CIMB Group Analyst Presentation 1Q17 Results · Group Funding # (9.2%) 148 (2) >1000% 101 46.5% PBT...
66
CIMB Group Analyst Presentation 1Q17 Results 24 May 2017 Tengku Dato’ Sri Zafrul Aziz
Transcript of CIMB Group Analyst Presentation 1Q17 Results · Group Funding # (9.2%) 148 (2) >1000% 101 46.5% PBT...
CIMB Group
Analyst Presentation 1Q17 Results
24 May 2017 Tengku Dato’ Sri Zafrul Aziz
2
Agenda
1. Key Highlights
2. CIMB Group 1Q17 Financials
3. PBT by Segment 3.1 Regional Consumer Banking 3.2 Regional Commercial Banking 3.3 Regional Wholesale Banking 3.4 Group Asset Management & Investments 3.5 Group Funding 3.6 CIMB Islamic
4. T18 Updates
5. Final Remarks

CIMB Group : 1Q17 Results 1. Key Highlights

4
Deposits Net Profit
Loan Impairment Overhead Expenses Operating Income
Gross Loans *
Key Financial Highlights
Notes: * Excluding bad bank
(RM ‘mil) (RM ‘mil) (RM ‘mil)
(RM ‘mil) (RM ‘mil) (RM ‘mil)
+12.2% Y-o-Y
+0.3% Q-o-Q
+10.8% Y-o-Y +45.0% Y-o-Y
+38.2% Q-o-Q +4.6% Q-o-Q
-43.6% Q-o-Q
-8.8% Y-o-Y +17.1% Y-o-Y
+1.1% Q-o-Q
+7.4% Y-o-Y
+3.0% Q-o-Q

5
CET 1 Loan Loss Charge
ROE
LD
CI NIM
Key Ratios
-12bps Y-o-Y
-41bps Q-o-Q
+90bps Y-o-Y +110bps Y-o-Y
-390bps Q-o-Q +20bps Q-o-Q
+240bps Y-o-Y
+260bps Q-o-Q
+10bps Y-o-Y
+90bps Q-o-Q
-480bps Y-o-Y
+3bps Q-o-Q
6
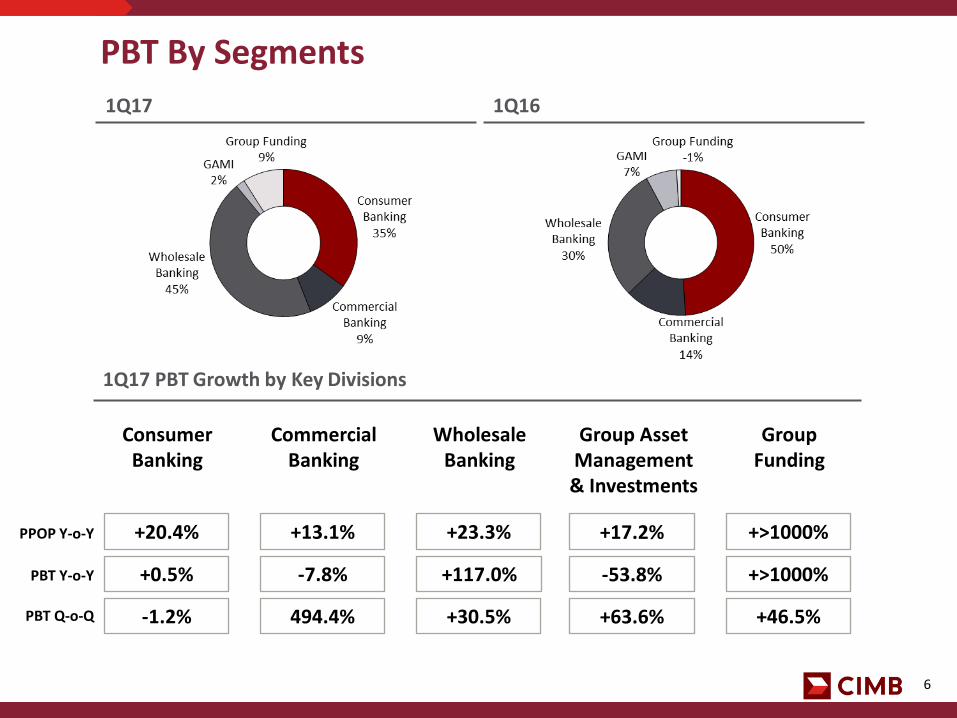
1Q17
PBT By Segments
1Q16
1Q17 PBT Growth by Key Divisions
-1.2%
Consumer Banking
Commercial Banking
Group Funding
Wholesale Banking
Group Asset Management & Investments
+0.5% -7.8% +>1000% +117.0% -53.8%
494.4% +46.5% +30.5% +63.6%
+20.4% +13.1% +>1000% +23.3% +17.2%
PBT Y-o-Y
PBT Q-o-Q
PPOP Y-o-Y
7
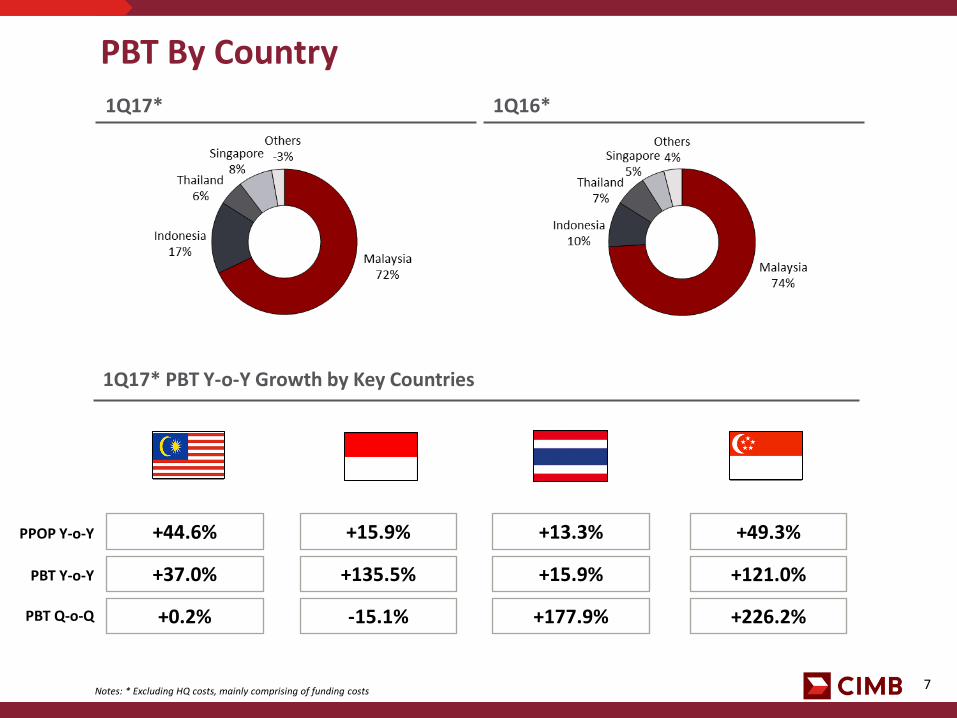
1Q17* 1Q16*
PBT By Country
1Q17* PBT Y-o-Y Growth by Key Countries
Notes: * Excluding HQ costs, mainly comprising of funding costs
+37.0% +135.5% +121.0%
+0.2% -15.1% +226.2%
+44.6% +15.9% +49.3%
+15.9%
+177.9%
+13.3%
PBT Y-o-Y
PBT Q-o-Q
PPOP Y-o-Y

CIMB Group : 1Q17 Results 2. CIMB Group 1Q17 Financials
9
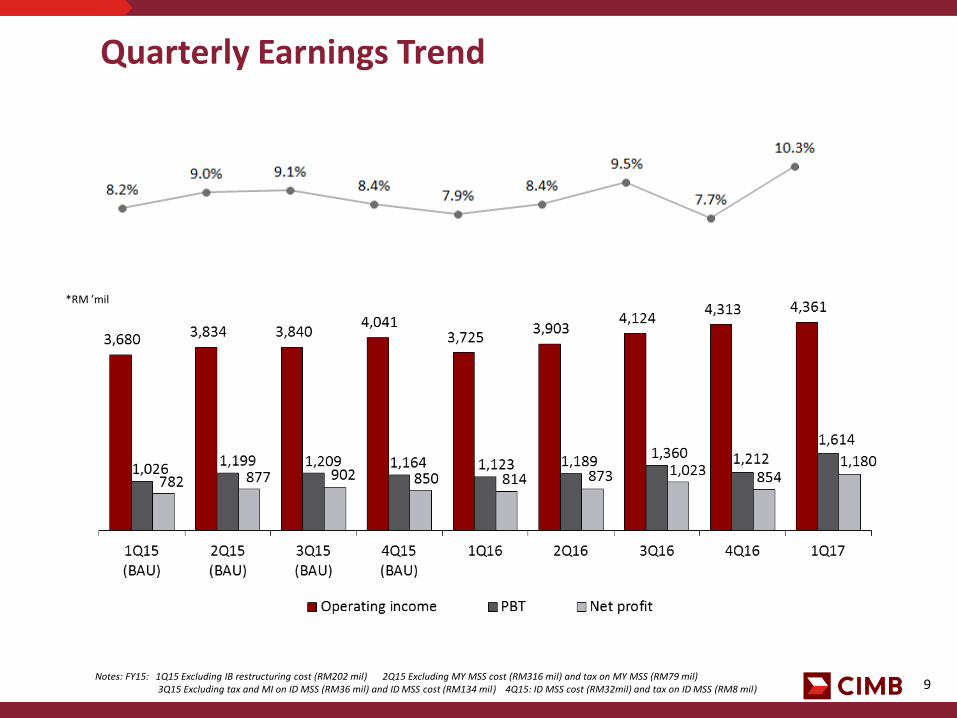
Quarterly Earnings Trend
Notes: FY15: 1Q15 Excluding IB restructuring cost (RM202 mil) 2Q15 Excluding MY MSS cost (RM316 mil) and tax on MY MSS (RM79 mil) 3Q15 Excluding tax and MI on ID MSS (RM36 mil) and ID MSS cost (RM134 mil) 4Q15: ID MSS cost (RM32mil) and tax on ID MSS (RM8 mil)
*RM ’mil

10
Earnings Summary
(RM ‘mil) 1Q17 1Q16 Y-o-Y 4Q16 Q-o-Q
Net interest income 3,046 2,731 11.5% 3,016 1.0%
Non interest income 1,315 994 32.3% 1,297 1.4%
Operating income 4,361 3,725 17.1% 4,313 1.1%
Overhead expenses (2,296) (2,137) 7.4% (2,230) 3.0%
PPOP 2,065 1,588 30.0% 2,083 (0.9%)
Loan impairment (424) (465) (8.8%) (752) (43.6%)
Other provisions (31) (50) (38.0%) (135) (77.0%)
Share of JV / Associates 4 50 (92.0%) 16 (75.0%)
PBT 1,614 1,123 43.7% 1,212 33.2%
Net profit 1,180 814 45.0% 854 38.2%
EPS (sen) 13.3 9.5 40.0% 9.7 37.1%
ROE (Annualised) 10.3% 7.9% 240bps 7.7% 260bps

11
Key Ratios (%) 1Q17 1Q16 Y-o-Y 4Q16 Q-o-Q
ROE ~ 10.3 7.9 7.7
NIM ~** 2.72 2.62 2.69
Non-interest income / total income 30.2 26.7 30.1
Cost to income 52.6 57.4 51.7
Allowance coverage # 79.6 84.8 79.8
Loan loss charge ~ 0.52 0.64 0.93
Gross impaired loans ratio 3.2 3.0 3.3
Net impaired loans ratio (Net of IA and PA) 0.7 0.5 0.7
Average shareholders’ funds (RM ’mil) 46,031 40,999 44,558
ROA ~ 0.95 0.70 0.72
Book value per share (RM) 5.27 4.80 5.11
Loan to Deposit (LDR) 91.7 90.6 95.6
CASA ratio 36.0 35.4 35.6
Notes: ~ Annualised ** Daily Average # Including regulatory reserve, allowance coverage was 93.2% as at end-Mar 2017

12
Operating Expenses
(RM ‘mil) 1Q17 1Q16 Y-o-Y 4Q16 Q-o-Q
Personnel 1,277 1,155 10.6% 1,238 3.2%
Establishment 580 558 3.9% 536 8.2%
Marketing 66 83 (20.5%) 73 (9.6%)
Admin & General 373 341 9.4% 383 (2.6%)
Total 2,296 2,137 7.4% 2,230 3.0%
Cost to income 52.6% 57.4% (480bps) 51.7% 90bps

13
Loans by Country as at 31 Mar 17 #
Gross Loans Growth
Divisions / Products (RM ‘bil) 31 Mar 17 31 Mar 16 Y-o-Y 31 Dec 16 Q-o-Q
Consumer Banking (50.8%) 163.5 147.7 10.7% 161.1 1.5%
Mortgages 82.6 72.5 13.9% 80.2 3.0%
Term Loans 36.2 33.2 9.0% 36.3 (0.3%)
Auto 19.6 19.9 (1.5%) 19.7 (0.5%)
Credit Cards 9.5 8.6 10.5% 9.8 (3.1%)
Personal Financing 4.8 4.4 9.1% 4.8 -
Enterprise 8.1 6.9 17.4% 7.8 3.8%
Others 2.7 2.2 22.7% 2.5 8.0%
Commercial Banking (13.1%) 42.2 37.8 11.6% 41.7 1.2%
Wholesale Banking (36.1%) 115.9 101.2 14.5% 117.7 (1.5%)
Gross Loans excl bad bank* 321.6 286.7 12.2% 320.5 0.3%
Bad Bank 2.9 2.7 7.4% 3.2 (9.4%)
Total Gross Loans 324.5 289.4 12.1% 323.7 0.2%
Notes: * Excluding FX fluctuations, total gross loans grew 6.8% Y-o-Y and 0.04% Q-o-Q + Gross loans exclude bad bank # Based on geographical location of counterparty, excluding bad bank ^ In local currency ~ Excluding FX fluctuations ** Including Labuan, London, Cambodia, Hong Kong & Shanghai
Loans*+ Y-o-Y Growth
Malaysia 11.8%
Indonesia ^ (0.3%)
Thailand ^ (0.4%)
Singapore ^ 1.6%
Others** (6.9%)
Group ~ 6.8%

14
Notes: * Excluding FX fluctuations, total group deposits +6.3% Y-o-Y and +4.3% Q-o-Q ^ In local currency ~ Excluding FX fluctuations
# Including deposits with options classified as derivatives in MY & SG ** Including Labuan, London, Cambodia, Hong Kong & Shanghai
Deposits by Country as at 31 Mar 17
Deposits Growth
Divisions / Products (RM ‘bil) 31 Mar 17 31 Mar 16 Y-o-Y 31 Dec 16 Q-o-Q
Consumer Banking (43.7%) 154.9 134.0 15.6% 151.0 2.6%
Commercial Banking (13.0%) 45.9 41.7 10.1% 45.4 1.1%
Wholesale Banking # (43.3%) 153.2 143.9 6.5% 142.1 7.8%
Total * 354.0 319.6 10.8% 338.5 4.6%
Deposits Y-o-Y Growth
Malaysia 13.1%
Indonesia ^ 1.9%
Thailand ^ 15.3%
Singapore ^ (2.5%)
Others** (35.6%)
Group ~ 6.3%

15
Country (RM ‘bil) 31 Mar 17 31 Mar 16 Y-o-Y 31 Dec 16 Q-o-Q
Malaysia 65.9 61.2 7.7% 63.1 4.4%
Indonesia ** 32.6 26.5 23.0% 30.7 6.2%
Thailand 10.4 9.2 13.0% 10.6 (1.9%)
Singapore 15.4 10.9 41.3% 14.1 9.2%
Others 3.0 5.5 (45.5%) 2.3 30.4%
Total * 127.3 113.3 12.4% 120.8 5.4%
CASA Growth
CASA by Country as at 31 Mar 17
CASA Y-o-Y Growth
Malaysia 7.8%
Indonesia ^ 7.1%
Thailand ^ (1.4%)
Singapore ^ 30.1%
Group ~ 6.8%
Notes: * Excluding FX fluctuations, total CASA grew 6.8% Y-o-Y and 5.1% Q-o-Q ** Adjusted for high cost saving deposits classified as Structured Deposits ^ In local currency ~ Excluding FX fluctuations + Including Labuan, London, Cambodia, Hong Kong & Shanghai
+
16
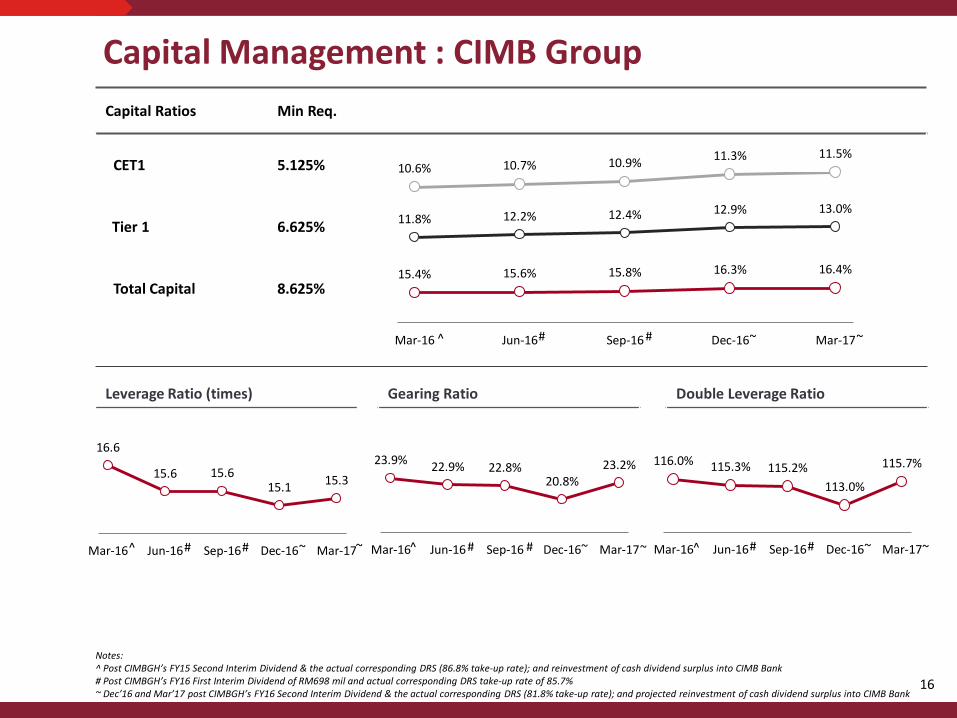
Notes: ^ Post CIMBGH’s FY15 Second Interim Dividend & the actual corresponding DRS (86.8% take-up rate); and reinvestment of cash dividend surplus into CIMB Bank # Post CIMBGH’s FY16 First Interim Dividend of RM698 mil and actual corresponding DRS take-up rate of 85.7% ~ Dec’16 and Mar’17 post CIMBGH’s FY16 Second Interim Dividend & the actual corresponding DRS (81.8% take-up rate); and projected reinvestment of cash dividend surplus into CIMB Bank
Capital Management : CIMB Group Capital Ratios Min Req.
CET1 5.125%
Tier 1 6.625%
Total Capital 8.625% 15.4% 15.6% 15.8% 16.3% 16.4%
11.8% 12.2% 12.4% 12.9% 13.0%
10.6% 10.7% 10.9% 11.3% 11.5%
Mar-16 Jun-16 Sep-16 Dec-16 Mar-17
Gearing Ratio Leverage Ratio (times) Double Leverage Ratio
16.6
15.6 15.6 15.1
15.3
Mar-16 Jun-16 Sep-16 Dec-16 Mar-17
116.0% 115.3% 115.2%
113.0%
115.7%
Mar-16 Jun-16 Sep-16 Dec-16 Mar-17
23.9% 22.9% 22.8%
20.8% 23.2%
Mar-16 Jun-16 Sep-16 Dec-16 Mar-17^ # # ~ ~
^ # # ~ ~
^ # # ~ ~ ^ # # ~ ~
CIMB Group : 1Q17 Results 3. PBT by Segment

18
PBT by Segments
PBT (RM ‘mil) 1Q17 1Q16 Y-o-Y 4Q16 Q-o-Q
Consumer Banking (34.8%) 561 558 0.5% 568 (1.2%)
Commercial Banking (8.8%) 142 154 (7.8%) (36) 494.4%
Wholesale Banking (45.0%) 727 335 117.0% 557 30.5%
Corporate Banking (29.6%) 479 179 167.6% 416 15.1%
Treasury & Markets ~ (15.4%) 248 180 37.8% 130 90.8%
Investment Banking + (0.0%) - (24) 100.0% 11 (100.0%)
GAMI ** (2.2%) 36 78 (53.8%) 22 63.6%
Group Funding # (9.2%) 148 (2) >1000% 101 46.5%
PBT 1,614 1,123 43.7% 1,212 33.2%
Notes: ~ Including treasury operations, markets and transaction banking + Including advisory, equities, capital markets, private banking and research ** Including asset management and strategic investments
# Including capital investments in fixed income securities and investment in Group’s proprietary capital

CIMB Group : 1Q17 Results 3.1 Regional Consumer Banking
20
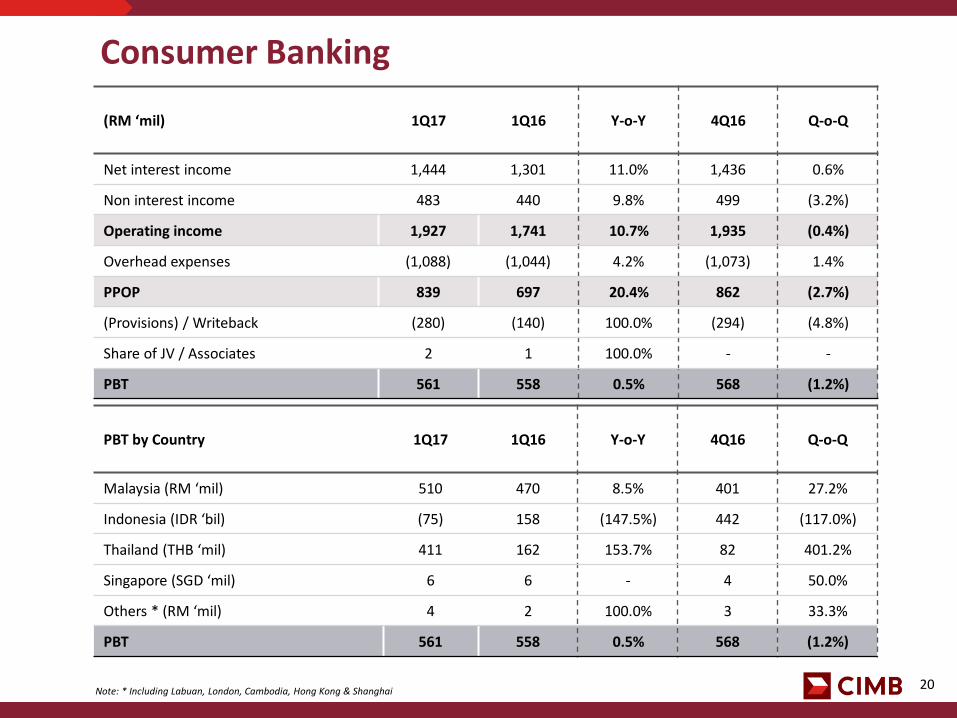
Consumer Banking
(RM ‘mil) 1Q17 1Q16 Y-o-Y 4Q16 Q-o-Q
Net interest income 1,444 1,301 11.0% 1,436 0.6%
Non interest income 483 440 9.8% 499 (3.2%)
Operating income 1,927 1,741 10.7% 1,935 (0.4%)
Overhead expenses (1,088) (1,044) 4.2% (1,073) 1.4%
PPOP 839 697 20.4% 862 (2.7%)
(Provisions) / Writeback (280) (140) 100.0% (294) (4.8%)
Share of JV / Associates 2 1 100.0% - -
PBT 561 558 0.5% 568 (1.2%)
PBT by Country 1Q17 1Q16 Y-o-Y 4Q16 Q-o-Q
Malaysia (RM ‘mil) 510 470 8.5% 401 27.2%
Indonesia (IDR ‘bil) (75) 158 (147.5%) 442 (117.0%)
Thailand (THB ‘mil) 411 162 153.7% 82 401.2%
Singapore (SGD ‘mil) 6 6 - 4 50.0%
Others * (RM ‘mil) 4 2 100.0% 3 33.3%
PBT 561 558 0.5% 568 (1.2%)
Note: * Including Labuan, London, Cambodia, Hong Kong & Shanghai

21
31 Mar 17 31 Mar 16
Consumer Banking : Gross Loans Country 31 Mar 17 31 Mar 16 Y-o-Y 31 Dec 16 Q-o-Q
Malaysia (RM ‘bil) 123.0 112.5 9.3% 121.1 1.6%
Indonesia (IDR ‘bil) 51,138 54,036 (5.4%) 52,130 (1.9%)
Thailand (THB ‘bil) 105.3 96.0 9.7% 102.9 2.3%
Singapore (SGD ‘mil) 2,907 2,780 4.6% 2,923 (0.5%)
Others * (RM ‘bil) 0.6 0.5 20.0% 0.6 -
Total Consumer Loans (RM ‘bil) 163.5 147.7 10.7% 161.1 1.5%
Notes: Loan base excludes bad bank * Including Labuan, London, Cambodia, Hong Kong & Shanghai

22
Consumer Banking : Deposits Country 31 Mar 17 31 Mar 16 Y-o-Y 31 Dec 16 Q-o-Q
Malaysia (RM ‘bil) 91.5 83.4 9.7% 89.3 2.5%
Indonesia (IDR ‘bil) 91,490 89,129 2.6% 93,677 (2.3%)
Thailand (THB ‘bil) 110.1 92.6 18.9% 105.6 4.3%
Singapore (SGD ‘mil) 5,974 4,936 21.0% 5,648 5.8%
Others * (RM ‘bil) 0.9 0.6 50.0% 0.9 -
Total Consumer Deposits (RM ‘bil) 154.9 134.0 15.6% 151.0 2.6%
Products (RM ‘bil) 31 Mar 17 31 Mar 16 Y-o-Y 31 Dec 16 Q-o-Q
Current 28.4 25.2 12.7% 27.9 1.8%
Savings 43.5 36.4 19.5% 41.3 5.3%
Fixed and Structured Deposits 83.0 72.4 14.6% 81.8 1.5%
Total 154.9 134.0 15.6% 151.0 2.6%
Note: * Including Labuan, London, Cambodia, Hong Kong & Shanghai

CIMB Group : 1Q17 Results 3.2 Regional Commercial Banking

24
(RM ‘mil) 1Q17 1Q16 Y-o-Y 4Q16 Q-o-Q
Net interest income 448 428 4.7% 440 1.8%
Non interest income 123 78 57.7% 97 26.8%
Operating income 571 506 12.8% 537 6.3%
Overhead expenses (303) (269) 12.6% (279) 8.6%
PPOP 268 237 13.1% 258 3.9%
(Provisions) / Writeback (126) (83) 51.8% (294) (57.1%)
Share of JV / Associates - - - - -
PBT 142 154 (7.8%) (36) 494.4%
Commercial Banking
Country 1Q17 1Q16 Y-o-Y 4Q16 Q-o-Q
Malaysia (RM ‘mil) 120 125 (4.0%) 147 (18.4%)
Indonesia (IDR ‘bil) 114 58 96.6% 59 93.2%
Thailand (THB ‘mil) (284) 1 (>1000%) (1,427) 80.1%
Singapore (SGD ‘mil) 4 2 100.0% (13) 130.8%
Others * (RM ‘mil) 6 5 20.0% 6 -
PBT (RM ‘mil) 142 154 (7.8%) (36) 494.4%
Note: * Including Labuan, London, Cambodia, Hong Kong & Shanghai
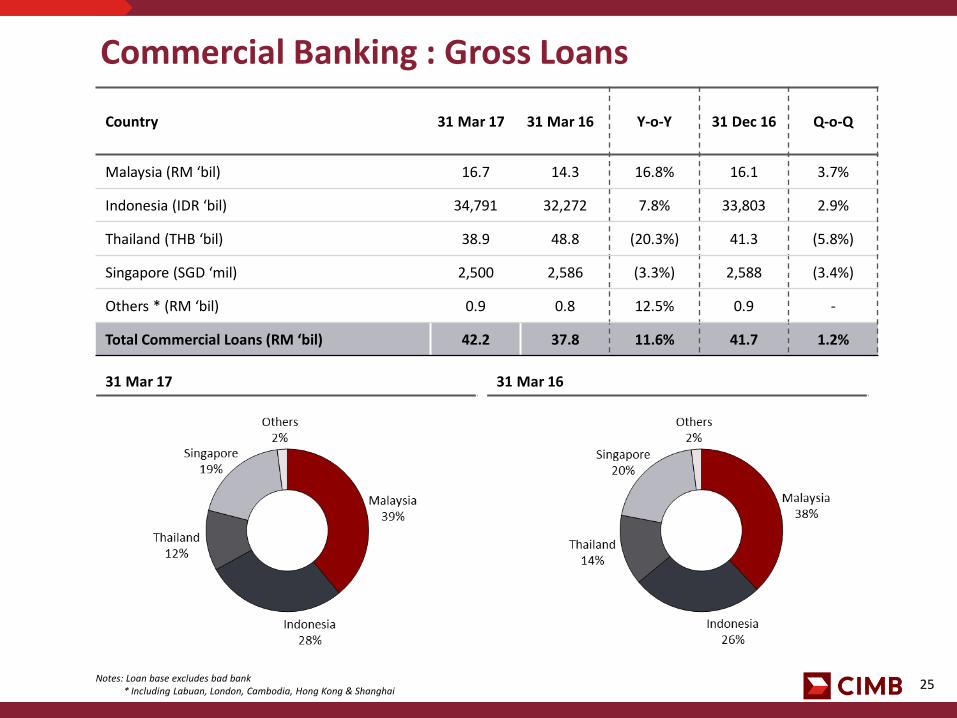
25
Commercial Banking : Gross Loans Country 31 Mar 17 31 Mar 16 Y-o-Y 31 Dec 16 Q-o-Q
Malaysia (RM ‘bil) 16.7 14.3 16.8% 16.1 3.7%
Indonesia (IDR ‘bil) 34,791 32,272 7.8% 33,803 2.9%
Thailand (THB ‘bil) 38.9 48.8 (20.3%) 41.3 (5.8%)
Singapore (SGD ‘mil) 2,500 2,586 (3.3%) 2,588 (3.4%)
Others * (RM ‘bil) 0.9 0.8 12.5% 0.9 -
Total Commercial Loans (RM ‘bil) 42.2 37.8 11.6% 41.7 1.2%
Notes: Loan base excludes bad bank * Including Labuan, London, Cambodia, Hong Kong & Shanghai
31 Mar 16 31 Mar 17
26
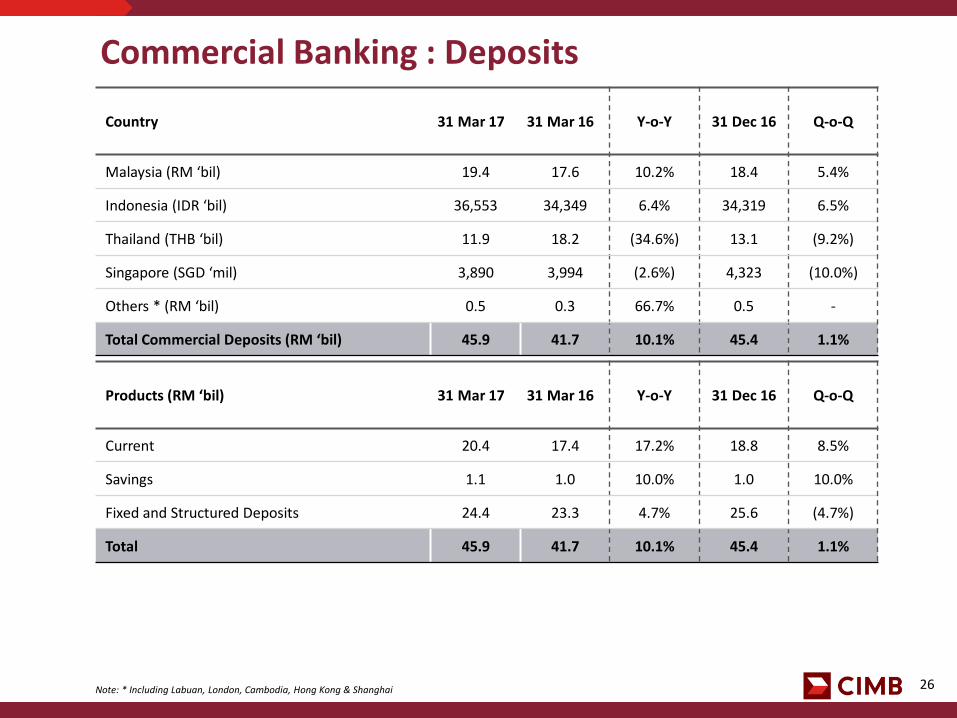
Commercial Banking : Deposits Country 31 Mar 17 31 Mar 16 Y-o-Y 31 Dec 16 Q-o-Q
Malaysia (RM ‘bil) 19.4 17.6 10.2% 18.4 5.4%
Indonesia (IDR ‘bil) 36,553 34,349 6.4% 34,319 6.5%
Thailand (THB ‘bil) 11.9 18.2 (34.6%) 13.1 (9.2%)
Singapore (SGD ‘mil) 3,890 3,994 (2.6%) 4,323 (10.0%)
Others * (RM ‘bil) 0.5 0.3 66.7% 0.5 -
Total Commercial Deposits (RM ‘bil) 45.9 41.7 10.1% 45.4 1.1%
Products (RM ‘bil) 31 Mar 17 31 Mar 16 Y-o-Y 31 Dec 16 Q-o-Q
Current 20.4 17.4 17.2% 18.8 8.5%
Savings 1.1 1.0 10.0% 1.0 10.0%
Fixed and Structured Deposits 24.4 23.3 4.7% 25.6 (4.7%)
Total 45.9 41.7 10.1% 45.4 1.1%
Note: * Including Labuan, London, Cambodia, Hong Kong & Shanghai
CIMB Group : 1Q17 Results 3.3 Regional Wholesale Banking
28
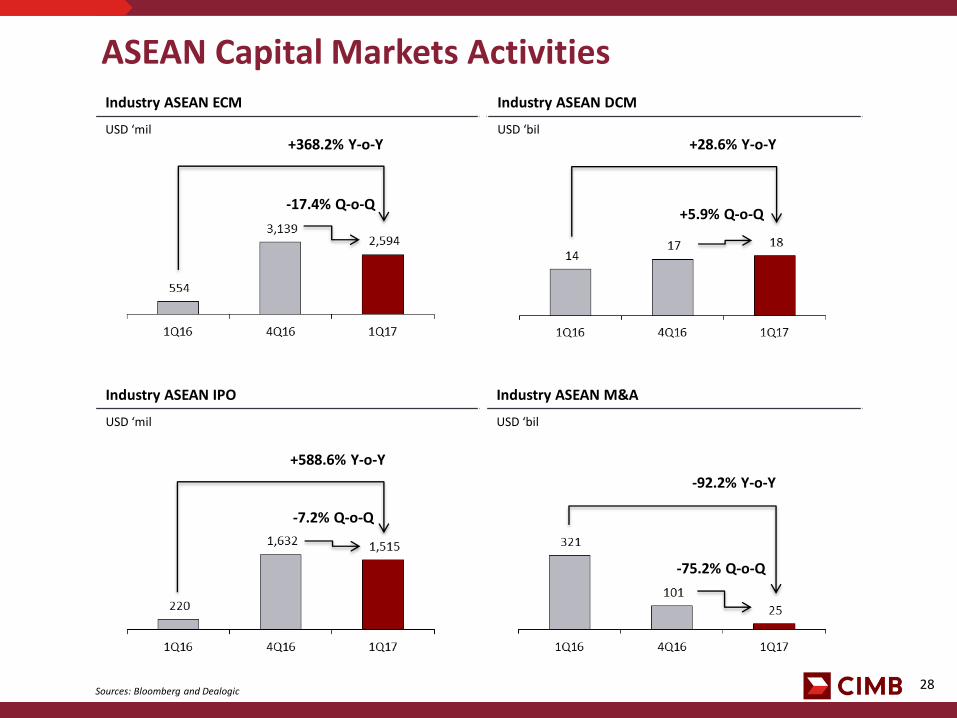
Industry ASEAN M&A
USD ‘bil
Industry ASEAN DCM
USD ‘bil
Industry ASEAN IPO
USD ‘mil
Industry ASEAN ECM
USD ‘mil
ASEAN Capital Markets Activities
Sources: Bloomberg and Dealogic
+368.2% Y-o-Y
+588.6% Y-o-Y
-92.2% Y-o-Y
+28.6% Y-o-Y
-17.4% Q-o-Q +5.9% Q-o-Q
-7.2% Q-o-Q
-75.2% Q-o-Q

29
Wholesale Banking
(RM ‘mil) 1Q17 1Q16 Y-o-Y 4Q16 Q-o-Q
Corporate Banking (65.9%) 479 179 167.6% 416 15.1%
Treasury & Markets ~ (34.1%) 248 180 37.8% 130 90.8%
Investment Banking + (0.0%) - (24) 100.0% 11 (100.0%)
PBT 727 335 117.0% 557 30.5%
Notes: ~ Including treasury operations, markets and transaction banking + Including advisory, equities, capital markets, private banking and research
(RM ‘mil) 1Q17 1Q16 Y-o-Y 4Q16 Q-o-Q
Net interest income 908 844 7.6% 941 (3.5%)
Non interest income 576 434 32.7% 519 11.0%
Total Income 1,484 1,278 16.1% 1,460 1.6%
Overhead expenses (712) (652) 9.2% (708) 0.6%
PPOP 772 626 23.3% 752 2.7%
(Provisions) / Writeback (45) (291) (84.5%) (195) (76.9%)
Share of JV / associates - - - - -
PBT (BAU) 727 335 117.0% 557 30.5%
30
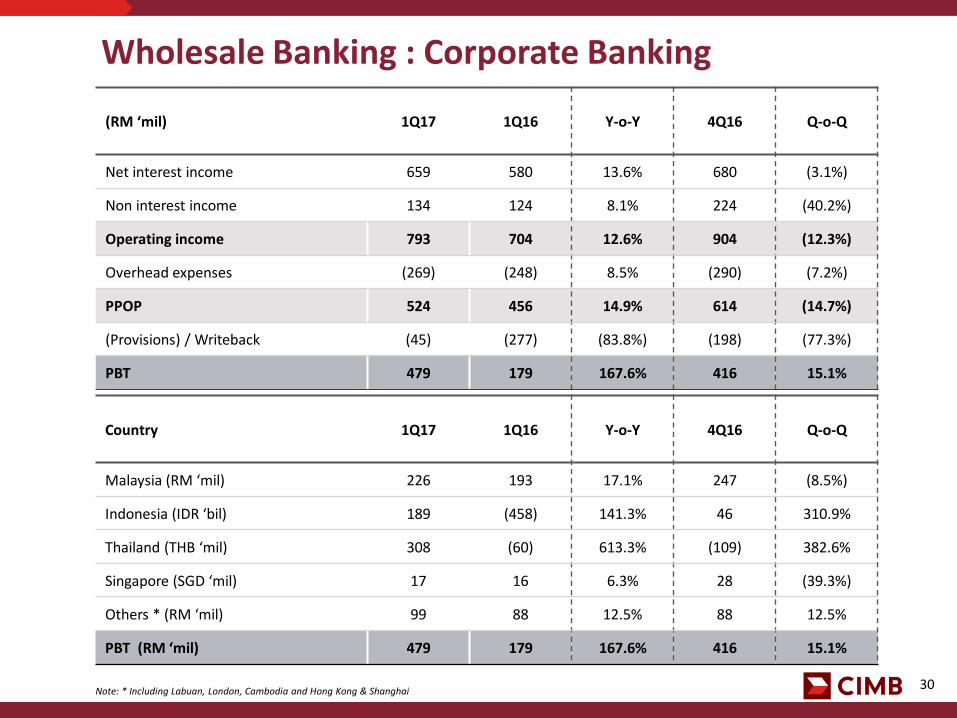
Wholesale Banking : Corporate Banking (RM ‘mil) 1Q17 1Q16 Y-o-Y 4Q16 Q-o-Q
Net interest income 659 580 13.6% 680 (3.1%)
Non interest income 134 124 8.1% 224 (40.2%)
Operating income 793 704 12.6% 904 (12.3%)
Overhead expenses (269) (248) 8.5% (290) (7.2%)
PPOP 524 456 14.9% 614 (14.7%)
(Provisions) / Writeback (45) (277) (83.8%) (198) (77.3%)
PBT 479 179 167.6% 416 15.1%
Country 1Q17 1Q16 Y-o-Y 4Q16 Q-o-Q
Malaysia (RM ‘mil) 226 193 17.1% 247 (8.5%)
Indonesia (IDR ‘bil) 189 (458) 141.3% 46 310.9%
Thailand (THB ‘mil) 308 (60) 613.3% (109) 382.6%
Singapore (SGD ‘mil) 17 16 6.3% 28 (39.3%)
Others * (RM ‘mil) 99 88 12.5% 88 12.5%
PBT (RM ‘mil) 479 179 167.6% 416 15.1%
Note: * Including Labuan, London, Cambodia and Hong Kong & Shanghai

31
Corporate Loans as at 31 Mar 17 Corporate Loans as at 31 Mar 16
Wholesale Banking : Gross Loans
Notes: Loan base excludes bad bank * Including Labuan, London, Cambodia, Hong Kong & Shanghai
Country 31 Mar 17 31 Mar 16 Y-o-Y 31 Dec 16 Q-o-Q
Malaysia (RM ‘bil) 37.9 32.3 17.3% 36.7 3.3%
Indonesia (IDR ‘bil) 90,053 84,713 6.3% 94,231 (4.4%)
Thailand (THB ‘bil) 52.1 52.3 (0.4%) 55.7 (6.5%)
Singapore (SGD ‘mil) 5,514 5,552 (0.7%) 5,784 (4.7%)
Others * (RM ‘bil) 17.8 17.8 - 19.1 (6.8%)
Total Corporate Loans (RM ‘bil) 111.0 98.5 12.7% 114.0 (2.6%)
Other Wholesale Loans (RM ‘bil) 4.9 2.7 81.5% 3.7 32.4%
Total Wholesale Loans (RM ‘bil) 115.9 101.2 14.5% 117.7 (1.5%)
32
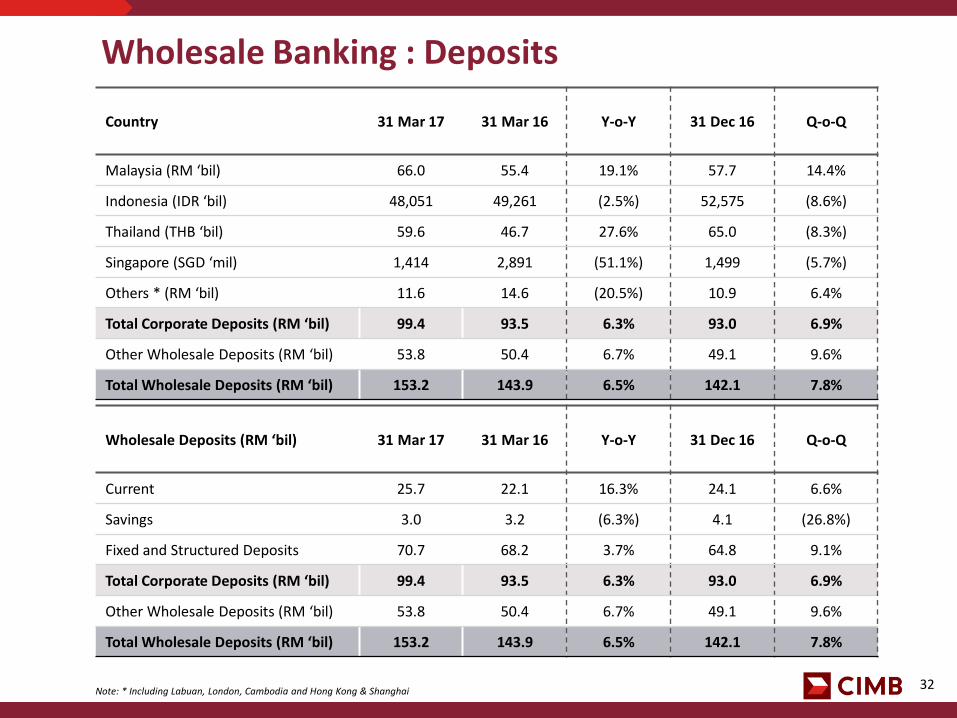
Country 31 Mar 17 31 Mar 16 Y-o-Y 31 Dec 16 Q-o-Q
Malaysia (RM ‘bil) 66.0 55.4 19.1% 57.7 14.4%
Indonesia (IDR ‘bil) 48,051 49,261 (2.5%) 52,575 (8.6%)
Thailand (THB ‘bil) 59.6 46.7 27.6% 65.0 (8.3%)
Singapore (SGD ‘mil) 1,414 2,891 (51.1%) 1,499 (5.7%)
Others * (RM ‘bil) 11.6 14.6 (20.5%) 10.9 6.4%
Total Corporate Deposits (RM ‘bil) 99.4 93.5 6.3% 93.0 6.9%
Other Wholesale Deposits (RM ‘bil) 53.8 50.4 6.7% 49.1 9.6%
Total Wholesale Deposits (RM ‘bil) 153.2 143.9 6.5% 142.1 7.8%
Wholesale Banking : Deposits
Note: * Including Labuan, London, Cambodia and Hong Kong & Shanghai
Wholesale Deposits (RM ‘bil) 31 Mar 17 31 Mar 16 Y-o-Y 31 Dec 16 Q-o-Q
Current 25.7 22.1 16.3% 24.1 6.6%
Savings 3.0 3.2 (6.3%) 4.1 (26.8%)
Fixed and Structured Deposits 70.7 68.2 3.7% 64.8 9.1%
Total Corporate Deposits (RM ‘bil) 99.4 93.5 6.3% 93.0 6.9%
Other Wholesale Deposits (RM ‘bil) 53.8 50.4 6.7% 49.1 9.6%
Total Wholesale Deposits (RM ‘bil) 153.2 143.9 6.5% 142.1 7.8%

33
Wholesale Banking : Treasury & Markets
Country 1Q17 1Q16 Y-o-Y 4Q16 Q-o-Q
Malaysia (RM ‘mil) 71 28 153.6% 28 153.6%
Indonesia (IDR ‘bil) 174 177 (1.7%) 106 64.2%
Thailand (THB ‘mil) 98 340 (71.2%) (51) 292.2%
Singapore (SGD ‘mil) 12 4 200.0% 1 >1000.0%
Others * (RM ‘mil) 71 44 61.4% 68 4.4%
PBT (RM ‘mil) 248 180 37.8% 130 90.8%
(RM ‘mil) 1Q17 1Q16 Y-o-Y 4Q16 Q-o-Q
Net interest income 191 219 (12.8%) 194 (1.5%)
Non interest income 253 110 130.0% 90 181.1%
Operating income 444 329 35.0% 284 56.3%
Overhead expenses (196) (146) 34.2% (158) 24.1%
PPOP 248 183 35.5% 126 96.8%
(Provisions) / Writeback - (3) (100.0%) 4 (100.0%)
PBT 248 180 37.8% 130 90.8%
Note: * Including Labuan, London, Cambodia and Hong Kong & Shanghai

34
Wholesale Banking : Investment Banking
Note: * Including Labuan, London, Cambodia and Hong Kong & Shanghai
(RM ’mil) 1Q17 1Q16 Y-o-Y 4Q16 Q-o-Q
Net interest income 58 45 28.9% 67 (13.4%)
Non interest income 189 200 (5.5%) 205 (7.8%)
Operating income 247 245 0.8% 272 (9.2%)
Overhead expenses (247) (258) (4.3%) (260) (5.0%)
PPOP - (13) 100.0% 12 (100.0%)
(Provisions) / Writeback - (11) (100.0%) (1) (100.0%)
Share of JV/Associates - - - - -
PBT - (24) 100.0% 11 (100.0%)
Country 1Q17 1Q16 Y-o-Y 4Q16 Q-o-Q
Malaysia (RM ‘mil) 9 28 (67.9%) 62 (85.5%)
Indonesia (IDR ‘bil) 24 29 (17.2%) 27 (11.1%)
Thailand (THB ‘mil) 55 17 223.5% 33 66.7%
Singapore (SGD ‘mil) (3) (5) 40.0% (12) 75.0%
Others * (RM ‘mil) (15) (49) 69.4% (28) 46.4%
PBT (RM ‘mil) - (24) 100.0% 11 (100.0%)

35
IB Market Share and Ranking (1)
1Q17 1Q16
Market Share
Rank Market Share
Rank
Cash Equities 9.5% 3 9.7% 3
IPO 28.5% 1 49.8% 1
ECM 32.4% 1 48.3% 1
EQL Products - - - -
M&A 13.8% 1 8.3% 5
Syndication ^ 3.5% 12 12.4% 3
DCM Domestic Sukuk
21.5% 26.6%
3 2
16.7% 8.2%
2 4
1Q17 1Q16
Market Share
Rank Market Share
Rank
Cash Equities 4.2% 4 4.6% 3
IPO 23.0% 2 - -
ECM 16.0% 3 - -
EQL Products - - - -
M&A 5.1% 2 - -
Syndication ^ 1.6% 11 2.1% 10
DCM 20.9% 1 11.9% 3
1Q17 1Q16
Market Share
Rank Market Share
Rank
Cash Equities 5.6% 3 6.8% 2
IPO 22.3% 2 - -
ECM 21.9% 2 - -
EQL Products - - - -
M&A - - - -
Syndication ^ - - - -
DCM 10.0% 5 6.0% 7
1Q17 1Q16
Market Share
Rank Market Share
Rank
Cash Equities 7.0% 4 8.9% 1
IPO - - 57.2% 1
ECM - - 13.5% 3
EQL Products - - - -
M&A - - 0.1% 25
Syndication ^ 1.5% 21 0.4% 35
DCM 0.9% 12 4.4% 7
Sources: Dealogic, Bloomberg, Local Stock Exchanges and internal data Note: ^ Mandated lead arranger
36
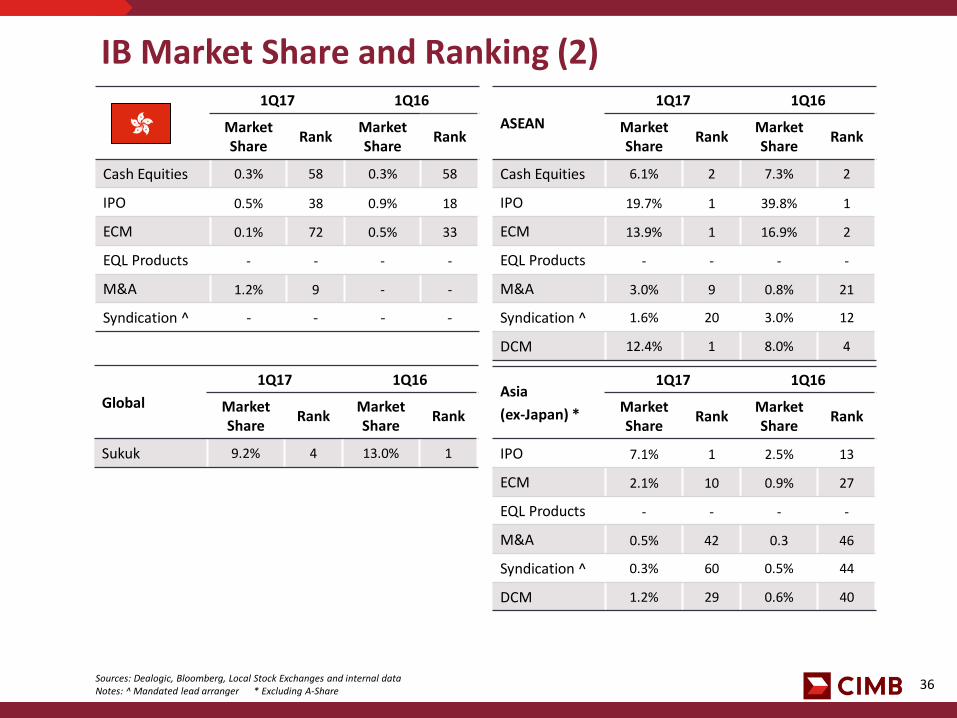
IB Market Share and Ranking (2) 1Q17 1Q16
Market Share
Rank Market Share
Rank
Cash Equities 0.3% 58 0.3% 58
IPO 0.5% 38 0.9% 18
ECM 0.1% 72 0.5% 33
EQL Products - - - -
M&A 1.2% 9 - -
Syndication ^ - - - -
Global
1Q17 1Q16
Market Share
Rank Market Share
Rank
Sukuk 9.2% 4 13.0% 1
ASEAN
1Q17 1Q16
Market Share
Rank Market Share
Rank
Cash Equities 6.1% 2 7.3% 2
IPO 19.7% 1 39.8% 1
ECM 13.9% 1 16.9% 2
EQL Products - - - -
M&A 3.0% 9 0.8% 21
Syndication ^ 1.6% 20 3.0% 12
DCM 12.4% 1 8.0% 4
Sources: Dealogic, Bloomberg, Local Stock Exchanges and internal data Notes: ^ Mandated lead arranger * Excluding A-Share
Asia
(ex-Japan) *
1Q17 1Q16
Market Share
Rank Market Share
Rank
IPO 7.1% 1 2.5% 13
ECM 2.1% 10 0.9% 27
EQL Products - - - -
M&A 0.5% 42 0.3 46
Syndication ^ 0.3% 60 0.5% 44
DCM 1.2% 29 0.6% 40
CIMB Group : 1Q17 Results 3.4 Group Asset Management & Investments
38
Private Markets AUM/CV
RM ‘mil
Public Markets AUM
RM ‘mil
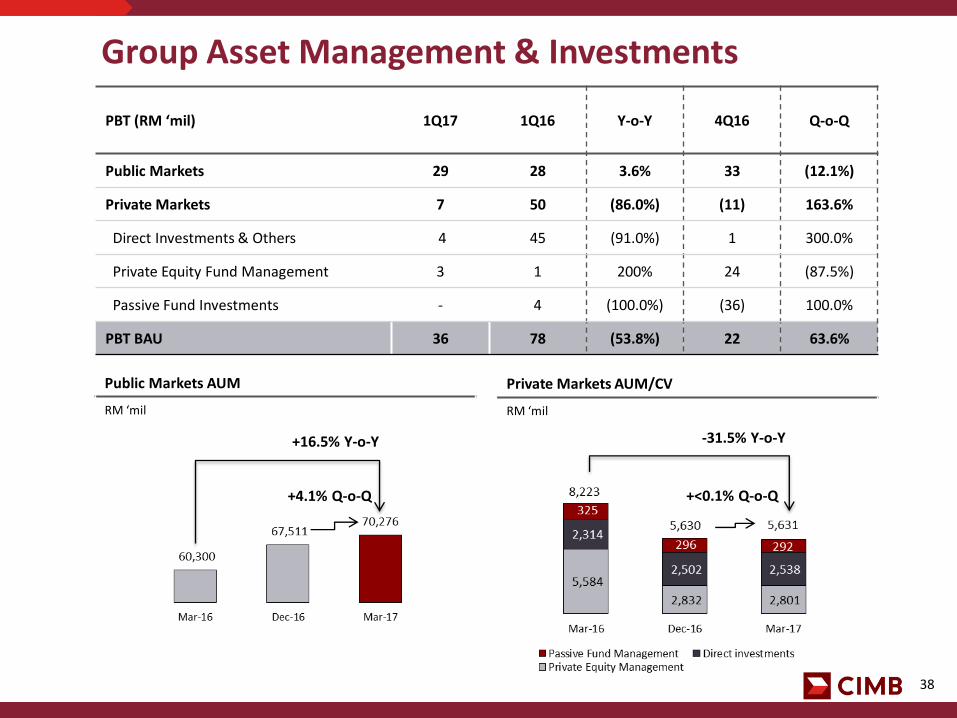
Group Asset Management & Investments
-31.5% Y-o-Y
+<0.1% Q-o-Q
+16.5% Y-o-Y
+4.1% Q-o-Q
PBT (RM ‘mil) 1Q17 1Q16 Y-o-Y 4Q16 Q-o-Q
Public Markets 29 28 3.6% 33 (12.1%)
Private Markets 7 50 (86.0%) (11) 163.6%
Direct Investments & Others 4 45 (91.0%) 1 300.0%
Private Equity Fund Management 3 1 200% 24 (87.5%)
Passive Fund Investments - 4 (100.0%) (36) 100.0%
PBT BAU 36 78 (53.8%) 22 63.6%
CIMB Group : 1Q17 Results 3.5 Group Funding

40
Group Funding
(RM ’mil) 1Q17 1Q16 Y-o-Y 4Q16 Q-o-Q
Net interest income 239 147 62.6% 193 23.8%
Non interest income 35 (61) 157.4% 55 (36.4%)
Total Income 274 86 218.6% 248 10.5%
Overhead expenses (122) (87) 40.2% (97) 25.8%
PPOP 152 (1) >1000% 151 0.7%
(Provisions) / Writeback (4) (1) 300.0% (50) (92.0%)
Share of JV / associates - - - - -
PBT (BAU) 148 (2) >1000% 101 46.5%
CIMB Group : 1Q17 Results 3.6 CIMB Islamic
42
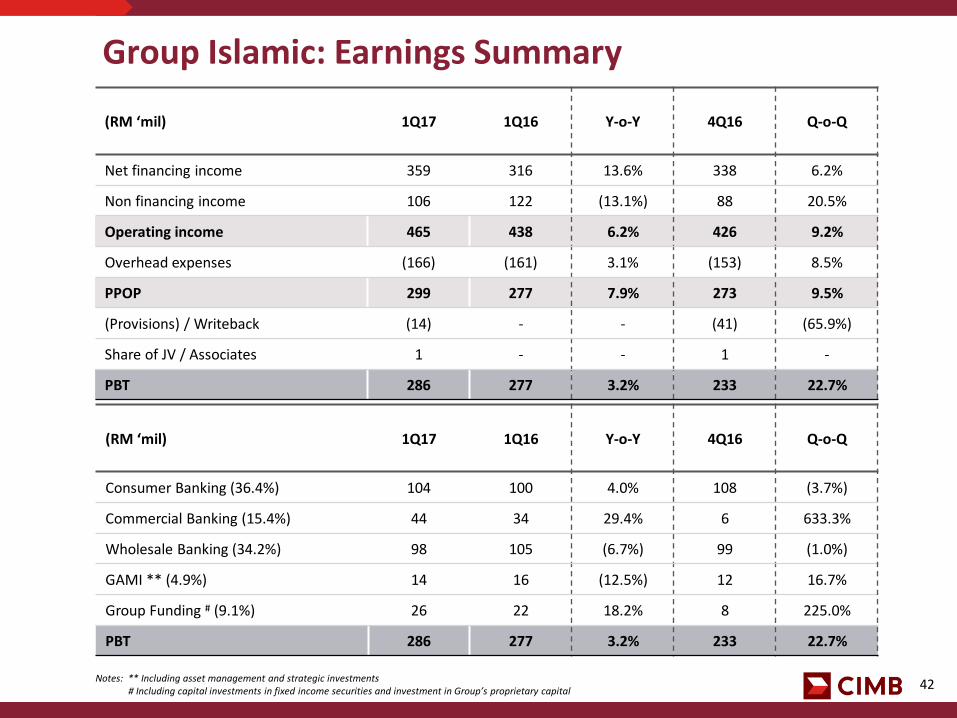
Group Islamic: Earnings Summary (RM ‘mil) 1Q17 1Q16 Y-o-Y 4Q16 Q-o-Q
Net financing income 359 316 13.6% 338 6.2%
Non financing income 106 122 (13.1%) 88 20.5%
Operating income 465 438 6.2% 426 9.2%
Overhead expenses (166) (161) 3.1% (153) 8.5%
PPOP 299 277 7.9% 273 9.5%
(Provisions) / Writeback (14) - - (41) (65.9%)
Share of JV / Associates 1 - - 1 -
PBT 286 277 3.2% 233 22.7%
(RM ‘mil) 1Q17 1Q16 Y-o-Y 4Q16 Q-o-Q
Consumer Banking (36.4%) 104 100 4.0% 108 (3.7%)
Commercial Banking (15.4%) 44 34 29.4% 6 633.3%
Wholesale Banking (34.2%) 98 105 (6.7%) 99 (1.0%)
GAMI ** (4.9%) 14 16 (12.5%) 12 16.7%
Group Funding # (9.1%) 26 22 18.2% 8 225.0%
PBT 286 277 3.2% 233 22.7%
Notes: ** Including asset management and strategic investments # Including capital investments in fixed income securities and investment in Group’s proprietary capital
43
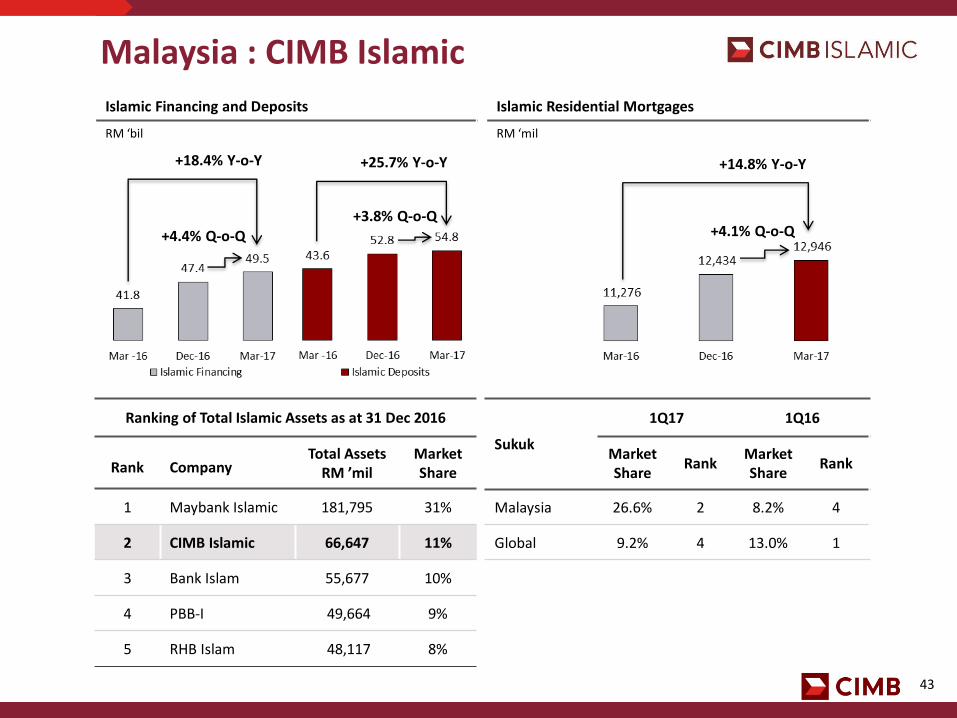
Islamic Residential Mortgages
RM ‘mil
Islamic Financing and Deposits
RM ‘bil
Malaysia : CIMB Islamic
+4.4% Q-o-Q
+18.4% Y-o-Y +25.7% Y-o-Y +14.8% Y-o-Y
+4.1% Q-o-Q
Ranking of Total Islamic Assets as at 31 Dec 2016
Rank Company Total Assets
RM ’mil Market Share
1 Maybank Islamic 181,795 31%
2 CIMB Islamic 66,647 11%
3 Bank Islam 55,677 10%
4 PBB-I 49,664 9%
5 RHB Islam 48,117 8%
Sukuk
1Q17 1Q16
Market Share
Rank Market Share
Rank
Malaysia 26.6% 2 8.2% 4
Global 9.2% 4 13.0% 1
+3.8% Q-o-Q

CIMB Group : 1Q17 Results 4. T18 Updates

45
T18 Progress Update
A total of 18 programmes have been identified to propel the Group towards its T18 targets
Wholesale Banking Commercial Banking
Further profitability optimisation initiatives
Sustain momentum in Malaysia and accelerate transformation in Indonesia and Thailand
Consumer Banking
Accelerate digital and undertake selective further recalibration e.g. Thailand
Focus Areas of the T18 Programmes
T18 Oversight Committee
Project Management Office
>400 projects ongoing across the 18 programmes
Programme sponsors identified for each initiative
Implementation and tracking on-going for each initiative
T18 OC and PMO diligently tracking to ensure momentum is sustained
Other Key Focus Areas
Capital and RWA optimisation to continue
Cost discipline emphasis to be sustained
HR – Sustain culture transformation and enhance overall performance management
Customer experience and quality improvement focus
Selective investments into Vietnam, Philippines and Fintech

46
T18 Financial Targets Scorecard
Income Contribution From Consumer & Commercial
ROE^
Cost-to-Income
CET1
C/I ratio improving within expectations
Capital and RWA optimisation met T18 target
Improving ROE from better financial performance
On track to meet target
Note: *based on BAU numbers ^Annualised
58.1%
55.4% 55.4% 53.9%
57.4%
53.6% 53.2% 51.7% 52.6%
2015 2016
8.2% 9.0% 9.1% 8.4% 7.9% 8.4% 9.5%
7.7%
10.3%
10.0% 9.7%
9.3%
10.4% 10.6% 10.7% 10.9% 11.3% 11.5%
57% 56% 57% 55%
60% 58% 55%
57% 57%
1Q15* 2Q15* 3Q15* 4Q15* 1Q16 2Q16 3Q16 4Q16 1Q17
2017
Highlights T18 Targets T18 Financial Progress
60%
15%
50%
11%

47
T18: 1Q17 Key highlights Wholesale
Banking
Commercial Banking
Consumer Banking
Improved profitability in 1Q17 due to higher income growth (+16.1% YoY) and lower provisions (-84.5% YoY)
Ongoing account planning efforts to improve RWA utilisation and enhance client profitability
Strong growth in Malaysia in 1Q17 – loans grew 16.8% YoY and deposits by 10.2%
Continuous focus to improve deposits and CASA through analytics and targeted cash management solutions
Asset quality in Indonesia and Thailand continues to be an area of focus given the challenging macro environment
Digital Banking Development and implementation of new initiatives to strengthen our overall
digital proposition, including partnerships with e-commerce and payment card players
Branch Productivity Continuous productivity improvement through various sales campaigns,
increased usage of alternate channels and process enhancements
Thailand Retail 2.0 Executing plans to strengthen our retail proposition in Thailand via strategic
partnerships, wealth platform and various digital initiatives
Transaction Banking
Ongoing efforts to improve collaboration with Business Units, e.g. KPI alignment, teamwork and sales partnerships
Strengthening our regional trade and cash management proposition by leveraging our ASEAN platform, such as mobile and card platforms, tailored packages and improved processes
48
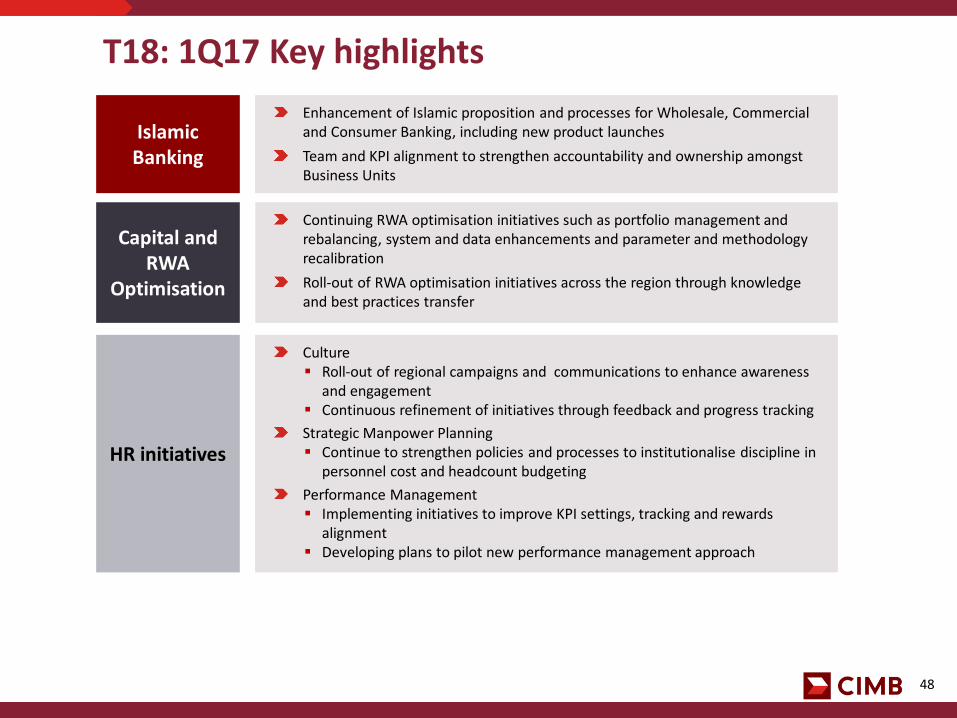
T18: 1Q17 Key highlights Islamic
Banking
Enhancement of Islamic proposition and processes for Wholesale, Commercial and Consumer Banking, including new product launches
Team and KPI alignment to strengthen accountability and ownership amongst Business Units
Capital and RWA
Optimisation
Continuing RWA optimisation initiatives such as portfolio management and rebalancing, system and data enhancements and parameter and methodology recalibration
Roll-out of RWA optimisation initiatives across the region through knowledge and best practices transfer
HR initiatives
Culture Roll-out of regional campaigns and communications to enhance awareness
and engagement Continuous refinement of initiatives through feedback and progress tracking
Strategic Manpower Planning Continue to strengthen policies and processes to institutionalise discipline in
personnel cost and headcount budgeting
Performance Management Implementing initiatives to improve KPI settings, tracking and rewards
alignment Developing plans to pilot new performance management approach

49
T18: 1Q17 Key highlights Customer
Experience
Cost & Productivity
Footprint & Expansion
Implementing plans to build CX capability across the firm through training programmes for identified staff Performance monitoring indicators in place to measure outcomes and benefits of CX initiatives Ongoing efforts to continuously drive and inculcate the CX mindset across the firm
Vietnam CIMB Vietnam commenced operations on 9 Dec 2016 with the launch of
Hanoi branch Ongoing efforts to operationalise Ho Chi Minh City branch Progressively building up local team as part of business expansion plans Implementation of consumer digital proposition underway Philippines Regulatory application process underway Partnership discussions and identification of key hires in progress
1Q17 cost to income ratio at 52.6% (FY2016: 53.9%, FY15: 55.6%, FY14: 59.1%)
Continuous efforts to further identify and realise cost saving opportunities, including: Roll-out of revised Group Delegated Authority framework across the region Optimisation of premises and processes Strategic Procurement – regional system implementation underway
CIMB Group : 1Q17 Results 5. Final Remarks

51
Notes: * Excluding bad bank ** Excluding FX fluctuations # Annualised
Targets for 2017
1Q17 FY17 Target
ROE 10.3% 9.5%
Dividend Payout Ratio - 40% - 60%
Total Loans Growth * 12.2% (6.8%**) 7.0%
Loan Loss Charge 0.52% 0.60% - 0.65%
CET 1 (CIMB Group) 11.5% >11.5%
Cost to income 52.6% <53.0%
#
#

52
Final Remarks
A good start to the year, but cautiously optimistic on outlook for the rest of 2017
Continue to expect steady loan growth with some NIM compression, improving
provisions and sustained cost discipline
Malaysia remains steady, driven by Consumer Banking and benign asset quality
Progressive improvement expected at CIMB Niaga with better loan provisions
CIMB Thai to be profitable in 2017 following business recalibration
Singapore should rebound from increased regional activity
On track to meet FY17 targets

53
THANK YOU

CIMB Group : 1Q17 Results Appendices

55
PPOP by Segments
PPOP (RM ‘mil) 1Q17 1Q16 Y-o-Y 4Q16 Q-o-Q
Consumer Banking (40.6%) 839 697 20.4% 862 (2.7%)
Commercial Banking (13.0%) 268 237 13.1% 258 3.9%
Wholesale Banking (37.4%) 772 626 23.3% 752 2.7%
Corporate Banking (25.4%) 524 456 14.9% 614 (14.7%)
Treasury & Markets ~ (12.0%) 248 183 35.5% 126 96.8%
Investment Banking + (0.0%) - (13) 100.0% 12 (100.0%)
GAMI ** (1.6%) 34 29 17.2% 60 (43.3%)
Group Funding # (7.4%) 152 (1) >1000% 151 0.7%
PPOP (Actual) 2,065 1,588 30.0% 2,083 (0.9%)
Notes: ~ Including treasury operations, markets and transaction banking + Including advisory, equities, capital markets, private banking and research ** Including asset management and strategic investments # Including capital investments in fixed income securities and investment in Group’s proprietary capital

56
Consumer Banking Key Highlights Y-o-Y Q-o-Q
Consumer Gross Loans (5.4%) (1.9%)
Mortgages 7.1% 3.5%
Auto (31.9%) (11.3%)
Credit cards 17.9% (2.9%)
Consumer Deposits 2.6% (2.3%)
CASA 6.3% 0.9%
Fixed & structured deposits (1.0%) (5.6%)
Y-o-Y Q-o-Q
Consumer Gross Loans 4.6% (0.5%)
Mortgages 4.4% 0.2%
Term loans 6.5% (2.0%)
Credit cards (13.0%) (7.2%)
Consumer Deposits 21.0% 5.8%
CASA 29.7% 6.9%
Fixed & structured deposits 11.7% 4.4%
Y-o-Y Q-o-Q
Consumer Gross Loans * 9.3% 1.6%
Mortgages 12.0% 2.7%
Term loans 8.1% 0.3%
Auto 2.2% -
Credit cards 3.8% (3.6%)
Consumer Deposits 9.7% 2.5%
CASA 7.1% 3.2%
Fixed & structured deposits 11.8% 1.9%
Note: * Loan base excludes bad bank
Y-o-Y Q-o-Q
Consumer Gross Loans * 9.7% 2.3%
Mortgages 6.9% 2.4%
Auto Loans 16.1% 3.7%
Personal / Others 13.0% (0.8%)
Consumer Deposits 18.9% 4.3%
CASA 24.6% 7.2%
Fixed & structured deposits 14.7% 2.0%
57
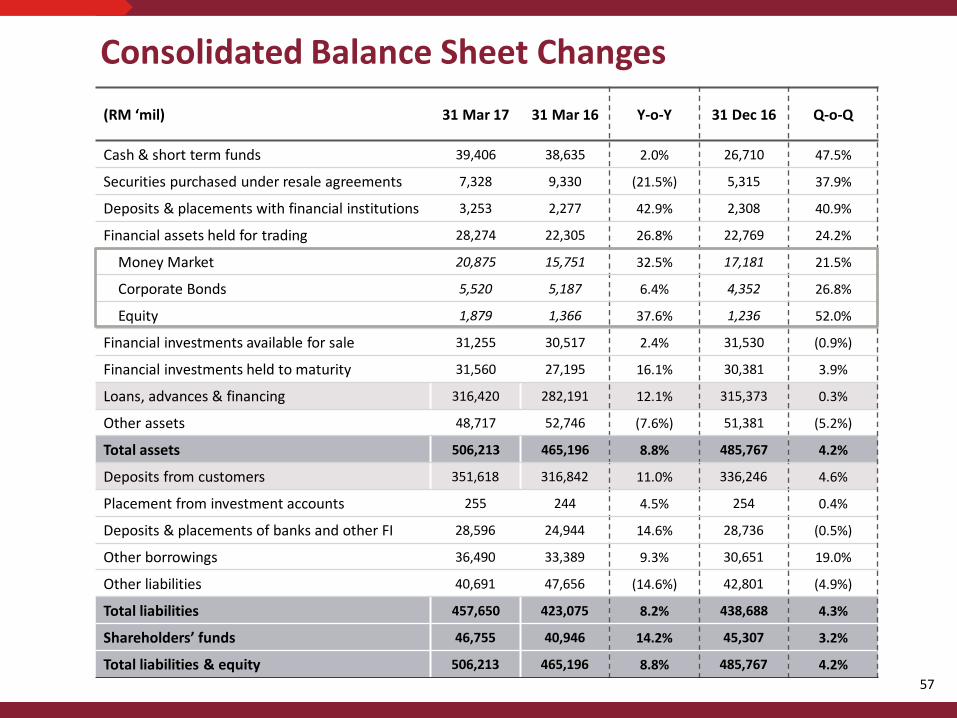
Consolidated Balance Sheet Changes (RM ‘mil) 31 Mar 17 31 Mar 16 Y-o-Y 31 Dec 16 Q-o-Q
Cash & short term funds 39,406 38,635 2.0% 26,710 47.5%
Securities purchased under resale agreements 7,328 9,330 (21.5%) 5,315 37.9%
Deposits & placements with financial institutions 3,253 2,277 42.9% 2,308 40.9%
Financial assets held for trading 28,274 22,305 26.8% 22,769 24.2%
Money Market 20,875 15,751 32.5% 17,181 21.5%
Corporate Bonds 5,520 5,187 6.4% 4,352 26.8%
Equity 1,879 1,366 37.6% 1,236 52.0%
Financial investments available for sale 31,255 30,517 2.4% 31,530 (0.9%)
Financial investments held to maturity 31,560 27,195 16.1% 30,381 3.9%
Loans, advances & financing 316,420 282,191 12.1% 315,373 0.3%
Other assets 48,717 52,746 (7.6%) 51,381 (5.2%)
Total assets 506,213 465,196 8.8% 485,767 4.2%
Deposits from customers 351,618 316,842 11.0% 336,246 4.6%
Placement from investment accounts 255 244 4.5% 254 0.4%
Deposits & placements of banks and other FI 28,596 24,944 14.6% 28,736 (0.5%)
Other borrowings 36,490 33,389 9.3% 30,651 19.0%
Other liabilities 40,691 47,656 (14.6%) 42,801 (4.9%)
Total liabilities 457,650 423,075 8.2% 438,688 4.3%
Shareholders’ funds 46,755 40,946 14.2% 45,307 3.2%
Total liabilities & equity 506,213 465,196 8.8% 485,767 4.2%

58
Asset Quality Ratios – CIMB Group
82.6%
77.4%
71.9%
81.8%83.6%
76.9%75.6%
84.4% 84.4%83.0%
80.0%79.3% 79.0%
83.8%
79.2%
74.2%
82.7%84.2%
77.9% 76.6%
84.7% 84.8%83.5%
80.6% 79.8% 79.6%
3.1% 3.1% 3.3% 3.1% 3.2% 3.3% 3.4% 3.0% 3.0% 3.2% 3.2% 3.3% 3.2%
2.7% 2.7% 2.9% 2.8% 2.9%3.1% 3.2%
2.9% 2.9% 3.0% 3.1% 3.2% 3.0%
0.5% 0.7% 0.9% 0.5% 0.5%0.8% 0.8%
0.5% 0.5% 0.5% 0.6% 0.7% 0.7%
0.5% 0.6% 0.8%0.5% 0.5%
0.7% 0.8%0.5% 0.5% 0.5% 0.6% 0.7% 0.7%
1Q14 2Q14 3Q14 4Q14 1Q15 2Q15 3Q15 4Q15 1Q16 2Q16 3Q16 4Q16 1Q17
Loan Loss Coverage Allowance Coverage (excl SEASAM) Allowance Coverage
Gross NPL Ratio Gross Impaired Loans Ratio Gross Impaired Loans Ratio (excl SEASAM)
Net NPL Ratio Net Impaired Loans Ratio (net of IA & PA) Net NPL Ratio (net of SP & GP)
Net Impaired Loans Ratio (net of IA & PA) (excl SEASAM)

59
AFS MTM (Q-o-Q) Position
Mar-16 Jun-16 Sep-16 Dec-16 Mar-17

60
CIMB Niaga : Earnings Summary
(IDR ‘bil) 1Q17 1Q16 Y-o-Y 4Q16
BAU^ Q-o-Q
Net interest income 3,096 2,837 9.1% 3,207 (3.5%)
Non interest income 716 716 - 583 22.8%
Operating income 3,812 3,553 7.3% 3,790 0.6%
Overhead expenses (1,873) (1,822) 2.8% (1,825) 2.6%
PPOP 1,939 1,731 12.0% 1,965 (1.3%)
Provisions (1,079) (1,341) (19.5%) (1,195) (9.7%)
PBT 860 390 120.5% 770 11.7%
Net profit 640 269 137.9% 576 11.1%
EPS (IDR) 25.45 10.69 138.1% 22.92 11.0%
PBT (RM ‘mil) 286 114 150.9% 249 14.9%
Net profit (RM ‘mil) 213 78 173.1% 186 14.5%
ROE (Annualised) 7.4% 3.6% 380bps 6.8% 60bps
Note: As per CIMB Niaga FY16 analyst presentation ^ Excluding one-off fee income (IDR276 bil)
61
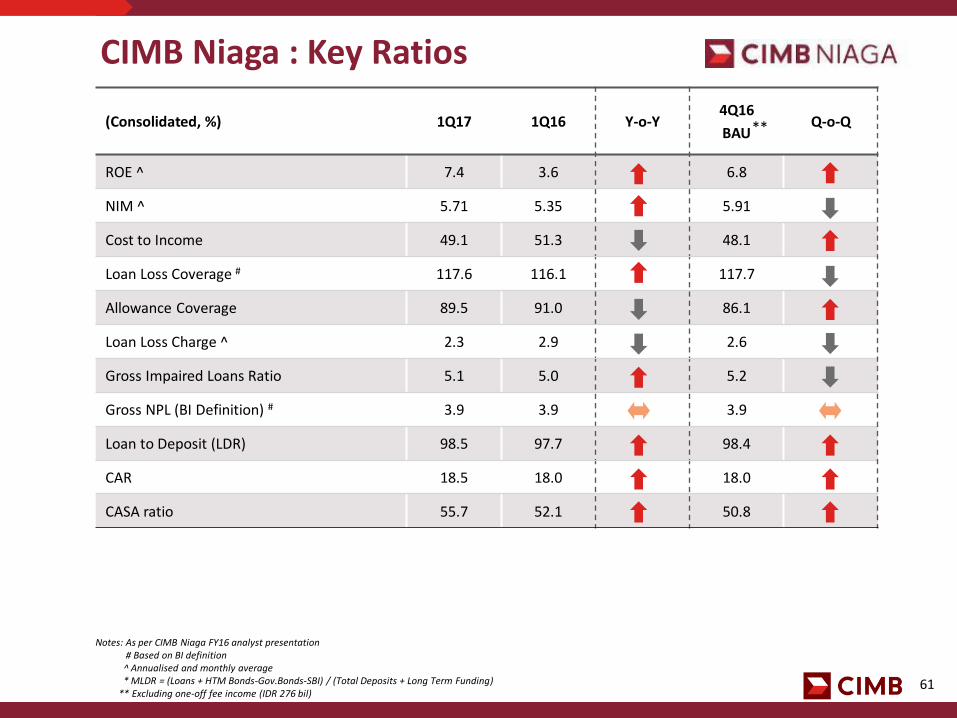
CIMB Niaga : Key Ratios
(Consolidated, %) 1Q17 1Q16 Y-o-Y 4Q16
BAU Q-o-Q
ROE ^ 7.4 3.6 6.8
NIM ^ 5.71 5.35 5.91
Cost to Income 49.1 51.3 48.1
Loan Loss Coverage # 117.6 116.1 117.7
Allowance Coverage 89.5 91.0 86.1
Loan Loss Charge ^ 2.3 2.9 2.6
Gross Impaired Loans Ratio 5.1 5.0 5.2
Gross NPL (BI Definition) # 3.9 3.9 3.9
Loan to Deposit (LDR) 98.5 97.7 98.4
CAR 18.5 18.0 18.0
CASA ratio 55.7 52.1 50.8
Notes: As per CIMB Niaga FY16 analyst presentation # Based on BI definition ^ Annualised and monthly average * MLDR = (Loans + HTM Bonds-Gov.Bonds-SBI) / (Total Deposits + Long Term Funding) ** Excluding one-off fee income (IDR 276 bil)
**

62
CIMB Thai : Earnings Summary Before GAAP Adjustments (THB ‘mil)
1Q17 1Q16 Y-o-Y 4Q16 Q-o-Q
Net interest income 2,463 2,390 3.0% 2,528 (2.6%)
Non interest income 667 924 (27.8%) 707 (5.6%)
Operating income 3,130 3,315 (5.6%) 3,235 (3.2%)
Overhead expenses (1,747) (1,755) (0.5%) (2,112) (17.3%)
PPOP 1,383 1,559 (11.3%) 1,123 23.2%
Provisions (1,230) (1,150) 7.0% (2,901) (57.6%)
PBT 152 409 (62.7%) (1,778) 108.6%
Net Profit 121 327 (63.0%) (1,428) 108.5%
EPS (THB) 0.005 0.01 (63.0%) (0.06) 108.5%
Net Profit (RM ‘mil) ~ 16 36 (57.2%) (179) 108.7%
PBT (RM ‘mil) * 77 64 20.3% (151) 151.0%
Net profit (RM ‘mil) * 69 51 35.3% (103) 167.0%
ROE (Annualised) 1.8% 4.7% (290bps) (20.4%) 2,220bps
Notes: ~ Local GAAP * After GAAP and FRS 139 adjustments

63
CIMB Thai : Key Ratios
(Consolidated, %) 1Q17 1Q16 Y-o-Y 4Q16 Q-o-Q
ROE ^ 1.8 4.8 (20.4)
NIM ^ 3.77 3.72 3.79
Cost to Income 55.8 53.0 65.3
Loan Loss Coverage ** 81.2 115.0 77.3
Loan Loss Charge ^ 2.5 2.3 5.6
Gross NPL ratio ** 5.3 3.0 6.1
Net NPL ratio ** 3.0 1.5 3.5
Loan to Deposit 110.3 126.8 111.9
Modified LDR *** 92.3 93.8 92.4
CAR * 16.2 14.9 15.6
CASA ratio # 44.7 52.2 46.1
Notes: * Bank Only ** Excluding STAMC *** (Loan + MM) / (Deposit + MM + BE + S/T debenture + structured debenture) ^ Annualised # Fixed deposit receipt call reclassified as savings from fixed deposits

64
M&A
Ekovest Berhad
Disposal of 40% equity interest held in Konsortium Lebuhraya Utara-Timur (KL) Sdn Bhd to Employees Provident Fund Board for a total cash consideration of RM1.13bil (Largest infrastructure deal in Malaysia over the last 1 year)
1Q17 Notable Deals DCM
Digi Telecommunications Sdn Bhd
RM5.0 bil in nominal value Sukuk Murabahah Programmes
Mah Sing Group Berhad
RM1.0 bil Perpetual Securities Programme
Lembaga Pembiayaan Ekspor Indonesia
IDR5.221 tril Senior Debt via 3rd Shelf Registration Programme Phase 4 of IDR24.0 tril
PT Astra Sedaya Finance
IDR2.5 tril Senior Debt via 3rd Shelf Registration Programme Phase 3 of IDR8.0 tril
Government Savings Bank
THB36.0 bil Senior Secured Debentures
IPO
Persta Resources Inc.
HKD220 million IPO on the Hong Kong Stock Exchange
DCM
Government of the Hong Kong Special Administrative Region of the People’s Republic of China
USD1.0 bil Trust Certificates due 2027 issued via Hong Kong Sukuk 2017 Ltd
DCM
Frasers Centrepoint Trust
SGD90 mil Senior Unsecured Fixed Rate Notes due 2020 issued via FCT MTN Pte Ltd
Government of the Hong Kong Special Administrative Region of the People’s Republic of China
USD1.0 bil Trust Certificates due 2027 issued via Hong Kong Sukuk 2017 Ltd
65
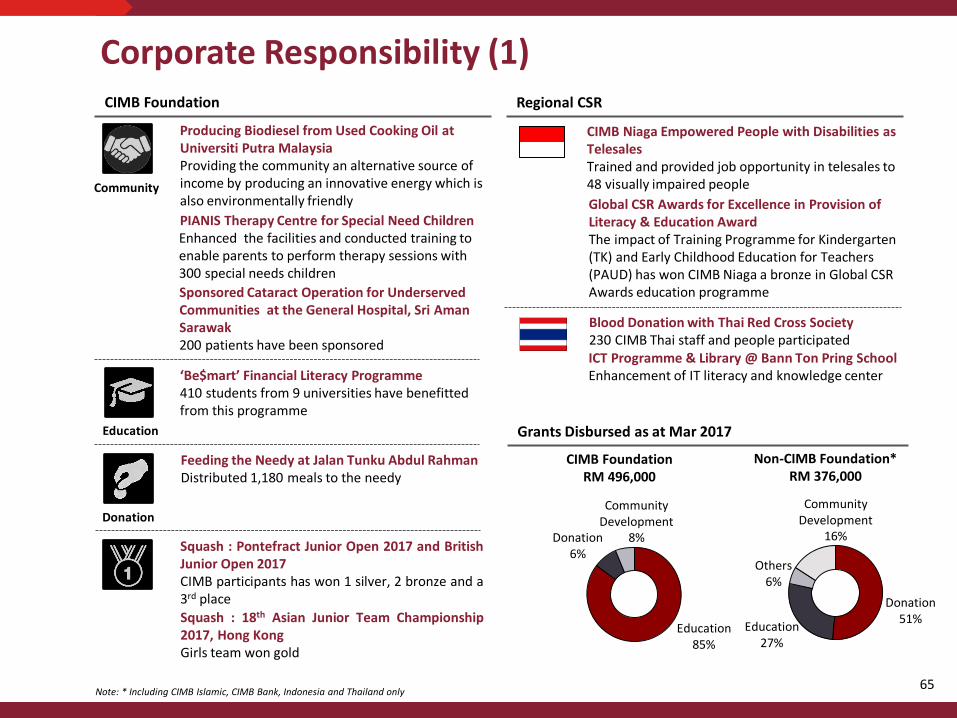
Corporate Responsibility (1) CIMB Foundation
CIMB Niaga Empowered People with Disabilities as Telesales Trained and provided job opportunity in telesales to 48 visually impaired people
Regional CSR
Producing Biodiesel from Used Cooking Oil at Universiti Putra Malaysia Providing the community an alternative source of income by producing an innovative energy which is also environmentally friendly
Community
Blood Donation with Thai Red Cross Society 230 CIMB Thai staff and people participated
‘Be$mart’ Financial Literacy Programme 410 students from 9 universities have benefitted from this programme
Education
ICT Programme & Library @ Bann Ton Pring School Enhancement of IT literacy and knowledge center
Feeding the Needy at Jalan Tunku Abdul Rahman Distributed 1,180 meals to the needy
Donation
Grants Disbursed as at Mar 2017
Non-CIMB Foundation* RM 376,000
CIMB Foundation RM 496,000
Note: * Including CIMB Islamic, CIMB Bank, Indonesia and Thailand only
Global CSR Awards for Excellence in Provision of Literacy & Education Award The impact of Training Programme for Kindergarten (TK) and Early Childhood Education for Teachers (PAUD) has won CIMB Niaga a bronze in Global CSR Awards education programme
PIANIS Therapy Centre for Special Need Children Enhanced the facilities and conducted training to enable parents to perform therapy sessions with 300 special needs children
Squash : Pontefract Junior Open 2017 and British Junior Open 2017 CIMB participants has won 1 silver, 2 bronze and a 3rd place
Sponsored Cataract Operation for Underserved Communities at the General Hospital, Sri Aman Sarawak 200 patients have been sponsored
Squash : 18th Asian Junior Team Championship 2017, Hong Kong Girls team won gold
Donation 51%
Education 27%
Others 6%
Community Development
16%
Education 85%
Community Development
8% Donation 6%
66
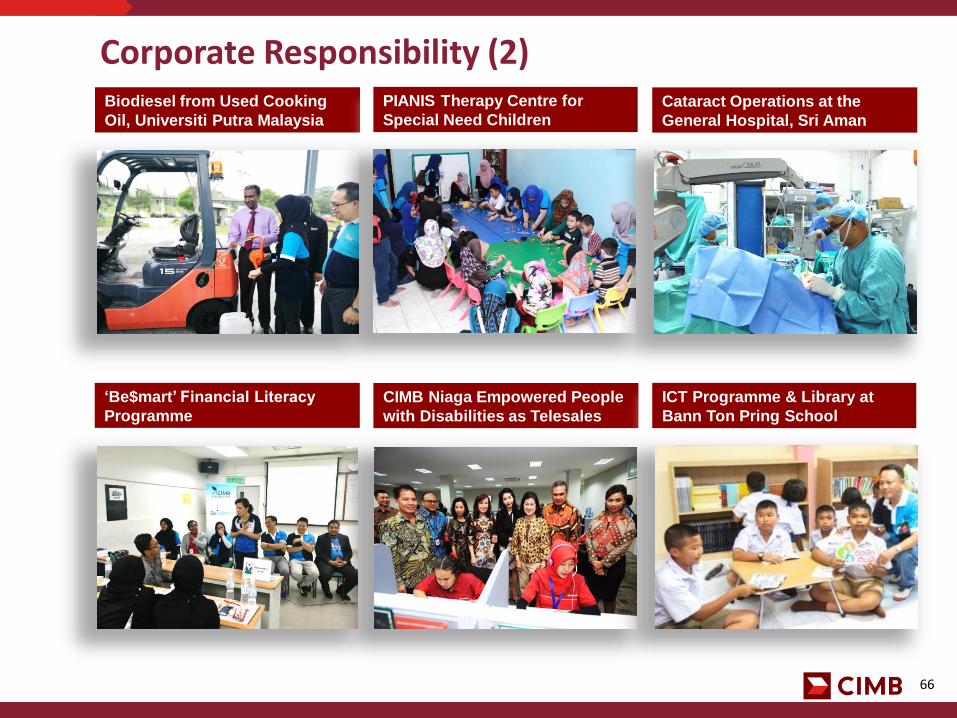
Corporate Responsibility (2)
CIMB Niaga Empowered People
with Disabilities as Telesales
Cataract Operations at the
General Hospital, Sri Aman
Biodiesel from Used Cooking
Oil, Universiti Putra Malaysia
ICT Programme & Library at
Bann Ton Pring School
‘Be$mart’ Financial Literacy
Programme
PIANIS Therapy Centre for
Special Need Children