Windows 10 Enterprise E3 - Best in Class Security and Control - Presented by Atidan
Professional Exams CIMA Paper E3
Enterprise Strategy
SUPPLEMENTARY EXAM KIT
November 2014
i i KAPLAN PUBLISHING
© Kaplan Financial Limited, 2014 All rights reserved. No part of this examination may be reproduced or transmitted in any form or by any means, electronic or mechanical, including photocopying, recording, or by any information storage and retrieval system, without prior permission from Kaplan Publishing.
The text in this material and any others made available by any Kaplan Group company does not amount to advice on a particular matter and should not be taken as such. No reliance should be placed on the content as the basis for any investment or other decision or in connection with any advice given to third parties. Please consult your appropriate professional adviser as necessary. Kaplan Publishing Limited and all other Kaplan group companies expressly disclaim all liability to any person in respect of any losses or other claims, whether direct, indirect, incidental, consequential or otherwise arising in relation to the use of such materials.
KAPLAN PUBLISHING i i i
CONTENTS Page
Section 1:
Pre-seen material for November 2014 1
Section 2:
Unseen material for Question 1 7
Unseen material for Question 2 9
Unseen material for Question 3 11
Section 3:
Answer for Question 1 15
Answer for Question 2 20
Answer for Question 3 25

iv KAPLAN PUBLISHING
KAPLAN PUBLISHING 1
Section 1
PRE-SEEN MATERIAL FOR NOV 2014
NOTE: This Pre-seen material should be read before attempting any of the three questions in this Supplementary Exam Kit.
Pre-seen case study
Y was formed in 1900. It manufactures and sells top quality confectionery. For many years, Y was and remains a successful company and has become a household name particularly throughout Europe. Its fame is built on the very high quality confectionery products it sells through its own high street stores (some of which it owns and some which it leases). Y has just over 3,500 employees.
All of Y’s products are manufactured in its factory in the European country in which it is based (which is in the Eurozone). The products are distributed through a multi-channel network comprising of Y’s own stores and ‘online’ business, franchises and retail partners. In addition, Y has now started to supply confectionery to large retail stores and supermarkets on a contract basis. These stores sell Y’s products and also ‘own brand label’ confectionery that Y manufactures for them.
Y’s product range includes a wide variety of milk, white, plain and diabetic chocolate products. Previously Y’s main sales had been chocolate products but now the company has expanded into producing other forms of confectionery which do not contain chocolate in any form, for example cakes and other sweets (candies). Y’s customers continue to have strong regard for the quality of its products.
Although Y exports its products throughout the world, its largest market is within Europe. Y’s customers vary from individuals to corporate clients which purchase Y’s products to present to their own clients as corporate gifts. Although individual customers buy from Y’s stores, franchises or online, corporate clients purchase goods directly from Y on a contract basis.
Business structure
Y has a simple business structure. It has a head office (which includes its corporate treasury function) and two divisions: Direct Customer Sales (DCS), and Manufacturing and Commercial (MC). The activities of each division are as follows:
DCS
DCS has the following sales outlets: • Y’s own stores • Franchises • Online sales
PAPER E3 : ENTERPRISE STRATEGY
2 KAPLAN PUBLISHING
MC
MC undertakes all purchasing of ingredients and manufacturing of Y’s products. It then supplies these products internally to: • DCS for its sales through its own outlets and externally to: • Corporate clients • External retail stores and supermarkets which sell Y’s products under Y’s own label and also
under the stores’ own labels.
Both divisions are investment centres but have limited capital investment authority, for expenditure up to EUR 10,000 per item. Major capital investments, above EUR 10,000 per item, have to be authorised by head office.
DCS does not allow any of its outlets to make any capital investment at all without its prior approval. Each of DCS’s sales outlets is regarded as a profit centre, including online sales which is a single profit centre in its own right. Brand development is carried out by both of the divisions. Any brand development costs, such as promotion, above EUR 10,000 must be approved at head office.
The decline of high street sales has led Y to reduce the number of its stores and expand other sales outlets. This has resulted in some staff being re-trained and re-deployed. Y currently has just over 300 of its own stores and just less than 200 franchises. It also has developed its own website. This has been very popular and has enabled its international business to grow. In addition, as internet shopping has become more popular, Y has been able to develop its online sales business and has introduced ‘click and collect’ services using its stores and franchise businesses as the collection points.
Mission, Aim and Objectives
Y’s mission statement, agreed by the Board of Directors last year is:
'To delight customers by providing luxurious products which strengthen the brand.'
Y’s overall aim is to increase shareholder value by improving profit margins through increased sales and reduced costs. Despite the difficult economic conditions in Europe, the chocolate market has continued to grow in the last five years. Y’s customers engage particularly with chocolate products in response to austere economic conditions seeing them as an affordable alternative to higher priced gifts. Y is now placing greater emphasis on trying to ‘de-seasonalise’ its sales by not being reliant on the seasonal peak sales periods. Y is encouraging customers to buy its products throughout the year through all of its sales channels. This demands a strong focus on developing brand awareness.
Y intends to achieve the continued development and growth of its business by meeting two strategic objectives which are to:
1 Engage with the widest range of customers through the development of Y’s markets and products through a wide variety of sales channels. The focus of this is on the delivery of products the customer demands, where they are required and when they are wanted.
2 Enhance the customer experience through strong and effective customer relationship management. The focus of this is on clear and consistent branding and marketing to encourage customer retention and loyalty all the year round.
PRE-SEEN MATERIAL : SECTION 1
KAPLAN PUBLISHING 3
Y’s Board and Divisional Management
The Board comprises a non-executive Chairman, a newly appointed Chief Executive, the Managing Directors of the two divisions, the Finance Director and three non-executive directors. The company applies good corporate governance principles and practice and the Board has a committee structure which includes an Audit Committee.
The divisional structures reflect their different activities. The Managing Director of each division has a team comprising three divisional directors covering the functions of Finance, Human Resources and Information Technology. In addition, the DCS division has three divisional directors, one each responsible for Y’s stores, franchises and online sales. In addition to the divisional directors for Finance, Human Resources and IT, the MC division has three divisional directors, one responsible for procurement, one for manufacturing and one for commercial clients, retail stores and supermarkets. The structure for Y’s Board and its divisions is presented at Appendix 1.
Financial overview
Extracts from the statement of profit or loss for the year ended 31 December 2013 and statement of financial position as at 31 December 2013 are shown in Appendix 2. They show that in the last financial year, Y achieved an operating profit margin of 12% and a profit after tax of 7.7%.
Despite its best efforts in heavily re-investing in the business, Y’s bottom-line profit has stagnated. The Board is concerned that expected actual profit for the year ended 31 December 2014, when compared to the forecast, is not looking as promising as was first thought. The Board is also mindful that some of Y’s borrowings are due for re-payment in 2015.
In response to these concerns, the Board of Directors has determined the following financial objectives for Y: • That it should operate on a sound financial basis in order to increase profit and shareholder
value • That it should pay a regular and consistent dividend each year.
Environmental and Corporate Social Responsibility
Y aims to carry out its business with as little damage to the environment as possible and to operate in a fair manner with regard to all its stakeholders. It is keen to ensure that each of its suppliers adheres to high ethical and environmental standards with regard to sources of materials and treatment of employees.
Y imports cocoa from Africa and Indonesia. Y has initiated schemes to encourage sustainable farming of cocoa and farmers are being trained in effective agricultural methods. The introduction of an industry approved certification programme has enabled farmers to achieve higher levels of income from increased production and to access additional training directed at improving their production yields. All raw materials sourced from Africa and Indonesia are priced in US Dollars (USD).
All of Y’s products contain only the ingredients listed on the packaging. The packaging also shows nutritional content and gives advice on recommended volumes of consumption. Y tries to ensure that the packaging used for its products is recyclable and kept as minimal as possible to balance concerns over material usage with commercial marketing requirements.
Environmentally friendly lighting has been introduced in Y’s factory which has reduced consumption of electricity and emission of carbon dioxide.
PAPER E3 : ENTERPRISE STRATEGY
4 KAPLAN PUBLISHING
Y has introduced annual independent health and safety audits in its factory and retail outlets. All factory staff have undertaken food safety and health and safety in the workplace training at the required industry standard level. Workplace benefits, such as life and medical insurance, staff discounts and membership of local gymnasia, as well as competitive salaries and wages are offered to all of Y’s employees.
Strategic developments
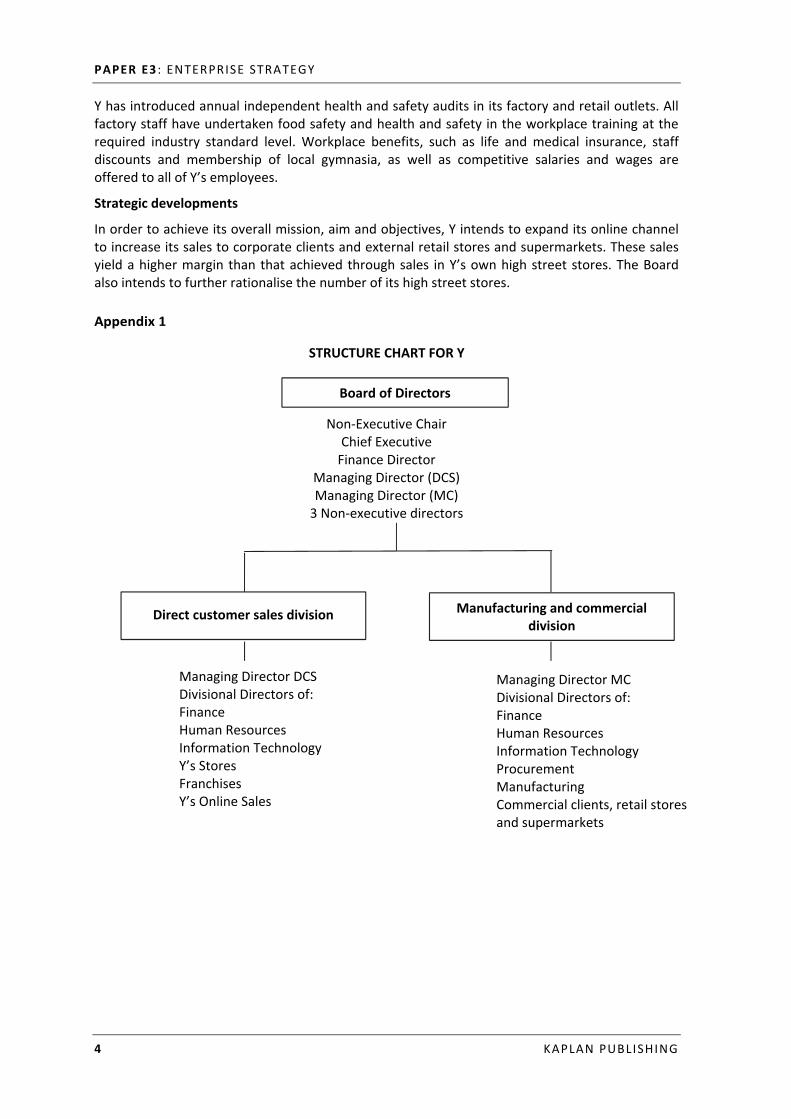
In order to achieve its overall mission, aim and objectives, Y intends to expand its online channel to increase its sales to corporate clients and external retail stores and supermarkets. These sales yield a higher margin than that achieved through sales in Y’s own high street stores. The Board also intends to further rationalise the number of its high street stores. Appendix 1
STRUCTURE CHART FOR Y
Non-Executive Chair Chief Executive
Finance Director Managing Director (DCS) Managing Director (MC)
3 Non-executive directors
Managing Director DCS Divisional Directors of: Finance Human Resources Information Technology Y’s Stores Franchises Y’s Online Sales
Managing Director MC Divisional Directors of: Finance Human Resources Information Technology Procurement Manufacturing Commercial clients, retail stores and supermarkets
Board of Directors
Direct customer sales division Manufacturing and commercial division
PRE-SEEN MATERIAL : SECTION 1
KAPLAN PUBLISHING 5
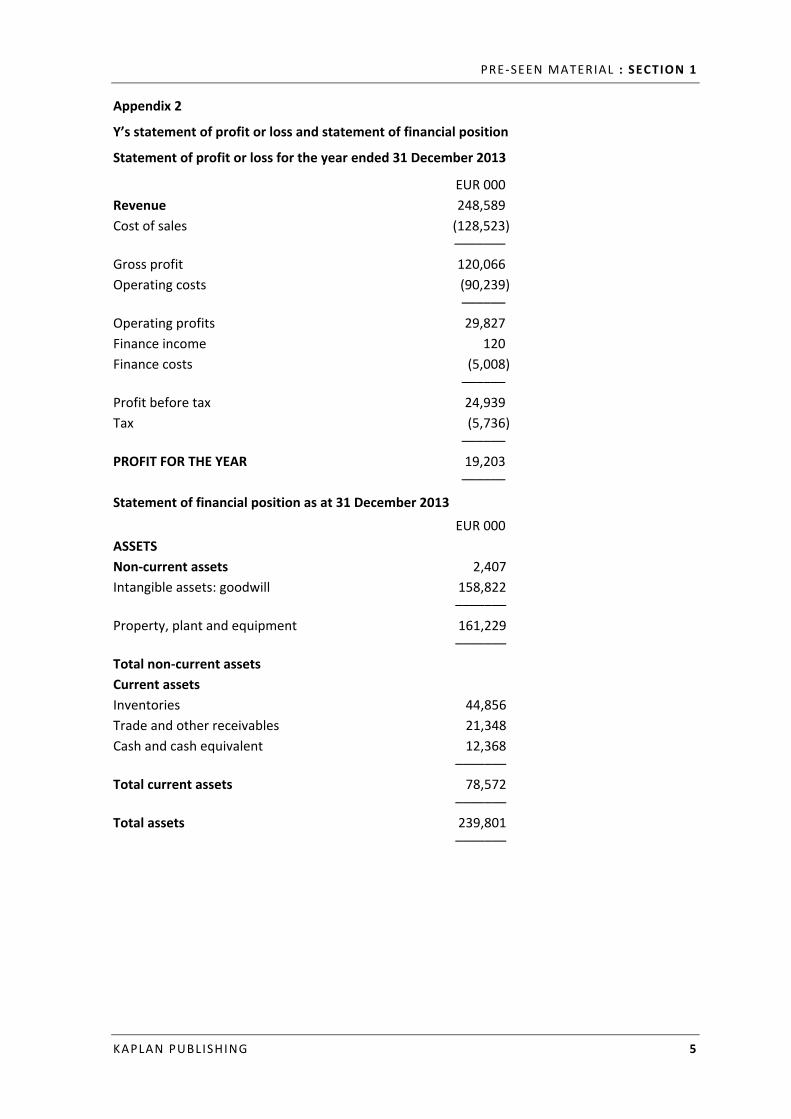
Appendix 2
Y’s statement of profit or loss and statement of financial position
Statement of profit or loss for the year ended 31 December 2013
EUR 000 Revenue 248,589 Cost of sales (128,523)
––––––– Gross profit 120,066 Operating costs (90,239)
–––––– Operating profits 29,827 Finance income 120 Finance costs (5,008)
–––––– Profit before tax 24,939 Tax (5,736)
–––––– PROFIT FOR THE YEAR 19,203
––––––
Statement of financial position as at 31 December 2013 EUR 000 ASSETS Non-current assets 2,407 Intangible assets: goodwill 158,822
––––––– Property, plant and equipment 161,229
––––––– Total non-current assets Current assets Inventories 44,856 Trade and other receivables 21,348 Cash and cash equivalent 12,368
––––––– Total current assets 78,572
––––––– Total assets 239,801
–––––––
PAPER E3 : ENTERPRISE STRATEGY
6 KAPLAN PUBLISHING
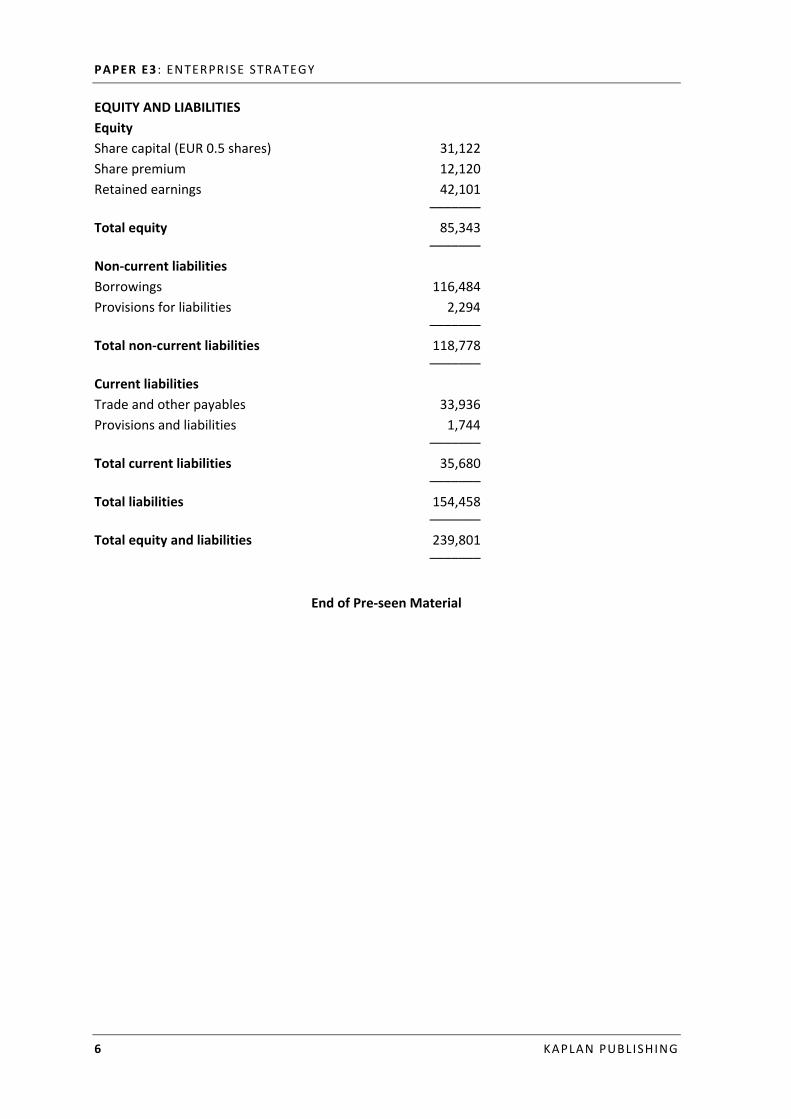
EQUITY AND LIABILITIES Equity Share capital (EUR 0.5 shares) 31,122 Share premium 12,120 Retained earnings 42,101
––––––– Total equity 85,343
––––––– Non-current liabilities Borrowings 116,484 Provisions for liabilities 2,294
––––––– Total non-current liabilities 118,778
––––––– Current liabilities Trade and other payables 33,936 Provisions and liabilities 1,744
––––––– Total current liabilities 35,680
––––––– Total liabilities 154,458
––––––– Total equity and liabilities 239,801
–––––––
End of Pre-seen Material
KAPLAN PUBLISHING 7
Section 2
QUESTIONS – UNSEEN MATERIAL
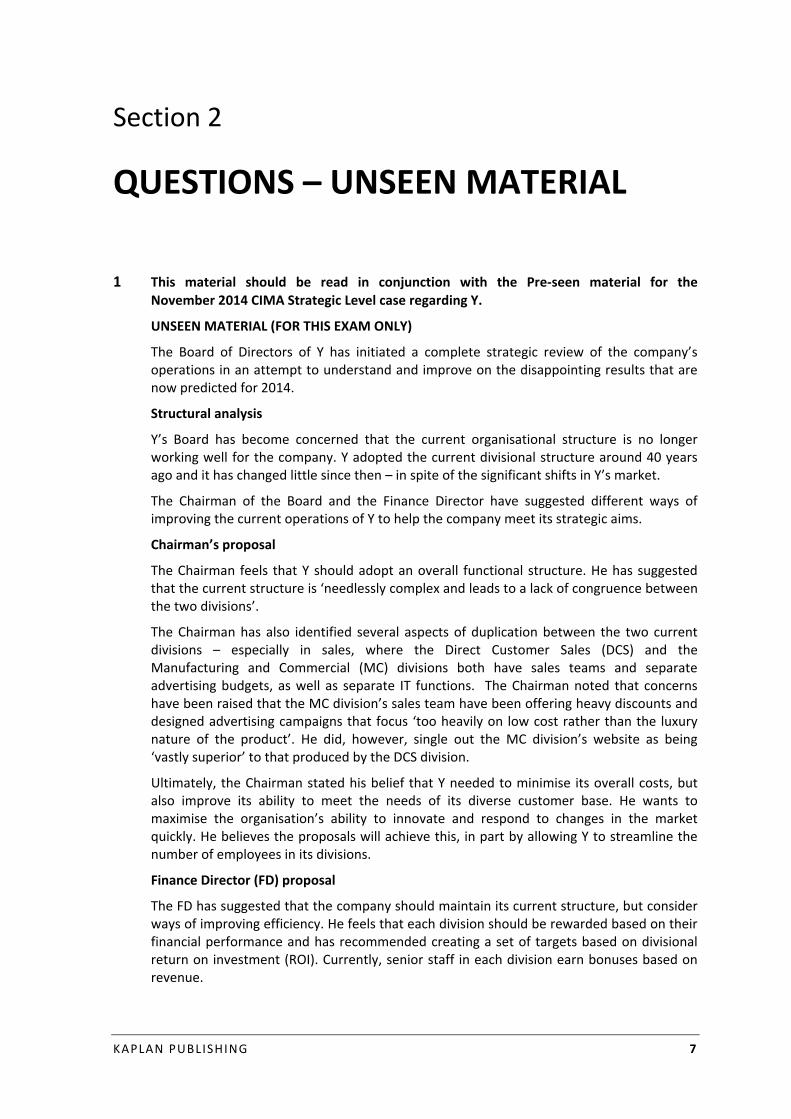
1 This material should be read in conjunction with the Pre-seen material for the November 2014 CIMA Strategic Level case regarding Y.
UNSEEN MATERIAL (FOR THIS EXAM ONLY)
The Board of Directors of Y has initiated a complete strategic review of the company’s operations in an attempt to understand and improve on the disappointing results that are now predicted for 2014.
Structural analysis
Y’s Board has become concerned that the current organisational structure is no longer working well for the company. Y adopted the current divisional structure around 40 years ago and it has changed little since then – in spite of the significant shifts in Y’s market.
The Chairman of the Board and the Finance Director have suggested different ways of improving the current operations of Y to help the company meet its strategic aims.
Chairman’s proposal
The Chairman feels that Y should adopt an overall functional structure. He has suggested that the current structure is ‘needlessly complex and leads to a lack of congruence between the two divisions’.
The Chairman has also identified several aspects of duplication between the two current divisions – especially in sales, where the Direct Customer Sales (DCS) and the Manufacturing and Commercial (MC) divisions both have sales teams and separate advertising budgets, as well as separate IT functions. The Chairman noted that concerns have been raised that the MC division’s sales team have been offering heavy discounts and designed advertising campaigns that focus ‘too heavily on low cost rather than the luxury nature of the product’. He did, however, single out the MC division’s website as being ‘vastly superior’ to that produced by the DCS division.
Ultimately, the Chairman stated his belief that Y needed to minimise its overall costs, but also improve its ability to meet the needs of its diverse customer base. He wants to maximise the organisation’s ability to innovate and respond to changes in the market quickly. He believes the proposals will achieve this, in part by allowing Y to streamline the number of employees in its divisions.
Finance Director (FD) proposal
The FD has suggested that the company should maintain its current structure, but consider ways of improving efficiency. He feels that each division should be rewarded based on their financial performance and has recommended creating a set of targets based on divisional return on investment (ROI). Currently, senior staff in each division earn bonuses based on revenue.
PAPER E3 : ENTERPRISE STRATEGY
8 KAPLAN PUBLISHING
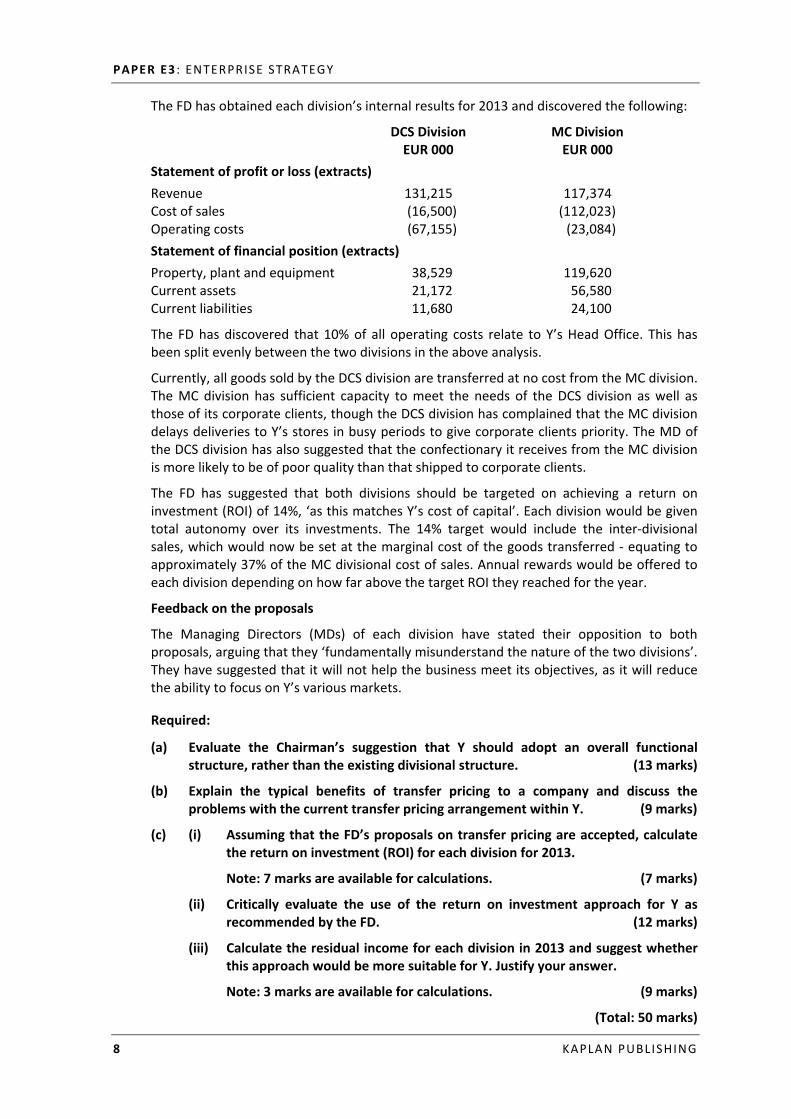
The FD has obtained each division’s internal results for 2013 and discovered the following:
DCS Division MC Division EUR 000 EUR 000
Statement of profit or loss (extracts) Revenue 131,215 117,374 Cost of sales (16,500) (112,023) Operating costs (67,155) (23,084) Statement of financial position (extracts) Property, plant and equipment 38,529 119,620 Current assets 21,172 56,580 Current liabilities 11,680 24,100
The FD has discovered that 10% of all operating costs relate to Y’s Head Office. This has been split evenly between the two divisions in the above analysis.
Currently, all goods sold by the DCS division are transferred at no cost from the MC division. The MC division has sufficient capacity to meet the needs of the DCS division as well as those of its corporate clients, though the DCS division has complained that the MC division delays deliveries to Y’s stores in busy periods to give corporate clients priority. The MD of the DCS division has also suggested that the confectionary it receives from the MC division is more likely to be of poor quality than that shipped to corporate clients.
The FD has suggested that both divisions should be targeted on achieving a return on investment (ROI) of 14%, ‘as this matches Y’s cost of capital’. Each division would be given total autonomy over its investments. The 14% target would include the inter-divisional sales, which would now be set at the marginal cost of the goods transferred - equating to approximately 37% of the MC divisional cost of sales. Annual rewards would be offered to each division depending on how far above the target ROI they reached for the year.
Feedback on the proposals
The Managing Directors (MDs) of each division have stated their opposition to both proposals, arguing that they ‘fundamentally misunderstand the nature of the two divisions’. They have suggested that it will not help the business meet its objectives, as it will reduce the ability to focus on Y’s various markets.
Required:
(a) Evaluate the Chairman’s suggestion that Y should adopt an overall functional structure, rather than the existing divisional structure. (13 marks)
(b) Explain the typical benefits of transfer pricing to a company and discuss the problems with the current transfer pricing arrangement within Y. (9 marks)
(c) (i) Assuming that the FD’s proposals on transfer pricing are accepted, calculate the return on investment (ROI) for each division for 2013.
Note: 7 marks are available for calculations. (7 marks)
(ii) Critically evaluate the use of the return on investment approach for Y as recommended by the FD. (12 marks)
(iii) Calculate the residual income for each division in 2013 and suggest whether this approach would be more suitable for Y. Justify your answer.
Note: 3 marks are available for calculations. (9 marks)
(Total: 50 marks)
QUESTIONS – UNSEEN MATERIAL : SECTION 2
KAPLAN PUBLISHING 9
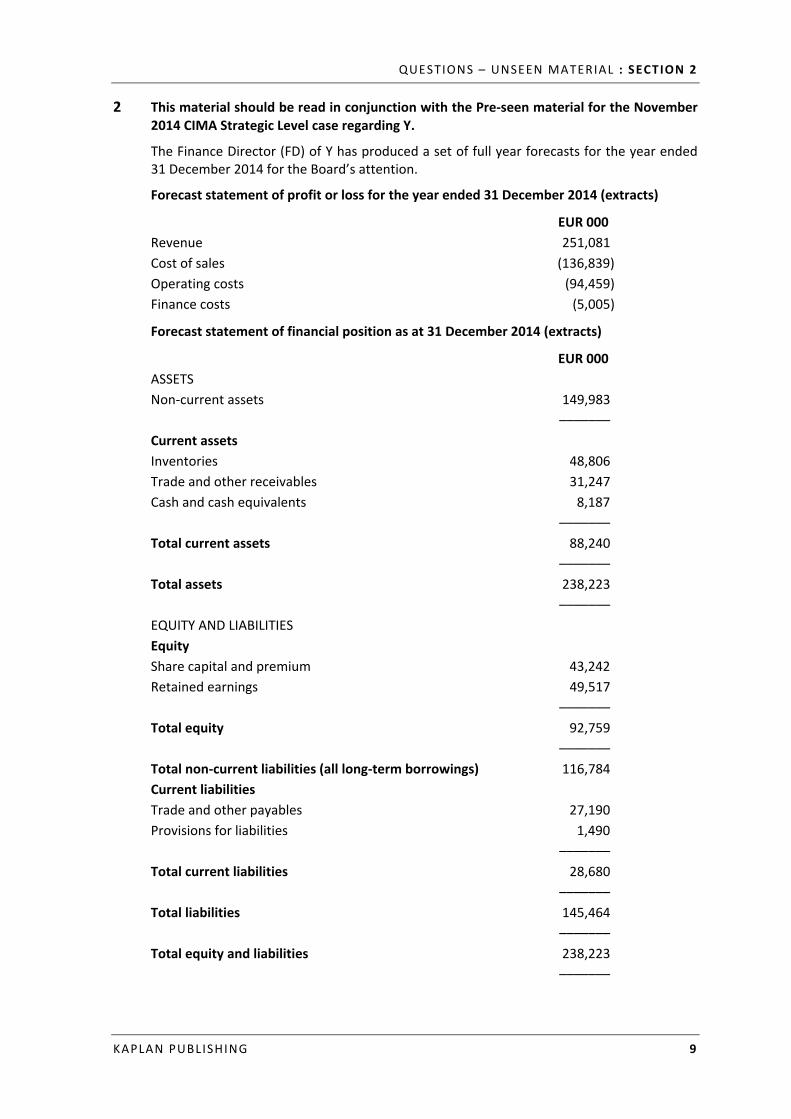
2 This material should be read in conjunction with the Pre-seen material for the November 2014 CIMA Strategic Level case regarding Y.
The Finance Director (FD) of Y has produced a set of full year forecasts for the year ended 31 December 2014 for the Board’s attention.
Forecast statement of profit or loss for the year ended 31 December 2014 (extracts)
EUR 000 Revenue 251,081 Cost of sales (136,839) Operating costs (94,459) Finance costs (5,005)
Forecast statement of financial position as at 31 December 2014 (extracts)
EUR 000 ASSETS Non-current assets 149,983 ––––––– Current assets Inventories 48,806 Trade and other receivables 31,247 Cash and cash equivalents 8,187 ––––––– Total current assets 88,240 ––––––– Total assets 238,223 ––––––– EQUITY AND LIABILITIES Equity Share capital and premium 43,242 Retained earnings 49,517 ––––––– Total equity 92,759 ––––––– Total non-current liabilities (all long-term borrowings) 116,784 Current liabilities Trade and other payables 27,190 Provisions for liabilities 1,490 ––––––– Total current liabilities 28,680 ––––––– Total liabilities 145,464 ––––––– Total equity and liabilities 238,223 –––––––
PAPER E3 : ENTERPRISE STRATEGY
10 KAPLAN PUBLISHING
Finance Director analysis
It has been a difficult trading year for Y, due to a decline in high-street sales across the majority of its stores. While many customers have been turning to Y’s internet site, a rising proportion of Y’s sales are now being made through supermarkets and major retailers. In particular sales of supermarket branded chocolate (manufactured by Y) have risen sharply. In spite of the economic downturn, the overall size of the confectionary market that Y operates in has risen by 5% to 2014.
Employees in Y’s owned stores have been aware of the risk of store closure for some time, though the possibility of redeployment has been uncertain. Several employees have stated that ‘there’s nothing we can do to improve sales – it’s management’s fault for selling in so many other places’.
Y is also planning a significant dividend of EUR 2m at the end of the coming year, which has also been included within the forecasts produced by the FD.
In a departure from its typical policy, the Board has halted the majority of capital investment, with only essential purchases being made.
Overall, the FD concluded that there are clear signs that Y is in some financial distress. On the basis of the forecasts, Y is planning on closing a number of stores in the last quarter of 2014 whose premises leases had come to an end (this is reflected in the above forecasts). Employees from these stores may be redeployed elsewhere in the business, though the FD has suggested there is no real need for extra staff in Y’s other operations.
Corporate social responsibility (CSR)
Inflation has been high in many of the countries that supply Y’s raw materials, such as sugar and cocoa. Y’s website has publicised the company’s commitment to offering farmers who supply Y ‘a fair deal’ meaning that they ensure farmers have sufficient returns to live on. In 2014, Y also stated that it would try to ensure that it pays these more vulnerable suppliers as quickly as possible.
In light of the poor results, the Finance Director has made a number of suggestions relating to Y’s CSR, including:
• Increasing the ‘recommended portion size’ on Y’s products. There is currently little legislation in the Eurozone on what constitutes a portion size, in spite of increasing obesity problems. The FD feels that an increase in portion sizes will enable Y to sell more of its products. These are currently set at a conservative level to reduce any impact on customer health.
• Making staff from closed stores redundant, rather than redeploying them. • Negotiating lower prices with farmers. The FD has noted that as Y currently buys
large volumes from many suppliers, it should be in a powerful position to reduce its costs.
The other directors are concerned about any attempts to undermine Y’s CSR position, with the Chairman arguing that ‘CSR is vital to Y’s image with customers and suppliers. We should be looking to increase spending on this area, not reduce it.’
QUESTIONS – UNSEEN MATERIAL : SECTION 2
KAPLAN PUBLISHING 11
Forecast concerns
There has also been debate within the Board about the quality of the forecasts for the last quarter of the year. Several directors have suggested that the FD’s forecasts are overly cautious and that, in fact the last quarter (typically when Y achieves a large share of its annual revenue) will see a significant rise in performance due to an improving economic position within the Eurozone. They have questioned therefore, whether there is a need to close any more stores in the last quarter of the year.
In fact, the FD had been presented with a similar report by a management accountant working within Y which suggested that there was a ‘good possibility’ that sales in the final quarter of the year would be far stronger than previously thought. The FD wishes to adopt a cautious view and has told the management accountant to ignore this information in the 2014 forecasts presented to the Board. He has suggested that failure to do so may compromise her future with the company.
Required:
(a) Analyse and explain Y’s projected financial performance in 2014, when compared with its 2013 results. State any assumptions you have made in your calculations.
Note: 10 marks are available for calculations. (20 marks)
(b) Explain the benefits and drawbacks of Y’s current approach to CSR. Briefly comment on the FD’s suggestions regarding CSR within Y. (16 marks)
(c) (i) Discuss the benefits to Y of having good quality management information. (6 marks)
(ii) Identify and discuss FOUR CIMA fundamental ethical principles that the management accountant would be breaching if she agreed to the FD’s demands. (8 marks)
(Total: 50 marks)
3 This material should be read in conjunction with the Pre-seen material for the November 2014 CIMA Strategic Level case regarding Y.
The most recent projected results for 2014 have been made available to the Board and have caused significant concern among the board members, as they show further, unexpected declines in the company’s profitability.
The Board has undertaken some detailed analysis of Y’s operations in order to help the company identify ways of improving margins. The Board has decided to consider three possible new strategies, put forward by the Chairman, for the business going forward. The Directors have stated that they do not wish to proceed with any strategies deemed to be ‘too risky’.
Strategy 1
Y has a number of strategic account managers (SAMs) in charge of maintaining a close relationship with each of Y’s major corporate and retail clients. Several of the corporate managers have suggested that Y develop a range of luxury chocolates that are exclusively offered to corporate clients. They would not be offered through any of Y’s other outlets.
PAPER E3 : ENTERPRISE STRATEGY
12 KAPLAN PUBLISHING
Y’s strategic account managers have extensive experience of Y’s corporate client requirements and they believe that any new range of confectionary would need to have more extensive, premium packaging than Y’s normal offerings. It would also need to have a higher cocoa content and a range of unique flavours. Y would be able to charge a premium for these products, but to maintain its margins it would need to source raw materials from suppliers who may use less sustainable working practices than Y’s current suppliers.
Strategy 2
One of Y’s research and development team members has recently been on a visit to the US – a geographic area where Y has little presence. He has identified that there are relatively few products catering to the needs of diabetic customers in the market – a segment which Y produces a number of high margin products for. The rate of diabetes has been growing in recent years in the US. Most US customers buy all their confectionary through various large supermarket chains.
Y’s management is cautious about this idea, as Y has previously made costly attempts to enter the US market, but with little success. The board is aware that the US confectionary market is dominated by several major companies which have agreements with the majority of US supermarket chains. It also feels that its current products would require redesigned packaging in order to appeal to the US market.
Strategy 3
Y is considering the launch of a range of chocolate drinks. These would be served chilled and would be offered through a wide variety of shops – from supermarkets to small, independent local retailers. The drinks would be Y branded and would be sold at a relatively low margin in order to compete with similar, existing drinks in the market. Y currently has no experience of drinks manufacture.
The Finance Director (FD) of Y has prepared a number of forecasts relating to the proposed drinks expansion.
The initial cost of the machinery required for the production of chocolate drinks is expected to be EUR 200,000, depreciated on a straight line basis. The manufacturing process would require 10 employees, at an average cost of EUR 10,000 per annum.
Based on previous launches of similar products by Y’s rivals, the FD has estimated that in the first year there is a 60% chance that sales will be EUR 800k, a 20% chance that sales will be EUR 500k and a 20% chance sales will be just EUR 300k.
Sales growth will depend on the growth in the size of the chocolate drinks market, which has historically been unpredictable. The FD feels that there is a 75% chance sales growth after the first year will be 5% per annum and a 25% chance it will be 1% per annum. Growth is assumed to stay constant across the life of the project.
Gross margins in the first year are expected to be 40%, though the FD is confident that this will fall by 1% per annum each year thereafter, due to increasing raw material costs – in spite of relatively low quality materials being used. Central administration costs for the new product will be EUR 50k in the first year, rising by 7% per annum.
Y wishes to assess the profits generated by the strategy over a four year period.
QUESTIONS – UNSEEN MATERIAL : SECTION 2
KAPLAN PUBLISHING 13
Customer relationship management (CRM)
Whichever of the above strategies (if any) is adopted by Y, the company is planning to launch a new IT system to help it manage its relationship with its customers. The new system will act as a database of information about clients, their buying habits and feedback – especially those provided by corporate and retail customers. Y’s directors feel that this will ensure that they are able to make strategic decisions about Y’s products more quickly and accurately than they are current able to. The system will be tailored to Y’s designs by a software development company.
Y’s directors would be able to contact major clients directly and the system would be used to contact customers for feedback via questionnaires and structured surveys. This information would be immediately accessible to Y’s directors.
All of this work is currently undertaken by Y’s strategic account managers (SAMs), who have regular meetings with clients, often taking key corporate managers out for hospitality – such as meal. Many of Y’s SAMs are now good personal friends with the corporate account managers of the clients they manage. The SAMs are also personally involved in developing strategies with the directors.
Y’s current SAMs were surprised by the announcement of the new IT system as they had not been included in any discussions on its creation. They have expressed concern over the proposals, saying that it will ‘see an end to the personal contact that Y has with its major clients’. Y’s Board of directors has disagreed, saying that the SAMs would still be needed – but as system administrators, collating data and ensuring that feedback is received from customers.
The SAMs are concerned that this will eventually lead to their jobs being made redundant, or to significant pay cuts, and have suggested that they will refer the matter to the union which represents the majority of Y’s employees. Y’s directors do not feel that redundancies or pay cuts will be needed at the current time.
Required:
(a) (i) Explain and justify where each of the Chairman’s three strategies would be placed on Ansoff’s product/market matrix. (9 marks)
(ii) Calculate the best, worst and expected profits for strategy 3. Explain any limitations of your analysis.
Note: 8 marks are available for calculations. (10 marks)
(iii) Recommend which, if any, of the Chairman’s strategies are suitable for Y to adopt. Justify your answer. (15 marks)
(b) (i) Explain the likely reasons for the resistance that Y is facing over the introduction of its new CRM system. (7 marks)
(ii)Using Lewin’s three-stage model, discuss how Y could manage the change process and minimise resistance when introducing the new CRM system. (9 marks)
(Total: 50 marks)

PAPER E3 : ENTERPRISE STRATEGY
14 KAPLAN PUBLISHING
KAPLAN PUBLISHING 15
Section 3
ANSWERS
1 (a) Functional structure
The Chairman has proposed that the organisation move away from its current divisional structure and adopt an overall functional approach.
A functional structure would have some advantages for Y.
Y is looking to reduce costs and improve its margins. Currently the divisional structure has led to significant duplication of key functions, especially within sales and information technology (but also potentially within finance and HR). Merging these functions could allow the business to reduce costs (and potentially staff numbers). Economies of scale may also become easier to create.
Changing to a functional structure would also enable Y to pool its experts together. It is clear that each division has skills in differing areas – for instance the MC division has excellent technical skills as shown by the development of an excellent web site. A functional structure would allow the company to ensure these skills could be used for the benefit of Y as a whole – not just one division.
Control may also be improved under a functional structure. There is evidence that the Board is not entirely happy with the way that the MC division has been advertising products (by emphasising cost, rather than focus on quality/brand image). Moving to a functional structure would potentially make it easier for the Board to exert direct control on such important areas.
It could be argued that, in spite of the warnings of the divisional managers, a functional structure could enable Y to more easily meet the needs of its customers. The MC division produces confectionary for the entire business, but is one step removed from individual and online consumers, as they purchase from the DCS division. By removing the divisional barriers, it may be possible for feedback from customers to be more rapidly acted upon by the organisation. A functional structure would centralise other functions, such as research and development. This could help the organisation innovate and make decisions more quickly, leading to increased responsiveness to the market.
A move to the functional structure would also remove the need for complex decisions on transfer pricing and divisional performance measures, potentially saving the organisation time and money.
Removing the current divisional structure will improve goal congruence. At the moment, there are accusations that the MC division is giving poor quality service to the DCS division as it wishes to focus on its own corporate clients, as these are more valuable to the MC division financially. Removal of the divisional structure could ensure that employees focus on looking after all of Y’s customers – not just those that benefit their division.
However, a functional approach may not be ideal for Y for a number of reasons.
PAPER E3 : ENTERPRISE STRATEGY
16 KAPLAN PUBLISHING
Given the sheer size of the business, it seems unlikely that a single set of management will have the time to deal with all the strategic decisions that they will need to make. This may be compounded if the company grows further.
The needs of the different customer groups within Y may not be adequately addressed under a functional structure. Attracting and retaining corporate clients is likely to be very different to selling to the public through stores and online. Combining the divisions may mean that Y becomes less responsive to the needs of its customers – something that goes against its objectives.
The main benefit outlined by the Chairman is that the change in structure will enable Y to reduce its headcount and lay off staff. This could provoke an angry reaction from employees, who may feel that the company is no longer looking after their needs. Whether Y’s employees are unionised is irrelevant as such a move could lead to the deterioration of employee relations and damage Y’s corporate social responsibility credentials.
It is worth noting that such a shift in organisational structure is unlikely to yield short-term benefits for the company. In addition to the disruption and management time taken up with changing the organisational structure, Y may incur one-off restructuring costs, such as redundancies, etc. This could make 2014’s already disappointing results even worse.
Conclusion
The case for restructuring Y does not seem to be proven. While it may have long-term cost advantages, it could work to make Y slower to make decisions and less reactive to the needs of its major customers. Rather than disrupting operations, Y may be more sensible to consider alternative ways of boosting its profitability.
(b) Transfer pricing
Within Y, transfer pricing relates to the valuation of the goods transferred between the divisions – i.e. those produced by the MC division and then sold through the DCS division. At the moment this transfer is made at no cost.
The typical benefits of a transfer pricing arrangement to an organisation include:
• Ensuring goal congruence between divisions – a transfer pricing arrangement can ensure that each division works for the benefit of the organisation as a whole and sees that supplying other divisions is in its own best interests.
• Motivation – transfer pricing ensures a fairer split of results between divisions, allowing for fairer division of bonuses and other management rewards.
• Taxation benefits – transfer pricing can be used to reduce taxation by moving profits from high tax economies to low-tax economies.
The current transfer pricing arrangement involves the transfer of goods at no cost between the divisions. This may cause a number of problems.
Firstly, it is likely to demotivate the MC division. The transfer of goods at no cost means that the MC division suffers the manufacturing costs, while the DCS division enjoys the sales. This skews the divisional results meaning that the DCS division will earn higher performance rewards.
This problem would continue even under the FD’s proposals – with the DCS division enjoying high sales and low costs, while the MC division simply covers its variable manufacturing costs, keeping its return on investment low.
ANSWERS : SECTION 3
KAPLAN PUBLISHING 17
There is little incentive for the MC division to offer a strong internal customer service, as the shipments to the DCS division offer no return. This can be seen by the delays in delivering products to Y’s stores in busy periods to allow corporate client orders to be fulfilled. The reduction in quality of goods shipped to the DCS division is also a concern as this may damage Y’s reputation in the market, as well as going against the company’s overall mission.
Note that the DCS and MC division are both located in the same country, so the transfer pricing is unlikely to have any effect on Y’s overall tax liability.
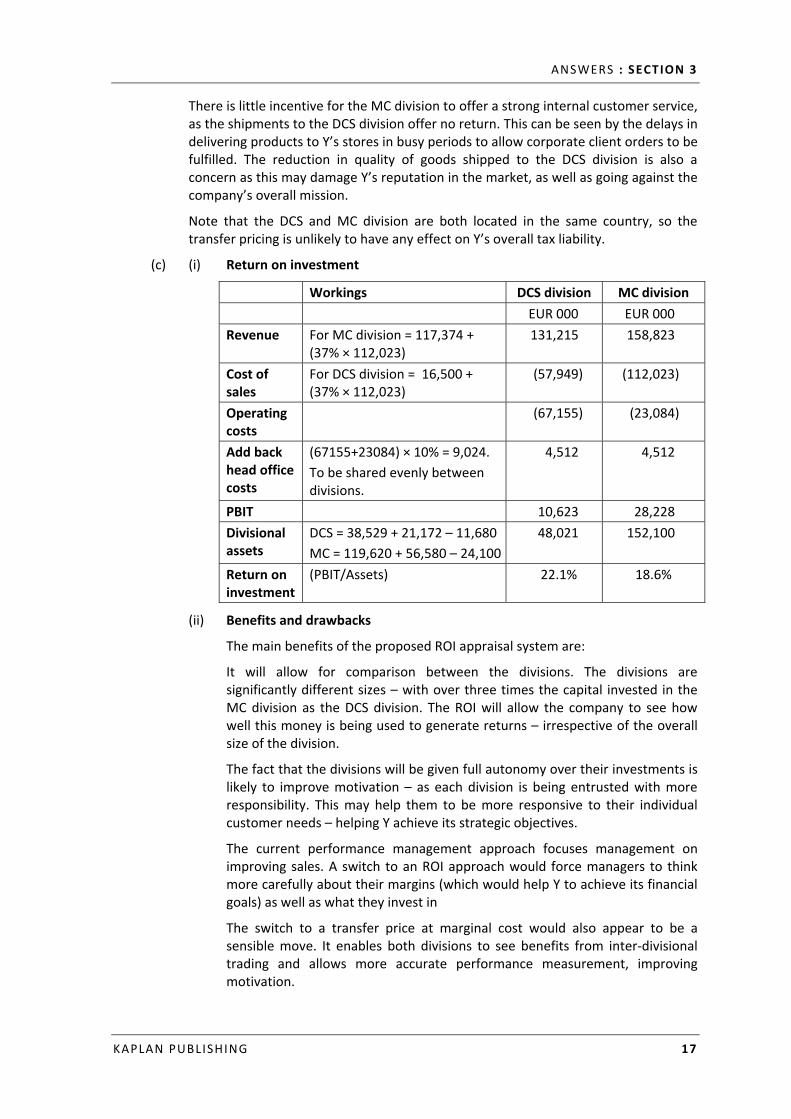
(c) (i) Return on investment
Workings DCS division MC division EUR 000 EUR 000 Revenue For MC division = 117,374 +
(37% × 112,023) 131,215 158,823
Cost of sales
For DCS division = 16,500 + (37% × 112,023)
(57,949) (112,023)
Operating costs
(67,155) (23,084)
Add back head office costs
(67155+23084) × 10% = 9,024. To be shared evenly between divisions.
4,512 4,512
PBIT 10,623 28,228 Divisional assets
DCS = 38,529 + 21,172 – 11,680 MC = 119,620 + 56,580 – 24,100
48,021 152,100
Return on investment
(PBIT/Assets) 22.1% 18.6%
(ii) Benefits and drawbacks
The main benefits of the proposed ROI appraisal system are:
It will allow for comparison between the divisions. The divisions are significantly different sizes – with over three times the capital invested in the MC division as the DCS division. The ROI will allow the company to see how well this money is being used to generate returns – irrespective of the overall size of the division.
The fact that the divisions will be given full autonomy over their investments is likely to improve motivation – as each division is being entrusted with more responsibility. This may help them to be more responsive to their individual customer needs – helping Y achieve its strategic objectives.
The current performance management approach focuses management on improving sales. A switch to an ROI approach would force managers to think more carefully about their margins (which would help Y to achieve its financial goals) as well as what they invest in
The switch to a transfer price at marginal cost would also appear to be a sensible move. It enables both divisions to see benefits from inter-divisional trading and allows more accurate performance measurement, improving motivation.
PAPER E3 : ENTERPRISE STRATEGY
18 KAPLAN PUBLISHING
The drawbacks of the FD’s suggestions include:
ROI produces a disincentive for the divisions to invest in new assets. By allowing assets to age, the value of PPE will fall, artificially increasing the ROI earned by the division. This could be a problem for both divisions, with a reduction in investment in machinery within the MC division and in the DCS division’s stores. This could lead to reduced quality and damage to Y’s brand.
In addition, a sole focus on return could lead the divisions to look at ways of cutting costs to boost ROI. Cuts in staffing, employee benefits or CSR would boost divisional return but again could damage the organisation’s overall reputation.
ROI allows the divisions to make decisions that lose shareholders money. The target suggested is 14% - but both divisions are currently earning a return significantly above this. If, for example, the DCS division was considering opening a new store with a return of 16%, it would reject this investment as it is below the division’s current ROI of 22.1% - even though it is well above the cost of capital of the company and would therefore increase shareholder wealth. Such decisions would fundamentally go against Y’s overall aim of improving shareholder wealth.
It is worth noting that the 14% target itself is unlikely to be accurate. The ROI is a profit-based measure and therefore setting it at the same level as the company’s cost of capital is unlikely to ensure that the divisions are maximising shareholder wealth. In addition, setting the same targets for the two divisions may also be unfair, given the radically different nature of their operations (manufacturing and corporate sales versus high-street and online sales).
There is a question over whether the divisions should be given increased autonomy. Y is determined to protect its brand, as can be seen from its mission and objectives. The Board of Directors is already unhappy with some of the decisions made by the divisions – giving them more autonomy will make it much more difficult for the Board of Y to exert control over their operations and adopt a coherent strategy across Y’s markets.
Finally, it could be argued that the transfer prices should not be included within the calculation as they are not controllable by either division – the transfer rates are imposed by management. The ROI should only be calculated based on controllable income and costs. This would have a dramatic effect on the ROI earned by each division, with the MC division actually showing a loss in the year.
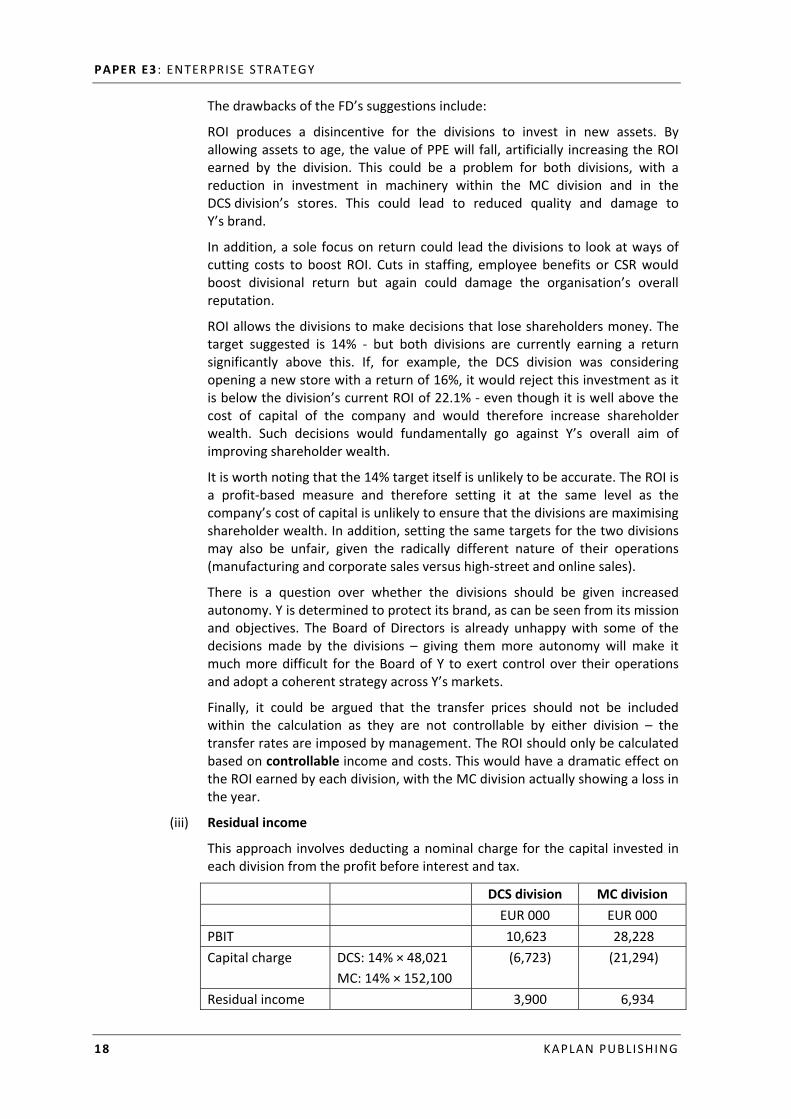
(iii) Residual income
This approach involves deducting a nominal charge for the capital invested in each division from the profit before interest and tax.
DCS division MC division EUR 000 EUR 000 PBIT 10,623 28,228 Capital charge DCS: 14% × 48,021
MC: 14% × 152,100 (6,723) (21,294)
Residual income 3,900 6,934
ANSWERS : SECTION 3
KAPLAN PUBLISHING 19
The residual income approach has one major advantage over the ROI, which is that it forces each division to make congruent decisions. In other words, it ensures that each division accepts any investment that maximises investor wealth. For the DCS and MC divisions, they will wish to accept any investment (i.e. in new machinery or new stores) that earns above a 14% return as this will boost their residual income and therefore their bonuses.
Given Y’s ongoing re-investment into the business in previous years, this is likely to help ensure that Y’s divisions work towards boosting shareholder wealth – a key objective of the company.
Unfortunately, RI has many of the disadvantages of ROI – including a disincentive to reinvest, an excessive focus on profitability and the potential need to remove the transfer prices from the calculation.
In addition, the RI cannot be used to compare divisions of different sizes. The MC division has a larger absolute residual income – in part at least because it is a larger division. This can make the creation of a fair performance appraisal system difficult.
Overall, while it has a number of issues, the RI may be the better option for Y as it will help control the decisions made by the divisions if they are given complete autonomy over their investment decisions.
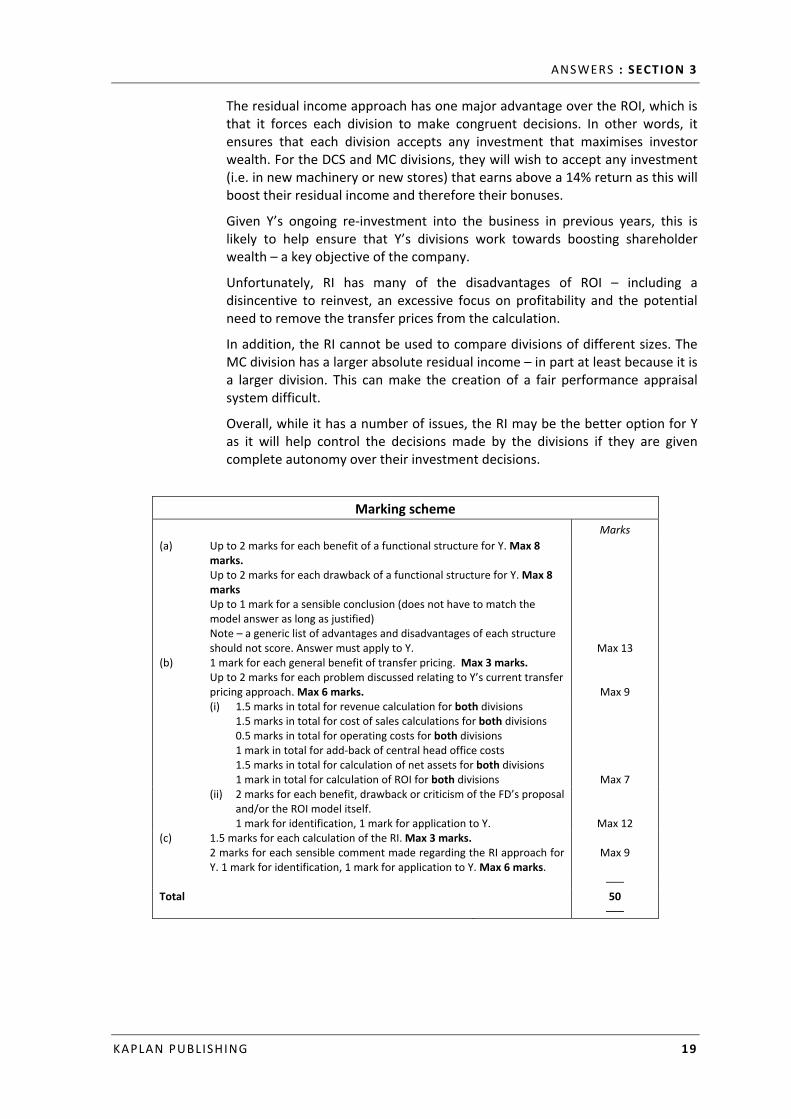
Marking scheme Marks (a) Up to 2 marks for each benefit of a functional structure for Y. Max 8
marks. Up to 2 marks for each drawback of a functional structure for Y. Max 8 marks Up to 1 mark for a sensible conclusion (does not have to match the model answer as long as justified) Note – a generic list of advantages and disadvantages of each structure should not score. Answer must apply to Y.
Max 13 (b) 1 mark for each general benefit of transfer pricing. Max 3 marks.
Up to 2 marks for each problem discussed relating to Y’s current transfer pricing approach. Max 6 marks.
Max 9 (i) 1.5 marks in total for revenue calculation for both divisions
1.5 marks in total for cost of sales calculations for both divisions 0.5 marks in total for operating costs for both divisions 1 mark in total for add-back of central head office costs 1.5 marks in total for calculation of net assets for both divisions 1 mark in total for calculation of ROI for both divisions
Max 7 (ii) 2 marks for each benefit, drawback or criticism of the FD’s proposal
and/or the ROI model itself. 1 mark for identification, 1 mark for application to Y.
Max 12 (c) 1.5 marks for each calculation of the RI. Max 3 marks.
2 marks for each sensible comment made regarding the RI approach for Y. 1 mark for identification, 1 mark for application to Y. Max 6 marks.
Max 9
––– Total 50
–––
PAPER E3 : ENTERPRISE STRATEGY
20 KAPLAN PUBLISHING
2 (a) Performance analysis
Y’s overall performance can be examined from three main perspectives – profitability, gearing and liquidity.
Profitability
This appears to a significant cause for concern for Y.
Sales have actually risen by 1% to EUR 251,081k. As the size of Y’s market has risen by 5%, this suggests relatively poor performance by Y in the year. This could be caused by a number of factors, including:
• The increasing reliance on sales through large retailers and supermarkets (including own-brand). These customers will buy in bulk and are likely to have enough power to drive down the prices that Y can charge.
• Demotivation of employees – staff seem to feel that they cannot improve sales thanks to the actions of management in selling through a variety of competing channels. This may have led to a ‘why bother’ attitude amongst workers.
• Closure of a number of stores in the final quarter of the year could lead to a reduction in the amount of revenue, especially given the high level of sales made in the last quarter of the year.
• The lack of investment during the year may also be a factor in poor sales. The company typically reinvests much of its profits in the company. This has not happened in the year – possibly due to the desire to pay a large dividend to investors.
As well as the slow growth in sales, the gross margin has also declined from 48.3% in 2013 to 45.5% in 2014. This is likely driven in part by the additional sales to powerful retailers and supermarkets, but another factor is likely to be the rise in raw material prices. Y currently offers its suppliers a ‘fair deal’ meaning that it ensures farmers have sufficient money to live on. Given the high rates of inflation in the countries that these farmers live in, the price of sugar and cocoa is likely to have risen sharply. This will put downward pressure on Y’s margins.
It is worth noting that the operating profits of the company have also fallen due to the rise in operating expenses by 4.7% between the two years. This is surprising given the small rise in sales of just 1%, along with the closure of a number of stores in the fourth quarter of 2014. However, this may be explained by one-off store closure costs, as well as the additional costs incurred maintaining relationships with Y’s larger customers. It is worth noting that Y is unlikely to have seen the full cost reduction benefits of store closures as it has decided to (apparently unnecessarily) redeploy these staff members elsewhere in the business.
Y’s return on capital employed (ROCE) has dropped significantly from 14.8% in 2013 to 9.4% in 2014. This is partly due to the falling margins (outlined above) and partly due to a slight rise in capital employed in the period. This is a key investor ratio and its reduction could lead to a number of issues for Y. Shareholders, a group Y is clearly concerned about keeping happy, are likely to be upset with this as it will impact the value of their investment and could be taken as an indication of poor performance. In addition, Y will likely need to refinance some long term liabilities within the next year or so. A fall in ROCE could be seen by debt-holders as increasing the risk of the company and could mean that the loans will be renegotiated on far less favourable terms for the company.
ANSWERS : SECTION 3
KAPLAN PUBLISHING 21
Ultimately, Y’s profitability in the year is disappointing for a number of reasons – in particular their apparent inability to control costs to maintain their margins. This has led to the company breaching its objectives of operating on a sound financial footing as well as its overall aim of improving margins.
Liquidity
Overall, Y’s current ratio has actually improved in the year – up from 2.2 in 2013 to 3.1 in 2014. This shift hides a number of different movements.
Y has a cash balance of over EUR 8m. However, this is down over EUR 4m from its 2013 levels – even with Y’s reduction in investment activity during the period. This is likely to be for a number of reasons.
Firstly, the company is predicting a large dividend payment in the year. This payment of EUR 2m would appear to explain around half of the drop in cash and cash equivalents.
Y’s receivables days appear to have risen. In 2013, Y’s receivables days were around 31.3. This has risen in 2014 to 45.4 days. This may not be unexpected due to the shift away from high street sales towards sales through more powerful large retailers, who will likely have longer payment terms. If this trend continues (and there is no reason to expect that it will not), it will put increasing pressure on Y’s cash flows.
Note that no figure is given for credit sales in either 2013 or 2014. This should be identified to allow proper calculation of the receivables days. For the purposes of the above calculations all sales have been assumed to be on credit. All receivables have been assumed to be trade receivables.
Y has also been paying its creditors more quickly in 2014. Many of Y’s suppliers are classed as ‘vulnerable’ and are therefore paid as quickly as possible by Y during 2014. This has led to a fall in payables days from 96.4 days in 2013 to 72.5 days in 2014. Should this trend continue, it will also place further strain on Y’s cash reserves.
Again – the payables days calculations need more information to be performed accurately. The figures above assume that trade and other payables all relate to trade payables. It also assumes that cost of sales is a good approximation of credit purchases.
Overall, while the current ratio has risen, there are concerns over the fall in cash balances – in particular due to the ongoing need for capital investment in the company, the plans to pay a regular dividend to shareholders and the possible need to meet higher debt repayments in the future.
Gearing
This looks at the levels of debt to equity within the organisation.
Gearing itself (measured as debt / (debt + equity)), based on book values, has not changed significantly in the period, dropping from 55.7% in 2014, down from 57.7% in 2013. The change has occurred largely due to a slight rise in retained profits in the period.
Interest cover, however, has dropped significantly due to the fall in operating profits from 6.0 in 2013 to 4.0 in 2014. This may make it harder for Y to refinance its loans when they fall due as it will appear that it is less able to cover repayments on its debt.
PAPER E3 : ENTERPRISE STRATEGY
22 KAPLAN PUBLISHING
However, without industry comparisons, there seems no real indication that Y is struggling to meet its repayments. It also has a significant level of good quality assets (factory, equipment and retail premises) which it should be able to use as security for any refinancing of its loans.
Overall
The FD has suggested that Y is in ‘some financial distress’. This may not be entirely fair. There is downward pressure on margins which needs to be addressed and in the longer term Y needs to more carefully manage its cash flows as payment terms with its payables, receivables and shareholders changes. However the company is still profitable and solvent and there is no reason to expect that this will not continue.
(b) Corporate social responsibility
Y currently adopts a very active approach to corporate social responsibility, with initiatives relating to employee wellbeing, environmental impact and supplier relationships.
This has a number of advantages, including:
• Motivated employees and a strong working relationship with staff. By offering fair pay and benefits to staff (as well as avoiding redundancies where possible), Y should see excellent staff retention as well as strong performance from employees who are motivated by working for the company.
• In addition, Y may be able to attract better quality staff who like its ethical practices. This may help to improve customer satisfaction – especially in its high street stores.
• Y’s CSR is likely to be a differentiator to customers. The Chairman has stated that it is ‘vital’ to Y’s reputation with customers. This will ensure that individuals and corporate clients continue to want to buy Y’s products, rather than those of its rivals. The fact that Y publicises its ethical initiatives on its website is further proof that this is an area which customers care about.
• Improved treatment of suppliers should help to ensure that Y continues to be able to source good quality raw materials. If it drives down prices too far, its suppliers will either be forced out of business or will move to supplying other confectionary manufacturers.
• The environmental focus (i.e. reducing packaging and electricity usage) will help Y save money on its overheads as well as being good to the environment.
• Acting responsibly with regards to the health of its customers (i.e. with appropriate portion sizes) will help to ensure that the governments of the Eurozone do not feel the need to legislate with regards to Y’s products, which may save Y money in the long-term.
However, Y’s current approach to CSR has a number of drawbacks, including:
• Increased costs – in spite of a strong negotiating position, Y is still paying relatively high prices for its products. This is lowering its margins, potentially meaning it will struggle to meet its financial aim of improving margins. In addition, it is preventing the company from making staff redundant – the company redeploying them internally when this is not necessarily in the organisation’s best interests.
ANSWERS : SECTION 3
KAPLAN PUBLISHING 23
• Management time – deciding on how best to act form a CSR perspective is time consuming. Y is currently experiencing a downturn in its results and CSR discussions could be seen as using up management time that could best be spent on considering how to ensure the future growth of the company.
• Reduced sales – concerns over obesity seem to have led Y to suggest relatively low portion sizes, which may be limiting sales. Placing the responsibility for their health back on the customers could lead to a rise in the organisation’s sales.
The FD’s suggestion that the company should reduce its expenditure on CSR is therefore a decision that needs to be taken with care. The reduction in CSR could lead to short term cost reductions to the organisation, but in the long term could lead to increased legislation, employee problems and a loss of differentiation in the market place.
(c) (i) Good quality management information
Having good quality management information could help the Board of Y in relation to their strategic decision-making processes in a number of ways.
More effective strategic planning
Y has a number of strategic objectives, financial aims and corporate social requirements – such as the desire to improve its margins and operate on a sound financial basis, as well as its desire to offer a strong customer experience. It also has to deal with the needs of key stakeholders, such as its shareholders and its employees. Good quality management information will help the Board make the right decisions and make them aware of any problems or issues as they arise.
By having detailed management information about the full year results to 2014 (as well as the predictions for sales beyond this period), the Board will be able to choose the strategies that best enable them to achieve these objectives and assess whether, for example, further store closures are in the company’s best interests.
Increased awareness of the business and its environment
By obtaining full management information, the Board would be able to identify any key issues that may affect their decision about the closure of high-street stores or the FD’s proposals to reduce the amount of money Y devotes to CSR.
For instance, Y needs detailed analysis of the impact that reducing employee benefits or payments to suppliers will have on these key stakeholders. Will it lead to the loss of key suppliers? Do they have alternative customers that they could go to in the event of a breakdown in their relationship with Y? Answering these questions could seriously impact upon Y’s final decision.
Increased control over business performance
By undertaking a complete analysis of next year’s results, Y is in a stronger position to understand the possible reasons behind its poor performance.
For example, if it discovers that the high-street store results are driving Y’s downturn, the Board may be able to take corrective action by launching new initiatives or attempting to improve staff morale and customer service levels.
PAPER E3 : ENTERPRISE STRATEGY
24 KAPLAN PUBLISHING
Better decision-making
Better management information would help Y to make the best possible decision about whether to proceed with the various possible options they are facing. It would also enable Y to analyse other options that they do not currently appear to have taken account of – such as the option of converting their underperforming stores into franchises, or expanding into new areas, such as drinks.
(ii) Fundamental ethical principles
If the management accountant fails to disclose her report to the Board, she would be in breach of a number of fundamental ethical principles:
• Integrity – this involves fair dealing and truthfulness. In particular, professional accountants are not to be associated with any misleading or false statements. By failing to include potentially significant information from the report to the directors, the accountant is clearly providing a misleading statement and would be in breach of this principle.
• Objectivity – this means that a professional accountant needs to be free from bias or conflict of interest. The FD has suggested that the management accountant may lose her job (or her promotion prospects) in an attempt to encourage her to leave out information from the official forecasts. If she accepts this, she has allowed her personal interest to override her professional duty.
• Professional competence – professional accountants must carry out their work with adequate knowledge and skill. The management accountant would not be using professional knowledge and skill if she were to produce an incomplete report for the directors.
• Professional behaviour – accountants should not do anything that could bring the profession into disrepute. If the Board or the public became aware that the management accountant had concealed information to preserve her career prospects, it would undermine their belief in the profession as a whole.
Marking scheme Marks (a) Up to 1 mark for each ratio/calculation (1 mark for BOTH years)
Max 10 marks for calculations Up to 2 marks for point of discussion regarding each ratio. Each point MUST be applied to Y. Generic points relating to the ratios should not score. Max 15 marks for discussion points
Max 20 (b) 2 mark per applied benefit and drawback of Y’s current approach to CSR.
Max 8 marks each for benefits and drawbacks. Up to 2 marks for a sensible comment on the FD’s proposals.
Max 16 (c) (i) Up to 2 marks for each benefit of good strategic information – 1
mark for identification, 1 mark for application to Y.
Max 6 (ii) Up to 2 marks per ethical area. One mark for showing
understanding of the principle (i.e. name and explanation) 1 mark for application to the scenario.
Max 8 ––– Total 50
–––
ANSWERS : SECTION 3
KAPLAN PUBLISHING 25
3 (a) (i) Ansoff’s matrix
This model examines whether a new strategy involves offering new or existing products to new or existing markets.
Strategy 1
This involves the creation of a new product range (new packaging, as well as new types of confectionary) which will be tailored to the requirements of corporate clients. While Y would still be making confectionary products, these are new products and will, presumably, require research and development to ensure they stand out from Y’s existing offerings.
The corporate market is one that Y already operates within and would therefore be classified as an existing market. Y has built up detailed information on its corporate customers as well as developing a close relationship with them.
Overall, this would be classified as product development – the sale of new products to existing markets.
Strategy 2
Y is proposing to launch its current range of diabetic products into the US market. While there would be changes made to the product’s packaging, there is no indication that Y is planning to make any significant changes to its diabetic range – which is already established in its European markets.
The US market is one that Y has little familiarity with. While it appears to have a small amount of sales in this area, past attempts to penetrate the market have been expensive failures.
This would suggest that strategy 2 involves market development – the sale of existing products to new markets.
Strategy 3
The final proposal by the Chairman is to launch a new chocolate drink. The scenario specifically states that Y has no experience in offering these products and will require significant initial investment in new machinery. This suggests that this would be classified as a new product.
Y is planning to sell these products to the public through retail chains and local shops, using the Y brand name. As Y is trading on its existing, well-known brand name, it is likely that it is targeting its existing customers, who already purchase Y branded chocolate products. It is also selling through retail chains – many of whom it likely already has experience of trading with. However, selling through local, independent stores may represent a new distribution outlet that Y is not currently used to dealing with.
Overall, however, this is likely to be classified as product development – the sale of new products to existing markets.
Tutorial note
If you have placed the strategy in a different segment of the matrix to the model answer you can still get full marks as long as you have justified your answer.
PAPER E3 : ENTERPRISE STRATEGY
26 KAPLAN PUBLISHING
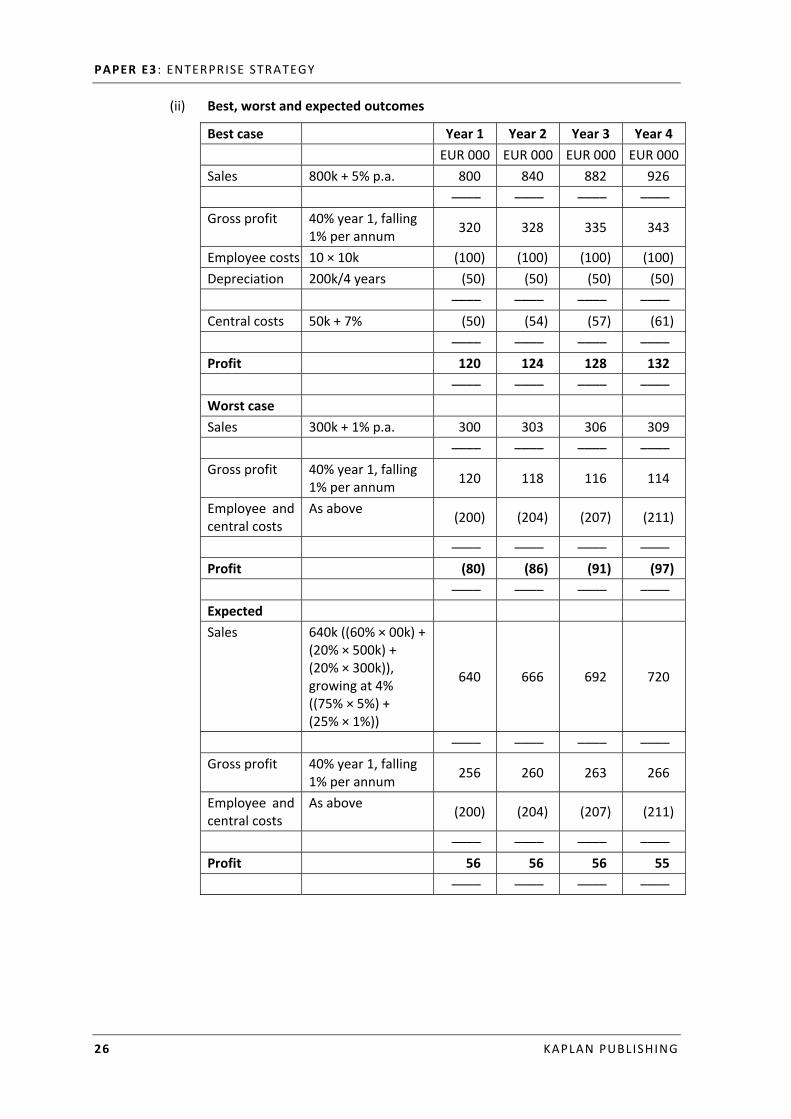
(ii) Best, worst and expected outcomes
Best case Year 1 Year 2 Year 3 Year 4 EUR 000 EUR 000 EUR 000 EUR 000Sales 800k + 5% p.a. 800 840 882 926 –––– –––– –––– –––– Gross profit 40% year 1, falling
1% per annum 320 328 335 343
Employee costs 10 × 10k (100) (100) (100) (100) Depreciation 200k/4 years (50) (50) (50) (50) –––– –––– –––– –––– Central costs 50k + 7% (50) (54) (57) (61) –––– –––– –––– –––– Profit 120 124 128 132 –––– –––– –––– –––– Worst case Sales 300k + 1% p.a. 300 303 306 309 –––– –––– –––– –––– Gross profit 40% year 1, falling
1% per annum 120 118 116 114
Employee and central costs
As above (200) (204) (207) (211)
–––– –––– –––– –––– Profit (80) (86) (91) (97) –––– –––– –––– –––– Expected Sales 640k ((60% × 00k) +
(20% × 500k) + (20% × 300k)), growing at 4% ((75% × 5%) + (25% × 1%))
640 666 692 720
–––– –––– –––– –––– Gross profit 40% year 1, falling
1% per annum 256 260 263 266
Employee and central costs
As above (200) (204) (207) (211)
–––– –––– –––– –––– Profit 56 56 56 55 –––– –––– –––– ––––
ANSWERS : SECTION 3
KAPLAN PUBLISHING 27
Possible concerns over the calculations include: • It is unclear how accurate the probabilities are. The FD has estimated
sales based on past rival sales – these may not be accurate for Y’s entry into the market.
• The probabilities for market growth are also a cause for concern – given the unpredictable nature of the market, assuming that growth will stay constant is likely to be inaccurate.
• The product is likely to last for more than four years, meaning the above analysis is not detailed enough (and issues such as depreciation could make the profit calculations inaccurate).
(iii) Suitability of the three strategies
The management of Y is attempting to decide which of the strategies outlined by the Chairman, if any, should be adopted by the company.
Strategy 1
The plans to create new ranges of chocolate just for the corporate market seem to be consistent with Y’s strategic aims. It helps Y to enhance the corporate customer experience and to deliver products that the customer wants.
In addition, the plan to make the new products even more luxurious than Y’s current range seems to help Y achieve its mission of providing luxurious products and enhancing its brand.
In order to maintain its margins, Y will need to source materials from less sustainable suppliers and will need to increase the amount of packaging on its products. Both of these go against its corporate social responsibility aims of minimising damage to the environment. This could harm Y’s reputation and, by extension, its brand.
The failure to provide these new, distinct ranges of chocolates to other sales channels (such as retail and stores) could be seen as inconsistent branding – which would also go against Y’s strategic objectives.
It is also worth noting that the strategy of product development is likely to be moderately risky. While Y has an excellent grasp of the needs of its corporate market, the launch of a new product range is always fraught with risk. If Y fails to make a product that corporate clients want, it could waste money and harm the brand.
Strategy 2
The US market appears to be high growth – and potentially lucrative. Given the target is on a niche market that is currently not being satisfied, Y’s diabetic products could perform well in the US.
This would not only help to diversify Y’s geographic portfolio, reducing its risk (which would please Y’s directors), but could help establish Y’s brand name in the US for future product launches.
In addition, the high margins that the diabetic products command will help Y to increase its overall margins – one of the company’s key financial objectives.
It is worth noting that other than the need to change the packaging on its diabetic range, there seems to be little additional investment required in adopting this strategy, reducing the risk of undertaking it.
PAPER E3 : ENTERPRISE STRATEGY
28 KAPLAN PUBLISHING
Market development like this is likely to be moderately risky. Y has a good range of diabetic products which it understands well. However, it has little experience of the US market, which has led to expensive failures in the past. This lack of understanding of the US market increases Y’s chances of failure.
Another area of risk is the potential difficulty in accessing the US distribution outlets. Y needs to sell its products through US supermarkets, who seem to already be tied to US confectionary manufacturers. If Y cannot sell through supermarkets it may struggle to gain a foothold in the US market, unless it is able to find alternative stockists (such as pharmacies).
Strategy 3
This involves product development, just like strategy 1. However, the risks would appear to be higher.
Firstly, the proposed move into chocolate drinks is radically different to anything that Y has experience of offering. This significantly increases the risk of failure – particularly as Y will also be attempting to sell it through local stores that it has no experience in dealing with.
The return earned by the product is extremely uncertain – with annual profits potentially ranging between a profit of EUR 132,000 and a loss of EUR 97,000. The expected profits of around EUR 55,000 over the four year planning period represent a lower margin than Y usually earns (an operating margin of 8.7% in year 1, as opposed to an average operating margin of 12% in Y’s 2013 financial statements) – something that goes against its financial objectives.
It is worth noting that the new chocolate drinks do not appear to be consistent with Y’s other products. The margins are low and the raw material quality is relatively poor. Neither of these fit with Y’s luxury brand image. The launch of Y’s new drinks range could therefore adversely affect the market’s view of Y’s brand, which could cause problems for Y across all of its markets.
However, the proposal would help Y to widen the number of sales channels it sells through, as well as further helping to deseasonalise its income. The fact that the project expects to offer positive returns would also mean that the company could increase the returns they are able to offer shareholders as a dividend, helping Y meet its financial objectives.
Conclusion
Strategy 1 involves Y moving away from its corporate social responsibility policies, which is likely to devalue the brand in the long-term. There is no evidence that Y will achieve significantly higher margins from the new product and it is therefore probably not suitable.
Strategy 2 has a number of practical problems (such as the availability of distribution channels) but seems to require little outlay, suggesting that Y may as well attempt to break into this new market.
Strategy 3 is expected to be profitable, but does not fit with Y’s market image. Y could consider launching the drinks under a different brand name, but this is likely to have an adverse effect on sales of the new product.
Given the options available, Y would therefore be best adopting strategy 2.
ANSWERS : SECTION 3
KAPLAN PUBLISHING 29
Tutorial note
Students can come to any reasonable conclusion and score credit here, as long as their answer is justified.
(b) (i) Reasons for resistance
There are likely to be a number of reasons that Y is experiencing resistance from its strategic account managers (SAMs). Y needs to deal with this promptly to avoid any negative impacts on its relationship with its corporate customers.
Job factors
Y’s SAMs are likely to be concerned that they will eventually be made unemployed. Their roles are to be deskilled, with the role turning into data processing and management. They may worry that they could be replaced with cheaper labour, or even made redundant and their roles almost completely automated.
The SAMs are also concerned that they are, effectively being demoted. They clearly feel that there is a risk to their pay and conditions, potentially harming their livelihood. This will also cause resistance.
Personal factors
The new system and the way it has been described by the directors of Y may be seen by the SAMs as an implied criticism of their current working methods. The new system will allow the directors to make strategic decisions ‘more quickly and accurately’, suggesting that they are unhappy with the SAMs’ current speed and accuracy.
The new role is likely to be far less interesting than the current one. SAMs currently have a large amount of personal contact with clients, including offering corporate hospitality. This will be replaced with a data entry and management role, which they are unlikely to see as being as varied.
Y’s SAMs are used to having input into the decisions being made by the directors relating to corporate accounts. This is likely to be eliminated, meaning that they will feel significantly less valued in their new roles.
Note that SAMs may also be concerned about using the new system. They may be worried that they lack the required skills to operate the new client IT system and/or may not wish to learn the new skills required.
Social factors
As mentioned before, the loss of contact with their corporate clients will change the SAMs’ social environment and interactions – especially as they have personal friendships with many of the corporate managers that they look after for Y. Loss of this interaction is likely to increase resistance.
Finally, SAMs are used to being consulted about strategy relating to their corporate clients. The fact that the directors have decided to invest in a new IT system that fundamentally changes the way Y interacts with its corporate clients without consulting the SAMs is also likely to have caused a degree of resistance.
PAPER E3 : ENTERPRISE STRATEGY
30 KAPLAN PUBLISHING
(ii) Lewin’s three-stage model of change
Lewin proposed a three-step process of managing change which Y may wish to adopt in order to deal with the resistance from its SAMs.
Unfreezing
This involves convincing employees of the need for change. Within Y, the directors need to convince the SAMs that the new system is desirable – which may be difficult to do given the fundamental shift in the SAM role, as well as the heavy unionisation of the employees.
Y may wish to stress the poor financial results that it is facing in 2014 and the pressure this places on the company to rapidly adapt to corporate needs.
The directors may also wish to calm any fears that employees have about possible redundancy or pay cuts. This is likely to be a major cause of resistance and assuring employees that there is no foundation to these concerns may help reduce resistance. It may even be possible to reassure existing client managers that they can be redeployed elsewhere within the organisation if they dislike the new, reduced SAM role.
Finally, involving SAMs in the design of the new system may help to reduce their resistance. This not only utilises their knowledge of their clients, but also will increase their acceptance of the system as they have had a hand in designing it.
Change
This involves the introduction of the new CRM system by Y’s directors.
At this stage, Y needs to ensure its SAMs are fully trained in how to use the new system, potentially setting up formal training courses with the software development company.
Y also needs to ensure that there is extensive communication with SAMs during this stage. The SAMs need to understand what their new role is and what is expected of them once the CRM system is in place. The role of the SAM is changing significantly and it is vital that this is explained to the appropriate staff members.
Refreezing
This ensures that SAMs do not slip back into old ways of working. It would be easy for a SAM to avoid using the new CRM system and continue traditional face-to-face communication with Y’s clients.
Y therefore needs to create a new set of controls to encourage SAMs to use the new systems. This could involve rewards and bonuses for ensuring that the new system is kept up to date.
Employees who adopt the new system fully could be offered promotions and any such success stories could be made known to other SAMs to encourage them to follow suit.
ANSWERS : SECTION 3
KAPLAN PUBLISHING 31
Marking scheme Marks (a) (i) 3 marks per strategy – 1 mark for justification of new or existing
product, 1 mark for justification of new or existing market and 1 mark for consistent placement on the matrix.
Max 9
(ii) 8 marks for calculations – Best case scenario – 1 mark each for sales, gross profit and central
costs. 0.5 marks each for depreciation and employee costs. Worst case scenario – 1 mark for sales and 0.5 marks for gross
profit. Expected scenario – 2 marks for sales and 0.5 marks for gross
profit. 2 marks for limitations of calculations 1 mark per valid explained point.
Max 10
(iii) Up to 2 marks for each sensible point made and well explained (1 mark for identification only). Max 6 marks per strategy.
Max 2 marks for sensible conclusion.
Max 15 (b) (i) 1 mark for each explained reason for resistance. Max 7 (ii) Three marks per stage of Lewin’s model. 1 mark for explanation of
each stage, 2 marks for application to Y.
Max 9 ––– Total 50
–––

PAPER E3 : ENTERPRISE STRATEGY
32 KAPLAN PUBLISHING