cicer arietinum l.
9
9481 BIOCHEMICAL CHANGES IN RESPONSE TO SALINITY IN CHICKPEA (CICER ARIETINUM L.) DURING EARLY STAGES OF SEEDLING GROWTH M. Arefian, S. Vessal * and A. Bagheri Department of Plant Biotechnology and Breeding, College of Agriculture, Ferdowsi University of Mashhad, Iran * Research Center for Plant Sciences, Ferdowsi University of Mashhad, Iran Corresponding Author E-mail: [email protected] ABSTRACT Salinity is a serious abiotic stress, causing oxidative stress. Various biochemical parameters in chickpea genotypes were considered under varied NaCl concentrations (0, 8 and 12 dS.m -1 (. This experiment was done as factorial arrangement (genotype × salt concentration × time) in a completely randomized design. Samples were collected at 21 and 28-day old seedlings (28-DOS). The results revealed that increasing salt concentration resulted in higher levels for malondialdehyde content; among genotypes, MCC806 with 2.2 and MCC760 with 0.7 had the highest and lowest amount, respectively. Proline and protein contents were significantly higher in MCC544 by 27-fold increase (for proline) and 30% (for protein) relative to control in 28 DAS at 12 dS.m -1 of salt. The leaf soluble carbohydrates also increased significantly in MCC544 and MCC760 compared with the others. The minimum decline of electrolyte leakages (6%) was belonged to MCC760 while MCC806 genotypes showed the highest decrease rate (more than 20%). Total leaf chlorophyll content decreased in all genotypes during the stress. However, morphological damages in MCC544 and MCC760 genotypes were less in 28- DOS at 8 and 12 dS.m -1 NaCl, respectively. Overall, proline and leaf soluble carbohydrates were more consistent with salt tolerance responses of the genotypes, and 2 weeks after stress initiation (28-DOS) could be a critical stage for screening the genotypes. Key words: Chickpea, Proline, Salinity, Total chlorophyll, Total soluble protein. INTRODUCTION Chickpea is the third most important pulse crop in the world in terms of total production which is mostly grown in semi-arid regions such as South Asia, West Asia, North Africa, East Africa, Southern Europe, North and South America, and Australia (Roy et al., 2010). It is cultivated in more than 50 countries with over 11 million hectares, and its total annual world production is around 8.4 million tons (FAOSTAT, 2011). It is cultivated in more than 50 countries with over 11 million hectares, and its total annual world production is around 8.4 million tons (FAOSTAT, 2011). Chickpea is a valuable source of protein, carbohydrate, fiber and many essential vitamins and minerals. Chickpea nitrogen fixation plays an important role in maintenance of the soil fertility, particularly in the arid and low rainfall areas (Roy et al., 2010). It is estimated that around 20% of total land in the world and nearly half of all irrigated land are adversely influenced by salinity stress (Silva and Gerós, 2009). Salinity causes not only physiological dehydration (water stress) in plants, but nutrient ion imbalance (Toker et al., 2007). Under saline conditions, reactive oxygen species (ROS) are commonly generated and accumulated by which oxidative damage occurs in bio-molecules such as lipids and proteins, resulting in cell death later in the process (Molassiotis et al., 2006; Shad et al., 2013). Soil salinity is known as a major inevitable constrain, especially in arid and semi-arid regions of the world where these regions are the main cultivation areas of chickpea (Khan et al., 2013). Despite chickpea sensitivity to salinity, particularly at the early stages of growth and development, there has been a considerable variation observed among various genotypes in which the most susceptible ones fail to grow in just 25 mM NaCl but tolerant genotypes survives up to a maximum of 100 mM NaCl in hydroponics (Flowers et al., 2009). In addition, the higher levels of salt concentrations in the soil due to its accumulation and drying the soil towards the end of the growing season, both lead to 8 to 10% yield losses globally. However, it is suggested that selection of tolerant genotypes would be an appropriate strategy to alleviate the adverse implications of salinity (Flowers et al., 2009). A considerable variation for salinity resistance has been reported among chickpea genotypes in some studies. Serraj et al. (2004) screened 234 chickpea genotypes grown in a Vertisol treated with 80 mM NaCl solution. They reported a 60% reduction in biomass at 40 day after sowing and identified resistant genotypes based on salinity susceptibility index (SSI) and shoot biomass. Similar study was achieved by Kafi et al., (2011) in which resistant genotypes was determined under 8 and 12 dS.m -1 NaCl concentrations 4 weeks after plant The Journal of Animal & Plant Sciences, 24(6): 2014, Page: 1849-1857 ISSN: 1018-7081
Transcript of cicer arietinum l.

Arefian et al., J. Anim. Plant Sci. 24(6):2014
9481
BIOCHEMICAL CHANGES IN RESPONSE TO SALINITY IN CHICKPEA (CICER
ARIETINUM L.) DURING EARLY STAGES OF SEEDLING GROWTH
M. Arefian, S. Vessal* and A. Bagheri
Department of Plant Biotechnology and Breeding, College of Agriculture, Ferdowsi University of Mashhad, Iran *Research Center for Plant Sciences, Ferdowsi University of Mashhad, Iran
Corresponding Author E-mail: [email protected]
ABSTRACT
Salinity is a serious abiotic stress, causing oxidative stress. Various biochemical parameters in chickpea genotypes were
considered under varied NaCl concentrations (0, 8 and 12 dS.m-1(. This experiment was done as factorial arrangement
(genotype × salt concentration × time) in a completely randomized design. Samples were collected at 21 and 28-day old
seedlings (28-DOS). The results revealed that increasing salt concentration resulted in higher levels for malondialdehyde
content; among genotypes, MCC806 with 2.2 and MCC760 with 0.7 had the highest and lowest amount, respectively.
Proline and protein contents were significantly higher in MCC544 by 27-fold increase (for proline) and 30% (for protein)
relative to control in 28 DAS at 12 dS.m-1 of salt. The leaf soluble carbohydrates also increased significantly in MCC544
and MCC760 compared with the others. The minimum decline of electrolyte leakages (6%) was belonged to MCC760
while MCC806 genotypes showed the highest decrease rate (more than 20%). Total leaf chlorophyll content decreased in
all genotypes during the stress. However, morphological damages in MCC544 and MCC760 genotypes were less in 28-
DOS at 8 and 12 dS.m-1 NaCl, respectively. Overall, proline and leaf soluble carbohydrates were more consistent with
salt tolerance responses of the genotypes, and 2 weeks after stress initiation (28-DOS) could be a critical stage for
screening the genotypes.
Key words: Chickpea, Proline, Salinity, Total chlorophyll, Total soluble protein.
INTRODUCTION
Chickpea is the third most important pulse crop
in the world in terms of total production which is mostly
grown in semi-arid regions such as South Asia, West
Asia, North Africa, East Africa, Southern Europe, North
and South America, and Australia (Roy et al., 2010). It is
cultivated in more than 50 countries with over 11 million
hectares, and its total annual world production is around
8.4 million tons (FAOSTAT, 2011). It is cultivated in
more than 50 countries with over 11 million hectares, and
its total annual world production is around 8.4 million
tons (FAOSTAT, 2011). Chickpea is a valuable source of
protein, carbohydrate, fiber and many essential vitamins
and minerals. Chickpea nitrogen fixation plays an
important role in maintenance of the soil fertility,
particularly in the arid and low rainfall areas (Roy et al.,
2010).
It is estimated that around 20% of total land in
the world and nearly half of all irrigated land are
adversely influenced by salinity stress (Silva and Gerós,
2009). Salinity causes not only physiological dehydration
(water stress) in plants, but nutrient ion imbalance (Toker
et al., 2007). Under saline conditions, reactive oxygen
species (ROS) are commonly generated and accumulated
by which oxidative damage occurs in bio-molecules such
as lipids and proteins, resulting in cell death later in the
process (Molassiotis et al., 2006; Shad et al., 2013). Soil
salinity is known as a major inevitable constrain,
especially in arid and semi-arid regions of the world
where these regions are the main cultivation areas of
chickpea (Khan et al., 2013).
Despite chickpea sensitivity to salinity,
particularly at the early stages of growth and
development, there has been a considerable variation
observed among various genotypes in which the most
susceptible ones fail to grow in just 25 mM NaCl but
tolerant genotypes survives up to a maximum of 100 mM
NaCl in hydroponics (Flowers et al., 2009). In addition,
the higher levels of salt concentrations in the soil due to
its accumulation and drying the soil towards the end of
the growing season, both lead to 8 to 10% yield losses
globally. However, it is suggested that selection of
tolerant genotypes would be an appropriate strategy to
alleviate the adverse implications of salinity (Flowers et
al., 2009).
A considerable variation for salinity resistance
has been reported among chickpea genotypes in some
studies. Serraj et al. (2004) screened 234 chickpea
genotypes grown in a Vertisol treated with 80 mM NaCl
solution. They reported a 60% reduction in biomass at 40
day after sowing and identified resistant genotypes based
on salinity susceptibility index (SSI) and shoot biomass.
Similar study was achieved by Kafi et al., (2011) in
which resistant genotypes was determined under 8 and 12
dS.m-1 NaCl concentrations 4 weeks after plant
The Journal of Animal & Plant Sciences, 24(6): 2014, Page: 1849-1857 ISSN: 1018-7081

Arefian et al., J. Anim. Plant Sci. 24(6):2014
9481
establishment in hydroponic system through evaluation of
biochemical parameters such as soluble carbohydrates,
proline and photosynthetic pigments.
The current study was aimed to evaluate
chickpea responses to salinity with the following
particular objectives: (i) to compare the chickpea
genotypes in terms of their variation in reaction to varied
concentrations of salt stress (various NaCl levels in the
soil); (ii) to determine the best biochemical parameter (s)
and its reliability as a marker for fast assessment and
screening of the genotypes in reaction to salinity
condition; (iii) to create an optimal physiological
framework for further exploration of salt tolerance
mechanism among contrastive genotypes using molecular
approaches such as proteomics.
MATERIALS AND METHODS
Seeds of chickpea genotypes were provided by
Research Center for Plant Sciences, Ferdowsi University
of Mashhad, Iran. Based on our previous salinity study
(Arefian et al. in press) and others reports (Kafi et al.,
2011) we used MCC544 and MCC760 as tolerant and
MCC361, MCC773and MCC806 as susceptible
genotypes.
Seeds were surface sterilized three times with
3% (w/v) sodium hypochlorite for 1 min, followed by
70% ethanol for 30 s and rinsed with sterile water five
times and germinated in petri dishes for 48 hr, prior to
sowing. Two chickpea seedlings were grown in each pot
with one-liter capacity, filled with a mixture of field soil
and sand (2:1, w/w) and kept in controlled conditions
(25±2°C, 50±5% relative humidity and 16-hr photoperiod
with light intensity of 270 µmol m-2 s-1), and then treated
with salty water after 2 weeks for 14 consecutive days.
The effect of different concentrations of NaCl
(0, 8 and 12 dS.m-1) on various biochemical parameters
were measured among the genotypes as a factorial
experiment in a completely randomized design with 3
replicates in two growth stages of early seedling growth
(21-day old seedlings) and flowering initiation (28-day
old seedlings).
Proline was extracted from 0.2 g leaf tissues
homogenized in 4 ml 3% aqueous sulfosalicylic acid
using the method developed by Bates et al., (1973).
Briefly, after centrifugation at 10000 rpm, 2ml of
supernatant was mixed with 2 ml of ninhydrin and 2 ml
of glacial acetic acid, and then boiled at 100°C for 1 hour.
The reaction mixture was extracted by 4ml toluene and
its absorbance was measured at 590 nm. Final proline
concentration was calculated by the standard curve and
following formula:
Total soluble proteins were determined through
some modifications in Lowry et al., (1951) method. In
brief, 0.1M potassium phosphate buffer was used for
extraction, and then the concentration of the proteins was
calculated by BSA standard curve. The membrane lipid
peroxidation was determined by the method from Heath
and Packer (1968), in terms of malondialdehyde (MDA)
production. Thus, 0.2g fresh leaf tissue was ground in
5ml 0.1% Trichloro acetic acid (TCA) and centrifuged at
10000 rpm. The supernatant was mixed well with 20%
TCA, containing 0.5% thiobarbituric acid in 1:4 (v/v)
ratio, and boiled at 90°C for 30 min. Oxidized MDA was
calculated according to the following formula:
MDA( gFWmol / ) = A532-600/151055.1 Mcm ×b
The total chlorophyll, calculated by adding
chlorophyll a and b with following formula in fresh leaf
samples, was extracted in 80% acetone and estimated by
the method of Lichtenthaler and Buschmann (2001).
The carbohydrates were measured using the
procedure of Dubois et al. (1956). Briefly, dried powder
of 100 mg leaf DW was vortexed with 80% ethanol.
After removing the supernatant along with extra
sediments by adding 5% zinc sulphate and barium
hydroxide 0.3 normal, it was mixed with phenol (2:1
(v/v)) and then with 1.5N H2SO4 (5:1 (v/v)). The
absorbance was read at 490 nm, using spectrophotometer
(OPTIMA, sp-3000 plus) after 45 min.
Membrane stability index (MSI) based on
electrolyte leakage was assayed by estimating the ion
leaching from leaves into distilled water (Premachandra
et al., 1990). The leaves were transferred to 10 mL
distilled water in two sets. The first set was kept at 40°C
for 30 min and then its conductivity (C1) recorded using
a conductivity meter. The second set was kept at 100°C
for 10 min and its conductivity (C2) also recorded and
finally MSI was calculated through (C1/C2) ×100.
Data were subjected to analysis of variance
(ANOVA) and significant differences among means were
calculated by Duncan’s multiple range test (p ≤ 0.05).
The percentage and relative data were normalized by
converting to arc sinus and square root. All calculations
were performed in SAS version 6.12 and jump version
4.0.4 softwares, and the figures plotted by Excel 2013.
RESULTS AND DISCUSSION
In the present study, proline content of leaves
significantly increased (p ≤ 0.05) with the increase of
NaCl concentrations in all genotypes (Fig. 1). This might
contribute to osmotic adjustment under salt stress.
Increased proline level is due to protein breakdown (Evan
Ibrahim, 2012). Once carbohydrate is available in the leaf

Arefian et al., J. Anim. Plant Sci. 24(6):2014
9489
cells or tissues, proline would engage with proteins. If a
portion of the accumulated proline were still present
when carbohydrates in the leaves is depleted by
translocation and respiration processes, then proline
would be synthesized through oxidation along with
normal protein synthesis (Kafi et al., 2011). High salinity
treatment resulted in 27 and 17 fold higher proline
content compared to the control in MCC544 and
MCC760, respectively. At 8 dS.m-1 concentration, the
highest proline level was observed for MCC544 in both
samplings 21 and 28 days with 9 and 20 fold increase;
these values were significantly higher than those of the
other genotypes. It seems that defense response of
MCC760 to the high level of stress (12 dS.m-1) was
stronger than others; so this genotype showed a higher
level of tolerance to salinity at this level. At the highest
NaCl concentration in both samplings, MCC806 showed
significantly the lowest proline accumulation than those
of the other genotypes, especially compared with
MCC544 with 4.7 and 2.9 times less proline in 21-day
old seedlings.
Proline is a particular osmolyte in plants,
increasing rapidly under reduced water levels and assist
the plants to preserve cell turgor (Bidabadi et al., 2012).
This osmolyte is a compatible solute, which can be
considered as protective response in terms of osmotic
adjustment (OA) in abiotic stress condition (Ali et al.,
Mahajan and Tuteja, 2005). The increase of ؛ 2007
proline upon salt stress in tolerant genotypes was
consistent with the findings of other studies (Najaphy et
al., 2010 ؛ Singh, 2004). Based on this parameter,
MCC544 and MCC760 can be considered as tolerant
while MCC806 the most susceptible one. The more delay
in proline accumulation was observed in susceptible
genotypes.
Figure 1: Proline content changes among genotypes under various salinity concentrations in (a) 21 and (b) 28
DAS and (c) Root dry weight to Shoot Dry Weight ratio. Means in columns with at least one letter in
common in the range are not significantly different (p ≤ 0.05).

Arefian et al., J. Anim. Plant Sci. 24(6):2014
9481
ROS are strong oxidizing species that create
oxidative damages to bioactive molecules including lipids
and proteins and these processes finally result in cell
death. MDA, a lipid peroxidation product, has been used
as an appropriate biomarker to evaluate the free radicals
levels in the living cells (Molassiotis et al., 2006). In the
current study, MDA content of all genotypes had a
progressive increase with rising salinity levels over time
(Fig. 2). Among all genotypes, MCC760 showed
relatively less increase in MDA content. At high NaCl
application to 28-day seedlings, the lowest and highest
MDA changes observed for MCC760 and MCC806
genotypes (with 0.7 and 2.2 fold increase as compared to
control treatment), respectively (Fig. 2). The responses of
genotypes were different in 21-day seedlings in which
MCC544 and MCC760 had the lowest increase in MDA
content (1.6 fold) but the highest (2.3 fold increase) for
MCC806 and MCC361 genotypes.
Figure 2: Salinity impact on malondialdehyde (MDA) content of chickpea genotypes, in (a) 21 and (b) 28 DAS.
Means in columns with at least one letter in common in the range are not significantly different (p ≤ 0.05).
The increase in MDA content under salinity and
drought stresses especially in susceptible genotypes was
in agreement with the findings of Bian and Jiang (2009)
in chickpea. Increase in MDA content may reduce the
ability to scavenge oxygen radical species accumulation
which might be an explanation for the higher membrane
damage in leaf tissue (Bandeoğlu et al., 2004). This
possible mechanism is later supported by higher
electrolyte leakage (decrees of membrane stability index)
under salt stress. According to this parameter, it seems
that the older seedlings (28-day) are better stage for
genotypes to be compared.
Salinity has a dual influence in relation to the
protein pattern in the plants. It reduces the total protein
content (Delgado et al., 1993), and also commences the
synthesis of other specific proteins necessary for
tolerating the effect of salinity through engaging ABA
(Chen and Plant, 1999). The pattern of total protein
changes was evident among genotypes studied in reaction
to NaCl treatments (Fig. 3). The impact of higher
concentration of salinity (8 and 12 ds.m-1) was more
prominent on MCC544 and MCC760 genotypes in which
the values significantly raised. In 28-day old seedlings,
MCC760 accumulated not only the highest protein
content (20 mg/gr.DW), but also had the highest increase
(40%) over the control. A slight decrease in protein
content for susceptible genotypes was recorded,
especially in MCC806. Insufficient increase in proline
and protein content of these genotypes may be due to the
degradation of some biomolecules such as enzymes
(Arora et al., 2002). This might be an indication of their
inability to maintain cell turgor under salinity condition
(Ashraf and Tufail, 1995). Overall, significant differences
of leaf total soluble proteins were observed in 28-day old
seedlings. It was also revealed that tolerant genotypes
(such as MCC760) had more proline and protein content
than other susceptible ones. An increase in protein
content upon salt stress has been reported in different
tolerant plant species (Najaphy et al., 2010).

Arefian et al., J. Anim. Plant Sci. 24(6):2014
9481
Figure 3. Effect of NaCl on protein content of genotypes in (a) 21 and (b) 28 DAS. Means in columns with at least
one letter in common in the range are not significantly different (p ≤ 0.05).
Among various organic osmotica, sugars form
up to 50% of the total osmotic potential in glycophytes
plants subjected to saline conditions (Parvaiz and
Satyawati, 2008). The accumulation of carbohydrates
including sugars and starch, facilitating the osmotic
adjustment, has been largely reported in response to
salinity or drought (Mahajan and Tuteja, 2005). The
content of soluble carbohydrates significantly changed
with increasing the salinity level (Fig. 4). The mixed
responses were observed among genotypes. For instance,
tolerant genotypes (MCC760 and MCC544) had the
highest carbohydrates accumulation under higher salinity
level, especially in 21-day old seedlings, so that salt
treatments caused 1.32 and 1.47 fold increase of
carbohydrates content in 28-day old seedlings, and 0.9
and 0.53 in 28-day old seedlings, and 0.9 and 0.6 in 28-
day old seedlings for these two genotypes, respectively.
Salt-induced reduction in soluble carbohydrate content
was seen in susceptible genotypes especially MCC806 at
higher level of stress in 28-day old seedlings.
The soluble carbohydrates accumulation in
tolerant genotypes seems to play an essential role in
conferring tolerance characteristic to salt condition. This
may refer to the better balance between anabolic and
catabolic processes in which susceptible genotypes can
be disturbed to a greater extent. Carbohydrates function
as metabolic signals during stress condition and act a
critical role in osmoprotection, osmotic balance, carbon
preservation, membrane stability and radical scavenging
(Parvaiz and Satyawati, 2008). More significantly, high
differences observed in 28-day old seedlings and this
might be a critical time for comparison in the current
study. Munns (1993) reported that in early exposure of
tolerant wheat genotypes to salt stress, soluble
carbohydrates increased due to converting sucrose to
monosaccharaides. Increase of leaf soluble carbohydrates
of chickpea in reaction to salinity has been reported by
Kafi et al., (2011). One possible reason presented was
reduction or interruption in the transfer of carbohydrates
from shoot to root of the plant to maintain osmotic
balance between cytoplasm and vacuole. As observed in
this study, Ashraf and Tufail (1995) found that although
sugar content increased considerably through increasing
salt level, tolerant lines of sunflower had mostly greater
soluble sugars than the salt sensitive ones. In the similar
context, there are many reports, indicating that the
soluble carbohydrates content increase in response to salt
stress (Meloni et al., 2004).
Figure 4. The average leaf soluble carbohydrates of genotypes in (a) 21 and (b) 28 DAS. Means in columns with at
least one letter in common in the range are not significantly different (p ≤ 0.05).
Arefian et al., J. Anim. Plant Sci. 24(6):2014
9488
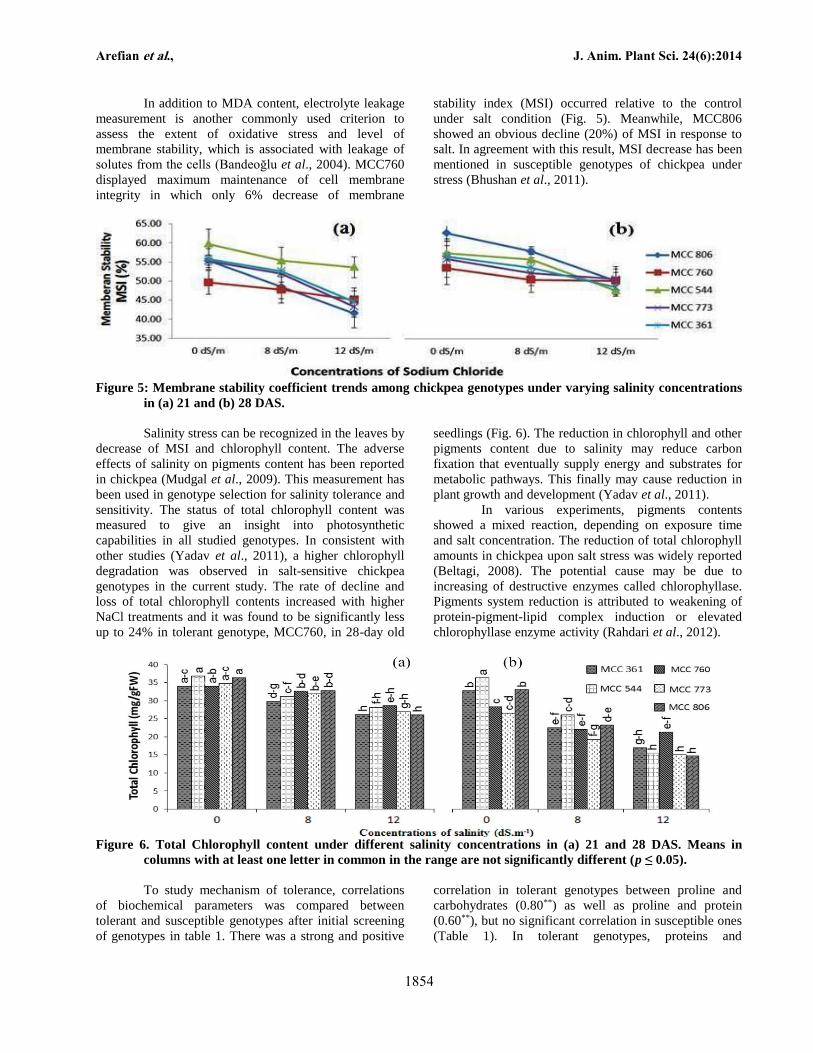
In addition to MDA content, electrolyte leakage
measurement is another commonly used criterion to
assess the extent of oxidative stress and level of
membrane stability, which is associated with leakage of
solutes from the cells (Bandeoğlu et al., 2004). MCC760
displayed maximum maintenance of cell membrane
integrity in which only 6% decrease of membrane
stability index (MSI) occurred relative to the control
under salt condition (Fig. 5). Meanwhile, MCC806
showed an obvious decline (20%) of MSI in response to
salt. In agreement with this result, MSI decrease has been
mentioned in susceptible genotypes of chickpea under
stress (Bhushan et al., 2011).
Figure 5: Membrane stability coefficient trends among chickpea genotypes under varying salinity concentrations
in (a) 21 and (b) 28 DAS.
Salinity stress can be recognized in the leaves by
decrease of MSI and chlorophyll content. The adverse
effects of salinity on pigments content has been reported
in chickpea (Mudgal et al., 2009). This measurement has
been used in genotype selection for salinity tolerance and
sensitivity. The status of total chlorophyll content was
measured to give an insight into photosynthetic
capabilities in all studied genotypes. In consistent with
other studies (Yadav et al., 2011), a higher chlorophyll
degradation was observed in salt-sensitive chickpea
genotypes in the current study. The rate of decline and
loss of total chlorophyll contents increased with higher
NaCl treatments and it was found to be significantly less
up to 24% in tolerant genotype, MCC760, in 28-day old
seedlings (Fig. 6). The reduction in chlorophyll and other
pigments content due to salinity may reduce carbon
fixation that eventually supply energy and substrates for
metabolic pathways. This finally may cause reduction in
plant growth and development (Yadav et al., 2011).
In various experiments, pigments contents
showed a mixed reaction, depending on exposure time
and salt concentration. The reduction of total chlorophyll
amounts in chickpea upon salt stress was widely reported
(Beltagi, 2008). The potential cause may be due to
increasing of destructive enzymes called chlorophyllase.
Pigments system reduction is attributed to weakening of
protein-pigment-lipid complex induction or elevated
chlorophyllase enzyme activity (Rahdari et al., 2012).
Figure 6. Total Chlorophyll content under different salinity concentrations in (a) 21 and 28 DAS. Means in
columns with at least one letter in common in the range are not significantly different (p ≤ 0.05).
To study mechanism of tolerance, correlations
of biochemical parameters was compared between
tolerant and susceptible genotypes after initial screening
of genotypes in table 1. There was a strong and positive
correlation in tolerant genotypes between proline and
carbohydrates (0.80**) as well as proline and protein
(0.60**), but no significant correlation in susceptible ones
(Table 1). In tolerant genotypes, proteins and

Arefian et al., J. Anim. Plant Sci. 24(6):2014
9488
carbohydrates accumulation possibly resulted in
membrane stability (0.26* and 0.61** correlations values),
meanwhile membrane damage in susceptible genotypes
might be due to decrease of necessary proteins and
carbohydrates since the correlation values were negative.
Chlorophyll degradation and MDA accumulation in
leaves of tolerant genotypes might be due to the increase
in root-shoot ratio (0.51** and -0.37**), a proposed
tolerance mechanism (Kalefetoglu Macar et al., 2009 ؛ Mensah et al., 2009). In the current study, carbohydrate
accumulation had a negatively relation with shoot dry
mater (0.23*). This may be due to less photosynthesis rate
(Kafi et al., 2011).
Table 1: Correlation values between each pair of biochemical parameters in tolerant (bold data) and susceptible
(un-bold data) genotypes of chickpea at 28 DAS seedlings under salt stress condition.
1. Proline 2. MDA 3. Protein 4. Carbo 5. MSI 6. Chl 7. Ro/Sh
1. Proline 1 0.63 ** 0.60** 0.80** - 0.21* - 0.58** 0.33*
2. MDA 0.97** 1 0.26* 0.57** - 0.46** - 0.81** 0.51**
3. Protein 0.01 0.001 1 0.61** 0.26* - 0.46** 0.02
4. Carbo 0.07 0.13 0.001 1 - 0.25* - 0.52** 0.23*
5. MSI - 0.29* - 0.34* - 0.14 - 0.09 1 0.52** 0.01
6. Chl - 0.78** - 0.85** 0.001 - 0.29* 0.40** 1 - 0.37**
7. Ro/Sh - 0.13 - 0.07 - 0.23* 0.23* 0.16 0.002 1 *and ** are significant data at 0.05 and 0.01 levels, respectively.
Figure 7: Effects of NaCl stress on 28 DAS of chickpea genotypes under two concentrations (a) 0 dS.m-1, (b) 12 dS.m-1.

Arefian et al., J. Anim. Plant Sci. 24(6):2014
9481
Overall, according to results of this study,
although proline, leaf soluble carbohydrates and total
chlorophyll were introduced as the best biochemical
criteria for screening of chickpea genotypes in response
to NaCl stress, the other parameters studied could be
useful criteria as extra supporting evidence in
determining the tolerance of MCC760 and susceptibility
of MCC806 genotypes. Furthermore, the data showed
that the best time for screening the genotypes seems to be
28-day old seedlings in which the most significant
differences occurred among genotypes based on
biochemical parameter assessments.
REFERENCES
Arefian, M., S. R. Vessal, A. B. Bagheri and A. Ganejali
(2014). Trend of changes for morpho-
physiological characteristics of chickpea (Cicer
arietinum L.) under salinity stress (NaCl)
condition. Iranian J. Pulses Res., In press.
Arora, A., R. Sairam and G. Srivastava (2002). Oxidative
stress and antioxidative system in plants. Curr.
Sci., 82: 1227-1238.
Ashraf, M. and M. Tufail (1995). Variation in salinity
tolerance in sunflower (Helianthus annum L.). J.
Agron. Crop Sci., 174: 351-362.
Bandeoğlu, E., F. Eyidoğan, M. Yücel and H. A. Öktem
(2004). Antioxidant responses of shoots and
roots of lentil to NaCl-salinity stress. Plant
Growth Regul., 42: 69-77.
Bates, L., R. Waldren and I. Teare (1973). Rapid
determination of free proline for water-stress
studies. Plant Soil., 39: 205-207.
Beltagi, M.S., (2008). Exogenous ascorbic acid (vitamin
C) induced anabolic changes for salt tolerance in
chickpea (Cicer arietinum L.). Afr. J. Plant Sci.,
2: 118-123.
Bhushan, D., D. K. Jaiswal, D. Ray, D. Basu, A. Datta, S.
Chakraborty and N. Chakraborty (2011).
Dehydration-responsive reversible and
irreversible changes in the extracellular matrix:
comparative proteomics of chickpea genotypes
with contrasting tolerance. J. Proteome Res., 10:
2027-46.
Bian, S. and Y. Jiang (2009). Reactive oxygen species,
antioxidant enzyme activities and gene
expression patterns in leaves and roots of
Kentucky bluegrass in response to drought stress
and recovery. Sci. Hortic., 120: 264-270.
Bidabadi, S. S., S. Meon, Z. Wahab, S. Subramaniam and
M. Mahmood (2012). In vitro selection and
characterization of water stress tolerant lines
among ethyl methanesulphonate (EMS) induced
variants of banana (Musa spp., with AAA
genome). Aust. J. Crop Sci., 6: 567-575.
Chen, C.C. and A.L. Plant (1999). Salt-induced protein
synthesis in tomato roots: the role of ABA. J.
Exp. Bot., 50: 677-687.
Delgado, M., J. Garrido, F. Ligero and C. Lluch (1993).
Nitrogen fixation and carbon metabolism by
nodules and bacteroids of pea plants under
sodium chloride stress. Physiol. Plant., 89: 824-
829.
Dubois, M., K. A. Gilles, J. K. Hamilton, P. t. Rebers and
F. Smith (1956). Colorimetric method for
determination of sugars and related substances.
Anal. Chem., 28: 350-356.
Evan Ibrahim, A. J., (2012). Effect of water stress on
carbohydrate metabolism during Pisum sativum
Pisum sativum seedlings growth. Euphrates J.
Agric. Sci., 4: 1-12.
Flowers, T.J., P. M. Gaur, C. L. L. Gowda, L.
Krishnamurthy, S. Samineni, K. H. M. Siddique,
N. C. Turner, V. Vadez, R. K. Varshney and T.
D. Colmer (2009). Salt sensitivity in chickpea.
Plant Cell Environ., 33: 490-509.
Heath, R.L. and L. Packer (1968). Photoperoxidation in
isolated chloroplasts: I. Kinetics and
stoichiometry of fatty acid peroxidation. Arch.
Biochem. Biophys. 125(1), 189-198.
Kafi, M., A. Bagheri, J. Nabati, M. Zare Mehrjerdi and
A. Masomi (2011). Effect of salinity on some
physiological variables of 11 chickpea
genotypes under hydroponic conditions. J. Sci.
Technol. Greenhouse Cult., 1: 55-70.
Khan, S., J. Iqbal and M. Saeed (2013). Comparative
study of grain yield and biochemical traits of
different rice varieties grown under saline and
normal conditions. J. Anim. Plant Sci. 23: 575-
588.
Lichtenthaler, H. K. and C. Buschmann (2001).
Chlorophylls and Carotenoids: Measurement
and Characterization by UV‐VIS Spectroscopy.
Curr. Protoc. Food Analyt. Chem. Published
Online.
Lowry, O.H., N. J. Rosebrough, A. L. Farr and R. J.
Randall (1951). Protein measurement with the
Folin phenol reagent. J. Biol. Chem., 193: 265-
275.
Mahajan, S. and N. Tuteja (2005). Cold, salinity and
drought stresses: an overview. Arch. Biochem.
Biophys., 444: 139-158.
Meloni, D.A., M.R. Gulotta, C. A. Martínez and M. A.
Oliva (2004). The effects of salt stress on
growth, nitrate reduction and proline and
glycinebetaine accumulation in Prosopis alba.
Braz. J. Plant Physiol., 16: 39-46.
Molassiotis, A., T. Sotiropoulos, G. Tanou, G.
Diamantidis and I. Therios (2006). Boron-
induced oxidative damage and antioxidant and
nucleolytic responses in shoot tips culture of the

Arefian et al., J. Anim. Plant Sci. 24(6):2014
9481
apple rootstock EM 9 (Malus domestica Borkh).
Environ. Exp. Bot., 56: 54-62.
Mudgal, V., N. Madaan, A. Mudgal and S. Mishra
(2009). Changes in growth and metabolic profile
of Chickpea under salt stress. J. Appl. Biosci.,
23: 1436-1446.
Munns, R. (1993). Physiological processes limiting plant
growth in saline soils: some dogmas and
hypotheses. Plant Cell Environ., 16: 15-24.
Najaphy, A., N. N. Khamssi, A. Mostafaie and H.
Mirzaee (2010). Effect of progressive water
deficit stress on proline accumulation and
protein profiles of leaves in chickpea. Afr. J.
Biotechnol., 9: 7033-7036.
Parvaiz, A. and S. Satyawati (2008). Salt stress and
phyto-biochemical responses of plants-a review.
Plant Soil Environ, 54: 89-99.
Premachandra, G., H. Saneoka and S. Ogata (1990). Cell
membrane stability, an indicator of drought
tolerance, as affected by applied nitrogen in
soybean. J. Agric. Sci., 115: 63-66.
Rahdari, P., S. Tavakoli and S. M. Hosseini (2012).
Studying of salinity stress effect on germination,
proline, sugar, protein, lipid and chlorophyll
content in Purslane (Portulaca oleracea L.)
Leaves. J. Stress Physiol. Biochem., 8: 182-193.
Roy, F., J. Boye and B. Simpson (2010). Bioactive
proteins and peptides in pulse crops: Pea,
chickpea and lentil. Food Res. Int., 43: 432-442.
Shad, M. A., H. Nawaz, T. Rehman and N. Ikram (2013).
Determination of some biochemicals,
phytochemicals and antioxidant properties of
different parts of Cichorium intybus L.: a
comparative study. J. Anim. Plant Sci., 23:
1060-1066.
Silva, P. and H. Gerós (2009). Regulation by salt of
vacuolar H+-ATPase and H+-pyrophosphatase
activities and Na+/H+ exchange. Plant Signal.
Behav, 4: 718-726.
Toker, C., C. Lluch, N. Tejera, R. Serraj and K. Siddique
(2007). Abiotic stresses. In: Chickpea Breeding
and Management (S.S. Yadav, R.J. Redden, W.
Chen and B. Sharma eds). CABI, Oxfordshire,
UK, pp. 474-496.
Yadav, S., M. Irfan, A. Ahmad and S. Hayat (2011).
Causes of salinity and plant manifestations to
salt stress: a review. J. Environ. Biol., 32: 667-
689.