CIBC Investor Presentation Q1 F19 · First Quarter, 2019 Highlights 5 1 Adjusted results are...
27
February 28, 2019 CIBC Investor Presentation Q1 F19
Transcript of CIBC Investor Presentation Q1 F19 · First Quarter, 2019 Highlights 5 1 Adjusted results are...
February 28, 2019
CIBC Investor Presentation
Q1 F19

Forward-Looking Statements2
A NOTE ABOUT FORWARD-LOOKING STATEMENTS: From time to time, we make written or oral forward-looking statements within the meaning of certain securities laws, including in this
report, in other filings with Canadian securities regulators or the SEC and in other communications. All such statements are made pursuant to the “safe harbour” provisions of, and are
intended to be forward-looking statements under applicable Canadian and U.S. securities legislation, including the U.S. Private Securities Litigation Reform Act of 1995. These
statements include, but are not limited to, statements made in the “Overview – Financial results”, “Overview – Significant events”, “Overview – Economic outlook”, “Financial condition
– Capital resources”, “Management of risk – Risk overview”, “Management of risk – Top and emerging risks”, “Management of risk – Credit risk”, “Management of risk – Market risk”,
“Management of risk – Liquidity risk”, “Accounting and control matters – Critical accounting policies and estimates”, “Accounting and control matters – Accounting developments”, and
“Accounting and control matters – Other regulatory developments” sections of this report and other statements about our operations, business lines, financial condition, risk
management, priorities, targets, ongoing objectives, strategies, the regulatory environment in which we operate and outlook for calendar year 2019 and subsequent periods. Forward-
looking statements are typically identified by the words “believe”, “expect”, “anticipate”, “intend”, “estimate”, “forecast”, “target”, “objective” and other similar expressions or
future or conditional verbs such as “will”, “should”, “would” and “could”. By their nature, these statements require us to make assumptions, including the economic assumptions set
out in the “Overview – Economic outlook” section of this report, and are subject to inherent risks and uncertainties that may be general or specific. A variety of factors, many of which
are beyond our control, affect our operations, performance and results, and could cause actual results to differ materially from the expectations expressed in any of our forward-looking
statements. These factors include: credit, market, liquidity, strategic, insurance, operational, reputation and legal, regulatory and environmental risk; the effectiveness and adequacy
of our risk management and valuation models and processes; legislative or regulatory developments in the jurisdictions where we operate, including the Dodd-Frank Wall Street Reform
and Consumer Protection Act and the regulations issued and to be issued thereunder, the Organisation for Economic Co-operation and Development Common Reporting Standard, and
regulatory reforms in the United Kingdom and Europe, the Basel Committee on Banking Supervision’s global standards for capital and liquidity reform, and those relating to bank
recapitalization legislation and the payments system in Canada; amendments to, and interpretations of, risk-based capital guidelines and reporting instructions, and interest rate and
liquidity regulatory guidance; the resolution of legal and regulatory proceedings and related matters; the effect of changes to accounting standards, rules and interpretations; changes
in our estimates of reserves and allowances; changes in tax laws; changes to our credit ratings; political conditions and developments, including changes relating to economic or trade
matters; the possible effect on our business of international conflicts and terrorism; natural disasters, public health emergencies, disruptions to public infrastructure and other
catastrophic events; reliance on third parties to provide components of our business infrastructure; potential disruptions to our information technology systems and services; increasing
cyber security risks which may include theft or disclosure of assets, unauthorized access to sensitive information, or operational disruption; social media risk; losses incurred as a result
of internal or external fraud; anti-money laundering; the accuracy and completeness of information provided to us concerning clients and counterparties; the failure of third parties to
comply with their obligations to us and our affiliates or associates; intensifying competition from established competitors and new entrants in the financial services industry including
through internet and mobile banking; technological change; global capital market activity; changes in monetary and economic policy; currency value and interest rate fluctuations,
including as a result of market and oil price volatility; general business and economic conditions worldwide, as well as in Canada, the U.S. and other countries where we have
operations, including increasing Canadian household debt levels and global credit risks; our success in developing and introducing new products and services, expanding existing
distribution channels, developing new distribution channels and realizing increased revenue from these channels; changes in client spending and saving habits; our ability to attract and
retain key employees and executives; our ability to successfully execute our strategies and complete and integrate acquisitions and joint ventures; the risk that expected synergies and
benefits of an acquisition will not be realized within the expected time frame or at all; and our ability to anticipate and manage the risks associated with these factors. This list is not
exhaustive of the factors that may affect any of our forward-looking statements. These and other factors should be considered carefully and readers should not place undue reliance on
our forward-looking statements. Any forward-looking statements contained in this report represent the views of management only as of the date hereof and are presented for the
purpose of assisting our shareholders and financial analysts in understanding our financial position, objectives and priorities and anticipated financial performance as at and for the
periods ended on the dates presented, and may not be appropriate for other purposes. We do not undertake to update any forward-looking statement that is contained in this report or
in other communications except as required by law.
Investor Relations contacts:
Hratch Panossian, Executive Vice-President 416 956-3317
Investor Relations Fax Number 416 980-5028
Visit the Investor Relations section at www.cibc.com

Victor DodigPresident and Chief Executive Officer
CIBC Overview

Kevin GlassSenior Executive Vice-President and Chief Financial Officer
First Quarter, 2019
Financial Review

First Quarter, 2019 Highlights5
1 Adjusted results are Non-GAAP financial measures. See slide 27 for further details.2 Reported results are on slide 21.
Earnings1
• Operating leverage of 1.3%
• ROE of 16.0%
• Pre-Provision Earnings growth of 8% YoY
Revenue• Double-digit volume growth in Canadian
and U.S. Commercial Banking
• Market volatility impacting results in
Wealth and Capital Markets businesses
Expenses• Expense discipline driving a 70 basis
point improvement in efficiency ratio
YoY
Provision for Credit Losses (PCL)• PCL ratio on impaired loans of 30 bps, up
8 bps YoY and 3 bps QoQ
• Update on economic outlook driving an
increase in PCL on performing loans
Adjusted1 Q1/18 Q4/18 Q1/19
($MM, except for EPS, Efficiency Ratio, ROE, and CET1 Ratio)
Revenue 4,432 4,504 4,552
Non-Interest Expenses 2,529 2,548 2,501
Pre-Provision Earnings 1,903 1,956 2,051
Impaired 202 231 295
Performing (49) 5 43
Provision for Credit Losses 153 236 338
Net Income — Reported2 1,328 1,268 1,182
Net Income — Adjusted1 1,433 1,364 1,363
Diluted EPS — Reported $2.95 $2.80 $2.60
Diluted EPS — Adjusted1 $3.18 $3.00 $3.01
Efficiency Ratio — Adjusted TEB1 55.1% 56.2% 54.4%
ROE — Adjusted1 18.8% 16.4% 16.0%
CET1 Ratio 10.8% 11.4% 11.2%

CET1 Ratio
Capital6
• Strong internal capital generation
Offset by:
• RWA growth
• Regulatory changes
• Air Canada loyalty program
11.4%11.2%
34 bps
(14) bps(36) bps
(8) bps
Q4/18 Earnings net ofDividends
RWAs(excl. FX)
RegulatoryChanges
Air CanadaTransaction
Other Q1/19
7 bps

51.3% 49.9% 50.7%
Q1/18 Q4/18 Q1/19
Efficiency Ratio — Adjusted1
Canadian Personal and Small Business Banking7
1 Adjusted results are Non-GAAP financial measures. See slide 27 for further details.2 Reported results are on slide 21.
• Solid performance driven by volume
growth and strong margins
− NIM up 7 bps YoY
• Continued expense management - 60 bps
improvement in efficiency ratio YoY
• Credit quality stable
− Impaired: PCL ratio of 30 bps, up 2
bps YoY and QoQ
− Performing: up mainly due to
recovery in Q1/18
Results driven by expense discipline and revenue growth
256 258 257167 167 173
235 245 242
Q1/18 Q4/18 Q1/19Loans & Acceptances ($B)
Deposits ($B)
Net Interest Margin (bps)
Loans and Deposits
Adjusted1 Q1/18 Q4/18 Q1/19
($MM)
Revenue 2,138 2,201 2,166
Non-Interest Expenses 1,096 1,098 1,098
Pre-Provision Earnings 1,042 1,103 1,068
Impaired 180 182 192
Performing (32) 9 16
Provision for Credit Losses 148 191 208
Net Income — Reported2 656 668 463
Net Income — Adjusted1 658 669 632

53 58 6045 50 53
Q1/18 Q4/18 Q1/19
Loans & Acceptances ($B) Deposits ($B)
Canadian Commercial Banking and
Wealth Management8
1 Adjusted results are Non-GAAP financial measures. See slide 27 for further details.2 Reported results are on slide 21.3 Comprises loans and acceptances and notional amount of letters of credit.4 Assets under management (AUM) are included in assets under administration (AUA).
3
Volume growth and expense management driving strong performance
Commercial Banking
4 4
Wealth Management
• Continued strong performance in
Commercial Banking driven by volume
growth, wider spreads and higher fee
income
− Loan balances up 13% YoY
− Deposit balances up 16% YoY
• Wealth Management revenue impacted
by market volatility
• Positive operating leverage of 5.6%
• Increase in PCL due to new impairments
Adjusted1 Q1/18 Q4/18 Q1/19
($MM)
Commercial Banking 354 386 413
Wealth Management 600 600 579
Revenue 954 986 992
Non-Interest Expenses 523 520 515
Pre-Provision Earnings 431 466 477
Impaired 4 8 48
Performing (3) (1) (5)
Provision for Credit Losses 1 7 43
Net Income — Reported2 314 333 319
Net Income — Adjusted1 314 334 319
278 269 273
166 165 168
Q1/18 Q4/18 Q1/19
AUA ($B) AUM ($B)
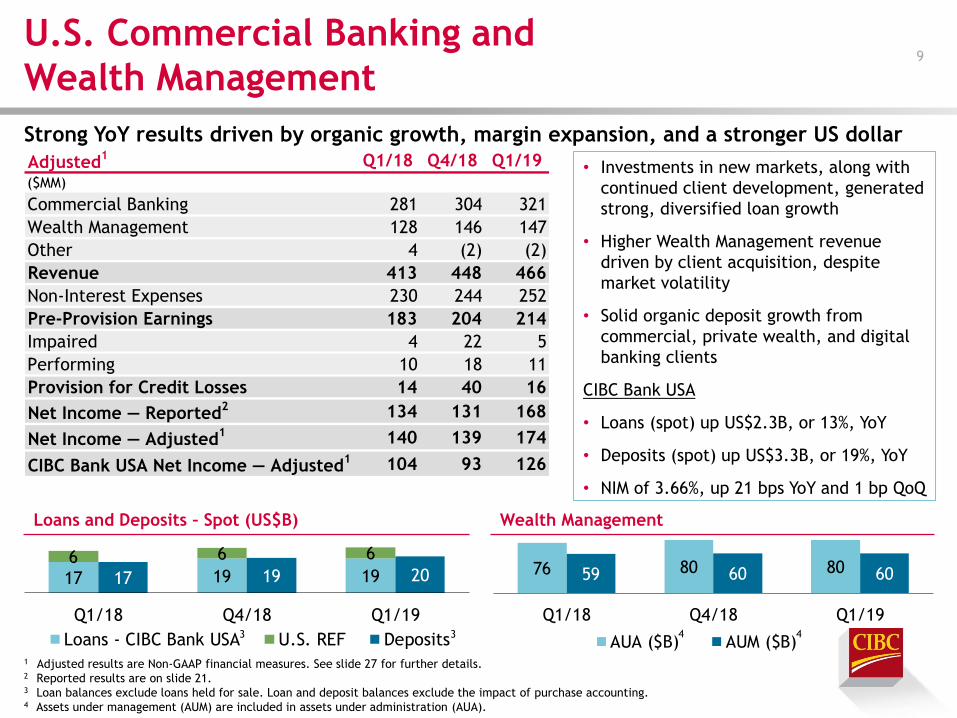
76 80 8059 60 60
Q1/18 Q4/18 Q1/19
AUA ($B) AUM ($B)
Strong YoY results driven by organic growth, margin expansion, and a stronger US dollar
U.S. Commercial Banking and
Wealth Management9
1 Adjusted results are Non-GAAP financial measures. See slide 27 for further details.2 Reported results are on slide 21.3 Loan balances exclude loans held for sale. Loan and deposit balances exclude the impact of purchase accounting.4 Assets under management (AUM) are included in assets under administration (AUA).
• Investments in new markets, along with
continued client development, generated
strong, diversified loan growth
• Higher Wealth Management revenue
driven by client acquisition, despite
market volatility
• Solid organic deposit growth from
commercial, private wealth, and digital
banking clients
CIBC Bank USA
• Loans (spot) up US$2.3B, or 13%, YoY
• Deposits (spot) up US$3.3B, or 19%, YoY
• NIM of 3.66%, up 21 bps YoY and 1 bp QoQ
4 4
Wealth ManagementLoans and Deposits – Spot (US$B)
3 3
17 19 1917 19 206 6 6
Q1/18 Q4/18 Q1/19
Loans - CIBC Bank USA U.S. REF Deposits
Adjusted1 Q1/18 Q4/18 Q1/19
($MM)
Commercial Banking 281 304 321
Wealth Management 128 146 147
Other 4 (2) (2)
Revenue 413 448 466
Non-Interest Expenses 230 244 252
Pre-Provision Earnings 183 204 214
Impaired 4 22 5
Performing 10 18 11
Provision for Credit Losses 14 40 16
Net Income — Reported2 134 131 168
Net Income — Adjusted1 140 139 174
CIBC Bank USA Net Income — Adjusted1 104 93 126

Revenue ($MM)1,2
Capital Markets10
1 Adjusted results are Non-GAAP financial measures. See slide 27 for further details.2 Corporate & Investment Banking now includes the Other line of business.3 Revenue is reported on a taxable equivalent basis (TEB).4 Reported results are on slide 21.
• Strong revenue growth QoQ
− Higher trading revenues, advisory
fees and Corporate Banking revenue
• Lower revenue YoY, primarily from equity
derivatives trading, with good
performance in core businesses
• Continued growth in the U.S., with
revenue growth of 17% YoY
• Increase in PCL due to a new impairment
and an update on economic outlook
Continued focus on delivering diversified earnings
379 341 355
422308 350
Q1/18 Q4/18 Q1/19
Non-Trading Trading
Adjusted1 Q1/18 Q4/18 Q1/19
($MM)
Global Markets 486 371 414
Corporate & Investment Banking2 315 278 291
Revenue3 801 649 705
Non-Interest Expenses 376 356 368
Pre-Provision Earnings 425 293 337
Impaired 2 2 42
Performing (18) (6) 24
Provision for (reversal of) Credit Losses (16) (4) 66
Net Income — Reported4 322 233 201
Net Income — Adjusted1 322 233 201
Corporate and Other11
1 Adjusted results are Non-GAAP financial measures. See slide 27 for further details.2 Revenue is reported on a taxable equivalent basis (TEB).3 Reported results are on slide 21.
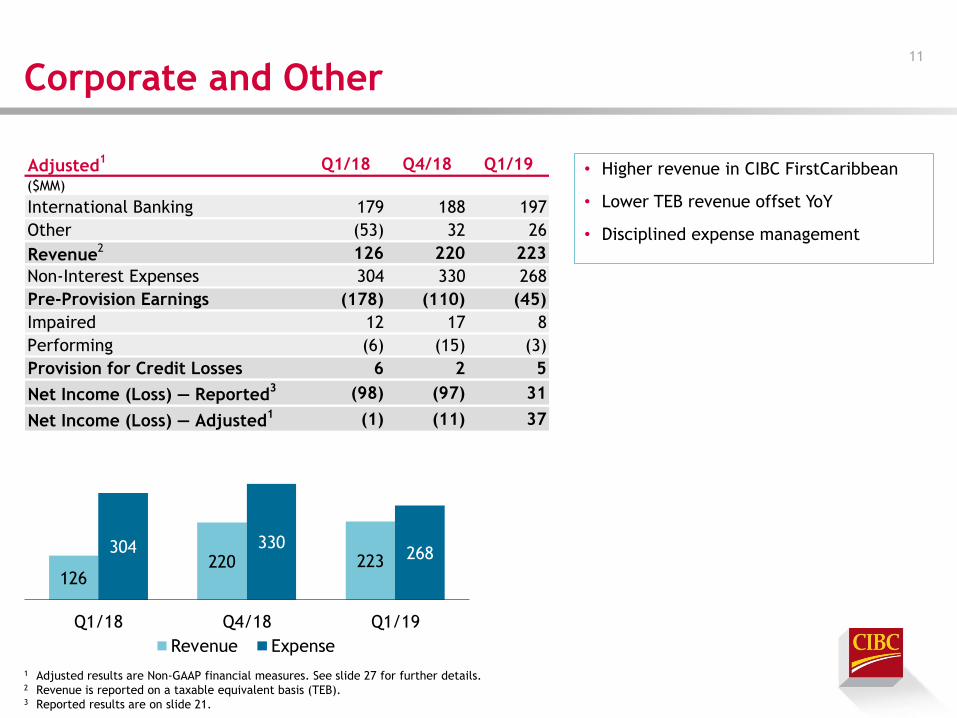
• Higher revenue in CIBC FirstCaribbean
• Lower TEB revenue offset YoY
• Disciplined expense management
126220 223
304 330268
Q1/18 Q4/18 Q1/19
Revenue Expense
Adjusted1 Q1/18 Q4/18 Q1/19
($MM)
International Banking 179 188 197
Other (53) 32 26
Revenue2 126 220 223
Non-Interest Expenses 304 330 268
Pre-Provision Earnings (178) (110) (45)
Impaired 12 17 8
Performing (6) (15) (3)
Provision for Credit Losses 6 2 5
Net Income (Loss) — Reported3 (98) (97) 31
Net Income (Loss) — Adjusted1 (1) (11) 37

Laura Dottori-AttanasioSenior Executive Vice-President and Chief Risk Officer
First Quarter, 2019
Risk Review
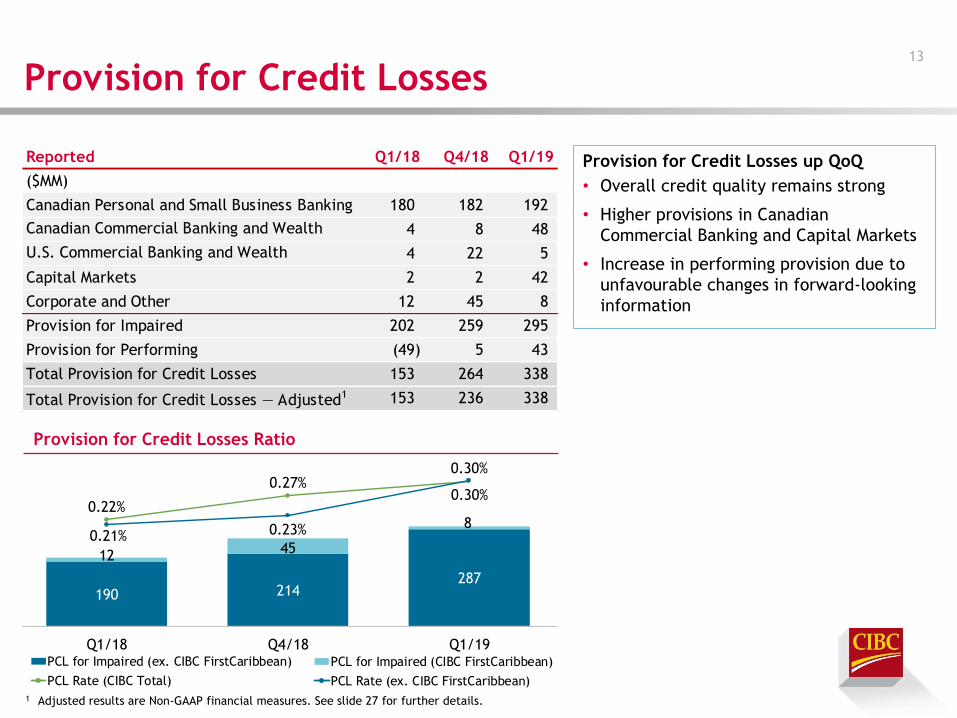
Provision for Credit Losses
1 Adjusted results are Non-GAAP financial measures. See slide 27 for further details.
Reported Q1/18 Q4/18 Q1/19
($MM)
Canadian Personal and Small Business Banking 180 182 192
4 8 48
4 22 5
Capital Markets 2 2 42
Corporate and Other 12 45 8
Provision for Impaired 202 259 295
Provision for Performing (49) 5 43
Total Provision for Credit Losses 153 264 338
Total Provision for Credit Losses — Adjusted1 153 236 338
Canadian Commercial Banking and Wealth
U.S. Commercial Banking and Wealth
Provision for Credit Losses up QoQ
• Overall credit quality remains strong
• Higher provisions in Canadian
Commercial Banking and Capital Markets
• Increase in performing provision due to
unfavourable changes in forward-looking
information
190 214287
1245
8
0.22%
0.27%0.30%
0.21%0.23%
0.30%
0.00%
0.05%
0.10%
0.15%
0.20%
0.25%
0.30%
0.35%
0
50
100
150
200
250
300
350
400
450
500
Q1/18 Q4/18 Q1/19
PCL for Impaired (ex. CIBC FirstCaribbean) PCL for Impaired (CIBC FirstCaribbean)
PCL Rate (CIBC Total) PCL Rate (ex. CIBC FirstCaribbean)
190 214287
1245
8
0.22%
0.27%0.30%
0.21%0.23%
0.30%
0.00%
0.05%
0.10%
0.15%
0.20%
0.25%
0.30%
0.35%
0
50
100
150
200
250
300
350
400
450
500
Q1/18 Q4/18 Q1/19
PCL for Impaired (ex. CIBC FirstCaribbean) PCL for Impaired (CIBC FirstCaribbean)
PCL Rate (CIBC Total) PCL Rate (ex. CIBC FirstCaribbean)
Provision for Credit Losses Ratio
190 214287
1245
80.22%
0.27%0.30%
0.21% 0.23%
0.30%
0.00%
0.05%
0.10%
0.15%
0.20%
0.25%
0.30%
0.35%
0
50
100
150
200
250
300
350
400
450
500
Q1/18 Q4/18 Q1/19
PCL for Impaired (ex. CIBC FirstCaribbean) PCL for Impaired (CIBC FirstCaribbean)
PCL Rate (CIBC Total) PCL Rate (ex. CIBC FirstCaribbean)
13

Credit Quality — Gross Impaired Loans
1 Excludes CIBC Bank USA and CIBC FirstCaribbean business & government loans.
Gross Impaired Loan Ratio
Reported Q1/18 Q4/18 Q1/19
Canadian Residential Mortgages 0.23% 0.24% 0.27%
Canadian Personal Lending 0.30% 0.33% 0.34%
CIBC Business & Government Loans1 0.40% 0.28% 0.56%
CIBC Bank USA 0.66% 0.91% 0.82%
CIBC FirstCaribbean 5.54% 4.56% 4.54%
Total excluding CIBC FirstCaribbean 0.29% 0.30% 0.38%
Total 0.40% 0.39% 0.46%
Gross Impaired Loans up QoQ
• Higher gross impaired loans in:
- Canadian residential mortgages
- Business and government due to new
impairments
1,059 1,113 1,428
415 367
366
0.29% 0.30% 0.38%
5.54% 4.56% 4.54%
-30.00%
-25.00%
-20.00%
-15.00%
-10.00%
-5.00%
0.00%
5.00%
10.00%
-
500
1,000
1,500
2,000
2,500
3,000
Q1/18 Q4/18 Q1/19
GIL (ex. CIBC FirstCaribbean) GIL (CIBC FirstCaribbean)
GIL Ratio (ex. CIBC FirstCaribbean) GIL Ratio (CIBC FirstCaribbean)
1,059 1,113 1,429
415 367
365
0.29% 0.30% 0.38%
5.54% 4.56% 4.54%
-30.00%
-25.00%
-20.00%
-15.00%
-10.00%
-5.00%
0.00%
5.00%
10.00%
-
500
1,000
1,500
2,000
2,500
3,000
Q1/18 Q4/18 Q1/19
GIL (ex. CIBC FirstCaribbean) GIL (CIBC FirstCaribbean)
GIL Ratio (ex. CIBC FirstCaribbean) GIL Ratio (CIBC FirstCaribbean)
14

Credit Quality — Canadian Consumer
Net Write-offs
Net Write-offs were stable QoQ and YoY
Net Write-off Ratio
Reported Q1/18 Q4/18 Q1/19
Canadian Residential Mortgages 0.01% 0.01% 0.01%
Canadian Credit Cards 2.99% 3.05% 3.02%
Canadian Personal Lending 0.72% 0.79% 0.76%
Total 0.26% 0.28% 0.27%
170 179 177
0.26% 0.28% 0.27%
-16.00%
-11.00%
-6.00%
-1.00%
4.00%
-
50
100
150
200
250
300
350
400
Q1/18 Q4/18 Q1/19
Net Write-offs Net Write-off Ratio
170 179 177
0.26% 0.28% 0.27%
-16.00%
-11.00%
-6.00%
-1.00%
4.00%
-
50
100
150
200
250
300
350
400
Q1/18 Q4/18 Q1/19
Net Write-offs Net Write-off Ratio
15
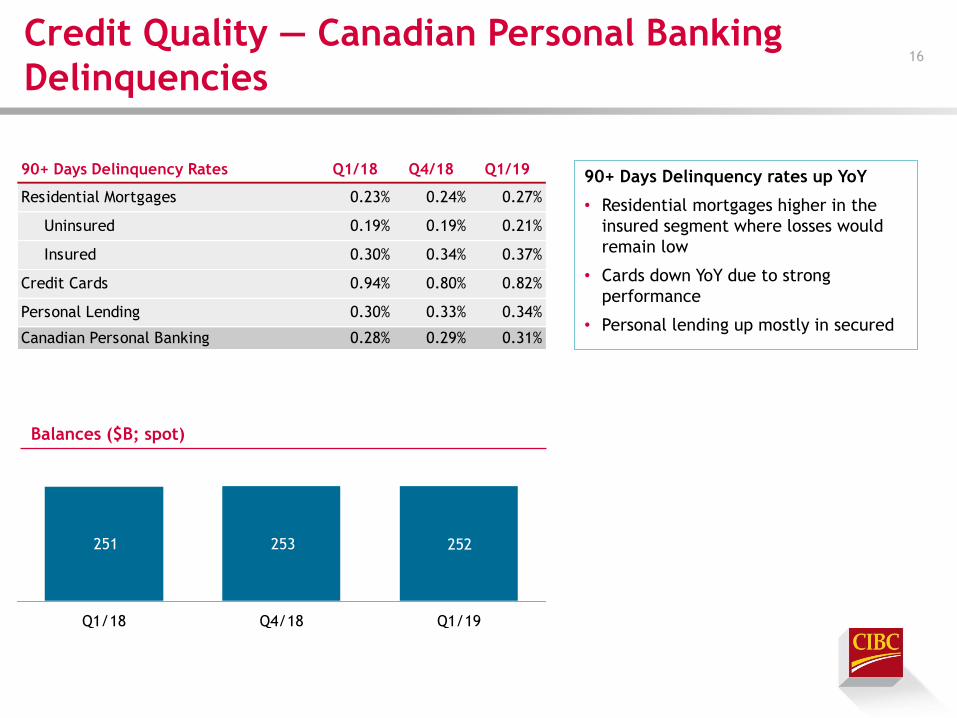
Credit Quality — Canadian Personal Banking
Delinquencies
Balances ($B; spot)
90+ Days Delinquency rates up YoY
• Residential mortgages higher in the
insured segment where losses would
remain low
• Cards down YoY due to strong
performance
• Personal lending up mostly in secured
90+ Days Delinquency Rates Q1/18 Q4/18 Q1/19
Residential Mortgages 0.23% 0.24% 0.27%
Uninsured 0.19% 0.19% 0.21%
Insured 0.30% 0.34% 0.37%
Credit Cards 0.94% 0.80% 0.82%
Personal Lending 0.30% 0.33% 0.34%
Canadian Personal Banking 0.28% 0.29% 0.31%
251 253 252
Q1/18 Q4/18 Q1/19
16

Trading Revenue (TEB)1 Distribution2
1 Non-GAAP financial measure. See slide 27 for further details.2 Trading revenue (TEB) comprises both trading net interest income and non-interest income and excludes
underwriting fees, commissions, certain month-end transfer pricing and other miscellaneous adjustments. Trading
revenue (TEB) excludes certain exited portfolios.
(10)
(5)
0
5
10
15
20
(10)
(5)
0
5
10
15
20
Trading Revenue VaR
($MM) ($MM)
Nov-18 Dec-18 Jan-19
17

Appendix

85.3%86.9%
88.6%
Q1/17 Q1/18 Q1/19
2.0 2.3
2.7
Q1/17 Q1/18 Q1/19
62.4% 64.4% 67.1%
Q1/17 Q1/18 Q1/19
1,105 1,076 1,045
Q1/17 Q1/18 Q1/19
Canadian Personal Banking Digital
Transformation119
Digital Adoption Rate2 Active Mobile Users3 (Millions)
Self-Serve Transactions4 (%)Banking Centres
470 bps 33.5%
-5.4% 330 bps
1 Excludes Simplii Financial.2 Digital Adoption Rate calculated using 90-day active users.3 Active Mobile Users represent the 90-day Active clients in Canadian Personal Banking.4 Reflect financial transactions only.

Canadian Personal and Small Business
Banking Market Share20
1 Market share is calculated using most current data available from OSFI (as at Dec/18), CBA (as at Sep/18), IFIC (as at Jan/19) and CETFA (as at
Jan/19), and is based on 6 banks (CIBC, BMO, BNS, NA, RBC and TD).
Q1/19
Balances
($B)
YoY
Growth
Most Current
Market Share1
Absolute
Rank
YoY Growth
Rank
Money-In
Personal Deposits & GICs 151 3.6% 16.7% 4 4
Canadian Retail Mutual Fund and ETF AUM 102 -1.0% 13.5% 5 4
Small Business Deposits & GICs 23 2.8% 13.7% 4 4
Money-Out
Real Estate Secured Personal Lending 224 -0.2% 18.1% 4 6
Other Personal Lending incl. Cards 30 5.8% 12.5% 4 1
Small Business Lending 3 1.0% 10.2% 5 6
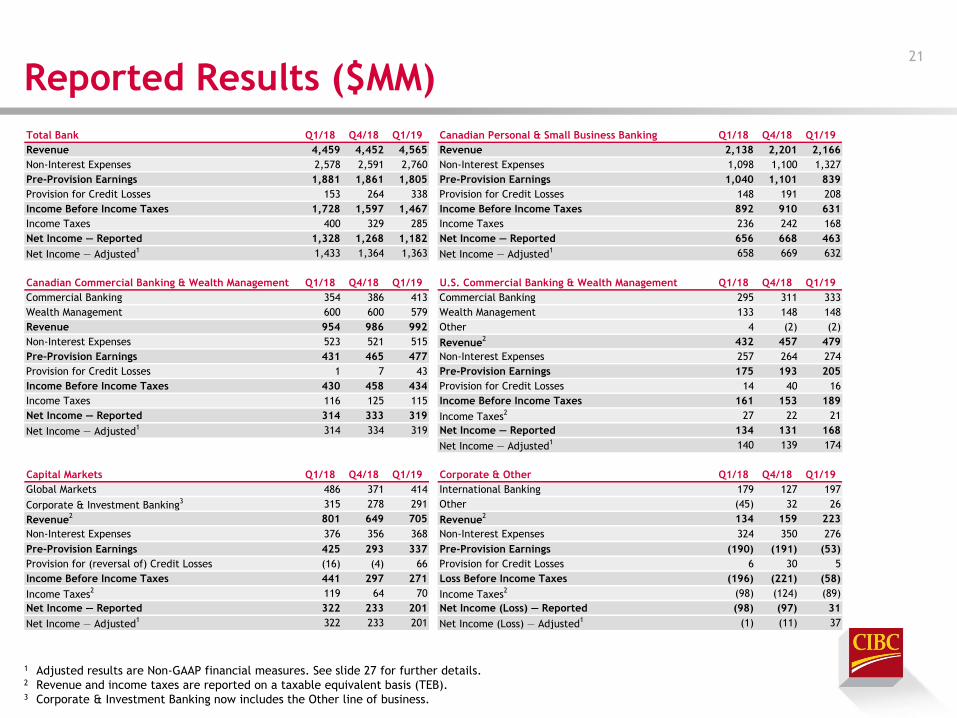
Reported Results ($MM)21
1 Adjusted results are Non-GAAP financial measures. See slide 27 for further details.2 Revenue and income taxes are reported on a taxable equivalent basis (TEB).3 Corporate & Investment Banking now includes the Other line of business.
Total Bank Q1/18 Q4/18 Q1/19 Canadian Personal & Small Business Banking Q1/18 Q4/18 Q1/19
Revenue 4,459 4,452 4,565 Revenue 2,138 2,201 2,166
Non-Interest Expenses 2,578 2,591 2,760 Non-Interest Expenses 1,098 1,100 1,327
Pre-Provision Earnings 1,881 1,861 1,805 Pre-Provision Earnings 1,040 1,101 839
Provision for Credit Losses 153 264 338 Provision for Credit Losses 148 191 208
Income Before Income Taxes 1,728 1,597 1,467 Income Before Income Taxes 892 910 631
Income Taxes 400 329 285 Income Taxes 236 242 168
Net Income — Reported 1,328 1,268 1,182 Net Income — Reported 656 668 463
Net Income — Adjusted1 1,433 1,364 1,363 Net Income — Adjusted
1 658 669 632
Canadian Commercial Banking & Wealth Management Q1/18 Q4/18 Q1/19 U.S. Commercial Banking & Wealth Management Q1/18 Q4/18 Q1/19
Commercial Banking 354 386 413 Commercial Banking 295 311 333
Wealth Management 600 600 579 Wealth Management 133 148 148
Revenue 954 986 992 Other 4 (2) (2)
Non-Interest Expenses 523 521 515 Revenue2 432 457 479
Pre-Provision Earnings 431 465 477 Non-Interest Expenses 257 264 274
Provision for Credit Losses 1 7 43 Pre-Provision Earnings 175 193 205
Income Before Income Taxes 430 458 434 Provision for Credit Losses 14 40 16
Income Taxes 116 125 115 Income Before Income Taxes 161 153 189
Net Income — Reported 314 333 319 Income Taxes2 27 22 21
Net Income — Adjusted1 314 334 319 Net Income — Reported 134 131 168
Net Income — Adjusted1 140 139 174
Capital Markets Q1/18 Q4/18 Q1/19 Corporate & Other Q1/18 Q4/18 Q1/19
Global Markets 486 371 414 International Banking 179 127 197
Corporate & Investment Banking3 315 278 291 Other (45) 32 26
Revenue2 801 649 705 Revenue
2 134 159 223
Non-Interest Expenses 376 356 368 Non-Interest Expenses 324 350 276
Pre-Provision Earnings 425 293 337 Pre-Provision Earnings (190) (191) (53)
Provision for (reversal of) Credit Losses (16) (4) 66 Provision for Credit Losses 6 30 5
Income Before Income Taxes 441 297 271 Loss Before Income Taxes (196) (221) (58)
Income Taxes2 119 64 70 Income Taxes
2 (98) (124) (89)
Net Income — Reported 322 233 201 Net Income (Loss) — Reported (98) (97) 31
Net Income — Adjusted1 322 233 201 Net Income (Loss) — Adjusted
1 (1) (11) 37

Oil & Gas Retail Exposure
1 Comprises mortgages, HELOC, unsecured personal lines and loans, credit cards and small business.2 Alberta, Saskatchewan and Newfoundland and Labrador.3 LTV ratios for residential mortgages are calculated based on weighted average.
• $40.8B of retail exposure1 to oil
provinces2 (or $23.1B excluding insured
mortgages)
− Alberta accounts for $32.3B or 79% of
the retail exposure1
− Average LTV3 of 66% in the uninsured
mortgage portfolio
Retail Exposure1 in Oil Provinces ($B)
Q1/18 Q2/18 Q3/18 Q4/18 Q1/19
Insured Mortgages 69% 70% 70% 70% 71%
Uninsured Mortgages 65% 66% 66% 65% 66%
HELOC 63% 64% 64% 63% 64%
Loan-to-Value (LTV)3
41.3 41.2 41.2 41.1 40.8
Q1/18 Q2/18 Q3/18 Q4/18 Q1/19
Insured
Mortgages
43%
Uninsured Mortgages
35%
HELOC8%
Other14%
22

Canadian Real Estate Secured Personal Lending
Mortgage Balances ($B; spot) HELOC Balances ($B; spot)
1 GVA and GTA definitions based on regional mappings from Teranet.
1 1 1 1
12.3 12.4 12.3
2.7 2.8 2.8
6.6 6.9 6.7
21.6 22.1 21.8
Q1/18 Q4/18 Q1/19
Other Region GVA GTA
• Delinquency rates increased in Q1/19
• The Greater Vancouver Area1 (GVA) and
Greater Toronto Area1 (GTA) continue to
outperform the Canadian average
• Oil provinces remain stable QoQ, but
have increased YoY
112 111 111
28 28 27
63 63 63
203 202 201
Q1/18 Q4/18 Q1/19
Other Region GVA GTA
90+ Days Delinquency Rates Q1/18 Q4/18 Q1/19
Total Mortgages 0.23% 0.24% 0.27%
Uninsured Mortgages 0.19% 0.19% 0.21%
Uninsured Mortgages in GVA1 0.07% 0.06% 0.10%
Uninsured Mortgages in GTA1 0.10% 0.08% 0.13%
Uninsured Mortgages in Oil Provinces 0.48% 0.54% 0.54%
23

Canadian Uninsured Residential Mortgages —
Q1/19 Originations
1 LTV ratios for residential mortgages are calculated based on weighted average. 2 GVA and GTA definitions based on regional mappings from Teranet.
• Originations of $6B in Q1/19
• Average LTV1 in Canada: 64%
− GVA2: 56%
− GTA2: 61%
Beacon Distribution
Loan-to-Value (LTV)1 Distribution
2 2
2 2
6%16%
32% 36%
10%6%15%
30%39%
10%5%
15%
31%39%
10%
≤650 651-700 701-750 751-800 >800
Canada GVA GTA
4% 8%16%
30%42%
7%14%
22%
35%
22%
5%10%
18%
32% 35%
<30% 30 to <45% 45 to <60% 60 to ≤75% >75%
Canada GVA GTA
24

Canadian Uninsured Residential Mortgages
1 LTV ratios for residential mortgages are calculated based on weighted average. See page 23 of the Q1/19 Report to
Shareholders for further details. 2 GVA and GTA definitions based on regional mappings from Teranet.
• Better current Beacon and LTV1
distributions in GVA2 and GTA2 than the
Canadian average
• Less than 1% of this portfolio has a
Beacon score of 650 or lower and an LTV1
over 75%
• Average LTV1 in Canada: 54%
− GVA2: 44%
− GTA2: 51%
Beacon Distribution
Loan-to-Value (LTV)1 Distribution
2 2
2 2
7%14%
27%
39%
13%6%
12%
24%
42%
16%7%
13%
27%
40%
13%
≤650 651-700 701-750 751-800 >800
Canada GVA GTA
9%
23%29% 27%
12%16%
39%30%
12%3%
10%
27%33%
21%
9%
<30% 30 to <45% 45 to <60% 60 to ≤75% >75%
Canada GVA GTA
25
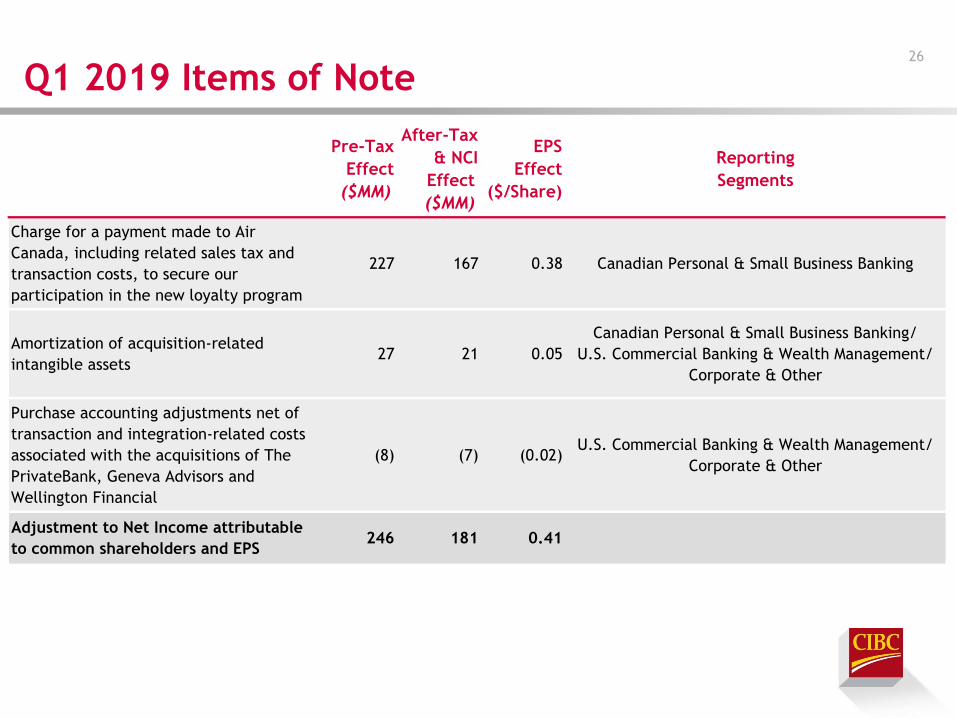
Q1 2019 Items of Note26
Pre-Tax
Effect
($MM)
After-Tax
& NCI
Effect
($MM)
EPS
Effect
($/Share)
Reporting
Segments
Charge for a payment made to Air
Canada, including related sales tax and
transaction costs, to secure our
participation in the new loyalty program
227 167 0.38 Canadian Personal & Small Business Banking
Amortization of acquisition-related
intangible assets27 21 0.05
Canadian Personal & Small Business Banking/
U.S. Commercial Banking & Wealth Management/
Corporate & Other
Purchase accounting adjustments net of
transaction and integration-related costs
associated with the acquisitions of The
PrivateBank, Geneva Advisors and
Wellington Financial
(8) (7) (0.02)U.S. Commercial Banking & Wealth Management/
Corporate & Other
Adjustment to Net Income attributable
to common shareholders and EPS246 181 0.41
Non-GAAP Financial Measures
• Adjusted results are Non-GAAP financial measures that do not have any standardized
meaning prescribed by GAAP and are therefore unlikely to be comparable to similar
measures presented by other issuers.
• For further details on items of note see slide 26 of this presentation; for Non-GAAP
measures and reconciliation of Non-GAAP to GAAP measures see pages 1 and 2 of the
Q1/19 Supplementary Financial Information and pages 14 and 15 of the 2018 Annual
Report available on www.cibc.com.
27