Cia. Hering - 1Q16 Results
10
1Q16 Results Conference Call April 29 th , 2016 – 11:00 am (BrT) 10:00 am (NY)/ 3:00 pm (London)
-
Upload
cia-hering-ri -
Category
Investor Relations
-
view
263 -
download
0
Transcript of Cia. Hering - 1Q16 Results
1Q16 Results Conference Call
April 29th, 2016 – 11:00 am (BrT) 10:00 am (NY)/ 3:00 pm (London)
1Q16 Results
DISCLAIMER
This presentation contains forward-looking statements regarding the
prospects of the business, estimates for operating and financial
results, and those regarding Cia. Hering's growth prospects. These are
merely projections and, as such, are based exclusively on the
expectations of Cia. Hering management concerning the future of the
business and its continued access to capital to fund the Company’s
business Plan. Such forward-looking statements depend, substantially,
on changes in market conditions, government regulations,
competitive pressures, the performance of the Brazilian economy and
the industry, among other factors and risks disclosed in Cia. Hering’s
filed disclosure documents and are, therefore, subject to change
without prior notice.
• Financial Performance
• SAP Implementation
• Outlook
• Q&A
2
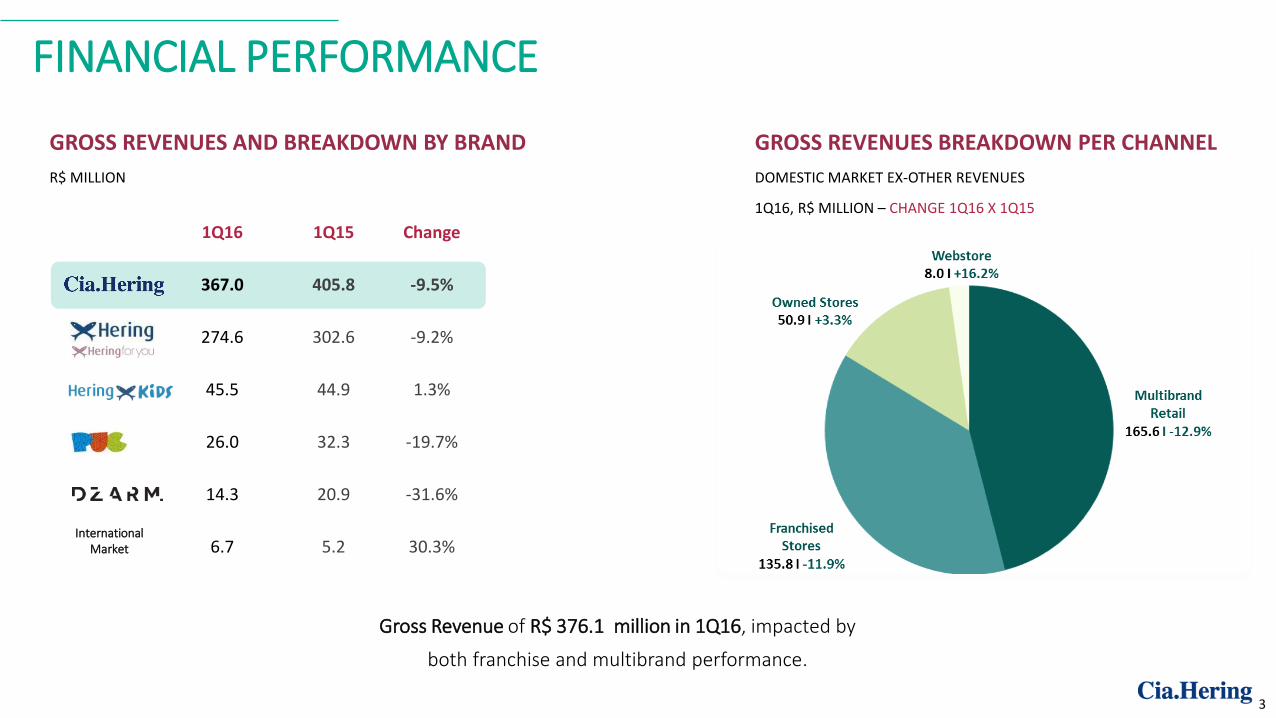
FINANCIAL PERFORMANCE
GROSS REVENUES AND BREAKDOWN BY BRAND
R$ MILLION
1Q16 1Q15 Change
367.0 405.8 -9.5%
274.6 302.6 -9.2%
45.5 44.9 1.3%
26.0 32.3 -19.7%
14.3 20.9 -31.6%
6.7 5.2 30.3% International
Market
GROSS REVENUES BREAKDOWN PER CHANNEL
DOMESTIC MARKET EX-OTHER REVENUES
1Q16, R$ MILLION – CHANGE 1Q16 X 1Q15
Gross Revenue of R$ 376.1 million in 1Q16, impacted by
both franchise and multibrand performance.
3
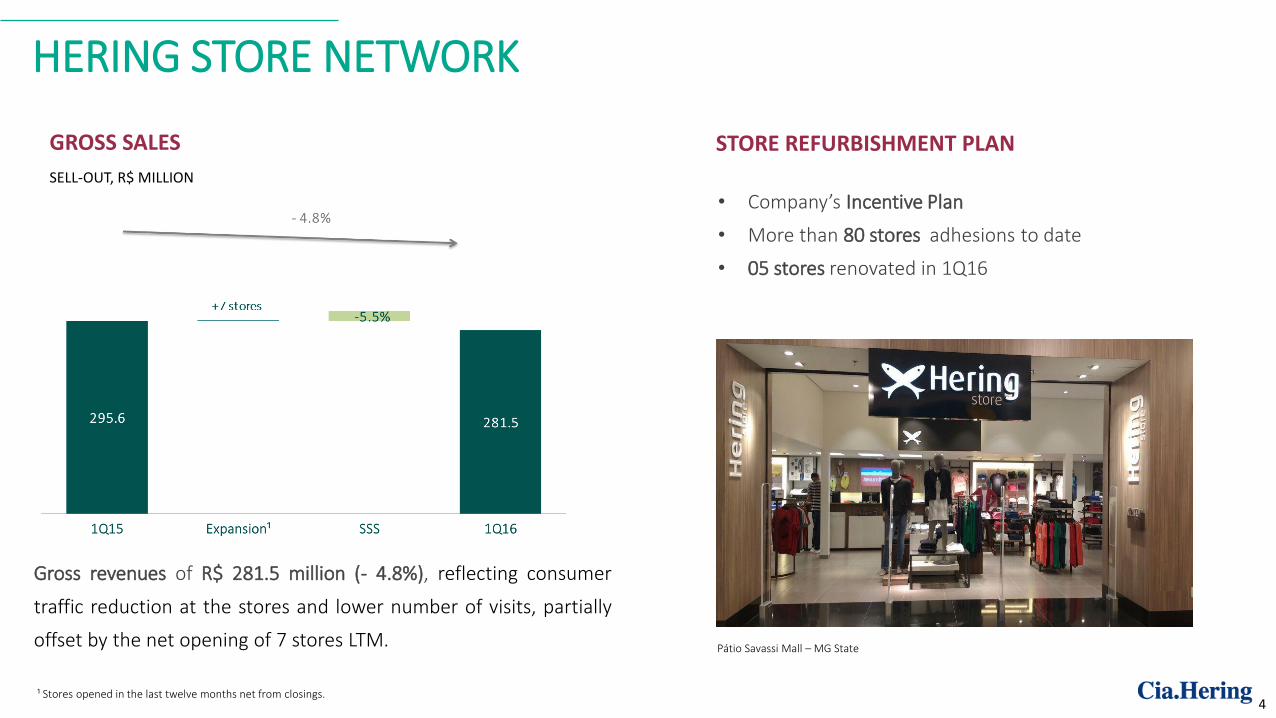
HERING STORE NETWORK
GROSS SALES
SELL-OUT, R$ MILLION
Gross revenues of R$ 281.5 million (- 4.8%), reflecting consumer
traffic reduction at the stores and lower number of visits, partially
offset by the net opening of 7 stores LTM.
¹ Stores opened in the last twelve months net from closings.
STORE REFURBISHMENT PLAN
• Company’s Incentive Plan
• More than 80 stores adhesions to date
• 05 stores renovated in 1Q16
Pátio Savassi Mall – MG State
4

FINANCIAL PERFORMANCE
EBITDA of R$ 36.5 million (-22.6%) explained by
R$ 5.9 million increase in Other Operating Expenses due
mainly to severance payments.
Gross margin improvement (+100 bp) due to lower markdowns.
GROSS PROFIT
R$ MILLION AND GROSS MARGIN
EBITDA
R$ MILLION AND EBITDA MARGIN
5
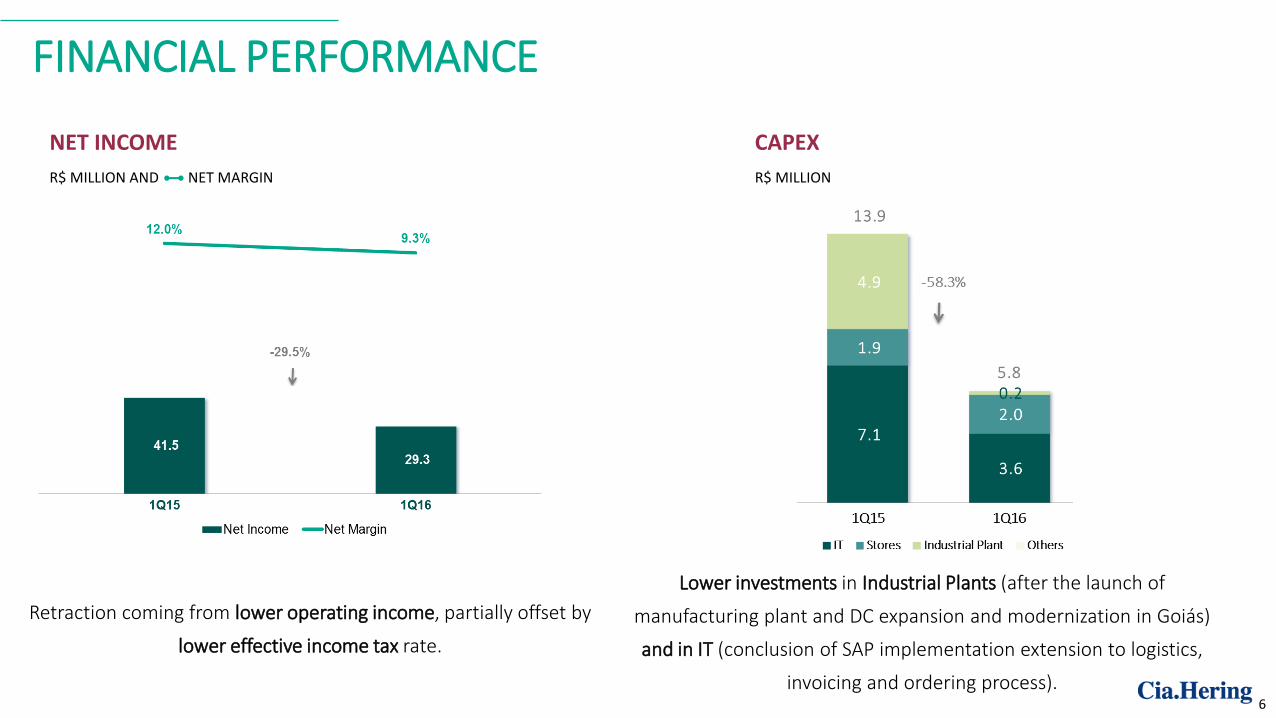
FINANCIAL PERFORMANCE
NET INCOME
R$ MILLION AND NET MARGIN
CAPEX
R$ MILLION
Retraction coming from lower operating income, partially offset by
lower effective income tax rate.
Lower investments in Industrial Plants (after the launch of
manufacturing plant and DC expansion and modernization in Goiás)
and in IT (conclusion of SAP implementation extension to logistics,
invoicing and ordering process). 6

FINANCIAL PERFORMANCE
Cash flow of R$ 101.6 million, R$ 34.2 million higher than 1Q15, due to a
reduce in working capital needs, notably in inventories, and lower investments.
CASH FLOWS
R$ MILLION
Cash Flow - Consolidated 1Q16 1Q15 Chg.
EBITDA 36,491 47 ,141 (10,650)
No cash items 3,612 12,047 (8,435)
AVP (Adjustment to Present Value) - Clients and Suppliers 5,712 4,975 737
Current Income tax and Social Contribution (3,795) (7,638) 3,843
Working Capital Capex 65,448 24 ,917 40 ,531
Decrease in trade accounts receivable 123,202 117,014 6,188
(Increase) in inventories (10,378) (41,342) 30,964
(Decrease) in accounts payable to suppliers (37,329) (22,955) (14,374)
(Decrease) in taxes payable (6,580) (17,352) 10,772
Refurbishment Project 2016 - Franchisee Financing 2,680 - 2,680
Others (6,147) (10,448) 4,301
CapEx (5 ,834) (13 ,959) 8 ,125
Free Cash Flow 101,634 67,483 34 ,151
7

SAP IMPLEMENTATION
Implementation, without disruptions, to logistic, invoicing and ordering process’ areas
‘Go-Live’ with assisted operation during the month
Operation normalization, but still monitored by the project team
Project closure, with operations conducted by the company normally
Jan
Mar
Feb
8
OUTLOOK
• Economic slowdown intensification in the beginning of the year increases uncertainty about sales outlook in 2016
• Execution of strategic initiatives highlighting ‘P&S’ fronts:
• Product: building competitive advantages based on the evolution in Product Lifecycle Management (PLM)
• Store: shopping experience improvement through Store Refurbishment Plan (80+) and improvements in supply process and VM
• Hering for you - business model and distribution strategy review
• The brand will remain as a product line within Hering brand
• Exclusive stores will be discontinued, but brand remais in selected Hering Stores, multibrands and webstore
• Balance sheet and earnings protection: capex reduction, strict costs and expenses control, reduction in collection leftovers
and free cash flow improvement in 2016
9

Fabio Hering – CEO Frederico Oldani – CFO and IRO
Bruno Salem Brasil – IR Manager Caroline Luccarini – IR Analyst
www.ciahering.com.br/ir +55 (11) 3371 – 4867/4805
INVESTOR RELATIONS TEAM