![23!-& 46587 9 ! :=@? · PDF file23!-& 46587 9 ! :=@? a 2cb(!-#d* ... ^p g wshjkz×i fh l`w[ow fhptm"i vtfhi f z]\ ^ j`g jqpr,i v w1lqw]gljkz a pjkm](https://static.fdocuments.net/doc/165x107/5a8771e67f8b9ac96a8dbd23/23-46587-9-46587-9-a-2cb-d-p-g-wshjkzi-fh-lwow-fhptmi.jpg)
CI Number: 46587 - Nova Scotia Power Number:-46587-T856 Metro Voltage Support Add Capacitor Project...
9
CI Number: 46587 Title: Metro Voltage Support - Add Capacitor Bank Start Date: 2015/06 In-Service Date: 2016/12 Final Cost Date: 2017/06 Function: Transmission Forecast Amount: $3,373,511 DESCRIPTION: This work order provides the cost for design, supply, and installation of 50 MVAR capacitor banks, complete with breaker and associated protection, on the 138 kV busses at Sackville (90H) and Lakeside (103H) substations. The purpose of this project is to increase the transfer limit on the Onslow South transmission corridor into the metro Halifax load centre. It will allow oil and natural gas fired generation in Halifax to be incrementally displaced by more economic power from coal plants in Eastern Nova Scotia or from New Brunswick imports. This is the first phase of investment to address transmission system restrictions that limit the uneconomic dispatch of Tuft’s Cove generation. Five additional capital items, listed in Summary of Related CIs, will be submitted in 2016. Summary of Related CIs +/- 2 years: 2016 CI 48025 L7018 Upgrade to 345kV & Capacitor $21,505,112 2016 CI 48022 Spider Lake Substation Addition $6,354,458 2016 CI 48024 90H - Sackville: Capacitor Bank Addition & L-6010/L6005 Breaker Upgrades $3,857,964 2016 CI 48023 103H - Lakeside: Capacitor Bank Additions & L-6003 Breaker Upgrades $3,236,286 2016 CI 48026 L-6033/L6035 CT Ratio Changes at 1H - Water St. $50,516 Depreciation Class: Transmission Equipment - Substation Estimated Life of the Asset: 40 Years JUSTIFICATION: Justification Criteria: Transmission Plant Why do this project? Tuft’s Cove generation in the metro Halifax area supplies reactive power to support steady state voltages during the combination of high transfer levels on the Onslow South transmission corridor and high system load (greater than 1600 MW). This isn’t a concern when the Tuft’s Cove fuel (gas or oil) is comparable to other fuel sources in the system, as these units would be dispatched economically. However, Tuft’s Cove is occasionally required to be dispatched in order to provide reactive power capability in the metro Halifax area. Some of the reactive power is used for steady state voltage support while the rest is counted towards the reactive reserve which is needed for dynamic voltage support (required in the event of a transmission line trip). In this scenario, when gas or oil prices are higher than other fuel sources in the system, the cost of running Tufts Cove is uneconomic. By installing capacitor banks, reactive power requirements to support steady state voltage from Tuft’s Cove generators can be reduced. Additional static reactive power sources will release dynamic reactive power from generators and the Brushy Hill SVC. This additional reactive power can be counted towards reactive power reserve needed during contingency. In this way, higher Onslow South transfer can be achieved with reduced Tuft’s Cove Generation. Another benefit of using capacitor banks over synchronous condensers is that capacitors banks have much lower real power losses. 2016 ACE CI 46587 Page 1 of 9 Date Revised: December 9, 2015 Page 618 of 966 REDACTED
Transcript of CI Number: 46587 - Nova Scotia Power Number:-46587-T856 Metro Voltage Support Add Capacitor Project...
CI Number: 46587 Title: Metro Voltage Support - Add Capacitor Bank Start Date: 2015/06 In-Service Date: 2016/12 Final Cost Date: 2017/06 Function: Transmission Forecast Amount: $3,373,511 DESCRIPTION: This work order provides the cost for design, supply, and installation of 50 MVAR capacitor banks, complete with breaker and associated protection, on the 138 kV busses at Sackville (90H) and Lakeside (103H) substations. The purpose of this project is to increase the transfer limit on the Onslow South transmission corridor into the metro Halifax load centre. It will allow oil and natural gas fired generation in Halifax to be incrementally displaced by more economic power from coal plants in Eastern Nova Scotia or from New Brunswick imports. This is the first phase of investment to address transmission system restrictions that limit the uneconomic dispatch of Tuft’s Cove generation. Five additional capital items, listed in Summary of Related CIs, will be submitted in 2016. Summary of Related CIs +/- 2 years: 2016 CI 48025 L7018 Upgrade to 345kV & Capacitor $21,505,112 2016 CI 48022 Spider Lake Substation Addition $6,354,458 2016 CI 48024 90H - Sackville: Capacitor Bank Addition & L-6010/L6005 Breaker Upgrades $3,857,964 2016 CI 48023 103H - Lakeside: Capacitor Bank Additions & L-6003 Breaker Upgrades $3,236,286 2016 CI 48026 L-6033/L6035 CT Ratio Changes at 1H - Water St. $50,516 Depreciation Class: Transmission Equipment - Substation Estimated Life of the Asset: 40 Years JUSTIFICATION: Justification Criteria: Transmission Plant Why do this project? Tuft’s Cove generation in the metro Halifax area supplies reactive power to support steady state voltages during the combination of high transfer levels on the Onslow South transmission corridor and high system load (greater than 1600 MW). This isn’t a concern when the Tuft’s Cove fuel (gas or oil) is comparable to other fuel sources in the system, as these units would be dispatched economically. However, Tuft’s Cove is occasionally required to be dispatched in order to provide reactive power capability in the metro Halifax area. Some of the reactive power is used for steady state voltage support while the rest is counted towards the reactive reserve which is needed for dynamic voltage support (required in the event of a transmission line trip). In this scenario, when gas or oil prices are higher than other fuel sources in the system, the cost of running Tufts Cove is uneconomic. By installing capacitor banks, reactive power requirements to support steady state voltage from Tuft’s Cove generators can be reduced. Additional static reactive power sources will release dynamic reactive power from generators and the Brushy Hill SVC. This additional reactive power can be counted towards reactive power reserve needed during contingency. In this way, higher Onslow South transfer can be achieved with reduced Tuft’s Cove Generation. Another benefit of using capacitor banks over synchronous condensers is that capacitors banks have much lower real power losses.
2016 ACE CI 46587 Page 1 of 9
Date Revised: December 9, 2015 Page 618 of 966 REDACTED
Why do this project now? System study has shown that, 100 MVAR of reactive power located on the power system south of Onslow substation increases the Onslow South corridor transfer capability by 70-90 MW. A study using the system planning simulation model Plexos has concluded that a reduction in must-run Halifax based generation improves the economics of system dispatch. Why do this project this way? Alternative A “Do Nothing”: This is a status quo option. There is no investment and no benefit. NPV is zero. Alternative B “Install 50MVAR CAP Banks at both Sackville and Lakeside substations”: This is the economic option – the capital investment avoids incremental uneconomic dispatch fuel costs at Tuft’s Cove. Please refer to the corresponding Economic Analysis Model. Using the Plexos model, the optimum size of capacitor bank that would minimize the fuel cost was found to be 100 MVAR. Upgrading to higher than 100 MVAR will not have further significant fuel savings. NS Power transmission planning engineers consider the maximum size of a single capacitor bank in the metro area to be 50 MVAR for all possible operating conditions. Capacitor banks larger than 50 MVAR would change the system voltage significantly causing adverse impact on voltage sensitive customer equipment. More than two capacitor banks smaller than 50 MVAR each and totaling 100 MVAR would increase the capital investment significantly. Hence, it was decided to install two capacitor banks of size 50 MVAR each. Five 138 kV substations in the metro were considered. It was found that Sackville and Lakeside substations can each accommodate a 50 MVAR capacitor bank. Physical space was a concern at other substations considered.
2016 ACE CI 46587 Page 2 of 9
Date Revised: December 9, 2015 Page 619 of 966 REDACTED
: -CI Number 46587-T856 Metro Voltage Support Add Capacitor Project Number T856
Cost Centre
Capital Item Accounts
VarianceForecastAmount AmountAcct Actv Account Activity
: -800 2016 ACE Plan800-Services - Admin. Budget Version
Parent CI Number : -
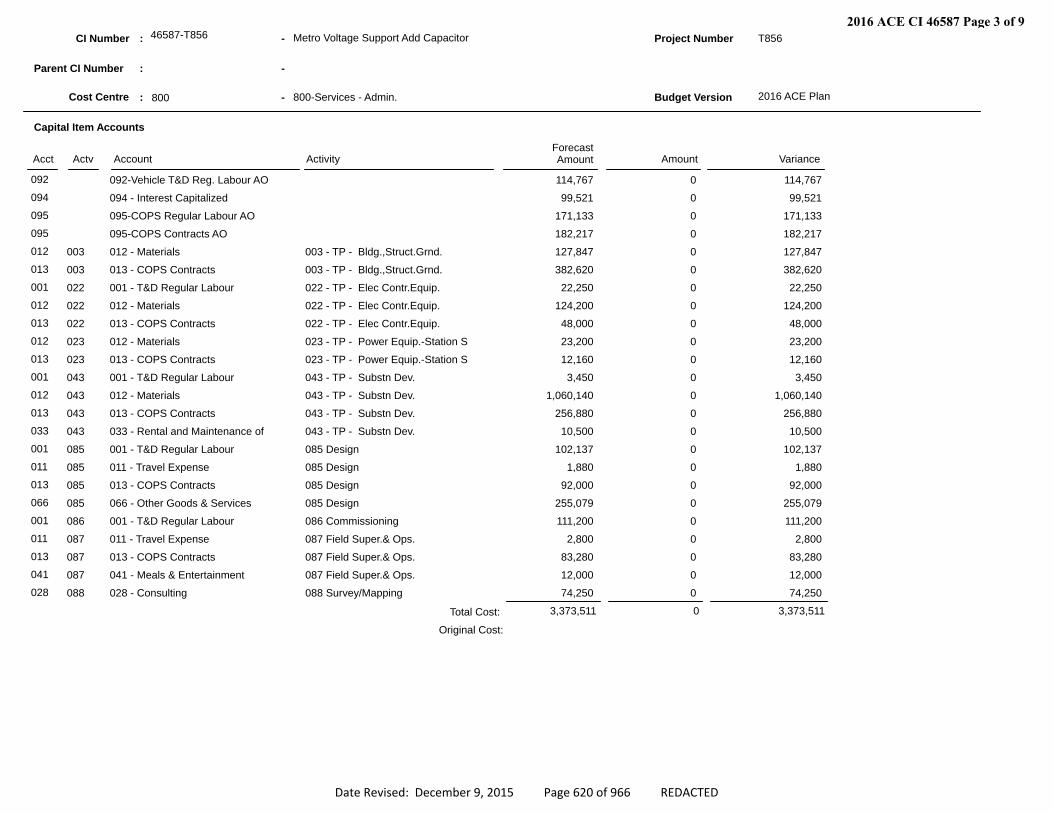
092 092-Vehicle T&D Reg. Labour AO 114,7670114,767094 094 - Interest Capitalized 99,521099,521095 095-COPS Regular Labour AO 171,1330171,133095 095-COPS Contracts AO 182,2170182,217012 003 012 - Materials 003 - TP - Bldg.,Struct.Grnd. 127,8470127,847013 003 013 - COPS Contracts 003 - TP - Bldg.,Struct.Grnd. 382,6200382,620001 022 001 - T&D Regular Labour 022 - TP - Elec Contr.Equip. 22,250022,250012 022 012 - Materials 022 - TP - Elec Contr.Equip. 124,2000124,200013 022 013 - COPS Contracts 022 - TP - Elec Contr.Equip. 48,000048,000012 023 012 - Materials 023 - TP - Power Equip.-Station S 23,200023,200013 023 013 - COPS Contracts 023 - TP - Power Equip.-Station S 12,160012,160001 043 001 - T&D Regular Labour 043 - TP - Substn Dev. 3,45003,450012 043 012 - Materials 043 - TP - Substn Dev. 1,060,14001,060,140013 043 013 - COPS Contracts 043 - TP - Substn Dev. 256,8800256,880033 043 033 - Rental and Maintenance of 043 - TP - Substn Dev. 10,500010,500001 085 001 - T&D Regular Labour 085 Design 102,1370102,137011 085 011 - Travel Expense 085 Design 1,88001,880013 085 013 - COPS Contracts 085 Design 92,000092,000066 085 066 - Other Goods & Services 085 Design 255,0790255,079001 086 001 - T&D Regular Labour 086 Commissioning 111,2000111,200011 087 011 - Travel Expense 087 Field Super.& Ops. 2,80002,800013 087 013 - COPS Contracts 087 Field Super.& Ops. 83,280083,280041 087 041 - Meals & Entertainment 087 Field Super.& Ops. 12,000012,000028 088 028 - Consulting 088 Survey/Mapping 74,250074,250
Total Cost:
Original Cost:
3,373,511 0 3,373,511
2016 ACE CI 46587 Page 3 of 9
Date Revised: December 9, 2015 Page 620 of 966 REDACTED
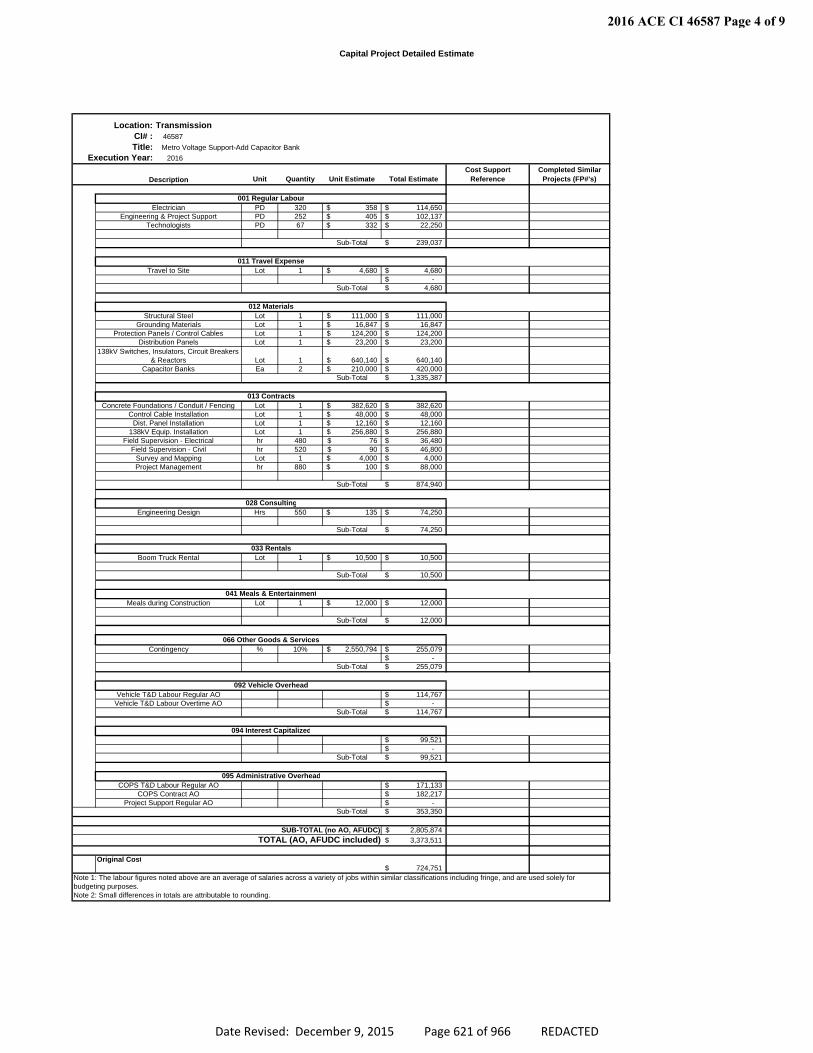
Capital Project Detailed Estimate
46587
Execution Year: 2016
Unit Quantity Unit Estimate Total EstimateCost Support
ReferenceCompleted Similar
Projects (FP#'s)
PD 320 358$ 114,650$ PD 252 405$ 102,137$ PD 67 332$ 22,250$
Sub-Total 239,037$
Lot 1 4,680$ 4,680$ -$
Sub-Total 4,680$
Lot 1 111,000$ 111,000$ Lot 1 16,847$ 16,847$ Lot 1 124,200$ 124,200$ Lot 1 23,200$ 23,200$
Lot 1 640,140$ 640,140$ Ea 2 210,000$ 420,000$
Sub-Total 1,335,387$
Lot 1 382,620$ 382,620$ Lot 1 48,000$ 48,000$ Lot 1 12,160$ 12,160$ Lot 1 256,880$ 256,880$ hr 480 76$ 36,480$ hr 520 90$ 46,800$ Lot 1 4,000$ 4,000$ hr 880 100$ 88,000$
Sub-Total 874,940$
Hrs 550 135$ 74,250$
Sub-Total 74,250$
Lot 1 10,500$ 10,500$
Sub-Total 10,500$
Lot 1 12,000$ 12,000$
Sub-Total 12,000$
% 10% 2,550,794$ 255,079$ -$
Sub-Total 255,079$
114,767$ -$
Sub-Total 114,767$
99,521$ -$
Sub-Total 99,521$
171,133$ 182,217$
-$ Sub-Total 353,350$
2,805,874$ 3,373,511$
Original Cost724,751$
COPS T&D Labour Regular AO
028 Consulting
Field Supervision - Civil
092 Vehicle OverheadVehicle T&D Labour Regular AO
Vehicle T&D Labour Overtime AO
Engineering Design
001 Regular Labour
Description
Electrician
Metro Voltage Support-Add Capacitor Bank
COPS Contract AOProject Support Regular AO
011 Travel ExpenseTravel to Site
095 Administrative Overhead
TOTAL (AO, AFUDC included)SUB-TOTAL (no AO, AFUDC)
Survey and Mapping
Location:CI# :Title:
Grounding Materials
Capacitor Banks
Engineering & Project SupportTechnologists
Note 1: The labour figures noted above are an average of salaries across a variety of jobs within similar classifications including fringe, and are used solely for budgeting purposes. Note 2: Small differences in totals are attributable to rounding.
094 Interest Capitalized
Control Cable Installation
Meals during Construction041 Meals & Entertainment
013 Contracts
138kV Switches, Insulators, Circuit Breakers & Reactors
Field Supervision - Electrical
033 Rentals
Concrete Foundations / Conduit / Fencing
066 Other Goods & Services
Project Management
Boom Truck Rental
Contingency
Protection Panels / Control Cables
Dist. Panel Installation138kV Equip. Installation
Transmission
012 MaterialsStructural Steel
Distribution Panels
2016 ACE CI 46587 Page 4 of 9
Date Revised: December 9, 2015 Page 621 of 966 REDACTED
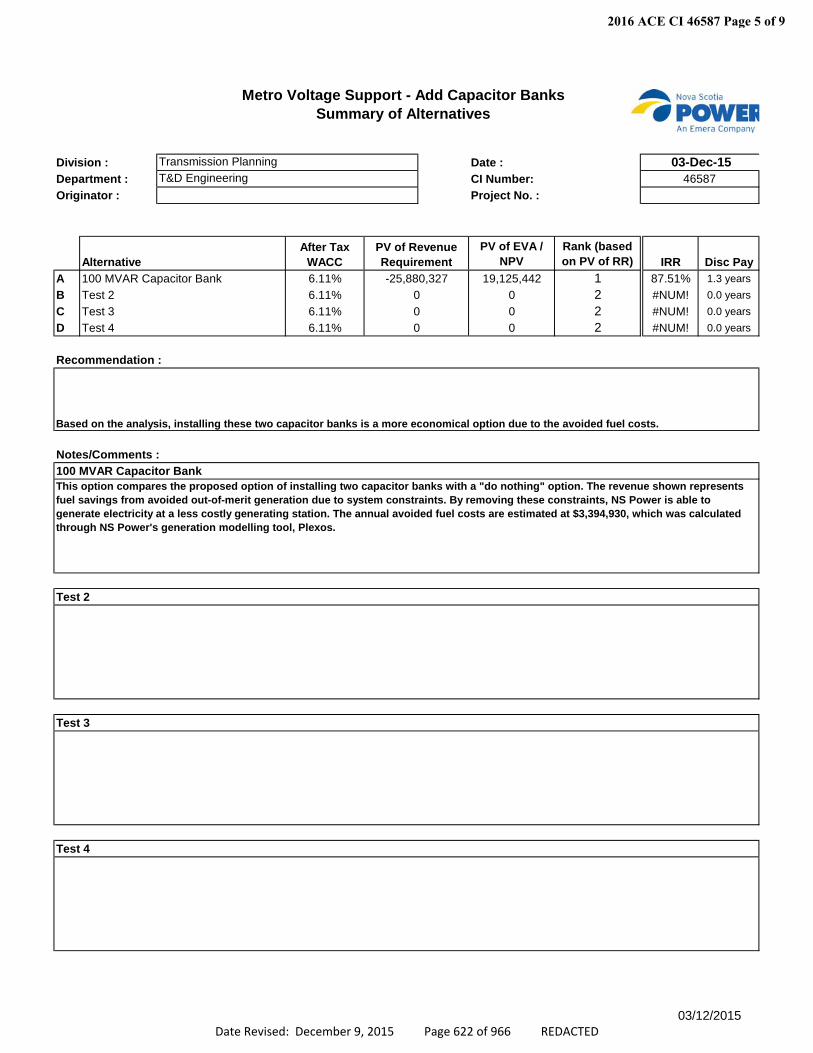
Metro Voltage Support - Add Capacitor BanksSummary of Alternatives
Division : Date : 03-Dec-15Department : CI Number:Originator : Project No. :
AlternativePV of EVA /
NPVRank (based on PV of RR) IRR Disc Pay
A 100 MVAR Capacitor Bank 19,125,442 1 87.51% 1.3 yearsB Test 2 0 2 #NUM! 0.0 yearsC Test 3 0 2 #NUM! 0.0 yearsD Test 4 0 2 #NUM! 0.0 years
Recommendation :
Notes/Comments :100 MVAR Capacitor Bank
Test 2
Test 3
Test 4
Transmission PlanningT&D Engineering 46587
Based on the analysis, installing these two capacitor banks is a more economical option due to the avoided fuel costs.
This option compares the proposed option of installing two capacitor banks with a "do nothing" option. The revenue shown represents fuel savings from avoided out-of-merit generation due to system constraints. By removing these constraints, NS Power is able to generate electricity at a less costly generating station. The annual avoided fuel costs are estimated at $3,394,930, which was calculated through NS Power's generation modelling tool, Plexos.
After Tax WACC
6.11%6.11%6.11%6.11%
PV of Revenue Requirement-25,880,327
000
03/12/2015
2016 ACE CI 46587 Page 5 of 9
Date Revised: December 9, 2015 Page 622 of 966 REDACTED
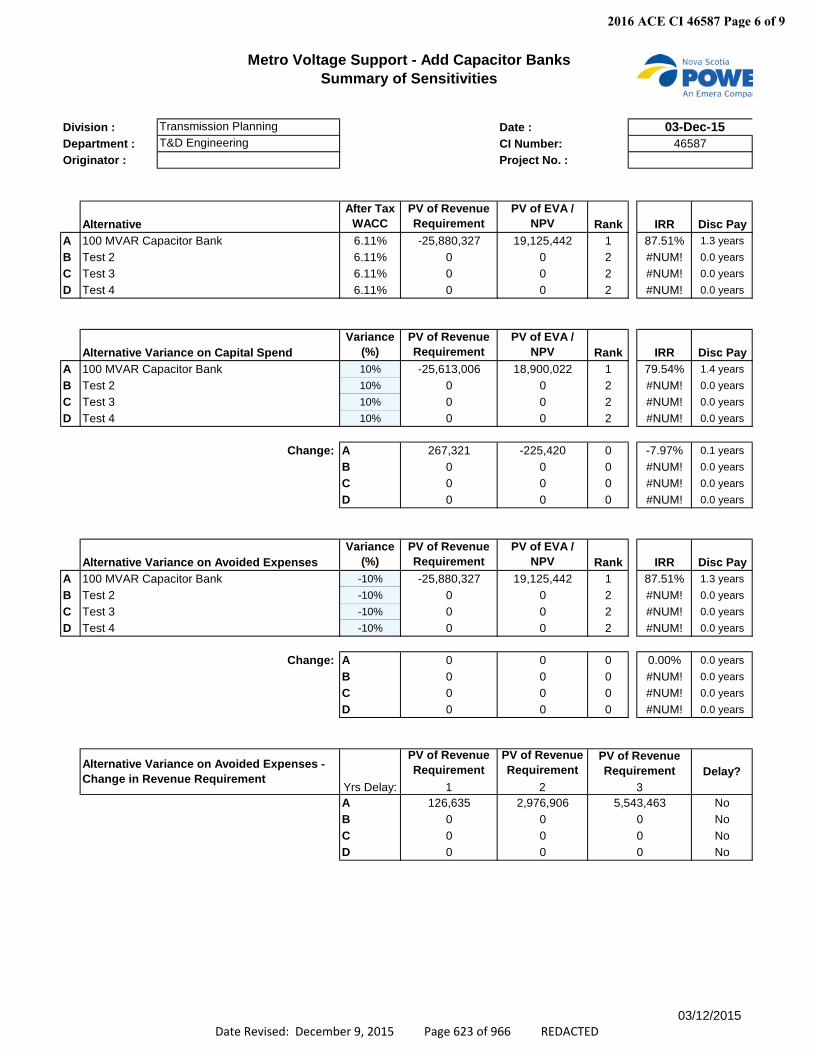
Metro Voltage Support - Add Capacitor BanksSummary of Sensitivities
Division : Date : 03-Dec-15Department : CI Number:Originator : Project No. :
AlternativeAfter Tax
WACCPV of Revenue Requirement
PV of EVA / NPV Rank IRR Disc Pay
A 100 MVAR Capacitor Bank 6.11% -25,880,327 19,125,442 1 87.51% 1.3 yearsB Test 2 6.11% 0 0 2 #NUM! 0.0 yearsC Test 3 6.11% 0 0 2 #NUM! 0.0 yearsD Test 4 6.11% 0 0 2 #NUM! 0.0 years
Alternative Variance on Capital SpendVariance
(%)PV of Revenue Requirement
PV of EVA / NPV Rank IRR Disc Pay
A 100 MVAR Capacitor Bank 10% -25,613,006 18,900,022 1 79.54% 1.4 yearsB Test 2 10% 0 0 2 #NUM! 0.0 yearsC Test 3 10% 0 0 2 #NUM! 0.0 yearsD Test 4 10% 0 0 2 #NUM! 0.0 years
Change: A 267,321 -225,420 0 -7.97% 0.1 yearsB 0 0 0 #NUM! 0.0 yearsC 0 0 0 #NUM! 0.0 yearsD 0 0 0 #NUM! 0.0 years
Alternative Variance on Avoided ExpensesVariance
(%)PV of Revenue Requirement
PV of EVA / NPV Rank IRR Disc Pay
A 100 MVAR Capacitor Bank -10% -25,880,327 19,125,442 1 87.51% 1.3 yearsB Test 2 -10% 0 0 2 #NUM! 0.0 yearsC Test 3 -10% 0 0 2 #NUM! 0.0 yearsD Test 4 -10% 0 0 2 #NUM! 0.0 years
Change: A 0 0 0 0.00% 0.0 yearsB 0 0 0 #NUM! 0.0 yearsC 0 0 0 #NUM! 0.0 yearsD 0 0 0 #NUM! 0.0 years
PV of Revenue Requirement
PV of Revenue Requirement
Yrs Delay: 1 2A 126,635 2,976,906 NoB 0 0 NoC 0 0 NoD 0 0 No0
Alternative Variance on Avoided Expenses - Change in Revenue Requirement
Transmission PlanningT&D Engineering 46587
PV of Revenue Requirement Delay?
35,543,463
00
03/12/2015
2016 ACE CI 46587 Page 6 of 9
Date Revised: December 9, 2015 Page 623 of 966 REDACTED
Division : Date : Department : CI Number:Originator : Project No. :
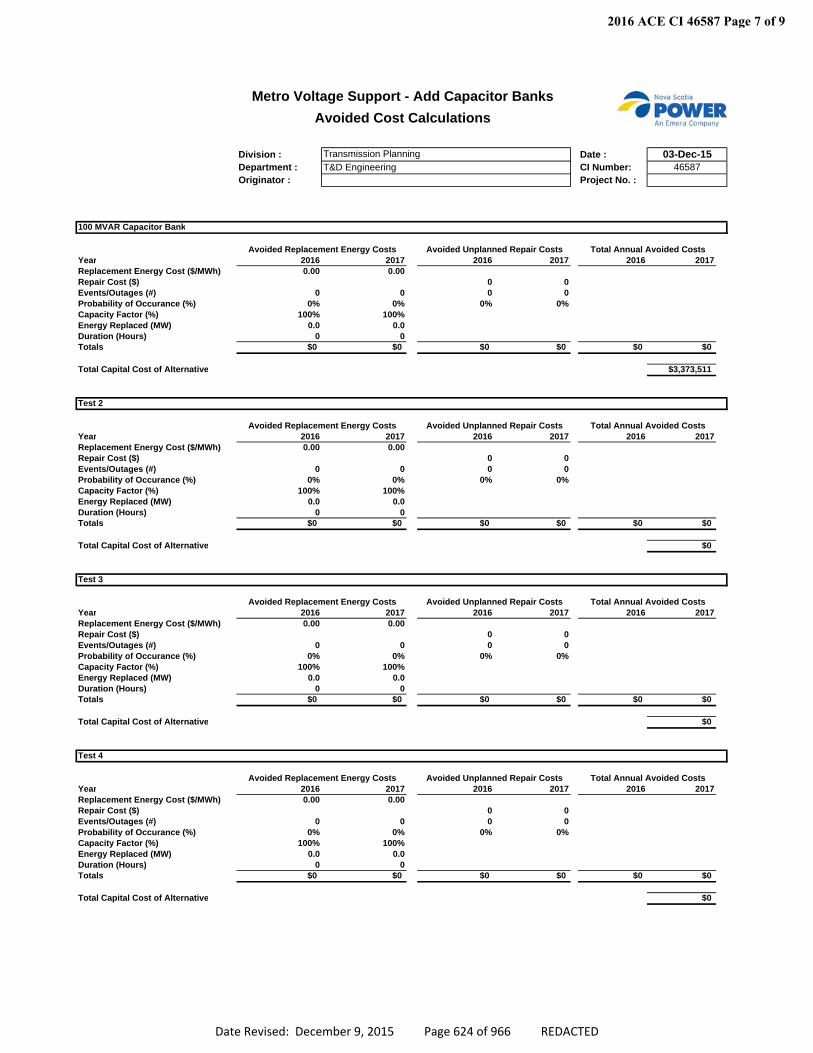
100 MVAR Capacitor Bank
Year 2016 2017 2016 2017 2016 2017Replacement Energy Cost ($/MWh) 0.00 0.00Repair Cost ($) 0 0Events/Outages (#) 0 0 0 0Probability of Occurance (%) 0% 0% 0% 0%Capacity Factor (%) 100% 100%Energy Replaced (MW) 0.0 0.0Duration (Hours) 0 0Totals $0 $0 $0 $0 $0 $0
Total Capital Cost of Alternative $3,373,511
Test 2
Year 2016 2017 2016 2017 2016 2017Replacement Energy Cost ($/MWh) 0.00 0.00Repair Cost ($) 0 0Events/Outages (#) 0 0 0 0Probability of Occurance (%) 0% 0% 0% 0%Capacity Factor (%) 100% 100%Energy Replaced (MW) 0.0 0.0Duration (Hours) 0 0Totals $0 $0 $0 $0 $0 $0
Total Capital Cost of Alternative $0
Test 3
Year 2016 2017 2016 2017 2016 2017Replacement Energy Cost ($/MWh) 0.00 0.00Repair Cost ($) 0 0Events/Outages (#) 0 0 0 0Probability of Occurance (%) 0% 0% 0% 0%Capacity Factor (%) 100% 100%Energy Replaced (MW) 0.0 0.0Duration (Hours) 0 0Totals $0 $0 $0 $0 $0 $0
Total Capital Cost of Alternative $0
Test 4
Year 2016 2017 2016 2017 2016 2017Replacement Energy Cost ($/MWh) 0.00 0.00Repair Cost ($) 0 0Events/Outages (#) 0 0 0 0Probability of Occurance (%) 0% 0% 0% 0%Capacity Factor (%) 100% 100%Energy Replaced (MW) 0.0 0.0Duration (Hours) 0 0Totals $0 $0 $0 $0 $0 $0
Total Capital Cost of Alternative $0
Avoided Replacement Energy Costs Avoided Unplanned Repair Costs Total Annual Avoided Costs
Avoided Replacement Energy Costs Avoided Unplanned Repair Costs Total Annual Avoided Costs
Avoided Replacement Energy Costs Avoided Unplanned Repair Costs Total Annual Avoided Costs
Avoided Replacement Energy Costs Avoided Unplanned Repair Costs Total Annual Avoided Costs
Metro Voltage Support - Add Capacitor BanksAvoided Cost Calculations
03-Dec-1546587
Transmission PlanningT&D Engineering
2016 ACE CI 46587 Page 7 of 9
Date Revised: December 9, 2015 Page 624 of 966 REDACTED
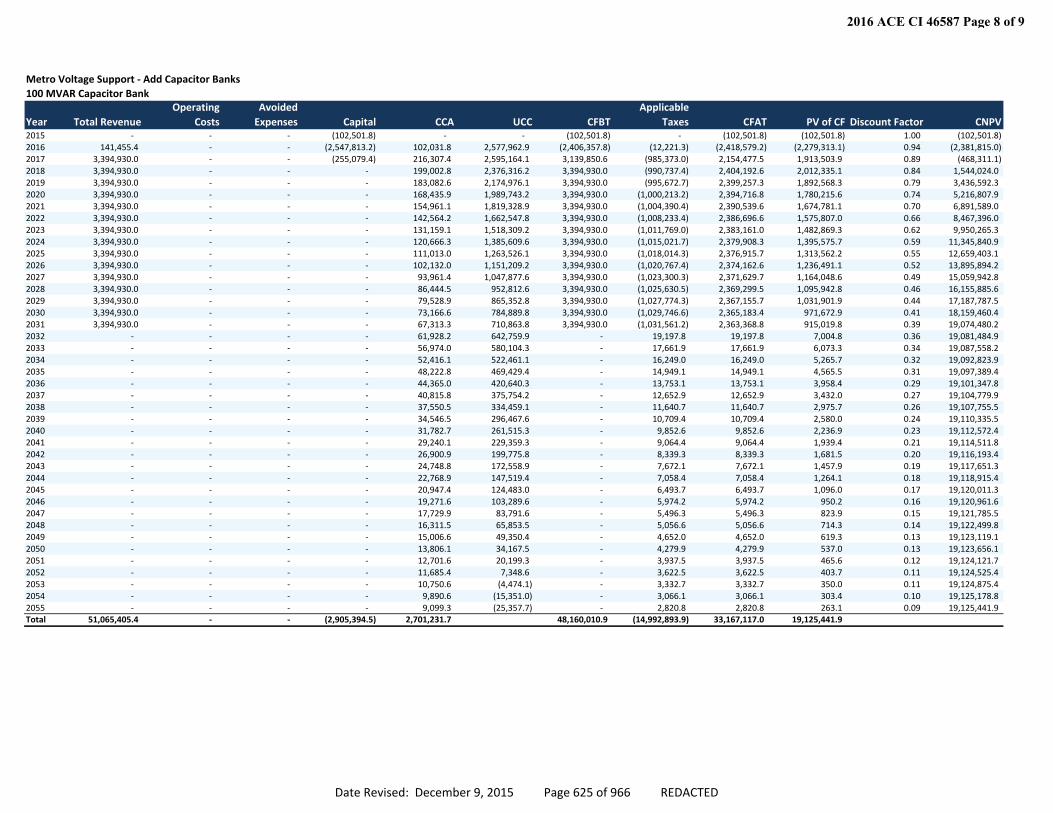
Metro Voltage Support ‐ Add Capacitor Banks100 MVAR Capacitor Bank
Year Total RevenueOperating
CostsAvoided Expenses Capital CCA UCC CFBT
Applicable Taxes CFAT PV of CF Discount Factor CNPV
2015 ‐ ‐ ‐ (102,501.8) ‐ ‐ (102,501.8) ‐ (102,501.8) (102,501.8) 1.00 (102,501.8) 2016 141,455.4 ‐ ‐ (2,547,813.2) 102,031.8 2,577,962.9 (2,406,357.8) (12,221.3) (2,418,579.2) (2,279,313.1) 0.94 (2,381,815.0) 2017 3,394,930.0 ‐ ‐ (255,079.4) 216,307.4 2,595,164.1 3,139,850.6 (985,373.0) 2,154,477.5 1,913,503.9 0.89 (468,311.1) 2018 3,394,930.0 ‐ ‐ ‐ 199,002.8 2,376,316.2 3,394,930.0 (990,737.4) 2,404,192.6 2,012,335.1 0.84 1,544,024.0 2019 3,394,930.0 ‐ ‐ ‐ 183,082.6 2,174,976.1 3,394,930.0 (995,672.7) 2,399,257.3 1,892,568.3 0.79 3,436,592.3 2020 3,394,930.0 ‐ ‐ ‐ 168,435.9 1,989,743.2 3,394,930.0 (1,000,213.2) 2,394,716.8 1,780,215.6 0.74 5,216,807.9 2021 3,394,930.0 ‐ ‐ ‐ 154,961.1 1,819,328.9 3,394,930.0 (1,004,390.4) 2,390,539.6 1,674,781.1 0.70 6,891,589.0 2022 3,394,930.0 ‐ ‐ ‐ 142,564.2 1,662,547.8 3,394,930.0 (1,008,233.4) 2,386,696.6 1,575,807.0 0.66 8,467,396.0 2023 3,394,930.0 ‐ ‐ ‐ 131,159.1 1,518,309.2 3,394,930.0 (1,011,769.0) 2,383,161.0 1,482,869.3 0.62 9,950,265.3 2024 3,394,930.0 ‐ ‐ ‐ 120,666.3 1,385,609.6 3,394,930.0 (1,015,021.7) 2,379,908.3 1,395,575.7 0.59 11,345,840.9 2025 3,394,930.0 ‐ ‐ ‐ 111,013.0 1,263,526.1 3,394,930.0 (1,018,014.3) 2,376,915.7 1,313,562.2 0.55 12,659,403.1 2026 3,394,930.0 ‐ ‐ ‐ 102,132.0 1,151,209.2 3,394,930.0 (1,020,767.4) 2,374,162.6 1,236,491.1 0.52 13,895,894.2 2027 3,394,930.0 ‐ ‐ ‐ 93,961.4 1,047,877.6 3,394,930.0 (1,023,300.3) 2,371,629.7 1,164,048.6 0.49 15,059,942.8 2028 3,394,930.0 ‐ ‐ ‐ 86,444.5 952,812.6 3,394,930.0 (1,025,630.5) 2,369,299.5 1,095,942.8 0.46 16,155,885.6 2029 3,394,930.0 ‐ ‐ ‐ 79,528.9 865,352.8 3,394,930.0 (1,027,774.3) 2,367,155.7 1,031,901.9 0.44 17,187,787.5 2030 3,394,930.0 ‐ ‐ ‐ 73,166.6 784,889.8 3,394,930.0 (1,029,746.6) 2,365,183.4 971,672.9 0.41 18,159,460.4 2031 3,394,930.0 ‐ ‐ ‐ 67,313.3 710,863.8 3,394,930.0 (1,031,561.2) 2,363,368.8 915,019.8 0.39 19,074,480.2 2032 ‐ ‐ ‐ ‐ 61,928.2 642,759.9 ‐ 19,197.8 19,197.8 7,004.8 0.36 19,081,484.9 2033 ‐ ‐ ‐ ‐ 56,974.0 580,104.3 ‐ 17,661.9 17,661.9 6,073.3 0.34 19,087,558.2 2034 ‐ ‐ ‐ ‐ 52,416.1 522,461.1 ‐ 16,249.0 16,249.0 5,265.7 0.32 19,092,823.9 2035 ‐ ‐ ‐ ‐ 48,222.8 469,429.4 ‐ 14,949.1 14,949.1 4,565.5 0.31 19,097,389.4 2036 ‐ ‐ ‐ ‐ 44,365.0 420,640.3 ‐ 13,753.1 13,753.1 3,958.4 0.29 19,101,347.8 2037 ‐ ‐ ‐ ‐ 40,815.8 375,754.2 ‐ 12,652.9 12,652.9 3,432.0 0.27 19,104,779.9 2038 ‐ ‐ ‐ ‐ 37,550.5 334,459.1 ‐ 11,640.7 11,640.7 2,975.7 0.26 19,107,755.5 2039 ‐ ‐ ‐ ‐ 34,546.5 296,467.6 ‐ 10,709.4 10,709.4 2,580.0 0.24 19,110,335.5 2040 ‐ ‐ ‐ ‐ 31,782.7 261,515.3 ‐ 9,852.6 9,852.6 2,236.9 0.23 19,112,572.4 2041 ‐ ‐ ‐ ‐ 29,240.1 229,359.3 ‐ 9,064.4 9,064.4 1,939.4 0.21 19,114,511.8 2042 ‐ ‐ ‐ ‐ 26,900.9 199,775.8 ‐ 8,339.3 8,339.3 1,681.5 0.20 19,116,193.4 2043 ‐ ‐ ‐ ‐ 24,748.8 172,558.9 ‐ 7,672.1 7,672.1 1,457.9 0.19 19,117,651.3 2044 ‐ ‐ ‐ ‐ 22,768.9 147,519.4 ‐ 7,058.4 7,058.4 1,264.1 0.18 19,118,915.4 2045 ‐ ‐ ‐ ‐ 20,947.4 124,483.0 ‐ 6,493.7 6,493.7 1,096.0 0.17 19,120,011.3 2046 ‐ ‐ ‐ ‐ 19,271.6 103,289.6 ‐ 5,974.2 5,974.2 950.2 0.16 19,120,961.6 2047 ‐ ‐ ‐ ‐ 17,729.9 83,791.6 ‐ 5,496.3 5,496.3 823.9 0.15 19,121,785.5 2048 ‐ ‐ ‐ ‐ 16,311.5 65,853.5 ‐ 5,056.6 5,056.6 714.3 0.14 19,122,499.8 2049 ‐ ‐ ‐ ‐ 15,006.6 49,350.4 ‐ 4,652.0 4,652.0 619.3 0.13 19,123,119.1 2050 ‐ ‐ ‐ ‐ 13,806.1 34,167.5 ‐ 4,279.9 4,279.9 537.0 0.13 19,123,656.1 2051 ‐ ‐ ‐ ‐ 12,701.6 20,199.3 ‐ 3,937.5 3,937.5 465.6 0.12 19,124,121.7 2052 ‐ ‐ ‐ ‐ 11,685.4 7,348.6 ‐ 3,622.5 3,622.5 403.7 0.11 19,124,525.4 2053 ‐ ‐ ‐ ‐ 10,750.6 (4,474.1) ‐ 3,332.7 3,332.7 350.0 0.11 19,124,875.4 2054 ‐ ‐ ‐ ‐ 9,890.6 (15,351.0) ‐ 3,066.1 3,066.1 303.4 0.10 19,125,178.8 2055 ‐ ‐ ‐ ‐ 9,099.3 (25,357.7) ‐ 2,820.8 2,820.8 263.1 0.09 19,125,441.9 Total 51,065,405.4 ‐ ‐ (2,905,394.5) 2,701,231.7 48,160,010.9 (14,992,893.9) 33,167,117.0 19,125,441.9
2016 ACE CI 46587 Page 8 of 9
Date Revised: December 9, 2015 Page 625 of 966 REDACTED
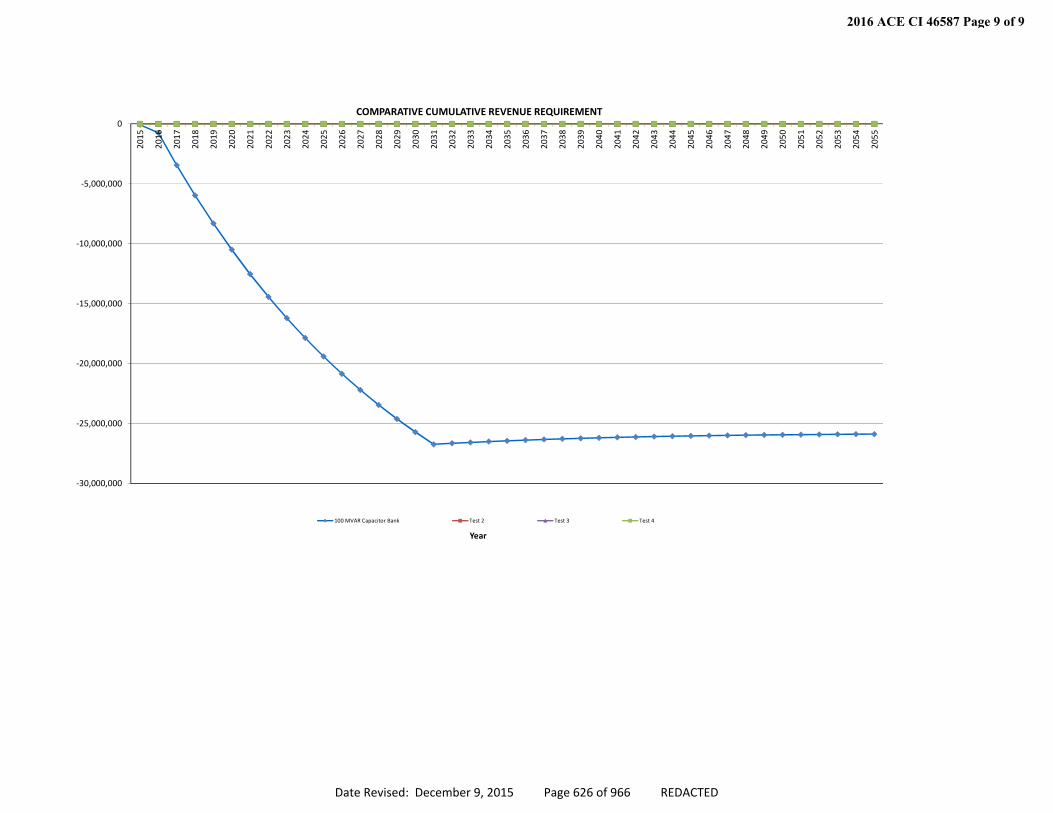
‐30,000,000
‐25,000,000
‐20,000,000
‐15,000,000
‐10,000,000
‐5,000,000
0
2015
2016
2017
2018
2019
2020
2021
2022
2023
2024
2025
2026
2027
2028
2029
2030
2031
2032
2033
2034
2035
2036
2037
2038
2039
2040
2041
2042
2043
2044
2045
2046
2047
2048
2049
2050
2051
2052
2053
2054
2055
Year
COMPARATIVE CUMULATIVE REVENUE REQUIREMENT
100 MVAR Capacitor Bank Test 2 Test 3 Test 4
2016 ACE CI 46587 Page 9 of 9
Date Revised: December 9, 2015 Page 626 of 966 REDACTED


![home/goguen/tatami/seek/lisbon04cseweb.ucsd.edu/~goguen/pps/old.lisbon04.pdf · .0/0132 46587 9;:/=?2 @ ACB0DFEHGJILKMDONQP RTSVU-W XFDOSYRTILBZDFW\[6]0W B ^_D`GbaHR ^CGbc0NedZURHfgc0h0NLGJIi]\jbD`GbBZjJGlknmoB0aHD`BZGbG3ILDFB0a](https://static.fdocuments.net/doc/165x107/604cd3d67474a11fe151c72f/homegoguentatamiseek-goguenppsoldlisbon04pdf-00132-46587-92-acb0dfehgjilkmdonqp.jpg)

![`46EGFba Pdc - ece.rice.edu-/.0 1 2 3)46587:9=?7@7bac465d46egfihkjml17on6pq; nsr; n6fthu46ewvx3)fzy[; 46\ov^]_46\`46egfba pdc](https://static.fdocuments.net/doc/165x107/61208fe2841bab5280781fd0/46egfba-pdc-ecericeedu-0-1-2-346587977bac465d46egfihkjml17on6pq-nsr.jpg)
![showman/publications/volcan-second-revision.pdf! " #$ &%' )(+*, -. /0 21 3 & 46587:9=@?BADC&EF9G7:H IKJML 7ONQPQ9 J HRPFCTSU;WVX7:H PY7ONQZ ?B[]\ HD[J]^ _a` H87ON37:HD5b;.Vc7:H](https://static.fdocuments.net/doc/165x107/5abd58887f8b9a3a428ba971/showmanpublicationsvolcan-second-revisionpdf-0-21-3-465879badcef9g7h.jpg)