CHUY Jan 2016 Investor Presentation
26
ICR Conference 2016
-
Upload
ala-baster -
Category
Documents
-
view
220 -
download
1
description
chuy
Transcript of CHUY Jan 2016 Investor Presentation

ICR Conference 2016
Cautionary Statements
Forward-Looking StatementsThis presentation may include forward-looking statements. These statements reflect the current views of theCompany’s senior management with respect to future events and financial performance. These statementsinclude forward-looking statements with respect to the Company’s business and industry in general.Statements that include the words “expect,” “intend,” “plan,” “believe,” “project,” “forecast,” “estimate,”“may,” “should,” “anticipate” and similar statements of a future or forward-looking nature identify forward-looking statements for purposes of the federal securities laws or otherwise. Forward-looking statementsaddress matters that involve risks and uncertainties. Accordingly, there are or will be important factors thatcould cause the Company’s actual results to differ materially from those indicated in these statements. Thestatements made herein speak only as of the date of this presentation.
Non-GAAP Financial MeasuresThis presentation contains certain non-GAAP financial measures. A “non-GAAP financial measure” is defined asa numerical measure of a company’s financial performance that excludes or includes amounts so as to bedifferent than the most directly comparable measure calculated and presented in accordance with GAAP in thestatements of income, balance sheets or statements of cash flow of the company. The Company has provided areconciliation of non-GAAP financial measures to the most directly comparable financial measure in theAppendix to this presentation. The non-GAAP financial measures used within this presentation are AdjustedEBITDA and Restaurant-Level EBITDA. These measures are presented because management uses thisinformation to monitor and evaluate financial results and trends and believes this information to also be usefulfor investors. For additional information about our non-GAAP financial measures, see our earnings releases andfilings with the Securities and Exchange Commission.
2

Senior Management Presenters
Steve HislopPresident andChief Executive Officer
33
Jon HowieVice President andChief Financial Officer
Steve HislopPresident andChief Executive Officer

“If you’ve seen one Chuy’s, you’ve seen one Chuy’s!”
Chuy’s is Tex Mex Unchained!
4
Leave the cookie cutters to the other guys. Each Chuy’s has genuine character: a noisy,sprawling Tex Mex hacienda full of feel-good drinks and home-cooked foods.
4
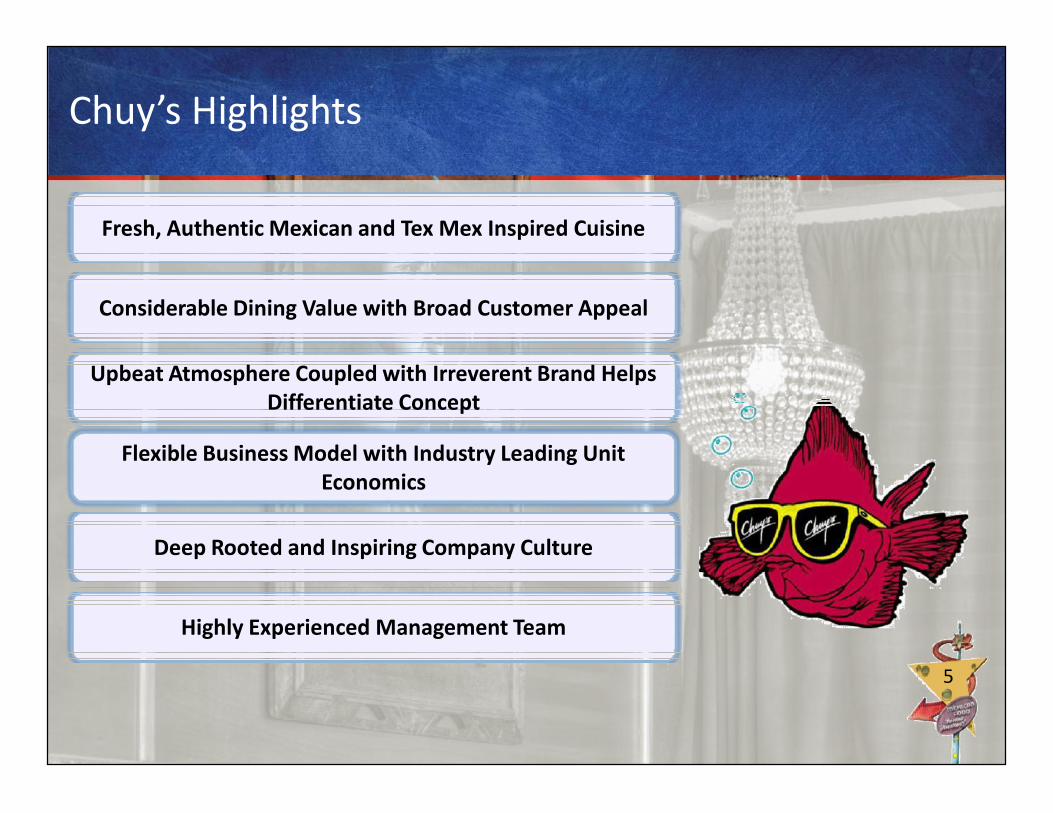
Chuy’s Highlights
Considerable Dining Value with Broad Customer Appeal
Upbeat Atmosphere Coupled with Irreverent Brand HelpsDifferentiate Concept
Fresh, Authentic Mexican and Tex Mex Inspired Cuisine
55
Flexible Business Model with Industry Leading UnitEconomics
Deep Rooted and Inspiring Company Culture
Upbeat Atmosphere Coupled with Irreverent Brand HelpsDifferentiate Concept
Highly Experienced Management Team
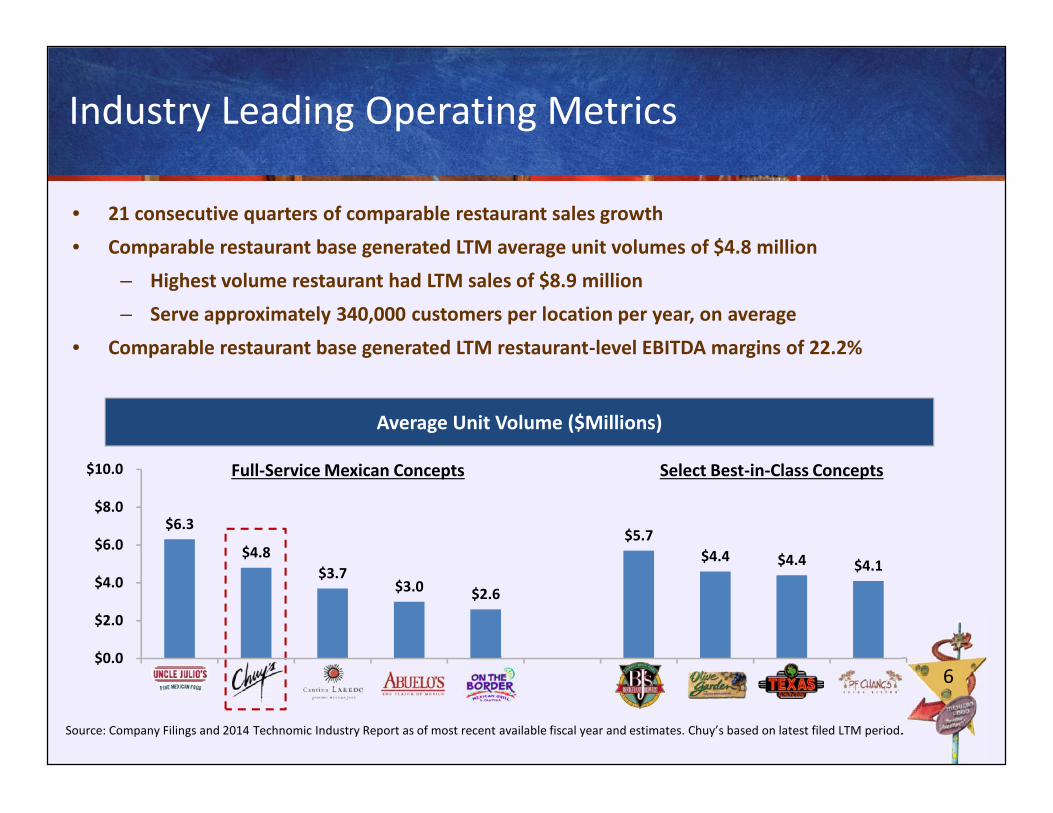
Industry Leading Operating Metrics
• 21 consecutive quarters of comparable restaurant sales growth• Comparable restaurant base generated LTM average unit volumes of $4.8 million
– Highest volume restaurant had LTM sales of $8.9 million– Serve approximately 340,000 customers per location per year, on average
• Comparable restaurant base generated LTM restaurant-level EBITDA margins of 22.2%
Average Unit Volume ($Millions)
6
Source: Company Filings and 2014 Technomic Industry Report as of most recent available fiscal year and estimates. Chuy’s based on latest filed LTM period.
Average Unit Volume ($Millions)
$6.3
$4.8$3.7
$3.0 $2.6
$5.7$4.4 $4.4 $4.1
$0.0
$2.0
$4.0
$6.0
$8.0
$10.0
6
Full-Service Mexican Concepts Select Best-in-Class Concepts
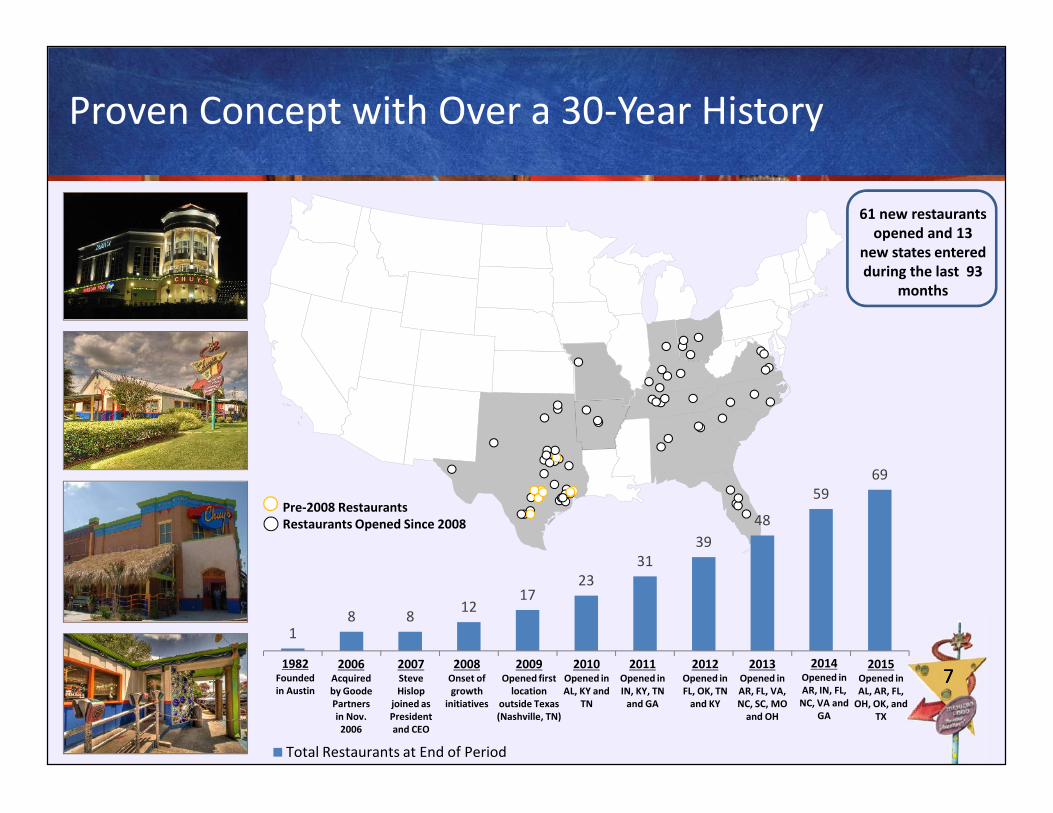
Proven Concept with Over a 30-Year History
61 new restaurantsopened and 13
new states enteredduring the last 93
months
77
Pre-2008 RestaurantsRestaurants Opened Since 2008
1982Foundedin Austin
2006Acquiredby GoodePartnersin Nov.2006
2008Onset ofgrowth
initiatives
2009Opened first
locationoutside Texas(Nashville, TN)
2010Opened inAL, KY and
TN
2011Opened inIN, KY, TN
and GA
2007SteveHislop
joined asPresidentand CEO
2013Opened inAR, FL, VA,NC, SC, MO
and OH
2012Opened inFL, OK, TN
and KY
2014Opened inAR, IN, FL,
NC, VA andGA
18 8 12
1723
3139
48
5969
Total Restaurants at End of Period
2015Opened inAL, AR, FL,
OH, OK, andTX

Fresh, Authentic Mexican Cuisine
• Offer authentic Mexican food using only the freshest ingredients
• Recipes and cooking techniques originated from friends and family of our founders, who arefrom Mexico, New Mexico and Texas
• Commitment to made-from-scratch, freshly prepared cooking
• Generous portions support value priced offering
• Customizable food offering is core to the Chuy’s concept
88

We Take One Thing Seriously: Our Food!
Homemade Sauces
Tex Mex
Ranchero
Hatch Green Chile
Green Chile
Tomatillo
Deluxe Tomatillo
Creamy Jalapeno
“Big As Yo’ Face” Burritos
• A homemade, 12” flourtortilla stuffed with refriedbeans, cheese and choice ofbeef or chicken. Served withchoice of sauce & choice ofMexican or green chile rice
• Price: $8.49 - $10.29
9
Tex Mex
Ranchero
Hatch Green Chile
Green Chile
Tomatillo
Deluxe Tomatillo
Creamy Jalapeno
9
Chicka-Chicka Boom-Boom
• Freshly-roasted, hand-pulledchicken & cheese with Boom-Boom sauce, made withcheese, roasted New Mexicangreen chiles, tomatillos, greenonions, cilantro and lime juice.Served with choice of Mexicanor green chile rice & refried orcharro beans
• Price: $10.49
Texas Martini
• Served “shaken, not stirred,”this south-of-the-bordermartini features tequila,Patrón Citrónge, fresh limejuice and a jalapeño-stuffedolive
• Three drinks for theprice of one
• Price: $8.95
Note: Prices above represent menu prices in Texas and Oklahoma as of December 31, 2015, which may vary from prices in other states.

Exceptional Dining Value
• Significant value proposition tocustomers
• Only 7 out of 49 menu items pricedover $10.00(1)
• Average check of $14.12
10
$12.44$14.12 $14.50
$16.02 $17.00$20.20 $21.00 $21.20
$24.93 $25.06
$0.0
$5.0
$10.0
$15.0
$20.0
$25.0
$30.0
Source: Company filings as of most recent available fiscal year end and equity research. Chuy’s based on latest filed LTM period.(1) Applies to our tier 1 menu as of December 31, 2015 which is in place at 33 of our 69 restaurants as of that date.
Average Check
10
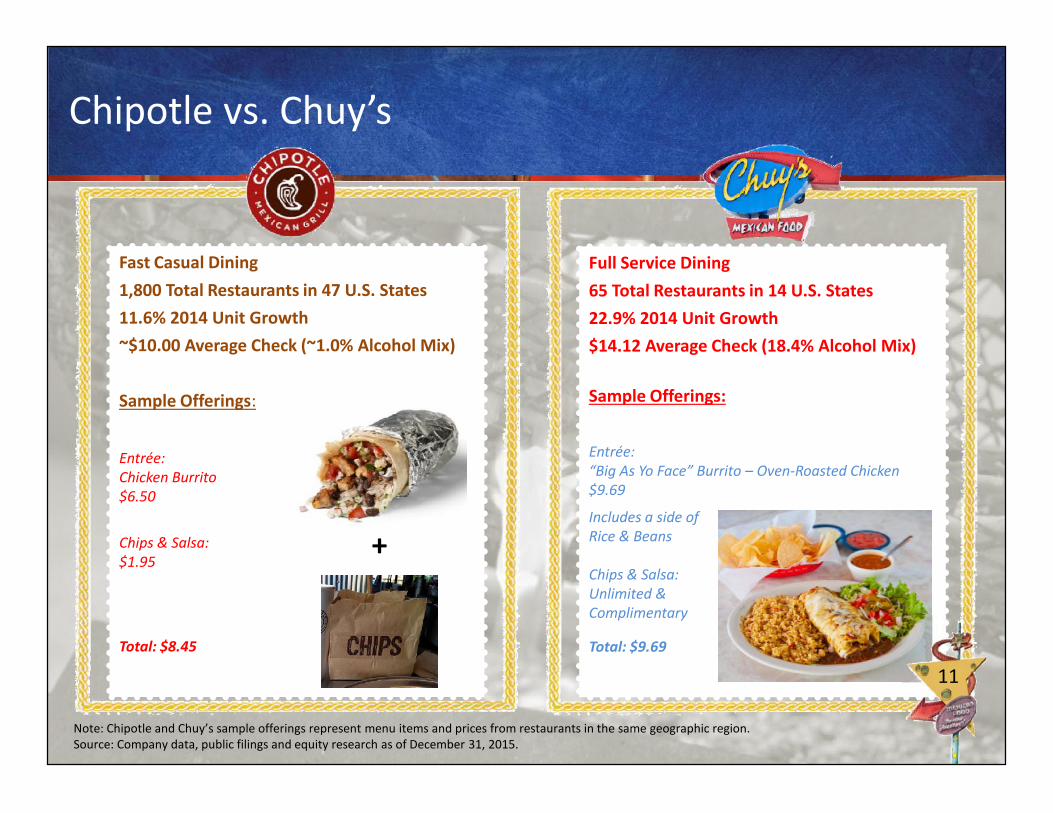
Full Service Dining65 Total Restaurants in 14 U.S. States22.9% 2014 Unit Growth$14.12 Average Check (18.4% Alcohol Mix)
Sample Offerings:
Entrée:“Big As Yo Face” Burrito – Oven-Roasted Chicken$9.69
Includes a side ofRice & Beans
Chips & Salsa:Unlimited &Complimentary
Total: $9.69
Chipotle vs. Chuy’s
Fast Casual Dining1,800 Total Restaurants in 47 U.S. States11.6% 2014 Unit Growth~$10.00 Average Check (~1.0% Alcohol Mix)
Sample Offerings:
Entrée:Chicken Burrito$6.50
Chips & Salsa:$1.95
Total: $8.45
11
Full Service Dining65 Total Restaurants in 14 U.S. States22.9% 2014 Unit Growth$14.12 Average Check (18.4% Alcohol Mix)
Sample Offerings:
Entrée:“Big As Yo Face” Burrito – Oven-Roasted Chicken$9.69
Includes a side ofRice & Beans
Chips & Salsa:Unlimited &Complimentary
Total: $9.69
Fast Casual Dining1,800 Total Restaurants in 47 U.S. States11.6% 2014 Unit Growth~$10.00 Average Check (~1.0% Alcohol Mix)
Sample Offerings:
Entrée:Chicken Burrito$6.50
Chips & Salsa:$1.95
Total: $8.45
+
11
Note: Chipotle and Chuy’s sample offerings represent menu items and prices from restaurants in the same geographic region.Source: Company data, public filings and equity research as of December 31, 2015.

Upbeat Atmosphere and Appealing, Irreverent Brand
1212

Growth Opportunities
13

Enhanced Restaurant Development Strategy
• Identify & pursue development inmajor markets
• “Backfill” smaller existing marketsto build brand awareness
• Flexible real estate strategy
– Conversions and newprototype construction
• Enhancements to Real Estate Dept.
• Plan to double restaurant base innext 3 to 5 years.
– 10 new units opened in 2015
– 11 to 13 new units expected in2016
1414
“Hub” Locations
• Identify & pursue development inmajor markets
• “Backfill” smaller existing marketsto build brand awareness
• Flexible real estate strategy
– Conversions and newprototype construction
• Enhancements to Real Estate Dept.
• Plan to double restaurant base innext 3 to 5 years.
– 10 new units opened in 2015
– 11 to 13 new units expected in2016
Pre-2008
2008
2009
2010
2011
2012
2013
Note: Map as of December 2015.
2014
2015
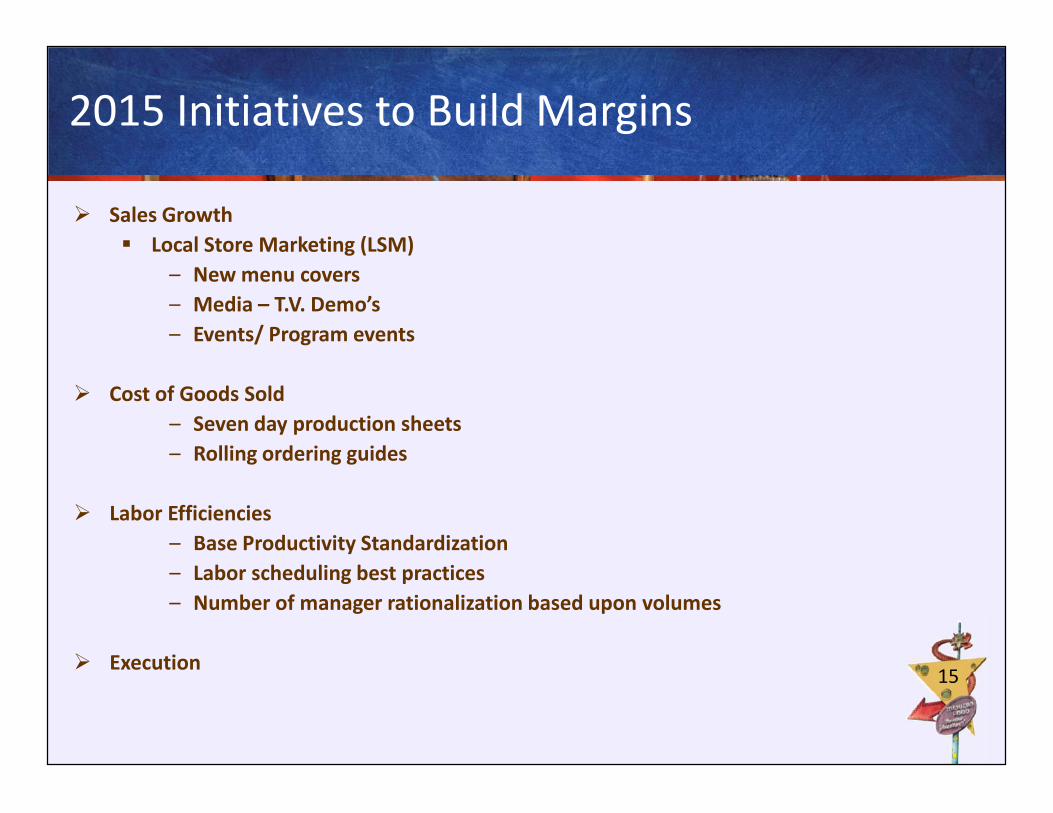
2015 Initiatives to Build Margins
Sales Growth Local Store Marketing (LSM)
– New menu covers– Media – T.V. Demo’s– Events/ Program events
Cost of Goods Sold– Seven day production sheets– Rolling ordering guides
Labor Efficiencies– Base Productivity Standardization– Labor scheduling best practices– Number of manager rationalization based upon volumes
Execution 15
Sales Growth Local Store Marketing (LSM)
– New menu covers– Media – T.V. Demo’s– Events/ Program events
Cost of Goods Sold– Seven day production sheets– Rolling ordering guides
Labor Efficiencies– Base Productivity Standardization– Labor scheduling best practices– Number of manager rationalization based upon volumes
Execution
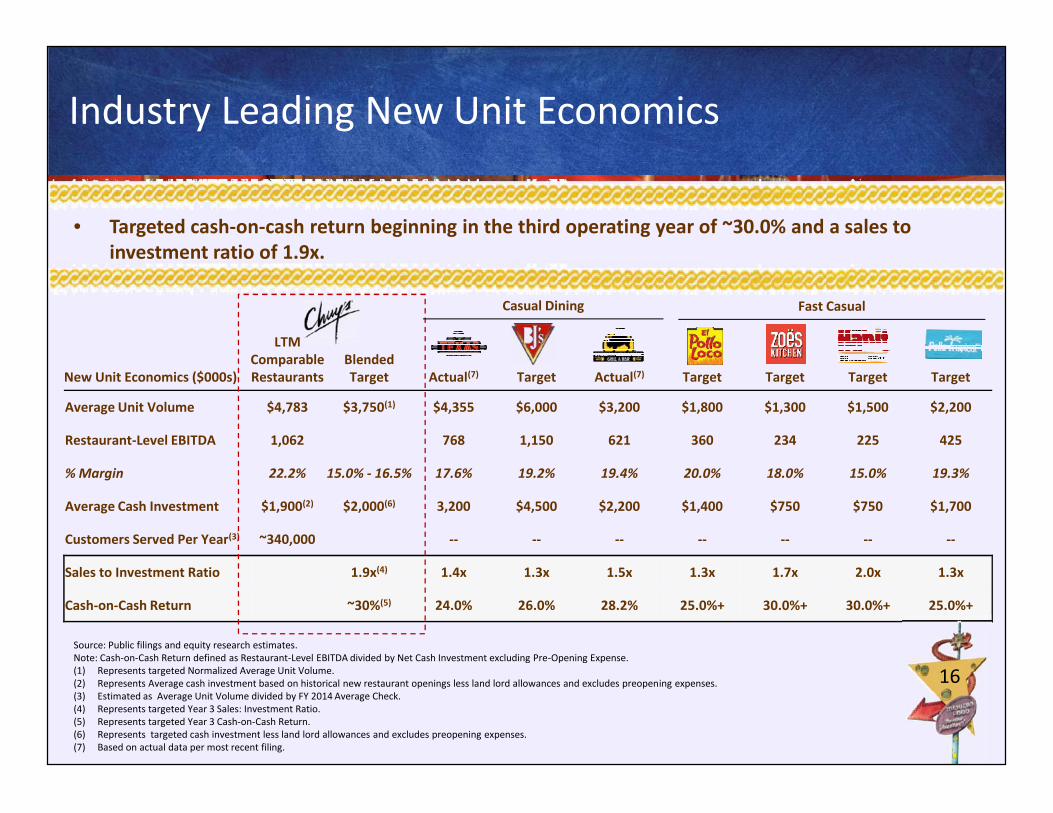
Industry Leading New Unit Economics
• Targeted cash-on-cash return beginning in the third operating year of ~30.0% and a sales toinvestment ratio of 1.9x.
New Unit Economics ($000s)
LTMComparableRestaurants
BlendedTarget Actual(7) Target Actual(7) Target Target Target Target
Average Unit Volume $4,783 $3,750(1) $4,355 $6,000 $3,200 $1,800 $1,300 $1,500 $2,200
Casual Dining Fast Casual
16
Source: Public filings and equity research estimates.Note: Cash-on-Cash Return defined as Restaurant-Level EBITDA divided by Net Cash Investment excluding Pre-Opening Expense.(1) Represents targeted Normalized Average Unit Volume.(2) Represents Average cash investment based on historical new restaurant openings less land lord allowances and excludes preopening expenses.(3) Estimated as Average Unit Volume divided by FY 2014 Average Check.(4) Represents targeted Year 3 Sales: Investment Ratio.(5) Represents targeted Year 3 Cash-on-Cash Return.(6) Represents targeted cash investment less land lord allowances and excludes preopening expenses.(7) Based on actual data per most recent filing.
Average Unit Volume $4,783 $3,750(1) $4,355 $6,000 $3,200 $1,800 $1,300 $1,500 $2,200
Restaurant-Level EBITDA 1,062 768 1,150 621 360 234 225 425
% Margin 22.2% 15.0% - 16.5% 17.6% 19.2% 19.4% 20.0% 18.0% 15.0% 19.3%
Average Cash Investment $1,900(2) $2,000(6) 3,200 $4,500 $2,200 $1,400 $750 $750 $1,700
Customers Served Per Year(3) ~340,000 -- -- -- -- -- -- --
Sales to Investment Ratio 1.9x(4) 1.4x 1.3x 1.5x 1.3x 1.7x 2.0x 1.3x
Cash-on-Cash Return ~30%(5) 24.0% 26.0% 28.2% 25.0%+ 30.0%+ 30.0%+ 25.0%+
16

Financial Summary
17
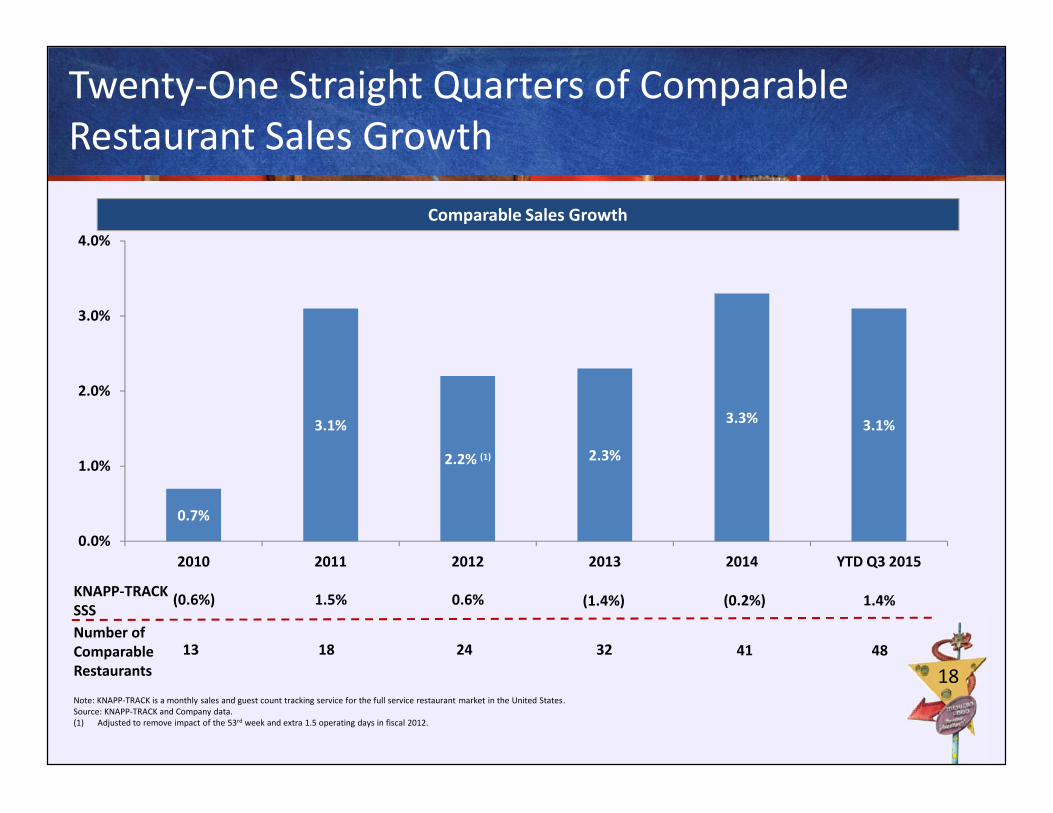
Twenty-One Straight Quarters of ComparableRestaurant Sales Growth
3.3%
2.0%
3.0%
4.0%Comparable Sales Growth
18
0.7%
3.1%
2.2% (1) 2.3%
3.3% 3.1%
0.0%
1.0%
2010 2011 2012 2013 2014 YTD Q3 2015
Number ofComparableRestaurants
18 24 4832 41
KNAPP-TRACKSSS 1.4%1.5% 0.6% (1.4%)
Note: KNAPP-TRACK is a monthly sales and guest count tracking service for the full service restaurant market in the United States.Source: KNAPP-TRACK and Company data.(1) Adjusted to remove impact of the 53rd week and extra 1.5 operating days in fiscal 2012.
(0.2%)
13
(0.6%)

Demonstrated Revenue and Unit Growth
$69.4$94.9
$130.6
$172.6$204.4
$245.1
$183.3$216.1
$0.0$40.0$80.0
$120.0$160.0$200.0$240.0
Revenue ($Millions)
19
$0.02009 2010 2011 2012 2013 2014 YTD Q3 2014 YTD Q3 2015
1723
3139
4859
5865
010203040506070
2009 2010 2011 2012 2013 2014 Q3 2014 Q3 2015
Total Restaurants
19

26.2%27.0%
27.7%26.9%
27.4%28.2% 28.2%
26.4%27.5%
30.0%
Consistent Cost of Sales Management
Cost of Sales (% of Revenue)
25.2%18.4%
Commodity Basket %’s
20
26.2% 26.4%
20.0%
22.5%
25.0%
2009 2010 2011 2012 2013 2014 YTDQ3
2014
YTDQ3
2015
20
15.5%
16.7%
12.6%
11.6%
Groceries Produce Beef
Dairy Chicken Bar & Other
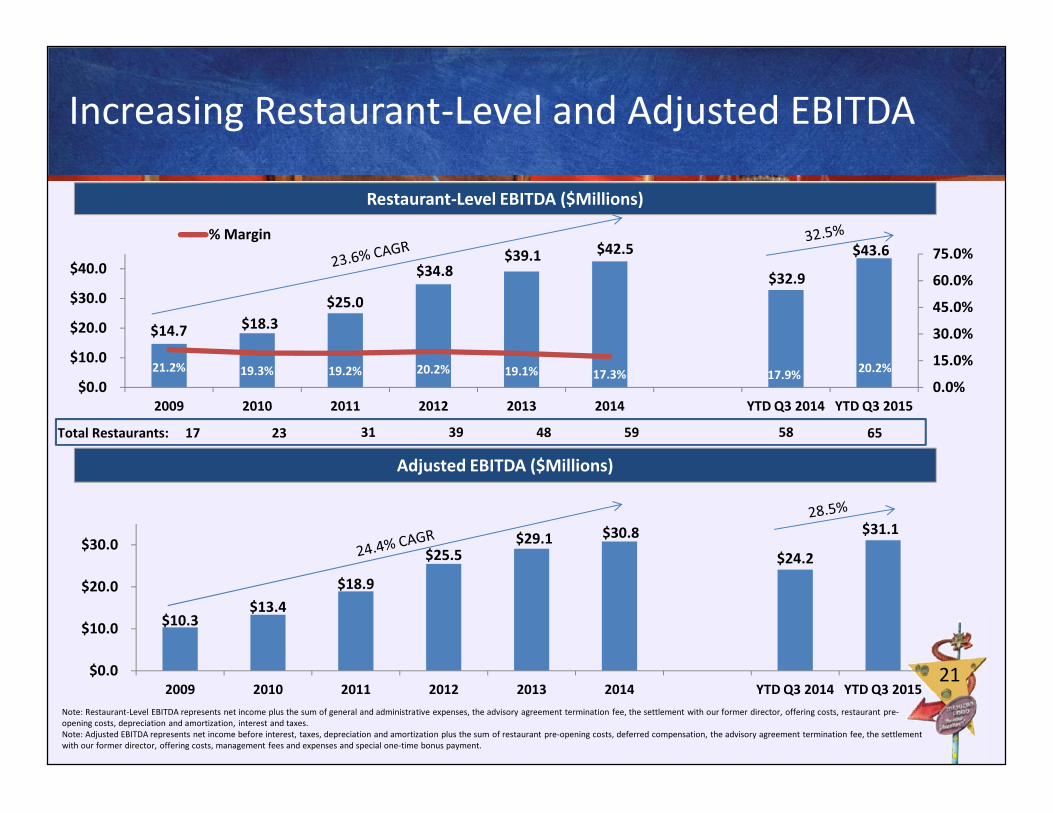
$14.7 $18.3$25.0
$34.8$39.1 $42.5
$32.9
$43.6
21.2% 19.3% 19.2% 20.2% 19.1% 17.3% 17.9% 20.2%0.0%
15.0%
30.0%
45.0%
60.0%
75.0%
$0.0
$10.0
$20.0
$30.0
$40.0
2009 2010 2011 2012 2013 2014 YTD Q3 2014 YTD Q3 2015
Restaurant-Level EBITDA
% Margin
Increasing Restaurant-Level and Adjusted EBITDA
Restaurant-Level EBITDA ($Millions)
Note: Adjusted EBIT reflects
21
2009 2010 2011 2012 2013 2014 YTD Q3 2014 YTD Q3 2015
58 65
$10.3$13.4
$18.9
$25.5$29.1 $30.8
$24.2
$31.1
$0.0
$10.0
$20.0
$30.0
2009 2010 2011 2012 2013 2014 YTD Q3 2014 YTD Q3 2015
Adjusted EBITDA ($Millions)
Total Restaurants:
Note: Restaurant-Level EBITDA represents net income plus the sum of general and administrative expenses, the advisory agreement termination fee, the settlement with our former director, offering costs, restaurant pre-opening costs, depreciation and amortization, interest and taxes.Note: Adjusted EBITDA represents net income before interest, taxes, depreciation and amortization plus the sum of restaurant pre-opening costs, deferred compensation, the advisory agreement termination fee, the settlementwith our former director, offering costs, management fees and expenses and special one-time bonus payment.
Note: Adjusted EBIT reflects
21
17 23 31 39 48 59
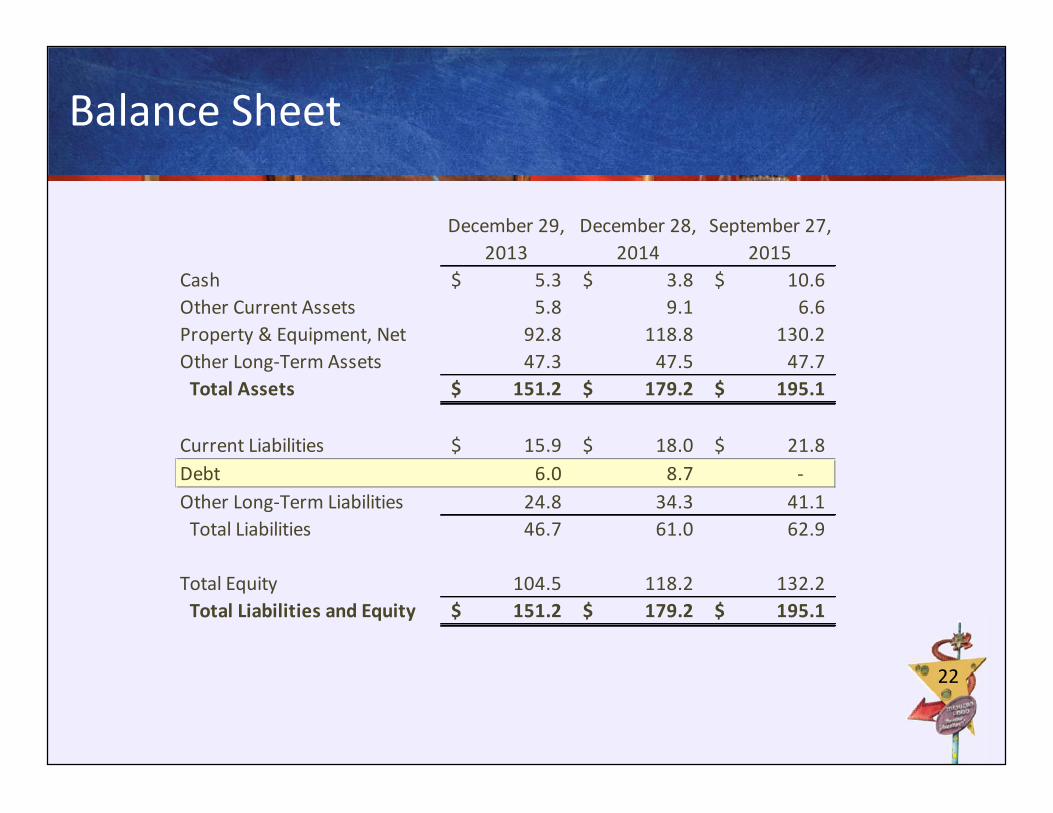
Balance Sheet
December 29, December 28, September 27,2013 2014 2015
Cash 5.3$ 3.8$ 10.6$Other Current Assets 5.8 9.1 6.6Property & Equipment, Net 92.8 118.8 130.2Other Long-Term Assets 47.3 47.5 47.7
Total Assets 151.2$ 179.2$ 195.1$
Current Liabilities 15.9$ 18.0$ 21.8$Debt 6.0 8.7 -Other Long-Term Liabilities 24.8 34.3 41.1
Total Liabilities 46.7 61.0 62.9
Total Equity 104.5 118.2 132.2Total Liabilities and Equity 151.2$ 179.2$ 195.1$
22
December 29, December 28, September 27,2013 2014 2015
Cash 5.3$ 3.8$ 10.6$Other Current Assets 5.8 9.1 6.6Property & Equipment, Net 92.8 118.8 130.2Other Long-Term Assets 47.3 47.5 47.7
Total Assets 151.2$ 179.2$ 195.1$
Current Liabilities 15.9$ 18.0$ 21.8$Debt 6.0 8.7 -Other Long-Term Liabilities 24.8 34.3 41.1
Total Liabilities 46.7 61.0 62.9
Total Equity 104.5 118.2 132.2Total Liabilities and Equity 151.2$ 179.2$ 195.1$
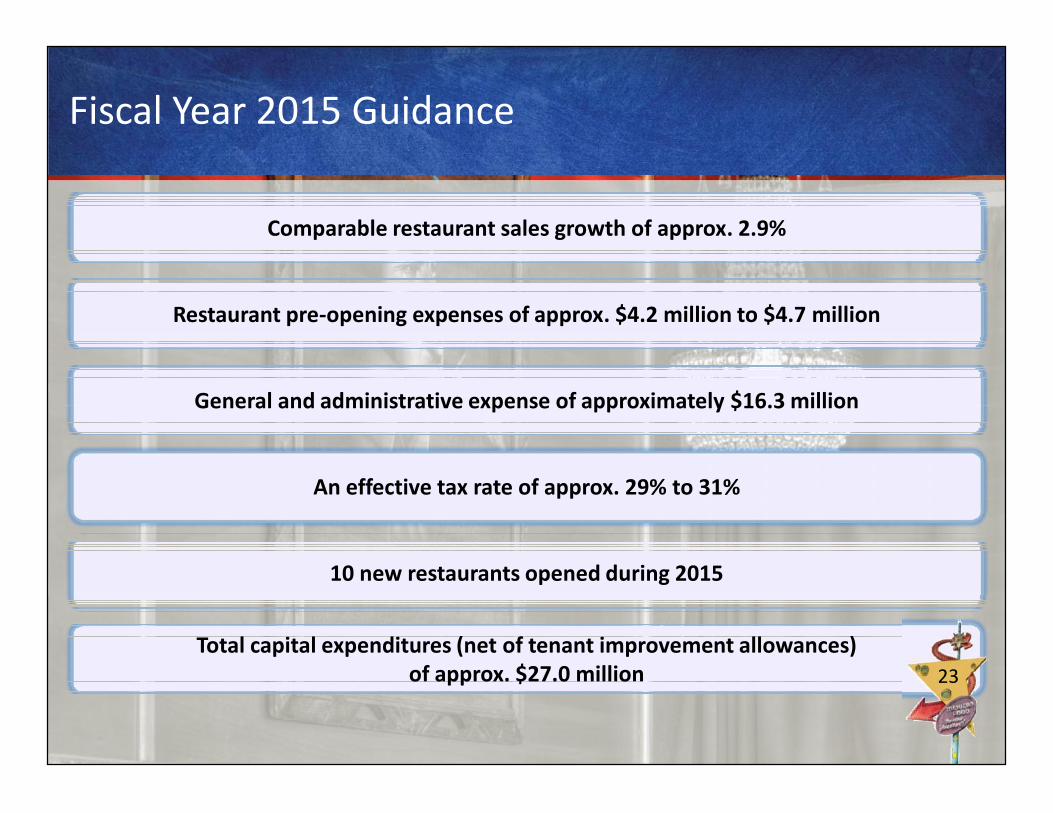
Fiscal Year 2015 Guidance
Restaurant pre-opening expenses of approx. $4.2 million to $4.7 million
General and administrative expense of approximately $16.3 million
Comparable restaurant sales growth of approx. 2.9%
23
An effective tax rate of approx. 29% to 31%
10 new restaurants opened during 2015
General and administrative expense of approximately $16.3 million
Total capital expenditures (net of tenant improvement allowances)of approx. $27.0 million 23
Appendix
24
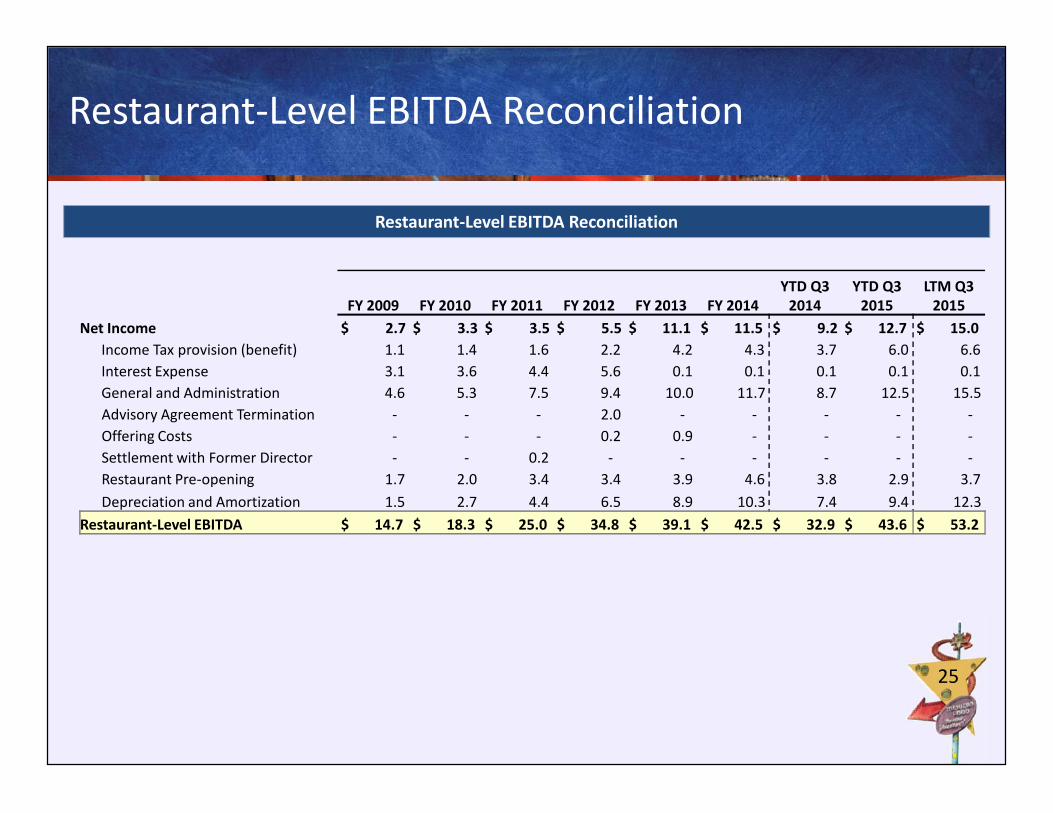
Restaurant-Level EBITDA Reconciliation
Restaurant-Level EBITDA Reconciliation
FY 2009 FY 2010 FY 2011 FY 2012 FY 2013 FY 2014YTD Q3
2014YTD Q3
2015LTM Q3
2015Net Income $ 2.7 $ 3.3 $ 3.5 $ 5.5 $ 11.1 $ 11.5 $ 9.2 $ 12.7 $ 15.0
Income Tax provision (benefit) 1.1 1.4 1.6 2.2 4.2 4.3 3.7 6.0 6.6Interest Expense 3.1 3.6 4.4 5.6 0.1 0.1 0.1 0.1 0.1General and Administration 4.6 5.3 7.5 9.4 10.0 11.7 8.7 12.5 15.5Advisory Agreement Termination - - - 2.0 - - - - -
25
Advisory Agreement Termination - - - 2.0 - - - - -Offering Costs - - - 0.2 0.9 - - - -Settlement with Former Director - - 0.2 - - - - - -Restaurant Pre-opening 1.7 2.0 3.4 3.4 3.9 4.6 3.8 2.9 3.7Depreciation and Amortization 1.5 2.7 4.4 6.5 8.9 10.3 7.4 9.4 12.3
Restaurant-Level EBITDA $ 14.7 $ 18.3 $ 25.0 $ 34.8 $ 39.1 $ 42.5 $ 32.9 $ 43.6 $ 53.2

Adjusted EBITDA Reconciliation
Adjusted EBITDA Reconciliation
FY 2009 FY 2010 FY 2011 FY 2012 FY 2013 FY 2014YTD Q3
2014YTD Q3
2015LTM Q3
2015Net Income 2.7$ 3.3$ 3.5$ 5.5$ 11.1$ 11.5$ 9.2$ 12.7$ 15.0$
Income Tax provision (benefit) 1.1 1.4 1.6 2.2 4.2 4.3 3.7 6.0 6.6Interest Expense 3.1 3.6 4.4 5.6 0.1 0.1 0.1 0.1 0.1Depreciation and Amortization 1.5 2.7 4.4 6.5 8.9 10.3 7.4 9.4 12.3
EBITDA 8.4$ 11.0$ 13.9$ 19.8$ 24.3$ 26.2$ 20.4$ 28.2$ 34.0$Deferred Compensation (0.1) - - - - - - - -Management Fees & Expenses 0.4 0.4 0.4 0.1 - - - - -Advisory Agreement Termination - - - 2.0 - - - - -Offering Costs - - - 0.2 0.9 - - - -Settlement with Former Director - - 0.2 - - - - - -Restaurant Pre-opening 1.7 2.0 3.4 3.4 3.9 4.6 3.8 2.9 3.7Special one-time bonus payment - - 1.0 - - - - - -
Adjusted EBITDA 10.3$ 13.4$ 18.9$ 25.5$ 29.1$ 30.8$ 24.2$ 31.1$ 37.7$
26
FY 2009 FY 2010 FY 2011 FY 2012 FY 2013 FY 2014YTD Q3
2014YTD Q3
2015LTM Q3
2015Net Income 2.7$ 3.3$ 3.5$ 5.5$ 11.1$ 11.5$ 9.2$ 12.7$ 15.0$
Income Tax provision (benefit) 1.1 1.4 1.6 2.2 4.2 4.3 3.7 6.0 6.6Interest Expense 3.1 3.6 4.4 5.6 0.1 0.1 0.1 0.1 0.1Depreciation and Amortization 1.5 2.7 4.4 6.5 8.9 10.3 7.4 9.4 12.3
EBITDA 8.4$ 11.0$ 13.9$ 19.8$ 24.3$ 26.2$ 20.4$ 28.2$ 34.0$Deferred Compensation (0.1) - - - - - - - -Management Fees & Expenses 0.4 0.4 0.4 0.1 - - - - -Advisory Agreement Termination - - - 2.0 - - - - -Offering Costs - - - 0.2 0.9 - - - -Settlement with Former Director - - 0.2 - - - - - -Restaurant Pre-opening 1.7 2.0 3.4 3.4 3.9 4.6 3.8 2.9 3.7Special one-time bonus payment - - 1.0 - - - - - -
Adjusted EBITDA 10.3$ 13.4$ 18.9$ 25.5$ 29.1$ 30.8$ 24.2$ 31.1$ 37.7$