Chup1 - a chloroplast movement protein and its interactions
110
Chup1 – a chloroplast movement protein and its interactions
Transcript of Chup1 - a chloroplast movement protein and its interactions

Chup1 – a chloroplast movement protein and
its interactions

Dissertation an der
Fakultät für Biologie der
Ludwig-Maximilians-Universität München
vorgelegt von Serena Schmidt von Braun
München, 2008
II

Erstgutachter: Prof. Dr. Enrico Schleiff Zweitgutachter: Prof. Dr. Manfred Schliwa Eingereicht am: 08.05.2008 Tag der mündlichen Prüfung: 11.07.2008
III

Figure 1 Excerpt from: Böhm JA (1856) Beiträge zur näheren Kenntnis des Chlorophylls. S.B. Akad. Wiss. Wien, Math.-nat. Kl. 22: 479-498
IV

CONTENTS
CONTENTS
1.1 ABSTRACT VII 1.2 ZUSAMMENFASSUNG VIII
2 INTRODUCTION 1 2.1 CHLOROPLAST MOVEMENT 1 2.2 THE SIGNAL 3
2.2.1 The Light Receptors 3 2.2.2 The modulator calcium 5
2.3 THE TRACKS 6 2.4 THE MOTOR FOR MOVEMENT? 8 2.5 COMPONENTS-INVOLVED IN CHLOROPLAST MOVEMENT 10
2.5.1 Chup1 10 2.5.2 Jac1 11 2.5.3 The Pmi family 11
2.6 AIM 13 3 MATERIALS AND METHODS 14
3.1 MATERIALS 14 3.1.1 Chemicals 14 3.1.2 Enzymes and Kits 14 3.1.3 E.coli strains 14 3.1.4 Plant material 15 3.1.5 Oligonucleotides 15 3.1.6 Vectors 15 3.1.7 Antibodies 16 3.1.8 Other material 16 3.1.9 Services 16 3.1.10 Further Instruments and Equipment 16 3.1.11 Bioinformatic tools 16
3.2 METHODS 18 3.2.1 General Methods 18 3.2.2 Molecular Methods 18 3.2.3 Cellular Methods 19 3.2.4 Biochemical Methods 20 3.2.5 Plant physiology 23
4 RESULTS 28 4.1.1 Affymetrix analysis of blue light dependent gene expression in A. thaliana 28
4.2 THE IN VIVO FUNCTION OF CHUP1 34 4.2.1 Confirmation of the T-DNA insertion in chup1 knockout plants 34 4.2.2 White Band Assay 35
4.3 LIGHT REGULATION 36 4.4 THE CHUP1 FAMILY IN PLANTS 38
4.4.1 RACE from Pisum sativum RNA 38 4.4.2 The domain structure of Chup1 39
4.5 LOCALIZATION OF THE CHUP1 PROTEIN 46 4.5.1 Chup1 is localized to plastids 46 4.5.2 Chup1 targeting is defined by the conserved N-terminus 48 4.5.3 The mode of targeting is independent of vesicle transport 50 4.5.4 Targeting of Chup1 to the chloroplast membrane in vitro 52
4.6 CHUP1 INTERACTION WITH ACTIN 53 4.6.1 Expression of Chup1 53 4.6.2 Purification of plant actin 54 4.6.3 Interaction of actin with the outer envelope of chloroplasts 55 4.6.4 Complex formation by Chup1 and actin 56
4.7 CHUP1 PROFILIN INTERACTION 57 4.7.1 Profilin purification and confirmation of functionality 58 4.7.2 Interaction of Chup1 and profilin 59
V

CONTENTS
4.7.3 Interaction of Chup1 and profilin occurs independent of phosphorylation 60 4.7.4 Interaction of Chup1 and profilin in vivo 60 4.7.5 Delimitation of the profilin binding domain in Chup1 61
4.8 INTERPLAY OF ACTIN, PROFILIN AND CHUP1 62 5 DISCUSSION 64
5.1 FUTURE PERSPECTIVES 77 REFERENCES 79 CURRICULUM VITAE 89 PUBLICATIONS 90 ACKNOWLEDGEMENTS 91 EHRENWÖRTLICHE VERSICHERUNG 92 ABBREVIATIONS 93 SUPPLEMENTS 94
VI

ABSTRACT
1.1 Abstract
The molecular mechanisms of light dependent chloroplast movement could for a long time
not be unravelled. But the recent discovery of a mutant deficient in chloroplast movement
sparked new impulses in the field. This study investigates the molecular mechanisms of
chloroplast movement based on the protein Chup1 and the interactions of Chup1 and
cytoskeletal effectors. It is demonstrated that Chup1 is exclusively and directly targeted to the
chloroplast surface in an N-terminus dependent manner.
Analyzing a putative role of Chup1 as a linker between chloroplasts and the cytoskeleton, an
interaction with actin is demonstrated which is independent on the filament status of actin. In
accordance with this, binding of actin to the outer envelope of chloroplasts is demonstrated.
Adding to the understanding of chloroplast movement, it is shown that Chup1 interacts with
profilin. Furthermore, an enhancing effect of Chup1 on the interaction of profilin to actin
could be demonstrated. As profilin is an actin binding protein and a potent modifier of the
polymerisation status of actin filaments, a key role of profilin in chloroplast movement is
suggested. For Chup1, an important role as a linker molecule in bridging chloroplasts to actin
filaments and a regulatory function in actin polymerization is discussed.
The investigation of the global expression profile revealed the effects of light treatment on
chup1 mutant plants and the effects of blue light on wildtype plants. From cluster analysis,
gene products participating in blue-light induced signalling are suggested. Furthermore, it is
suggested, that gene expression is not involved in the regulation of chloroplast movement. A
conclusive model of chloroplast movement can be presented.
VII

ZUSAMMENFASSUNG
1.2 Zusammenfassung
Die molekularen Mechanismen der Chloroplastenbewegung waren für lange Zeit rätselhaft.
Erst die kürzliche Entdeckung einer Mutante, die Defekte in der Chloroplastenbewegung
aufwies, brachte neue Impulse in die Forschergemeinschaft. In dieser Arbeit werden die
molekularen Mechanismen der Chloroplastenbewegung im Zusammenhang mit dem Protein
Chup1 und die Interaktionen von Chup1 mit Zytoskelett - Effektoren untersucht. Dabei wird
gezeigt, dass Chup1, abhängig von einem N-terminalen Signal, ausschließlich und auf
direktem Weg an die Chloroplastenoberfläche geleitet wird. In dieser Arbeit wird die Rolle
von Chup1 als putatives Verbindungsglied zwischen dem Chloroplasten und dem Aktin-
Zytoskelett untersucht. Dabei kann eine Interaktion von Aktin und Chup1 gezeigt werden, die
unabhängig vom Aktin-Filamentstatus ist. In Übereinstimmung hiermit wird gezeigt, dass
Chup1 an die äußere Hüllmembran des Chloroplasten binden kann.
Die Tatsache dass eine Interaktion von Chup1 und Profilin gezeigt werden kann bringt einen
Erkenntnisgewinn für die Regulation der Chloroplastenbewegung. Zudem kann eine
Verstärkung der Interaktion von Aktin und Profilin durch Chup1 nachgewiesen werden. Da
Profilin ein Aktin bindendes Protein ist und darüber hinaus eine zentrale Komponente in der
Aktin-Zytoskelett Dynamik darstellt, wird eine Schlüsselrolle für Profilin in der Regulation
der Chloroplastenbewegung vorgeschlagen. Für Chup1 wird eine wichtige Funktion als
Bindeglied zwischen dem Aktin-Zytoskelett und dem Chloroplasten und eine Rolle in der
Regulation der Aktin-Polymerisation diskutiert. Durch eine Analyse des globalen
Expressionsprofils konnten die Effekte von Starklicht auf die chup1 Mutante und von
Blaulicht auf den Wildtyp untersucht werden. Durch eine Clusteranalyse konnten zudem
Einblicke in die Signalkette der Lichtregulation gewonnen werden. Darüber hinaus wird
postuliert, dass Genexpression keinen Anteil an der Regulation von blaulichtgesteuerten
Signalketten in der Chloroplastenbewegung hat. Abschließend kann ein verbessertes Modell
für die Chloroplastenbewegung vorgeschlagen werden.
VIII

INTRODUCTION
2 Introduction
2.1 Chloroplast Movement
Chloroplasts are semi-autonomous organelles in plant cells that evolved from an ancient
cyanobacterium taken up by a host cell (Sagan 1967, Martin et al 1998, Cavalier-Smith 2000).
The major function of chloroplasts is the conversion of light energy to utilizable energy for
the cell. The importance of chloroplasts is paramount for life that is dependent on biomass
produced with energy from the sun (which is of course most life on earth). Therefore it is
astonishing that the principal mechanisms of chloroplast movement remained a mystery for a
long time. The apparent movement of chloroplasts in response to light per se however, can be
observed with simple instruments. For this reason the research on the phenomenon of the
moving chloroplasts has a history of 150 years. One of the first to publish observations on
chloroplast movement was Böhm in 1856 (Figure 1). He made the observation that the so
called “chlorophyll particles” (chloroplasts) in leaves of Sedum plants could have different
organizations in the cell under different light conditions. The movements that chloroplasts
undergo to take different spatial organizations in variable light are today referred to as
“accumulation movement” under low light and “avoidance movement” under high light
conditions (Wada et al. 2003) (Figure 2). The distribution of chloroplasts in mesophyll cells in
low light conditions is an arrangement at the cell walls perpendicular to the light. Under high
fluence rates the chloroplasts arrange at the walls parallel to the light. In darkness, the
chloroplasts can adopt a third position that varies among different species (Inoue and Shibata,
1974), depends on the growth conditions (Trojan and Gabrys, 1996) and can be an
intermediate form or an accumulation at the bottom of the cell. This positioning is termed
dark positioning or dark accumulation (Suetsugu et al. 2005b).
Light is not the only trigger for chloroplast movement, other triggers for movement have been
found in fern (Adiantum capillus-veneris). The chloroplasts in this species react to mechano-
stimulation and wounding (Sato et al. 1999).
1

INTRODUCTION
Figure 2 Chloroplast distribution under different light conditions. A Chloroplasts accumulate under low light conditions at the periclinial walls to gather more light. B Chloroplasts undergo avoidance movement under high light conditions and distribute at the anticlinial walls to avoid high light. The high light distribution of chloroplasts allows them to avoid photodamage, while the low light distribution enables them to gather light efficiently for photosynthesis.
The physiological reason for chloroplast arrangements under different light conditions was
early proposed to be the optimization of photosynthesis (Zurzycki et al. 1955). The light
absorption would thus be maximized by the low light arrangement of chloroplasts in light
conditions when the photon flux is below the saturation point of the photosystems. Vice versa,
the photosystems are protected from photodamage in high light by the arrangement at the
anticlinial walls, where mutual shading is optimized (Zurzycki 1957, Park et al 1996). This
hypothesis was confirmed 2002 by Kasahara and colleagues, as chloroplasts in mutant plants,
that could not perform chloroplast movement in high light were more sensitive to
photodamage than wild type plants.
In the past, other reasons for chloroplast movement were discussed as well, like altered CO2
diffusion, but no evidence for these hypotheses could be presented so far (e.g. Gorton et al.
2003).
Chloroplast movement thus is an adaptation to light in between short term regulation of the
rate of photosynthesis - e.g. by phosphorylation/degradation - and long term photoprotection
mechanisms like reduction of grana thylakoids or transcription control.
2

INTRODUCTION
2.2 The Signal
2.2.1 The Light Receptors
Early on it was clear that light itself is the signal. More specifically, blue light induces the
relocation reaction of chloroplasts. This is true for most plants (Sato et al. 2000). Exceptions
are several cryptogams (the algae, fern and moss Mougeotia, Adiantum, and Mesotaenium)
however, where red light together with blue light is used for the regulation of directional
chloroplast movement (Wada et al. 1993). The red light receptor phytochrome has been
demonstrated to function as a light receptor for chloroplast movement in algae (Haupt et al.
1969), mosses (Sato et al. 2001), ferns (Yatsuhashi 1996) and in the aquatic angiosperm
Vallisneria (Dong et al. 1995). To some effect, red light can also slightly modulate the blue
light induced chloroplast movement in other plants (investigated in Arabidopsis, Kagawa and
Wada 2000, DeBlasio et al. 2005). The response to red in contrast to blue light might reflect
the shifting of light requirements of the photosystems (see Schmidt von Braun and Schleiff
2007).
The search for a flavoprotein began as it became clear that blue light (390–500 nm) and
ultraviolet-A (320–390 nm) light was the trigger for chloroplast movement and blue light
induced morphological changes in most plants. Flavoproteins were the favoured candidates
because the action spectrum of phototropism and chloroplast movement closely resembled the
excitation spectrum of flavoproteins (Briggs and Christie 2002).
This led to the discovery of a new family of photoreceptors, the so called phototropins
(Liscum and Briggs 1995, Huala et al. 1997, Christie et al. 1999). Phototropins are the blue
light sensitive receptors that convey the signal for the light-induced movements of
chloroplasts (Jarillo et al. 2001, Kagawa et al. 2001, Sakai et al. 2001). They additionally
mediate phototropism (Huala et al. 1997, Liscum and Briggs, 1995), blue-light-induced
stomatal opening (Kinoshita et al. 2001) and other blue light dependent reactions like the
rapid inhibition of hypocotyl growth (Folta and Spalding, 2001).
Two phototropins have been identified in Arabidopsis to date: Phot1 and Phot2 (former
names NPH1 and NPL1) and subsequently been found in other plants. They differ in the
sensitivities to blue light: Phot1 being susceptible to lower fluence rates than Phot2 (Kagawa
et al. 2001, Jarillo et al. 2001, Sakai et al. 2001). Phot1 mediates accumulation over a broad
fluence range of light (from 0.4 to 100 µmol), whereas Phot2 mediates accumulation at low
fluence at a higher rate than Phot1 (2 to 16 µmol) and avoidance at high fluence rates (32 and
3

INTRODUCTION
100 µmol) in mesophyll cells (all figures for blue light (390-500 nm), Harada and Shimazaki
2007). This explains the requirement of Phot1 in the accumulation response and Phot2 in both
accumulation and avoidance response.
The structure of the phototropins comprises a serine/threonine kinase in the C-terminal part of
the protein and two domains found in signalling proteins: the light, oxygen or voltage (LOV)
domain (Huala et al. 1997). The LOV domains function as the binding site for two flavin
mononucleotide (FMN) chromophores (Christie et al. 1999, Sakai et al. 2001). The FMN is
non-covalently bound in the dark, but forms an adduct with the LOV domain in blue light
(Salomon et al. 2000). This is thought to activate the kinase domain by a structural change in
the protein through the release of the binding of the LOV2 domain to the kinase domain in
light (Matsuoka and Tokutomi, 2005). The Phot2 protein is slightly shorter than Phot1
(Briggs et al. 2001) but what actually is responsible for the difference in light sensitivity is not
known yet. The phototropins can undergo autophosphorylation upon light reception.
Phosphorylation of other substrates by the kinase domain has not been detected so far, but
seems quite likely (see Discussion).
In Adiantum as well as in Mougeotia - both showing chloroplast movement in response to
blue and red light - a chimeric photoreceptor resulting from gene fusion between the N-
terminus of the red light receptor phytochrome and a phototropin was found which was
termed neochrome, and is responsible for chloroplast movement in these organisms (Nozue et
al. 1998, Suetsugu et al. 2005a).
Both phototropins are localized at the plasma membrane (Christie et al. 2002, Harada et al.
2003). Phot1 was also seen to be localized in part in the cytoplasm during blue light
illumination (Sakamoto and Briggs, 2002), the consequence of the relocalization was not
detected. In 2006 it was reported by Kong et al. that Phot2 relocalizes from the plasma
membrane to the Golgi apparatus upon blue light illumination. The kinase domain was found
to be essential for the relocalization. An implication for signal transduction was concluded
from this observation (see Discussion) and even a chloroplast localization is suggested
(Harada and Shimazaki 2007; Weber, Düsseldorf, personal communication). However, the
consequence of the delocalization of Phot1 and Phot2 from the plasma membrane remains to
be studied.
4

INTRODUCTION
2.2.2 The modulator calcium
Upon blue light illumination, a phototropin-mediated increase in calcium levels in the
cytoplasm has been reported (Baum et al. 1999, Babourina et al. 2002, Stoelzle et al. 2003). In
line, it was shown that calcium participates as modulator downstream of phototropin signal
transduction in chloroplast movement with different intensities in high- and low light (Harada
et al. 2003). In the case of chloroplast movement, unlike the situation in phototropism (Baum
et al. 1999), calcium was reported to be released from internal stores and not by influx from
the apoplast (Tlalka and Gabrys 1993, Tlalka and Fricker 1999, Sato et al. 2001, Stoelzle et
al. 2003). A Phot2 dependent calcium release from internal stores (like for instance the ER,
the vacuole or the Golgi) has been concluded from calcium channel inhibitor studies and
inhibition of phospholipase C (which can induce calcium release (see Discussion)) in
phototropin mutants (Harada et al. 2003). For Phot1 however, which mediates calcium influx
from the apoplast, as found by mutant and inhibitor studies (Baum et al. 1999), to date no
influence in intracellular calcium release has been found. The controversy is discussed by
Harada et al. (2003) who proposed a Phot1 mediated modulation of Phot2 induced calcium
increase from internal stores. The differentiation between accumulation in low light and
avoidance in high light is accomplished by the different increases in calcium concentration on
one hand, by the possible amplification of Phot2-induced signalling by Phot1 on the other
hand and also very likely by the relocation of Phot2 to the Golgi in strong light. In the latter
case Phot2 is possibly inducing intracellular Ca2+ release that could provide a different Ca2+
signature in strong light. Furthermore a direct involvement of the chloroplast in signalling is
conceivable (see Discussion).
The differentiation for the signalling downstream of phototropins to result in either
chloroplast movement, phototropism or other blue light induced changes, could equally be the
result of the release of Ca2+ from different sources that produce different patterns or “Ca2+
signatures” in the cytosol (Allen and Schroeder 2001, Sanders et al. 2002, Harada and
Shimazaki 2007) and interact with calcium effectors such as calmodulin or other calcium
binding proteins.
Downstream interactors with phototropins have been identified yet only in connection with
phototropism and stomata opening. In Vicia faba, the protein VfPip with homology to a
dynein light chain was identified to interact with Phot1, and was found to interact with
microtubules in guard cells. It has been concluded that VfPip is involved in blue-light induced
stomata opening (Emi et al 2005). The two proteins identified so far in Arabidopsis are Rpt2
and Nph3 and belong to a family of novel plant specific proteins (Sakai et al. 2000,
5

INTRODUCTION
Motchoulski and Liscum 1999). Rpt2 forms a complex with Phot1 in vivo and both have
putative phosphorylation sites, a nuclear localization signal, a BTB/POZ domain, and a
coiled-coil domain. Another protein family interacting with Phot1 in phototropin signalling
are the Pks proteins (Pks1-4). They could function together with Phot1 and Nph3 to mediate
phototropism (Lariguet et al. 2006), as Pks1 is forming a complex with Phot1 and Nhp3. Rpt2
and Nph3 proteins are not involved in signal transduction leading to chloroplast movement, as
demonstrated by mutant studies (Inada et al. 2004). The Pks mutants were not tested yet but
seem to be predominantly involved in hypocotyl curvature.
From the signal to the actual movement a further component has to be considered - the
mechanism of movement which is relying on tracks.
2.3 The Tracks
Plant cells contain two types of cytoskeletal elements, microtubuli and microfilaments, which
besides maintaining a solid support also perform numerous other functions including
signalling, transport and cell division. Microtubuli are built from tubulin subunits (α- and β-
tubulin, with nine and six isoforms in Arabidopsis) and microfilaments from actin monomers
(eight functional isoforms in Arabidopsis, Meagher et al. 1999). The search for intermediate
filaments as found in animal cells is still ongoing. Intermediate filaments comprise a family of
structurally related alpha-helical proteins with globular tails that form non-polar filament
structures. Putative candidates for intermediate filaments in plants are for instance the
Filament-like plant proteins (FPP), that seem to be structurally related to animal nuclear
lamins, and other large coiled-coil containing proteins (Gindullis et al. 2002).
Plant actins were identified more easily, as plant actin isoforms are typically showing 83 to
88% identity to actins of a wide range of species including animals. This high degree of
conservation is interpreted to be a result of the fact that almost the whole surface of actin is
involved in protein–protein interactions (Meagher et al. 1999). Actin is involved in many
different cellular processes like establishing cell polarity, division plane determination,
preprogramming of development and cell wall deposition, cell elongation, tip growth,
transmembrane transport and positioning of receptors, mRNA transport within the cell, RNA
polymerase I transcription and organelle movement (e.g. Staiger and Lloyd 1991, Meagher et
al. 1999, Philimonenko et al. 2004).
6

INTRODUCTION
It was hypothesized early that chloroplasts use the cytoskeleton to move in the cell. Boresch
postulated a model of “pulling fibres” in 1914, which could be interpreted as the first
explanation of the involvement of cytoskeletal elements in chloroplast movement.
Proof for the conception of cytoskeletal elements taking part in chloroplast movement was
gained by inhibitor studies. In most investigated plants, the mechanism of chloroplast
movement is relying on actin filaments, as actin antagonists like cytochalasin-D, m-
maleimidobenzoic acid or N-hydroxysuccinimide ester inhibit chloroplast movement (in the
green algae Mougeotia (Wagner et al. 1972), the fern A. capillus-veneris (Kadota and Wada
1992), mosses (Sato et al. 2001), Lemna triscula, (Malec et al. 1996), Alocasia macrorrhiza
Gorton et al. 1999) and angiosperms (Witztum and Parthasarathy 1985, Izutani et al. 1990,
Tlalka and Gabrys 1993, Kandasamy and Meagher 1999, A.thaliana).
No inhibitory effect on chloroplast movement was found however with microtubule drugs.
This is true for most plant species, except for the situation in the mosses F. hygrometrica and
P. patens, where microtubules are also participating in chloroplast movement (Wacker et al.
1988, Quader and Schnepf 1989). Interestingly, in P. patens - making the movement
mechanism different from that of dicotelydons - red light induced chloroplast movement and
rapid longitudinal movement in the dark is relying on microtubules only, whereas blue light
induced movement occurs on both, microtubules and microfilaments (Sato et al. 2001).
Microscopic observations with fluorescently stained actin revealed that chloroplasts are
surrounded by circular actin structures which appear after the end of accumulation movement
and before the start of the avoidance movement in fern (Adiantum capillus-veneris) (Kadota
and Wada 1992). These actin structures were also observed by Dong et al. (1998) in
Vallisneria gigantea, who described a honeycomb array surrounding the chloroplasts, which
was resistant to centrifugal force. This is evidence for an anchoring of chloroplasts in position
at times when no light-induced movement occurs. A more detailed observation of fine basket-
like actin structures closely surrounding chloroplasts was made by Kandasamy and Meagher
(1999) and Kwok and Hanson (2004). They even observed connections between the fine actin
filaments on the chloroplast surface and thicker actin filaments extending to strong
microfilament bundles. The latter became more prominent on illumination and extended
throughout the cell, presumably to form the tracks on which chloroplast movement could take
place.
Actin rearrangement after illumination was also observed by Sakurai et al. (2005) in the
aquatic angiosperm Vallisneria gigantea. Here, short bundles of actin were observed in the
7

INTRODUCTION
vicinity of chloroplasts in dark adapted cells that disappeared under illumination, while long
straight bundles appeared at the same time in the cell. The reorganization was completed after
10 min which coincided with the time of the onset of movement (Sakurai et al. 2005).
The dynamic nature of the actin cytoskeleton can be made understandable when realizing that
most actin filaments have half-lives of approximately 1 min (Theriot and Mitchison 1991) and
most cross-links between filaments last less than 1 sec (Wachsstock et al. 1994). These
dynamics are possible due to the architecture of the filament which is built from actin
monomers. A large pool of monomeric G-actin is present in the cell at the same time as the
filamentous F-actin. This is made possible by a large number of actin binding proteins that
can modify the polymerisation and depolymerisation speed. Actin filaments have a polarised
structure. This means that monomer addition to the filament preferentially takes place at the
plus (or barbed end) while monomer loss is happening at the minus (or pointed) end. A rapid
restructuring of the filament is done with the help of actin binding proteins, for instance by
capping the minus end to avoid monomer loss, by accelerating monomer addition at the plus
end, or by maintaining a pool of monomeric actin (e.g. dos Remedios et al. 2003).
A dynamic cytoskeleton thus is a precondition for chloroplast movement. The speed of
moving chloroplasts was found to be in a range of 1-1.5 µm/min. Interestingly, the velocity of
movement is fluence rate dependent (Kagawa and Wada 2004) and directly linked to the
activity of the Phot2 receptor, as the velocity of avoidance movement in heterozygous Phot2
mutants was half of that in wild type (Suetsugu and Wada 2007).
2.4 The motor for movement?
When thinking of an actin-based chloroplast movement, the relation to the actin-associated
motor protein myosin is not far from crossing the mind. In Arabidopsis the myosin family is
made up of the classes VIII, XI and X and contains 17 members. Interestingly, the myosins of
class VIII and XI are unique for the plant kingdom (Reddy 2001). As different myosins have
different specificities for their cargoes (e.g. organelles) (e.g. Karcher et al. 2002), this fact
might be relevant for chloroplast movement.
Indeed, an interaction of putative myosins with chloroplasts as detected by
immunolocalization was suggested in a number of plant species (La Claire 1991, La Claire et
8

INTRODUCTION
al. 1995, Liebe and Menzel, 1995). More specifically, a myosin of the class XI was found to
be associated with the surface of maize chloroplasts (Wang and Pesacreta 2004). In a recent
analysis of fusion proteins of six A. thaliana class XI myosin tails to YFP, a number of
organellar localisations of the myosin fusions was detected, but yet no chloroplast localisation
(Reisen and Hanson, 2007). Additionally, an influence of myosin XI-K of Nicotiana
benthamiana on Golgi stack trafficking, mitochondria- and peroxisome movement was
observed, but no influence of six other tested myosins on light induced chloroplast movement
(Avisar et al. 2008). As there are still seven experimentally untested myosin candidates, the
search has to go on.
Different modes of movement have to be considered for chloroplasts. The force for movement
could be generated directly between the chloroplast and actin or with the help of linker
proteins that connect myosin to the chloroplast. In another scenario, the force of movement
could be generated between actin filaments (similar to the situation in muscles) connected to
the chloroplast and actin filament tracks (Figure 3).
Recently, it was found that myosins are involved only in accumulation movement but not in
avoidance movement in Arabidopsis. This was shown by the inhibition of myosins with three
different drugs (Paves and Truve 2007). The implication of this could be that the avoidance
movement could possibly rely only on the force generated through actin assembly itself. This
could imply a third type of movement conceivable for the chloroplast. An example for this
kind of movement can be found for the intracellular pathogen Listeria monocytogenes, which
moves by the pushing force resulting from polymerizing actin, forming the so called “comet
tails” in its wake (Geese et al. 2000). Comet tails however are not observed in the vicinity of
chloroplasts, but the principle could be the same. For vesicle movement, recently a
polymerization dependent movement has been identified (Merrifield et al. 1999, May et al.
2000, Rozelle et al. 2000). To exert a pushing force, polymerization has to take place on short
actin filaments (30-150 nm) longer filaments tend to bend, unless bundles of 10-30 filaments
are formed that build a stiffer structure (van der Honing et al. 2007).
The presence of short actin bundles has been observed on illuminated chloroplasts (see 2.3)
which could thus either function in anchoring (as discussed) or in movement itself.
9

INTRODUCTION
Figure 3 Modes of Movement. Several types of movement mechanistics for chloroplasts are conceivable. Three chloroplasts are depicted with different movement mechanistics. On the upper chloroplast, propulsion force is generated by motor molecules (red) which act between actin filaments, the tethering of the chloroplast to actin is accomplished through linker molecules (blue). For the middle chloroplast, a direct propulsion force is displayed, which is generated directly by actin polymerisation at the chloroplast surface. The lower chloroplast moves by a direct interaction of motors with the chloroplast envelope.
2.5 Components-involved in chloroplast movement
2.5.1 Chup1
In 2002, a mutant was discovered – the first of its kind (apart from photoreceptor mutants) -
that was defective in chloroplast movement (Kasahara et al. 2002). The mutant was termed
chup1 for chloroplast unusual positioning 1. In the mutant, chloroplast movement as
detectable in wild type was not observed. However, a distribution of chloroplasts on the
bottom of the cells was prevailing in all light conditions. This distribution was not due to
gravity sedimentation, as the position of the chloroplasts was not altered by an upside-down
incubation of the leaves. Peroxisomes were observed to be positioned in the same way as
chloroplasts in chup1 mutants. This is, however, most likely due to the typical close
association of chloroplasts and peroxisomes (Mano et al. 2002) and not due to the lack of the
Chup1 protein.
By labelling actin filaments with mouse talin-GPF in ∆chup1 plants, according to Oikawa et
al. (2003), no apparent change in the cytoskeleton compared to wild type cells was detected.
10

INTRODUCTION
A study from Sheahan et al. (2004) was pointing out however, that the data presented was
flawed by artefacts probably resulting from labelling with talin-GFP, as this is now
considered to alter the binding capabilities of actin and cause artificial aggregation of actin. A
more detailed observation is needed in future.
Chup1 is a 112 kD protein with several predicted domains. As will be examined in more
detail below, Chup1 comprises a hydrophobic N-terminus, a large coiled-coil domain, two
putative leucine zippers, a putative actin binding motif and a proline-rich region.
2.5.2 Jac1
Jac1 (J domain protein required for chloroplast accumulation response) is a cytosolic protein
and jac1 mutant plants were found to have defects in the chloroplast accumulation response
and in dark-positioning, but were functional in the avoidance response, even though the
avoidance movement already set in under a lower fluence rate. Jac1 is therefore indispensable
for the accumulation response in low light and in darkness, but not for the avoidance response
in high light. (Suetsugu et al. 2005b)
The Jac1 J-domain resembles that of auxilin (e.g. Gall et al. 2000), a clathrin uncoating factor
functioning in vesicle transport, but such function could yet not be assigned for Jac1. A
function in vesicular traffic could be conceivable since Phot2, a member of the signal
transduction machinery relocalizes to the Golgi-apparatus upon illumination with blue light
(Kong et al. 2006). Developmental defects as would be expected for an auxilin mutant could
not be observed in the jac1 mutant (e.g. Gall et al. 2000). The authors suggest a possible role
for Jac1 in chloroplast movement as a cytosolic signal transducer between phototropins and
chloroplasts or so far unidentified proteins (Suetsugu et al. 2005b). Interestingly, Jac1 also
functions in Al-uptake in roots. An inhibition of endocytosis was suggested from microscopic
observations and a putative function in clathrin-uncoating in the endocytosis process was
discussed (Ezaki et al. 2007). A relevance of this function for chloroplast movement has to be
investigated.
2.5.3 The Pmi family
Three other mutants with chloroplast movement defects have been published so far by
DeBlasio and colleagues (2005) and Luesse et al. (2006). All have been termed plastid
movement impaired (Pmi) and display aberrant chloroplast positioning but do not all fall into
the same phenotypic groups. Pmi1 mutants are affected in chloroplast movement under all
fluence rates, but do not show the sedimented chloroplast phenotype of ∆chup1. Pmi1
11

INTRODUCTION
contains a coiled-coil region at the C-terminus and a rice ortholog was shown to interact with
a C2 calcium binding protein in a Yeast Two Hybrid Screen (Cooper et al 2003). A function
of Pmi1 in blue-light induced calcium-signalling awaits its investigation.
The pmi2 mutant displayed attenuated chloroplast movements under medium and high light
intensities. The sensitivity to light was observed to be shifted to higher fluence rates in the
mutant. Pmi2 is composed of a long coiled-coil region and a putative P-loop (ATP -binding
motif A) and is localized in the cytoplasm. Strangely, both, Pmi1 and Pmi2, are expressed in
roots as well as in leaves (Luesse et al. 2006).
Pmi15 is similar to Pmi2 but lacks the P loop. The mutant of pmi15 displayed attenuated
chloroplast movement in high-light conditions. Pmi2 and pmi15 double mutants show a
change in chloroplast movement under all light intensities suggesting a parallel action of the
two gene products. Based on the observation of similar phenotypic behaviour of pim2, pmi15
and phot2, the authors suggest that Pim2 and Pim15 participate in the Phot2 mediated signal
cascade (Luesse et al. 2006).
12

INTRODUCTION
2.6 Aim
The molecular mechanisms of chloroplast movement and its regulation are poorly understood.
The discovery of the chup1 mutant and the implications for chloroplast movement led the way
to a better understanding. So far most investigations focussed on the phenotypic
characterization of chloroplast movement. The aim of this work was to biochemically
characterize the protein Chup1. Chup1 was known to be involved in chloroplast movement as
shown by phenotypic analysis of the mutant. A further characterization on the whole was
lacking. As regulation by light is crucial for chloroplast movement, an investigation of global
gene expression and a link to signalling pathways was explored. Furthermore, the profile of
Chup1 in the context of global light expression was targeted. One goal was to identify the
exact nature of the translocation signal for Chup1 localization and to identify the translocation
pathway, and to explore a putative link to the secretory pathway. To identify the molecular
mechanism of chloroplast movement, the interaction of Chup1 with the actin cytoskeleton and
its modifiers was set to be explored. In chloroplast movement, the way of action of Chup1
was aimed to be unravelled, to place Chup1 in a new model of light regulated chloroplast
movement.
13

MATERIALS AND METHODS
3 Materials and Methods
3.1 Materials
3.1.1 Chemicals
The chemicals in this study were of analytical grade or better and purchased from Sigma-
Aldrich/Fluka (München, Germany), Merk (Darmstadt, Germany), and Roth (Karlsruhe,
Germany). Poly-L-proline (MW 10000-30000) was purchased from Sigma. Other materials
include MitoTracker Orange CMTMRos from Molecular Probes (Leiden, The Netherlands),
[35S] Methionine (10µCi/µl) from Amersham Biosciences (Freiburg, Germany) and dansyl
chloride [5 (dimethylamino) naphtalene-1-sulfonyl chloride] from Fluka.
3.1.2 Enzymes and Kits
Restriction enzymes, T4-Ligase, calf intestine alkaline phosphatase (CIAP) were purchased
from Fermentas (St.Leon-Rot, Germany), DNaseI and Complete Protease Inhibitor Cocktail
Tablets from Roche (Mannheim, Germany), Trypsin and Cellulase from Sigma-Aldrich,
Macerozyme Onozuka-RS (Yakult, Japan), PlantRNeasy Kit from Qiagen (Hilden, Germany),
Gateway LR and BP Clonase and SuperScriptIII First Strand Synthesis from Invitrogen
(Karlsruhe, Germany), Triple Master PCR System and FastPlasmid Mini Kit from Eppendorf
(Hamburg, Germany), Nucleobond AX Nucleospin and Nucleospin Extract II kit from
Machery-Nagel (Düren, Germany), SMART™ RACE cDNA Amplification Kit (Clontech,
Mountain View, CA, USA), Bio-Rad Protein Assay Kit (Bio-Rad Laboratories, München,
Germany)
3.1.3 E.coli strains
DH5α (DE3) from Invitrogen (Karlsruhe, Germany) and TOP10 were used for
transformation and amplification of vector DNA.
BL21 (DE3) pLysS from Invitrogen (Karlsruhe, Germany) was used for recombinant
expression. pLysS constitutively expresses low levels of T7 lysozyme, and thus inhibits basal
levels of T7 RNA polymerase, which results in a reduction of basal expression of recombinant
genes.
BL21 (DE3) Rosetta (Novagen, Madison, WI, USA) encoding rare tRNAs.
BL21 (DE3) pMICO encoding 3 rare tRNAs and T7 lysozyme (kindly provided by Dr Ian
Menz, Cinquin et al., 2001).
14

MATERIALS AND METHODS
3.1.4 Plant material
Pisum sativum (variety “Arvika”) seeds were obtained from Bayerische Futtersaatbau GmbH
(Ismaning, Germany). Arabidopsis thaliana ecotype Col-0 seeds were obtained from Lehle
Seeds (Round Rock, USA). The T-DNA insertion line SALK_129128 resulting in a knock-
out of CHUP1 (At3g25690, ecotype Columbia) was obtained from NASC Stock centre
(University of Nottingham, UK, Alonso et al. 2003).
3.1.5 Oligonucleotides
Oligonucleotides used in PCR were synthesized by Operon (Köln, Germany):
Table 1 Oligonucleotides used in this study
Chup1 LP tggtacccctgaaacaccgaa SALK line Chup1 Chup1 RP ccttgtgtctccacatccgct SALK line Chup1 Lba1 tggttcacgtagtgggccatcg T-DNA left border primer Chup1_NheI_fw ggttaagctagctcatgtttgtccggatagggtttg Chup1 GFP fusion Chup1_SalI_rev aattccgtcgacagtttacagattcttcttcattg Chup1 GFP fusion Chup1_dN_Nhe fw ttaaccgctagcgcatgtccaaaccaagcaaaccatcagat ∆N-Chup1 GFP fusion Fim_NheI_fw ggttaagctagcatgcctcttgaaagagctgaattggttc fABD2 atFIM1 RFP fusion Fim_SalI_rev aattccgtcgactttcgatggatgcttgctctgagac fABD2 atFIM1 RFP fusion Pro_NheI_fw ggttaagctagcatgtcttggcaatcatacgtcgat atPRF2 GFP fusion Pro_SalI_rev aattccgtcgactgagttcagactcgataaggtaatc atPRF2 GFP fusion Chup1 consens1 fw cactttgattggcctga psChup1 RACE Chup1 consens2 fw tacgggaagcatcttttga psChup1 RACE Chup1 Erbse 1010 rev tttgaagtccttccacttgctttg psChup1 RACE Chup1 Erbse 1360 rev ctcaaagatgattctagtgctctttca psChup1 RACE psChup1 2230 rev gtatccttctttgcctcccgtttcatc psChup1 RACE psChup1 1470 fw agctgatgataaggaatgccagtgatagtg psChup1 RACE Chup1 Erbse 2430 fw ctggctagatgaagaactttccttc psChup1 RACE RACE UPM ctaatacgactcactatagggc RACE Primer Clontech
3.1.6 Vectors
The vectors used in this study were the expression vector pDEST17 (Invitrogen) containing a
His-tag C-terminal to the cloning site, and a GFP vector for expression of GFP-fusion proteins
under a S35 promoter in plants, the pOL GFP-S65C vector (Peeters et al. 2000). The same
vector was also available as RFP construct (pOL RFP). The Golgi marker ST-GFP (rat sialyl
transferase fused to GFP, Boevink et al. 1998) was kindly provided by Prof. Chris Hawes
from Oxford Brookes University. The constructs cloned from these vectors are described in
3.2.2.2.
15
MATERIALS AND METHODS
3.1.7 Antibodies
Antibodies against Toc34 were raised by Pineda Antibody Service (Berlin, Germany). Anti-
profilin (from mouse) and anti-actin (from rabbit) were obtained from Sigma. The secondary
antibodies goat anti-rabbit or anti-mouse alkaline phosphatase conjugated were obtained from
Sigma.
3.1.8 Other material
Ni-NTA Superflow sepharose was purchased from Qiagen (Hilden, Germany), Nitrocellulose
Protran BA-S83 membranes from Schleicher & Schüll (Dassel, Germany), CNBr-activated
Sepharose 4B and nProteinA-Sepharose CL-4B and HiTrap Desalting column from
Amersham Biosciences (Freiburg, Germany), Wheat Germ Extract from Promega
(Mannheim, Germany), Fuji film imaging plates from Fuji (Düsseldorf, Germany),
Affymetrix ATH1 arabidopsis genome chip from Affymetrix (High Wycombe, United
Kingdom), vermiculite was obtained from Dämmstoff-Fabrik Klein GmbH (Zellertal,
Germany)
3.1.9 Services
DNA Sequencing was performed with the BigDye Terminator v3.1 Cycle Sequencing Kit
from Applied Biosystems (Darmstadt, Germany) on an ABI 3730 by the Sequencing Service
Department Biology (München, Germany).
3.1.10 Further Instruments and Equipment
Instruments or equipment used in this study include: BioPhotometer (Eppendorf),
Phosphoimager FLA-3000 (Fuji), Ultrafiltration Cell 8050 (Amicon, Beverly, MA, USA),
Leica TCS SP5 laser scanning confocal microscope (Leica, Heidelberg, Germany), LS55
Luminescence Spectrometer (Perkin Elmer, Waltham, MA, USA). Light for the White Band
Assay and microarray experiments was provided by a cool metal halide lamp Olympus ILH-
2A (Olympus, Hamburg, Germany) equipped with a liquid light conductor (5-1800, Olympus)
and light intensity was measured with an Almemo FLA603PS5 light sensor (Ahlborn,
Holzkirchen, Germany).
3.1.11 Bioinformatic tools
Analysis of Affymetrix expression data was performed with the Affymetrix software package
MAS for white light dependent expression delivering the signal intensity and the detection P-
16

MATERIALS AND METHODS
value and data was processed with Sigma Plot (SPSS). Multiple sequence alignment was
performed with the program MAFFT (Katoh and Toh 2008) and presented with Jalview
(www.jalview.org, Clamp et al. 2004). Pattern and motif search was performed with Prosite
(De Castro et al. 2006, http://www.expasy.org/prosite/). Protein parameters (e.g. the pI of
proteins) were calculated with ProtParam (http://au.expasy.org/cgi-bin/protparam). Coiled-
coil analysis was performed with the PCOILS program (http://toolkit.
tuebingen.mpg.de/pcoils, Lupas et al. 1991). The search for sequence similarities in the
databases was performed with the Basic Local Alignment Search Tool, BLAST (Altschul et
al. 1990, http://www.ncbi.nlm.nih.gov/blast/ Blast.cgi). Sequence annotation was performed
with the TAIR 6.0 database (http://www.arabidopsis.org/) in collaboration with Georg
Haberer, MIPS, GSF, Neuherberg).
17
MATERIALS AND METHODS
3.2 Methods
3.2.1 General Methods
Gel electrophoresis of DNA on agarose gels, restriction of DNA, ligation and transformation
of vector DNA into bacterial strains were performed according to standard protocols
(Sambrook et al., 1989). The purification of DNA restriction fragments from agarose gels was
done with the Nucleospin Extract II kit. DNA concentration was measured photometrically at
260 nm (Sambrook et al., 1989). Proteins were separated by SDS-PAGE according to
Laemmli (1970). Protein concentrations were determined by using the Bio-Rad Protein Assay
Kit according to the manufacturer’s recommendations and by absorption measurements at 280
nm as described (Sambrook et al., 1989). SDS-PAGE Gels were stained either by Coomassie
Brilliant Blue R250 or silver-stained as described (Sambrook et al., 1989). Western blotting
(transfer of proteins) was done by semi-dry blotting (Towbin et al., 1979) on nitrocellulose
membranes. The immunodecoration with secondary antibody conjugated with alkaline
phosphatase and detection with NBT/BCIP were performed as described (Sambrook et al.,
1989).
3.2.2 Molecular Methods
3.2.2.1 RNA isolation and cDNA generation
To obtain RNA from plant material, leaf tissue of pea or A. thaliana was processed with the
Plant RNeasy Kit. Subsequently cDNA was synthesized using the SuperScript III Kit with
gene specific reverse primers. To amplify cDNA, a standard PCR (Mullis and Falloona, 1987)
was performed using TripleMaster Polymerase according to the manufacturer’s
recommendations; where necessary restriction enzyme sites were joined to cDNA ends with
the use of the respective oligonucleotides (Table 1).
3.2.2.2 Cloning
The following vectors were constructed for use in this study. The delineated GFP/RFP fusions
are all C-terminal to the gene of interest. To produce GFP fusion constructs, full-length
CHUP1 and ∆N-CHUP1 lacking the N-terminal 75 base pairs (hydrophobic domain), were
fused to GFP via NheI/SalI using the pOL GFP-S65C vector (Peeters et al. 2000). The second
actin binding domain (fABD2) of fimbrin (atFIM1; Sheahan et al. 2004) was fused to RFP via
NheI/SalI into pOL RFP. AtPRF2 (AT4G29350, profilin2) was fused to RFP via NheI/SalI
18

MATERIALS AND METHODS
into pOL RFP. Integration of CHUP1 and CHUP1-CT (C-terminus of CHUP1 from bp 1814-
3015) into the expression vector pDEST17 (Invitrogen) was performed using the Gateway
system (Invitrogen). All constructs were controlled by sequencing.
3.2.2.3 Protein production
Chup1-CT in the pDEST17 vector was expressed in freshly transformed E. coli BL21 (DE3)
pLysS cells. The cultures were induced at an OD600 of 0.6 to 0.8 with 0.5 mM IPTG and
incubated over night at 22 °C. Cells were resuspended in 20 mM Tris/HCl pH 7.0, 150 mM
NaCl and lysed with a French Press. After centrifugation for 20 min at 20000 g the soluble
fraction was purified with NiNTA Superflow matrix according to the manufacturer’s
instructions. Briefly, the soluble fraction was incubated with NiNTA matrix for 30 min at
room temperature, washed with 20 mM Tris/HCl pH 7.0, 5 mM imidazole and eluted with 20
mM Tris/HCl pH 7.0, 500 mM imidazole. To avoid proteolytic degradation, Complete
protease inhibitor without EDTA (1 Tbl./40ml) and 0.3 mM PMSF were added to the buffers.
Chup1-CT was dialysed with the appropriate buffer before use.
3.2.2.4 In vitro transcription/translation
In vitro translation of CHUP1 and radioactive labelling was performed in wheat germ extract
(Promega). A reaction mixture contained 100µl wheat germ extract, 1-3µg CHUP1 DNA in
pDEST17, 6µl TNT reaction buffer (Promega), 4µl T7 Polymerase (Promega), 4µl amino
acid mixture minus methionine (Promega, 1mM), 4-8 µl [35S] methionine (Amersham,
10µCi/µl), 2µl RNase inhibitor (GE Healthcare 40U/µl) and water up to 200µl. The reaction
was incubated at 30°C for 2h. Unincorporated [35S] Met was removed by subjecting the
reaction to a column containing G25 sephadex medium (Pharmacia). The flowthrough and
50µl of the first elution fraction with 10 mM sodium phosphate buffer pH 8.0 was collected.
The translation product was checked by SDS-PAGE analysis and autoradiography by
exposing the dried gels on Fuji film imaging plates for 4-16 h. The signal was detected with a
Phosphoimager FLA-3000 system.
3.2.3 Cellular Methods
3.2.3.1 Protoplast transformation and fluorescent imaging
Protoplast preparation was performed according to the protocol from Yoo et al. (2007).
Mesophyll protoplasts were isolated from 3 to 4 week old A. thaliana leaves and transformed
with 10-20µg DNA. Fluorescent images were taken with a Leica TCS SP5 laser scanning
19

MATERIALS AND METHODS
confocal microscope. For the visualization of mitochondria, protoplasts were stained with 400
nM MitoTracker Orange CMTMRos in buffer W5 (154 mM NaCl, 125 mM CaCl2, 5 mM
KCl, 2 mM MES pH 5.7) for 1 h. For studies with brefeldin A (BFA), protoplasts
immediately after transformation with DNA (with a final concentration of 1.8*105 cells/ml in
500 µl buffer W5) were mixed with a stock of 20 mM BFA prepared in DMSO to a final
concentration of 33 µg/ml (120 nM) and incubated for 24 h in the dark at 16-21°C.
3.2.4 Biochemical Methods
3.2.4.1 Preparation of conjugated CNBr- Sepharose columns
To conjugate proteins or enzymes to sepharose for affinity chromatography, the substances
were coupled to CNBr-Sepharose by following the manufacturer’s protocol. For the
conjugation of DNase I, a ratio of 10mg DNAse I for 2.8 g CNBr-Sepharose was used. For
conjugating poly-L-proline to Sepharose, 150 mg poly-L-proline and 1 g CNBr-Sepharose
was used. The conjugant was dissolved in coupling buffer (0.1 M NaHCO3 pH 8.3, 0.5 M
NaCl) and the coupling reaction was performed with shaking at 4°C over night. Remaining
active groups were blocked after coupling for 2 hours at room temperature with 0.1 M
Tris/HCl pH 8.0. Excess of uncoupled ligand was washed away with five alternating washes
of coupling buffer and sodium-acetate buffer (0.1 M Na-acetate pH 4.0, 0.5 M NaCl).
3.2.4.2 Purification of actin from Pisum sativum
Actin was purified from pea leaf by adapting the protocol from Diaz-Camino and Villanueva
(1999) for the isolation of actin from Phaseolus vulgaris. Leaves from 10-12 day old pea
plants were frozen in liquid nitrogen and ground in a mortar. Buffer A (2mM Tris/HCl pH
8.0, 0.2 mM CaCl2, 0.2 mM ATP, 30 mM sodium phosphate buffer pH 8.0, 1 tablet Complete
Protease Inhibitor/100 ml, 0.25mM DTT and 0.005% NaN3) was added and leaves were
ground for 15 min. The leaf extract was filtered through a paper filter and centrifuged at
20000 g. The supernatant was applied to a DNase I-Sepharose affinity column (see 3.2.4.1),
equilibrated with buffer G (2 mM Tris/HCl pH 8.0, 0.2 mM CaCl2, 0.2 mM ATP, 0.25mM
DTT and 0.005% NaN3). The column was washed with 20 volumes of buffer G plus 0.01%
Triton X-100, 20 volumes of buffer G, 3 volumes of buffer G plus 0.6 M NaCl and 3 volumes
of buffer C (2 mM Tris/HCl pH 8.0, 2 mM EGTA, 0.2 mM ATP, 0.25 mM DTT, 0.005%
NaN3) and 1.5 volumes of buffer G plus 0.75 M urea. The column was eluted with 1.5
20

MATERIALS AND METHODS
volumes of buffer G plus 4 M urea. The eluate was diluted immediately to maintain functional
actin by letting it drop into an excess of 250 ml of buffer G and concentrated in an Amicon
ultrafiltration cell, diluted several times with buffer G and concentrated again.
3.2.4.3 Preparation of monomeric or filamentous actin
For preparing monomeric (G) or filamentous (F) actin, rabbit muscle actin (Sigma) or pea leaf
actin (see 3.2.4.2) was incubated for 1 h in buffer G (2 mM Tris/HCl pH 8.0, 0.2 mM CaCl2,
0.2 mM ATP) or buffer F (5 mM Tris/HCl pH 8.0, 5 mM MgCl2, 0.1 M KCl, 0.5 mM ATP).
The mixture was clarified by centrifugation at 300000 g for 1 h at 4°C. The pellet fraction
containing F-actin and the supernatant fraction containing G-actin were further processed.
3.2.4.4 Binding of proteins to chloroplast outer envelope membranes
3.2.4.4.1 Binding of Chup1 and Chup1-NT to chloroplast outer envelope Outer envelope membranes (OE) were prepared from pea chloroplasts according to (Schleiff
et al. 2003). Translation products of Chup1 and Chup1-NT (see 3.2.2.4) in 10 mM sodium
phosphate buffer pH 8.0 were pre-cleared by centrifugation for 10 min at 256 000 g.
Supernatant fractions were incubated with OE for 10 min at room temperature and centrifuged
for 10 min at 256 000 g. Supernatant and pellet fractions were subjected to SDS-PAGE and
autoradiography.
3.2.4.4.2 Binding of actin to chloroplast outer envelope membranes Outer envelope was subjected to short sonication pulses in buffer G. For proteolytic digestion
of the OE with trypsin, OE was incubated with 1µg/µl trypsin for 2 minutes. The reaction was
stopped with a 10 fold excess of trypsin inhibitor. OE and G-actin were incubated for the
indicated times and centrifuged for 10 min at 35000 g through a 200 mM sucrose cushion in
buffer G. Supernatant and pellet fractions were analyzed by SDS-PAGE and western blotting
using anti-actin antibody.
3.2.4.5 Binding of actin to Chup1
For co-immunoprecipitation of Chup1 with G-actin and actin-antibodies, G-actin was
incubated with radioactively labelled Chup1 protein in buffer G for 30 min and mixed with
anti-actin or control antibody (anti-Toc12) coupled to protein A sepharose (GE Healthcare).
Coupling of antibodies to protein A sepharose was performed for 30 min in buffer G plus
21
MATERIALS AND METHODS
0.3% BSA. After incubation, the sepharose beads were washed with buffer G and buffer G
plus 0.5 M NaCl. Chup1 was eluted from the beads with 0.1 M glycine pH 2.5. The samples
were analyzed by SDS-PAGE and autoradiography. For binding studies of F-actin and Chup1,
F-actin was incubated with pre-cleared (300 000 g, 1h) radioactively labelled Chup1 or
control (Toc34) in buffer F. After centrifugation for 45 min at 300 000 g, supernatant and
pellet fraction were analyzed by SDS-PAGE and autoradiography.
3.2.4.6 Purification of profilin from Pisum sativum and Arabidopsis thaliana
Profilin was purified from P. sativum or A. thaliana leaves by poly-L-proline affinity
chromatography following the protocol published in (Vidali et al. 1995). Plant leaf material
was homogenized in a blender with 4 volumes of extraction buffer (100mM glycine, 100mM
KCl, 10 mM Tris/HCl pH 8.0, 1 mM DTT, 1% Triton X-100 and 1 Tbl Complete/200 ml) per
gram and extracted at 4°C for 1h while stirring. The extract was filtered through gauze,
centrifuged at 24000 g for 30 min and filtered through a paper filter before incubation with
0.1 volume of PLP-sepharose (see 3.2.4.1) equilibrated with extraction buffer without Triton
X-100 over night at 4°C. PLP-sepharose was packed into a column and washed with several
volumes of extraction buffer and 3 M urea in TBS (20 mM Tris/HCl pH 7.6, 150 mM NaCl).
Profilin was eluted with 8 M urea in TBS and diluted immediately in TBS. The eluate was
concentrated in an Amicon ultrafiltration cell and diluted several times with TBS before
concentrating again.
For some experiments, profilin subsequently was dephosphorylated by incubation with 10
units of calf intestine alkaline phosphatase (CIAP, Fermentas) for 1h at 37°C. The reaction
was stopped with EDTA (50 mM final concentration).
3.2.4.7 Fluorescence measurements
3.2.4.7.1 Tryptophan quenching
The spectrum of tryptophan fluorescence was recorded to assay the interaction of actin and
profilin. The method makes use of the phenomenon of tryptophan fluorescence quenching
upon binding of interaction partners (that contain tryptophan at the interaction sites). The
fluorescence of the tryptophans is quenched upon complex formation.
The fluorescence emission spectra of actin and profilin (0.2 µM each) were measured at an
excitation wavelength of 295 nm in buffer G on a LS55 Luminescence Spectrometer. Actin
22

MATERIALS AND METHODS
and profilin were mixed at the same concentration as indicated above to obtain the tryptophan
emission spectrum of the actin-profilin complex.
3.2.4.7.2 Profilin dansylation
Profilin was labelled with 1mM dansyl chloride [5 (dimethylamino) naphtalene-1-sulfonyl
chloride] for 1 h in PBS buffer and quenched with 0.1 M Tris/HCl pH 8.0. Excess dansyl
hydroxide was removed by dialysis in buffer G plus 50 mM NaCl for 48 h followed by
chromatography on a size exclusion HiTrap desalting column equilibrated with buffer G plus
50 mM NaCl. Elution was performed with the same buffer. For fluorescence measurements
actin or Chup1-CT were titrated to dansyl-profilin in buffer G and fluorescence was measured
with a LS55 Luminescence Spectrometer with an excitation wavelength of 337 nm.
3.2.4.8 Interactions of profilin
Profilin (or casein/BSA as control protein) was spotted onto nitrocellulose membrane in
defined amounts with a dot-blot apparatus. The membrane was blocked with 0.3 % skimmed
milk, 0.03 % BSA (BSA was omitted when used as a control) and incubated with
radioactively labelled Chup1 in the same buffer over night. Three extended washing steps
with blocking buffer were performed and Chup1 protein bound to the membrane was
visualized by autoradiography.
Chup1-CT was spotted onto nitrocellulose membrane and blocked respectively. The
membrane was incubated with profilin (or without as control) in blocking buffer and
immunostained with anti-profilin (Sigma).
3.2.5 Plant physiology
3.2.5.1 Plant Growth
A.thaliana seeds were surface sterilized by a treatment with 70% ethanol followed by 50 %
sodium hypochlorite, 0.05 % Tween 20 and a wash step in sterile water. The seeds were
plated on MS medium (Murashige and Skoog 1967) supplemented with 1% (w/v) sucrose,
stratified for 2 days at 4°C in the dark and grown in climate chambers with the following
growth conditions: 14 hour 75 µmol light at 21°C and 10 hour dark at 16°C. Seedlings were
transferred to soil after two weeks.
23

MATERIALS AND METHODS
Pisum sativum seeds were imbibed over night in running water, sown on vermiculite or on
sand and grown at a 12 h day/12 h night cycle in a climate chamber at 21°C.
3.2.5.2 Mutant analysis
T-DNA containing SALK Lines were analyzed for the harboring of the insertion in the gene
of interest by PCR. In a standard PCR reaction, primers for left- and right region (LP and RP)
of the gene of interest and the Lba1 primer (Table 1) for the left border of the T-DNA were
used to amplify in one reaction the region spanning the left and right primer in case of a wild
type genome, amplifying the said region plus the construct from the right primer and the Lba1
primer in case of a heterozygous genome; and amplifying only the latter construct when a
homozygous genome was given.
3.2.5.3 White band assay
The phenotypic characterization of chloroplast movement deficient knock-out plants was
assayed with the white band assay as described in Kagawa et al. (2001). Leaves of the
respective plants were placed on agar to avoid drying and treated with high intensity white
light (>400 µmol) applied by a cool metal halide lamp (Olympus) through a narrow slit in a
black plate for 1 h.
3.2.5.4 Analysis of Affymetrix Data in high white light dependent expression in WT
and ∆chup1
RNA was extracted from leafs of three sets of biological independent wild type or ∆chup1 A.
thaliana plants (ecotype Columbia) grown for 4 weeks to stage 5.10 (Boyes et al. 2001) at a
14 h 75 µmol light at 21°C and 10 h dark (>0.1 µmol light) 16°C regime before or after 1 h
illumination with 400 µmol light at 21°C and immediately frozen in liquid nitrogen. RNA
extraction and hybridization was done in collaboration with Prof. Jürgen Soll and Dr. Katrin
Phillipar (LMU Munich). Gene chip analysis was performed according to the manufacturer’s
recommendation in collaboration with Enrico Schleiff. For data analysis, signal intensity and
the detection P-value (value for the reliability of the measurement) were analyzed, the
standard error for the three independent experiments was calculated and the highest individual
detection P-value was considered. Data were first filtered for signals which had in at least one
experiment a maximal detection P=0.005. For a comparison of the change in expression, the
slope ratio value was determined. The slope ratio is a measurement for the steepness or
24

MATERIALS AND METHODS
“gradient” of expression change calculated from the ratio of the vertical and horizontal
distance between two values.
3.2.5.5 Analysis of Affymetrix Data in Blue Light Dependent Expression
For the analysis of gene expression after blue light treatment, RNA was extracted from leaves
of at least four biological independent plants of WT ecotype Columbia (Lehle). Plants were
grown for 4 weeks to stage 5.10 (Boyes et al. 2001) in a cycle of 16 hours 75 µmol light at
21°C and 10 hours dark (>0.1µmol light) at 16°C. The plants were illuminated with blue light
provided by a cool metal halide lamp (Olympus) through blue plexiglass (Degussa, Essen,
Germany) in the dark at intensities and time scales indicated in Table 2 and immediately
frozen in liquid nitrogen. Hybridization was performed as stated above (3.2.5.4). The analysis
of the data and the programs necessary for the analysis were worked out in cooperation
together with Oliver Mirus, Georg Haberer und Enrico Schleiff and programmed by Oliver
Mirus. For this reason the process of analysis but not the program source code is given in the
following.
3.2.5.5.1 Structure of the Primary Data from the Affymetrix Analysis
Introduction to Affymetrix chip architecture/Background
For background information a brief outline of the architecture of a DNA microarray of the
Affymetrix type is given here, to help understand the process of analysis in the following
paragraphs. The gene chip from Affymetrix was designed initially to comprise a probe set of
11 probe pairs for each sequence. These probes are 25 nucleotides in length, and each probe
set consists of 11 match (perfect match to target sequence) and 11 mismatch (a single
mismatch in the sequence) oligonucleotide pairs (22 spots in total). The annotation used for
the A. thaliana ATH1 chip set was from the TIGR ATH1 database as of December 15, 2001.
On the chip, 22500 probe sets are spotted, representing approximately 24000 gene sequences
on one gene chip array. With new sequence information gained in the last years however, new
annotations are required for a precise allocation of the 25mers to specific gene sequences. The
new annotation information was drawn from the TAIR 6.0 database. The assignment of the
new sequence information to the Affymetrix chip probe sets is outlined in the following.
Three data sets were available. In the first the coordinates of each of the spots for the so called
match position are given, including the corresponding sequence. In the second data set the
annotation respective to the TAIR 6.0 nomenclature for each spot is included. The third data
25

MATERIALS AND METHODS
set contains the obtained values from the experiments. As data from 7 independent
experiments was obtained, this means, that from the type-three data set, 7 files existed, listing
the data from the measurements. Table 2 contains the nomenclature of the used files.
WT
untreated G
5 min 30 min
1 µmol A B
10 µmol C D
100 µmol E F
Table 2 Experimental conditions. Time scales and light intensities used in themicroarray experiment are encoded in the letters A-G
3.2.5.5.2 Combination of the data
Preceding the analysis and further processing of the data, 7 new files were generated. First, by
combination of the data set one and two, a source file was generated, in which the allocation
of the spots to match and mismatch and the allocation of the single spots to genes on the basis
of the according AGI numbers were stored. All entries which could not be assigned to a gene
according to the TAIR 6.0 annotation were deleted.
In a second step, 7 new files were generated, by combining the values to the annotation.
During this procedure, entries which had been stored falsely in the Affymetrix file were
deleted. Subsequently it was tested, whether at least 6 values still existed for each annotated
gene in the data file. If this was not the case, all values for this gene were deleted. In addition,
the value <„match“ minus „mismatch“> and the corresponding error <error „match“ plus
error „mismatch“> were calculated and subsequently all values for “mismatch” were deleted.
The following data structure was thereby obtained: X-coordinate, Y-coordinate, AGI-code,
Affymetrix-code, ATOM, Max, value-1, error-1, value-2, error-2. The coordinates match to
the position on the chip, ATOM specifies which spot of a gene corresponds to the value, Max
specifies, how many spots exist for the corresponding gene, value-1 and error-1 relate to the
“match” values and value-2 and error-2 to the “match” minus ”mismatch” values. These files
constitute the source files for further calculation.
26

MATERIALS AND METHODS
3.2.5.5.3 Statistical analysis with values for wild type A. thaliana
For the evaluation of data, the values for wild type were analysed first. For this analysis first
all mean values (value-1 and value-2) for each gene were calculated by adding all values.
Furthermore the standard deviation of the values was calculated (SDA, STA-2). Thereby the
generated files now contained only one value per gene. In the next step the individual files
were compared, whereupon file C was used as basis for comparison for files A, E and G and
file D as basis for comparison for files B, F and G (nomenclature see Table 2). First the
respective files were combined. Afterwards it was controlled for each pair of mean value-1
and value-2, whether the distance of the values exceeded half of the error sum. These value
pairs were indexed. The value pairs were then analyzed with a linear fit by the least squares
method.
3.2.5.5.4 Cluster Analysis
For the cluster analysis of the data, expression categories were defined (see Figure 7). The
classification of categories was set depending on the behaviour of gene expression in 1 or 100
µmol blue light in relation to 10µmol blue light. The independent spot values were sorted
according to the categories defined and a gene was selected to be in one category if at least
80% of all spot values representing the gene were in that category and if the spot number in
this category was larger than 6, because some of the genes had less than 8 spot values after
correcting the Affymetrix annotation by the TAIR 6.0 annotation.
27

RESULTS
4 Results
4.1.1 Affymetrix analysis of blue light dependent gene expression in A. thaliana
4.1.1.1 Analysis of the statistical significance of the obtained data sets
For a specific analysis of physiological reactions to blue light, which, for instance, is involved
in stomata regulation and chloroplast movement (see 2.2), the expression profile in reaction to
blue light was determined. Wild type plants were illuminated with blue light of 1, 10 and 100
µmol for 5 or 30 min (see Table 2). To begin with, for the analysis, the statistical significance
of the data had to be determined. Because of the high costs for Affymetrix chips each
condition was conducted in a single experiment (but with several biological independent
samples). This raised two questions: what is the statistical significance of the experiments and
which value should be used for evaluation: match or match minus mismatch? In literature the
problem of the usefulness of the mismatch probe has been discussed (e.g. Naef et al. 2002,
Irizarry et al. 2003). To determine the difference in analysis, the average values for match and
mismatch were calculated for each gene from those spots which were assigned according to
TAIR 6.0 annotation. Using the new TAIR annotation reduced the calculated errors for the
signal intensities significantly (not shown).
Figure 4 Analysis of raw data and determination of data evaluation. Diagrammed is the comparison between untreated wild type sample (G) and wild type after 5 min treatment with 10µmol blue light. Diagrammed is the comparison between value-1 (“match”, left) and value-2 (“match” minus “mismatch”, right). The grey line indicates the linear regression of all data points.
As is apparent from Figure 4, when calculating with match minus mismatch (value-2) only
values with low signal intensity are over-emphasized. Values with high signal intensity are
not influenced by the change in calculation. At the same time, the ratio between signal and
error of the small signals increases (as subtraction results in addition of errors), so that many
28

RESULTS
of the signals would have to be removed from the analysis (not shown). Thereby the influence
lies only on values with low signal intensities, which can be dispensed with, as low signal
intensities are more noise sensitive. Therefore, solely the match values (Value-1) were used
for further analysis.
To analyse the results, all genes for which the signal change was smaller than the error of the
signals (and therefore, considering the errors, had no signal change) were removed from the
analysis (not shown). By this procedure which simplifies the analysis the majority of values
can be eliminated. The remaining values were analysed with respect to their expression
change values and only genes with a change of more than 1.5 fold in either direction (up- or
downregulation) were considered.
Figure 5 Analysis of the treatment with 10 µmol blue light in comparison to the untreated sample. Upper panel: shown is the comparison of value-1 (match) between untreated wild type sample and the wild type sample after 5 min (left) or 30 min (right) treatment with 10 µmol blue light. Only values remaining after selection by error discrimination and a minimal 1,5 fold change of the signal are shown. Depicted in grey are the borders of 1.5 fold change. Lower panel: The statistics of value-1 (upper part and value-2 selection (lower part) is depicted as bar chart. The circular charts show the overlap between the selected genes by the means of the value-1 (black) and the value-2 (grey).
It is apparent that almost all of the data points found by calculating with value-1 are also
found in the pool of data points by taking into account the value-2 (Figure 5), but not vice
29

RESULTS
versa. Furthermore, considering value-2 it becomes obvious that almost all genes passing the
error criterion are subsequently selected as up- or downregulated (Figure 5, bottom, value-2,
compare error and 1.5). This again shows that errors are introduced while considering value-
2, because most of the genes found additionally by value 2 have a low signal intensity (not
shown). Additionally, the analysis shows, that only 0.1% of all genes after 5 min and only 2%
of genes after 30 min blue light treatment have significantly changed expression signals
considering value-1. The conclusion is therefore, that the chosen method can be used for
analysis. The statistical variance is low (approximately below 0.1%). To further access this
question, the three sets of results for the 5 min blue light treatment were compared. It
becomes obvious that the comparison between control and 10µmol blue light treatment for 5
min shows the largest number of regulated genes (Figure 6). Therefore, it can be concluded
that the statistical variation is rather low and the consideration of match values only and the
concept of program-independent analysis proved to be reliable.
Figure 6 Analysis of the blue light reaction. A Diagrammed is the comparison of the expression values after treatment with 10 µmol blue light for 5 min and the treatment with 100 µmol blue light (above), 1 µmol blue light (below) and the untreated control sample (mid). Depicted in grey are the borders of 1.5 fold regulation. B The circular charts show the overlap between the genes selected by value-1.
30

RESULTS
4.1.1.2 Analysis of the blue light induced gene expression in A. thaliana
After establishing the methodology and error estimation the effects of blue light treatment
were analysed but now even based on the individual spot values and no longer on averaged
gene values. The program was designed by Enrico Schleiff, programmed by Oliver Mirus and
its workflow is outlined in Materials and Methods. This approach was necessary to perform a
knowledge based cluster analysis. For the cluster analysis, differential gene expression pattern
was classified into different categories. For three different light qualities, nine different
categories can be classified depending on up-or downregulation under different fluence rates
(Figure 7 A).
Figure 7 Cluster analysis of blue light dependent gene regulation. Categories assigned to the behaviour of gene expression in 1, 10 or 100 µmol blue light. Dots lower or higher than the central dot indicate a significant lower or higher expression of the gene under the indicated light intensity in comparison to the 10µmol treatment. Class zero (not shown) includes all genes which do not pass the filter described in Materials and Methods. B The number of genes according to the clustering obtained by determined spot values for 5 minute (black) or 30 minute treatment (grey) of wild type is shown. The numbers indicate the categories from (A).
Following the described strategy, the values of each spot directly were analyzed. As stated
above, the majority of the expression signals are categorized in class 0 and 1, representing
genes either not passing the selection filter or being not regulated. Furthermore, as expected
from Figure 5, after 30 minutes more genes are found to be differentially regulated,
particularly downregulated at 100µmol light treatment (class 5). Hence, the subsequent step
was to analyse the genes classified.
31

RESULTS
4.1.1.2.1 The effect of blue light on the expression profile in wild type plants
After having established a clustering procedure the observed expression profile was analysed.
After 5 minutes, only three genes are significantly altered in their expression based on the
clustering procedure (Supp. Table 2). One of the genes is upregulated at low light intensities
(category 2) and two are upregulated at high light intensities (category 4). All three genes
encode proteins with a possible chloroplast localization. The gene of the category 2 encodes a
kinase (Supp. Table 2), which is under the control of the Dof transcription factor OBP3 (Kang
et al. 2003). The other two genes encode a chloroplast localized copper chaperone for
superoxide dismutase (CCS1, Chu et al. 2005) and a chloroplast localized superoxide
dismutase (CSD2, Kliebenstein et al. 1998). This could be interesting as reactive oxygen
species (ROS) may function in signalling to the actin cytoskeleton in plants (Choi et al. 2008).
For the superoxide dismutase (CSD2) a regulation of post-transcriptional mRNA
accumulation by the microRNA miR398 was reported (Sunkar et al. 2006). Strikingly, it was
observed that miR398 levels are reduced under high light, resulting in enhanced levels of the
two Cu/Zn superoxide dismutases, the cytosolic CSD1 and CDS2. In line, CSD2 was found in
class 4 (upregulated under high intensities of blue light). To explore whether the observed
regulation might be indeed linked to this microRNA, the expression of CSD1 was analyzed by
comparison of the expression values determined by averaging the spot values (as in Figure 6).
Indeed, an enhanced signal of CSD1 after illumination can be observed (Figure 8). An
enhancement of CSD1 and CSD2 transcripts after illumination, which was more pronounced
for CSD1, was confirmed by RT-PCR (Petra Lehmann, Frankfurt, personal communication).
The relation between blue light regulation and transcript level regulation by miR398 might be
interesting to explore in future.
Figure 8 Analysis of treatment with blue light for 5 minutes The expression values determined by spot value averaging were analysed for the two superoxide dismutases CSD2 (encoded by At2g28190) and CSD1 (encoded by At1g08830) and the log2 of the ratio of the expression after illumination with 1µmol blue light (I-1/I-10) or 100µmol blue light (I-100/I-10) and after illumination with 10µmol blue light is shown.
When analysing the genes found to be regulated after 30 min of blue light, in total 129 genes
were identified in the category 2-9. The category 5 (representing no difference between 1 and
32

RESULTS
10µmol and a down-regulation at 100µmol, Figure 7 A) is dominating. No genes were
obtained for category 3 (Figure 7 A).
The genes found to be regulated after 30 min (Supp. Table 2) were analysed by annotation.
The majority of genes were transcription factors or of unknown function. For some of the
transcription factors, a regulation in response to light has been reported (e.g. RHL41, Iida et
al. 2000). Overexpression of RHL41 induced photomorphological changes in the leaves and
higher light tolerance (Iida et al. 2000). Interestingly, many kinases (9), calcium binding
proteins (3) and calmodulin-binding family proteins (4) or even a kinase from a family of
calcium binding kinases (AT5G45820, Gong et al. 2003) were found, which might give a link
to signal cascades that involve calcium (see Discussion). The latter kinase (atPKS18,
At5g45820) was reported to be sensitive to abscisic acid (Gong et al. 2002). Stomata opening
is regulated by blue light and abscisic acid, and a merging of the signal pathways was
suggested recently (Warpeha et al. 2007).
A link to blue light induced signal cascades might also be at reach for the receptor like protein
kinase that is involved in phosphatidylinositol signalling: (AT5G47070) (see Discussion).
Also, a putative activated protein kinase C receptor (At1g48630) was found. Protein kinase C
can be activated by calcium or DAG in animals and the regulation of the cytoskeleton is
linked to protein kinase C in animals (e.g. Sohn and Goldschmidt-Clermont 1994). A real
homologue has, however, not been reported in plants yet (see Discussion).
The regulation of blue-light induced gene expression on proteins involved in chloroplast
movement and proteins reported to be involved in blue-light signalling was analysed
separately (Figure 9). However, the expression profiles of the proteins were not drastically
influenced by blue light of different fluence rates. In general, most of the genes show a
slightly reduced expression after the 30 min treatment with the exception of PMI2, which is
not altered in its expression. RPT2 shows a more pronounced downregulation. For the
CHUP1 gene a slight upregulation with increasing light at 5 min can be observed, which is
not detected at 30 min. Overall, the regulation of the chloroplast movement proteins observed,
seems, however, not to be transcriptionally regulated.
33

RESULTS
Figure 9 Comparison of the expression profiles of proteins involved in chloroplast movement or blue-light induced phototropic responses under blue light conditions
4.2 The in vivo function of Chup1
4.2.1 Confirmation of the T-DNA insertion in chup1 knockout plants
For a phenotypic characterization of Chup1 function, a mutant line harbouring a T-DNA
insertion in the CHUP1 gene was obtained from the SALK institute and screened by PCR
genotyping. To verify the insertion of the T-DNA into the CHUP1 gene (see Figure 10A), a
combination of three different primers (Table 1) was used. In a WT background, the chosen
34

RESULTS
gene-specific primers CHUP1 LP and CHUP1 RP should yield a WT band of 884 bp. In a
heterozygous mutant plant with a T-DNA insertion in the CHUP1 gene on one chromosome
and no insertion on the other, two bands should be visible: the PCR product resulting from the
combination of the T-DNA–specific left border primer (Lba1) and the gene-specific primer
CHUP1 RP, which give a product of 590 bp. An additional band results from the gene-
specific primers CHUP1 LP and CHUP1 RP (WT band). For a homozygous plant, only the
PCR product from the Lba1 primer and the CHUP1 RP primer is amplified and results again
in a product of 590 bp. The PCR products of the homozygous, heterozygous and wild type
plants can be seen in Figure 10B, where the predicted bands of the correct size appear. The T-
DNA insertion site in the third exon of the CHUP1 gene is depicted in Figure 10 A.
Figure 10 A Intron structure of the CHUP1 gene (At3g25690), not to scale. The white triangle marks the insertion of the T-DNA. Back arrows mark the position of the gene specific left and right primer (LP, RP); grey arrow the position of Lba1 primer B PCR products from HZ (heterozygous, lane 1), WT (wild type, lane 2) and HM (homozygous, lane 3) plants from the progeny of the SALK line 129128 are shown
The knock-out status of the ∆chup1 line was further confirmed by microarray analysis (see
chapter 4.1.1). A complete downregulation of the CHUP1 gene was observed (Figure 12 A).
4.2.2 White Band Assay
A chloroplast movement deficient phenotype was discovered in a screen by Kasahara et al.
(2002) resulting from a mutation in the CHUP1 gene. To verify this phenotype the ∆chup
mutant was tested for loss of chloroplast movement. To assay the chloroplast movement
deficient phenotype of ∆chup1, the white band assay was used (Kagawa et al. 2001). With
this screening method, defects in chloroplast movement can be made visible on a macroscopic
level. At the illuminated area wild type plants show a paler green colour (Figure 11). This
results from an increased transmittance of light through the leaf owing to a lower density of
chloroplasts at the periclinial walls (walls perpendicular to the light) and a higher chloroplast
density at the anticlinial walls (walls parallel to the light) (see Figure 2, Introduction).
35

RESULTS
Figure 11 White Band Assay. Leaves from WT (up) or ∆chup1 (down) were illuminated with strong white light within a narrow area on the leaf. The pale band on the WT leaf denotes the chloroplast movement in this area. On the ∆chup1 leaf, no pale band is appearing upon illumination with strong light
As can be seen in Figure 11, the leaf of a ∆chup1 plant does not show any sign of chloroplast
movement, as no pale band is appearing after illumination. Thus, this is an independent
confirmation of the chloroplast movement deficient phenotype of the chup1 knockout plant
which was described by Oikawa et al. (2003).
4.3 Light regulation
To obtain information about the changes in gene expression induced through high light
conditions and to explore a mode of function of Chup1 in the network of adaptation to
enhanced light intensities, an expression analysis was conducted. A comparison of global
gene expression changes in ∆chup1 and wild type plants was obtained through microarray
analysis of mRNA from high light treated plants.
Figure 12 Expression analysis of ∆chup1 plants A The averaged signal intensity of gene expression (three independent experiments) in wild type and ∆chup1 plants at day 30 with a detection P-value equal or smaller than 0.005 in at least one plant type is shown. Lines indicate the border for an at least three fold signal difference and the number of significantly up- or downregulated genes are given (listed in Suppl. Table 1). The signal for CHUP1 is circled. B The averaged signal intensity (three independent experiments) at day 30 of the genes in wild type plants before (wt) and after illumination (wtL) with a detection P-value equal to or smaller than 0.005 in at least one plant type is given. Lines indicate the border for an at least threefold signal difference. C Comparison of the number of genes significantly up- (U) or down-regulated (D) in response to light in wild type (black) or mutant plants (grey). D The slope ratio values (slr) for signals found in wild type versus mutant and mutant versus mutant after light treatment are shown for the genes significantly regulated in wild type in response to light (see panel B). Black dots indicate genes found to be downregulated and grey dots found to be upregulated in wild type in response to light. Positive values correspond to downregulation, negative values to upregulation.
36

RESULTS
A comparison of the expression signals of wild type and ∆chup1 (Figure 12 A) shows, that
only a small number of genes (3) are downregulated. The most drastically downregulated
gene is CHUP1, which demonstrates the knock-out status of the mutant. The genes that were
found to be upregulated in ∆chup1 are for the most part involved in stress response. This may
reflect adaptation to environmental conditions of the mutant and might give a link of the
signal cascades of stress induced changes and light stimulus. As the behaviour of gene
expression in response to high light in terms of the regulation of chloroplast movement was of
major interest, plants treated with strong white light (400µmol) were analysed. The light
treatment caused – not surprisingly - a significant change in the expression profile of the wild
type compared to non treated wild type (Figure 12 B). With a significance criterion of a three
fold enhanced expression change, 282 genes were found to be upregulated and 211 genes
downregulated. For high light treated ∆chup1 plants, a similar observation was made (Figure
12 C) while not all of the regulated genes were entirely the same as in wild type.
The most interesting observation was made when the genes found to be regulated in wild type
upon light treatment were analysed for their behaviour in the ∆chup1 mutant background
(Figure 12 D). Genes that were downregulated in the WT in response to light were not found
to be regulated in the non-treated mutant. But this population of genes was slightly
downregulated in the mutant in response to light (Figure 12 D black dots). A more drastic
differential regulation was observed for genes that were upregulated in high light treated WT:
Genes of this population that were found to be upregulated in the mutant compared to WT
were found to be not regulated in the mutant after illumination. This is due to the fact that
their expression before illumination was already at a comparable high level as reached in WT
after illumination. By contrast, genes of that population again (upregulated in high light
treated WT), that were downregulated in the mutant in comparison to wild type did strongly
enhance their expression in the mutant in response to light to reach a similar expression level
after light treatment as obtained in wild type after light treatment (Figure 12 D, grey dots).
The exclusive differential regulation of genes in the mutant, which are usually upregulated in
response to light in the wild type plants, demonstrates that the mutation causes a shift of the
sensing light intensity.
37

RESULTS
4.4 The Chup1 family in plants
4.4.1 RACE from Pisum sativum RNA
To assess whether the Chup1 protein is present in pea and to analyse its domain structure for a
comparison of conserved sequence structures, RACE reactions from Pisum sativum RNA
were performed. The sequence of the CHUP1 gene from pea (psCHUP1) could be gained
from cDNA amplification of 3’ and 5’ ends (RACE) in consecutive sequencing steps. Highly
conserved regions in the CHUP1 gene, deduced from comparison with sequences from
several species (see Table 3) were chosen for the generation of oligonucleotide primers for the
first RACE reaction. Primer combinations from the conserved regions were tested on cDNA
obtained from P.sativum RNA. The primer combination RACE UPM and Chup1 1470 fw
(Table 1) resulted in a PCR product.
After sequencing the PCR product, new primer combinations at the 3’ and 5’ ends of the
discovered sequence were generated and another RACE cycle was performed. This strategy
was followed until the full-length sequence was obtained. The DNA sequence of P. sativum
CHUP1 was found to be 2958 bp (985 amino acids) long which results in a predicted
molecular mass of 110.68 kDa for the protein. The protein is therefore slightly smaller than
atChup1, which is 1004 amino acids long and has a mass of 111.91 kDa. The isoelectric point
of psChup1 is predicted to be 5.52 and 5.43 for atChup1. No hints for multiple isoforms of the
CHUP1 gene in pea were observed (as is the case in Physcomitrella patens) and no splicing
variants were encountered in the screen.
38

RESULTS
Figure 13 Alignment of Chup1 from Arabidopsis (Atha) and Chup1 from pea (Psat). Alignment of the full-length sequence of atChup1 and the sequence of psChup1 obtained by RACE, performed with MAFFT and depicted with Jalview
4.4.2 The domain structure of Chup1
To further compare psChup1 to atChup1 a sequence analysis based on conserved domains
was performed. The analysis of sequence structures that have been conserved in evolution
throughout different species is a powerful tool for the assignment of functions to highly
conserved parts of proteins. Conserved regions are most likely important for the function of a
protein or for the maintenance of the tertiary folding structure. Therefore, the domains
postulated by (Oikawa et al. 2003) for the atChup1 protein, were scrutinized with respect to
their occurrence and conservedness in orthologs from other species.
The sequences from the following different organisms (Table 3) were found to contain high
sequence similarity to the full length Chup1 protein from Arabidopsis in a BLAST search
(Altschul et al. 1990).
39

RESULTS Table 3 Orthologs of atChup1
Abbreviation Organism Identifier Sequence length in aa
Atha Arabidopsis thaliana At3g25690 1004
Psat Pisum sativum this study 985
Ppat 1A Physcomitrella patens Chup1A GI:125659421 1130
Ppat 1B Physcomitrella patens Chup1B GI:125659423 1141
Osat Oryza sativa GI:115486888 929
Mtru Medicago truncatula GI:140058210 986
Vvin Vitis vinifera GI:157338727 959
The proteins listed in Table 3 were used for a multiple sequence alignment (MAFFT)
including the newly found Chup1 protein from Pisum sativum.
4.4.2.1 The N-terminal hydrophobic domain
The selected Chup1 orthologs show a high similarity at the utmost N-terminus (Figure 14),
which in the following has only a low conserved structure (see Figure 19). The 18 utmost N-
terminal residues are found to be hydrophobic (depicted in blue) with a high occurrence. The
N-terminal part of atChup1 was suggested to be acting as a membrane anchor (Oikawa et al.
2003) and is needed for targeting to the chloroplast (chapter 4.5.2).
Figure 14 Multiple sequence alignment of the N-terminal domain of Chup1 orthologs. The sequence from residues 1-28 in atChup1 is shown in a multiple sequence alignment performed with MAFFT. Hydrophobic amino-acids are depicted in blue.
4.4.2.2 The actin binding domain
The atChup1 protein was found to contain an actinin-like (e.g. Gimona et al. 2002) actin
binding domain by comparison with prosite patterns [EQ]-x(2)-[ATV]-[FY]-x(2)-W-x-N
(Oikawa et al. 2003). This entry was however replaced in April 2006 by the actinin-type actin
binding domain signature 1 pattern: ACTININ_1 PS00019 [EQ]-{LNYH}-x-[ATV]-[FY]-
{LDAM}-{T}-W-{PG}–N. The amino-acid sequence does, however, not exactly follow the
40

RESULTS
proposed pattern found in actin-binding proteins from this motif family (Figure 15). This is
due to the leucine in position six of the pattern, which is not allowed by the ambiguity code
{LDAM}.
Only a low amount of plant actin-binding proteins was used for the calculation of the
ambiguity code. The pattern may therefore not depict the reality in plants. When looking at
the putative actin-binding domain in atChup1, however, this domain is found to be highly
conserved within proteins of the analysed species (Figure 15, actin-binding motif marked in
red). Additionally, the domain represents an “island” of conserved amino acids in the
structure (Figure 19, marked in red).
Figure 15 Multiple sequence alignment of the actin binding domain in Chup1 orthologs. The sequence from residues 326-369 in atChup1 is shown in a multiple sequence alignment performed with MAFFT. The actinin-like actin binding motif is depicted in red.
4.4.2.3 The profilin binding domain
The atChup1 protein contains a region abundant in prolines. The three repeats of GPPPPP in
the sequence can all be classified as proline-rich motif1 (PRM1) which has the consensus
motif XPPPPP, where X = G, L, I, S or A (Holt and Koffer, 2001). The PRM1 motif was
identified to be a binding motif for profilin.
It is noticeable that among Chup1 proteins the overall arrangement of the prolines is not
conserved in a definite structure of the domain (Figure 16), but to a high content in the
number of proline repeats itself. Stretches of prolines in proteins by themselves are able to
bind profilin, which is reflected in the ability of profilin to bind to poly-L-proline. The
following numbers of repeats of the PRM1 motif occur: atChup1 (3), psChup1 (2), oryza (3),
physcomitrella 1b (2), physcomitrella 1a (1), medicago (1), vitis (0) (red boxes Figure 16). A
conserved part in the proline-rich domain is found at the N-terminal part of this region
depicted as a black box in Figure 16, where a triple repeat of prolines is surrounded by the
positively charged amino-acids lysine or arginine (in two cases also asparagine or alanine).
41

RESULTS
This conserved sequence structure was, however, not yet assigned a profilin binding PRM
motif.
Figure 16 Multiple sequence alignment of the proline-rich region in Chup1 orthologs. The sequence from residues 647-719 in atChup1 is shown in a multiple sequence alignment performed with MAFFT. Red boxes mark PRM motifs, the black box marks a putative conserved PRM motif
4.4.2.4 Dimerization motifs
The atChup1 protein was predicted to contain a coiled-coil motif (Oikawa et al. 2003).
Coiled-coils are α-helical structural domains that intertwine to form multimeric supercoils.
The coiled-coil structure is characterized by a heptad repeat pattern. The residues in the first
and fourth position are hydrophobic, residues in the fifth and seventh position are mostly
charged or polar (Burkhard et al. 2001) A specific class of coiled-coil regions are leucine
zippers (see below). Coiled-coil domains are protein oligomerization motifs that function as
protein-protein interaction sites in subunit-oligomerization or act as membrane anchors.
Interestingly, coiled-coil domains are often a structural feature of cytoskeletal proteins and
motor proteins (e.g. myosins) or found in movement processes (e.g. endocytosis or cell
adhesion) or in signal transduction (Burkhard et al. 2001)
The existence of coiled-coil domains found in atChup1 (Oikawa et al. 2003) was predicted for
the Chup1 orthologs with the PCOILS program. This program was chosen from a range of
coiled-coil prediction programs found to outperform competitors based on a comparative
analysis by Gruber et al. (2006).
42

RESULTS
Figure 17 Presence of coiled-coils in psChup1. Exemplary for the Chup1 orthologs, a prediction of coiled-coils by the PCOILS program for psChup1 is shown. X-axis: position in sequence, y-axis: coiled-coil probability.
Figure 17 shows the prediction of coiled-coil domains in psChup1. The predicted coiled-coils
are found to be similarly distributed in the orthologs. The coiled-coils have a high prevalence
in the N-terminal region of the proteins ranging from a position in sequence of approximately
100-350 aa in atChup1, vitis, psChup1, medicago and oryza and from 200-450 aa in the two
Physcomitrella orthologs (which is due to an insertion upstream of this region). An additional
coiled-coil region can be detected at a position in sequence of approximately 1000 aa in the
Physcomitrella orthologs and at a position of approximately 800 aa in all other proteins. It is
predicted however to have a lower probability. This coiled-coil is formed by the leucine-
zipper motif in that region. A short stretch of a possible third coiled-coil conformation is
present in the Physcomitrella orthologs at around a position of 700 aa.
The coiled-coil prediction gives a picture of the conformational conservation that is not
necessarily mirrored in the sequence homology. With the analysis of the coiled-coil structure,
the conclusion can be drawn, that although the N-terminal part of the orthologous proteins has
overall low sequence conservation, the structural conservation is high. When comparing the
coiled-coils predicted in the orthologs, a high similarity in the predicted structure can be
detected.
43

RESULTS
Figure 18 Multiple sequence alignment of the first predicted leucine zipper motif in Chup1 orthologs. Leucine zipper motif from Leu 269 to 304 in atChup1 is shown as a multiple sequence alignment performed with MAFFT. Marked in red are the leucines (in one case the arginines) of the motif
A leucine zipper motif was predicted for Chup1 by (Oikawa et al. 2003). Leucine zippers are
sequence structures containing repetitions of leucines (or arginines in basic zipper motifs) at
every seventh position. They are often found in transcription factors or function in
homodimerization or heterodimerization of proteins. The leucine-zipper motif is a pattern
with a high probability of occurrence and as leucine zippers exist in an α-helical
conformation, they are also considered to be a subset of the more general coiled-coil structure
(O'Shea et al. 1991). This seems to be the case for the Chup1 proteins. The leucine zipper
motif (residues from Leu 269 to 304) is indeed only partially conserved (Figure 18). The
leucines are replaced by methionines in the Physcomitrella sequences and the medicago
sequence is lacking the 6th leucine.
Thus, as the leucine zipper motif is found in the region of the predicted coiled-coil (Figure 17)
it could just as well belong to the overlying structure of the predicted coiled-coil. For the
second predicted leucine-zipper (four leucines from Leu 802-Leu 823 in atChup1), the
sequence conservation is likewise not too pronounced. The first leucine residue is replaced by
a valine in oryza, medicago and the two physcomitrella sequences. The remaining three
leucine repeats are probably not able to form a functional motif, but may as before belong to
the coiled-coil domain (second coiled coil, Figure 17). The overall conserved structure in the
alignment of the Chup1 orthologs can be found in Figure 19.
44

RESULTS
Figure 19 Sequence conservedness of the Chup1 orthologs. Shown is the conservation in sequence for the alignment of the Chup1 orthologs (Table 3). Higher values (high columns, lighter blue) stand for high conservation. Marked in red is the hydrophobic N-terminus, the first coiled-coil in yellow, the actin binding domain in orange and the profilin binding domain in green..
To summarize, from the analysis of the domain structure can be concluded, that psChup1 is a
putative functional homologue of atChup1. A model of the domain structure of atChup1,
including constructs for further analysis referred to later, is given in (Figure 20).
Figure 20 Domains of atChup1 and constructs NT, ABD and CT (not to scale)
45

RESULTS
4.5 Localization of the Chup1 protein
4.5.1 Chup1 is localized to plastids
To determine the localization of the Chup1 protein in plant cells, GFP fusion constructs were
generated. Previously it had been shown by Oikawa et al. (2003) that the N-terminal 25 amino
acids of Chup1 are directed to the chloroplast. But a more detailed analysis of the full-length
protein and information about the targeting signal were missing, like a confirmation of the
exclusive localization of Chup1 to chloroplasts and the dependence of the targeting on the N-
terminal domain. This was needed because a component of the signal transduction cascade
leading to chloroplast movement was found with at least dual localization. The Phot2 light
receptor kinase relocalizes from the plasma membrane to the Golgi apparatus upon
illumination with blue light (see 2.2.1, Kong et al. 2006)
To investigate these questions, first GFP fusion constructs of full-length Chup1 and ∆N-
Chup1 – the full-length Chup1 without the N-terminal 25 amino acids - were generated.
Figure 21 Expression of Chup1-GFP in A.thaliana protoplasts. Left panel: GFP fluorescence, middle panel chlorophyll autofluorescence, right panel: overlay picture. A-F Chup1-GFP expression in protoplasts. D-F Close-up of two chloroplasts surrounded by Chup1-GFP fluorescence. Bar = 10 µm.
46

RESULTS
As can be seen in Figure 21, the full-length Chup1 is directed to the chloroplast. The Chup1-
GFP fluorescence signal is evenly surrounding the chloroplast (close-up Figure 21 D). In
some experiments, however, the Chup1-GFP signal was found to be distributed in a distinct
pattern along the chloroplast surface. Tagged regions occurred, where the signal appeared to
be confined to the areas where the chloroplasts are in close contact to each other (Figure 22
A). As the signal intensity was high it is unlikely that the signal is only apparent at the contact
sites due to overlap of signals and not visible at the whole chloroplast envelope.
Another observation was that in some cases the signal was more intense in spatially confined
areas of the chloroplast surface (Figure 22 D, barbed arrows in G and I). Additionally, in
some cases, vesicular structures formed by the Chup1-GFP fluorescence were encountered
(Figure 22 G). In rare cases these structures could be observed throughout the cell (Figure 22
H). The physiological relevance of this distribution could, however, not be approached.
47

RESULTS Figure 22 Observed alternative localisation patterns of Chup1-GFP. Chup1-GFP expressed in A. thaliana protoplasts (A-I) Left panel: GFP fluorescence, middle panel: chlorophyll autofluorescence, right panel: overlay picture. Arrow points to vesicular structures, barbed arrow to intense regions of GFP fluorescence. Bar = 10 µm.
4.5.2 Chup1 targeting is defined by the conserved N-terminus
When the 25 amino-terminal amino acids of Chup1 were deleted (∆N-GFP), the distribution
of the GFP signal changed (Figure 23 B). The chloroplast localization was abolished. ∆N-
GFP was located as distinct spots in the cytoplasm. The spots were not in contact with
chloroplasts (Figure 23 E).
Here the question arose, whether information from other Chup1 domains, like the actin
binding domain or the PRF1 motif, was able to direct the deletion protein to a specific
alternative location. For that reason an association of the speckles with the actin cytoskeleton
was checked (Figure 23 F). From known actin markers, the fluorescent protein fusion to the
actin binding domain of AtFIM1 (fimbrin) was chosen (Sheahan et al. 2004). Fimbrin is an
actin binding protein which has two actin binding domains. The second actin binding domain
(fABD2) of fimbrin was fused to RFP to enable co-localization studies (Figure 23). An
advantage of fimbrin is, that altered interactions of actin to actin binding proteins upon
binding of the tagged protein have not been reported, which is e.g. the case for mouse GFP-
talin (Sheahan et al. 2004, see 2.5).
48

RESULTS
Figure 23 Localization of ∆N-Chup1-GFP. Expression of ∆N-Chup1-GFP in A.thaliana protoplasts A Chlorophyll autofluorescence B ∆N-Chup1-GFP C Mitotracker staining D overlay of b and c E overlay of chlorophyll autofluorescence, ∆N-Chup1 GFP and fABD2-RFP F overlay of ∆N-Chup1-GFP and fABD2-RFP. Bar = 10 µm
The actin cytoskeleton was stained effectively by the fimbrin-RFP construct (Figure 23 E,F).
Also fine structural elements of actin fibres are visualized by the marker. It should be noted,
that the chloroplasts are closely surrounded by the actin cytoskeleton as has previously been
observed by other groups (see Introduction, Kandasamy and Meagher 1999, Kwok and
Hanson 2004).
The distribution of the ∆N-Chup1-GFP construct was not to be found in association with the
actin cytoskeleton, as no co-localization could be observed. In Figure 23 (C, D), protoplasts
were stained with Mitotracker to exclude that ∆N Chup1 co-localizes with mitochondria, as
for mitochondria a similar pattern can be observed, and indeed no such co-localization was
observed. To further analyze the localization of the ∆N-Chup1 construct, the characteristic
localization pattern deduced from numerous experiments was compared with the distribution
of the Golgi marker ST-GFP. By this comparison it was found very unlikely that the ∆N-
Chup1-GFP signal resides in the Golgi (data not shown)
49

RESULTS
4.5.3 The mode of targeting is independent of vesicle transport
The possibility that ∆N-Chup1 could be targeted to the Golgi apparatus was examined for
several reasons. First, Golgi localization was often described to form a punctuate pattern (e.g.
Chatre et al. 2005) somewhat similar to that observed for ∆N-Chup1 (Figure 23). Second, the
light receptor Phot2, which is the origin of the chloroplast movement signal cascade, was
found to have a dual localization (Kong et al. 2006, see 4.5) at the plasma membrane and at
the Golgi apparatus. The third reason was that recent findings suggested that some chloroplast
proteins are targeted through the secretory pathway to the chloroplast (Villarejo et al. 2005).
Moreover, from initial analyses of the biochemical properties of Chup1, a possibility for
Chup1 taking the secretory route to the chloroplast could not be excluded. Prediction
programs (e.g. TargetP, Emanuelsson et al. 2000) predicted the destination of Chup1 to the
secretory pathway. Moreover, a glycosylation site was predicted for Chup1 (e.g. Prosite). By
taking the secretory pathway, Chup1 would be able to target different cellular membranes.
Analysis of the targeting of Chup1 in respect to a possible route to the chloroplast via the
Golgi apparatus was done with brefeldin A (BFA).
BFA is an inhibitor of the Golgi-mediated vesicular transport (Ritzenthaler et al. 2002). BFA
targets GTP-exchange factors (GEFs) and thus inhibits the activation of Arf1p, which recruits
coat proteins for transport vesicles to the Golgi (Nebenführ et al. 2002). This inhibition results
in a disorganization of the Golgi-stacks, as can be nicely seen in Figure 24 K, where the
fluorescent signal of ST-GFP shows the organization of the so called brefeldin A
compartment.
50

RESULTS
Figure 24 Influence of BFA on the localization of Chup1-GFP. Left panel: GFP fluorescence, middle panel: chlorophyll autofluorescence, right panel: overlay picture. Chup1-GFP (A-F), ST-GFP (G-M) and GFP (N-S)
51

RESULTS were transformed into A.thaliana protoplasts without treatment with BFA (A-C, G-I, N-P) or with BFA-treatment (D-F, K-M, Q-S). Bar = 10 µm.
In contrast, Chup1 targeting to chloroplasts was not impaired by addition of BFA (Figure 24
A vs D). As expected, the distribution of the GFP control is also not affected by BFA (Figure
24 N vs Q). This is of course due to the cytoplasmic and nuclear localization of GFP, which is
not dependent on a distribution through the secretory pathway.
4.5.4 Targeting of Chup1 to the chloroplast membrane in vitro
To further assess the localization of Chup1 at the chloroplast surface, and to support the in
vivo GFP localisation studies (see 4.5), in vitro binding of Chup1 to purified outer envelope of
chloroplasts was tested. For the experiment Chup1 protein was in vitro translated in wheat
germ extract (Figure 26 A) and used in further experiments as no translation product was
obtained from reticulocyte lysate (Figure 26 C).
The binding of Chup1 to the outer envelope could be confirmed, as Chup1 was coprecipitated
with the outer envelope (Figure 25 A, lane 2) but did not sediment in the absence of OE (lane
4).
This interaction is mediated by the N-terminal domain of Chup1, as the Chup1-NT fragment
comprising the N-terminal residues of the Chup1 protein likewise cosediments in an outer
envelope dependent manner (Figure 25, lane 4). These results confirm the above established
conclusion that Chup1 is indeed localized at the outer envelope.
Figure 25 Cosedimentation of Chup1/Chup1-NT and OE. A Radioactively labelled Chup1 (lanes 1-4) was incubated with OE (lanes 1 and 2), supernatant and pellet fractions were subjected to SDS-PAGE and autoradiography after centrifugation. B Radioactively labelled Chup1-NT (lanes 1-4) was incubated with OE (lanes 3 and 4), supernatant and pellet fractions were subjected to SDS-PAGE and autoradiography after centrifugation.
52

RESULTS
4.6 Chup1 interaction with actin
4.6.1 Expression of Chup1
To characterize interactions of the Chup1 protein, binding studies with heterologous
expressed protein were required. All attempts to express full-length Chup1 protein failed
however. In the E. coli system, different strains (BL21(DE3), TOP10, JM101) as well as
strains containing helper plasmids (pLysS, pMICO, Rosetta) were used to enable tight
expression and/or expression of plant genes with rare codons. Furthermore expression with a
GST-tag to enhance solubility and to avoid potentially lethal aggregation was tested but
proved to be not successful. A change to a eukaryotic expression system and expression of
CHUP1 with a HA-tag in yeast was not yielding any protein. An attempt to express CHUP1
with a secretion signal in yeast to allow the immediate export from the cytoplasm and thus
avoid aggregation of misfolded protein that could result in cell death was also not successful.
An expression of full-length CHUP1 was only possible in the in vitro system. But
interestingly, in vitro expression also failed when CHUP1 was translated in reticolucyte lysate
rather than in wheat germ extract (Figure 26 C). This points to an expression mechanism that
is requiring factors only present in plant systems for the expression of functional full-length
protein (probably specialized chaperones). This is conceivable as Chup1 has no equivalent in
prokaryotes or animals. Therefore, radioactively translated full-length Chup1 was gained from
in vitro expression in wheat germ extract (Figure 26 A). The N-terminal part of Chup1, as
well as the middle part comprising the coiled-coil and the actin binding domain (see Figure
20) could be expressed as insoluble inclusion bodies in E. coli. The lack to properly fold in E.
coli is probably due to the hydrophobic domain on one hand and the large coiled-coil which
can cause aggregation on the other hand. A large fraction of the protein was however
successfully refolded to gain soluble protein by the method of rapid dilution (data not shown).
The C-terminus of Chup1 was obtained in a soluble form and purified over Ni-NTA column
(Figure 26 B). With the proteins in hand, in vitro binding experiments could be initiated.
53

RESULTS
Figure 26 Expression of Chup1 A: radioactively [35S]Met labelled translation product (TP) from in-vitro translation in wheat germ with CHUP1-pDest as template, autoradiography from SDS-PAGE gel. B: Coomassie stained SDS-PAGE gel from elution fractions of Chup1-CT expressed in E. coli and purified over Ni-NTA sepharose (lane 1 0.8 µg and lane 2 4 µg protein loaded). C: Translation product of CHUP1 pDEST17 in wheat germ extract (WG, lane 1) or reticulocyte lysate (lane 2), subjected to SDS-PAGE and autoradiography.
4.6.2 Purification of plant actin
For interactions studies of actin with the chloroplast and Chup1, actin had to be purified from
endogenous plant sources. Actin can readily be gained from muscle tissue of different species.
Protocols for the isolation of actin from plant tissue were limited and not satisfying (Diaz-
Camino and Villanueva 1999). The problems for actin purification from plants consisted in
the lower concentration of actin and high protease content in plant tissue preparations.
Following the protocol from Diaz-Camino and Villanueva published in 1999 and adapting it
from Phaseolus vulgaris to Pisum sativum plants (see 3.2.4.2), a sufficient amount of actin
could be prepared for experiments.
For the purpose of purification DNaseI was coupled to sepharose for affinity chromatography
of actin from plant extracts. Figure 27 (lane 1) shows the actin purified from pea compared to
actin from chicken obtained from Sigma (lane 2). In lane 3 (Figure 27), the specificity of the
anti actin antibody from sigma against pea actin is shown. Also, no cross-reactivity of the
actin-antibody with antigenes from the outer envelope was observed during incubation of the
outer envelope vesicles with pea actin
54

RESULTS
Figure 27 Actin purified from pea, specificity of actin antibody. Pea actin (lane 1), actin from Sigma (lane 2) and pea actin pelleted with outer envelope vesicles (OEV, lane 3) were immunodetected with actin antibody
4.6.3 Interaction of actin with the outer envelope of chloroplasts
As a first measure to characterize the molecular events in chloroplast movement, the
participation of actin - which was proposed to be involved by inhibition experiments (see 2.3)
- had to be confirmed. Therefore, an interaction of chloroplasts and actin either directly or
through linker complexes is indispensable for a participation of actin in chloroplast movement
in this respect.
In Figure 28 pea actin was incubated with outer envelope vesicles from pea at conditions
omitting the polymerization of G-actin. A co-sedimentation of actin together with the OE can
be detected (Figure 28, lane 2 vs. lane 4). Interestingly, a minor fraction of actin is also found
in the envelope fraction (lane 2) prior to the addition of actin, which is removed by protease
treatment (lane 8). The association of actin with the OE is a proteinaceous interaction, as a
treatment of the OE with trypsin, to digest protein domains not protected by the membrane,
results in a loss of interaction (lane 6 vs. lane 4). The occurrence of actin in the supernatant
after incubation with protease treated membranes (lane 5) proves the efficient removal of
protease activity by trypsin inhibitors. Without the addition of OE, G-actin is not found to
pellet, which demonstrates that monomeric actin was present (lane 9, 10) and the precipitation
reflected specific binding.
55

RESULTS
Figure 28 Interaction of actin with the outer envelope of chloroplasts. Outer envelope membranes (lane 1-8) were incubated with G-actin (lane 3-6) or without G-actin (lane 1, 2). Lanes 5-8 were treated with trypsin. For control G-actin alone was processed (lane 9, 10) Supernatant (S) and membrane fraction (P) were separated by centrifugation.
To assess the binding properties of actin to the OE, a kinetic of the association was conducted
(Figure 29). Already at 0 min, actin can be found in the pellet (lane 2), which might reflect
endogenous actin bound to the membrane fraction (see Figure 28, lane 2) or a rapid
interaction. When comparing lane 4 vs. lane 6 (Figure 29), it can be observed that the binding
of actin to the outer membrane fraction of chloroplasts is rapid and saturated already after 10
min under the conditions used.
Figure 29 Interaction of actin with outer envelope, time scale. Outer envelope membranes were incubated with G-actin (lane 1-6) for 10 (lane 3, 4) or 20 min (lane 5, 6) and supernatant (S) and membrane fraction (P) were separated by centrifugation. In lane 1, 2 samples were centrifuged directly after addition of actin. Equal amounts of pelleted membrane fraction and supernatant subjected to SDS-PAGE, transferred and stained with actin antibodies are shown.
4.6.4 Complex formation by Chup1 and actin
To challenge the proposal that Chup1 is the OE receptor recognizing actin, based on the motif
search (4.4.2), F-actin was incubated with in-vitro translated Chup1 protein. F-actin is a high
molecular weight complex and is sedimented at accelerations of 300 000g for 1h, which can
be used to study the interaction of factors. A specific interaction of Chup1 with F-actin can be
observed, because Chup1 sediments after addition of F-actin (Figure 30). It does not sediment
significantly in the absence of actin (lane 2) or in the presence of G-actin (lane 8).
56

RESULTS
Furthermore, F-actin is not able to precipitate Toc34 (lane 6) – an outer envelope protein -
confining the specificity of the Chup1-actin interaction.
Figure 30 Cosedimentation of Chup1 and F-actin. Radioactively labelled Chup1 (lane 1-4, 7, 8) or Toc34 (lane 5, 6) were incubated with F-actin (lane 3-6) or G-actin (lane 7, 8) and supernatant (S) and pellet fraction (P) were separated by centrifugation, subjected to SDS-PAGE and autoradiography.
The interaction of Chup1 with actin, however, is not dependent on the filamentous state of
actin. Chup1 can be specifically immunoprecipitated by antibodies against actin after addition
of G-actin (Figure 31). Chup1 is retained on the column by G-actin and only eluted in low pH
(lane 5), whereas it is not retained by the control (lane 4 and 6).
With Chup1 being present in the outer envelope (Figure 21, Figure 25) and actin associated
with the outer envelope (Figure 28) and additionally interacting with Chup1 (Figure 30,
Figure 31), Chup1 might well be one interaction partner of actin present at the outer envelope
membrane.
Figure 31 Immunoprecipitation of radioactively labelled Chup1 with G-actin. Chup1 (lane 1, 2; FT, flow through) incubated with G-actin was immunoprecipitated by anti-actin (lane 5; E elution) or control antibodies (lane 6, E elution). The wash of the column is shown in lane 3, 4 (W, wash). Fractions were submitted to SDS-PAGE and autoradiography.
4.7 Chup1 profilin interaction
From sequence information, for Chup1 a profilin binding motif PRM1 (Holt and Koffer 2001)
can be classified from the proline-rich region (Figure 16). A binding of Chup1 to profilin is
57

RESULTS
conceivable, as profilin is a multifunctional actin binding protein. Thus, a function of profilin
in chloroplast movement can be considered (see Discussion). To test this hypothesis, binding
studies were conducted to prove an interaction of Chup1 and profilin.
4.7.1 Profilin purification and confirmation of functionality
Profilin was purified from P.sativum or A. thaliana with the use of poly-L-proline affinity
chromatography by the method of Vidali et al. (1995). Profilin has a high affinity to PLP as it
naturally binds to proline-rich proteins in vivo. Profilin was recovered in high quantities and
in high purity (Figure 32).
Figure 32 Profilin purification. Profilin isolated from pea extract by poly-L-proline affinity chromatography. Flow through (lane 1), wash (lane 2) and elution fraction (lane 3) were subjected to SDS-PAGE and silver stained.
To test whether profilin isolated from plant extracts by the described method is functional, its
ability to bind actin was assayed. Profilin was initially described as an actin binding protein,
interacting with actin in a 1:1 complex (Carlsson et al. 1976). Therefore actin binding to the
isolated plant profilin was tested. The fluorescence quenching of tryptophan in proteins results
from excited state encounters of the tryptophan with the functional groups of the amino acids
in the surrounding protein (Harris and Hudson 1990). This is also true for the formation of the
profilin-actin complex, which is accompanied by a change in tryptophan fluorescence.
Perelroizen and colleagues (1994) observed that the fluorescence intensity of the tryptophans
for a mixture of actin and profilin was lower than the sum of the intensities measured for actin
or profilin alone. The fluorescence quenching results from the quenching of fluorescence of
the tryptophans upon interaction, which are present in the profilin binding pocket of actin.
58

RESULTS
Figure 33 Fluorescence emission spectrum of profilin and actin. Tryptophan fluorescence of actin (solid black line), profilin (dashed-dotted line), actin and profilin together (B) at the same concentrations as before (dashed line) and difference spectrum of the added single fluorescence spectra of actin and profilin subtracted by the spectrum of actin and profilin together (A +P –B, solid grey line) at an excitation wavelength of 295 nm.
The purification process yielded functional profilin (Figure 33). The fluorescence emission
spectra of actin, profilin and the actin-profilin complex are shown. The difference spectrum
(A + P- B) (Figure 33, grey line) has a lower fluorescence emission than the single spectra of
actin or profilin alone and thus displays the tryptophan quenching of the actin-profilin
complex. Therefore it can be assumed that the binding properties of profilin were conserved
during the purification process and that profilin is active.
4.7.2 Interaction of Chup1 and profilin
To determine, if an interaction of Chup1 and profilin can occur, the purified profilin was
spotted on nitrocellulose membrane. The immobilized profilin was incubated with in-vitro
translated radioactively labelled Chup1 protein (Figure 26 A). A specific concentration-
dependent binding of Chup1 to profilin was observed (Figure 34 A, lane 2). No association of
Chup1 to the likewise spotted control protein BSA was detected (Figure 34 A, lane1). This
result demonstrates that Chup1 is interacting with profilin.
59

RESULTS
Figure 34 Binding of Chup1 and profilin. A In-vitro translated Chup1 was incubated with indicated amounts of BSA (lane 1) or profilin (lane 2) on an affinity matrix. The binding was visualized after extensive wash steps by autoradiography. B Chup1 in-vitro translation product was incubated with an affinity matrix coated with 20µg of casein or profilin treated with phosphatase (Profilin – P) or without treatment (Profilin). The binding was visualized after extensive wash steps by autoradiography.
4.7.3 Interaction of Chup1 and profilin occurs independent of phosphorylation
Plant profilin can be phosphorylated in vivo (Guillen et al. 1999, Limmongkon et al. 2004).
Phosphorylation is thought to alter the specificity of profilin for different proline-rich domain
containing proteins (Aparicio-Fabre et al. 2006). It was demonstrated by (Sathish et al. 2004)
that the affinity of phosphorylated profilin to poly-L-proline is higher than the affinity of the
unphosphorylated form. Thereby an enrichment of the phosphorylated profilin through the
purification process using the affinity chromatography on PLP sepharose is likely. To test
whether the phosphorylation of profilin affects the binding to Chup1, profilin was
phosphatase treated. Chup1 then was incubated with profilin or the phosphatase treated
profilin and casein as control protein immobilized on nitrocellulose membrane. However, no
alteration of the binding efficiency of Chup1 towards profilin was observed, because the
association was not altered by phosphatase treatment of profilin (Figure 34B).
4.7.4 Interaction of Chup1 and profilin in vivo
A remarkable observation was made, when ∆N-Chup1-GFP and profilin-RFP were co-
expressed in the same protoplast. When profilin-RFP is expressed in the absence of ∆N-
Chup1-GFP, it is distributed in the cytoplasm (Figure 35 E) and in part in the nucleus (not
easily seen in Figure 35). This localisation is consistent with the function of profilin as a
multifunctional actin filament regulating protein. The localisation of profilin in the nucleus
60

RESULTS
has been explained with a function in inhibiting actin filamentation in the nucleus (Stüven et
al. 2003) and/or with a role of profilin in pre-mRNA splicing (Skare et al. 2003).
When profilin is now co-expressed with ∆N-Chup1, this localization changes to adopt a
punctuate pattern like that observed from ∆N-Chup1 (Figure 23 B). Indeed, a co-localization
of profilin-RFP and ∆N-Chup1-GFP can be observed (Figure 35 B, C). The overexpression of
∆N-Chup1-GFP directs profilin-RFP to the sites of ∆N-Chup1-GFP accumulation. The
punctuate pattern formed by profilin-RFP is dependent on the presence of ∆N-Chup1-GFP.
Figure 35 Interaction of ∆N-Chup1-GFP and Profilin-RFP. A-C Co-expression of ∆N-Chup1-RFP and profilin-RFP in A.thaliana protoplasts, autofluorescence (left), GFP (middle), RFP (right). D-E expression of profilin-RFP, autofluorescence (left), RFP (middle)
4.7.5 Delimitation of the profilin binding domain in Chup1
To test the prediction of the profilin binding motif present in the C-terminal part of Chup1 and
to delimit the binding activity to the PRM1 motif in Chup1, a construct of the C-terminal part
of Chup1 (Chup1-CT) was used (Figure 26). Chup1-CT includes the PRM1 motif but lacks
other predicted functional domains (except a short coiled-coil Figure 20). The interaction
between Chup1 and profilin is indeed mediated by the proline-rich domain, because the C-
61

RESULTS
terminal part of Chup1 including the PRM1 motif efficiently interacts with profilin (Figure
36). A concentration dependent binding of profilin to Chup1-CT can be detected by staining
with profilin antibody. A cross-reaction of the antibody with Chup1-CT can be excluded from
Figure 36 (upper panel). The casein control protein shows no interaction with profilin.
Figure 36 Binding of Chup1-CT to profilin. Chup1-CT (or casein as control) was spotted in indicated amounts on the affinity matrix and incubated with profilin (lower panel) or without profilin (upper panel), and immunostained with anti-profilin.
4.8 Interplay of actin, profilin and Chup1
It was now important to explore the combined interaction between actin, profilin and Chup1.
Fluorescent labelling of profilin with dansylchloride [5 (dimethylamino) naphtalene-1-
sulfonyl chloride] (Weber 1952) was used to measure interaction of profilin to Chup1. The
dansyl group covalently interacts with the primary amine in lysines present in the protein (e.g.
Haugland 2003). To analyze whether Chup1 modulates the interaction between profilin and
actin, the fluorescent emission spectrum of dansylated profilin, incubated with actin or
Chup1-CT was measured. An increase of the dansyl fluorescence (e.g. Enguita et al.1996) is
expected upon interaction. Indeed, the expected increase in fluorescence was obtained (Figure
37A); the fluorescence spectrum of dansyl-profilin incubated with actin or Chup1-CT
exceeded the fluorescence of the dansyl-profilin/BSA control or that of dansyl-profilin alone.
The fluorescence increased in a concentration dependent manner, when Chup1-CT was
titrated to dansyl-profilin (Figure 37 B).
To determine whether Chup1-CT influences the interaction of actin and profilin, Chup1-CT
was titrated to a mixture of profilin and actin. The observed fluorescence was corrected for
the fluorescence induced by profilin-Chup1-CT and the remaining signal was normalized to
the initial fluorescence induced by the actin-profilin interaction itself. A Chup1-CT
62

RESULTS
concentration dependent increase of the fluorescence was obtained (Figure 37 C), indicating
an interaction of the three proteins.
Figure 37 Fluorescence measurements of dansyl-profilin. A Profilin labelled with dansyl (0.4µM, solid line) was incubated with 0.25µM BSA (dashed line), 0.1µM actin (dashed – dotted line) or 0.1µM Chup1-CT (dashed - double dotted line) and the fluorescence was determined exciting with 337nm. B The fluorescence increase of dansyl-profilin (0.4µM) at 450nm at different Chup1-CT concentrations was determined. The line shows the least square fit to Fmax*cChup1-CT/(KD + cChup1-CT). C 0.4µM dansyl-profilin was incubated with 0.2µM actin and fluorescence was determined in the presence of increasing amounts of Chup1-CT. Shown is the difference of the fluorescence of dansyl-profilin in the presence of actin and in the absence of actin normalized to the initial fluorescence of dansyl-profilin bound to actin in the absence of Chup1-CT
63

DISCUSSION
5 Discussion
Chloroplast movement is of high importance for chloroplast integrity and the plant’s light
gathering ability. The hazardous impact of light on the photosystems as well as the crucial
gathering of light for energy is a double-edged sword for the chloroplast. A tight balance has
to be kept to ensure optimal conditions for the chloroplast in different light fluence rates.
Chloroplast movement is a major part of the system ensuring the right balance. The
involvement of Chup1 in chloroplast movement has been demonstrated in phenotypic
observations. A biochemical analysis of Chup1 however was lacking. As light is the trigger
for regulation of chloroplast movement, the global gene expression in response to light was
analysed by expression profiling.
Expression profiling of changes induced by blue light and the chup1 mutation
From a global expression profile of wild type plants in response to blue light stimulus the
expression of blue light sensitive genes was tested. After 5 min of blue light treatment only 3
genes were found to be regulated. A chloroplast localized superoxide dismutase was found
with an enhanced transcript level that is possibly regulated by a microRNA. The regulation of
transcript levels by blue light regulated miRNAs would point to a novel blue light regulating
pathway in plants. Furthermore, the level of reactive oxygen species - that were found to be
involved in signalling to the actin cytoskeleton (Choi et al 2008) - could apply regulatory
force for the chloroplast in signalling to actin.
The analysis of the obtained data for the genes directly involved in chloroplast movement,
namely Phot1/2, Jac1, Pmi1/2/15, leads to the conclusion that chloroplast movement is not
causally regulated by gene expression, as no drastic change in expression was detected.
Chloroplast movement has been shown to be insensitive to the loss of the nucleus in fern
(Wada, 1988). From the conducted microarray experiments, the conclusion can now be drawn
that chloroplast movement in higher plants is likewise not transcriptionally regulated. This
might, however, not be the case for components of the signal cascade upstream of the
mentioned targets, as many light regulated kinases were found.
In this study the chloroplast unusual positioning phenotype of Chup1 discovered by Kasahara
et al. (2002) was confirmed with an independent knock-out mutation in the CHUP1 gene. The
chloroplasts in this mutant are unable to react to strong light with avoidance movement
(Figure 11). This manifests Chup1 as indispensable for chloroplast movement.
64

DISCUSSION
From expression analysis, a differential regulation of genes responding to high light treatment
was found for the wild type and the ∆chup1 mutant (Figure 12). Strikingly, most of the genes
altered in their expression in response to the deletion of CHUP1 are found to be up-regulated
in wild type plants in response to enhanced light conditions. This can be explained by a shift
in the sensitivity to light in ∆chup1 as an adaptation mechanism to strong light caused by the
lack of protection for the chloroplasts by the defect in chloroplast movement (Kasahara et al.
2002). Furthermore, most of the regulated genes were involved in stress response. This may
reflect adaptation to environmental conditions of the mutant and might give a link of the
signal cascades of stress induced changes and light stimulus.
psChup1 is a putative functional homologue of atChup1
From RACE experiments, a homologue of atChup1 in pea was discovered (Figure 14, Figure
15, Figure 16, Figure 18). The high overall sequence homology as well as the high
conservation of the functional Chup1 domains, the N-terminal hydrophobic domain, the
coiled-coil domain, the actin-binding domain and the PRM1 profilin binding domain, makes
psChup1 a very likely candidate for a Chup1 functional homologue in pea. In this screen no
other isoforms were detected, as is the case for Physcomitrella patens Chup1, where two
isoforms Chup1a and Chup1b have been submitted to the database.
Several sequences from a range of plant species were found with a high similarity to the C-
terminus of atChup1, which were not included in this study as it can not be judged at this time
whether they have an implication on chloroplast movement. Nonetheless, these proteins
highlight the conserved structure of the C-terminus, which might be interesting for future
studies. For example in a BLAST search a protein from Medicago was found to share high
similarity with the C-terminus. This protein is designated a phosphoinositide-binding (clathrin
adaptor). A function in phosphoinositide binding could be important for regulatory action
with respect to profilin (see below).
Chup1 targeting and localization
In a previous study (Oikawa et al. 2003), the localization of Chup1 had been determined
solely via a 25 aa fragment of the N-terminus of the protein. In this study, the aim was to
discover the actual site for targeting information and the inherent targeting information of the
full-length protein. It could be observed, that the full length Chup1-GFP protein is targeted to
the chloroplast (Figure 21). Thus, no other targeting information is conveyed by the full-
length protein in comparison to the N-terminus alone (Oikawa et al. 2003). The chloroplasts
65

DISCUSSION
are in most cases evenly surrounded by Chup1-GFP fluorescence, but in a number of cases
the fluorescence was forming a pattern in all observed protoplasts of the sample (Figure 22
A). Here, Chup1-GFP is apparently localized at the contact sites between chloroplasts. The
conditions under which such a localisation appeared were not determined, but they could
reflect a more specific structuring of Chup1 under certain conditions (e.g. light intensity,
calcium concentration etc.). The observed more intense regions of fluorescence at certain
parts on the chloroplast (Figure 22 D, G, I) could display regions where contact to interaction
partners (e.g. actin sites) is maintained and a higher protein concentration is favourable. They
could however also be caused by artificial overexpression under a strong promoter. The
observation of vesicular structures in some cases (Figure 22 G, H) remains however more
elusive. Whether they reflect a physiological localization –which is unlikely as only rarely
observed - or result from overexpression artefacts can not be judged by this experiment.
The influence of the N-terminal hydrophobic domain on the targeting of Chup1 was
investigated, as it was proposed, that it could function as a membrane anchor for Chup1 at the
chloroplast envelope (Oikawa et al. 2003). Indeed, the N-terminal hydrophobic domain could
be identified as the explicit signal for targeting. A deletion of the hydrophobic domain led to
abolition of the targeting (Figure 23). This proves, that the N-terminus is not only sufficient
(Oikawa et al. 2003), but also essential and is the only targeting information for targeting to
the chloroplast surface.
To determine, where the mis-targeting of ∆N-Chup1-GFP in the cell was directed to,
localization to mitochondria or the Golgi apparatus was assayed, which can form a similar
punctuate pattern in the cell. ∆N-Chup1-GFP was shown to neither localize to mitochondria
(Figure 23 D) or the Golgi (not shown). Thus the most plausible explanation is that the ∆N-
Chup1-GFP construct aggregates in the cytoplasm possibly caused by the lack of being able
to target to its proper destination.
To determine, whether ∆N-Chup1-GFP can be directed to the actin cytoskeleton by means of
the actin binding domain, a co-expression with the actin marker fABD2-RFP was conducted.
An association of the ∆N-Chup1-GFP signal with the RFP signal from actin was however not
determined. The ∆N-Chup1-GFP protein thus may be in a (unfolded) state not allowing
association of the actin binding domain with actin.
An additional observation could be made in the process. By staining protoplasts with the actin
marker fABD2-GFP, an intact cytoskeleton was observed, with fine structures being visible.
The actin filaments were detected in the vicinity of the chloroplasts, surrounding them
66

DISCUSSION
closely. This confirms the observation of the basket-like structures, detected by Kandasamy
and Meagher (1999) and Kwok and Hanson (2004).
As several aspects were pointing to a possible dual localisation of Chup1, this had to be
excluded experimentally. A dual localisation was discovered for the light receptor Phot2,
which is a crucial factor in chloroplast movement and relocalizes to the Golgi. Also, a
targeting for Chup1 to the secretory pathway and glycosylation was predicted (by prediction
programs) and recent research discovered protein transit from the Golgi to the chloroplast
(Villarejo et al. 2005).
An alternate localisation for Chup1 was, however, not observed under the presence of the
secretion- and vacuolar protein transport inhibitor BFA (Figure 24). Targeting of Chup1 to the
chloroplast via the secretory pathway can thus be excluded. This is also in line with the
observation, that light-induced chloroplast movement was observed even in the presence of
BFA (Kong et al. 2006). Chup1 is thus targeted to the chloroplast via the classical
translocation pathway (e.g. Soll and Schleiff 2004) mediated by the N-terminal domain and
not through vesicle transport.
An alternative pattern of Chup1 localization at the chloroplast envelope through different
environmental stimulus, however, is conceivable (Figure 22 A).
Chup1 and actin both interact with the outer envelope
Chup1 localization to the chloroplast has been confirmed by GFP studies (Figure 21). A more
accurate experiment was needed, to determine the localization of the protein and to exclude
localization in the inner envelope or the inter-membrane space, which can not be
differentiated by GFP fluorescence from localization at the outer envelope. As expected,
Chup1 as well as Chup1-NT indeed bind to isolated outer envelope from chloroplasts (Figure
25). This is also again evidence for the N-terminus functioning as a membrane anchor for
Chup1. Furthermore, actin isolated from pea was co-precipitated with the outer envelope
(Figure 28). This interaction was protease sensitive (Figure 28, lane 6), and is thus dependent
on a proteinaceous component residing in the outer envelope, which was not removed by the
isolation process for the outer envelope and is thus an integral membrane protein on the outer
periphery.
Some time after the experiments for this study were conducted, Kumatani et al. (2006) could
show the interaction of F-actin with chloroplasts from spinach. This experiment nicely
confirms the results shown here, that actin interacts with the chloroplast. In addition to this, it
67

DISCUSSION
is now clear that the chloroplast is able to bind G-actin (Figure 31) as well as F-actin, which
adds up to our knowledge.
In a time scale experiment a fast interaction of actin with the outer envelope was
demonstrated (Figure 29). The quick interaction points to a high affinity actin binding site in
Chup1. The actinin-like actin binding domain that is modified a trifle in Chup1 might
therefore still be able to mediate efficient binding. An exact relation of the proposed actin
binding site to the actin binding function and exclusion of further sequence motif influences
have to be tested in future. A rapid binding of actin to the chloroplast is essential for
chloroplast movement - if a timely reaction to environmental stimulus is considered a
precondition. In line, a light sensitive rapid rearrangement of the actin cytoskeleton in
preparation for chloroplast movement at a time scale of 10 min was observed by Sakurai et al.
(2005).
To a small extent, endogenous actin was found to be present in outer envelope fractions
(Figure 28). In the chloroplast preparations from Kumatani et al. 2006, no actin was found to
be present any more on the chloroplasts after the isolation. Explanations for this might either
be a more sensitive detection in this study, a different isolation protocol and spinach/pea
diversities or different environmental conditions (e.g. light conditions) that favour anchoring
to actin.
Chup1 interacts with G- and F-actin
As both actin and Chup1 can bind to the outer envelope it was logical to assume that Chup1
interacts with actin at the chloroplast by means of its actin binding domain. Already Oikawa
et al. (2003) detected the actinin-like actin binding domain in Chup1 (see chapter 4.4.2.2). In
the work of his group, the actin binding domain of Chup1 was expressed with a GST-tag and
co-immunoprecipitated with F-actin. In this work the aim was now to assay the properties of
the native full length protein in the interaction with actin. Indeed, Chup1 was found to be co-
sedimented with F-actin (Figure 30, lane 4). An interaction of Chup1 and F-actin can thus
take place under the given conditions in-vitro. Even more, as Chup1 does not induce
sedimentation of G-actin (Figure 30, lane 8), a direct function of Chup1 in polymerization of
actin can be excluded. In a co-immunoprecipitation experiment, Chup1 was found to interact
also with G-actin (Figure 31). Interestingly, Chup1 thus is able to interact with both G- and F-
actin (Figure 30, Figure 31). As stated before, dual binding of actin was also found for the
proteinaceous component on the chloroplast that interacts with actin. Only a few actin binding
proteins have been reported to bind G- as well as F-actin, such as for instance gelsolin and
68

DISCUSSION
calponin (Ferjani et al. 2006). The ability to bind both G- and F-actin can bestow regulating
properties. This was proposed for calponin, where a turnover of the actin cytoskeleton is
thought to be sensed by calponin which as a result could perform a signalling function
(Ferjani et al. 2006).
The conclusion can now be made, that Chup1 is the interaction partner of actin present in the
outer envelope (Figure 21, Figure 25, Figure 30, Figure 31) and thus the true “missing link”
that ties chloroplasts to the actin cytoskeleton and is responsible for chloroplast movement.
As this is indeed very conceivable, the binding of Chup1 to G- and F-actin would imply now
a regulatory function for Chup1. It is imaginable, that Chup1 is bound to G-actin (and maybe
also functions as monomeric actin storage pool) when a temporary release from the F-actin
filaments is necessary upon movement, and that a tethering to F-actin filaments is favoured
under conditions when no movement action is required. In this case the F-actin binding ability
of Chup1 may be decisive.
A binding of Chup1 to G-actin could be initiated by increasing amounts of G-actin in the
surrounding medium by actin sequestering proteins and thus lead to a release of the
chloroplast from actin filaments by a change in binding of Chup1 to G-actin rather than F-
actin. (The anchoring of the chloroplast would thus be abolished, but a re-binding to the
filament could set in at a later moment, when the (stronger) actin tracks for movement have
been re-built). Under which conditions an interaction of Chup1 with G-actin or F-actin is
favoured has to be elucidated in future studies. Apart from competition in binding, also a
change in light conditions, in interaction with different modulator proteins/second messengers
or in ionic conditions in the medium is conceivable.
Discovery of the Movement Complex?
For interaction studies, functional profilin could be purified from pea leaf tissue. The binding
properties of profilin were retained, as was determined by tryptophan quenching in complex
with actin (Figure 33).
An interaction of Chup1 and profilin could be proven by different binding experiments
(Figure 34 and Figure 36). The involvement of an interaction domain present in the C-
terminal part of Chup1 was shown with recombinantly expressed Chup1-CT (Figure 36). The
interaction site of profilin and Chup1 has thus to be located in the C-terminal part of Chup1.
This is strong evidence for the PRM1 motif to act as the binding domain for profilin.
69

DISCUSSION
It remains to be unravelled by site-directed mutagenesis, whether the conserved proline
structure “positive-PPP-positive” in the Chup1 orthologs is also important for mediating
interaction (see 4.4.2.3).
In co-expression experiments with ∆N-Chup1-GFP and profilin-RFP, a striking observation
was made (Figure 35 B, C). Profilin-RFP is targeted to the sites of ∆N-Chup1-GFP
agglomeration in the cell. Such a pattern of localisation is not observed when profilin-RFP is
expressed without presence of ∆N-Chup1-GFP. In this case, profilin is rather evenly
distributed in the protoplast (Figure 35 E). This observation can be interpreted as an
interaction of Chup1 and profilin in a cellular environment. An in-vivo interaction of profilin
and ∆N-Chup1 in the cell thus is likely. It can not be determined, however, whether ∆N-
Chup1-GFP is in an active and properly folded state. An unspecific co-aggregation of
profilin-RFP with aggregated ∆N-Chup1 can thus not be entirely excluded, but is unlikely in
the light of the observed Chup1-profilin interaction in the previously shown experiments.
Still more evidence for the interaction of Chup1 and profilin was gained from fluorescence
experiments with dansyl-profilin. The interaction of Chup1-CT and profilin could be
confirmed. An increase in fluorescence was observed when Chup1-CT was mixed with
dansyl-profilin (Figure 37 A); this increase was of a comparable level as the increase
observed with actin and dansyl-profilin. This leads to the assumption that the binding
efficiency of Chup1 to profilin also is at a comparable level. The interaction of Chup1-CT and
dansyl-profilin was demonstrated to be concentration-dependent (Figure 37 B).
Furthermore, a concentration dependent increase in fluorescence was observed, when the
fluorescence of Chup1 profilin and actin corrected for the fluorescence of Chup1 and profilin
was determined (Figure 37 C).
From these results it can be concluded, that Chup1-CT, actin and profilin can interact as a
trimeric complex. Only if Chup1 interacts with a dansyl-profilin-actin complex an increase of
fluorescence is conceivable, as profilin interacts with actin in a 1:1 complex.
As it is assumed, that the C-terminus of Chup1 is not directly interacting with actin (as the
actin binding domain is not present in Chup1-CT) an alternating complex between Chup1-
profilin and Chup1-actin would in any event be unlikely. Thus, as a competition in binding
would not take place, a trimeric complex is the logical conclusion. In the given case, in the
70

DISCUSSION
trimeric complex, actin is interacting with Chup1-CT through profilin. The results suggest
that the trimeric complex is more stable than the individual binary complexes.
A constellation with Chup1 binding both actin and profilin singularly with the respective
binding domains is not tested by this procedure. It is nonetheless likely and conceivable in the
context of chloroplast anchoring through Chup1 as discussed beforehand, and might have
high relevance in vivo. This other trimeric complex thus awaits still its experimental proof.
Is the discovered trimeric complex of Chup1, actin and profilin now acting as the sought after
“movement complex” at the chloroplast outer envelope? This complex would at least have all
the required functions necessary to initiate movement. In this scenario, Chup1, situated at the
outer envelope, functions as the membrane anchor with its hydrophobic domain and interacts
with G- and F-actin. The modulating action of polymerizing and depolymerizing actin
filaments is done by profilin, which can be recruited to the chloroplast by Chup1 (due to its
PRM1 motif). Profilin in complex with actin (profilactin) can deliver actin monomers to the
vicinity of the chloroplast, where polymerization action is needed.
As profilin is likely to play a key part in chloroplast movement, our attention should be
directed to profilin in the next section.
Profilin, in fact, is a key regulator of the actin cytoskeleton (Theriot and Mitchison 1993, e.g.
Sohn and Goldschmidt-Clermont 1994, Staiger et al. 1997). Profilin’s regulation of actin and
its involvement in signalling to the cytoskeleton and regulatory functions in the cell is a well
researched on topic. This is due to the fact that profilin is an abundant multipotent protein that
has a multitude of interactors and serves as a hub to control complex interaction networks and
whose versatile activities are essential for cell viability (e.g. Sohn and Goldschmidt-Clermont
1994, Witke 2004, Yarmola and Bubb 2006). A cue to the importance of profilin in the cell is
seen by its sheer abundance in the cell as profilin content can reach up to an amount of 0.3%
of total protein in Arabidopsis leaves (Chaudhry et al. 2007). Plants have large multigene
families encoding profilins, and different tissues or cells can express multiple profilin
isoforms. In Arabidopsis five profilin isoforms are encoded: constitutive profilin (PRF1-3)
expressed in leaf tissues (Jeong et al. 2006) and pollen specific profilin (PRF4, 5, Kandasamy
et al. 2002). The profilin isoform to interact with Chup1 in chloroplast movement has to be
identified in future.
Importantly, the interaction of profilin with proline-rich proteins is thought to direct profilin
to sites of rapid actin assembly and is involved in regulating profilin activity (e.g. Gibbon et
71

DISCUSSION
al. 1998, Paavilainen et al. 2004). This now places Chup1 again in a more central role in the
regulation of chloroplast movement.
Profilin has to be considered a global player for many actin-filament dependent cellular
functions including the positioning of chloroplasts. Adding to profilin’s role as an important
factor in chloroplast movement, profilin action could be regulated by signalling pathways,
similar to the ones discovered in mammals, which will be discussed in the following chapter.
But still, a quest for other components of the “movement complex” is desirable.
Chup1 and profilin and the network of movement regulation
To fit Chup1 and profilin in to the regulatory network, the signalling to the chloroplast has to
be understood. On the basis of the experimental evidence gained from this study and evidence
from literature, a model for a signalling cascade for light induced chloroplast movement was
composed (Figure 38), which was published in Schmidt von Braun and Schleiff (2007). A lot
of information has been gained in the last few years about the mechanism of light perception
of the phototropins. What is not understood today is the signalling cascade downstream of the
phototropin activation. But from the participating proteins and related signal cascades a
conclusive model can be obtained (Figure 38).
72
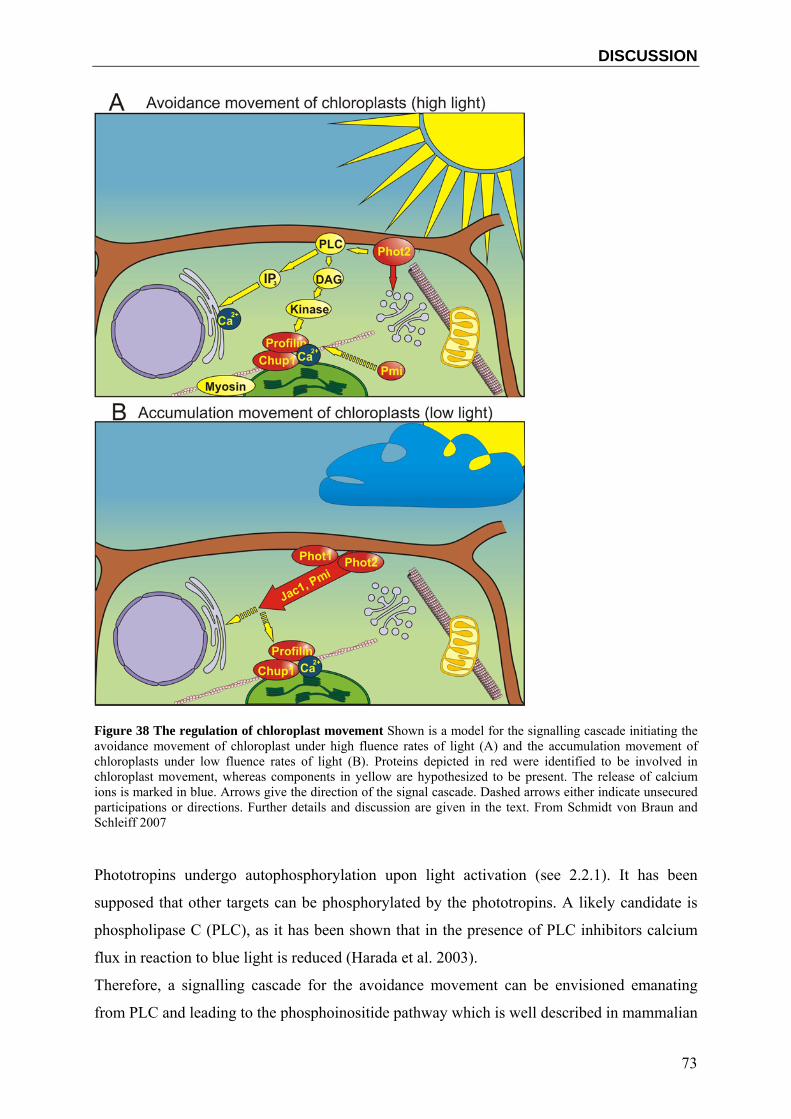
DISCUSSION
Figure 38 The regulation of chloroplast movement Shown is a model for the signalling cascade initiating the avoidance movement of chloroplast under high fluence rates of light (A) and the accumulation movement of chloroplasts under low fluence rates of light (B). Proteins depicted in red were identified to be involved in chloroplast movement, whereas components in yellow are hypothesized to be present. The release of calcium ions is marked in blue. Arrows give the direction of the signal cascade. Dashed arrows either indicate unsecured participations or directions. Further details and discussion are given in the text. From Schmidt von Braun and Schleiff 2007
Phototropins undergo autophosphorylation upon light activation (see 2.2.1). It has been
supposed that other targets can be phosphorylated by the phototropins. A likely candidate is
phospholipase C (PLC), as it has been shown that in the presence of PLC inhibitors calcium
flux in reaction to blue light is reduced (Harada et al. 2003).
Therefore, a signalling cascade for the avoidance movement can be envisioned emanating
from PLC and leading to the phosphoinositide pathway which is well described in mammalian
73

DISCUSSION
systems (e.g. Sohn and Goldschmidt-Clermont 1994). The plant counterpart PLC-II could
take this part when activated by phosphorylation through Phot2. Mammalian PLC can
hydrolyse phosphatidylinositol(4,5)bisphosphate (PIP2) to produce inositol 1,4,5-
trisphosphate (IP3) and 1,2-diacylglycerol (DAG). IP3 is known to bind to receptors on
intracellular calcium stores and trigger a calcium release (e.g. reviewed in Xia and Yang
2005, Mikoshiba 2007). A calcium increase is known to occur in plants activated by blue-
light. This calcium increase is supposed to be a crucial signal for chloroplast movement.
Support for this model also comes from two other observations. The first observation is that
plant PLC-II in turn can also be activated by calcium (Drøbak et al. 1994) which could be a
feed back regulation for chloroplast movement. In another observation, an inhibitor of
phosphoinositide-3-kinases (wortmannin) was able to inhibit chloroplast responses to blue
light in Lemna triscula (Grabalska and Malec 2004).
When following the cascade further, an interesting relation to profilin can now be considered.
In mammals, DAG activates protein kinases like protein kinase C, which in turn can
phosphorylate profilin (Guillen et al. 1999, Vemuri and Singh 2001). Furthermore, profilin is
known to interact with PLC and can thus protect PIP2 from hydrolysis (Drøbak et al. 1994).
In plants also an interaction of profilin with multiple molecules of PIP2 was observed
(Drøbak et al. 1994). Thus a “back-loop” regulation of the signal cascade by profilin is
possible. Phosphorylation of profilin was shown to have no effect on Chup1 binding (Figure
34 B), but it might well influence regulatory properties of profilin with respect to the signal
cascade. It was shown for instance in Phaseolus vulgaris, that phosphorylation of profilin in
the binding region for poly-L-proline inhibits binding to phosphoinositide 3-kinase (Aparicio-
Fabre et al. 2006).
However, in plants no real homologue to protein kinase C is identified yet (but might be soon,
compare 4.1.1.2). Hence, phosphatidic acid derived from DAG might be the important second
messenger by activation of for instance MAP kinases (e.g. Laxalt and Munnik 2002, Wang et
al. 2004). This would be a plausible option, as the phosphorylation of plant profilin by a MAP
kinase was reported (Limmongkon et al. 2004). This closes the signal cascade from Phot2 to
profilin. The mode of action and regulation of the Pmi proteins in this cascade has to be
illuminated in future, as little is known about them yet.
74

DISCUSSION
Another aspect to consider is the fact that Phot2 relocalizes to the Golgi apparatus (Kong et al.
2006) and possibly also to the chloroplast (Harada and Shimazaki 2007; Weber, Düsseldorf
personal communication). IP3 induced calcium release from the Golgi was reported (Pinton et
al. 1998). Thus, Phot2 could also directly be involved in the regulation of calcium flux from
the Golgi or even from the chloroplast which could induce specific calcium patterns. It is
tempting to speculate that the chloroplast itself takes part in regulating the movement An
involvement of the chloroplast in signalling has been suggested based on microbeam
observations, where single chloroplasts are able to specifically move in reaction to the beam
although the signal for the avoidance response can not be transported long-distance (Wada et
al. 2003). A direct participation in signalling could be assigned due to the fact that
chloroplasts exhibit a large stromal calcium spike at the transition from light to dark, induced
by the release of calcium from the thylakoid lumen and subsequently to the cytosol (Sai et al.
2002). Additionally, it was observed that DCMU, an inhibitor of photosynthesis, reduced the
motility of plastids in Vallisneria gigantea (Dong et al. 1996) and suppressed the
rearrangement of actin filaments (Sakai et al. 2005) upon light treatment. This speaks for a
signal released from chloroplasts that causes actin filament rearrangement.
Further support for the model comes from a Yeast Two Hybrid analysis conducted with
Chup1 as bait (see Suppl. Table 1). A phosphatidylinositol phosphatase was found to interact
with Chup1 and poses a direct link to the signal cascade. The same holds true for the
calmodulin-binding protein found in the screen. This could mark another contact point for
calcium to influence the activity of the proteins of the movement complex besides the above
discussed interactions. Additionally, a putative myosin heavy chain was found in the screen,
which can be an important clue for the detection of the molecular motor involved in
chloroplast movement. Evidence of myosins involved in chloroplast movement is strong (see
2.4). Furthermore, a clathrin-binding γ-adaptin was found in the screen, which functions in
vesicle-mediated transport from the Golgi or plasma membrane (Schledzewski et al. 1999).
This is interesting with respect to Jac1 which possesses a domain possibly also involved in
clathrin binding (see 2.5.2).
The regulation of the accumulation movement is even less understood (Figure 38 B). Parts of
the puzzle that could be stuck together for the avoidance movement are missing for the low-
light event. In accumulation movement, Phot1 and Jac1 seem to be major players as their
mutants display the most severe defects here.
75

DISCUSSION
Profilin and the regulation of chloroplast movement
Profilin emerges now to probably be a potent key-regulator in chloroplast movement. Profilin
is a well known modulator of the actin cytoskeleton, as it is able to induce polymerisation and
depolymerisation (Yarmola and Bubb 2006). Profilin even is considered the major link
through which the actin cytoskeleton can communicate with signalling pathways (Sohn and
Goldschmidt-Clermont 1994), which has also been implicated for plant systems (Drøbak et al.
1994, Guillen et al. 1999). Profilin can recruit actin to sites of actin polymerisation with the
help of proline-rich proteins (Paavilainen et al. 2004). In chloroplast movement, this of course
would be the role of the proline-rich protein Chup1. The profilactin complex would be
recruited to the chloroplast to initiate actin polymerisation to prepare the tracks for movement
or for anchoring the chloroplast. Interestingly, the movement of Listeria (see 2.4) also
depends on a profilin dependent polymerisation of actin for movement (Geese et al. 2000).
The interesting part is that also actin depolymerisation can be regulated by profilin.
Depending on the activities of effectors or the presence of actin capping proteins, profilin is
able to rapidly sequester actin filaments. In fact profilin was initially only realized to be an
actin sequestering protein (Carlsson et al. 1977, Pollard and Cooper 1984).
The initiation of movement involves the sequestering of the actin baskets that anchor the
chloroplasts to allow unhindered movement. A dual role for profilin in chloroplast movement
in building up new filaments or sequestering filaments would involve precise regulation.
Several modes of profilin regulation have been reported. The activity of profilin can be
regulated by phosphorylation, through proline-rich proteins, phosphoinositides and calcium
concentration. The sequestering activity of profilin has been shown previously to be
dependent on calcium concentration (Kovar et al. 2000), which would be in line with the
calcium dependence of chloroplast movement. The actin cytoskeleton status is also sensitive
to calcium concentrations (Reddy 2001, Wasteneys and Galway 2003)
To summarize, a dual activity of profilin in regulating chloroplast movement would be the
most elegant way (Figure 39). Dependent on its phosphorylation status, the calcium
concentration or regulation of activity through protein ligands, profilin could act in
polymerisation or depolymerisation of actin. A role of different profilin isoforms (Kovar et al.
2000) has to be considered as well.
Much speculation is still involved in these models, but future studies may be able to orient on
it to prove matters.
76

DISCUSSION
Figure 39 Model for Chloroplast movement involving the interaction of Chup1 profilin and actin. The model depicts the action of Chup1 at the surface of the chloroplast, recruiting profilin to initiate depolymerisation of actin baskets to release the chloroplast from the actin anchor. After the release, Chup1 recruits profilactin to initiate polymerisation of actin bundles which provide the tracks for the movement of the chloroplast to its destination. In this model, the process is regulated by the signal cascade described in the text and by additional unidentified factors interacting with the coiled-coil domain of Chup1.
5.1 Future perspectives
For the future, it will be exiting to explore the interaction of Chup1 to profilin more
specifically. Is there for instance sensitivity in the binding activity to calcium concentration?
Where exactly does the signal cascade have its point of contact, is it the interaction of profilin
with different factors (possibly dependent on phosphorylation) or the regulation of Chup1 or
actin? And to this respect, are there further factors interacting with Chup1, possibly through
the coiled-coil domain? A major task will be to unravel the interplay of the other factors (Jac,
Pmi), involved in chloroplast movement, with the signal cascade. The signal pathway itself
has to be experimentally addressed. Furthermore the identification of the myosin that is
involved in chloroplast accumulation will be important, as well as the nature of force
77

DISCUSSION
generation through actin in the avoidance movement. And eventually, the identification of the
role of the chloroplast itself in movement, taking part in the regulation of movement possibly
through calcium efflux, will be fascinating to discover.
78

REFERENCES
References
Allen GA, Schroeder JI (2001) Combining genetics and cell biology to crack the code of plant cell calcium signaling. Sci. STKE 102:re13
Altschul SF, Gish W, Miller W, Myers EW, Lipman DJ (1990) Basic local alignment search tool. J Mol Biol 215:403-410
Alonso JM, Stepanova AN, Leisse TJ, Kim CJ, Chen H, Shinn P, Stevenson DK, Zimmerman J, Barajas P, Cheuk R, Gadrinab C, Heller C, Jeske A, Koesema E, Meyers CC, Parker H, Prednis L, Ansari Y, Choy N, Deen H, Geralt M, Hazari N, Hom E, Karnes M, Mulholland C, Ndubaku R, Schmidt I, Guzman P, Aguilar-Henonin L, Schmid M, Weigel D, Carter DE, Marchand T, Risseeuw E, Brogden D, Zeko A, Crosby WL, Berry CC, Ecker JR (2003) Genome-Wide Insertional Mutagenesis of Arabidopsis thaliana Science 301: 653-657
Aparicio-Fabre R, Guillen G, Estrada G, Olivares-Grajales J, Gurrola G, Sanchez F (2006) Profilin tyrosine phosphorylation in poly-L-proline-binding regions inhibits binding to phosphoinositide 3-kinase in Phaseolus vulgaris. Plant J 47: 491-500
Avisar D, Prokhnevsky AI, Makarova KS, Koonin EV, Dolja VV (2008) Myosin XI-K Is Required for Rapid Trafficking of Golgi Stacks, Peroxisomes, and Mitochondria in Leaf Cells of Nicotiana benthamiana. Plant Physiol 146:1098-1108 Babourina O, Newman I, Shabala S (2002) Blue light-induced kinetics of H+ and Ca2+ fluxes in etiolated wild-type and phototropin-mutant Arabidopsis seedlings. Proc. Natl. Acad. Sci. USA 99:2433–2438
Baum G, Long JC, Jenkins GI, Trewavas AJ (1999) Stimulation of the blue light phototropic receptor NPH1 causes a transient increase in cytosolic Ca2+. Proc. Natl. Acad. Sci. USA 96:13554–13559
Böhm JA (1856) Beiträge zur näheren Kenntnis des Chlorophylls. S.B. Akad. Wiss. Wien, Math.-nat. Kl. 22: 479-498
Boevink P, Oparka K, Santa Cruz S, Martin B, Betteridge A, Hawes CR (1998) Stacks on tracks: the plant Golgi apparatus traffics on an actin/ER network. Plant J 15, 441-447
Boresch, K. Über fadenförmige Gebilde in den Zellen von Moosblättern. Zeitschr Botan 914:97-156
Boyes DC, Zayed AM, Ascenzi R, McCaskill AJ, Hoffman NE, Davis KR Görlach J (2001) Growth stage based phenotypic analysis of Arabidopsis: A model for high throughput functional genomics in plants. Plant Cell 13: 1499-1520
Briggs W, Beck C, Cashmore A, Christie J, Hughes J, Jarillo J, Kagawa T, Kanegae H, Liscum E, Nagatani A, Okada K, Salomon M, Rudiger W, Sakai T, Takano M, Wada M, Watson J (2001) The Phototropin Family of Photoreceptors. Plant Cell 13:993–997
Briggs WR, Christie JM (2002) Phototropins 1 and 2: versatile plant blue-light receptors. Trends Plant Sci 7:204-210
Burkhard P, Stetefeld J, Strelkov SV (2001) Coiled coils: a highly versatile protein folding motif. Trends Cell Biol.11:82-88.
Bukau B, Horwich AL (1998) The Hsp70 and Hsp60 chaperone machines. Cell 92:351-366
79

REFERENCES
Carlsson L, Nystrom LE, Lindberg U, Kannan KK, Cid-Dresdner H, Lovgren S, Jornvall H (1976) Crystallization of a non-muscle actin. J Mol Bid 105:353-366
Carlsson L, Nystrom LE, Sundkvist I, Markey F, Lindberg U (1977) Actin polymerizability is influenced by profilin, a low molecular weight protein in non-muscle cells. J Mol Biol 115:465-483
Cavalier-Smith T (2000) Membrane heredity and early chloroplast evolution. Trends Plant Sci 5:174-182
Chatre L, Brandizzi F, Hocquellet A, Hawes C, Moreau P (2005) Sec22 and Memb11 are v-SNAREs of the anterograde endoplasmic reticulum-Golgi pathway in tobacco leaf epidermal cells. Plant Physiol. 139: 1244–1254
Chaudhry F, Guérin C, von Witsch M, Blanchoin L, Staiger CJ (2007) Identification of Arabidopsis cyclase-associated protein 1 as the first nucleotide exchange factor for plant actin. Mol Biol Cell 18:3002-14
Choi Y, Lee Y, Jeon BW, Staiger CJ, Lee Y (2008) Phosphatidylinositol 3- and 4-phosphate modulate actin filament reorganization in guard cells of day flower. Plant Cell Environ 31:366-377
Christie JM, Salomon M, Nozue K, Wada M, Briggs WR (1999) LOV (light, oxygen, or voltage) domains of the blue-light photoreceptor phototropin (nph1): binding sites for the chromophore flavin mononucleotide. Proc Natl Acad Sci USA 96:8779–8783
Christie JM, Swartz, TE, Bogomolni RA, Briggs WR (2002) Phototropin LOV domains exhibit distinct roles in regulating photoreceptor function. Plant J 32:205–219
Chu CC, Lee WC, Guo WY, Pan SM, Chen LJ, Li HM, Jinn TL. A copper chaperone for superoxide dismutase that confers three types of copper/zinc superoxide dismutase activity in Arabidopsis. Plant Physiol. 2005 139: 425-36
Cinquin O, Christopherson RI, Menz RI (2001) A hybrid plasmid for expression of toxic malarial proteins in Escherichia coli. Mol Biochem Parasitol 117:245-247
Clamp M, Cuff J, Searle S M Barton G J (2004) The Jalview Java Alignment Editor Bioinformatics 20:426-427
Cooper B, Clarke JD, Budworth P, Kreps J, Hutchison D, Park S, Guimil S, Dunn M, Luginbühl P, Ellero C, Goff SA, Glazebrook J (2003) A network of rice genes associated with stress response and seed development.Proc Natl Acad Sci USA 100: 4945–4950
Davies E, Stankovic B, Azama K, Shibata K, Abe S (2001) Novel components of the plant cytoskeleton: a beginning to plant 'cytomics'. Plant Sci 160:185-196
DeBlasio SL, Luesse DL, Hangarter RP (2005) A Plant-Specific Protein Essential for Blue-Light-Induced Chloroplast Movements. Plant Physiol 139:101-114
De Castro E, Sigrist CJA, Gattiker A, Bulliard V, Langendijk-Genevaux PS, Gasteiger E, Bairoch A, Hulo N (2006) ScanProsite: detection of PROSITE signature matches and ProRule-associated functional and structural residues in proteins. Nucleic Acids Res 34:W362-5
Diaz-Camino C, Villanueva MA (1999) Purification of multiple functional leaf-actin isoforms from Phaseolus vulgaris L. Biochem J 343: 597-602
Drøbak BK, Watkins PAC, Valenta R, Dove SK, Lloyd CW, Staiger CJ (1994) Inhibition of plant plasma membrane phosphoinositide phospholipase C by the actin-binding protein, profilin. Plant J 6:389-400
80

REFERENCES
Dong XJ, Takagi S, Nagai R (1995) Regulation of the orientation movement of chloroplasts in epidermal cells of Vallisneria: cooperation of phytochrome with photosynthetic pigment under low-fluence-rate light. Planta 197:257-263
Dong XJ, Ryu JH, Takagi S, Nagai R (1996) Dynamic changes in the organization of microfilaments associated with the photocontrolled motility of chloroplasts in epidermal cells of Vallisneria. Protoplasma 195,:18-24.
Dong XJ, Nagai R, Takagi S (1998) Microfilaments anchor chloroplasts along the outer periclinal wall in Vallisneria epidermal cells through cooperation of Pfr and photosynthesis. Plant Cell Physiol 39:1299–1306
dos Remedios CG, Chhabra D, Kekic M, Dedova IV, Tsubakihara M, Berry DA, Nosworthy NJ (2003) Actin binding proteins: regulation of cytoskeletal microfilaments. Physiol Rev 83:433-473
Eads JC, Mahoney NM, Vorobiev S, Bresnick AR, Wen KK, Rubenstein PA, Haarer BK, Almo SC (1998) Structure determination and characterization of Saccharomyces cerevisiae profilin. Biochem 37: 11171–11181
Emanuelsson O, Nielsen H, Brunak S von Heijne G (2000) Predicting subcellular localization of proteins based on their N-terminal amino acid sequence. J Mol Biol 300: 1005-1016
Emi T, Kinoshita T, Sakamoto K, Mineyuki Y, Shimazaki K (2005) Isolation of a protein interacting with Vfphot1a in guard cells of Vicia faba. Plant Physiol 138:1615-1626
Enguita FJ, Liras P, Leitão AL, Martín JF (1996) Interaction of the two proteins of the methoxylation system involved in cephamycin C biosynthesis. J Biol Chem 271: 33225-33230 J Exp Bot 58:497–506
Ezaki B, Kiyohara H, Matsumoto H, Nakashima S (2007) Overexpression of an auxilin-like gene (F9E10.5) can suppress Al uptake in roots of Arabidopsis. J Exp Bot 58:497–506
Ferjani I, Fattoum A, Maciver S, Manai M, Benyamin Y, Roustan C (2006) Calponin binds G-actin and F-actin with similar affinity. FEBS Lett 580: 4801-4806
Fields S, Song O (1989) A novel genetic system to detect protein-protein interactions. Nature 340:245-246
Folta KM, Spalding EP (2001) Unexpected roles for cryptochrome 2 and phototropin revealed by high-resolution analysis of blue light-mediated hypocotyl growth inhibition. Plant J 26:471–478
Gall WE, Higginbotham MA, Chen CY, Ingram MF, Cyr DM, Graham TR (2000) The auxilin-like phosphoprotein Swa2p is required for clathrin function in yeast. Curr Biol 10: 1349–1358
Geese M, Schlüter K, Rothkegel M, Jockusch BM, Wehland J, Sechi AS (2000) Accumulation of profilin II at the surface of Listeriais concomitant with the onset of motility and correlates with bacterial speed. J Cell Sci 113:1415-26
Gibbon BC, Zonia LE, Kovar DR, Hussey PJ, Staiger CJ (1998) Pollen Profilin Function Depends on Interaction with Proline-Rich Motifs. Plant Cell 10:981–993
Gimona M, Djinovic-Carugo K, Kranewitter WJ, Winder SJ (2002) Functional plasticity of CH domains. FEBS Lett 513: 98-106
Gindullis F, Rose A, Patel S, Meier I (2002) Four signature motifs define the first class of structurally related large coiled-coil proteins in plants. BMC Genomics 3(1):9
81

REFERENCES
Grabalska M, Malec P (2004) Blue light-induced chloroplast reorientations in Lemna trisulca L. (duckweed) are controlled by two separable cellular mechanisms as suggested by different sensitivity to wortmannin. Photochem Photobiol 79:343-348
Gruber M, Söding J, Lupas AN (2006) Comparative analysis of coiled-coil prediction methods. J Struct Biol. 155:140-145
Gorton HL, Williams WE, Vogelmann TC (1999) Chloroplast movement in Alocasia macrorrhiza. Physiol Plant 106: 421–428
Gorton HL, Herbert SK, Vogelmann TC (2003) Photoacoustic analysis indicates that chloroplast movement does not alter liquid-phase CO2 diffusion in leaves of Alocasia brisbanensis. Plant Physiol 132:1529–1539
Guillen G, Valdes-Lopez V, Noguez R, Olivares J, Rodriguez-Zapata LC, Perez H, Vidali L, Villanueva MA, Sanchez F (1999) Profilin in Phaseolus vulgaris is encoded by two genes (only one expressed in root nodules) but multiple isoforms are generated in vivo by phosphorylation on tyrosine residues. Plant J 19:497–508
Harada A, Sakai T and Okada K (2003) Phot1 and phot2 mediate blue light-induced transient increases in cytosolic Ca2+ differently in Arabidopsis leaves. Proc Natl Acad Sci USA, 100:8583-8588
Harada A, Shimazaki K (2007) Phototropins and blue light-dependent calcium signaling in higher plants. Photochem Photobiol 8: 102-11
Harris DL, Hudson BS (1990) Photophysics of tryptophan in T4 phage lysozyme. Biochemistry 29:5276-5285
Haugland RP (2003) Molecular Probes: Handbook of Fluorescent Probes and Research Chemicals
Haupt W, Mörtel G, Winkelnkemper I (1969) Demonstration of different dichroic orientation of phytochrome Pr and Pfr. Planta 88:183-186
Holt MR, Koffer A (2001) Cell motility: proline-rich proteins promote protrusions. Trends Cell Biol 11: 38-46
Huala E, Oeller PW, Liscum E, Han IS, Larsen E, Briggs WR. (1997) Arabidopsis NPH1: a protein kinase with a putative redox-sensing domain. Science 278, 2120–2123
Iida A, Kazuoka T, Torikai S, Kikuchi H, Oeda K (2000) A zinc finger protein RHL41 mediates the light acclimatization response in Arabidopsis. Plant J 24:191-203
Inoue Y, Shibata K (1974) Comparative examination of terrestrial plant leaves in terms of light-induced absorption changes due to chloroplast rearrangements. Plant Cell Physiol 15: 717–721
Inada S, Ohgishi M, Mayama T, Okada K, Sakai T (2004) RPT2 Is a Signal Transducer Involved in Phototropic Response and Stomatal Opening by Association with Phototropin 1 in Arabidopsis thaliana. Plant Cell 16: 887–896
Irizarry RA, Bolstad BM, Collin F, Cope LM, Hobbs B, Speed TP (2003) Summaries of Affymetrix GeneChip probe level data. Nucleic Acids Res 31:e15
Izutani Y, Takagi S, Nagai R (1990) Orientation movements of chloroplasts in Vallisneria epidermal cells: different effects of light at low and high-fluence rate. Photochem Photobiol 51:105-111
Jarillo JA, Gabrys H, Capel J, Alonso JM, Ecker JR, Cashmore AR (2001) Phototropin-related NPL1 controls chloroplast relocation induced by blue light. Nature 410:952–954
82

REFERENCES
Jeong YM, Mun JH, Lee I, Woo JC, Hong CB, Kim SG (2006) Distinct roles of the first introns on the expression of Arabidopsis profilin gene family members. Plant Physiol 140:196-209
Kadota A, Wada M (1992) Photoinduction of formation of circular structures by microfilaments on chloroplasts during intracellular orientation in protonemal cells of the fern Adiantum capillus-veneris. Protoplasma 167:97–107
Kagawa T, Sakai T, Suetsugu N, Oikawa K, Ishiguro S, Kato T, Tabata S, Okada K, Wada M (2001) Arabidopsis NPL1: a phototropin homolog controlling the chloroplast high-light avoidance response. Science 291: 2138–2141
Kagawa T, Wada M (2004) Velocity of chloroplast avoidance movement is fluence rate dependent.Photochem Photobiol Sci 3:592-5.
Kandasamy MK, Meagher RB (1999) Actin–organelle interaction: association with chloroplast in Arabidopsis leaf mesophyll cells. Cell Motil Cytoskel 44:110-118
Kandasamy MK, McKinney EC, Meagher RB (2002) Plant profilin isovariants are distinctly regulated in vegetative and reproductive tissues. Cell Motil Cytoskel 52:22–32.
Kanehisa M, Goto S (2000) KEGG: Kyoto Encyclopedia of Genes and Genomes. Nucleic Acids Res 28:27-30
Karcher RL, Deacon SW, Gelfand VI (2002) Motor-cargo interactions: the key to transport specificity. Trends Cell Biol 12:21-27
Kasahara M, Kagawa T, Oikawa K, Suetsugu N, Miyao M, Wada M (2002) Chloroplast avoidance movement reduces photodamage in plants. Nature 420: 829-832
Katoh and Toh (2008) Recent developments in the MAFFT multiple sequence alignment program Briefings in Bioinformatics doi:10.1093/bib/bbn013
Kinoshita T, Doi M, Suetsugu N, Kagawa T, Wada M, Shimazaki K (2001) Phot1 and phot2 mediate blue light regulation of stomatal opening. Nature 414:656–660
Kliebenstein DJ, Monde RA, Last RL (1998) Superoxide dismutase in Arabidopsis: an eclectic enzyme family with disparate regulation and protein localization. Plant Physiol 118: 637-50
Kong SG, Suzuki T, Tamura K, Mochizuki N, Hara-Nishimura I, Nagatani A (2006) Blue light-induced association of phototropin 2 with the Golgi apparatus. Plant J 45: 994-1005
Kovar DR, Drøbak BK Staiger CJ (2000) Maize Profilin Isoforms Are Functionally Distinct Plant Cell Plant Cell 12:583–598
Kovar DR, Yang P, Sale WS, Drobak BK, Staiger CJ (2001) Chlamydomonas reinhardtii produces a profilin with unusual biochemical properties. J. Cell Sci. 114: 4293–4305
Kumatani T, Sakurai-Ozato N, Miyawaki N, Yokota E, Shimmen T, Terashima I, Takagi S. (2006) Possible association of actin filaments with chloroplasts of spinach mesophyll cells in vivo and in vitro. Protoplasma 229(1):45-52
Kwok EY, Hanson MR (2004) In vivo analysis of interactions between GFP-labeled microfilaments and plastid stromules BCM Plant Biol 4:2
La Claire JW II (1991) Immunolocalization of myosin in intact and wounded cells of the green alga Ernodesmis verticillata (Kutzing) Borgesen. Planta 184:209-217
La Claire JW II, Chen R, Herrin DL (1995) Identification of a myosin-like protein in Chlamydomonas reinhardtii (Chlorophyta). J Phycol 31:302-306
83

REFERENCES
Laemmli (1970) Cleavage of structural proteins during the assembly of the head of bacteriophage T4. Nature 227: 680-685
Lariguet P, Schepens I, Hodgson D, Pedmale UV, Trevisan M, Kami C, de Carbonnel M, Alonso JM, Ecker JR, Liscum E, Fankhauser C (2006) PHYTOCHROME KINASE SUBSTRATE 1 is a phototropin 1 binding protein required for phototropism. PNAS 103:10134-10139
Laxalt AM, Munnik T (2002) Phospholipid signalling in plant defence. Curr Opin Plant Biol 5: 332-338
Lee S, Kolodziej PA (2002) Short Stop provides an essential link between F-actin and microtubules during axon extension. Development 129:1195-1204
Liebe S, Menzel D (1995) Actomyosin-based motility of endoplasmic reticulum and chloroplasts in Vallisneria mesophyll cells. Biol Cell 85:207-222
Limmongkon A, Giuliani C, Valenta R, Mittermann I, Heberle-Bors E, Wilson C (2004) MAP kinase phosphorylation of plant profilin. Biochem Biophys Res Commun 324: 382-386
Luesse DR, DeBlasio SL, Hangarter RP (2006) Plastid Movement Impaired 2, a New Gene Involved in Normal Blue-Light-Induced Chloroplast Movements in Arabidopsis. Plant Physiol 141:1330-1337
Lupas A, Van Dyke M, Stock J (1991) Predicting Coiled Coils from Protein Sequences. Science 252:1162-1164
Malec P, Rinaldi RA, Gabrys H (1996) Light-induced chloroplast movements in Lemna trisulca: identification of the motile system. Plant Sci 120: 127–137
Mano S, Nakamori C, Hayashi M, Kato A, Kondo M, Nishimura M (2004) Distribution and characterization of peroxisomes in Arabidopsis by visualization with GFP: dynamic morphology and actin-dependent movement. Plant Cell Physiol 43: 331-341
Martin W, Stoebe B, Goremykin V, Hapsmann S, Hasegawa M, Kowallik KV (1998) Gene transfer to the nucleus and the evolution of chloroplasts. Nature 393:162-165
Matsuoka D, Tokutomi S (2005) Blue light-regulated molecular switch of Ser/Thr kinase in phototropin. Proc Natl Acad Sci USA 102:13337-13342
May RC, Caron E, Hall A, Machesky LM (2000) Involvement of the Arp2/3 complex in phagocytosis mediated by FcgammaR or CR3. Nat Cell Biol 2:246-8.
Meagher RB, McKinney EC, Kandasamy MK (1999) Isovariant Dynamics Expand and Buffer the Responses of Complex Systems: The Diverse Plant Actin Gene Family. Plant Cell 11:995–1005
Merrifield CJ, Moss SE, Ballestrem C, Imhof BA, Giese G, Wunderlich I, Almers W (1999) Endocytic vesicles move at the tips of actin tails in cultured mast cells. Nat Cell Biol 1:72-4
Mikoshiba K (2007) IP3 receptor/Ca2+ channel: from discovery to new signaling concepts. J Neurochem 102:1426-1446
Motchoulski A, Liscum E (1999) Arabidopsis NPH3: A NPH1 photoreceptor-interacting protein essential for phototropism. Science 286:961-964.
Mullis KB, Faloona FA (1987) Specific synthesis of DNA in vitro via a polymerase-catalyzed chain reaction. Methods Enzymol 155:335-50
Murashige T, Skoog F (1967) A revised medium for rapid growth and bio assays with tobacco tissue cultures. Physiologia Plantarum 15:473–97
84

REFERENCES
Naef F, Hacker C, Patil N Magnasco M (2002) Empirical characterization of the expression ratio noise structure in high-density oligonucleotide arrays. Genome Biol 3, RESEARCH0018
Nebenführ A, Ritzenthaler C, Robinson DG (2002) Brefeldin A: Deciphering an enigmatic inhibitor of secretion. Plant Physiol 130:1102-1108
Nozue K, Kanegae T, Imaizumi T, Fukuda S, Okamoto H, Yeh KC, Lagarias JC, Wada M (1998) A phytochrome from the fern Adiantum with features of the putative photoreceptor NPH1. Proc. Natl. Acad. Sci. USA 95, 15826–15830.
Oikawa K, Kasahara M, Kiyosue T, Kagawa T, Suetsugu N, Takahashi F, Kanegae T, Niwa Y, Kadota A, Wada M (2003) Chloroplast unusual positioning1 is essential for proper chloroplast positioning. Plant Cell 15: 2805-2815
O'Shea EK, Klemm JD, Kim PS, Alber T (1991) X-ray structure of the GCN4 leucine zipper, a two-stranded, parallel coiled coil. Science 254:539-544
Paavilainen VO, Bertling E, Falck S, Lappalainen P (2004) Regulation of cytoskeletal dynamics by actin-monomer-binding proteins. Trends Cell Biol. 14: 386–394
Park YI, Chow WS, Anderson JM (1996) Chloroplast movement in the shade plant Tradescantia albiflora helps protect photosystem II against light stress. Plant Physiol 111:867–875
Paves H, Truve E (2007) Myosin inhibitors block accumulation movement of chloroplasts in Arabidopsis thaliana leaf cells. Protoplasma 230:165-169
Peeters NM, Chapron A, Giritch A, Grandjean O, Lancelin D, Lhomme T, Vivrel A, Small I, (2000) Duplication and quadruplication of Arabidopsis thaliana cysteinyl- and asparaginyl-tRNA synthetase genes of organellar origin. J Mol Evol 50: 413–423
Perelroizen I, Marchand JB, Blanchoin L, Didry D, Carlier MF (1994) Interaction of profilin with G-actin and poly( L-proline). Biochem 33: 8472-8478
Perelroizen I, Didry D, Christensen H, Chua NH, Carlier MF (1996) Role of nucleotide exchange and hydrolysis in the function of profilin in action assembly. J. Biol. Chem. 271: 12302–12309
Philimonenko VV, Zhao J, Iben S, Dingová H, Kyselá K, Kahle M, Zentgraf H, Hofmann WA, de Lanerolle P, Hozák P, Grummt I, (2004) Nuclear actin and myosin I are required for RNA polymerase I transcription. Nat Cell Biol 6: 1165–1172
Pinton P, Pozzan T, Rizzuto R (1998) The Golgi apparatus is an inositol 1,4,5-trisphosphate-sensitive Ca2+ store, with functional properties distinct from those of the endoplasmic reticulum. EMBO J 17:5298–5308
Pollard TD, Cooper JA (1984) Quantitative analysis of the effect of Acanthamoeba profilin on actin filament nucleation and elongation. Biochem 23:6631-6641
Quader H, Schnepf E (1989) Actin filament array during side branch initiation in protonema cells of the mossFunaria hygrometrica: an actin organizing center at the plasma membrane. Protoplasma 151:167-170
Reddy AS (2001) Molecular motors and their functions in plants. Int Rev Cytol 204:97-178
Reisen D, Hanson MR (2007) Association of six YFPmyosin XI-tail fusions with mobile plant cell organelles. BMC Plant Biol 7:6
Ritzenthaler C, Nebenführ A, Movafeghi A, Stussi-Garaud C, Behnia L, Pimpl P, Staehelin LA, Robinson DG (2002) Reevaluation of the effects of brefeldin A on plant cells using
85

REFERENCES
tobacco Bright Yellow 2 cells expressing Golgi-targeted green fluorescent protein and COPI antisera. Plant Cell 14:237-61
Rozelle AL, Machesky LM, Yamamoto M, Driessens MH, Insall RH, Roth MG, Luby-Phelps K, Marriott G, Hall A, Yin HL (2000) Phosphatidylinositol 4,5-bisphosphate induces actin-based movement of raft-enriched vesicles through WASP-Arp2/3. Curr Biol 10:311-20
Sagan L (1967) On the origin of mitosing cells. J Theor Biol 14:255-274
Sai J, Johnson CH (2002) Dark-stimulated calcium ion fluxes in the chloroplast stroma and cytosol. Plant Cell 14:1279-1291
Sakai T, Wada T, Ishiguro S, Okada K. (2000) RPT2. A signal transducer of the phototropic response in Arabidopsis.Plant Cell 12:225-236
Sakai T, Kagawa T, Kasahara M, Swartz TE, Christie JM, Briggs WR, Wada M, Okada K (2001) Arabidopsis nph1 and npl1: blue light receptors that mediate both phototropism and chloroplast relocation. Proc Natl Acad Sci USA 98: 6969–6974
Sakai Y, Takagi S (2005) Reorganized actin filaments anchor chloroplasts along the anticlinal walls of Vallisneria epidermal cells under high-intensity blue light. Planta 221:823-830
Sakamoto K, Briggs WR (2002) Cellular and subcellular localization of phototropin 1. Plant Cell 14:1723–1735.
Sakurai N, Domoto K, Takagi S (2005) Blue-light-induced reorganization of the actin cytoskeleton and the avoidance response of chloroplasts in epidermal cells of Vallisneria gigantea. Planta 221:66–74
Salomon M, Christie JM, Knieb E, Lempert U, Briggs WR (2000) Photochemical and mutational analysis of the FMN-binding domains of the plant blue light receptor, phototropin. Biochem 39:9401-9410.
Sambrook J, Fritsch EF and Maniatis T (1989) Molecular Cloning – A laboratory manual Second Edition, Cold Spring Habor Laboratory Press, New York
Sanders D, Pelloux J, Brownlee C, Harper JF (2002) Calcium at the crossroads of signaling. Plant Cell Supplement 14:401–417
Sathish K, Padma B, Munugalavadla V, Bhargavi V, Radhika KVN, Wasia R, Sairam M, Singh SS (2004) Phosphorylation of profilin regulates its interaction with actin and poly L-proline.Cellular Signalling 16:589–596
Sato Y, Kadota A, Wada M (1999) Mechanically induced avoidance response of chloroplasts in fern protonemal cells. Plant Physiol 121:37-44
Sato Y, Wada M, Kadota A (2000) Choice of tracks, microtubules and/or actin filaments for chloroplast photo-movement is differentially controlled by phytochrome and a blue light receptor. J Cell Sci 114:269-79
Sato Y, Wada M, Kadota A (2001) External Ca2+ is essential for chloroplast movement induced by mechanical stimulation but not by light stimulation. Plant Physiol 127:497–504
Schledzewski K, Brinkmann H, Mendel RR (1999) Phylogenetic analysis of components of the eukaryotic vesicle transport system reveals a common origin of adaptor protein complexes 1, 2, and 3 and the F subcomplex of the coatomer COPI. J Mol Evol 48:770-778
Schleiff E, Soll J, Küchler M, Kühlbrandt W, Harrer R (2003) Characterization of the translocon of the outer envelope of chloroplasts. J Cell Biol 160: 541-51
86

REFERENCES
Schmidt von Braun S, Schleiff, E (2007) Movement of endosymbiotic organelles. Curr Prot Pep Sci 8: 426-438
Sheahan MB, Staiger CJ, Rose RJ, McCurdy DW (2004) A green fluorescent protein fusion to actin-binding domain 2 of Arabidopsis fimbrin highlights new features of a dynamic actin cytoskeleton in live plant cells. Plant Physiol 136: 3968–3978
Skare P, Kreivi JP, Bergström A, Karlsson R (2003) Profilin I colocalizes with speckles and Cajal bodies: a possible role in pre-mRNA splicing. Exp Cell Res 286:12-21
Soll J, Schleiff E (2004) Protein import into chloroplasts. Nat Rev Mol Cell Biol 5:198-208
Sohn RH, Goldschmidt-Clermont PJ (1994) Profilin: At the crossroads of signal transduction and the cytoskeleton. BioEssays 16:465-472
Staiger CJ, Lloyd CW (1991) The plant cytoskeleton. Curr Opin Cell Biol 3:33–42
Staiger CJ, Gibbon BC, Kovar DR, Zonia LE (1997) Profilin and actin depolymerizing factor: modulators of actin organization in plants. Trends Plant Sci 2:275-281
Stoelzle S, Kagawa T, Wada M, Hedrich R, Dietrich P (2003) Blue light activates calcium-permeable channels in Arabidopsis mesophyll cells via the phototropin signaling pathway. Proc. Natl. Acad. Sci. USA 100:1456–1461
Stüven T, Hartmann E, Görlich D (2003) Exportin 6: a novel nuclear export receptor that is specific for profilin.actin complexes. EMBO J 22:5928-5940)
Suetsugu N, Mittmann F, Wagner G, Hughes J, Wada M (2005a) A chimeric photoreceptor gene, NEOCHROME, has arisen twice during plant evolution. PNAS 102:13705–13709
Suetsugu N, Kagawa T, Wada M. (2005b) An auxilin-like J-domain protein, JAC1, regulates phototropin-mediated chloroplast movement in Arabidopsis. Plant Physiol 139:151-162
Suetsugu N, Wada M (2007) Chloroplast photorelocation movement mediated by phototropin family proteins in green plants. Biol Chem 388: 927–935
Sunkar R, Kapoor A, Zhu JK. Posttranscriptional induction of two Cu/Zn superoxide dismutase genes in Arabidopsis is mediated by downregulation of miR398 and important for oxidative stress tolerance. Plant Cell. 2006 18: 2051-65
Theriot JA, Mitchison TJ (1991) Actin microfilament dynamics in locomoting cells. Nature 352:126–131
Tlalka M, Gabrýs H (1993) Influence of calcium on blue-light-induced chloroplast movement in Lemna trisulca L. Planta 189:491-498
Tlalka M, Fricker M (1999) The role of calcium in blue-light-dependent chloroplast movement in Lemna trisulca L. Plant J 20:461-473
Towbin H, Staehlin T and Gordon J (1979) Electrophoretic transfer of proteins from polyacrylamid gels to nitrocellulose sheets: procedure and some application. Proc. Natl. Acad. Sci. USA 76: 4350-4354.
Trojan A, Gabrys H (1996) Chloroplast distribution in Arabidopsis depends on light conditions during growth. Plant Physiol 111: 419–425
van der Honing HS, Emons AM, Ketelaar T (2007) Actin based processes that could determine the cytoplasmic architecture of plant cells. Biochim Biophys Acta 1773:604-614.
Vemuri B, Singh SS (2001) Protein kinase C isozyme-specific phosphorylation of profilin Cell Signal 13:433-439
87

REFERENCES
Vidali L, Perez HE, Valdés López V, Noguez R, Zamudio F, Sánchez F, (1995) Purification, characterization, and cDNA cloning of profilin from Phaseolus vulgaris. Plant Physiol 108:115-123
Villarejo A, Buren S, Larsson S, Dejardin A, Monne M, Rudhe C, Karlsson J, Jansson S, Lerouge P, Rolland N, von Heijne G, Grebe M, Bako L, Samuelsson G (2005) Evidence for a protein transported through the secretory pathway en route to the higher plant chloroplast. Nat Cell Biol 7: 1224-1231
Wachsstock DH, Schwarz WH, Pollard TD (1994) Cross-linker dynamics determine the mechanical properties of actin gels. Biophys J 66:801–809
Wacker I, Quader H, Schnepf E (1988) Influence of the herbicide oryzalin on cytoskeleton and growth of Funaria hygrometrica protonemata. Protoplasma 142:55-67
Chloroplast Photoorientation in Enucleated Fern Protonemata
Wada M (1988) Chloroplast Photoorientation in Enucleated Fern Protonemata. Plant Cell Physiol 29: 1227-1232
Wada M, Grolig F, Haupt W (1993) Light-oriented chloroplast positioning. Contribution to progress in photobiology. J Photochem Photobiol B Biol 17:3–25
Wada M, Kagawa T, Sato Y (2003) Chloroplast movement. Annu Rev Plant Biol 54:455-468
Wada M, Suetsugu N (2004) Plant organelle positioning. Curr Opin Plant Biol 7: 626–631
Wang Z, Pesacreta TC (2004) A subclass of myosin XI is associated with mitochondria, plastids, and the molecular chaperone subunit TCP-1alpha in maize. Cell Motil Cytoskel 57:218-232
Wang X (2004) Lipid signalling. Curr Opin Plant Biol 7: 329-336
Wasteneys GO, Galway ME (2003) Remodeling the cytoskeleton for growth and form: An overview with some new views. Annu Rev Plant Biol 54:691-722
Weber G (1952) Polarization of the fluorescence of macromolecules. I. Theory and experimental method. Biochem J 51:145-55
Witke W (2004) The role of profilin complexes in cell motility and other cellular processes. TRENDS Cell Biol 14:461-469
Witztum A, Parthasarathy MV (1985) Role of actin chloroplast clustering and banding in leaves of Egeria, Elodea and Hydrilla. Eur J Cell Biol 39:21-26
Xia HJ, Yang G (2005) Inositol 1,4,5-trisphosphate 3-kinases: functions and regulations. Cell Res 15:83-91
Yarmola EG, Bubb MR(2006) Profilin: emerging concepts and lingering misconceptions, Trends Biochem Sci 4: 197-205
Yatsuhashi H (1996) Photoregulation systems for light-oriented chloroplast movement. J Plant Res 109:139-146
Yoo SD, Cho YH, Sheen J (2007) Arabidopsis mesophyll protoplasts: a versatile cell system for transient gene expression analysis. Nat Protoc 2: 1565-1572
Zurzycki J (1955) Chloroplast arrangements as a factor of photosynthesis. Acta Soc Bot Pol 24: 27-63
Zurzycki J (1957) The destructive effect of light on the photosynthetic apparatus. Acta Soc Bot Pol 26:157–175
88

CURRICULUM VITAE
Curriculum Vitae Name: Serena Schmidt von Braun, née Steinhübl
Date of birth: 24.10.1977 in Munich
Nationality: German
Education
09/88 - 07/97 Gymnasium Weilheim Mathematics and Science Branch, graduated
with Abitur
University
11/97 - 07/98 Study of Chemistry at the Technical University Munich
11/98 - 10/03 Study of Biology at the Ludwig Maximilians University Munich,
Diploma degree 10/2003
01/03 - 10/03 Diploma thesis at GSF Neuherberg, division radiation biology and
DNA repair
01/04 - now Ph. D. at the LMU Munich Department I Biochemistry and Plant
Physiology
89

PUBLICATIONS
Publications • Schmidt von Braun S, Schleiff E, Movement of Endosymbiotic Organelles, Current
Protein and Peptide Sciences (2007) 8: 426-438
• Schmidt von Braun S, Schleiff E, The chloroplast outer membrane protein Chup1
interacts with actin and profilin, Planta (2008) PMID: 18193273
• Schmidt von Braun S, Sabetti A, Hanic-Joyce PJ, Gu J, Schleiff E, Joyce P, Dual
targeting of the tRNA nucleotidyl-transferase CCA1 in plants – not just the signal,
Journal of Experimental Botany (2007) 58: 4083-4093
• Schmidt von Braun S, Schleiff E, Moving the Green, Chup1 and chloroplast
movement – an obvious relationship? Plant Signaling & Behavior (2008) 3:488-489
• Schmidt von Braun S, Lehmann P, Mirus O, Haberer G, Schleiff E, Blue light – a
message and its receivers analysed by global expression profiling, in preparation
90

ACKNOWLEDGEMENTS
Acknowledgements Mein herzlichster Dank gilt allen die mich bei dieser Arbeit unterstützt haben, allen voran
Enrico für seinen unermüdlichen Einsatz und sprühenden Enthusiasmus.
Allen aus der Arbeitsgruppe für die schöne und fröhliche (Arbeits-)Atmosphäre und
gegenseitige Hilfe in allen Belangen. Danke an Sunčana, Kerstin, Petra, Rolf, Mislav, Olli,
Thomas, Soumya, Alexandar, Maike, Tihana, Anja und Rajae. Und natürlich an alle aus
unseren befreundeten Nachbarschaftgruppen. Danke an Georg aus der GSF für seine
Unterstützung.
Ein besonderer Dank geht zusätzlich noch einmal an Olli für seine Programmierkünste.
Ein sehr großes Danke an meine Familie und an meinen Mann… für alles!
91

EHRENWÖRTLICHE VERSICHERUNG
Ehrenwörtliche Versicherung Die vorliegende Dissertation wurde von der Verfasserin selbständig und ohne unerlaubte
Hilfe angefertigt. Die Verfasserin hat zuvor nicht versucht, anderweitig eine Dissertation
einzureichen oder sich einer Doktorprüfung zu unterziehen. Die Dissertation wurde keiner
weiteren Prüfungskommission weder in Teilen noch als Ganzes vorgelegt.
Wessobrunn, den 08.05.08 Serena Schmidt von Braun
92

ABBREVIATIONS
Abbreviations
aa amino acid Al Aluminium ATP adenosine-5’-triphosphate bp base pair BCIP 5-bromo-4-chloro-3-indolyl-phosphate BSA bovine serum albumin Chup1 chloroplast unusual positioning1 CnBr cyanogen bromide CT carboxy terminus DAG 1,2-diacylglycerol DCMU dichlorophenyl dimethylurea DMSO dimethyl sulfoxyde DTT dithiothreitol EDTA ethylenediaminetetraacetic acid ER endoplasmic reticulum GFP green fluorecent protein His histidine IP3 inositol 1,4,5-trisphosphate IPTG isopropylthiogalactoside Jac1 J domain protein required for chloroplast accumulation response kD kilo Dalton MAP kinase mitogen-activated protein kinase µmol measure of fluence rate of light in mols of photons, short for µmol m-1s-1
Met methionine MS Murashige and Skoog NBT nitroblue tetrazolium, 4-nitrotetrazoliumchlorid-blue-hydrate NT amino terminus OD optical density PCR polymerase chain reaction Phot Phototropin pI isoelectric point PIP2 phosphatidylinositol(4,5)bisphosphate PLC phospholipase C PLP poly-L-proline Pmi plastid movement impaired PMSF phenylmethane sulfonyl fluoride LOV light, oxygen or voltage RACE rapid amplification of cDNA ends RFP red fluorecent protein ROS reactive oxygen species SDS PAGE sodium dodecyl sulphate-polyacrylamide gel electrophoresis Tris 2-amino-2-(hydroxymethyl)-1,3-propandiol WT wild type YTH Yeast Two Hybrid
93

SUPPLEMENTS
Supplements DNA Sequence of Pisum sativum Chup1 discovered by RACE ATGATAGTCAGGTTAGGACTCATTGTTGCTGCTTCATTAGCAGCTTTTACAGTTAAGCAGCTCAATCTTGGAAACTCTAAATCAGATCATGGTCAAGAAAGGTCTCAAAAGCATCAAGACGAAGACACCGAACAAGAGCAGGTCACTAGTATTACAGATGATTCTCATCATCAAAGGAATGATACTGAGGAGGAAGAAGAGGAGAAAGAGGAGGTCAAGTTAATTAGCAGCATAATTAATAGAGCTAATAATTTCGAAGATGATGATATTCTACCAGAATTTGAAGACCTTTTATCCGGAGAGATTGAGTTATCATTTCCTAGCGATGATAATAAGGATGAGAAAGAAAGAGTTTATGAGATAGAGATGGCATACAATGACAGCGAGTTAGAACGACTGCGGCAGCTAGTGAAGGAATTGGAGGAAAGGGAAGTGAAACTTGAAGGAGAATTGCTTGAGTACTATGGTTTAAAGGAGCAGGAATCAGACATTGTAGAGTTACAAAGGCAGCTGAAAATTAAGACGGTGGAAATAGATATGCTTAATATTACGATTAACTCGTTACAGGCCGAGAGGAAGAAGCTTCAAGAAGAACTCACAAATGGAGCTTCAGCAAAGAGAGATCTTGAGTTGGCTAGAAACAAGATAAAGGAGCTACAAAGGCAAATGCAGCTTGAGGCTAACCAAACAAAAGGCCAACTTTTGTTGCTTAAACAGCAAGTTTCTGGTCTACAGGTGAAAGAAGAAGTGGGTGCCAGAAATGATGCTGAGATTGAAAAGAAATTGAAAGCTGTGAATGACTTAGAGGTTAATGTTGTGGAGCTTAGGAGGAAAAATAAAGAACTTCAGTACGAGAAGCGAGAGTTAACTGTTAAACTCAATGCTGCTGAATCTAGAGTAGCAGAGCTCTCCAACATGACAGAGAGTGAAATGGTTGCCAAGGTCAAAGAGGAGGTCAGCAACCGAGAGACACGCAAAGAATCAAAGCAAGTGGAAGGACTTCAAATGAATAGGTTTAGTGAAGTGGAAGAGCTCGTATACCTTCGTTGGGTCAATGCATGTTTGAGGTATGAGCTAAAGAATCAGCAGGCACCCTCGGGAAAATATCGGCGCGCGACCTCAGCAAGAACCTTAGCCCAATCACAAGCGAGAGCAAAGCAGCTGATGTTAGAATACGCTGGATCGGAACGAGGTCAAGGGGACACAGATCTCGATAGCAATTTCTCTCATCCCTCTTCACCAGGAAGTGAAGATTTTGACAATGCTTCTATTGATAGCTTTAGTAGCAAATATAGTAGTATTAGCAAGAAAACTAGCATAATCCAAAAATTGAAGAAATGGGGCAAACTCAAAGATGATTCTAGTGCTCTTTCATCACCATCAAGATCATTTTCAGGAAGTTCTCCAAAAAGGATGAGTATGAGTGTTAAATCTAGGGGTCCACTCGAAAGCTTGATGATAAGGAATGCCAGTGATAGTGTGGCCATCACCACCTTTGGTCAAGGGGATCTAGAATCTTCTTATTCTCCTGAAACTTCAACTCCTGCTAGTGCTGATCTTAGAAAAATCCCATCTACCGACTCACTAAATTCTGTTGCTACTTCATTCCATTTGATGTCCAAGTCATCTGTTGATGCGTCTGTGGACGAAAAGTACCCTGCATATAAATATCGCCATAAATTGGCCATGGCTAGAGAGAGTGATCTAAAAGATAAGGCGGAGAAAGCAAGAGTGCAGAAGTTTGGTAATCATTCAAATTTGAATATGATCAAGACTGAAAGAGAGAGGCCTCATATATCTTTGCCACCTAAACTTTCTCAAATAAAGGAGAAGCCAATTGTTCCTGATAGTCCAAATGACCAATCTGAGGATGGAAAGAATGTTGAAAACCAAAACATTAGCAAGATGAAGCTTGCCGACATTGAGAAAAGGCCTACTCGGGTGCCTAGGCCGCCTCCTAAACCATCAGGTGGTGGTTCTGTTAGCACAAATTCAAATCCTGCGAATGGAATACCATCTGCTCCATCCATTCCTCCTCCCCCTCCTCGTCCACCAGGAGGACCGCCTCCTCCACCTCCTCCACCAAGAGGTCTATCAAGAGGGGCAATGGATGACGACAAAGTTCACCGAGCTCCACAGTTAGTTGAGTTTTATCAGTCATTGATGAAACGGGAGGCAAAGAAGGATACTACTCCGTTACTAGTCTCTTCAACCGGTAACGCATCTGATGCCAGAAGCAACATGATTGGGGAAATTGAGAATAGATCAACATTCCTCTTAGCAGTGAAAGCTGATGTAGAAACACAAGGTGATTTTGTCACATCCTTGGCAACTGAAGTTAGAGCATCCTCCTTTTCAGATGTCAATGACTTGGTTGCCTTTGTGAACTGGCTAGATGAAGAACTTTCCTTCTTGGTTGATGAACGAGCTGTCCTGAAGCACTTTGATTGGCCTGAGGGGAAAGCAGATGCACTAAGGGAAGCAGCTTTTGAATATCAAGATCTTATGAAATTGGAGAAGCAAGTCTCTACCTTCATTGATGATCCAAAGCTCTCGTGTGATGCTGCTCTCAAGAAAATGTATTCCTTGCTTGAAAAAGTAGAGCAAAGCGTATATGCACTGTTGCGAACAAGAGATATGGCTATTTCACGATACAAGGAATTCGGAATCCCAATAAACTGGCTACAAGATTCAGGAGTTGTGGGCAAGATAAAGCTTTCTTCTGTACAACTAGCAAGGAAGTATATGAAACGTGTTGCATCTGAACTTGATGCATTATCTGGACCTGAAAAGGAACCAGCTAGAGAGTTCTTGATTCTGCAAGGCGTGCGTTTTGCTTTCCGCGTCCATCAGTTTGCAGGAGGCTTTGACGCAGAGAGCATGAAGGCTTTCGAAGACCTAAGGAGCCGCATCCAAACCCCTCAAATTGGTGGAGAAGAGAGTAAACCAGAATCATAG
Amino Acid sequence of Pisum sativum Chup1 MIVRLGLIVAASLAAFTVKQLNLGNSKSDHGQERSQKHQDEDTEQEQVTSITDDSHHQRNDTEEEEEEKEEVKLISSIINRANNFEDDDILPEFEDLLSGEIELSFPSDDNKDEKERVYEIEMAYNDSELERLRQLVKELEEREVKLEGELLEYYGLKEQESDIVELQRQLKIKTVEIDMLNITINSLQAERKKLQEELTNGASAKRDLELARNKIKELQRQMQLEANQTKGQLLLLKQQVSGLQVKEEVGARNDAEIEKKLKAVNDLEVNVVELRRKNKELQYEKRELTVKLNAAESRVAELSNMTESEMVAKVKEEVSNRETRKESKQVEGLQMNRFSEVEELVYLRWVNACLRYELKNQQAPSGKYRRATSARTLAQSQARAKQLMLEYAGSERGQGDTDLDSNFSHPSSPGSEDFDNASIDSFSSKYSSISKKTSIIQKLKKWGKLKDDSSALSSPSRSFSGSSPKRMSMSVKSRGPLESLMIRNASDSVAITTFGQGDLESSYSPETSTPASADLRKIPSTDSLNSVATSFHLMSKSSVDASVDEKYPAY
94

SUPPLEMENTS KYRHKLAMARESDLKDKAEKARVQKFGNHSNLNMIKTERERPHISLPPKLSQIKEKPIVPDSPNDQSEDGKNVENQNISKMKLADIEKRPTRVPRPPPKPSGGGSVSTNSNPANGIPSAPSIPPPPPRPPGGPPPPPPPPRGLSRGAMDDDKVHRAPQLVEFYQSLMKREAKKDTTPLLVSSTGNASDARSNMIGEIENRSTFLLAVKADVETQGDFVTSLATEVRASSFSDVNDLVAFVNWLDEELSFLVDERAVLKHFDWPEGKADALREAAFEYQDLMKLEKQVSTFIDDPKLSCDAALKKMYSLLEKVEQSVYALLRTRDMAISRYKEFGIPINWLQDSGVVGKIKLSSVQLARKYMKRVASELDALSGPEKEPAREFLILQGVRFAFRVHQFAGGFDAESMKAFEDLRSRIQTPQIGGEESKPES
Supporting Table 1 Yeast Two Hybrid analysis with Chup1 as bait. Yeast two hybrid screen results with Chup1 as bait. Given is the AGI number of the gene and
the name of the protein and/or function. Yeast Two Hybrid Analysis was performed by
Hybrigenics (Paris, France) with a CHUP1 template provided in the pOL GFP vector as bait.
AT2G24270.1 ALDH11A3 aldehyde dehydrogenase/ oxidoreductase AT5G13000 ATGSL12 1,3-beta-glucan synthase/ transferase, transferring glycosyl groups AT5G23450 ATLCBK1 LONG-CHAIN BASE (LCB) KINASE 1, diacylglycerol kinase AT5G35970 ATP binding / ATP-dependent helicase/ DNAbinding AT4G20360 ATP binding / GTP binding / translation elongationfactor AT2G29940 ATPase, coupled to transmembrane movement of substances AT1G22190 AP2 domain containing transcription factor /DNA binding AT3G04400 EMB2171 (EMBRYO DEFECTIVE 2171); structural constituent of ribosome AT2G41430.1 ERD15 (EARLY RESPONSIVE TO DEHYDRATION 15) AT4G25100.2 FSD1 iron superoxide dismutase AT1G23900.2 GAMMA-ADAPTIN 1; clathrin binding AT5G23120 HCF136 (high chlorophyll fluorescence 136) stability and/or assembly factor of photosystem II AT4G13940.1 HOG1 HOMOLOGY-DEPENDENT GENE SILENCING 1; adenosylhomocysteinase AT4G20380.2 LSD1 LESION SIMULATING DISEASE AT3G51600 LTP5 LIPID TRANSFER PROTEIN 5 lipid transporter AT4G24190.1 SHD SHEPHERD , ATP binding / unfolded protein binding AT1G14610 TWN2 TWIN 2, ATP binding / tRNA ligase/ valine-tRNA ligase AT3G15350.2 acetylglucosaminyltransferase AT2G05710 aconitate hydratase, cytoplasmic, putative / citrate hydro-lyase/aconitase,putative AT5G56360 calmodulinbinding, similar to protein kinase C substrate AT1G31550.2 carboxylic ester hydrolase/ hydrolase, acting on ester bonds /lipase AT5G48010 pentacyclic triterpene synthase, putative AT4G16190 cysteine-type endopeptidase/ cysteine-type peptidase AT3G46180 galactosetransporter
AT5G54390 AHL (HAL2-LIKE); 3'(2'),5'-bisphosphate nucleotidase/ inositol or phosphatidylinositol phosphatase
AT5G38410 ribulose-bisphosphatecarboxylase AT3G61790 seven in absentia (SINA) familyprotein AT3G47420 sugar porter/transporter AT1G70090 transferase, transferring glycosyl groups / transferase, transferring hexosylgroups AT5G18630.3 triacylglycerollipase AT1G04820 tubulin alpha-2/alpha-4 chain (TUA4) AT4G22500 unknown, similarity to glycine-rich cell wall protein precursor AT2G07707 ATP synthase protein YMF19 (Mitochondrial protein YMF19) AT2G32240 putative myosin heavy chain AT1G79040 PSII-R (photosystem II subunit R) AT1G16810.1 unknown protein AT3G20380 meprin and TRAF homology domain-containing pr. / MATH domain-containing pr. AT1G31330 PSI subunit III (PsaF, photosystem I subunit F)
95

SUPPLEMENTS
Supporting Table 2. Genes regulated in wild type background upon illumination with blue
light.
Given are the genes found to be categorized in the experiments using wild type. The first
column gives the time of illumination with blue light in minutes (T), the second column the
category of expression (C) as of Figure 7; the third column the AGI code of the gene, the
fourth column the name of the protein, the fifth column indicates whether the genes is found
to be higher (u) or lower (d) expressed in non treated plants in comparison to plants treated
with 10µmol blue light (NL), the sixth column gives number of spots identified as positive by
the new classification (SP); the seventh column the number of spots with signal intensities
supporting the classification (NP); the eighth column gives the (putative) function of the
encoded protein; the ninth column gives the (putative) localization; the tenth column gives a
relevant reference. T C AGI code Name NL SN NP function localization Ref.
2 AT5G53450 - - 11 9 protein kinasea chloroplastsa Kang et al.,
2003
AT1G12520 CCS1 - 9 7 copper chaperone for superoxide
dismutase
chlorolast or
secretion
Chu et al.,
2005 5
4
AT2G28190 CSD2 - 6 5 superoxide dismutase chloroplast Kliebenstein
et al., 1998
AT1G36370 - - 10 8 glycine hydroxymethyltransferasea cytosolica -
AT3G30720 - - 10 8 unknown unknown - 2
AT4G04610 atAPR1 - 11 10 phosphoadenosine
phosphosulfate sulfotransferase achloroplastsa Setya et al.,
1996
AT1G15100 RHA2A - 11 9 Ring H2 finger protein a secretiona -
AT1G17100 - - 11 9 SOUL heme-binding protein a secretiona -
AT1G68550 - - 11 9 AP2 domain cont. transcription
factora nucleusa -
AT1G76240 - d 11 10 unknown unknown -
AT2G44940 - d 11 9 AP2 domain cont. transcription
factora nucleusa -
AT3G44450 - d 11 11 unknown unknown -
AT3G56290 - - 11 9 unknown unknown -
4
AT5G45820 AtPKS18 d 11 10 SNF1-related protein kinase cytosolic Gong et al.,
2003
AT1G01560 atMPK11 u 11 10 mitogen-activated protein kinase
11 unknown
Hamel et al.,
2006
AT1G02660 - u 11 9 putative triacylglycerol lipasea unknown -
AT1G05575 - u 11 10 unknown unknown -
AT1G15010 - u 11 9 unknown unknown -
AT1G19380 - u 11 10 unknown unknown -
AT1G19770 atPUP14 u 11 9 purine permease 14 unknown Gillissen et al.,
2000
AT1G21010 - u 11 10 unknown unknown -
30
5
AT1G22890 - - 9 7 unknown unknown -
96

SUPPLEMENTS
AT1G25550 - - 10 9 myb family transcription factora unknown -
AT1G27730 atZAT10 u 11 10 salt-tolerance zinc
fingertranscription factor nucleus
Rossel et al.
2007
AT1G28330 atDRM1 - 9 7 dormancy-associated protein unknown Gonzali et al.
2006
AT1G49500 - - 11 9 unknown secretiona -
AT1G52200 atPCR8 u 7 6 putative plant cadmium resistance
protein unknown
Song et al.
2004
AT1G53170 atERF8 - 11 10 ERF transcription factor 8 nucleusa Yang et al.,
2005
AT1G66090 - u 11 11 Putative disease resistance
protein chloroplastsa -
AT1G69490 atNAP - 11 10 NAC-type transcription factor nucleus Gou and Gan,
2006
AT1G69890 - u 10 8 unknown unknown -
AT1G70290 atTPS8 - 11 9 rehalose-6-phosphate synthase 8 unknown Leyman et al.
2001
AT1G70740 - u 11 11 putative receptor-like protein
kinasea unknown -
AT1G73500 atMKK9 - 11 9 MAP kinase kinase 9 Hamel et al.,
2006
AT1G74450 - u 11 9 unknown unknown -
AT1G74930 - u 11 10 putative AP2 domain-containing
transcription factora nucleusa -
AT1G76650 - u 11 9 calcium-binding EF hand family
protein unknown -
AT2G15960 - - 10 9 unknown unknown -
AT2G18700 atTPS11 - 11 11 trehalose-phosphatase protein unknown Chary et al.
2008
AT2G22500 atPUMP5 u 11 9 Mitochondrial uncoupling protein mitochondria Borecky et al.,
2006
AT2G22880 - u 11 11 unknown unknown -
AT2G24550 - u 11 9 unknown unknown -
AT2G24600 - u 11 9 ankyrin repeat family proteina unknown -
AT2G25735 - u 11 10 unknown unknown -
AT2G26190 - u 10 8 calmodulin-binding family proteina unknown -
AT2G26530 - u 11 10 calmodulin-binding family proteina unknown -
AT2G26560 atPLP2 u 9 7 lipid acyl hydrolase unknown La Camera et
al., 2005
AT2G27830 - u 11 9 Putative pentatricopeptide (PPR)
repeat-containing protein unknown -
AT2G31880 - u 11 10 putative receptor-like protein
kinasea secretiona -
AT2G35930 - u 11 10 U-box domain-containing proteina unknown -
AT2G38790 - u 11 9 unknown unknown -
AT2G40000 - u 11 10 unknown unknown -
AT2G40140 ZFAR1 u 11 10 zinc finger transcription factor unknown AbuQamar et
al., 2006
AT2G41100 atTCH3 u 11 9 environmental stimuli-responsive
Ca2+ binding protein
Sistrunk et al.,
1993
97

SUPPLEMENTS
AT2G44500 - u 11 9 unknown unknown -
AT3G04640 - u 11 9 unknown secretiona -
AT3G05200 ATL6 u 11 9 putative RING-H2 zinc finger
proteina secretiona
Salinas-
Mondragón et
al., 1999
AT3G06070 - - 10 10 unknown unknown -
AT3G06500 - u 9 7 putative beta-fructofuranosidasea chloroplastsa -
AT3G07350 - u 11 10 unknown unknown -
AT3G10020 - u 11 10 unknown unknown -
AT3G10985 atSAG20 u 10 9 Wound induced protein 12 - Miller et al.,
1999
AT3G15630 - u 11 10 unknown unknown -
AT3G19580 AZF2 u 11 11 zinc finger (C2H2 type) protein 2 nucleus Sakamoto et
al., 2004
AT3G28340 - - 11 9 putative galactinol synthasea secretiona -
AT3G44260 - - 11 10 Putative CCR4-NOT transcription
complex proteina unknown -
AT3G46620 - u 11 10 RING-domain protein of unknown
functiona unknown -
AT3G49530 ANAC062 u 9 8 Arabidopsis NAC domain
containing protein 62
membrane-
associated
Riechmann et
al., 2000
AT3G49940 LBD38 - 10 8 LOB domain protein 38 unknown -
AT3G50260 ATERF#011 u 11 9 AP2 domain-containing
transcription factora nucleus Riechmann et
al., 2000
AT3G52400 SYNTAXIN
122 - 10 8
vesicle transport syntaxin-type t-
SNARE protein
plasma
membrane
Sanderfoot et
al., 2000
AT3G55980 F27K19.160 u 11 11 zinc finger (CCCH-type) family
protein unknown
Riechmann et
al. 2000
AT3G57450 - u 11 9 unknown unknown -
AT3G61060 ATPP2-A13 - 10 9 similar to ATPP2-A12 (Phloem
protein 2-A12) unknown
Dinant et al.,
2000
AT3G62950 GRXC11 - 11 9 glutaredoxin family protein endomembran
e system -
AT4G02380 AtLEA5 - 9 7 late embryogenesis abundant like
protein unknown
Weaver et al.,
1998
AT4G05070 C17L7.2 - 11 9 similar to wound induced protein-
like chloroplasta
AT4G14365 - u 7 6 zinc finger (C3HC4-type RING
finger) family protein unknown -
AT4G17230 SCL13 u 11 10 scarecrow-like protein unknown Bolle et al.,
2000
AT4G17490 AtERF6 u 11 11 ethylene-responsive element
binding factor nucleus
Riechmann et
al., 1998
AT4G17900 - - 7 6 zinc-binding family protein unknown -
AT4G18880 HSF21 u 11 9 heat shock transcription factor 21 unknown Riechmann et
al., 2000
AT4G20860 - u 11 9 FAD-binding domain-containing
protein
endomembran
e system -
AT4G23180 CRK10 u 10 9 receptor-like protein kinase secretorya Du et al., 2000
AT4G23220 - u 9 7 receptor-like protein kinasea unknown -
98

SUPPLEMENTS
AT4G24380 - u 10 8 serine hydrolasea unknown -
AT4G24570 AtDIC2 u 11 9 mitochondrial dicarboxylate
carriera Mitochondriaa -
AT4G27280 - u 11 10 calcium-binding EF hand family
protein unknown -
AT4G28140 - u 11 10 AP2 domain-containing
transcription factora nucleusa Riechmann et
al., 2000
AT4G29190 - - 11 11 zinc finger (CCCH-type) family
protein unknown
Riechmann et
al., 2000
AT4G29780 - u 11 11 unknown unknown -
AT4G33050 EDA39 u 10 9 calmodulin binding unknown Pagnussat et
al., 2005
AT4G34150 - u 10 8 C2 domain-containing protein unknown Kawamura et
al., 2003
AT4G35480 RHA3b - 11 10 RING-H2 finger protein a unknown Jensen et al.,
1998
AT4G36040 J11 - 11 9 DNAJ heat shock N-terminal
domain-containing protein
chloroplasta -
AT4G36500 - - 10 10 unknown mitochondriaa -
AT4G37260 MYB73 - 10 10 myb DNA-binding protein nucleusa Kranz et al.,
1998
AT5G04340 C2H2 u 11 10 zinc finger (C2H2 type) proteina unknown Chrispeels et
al., 2000
AT5G06320 NHL3 u 11 10 harpin-responsive proteina plasma
membranea
Varet et al.,
2002
AT5G06860 PGIP1 - 11 9 polygalacturonase inhibiting
protein 1
secretorya Kobe et al.
2001
AT5G10695 - u 11 9 unknown unknown -
AT5G11070 - u 11 10 unknown unknown -
AT5G20230 BCB u 10 10 blue copper-binding protein secretorya van Gysel et
al., 1993
AT5G22270 - - 11 9 unknown unknown -
AT5G24590 TIP - 11 9 NAC-type transcription factor nucleusa Ren et al.
2000
AT5G25440 - u 7 6 receptor-like protein kinase cytoplasm/nucl
eusa
-
AT5G26920 - u 11 9 calmodulin binding unknow -
AT5G27420 - u 11 9 zinc finger (C3HC4-type RING
finger) family proteina
secretorya -
AT5G28770 BZO2H3 - 9 8 bZIP protein nucleusa Riechmann et
al., 2000
AT5G39580 - u 9 7 peroxidasea secretorya -
AT5G47070 - u 10 9 receptor-like protein kinasea unknown -
AT5G52050 - u 11 11 MATE related efflux carriera membranea -
AT5G57560 XTH22 u 11 9 xyloglucan endotransglucosylase-
hydrolase
cell wall Xu et al., 1995
AT5G58430 EXO70B1 - 11 9 exocyst subunit EXO70a exocysta -
AT5G59080 - - 9 8 unknown chloroplast -
AT5G59550 - - 11 10 zinc finger (C3HC4-type RING
finger) family protein
unknown -
99

SUPPLEMENTS
AT5G59820 RHL41 u 11 9 RESPONSIVE TO HIGH LIGHT
41
unknown Riechmann et
al., 2000
AT5G60680 - u 11 11 unknown unknown -
AT5G66070 - u 10 8 similar to zinc finger (C3HC4-type
RING finger) family proteina
secretorya -
6 AT1G48630 - - 10 8 activated protein kinase C
receptora cytosolica -
AT1G68840 RAV2 - 11 9 DNA-binding protein RAV2
(RAV2) - -
AT2G20670 - - 11 11 unknown unknown -
AT4G37610 atBT5 u 11 10 transcription regulator BT5 nucleus
Du and
Poovaiah,
2004
7
AT5G19120 - u 11 10 unknown secretiona -
8 AT4G16780 atHB2 u 10 8 Homeobox-leucine zipper protein
HAT4 nucleusa Carabelli et al.
1993
AT1G17380 - u 10 9 unknown unknown -
AT1G56600 atGOLS2 u 10 9 galactinol synthase 2 unknown Taji et al.
2002
AT1G61890 atDTX37 u 9 7 MATE efflux family proteina unknown Li et al., 2002
AT2G34600 - u 10 8 unknown unknown -
AT3G25780 atAOC3 u 10 8 allene oxide cyclase 3 Plasma
membrane
He et al.,
2002; Dunkley
et al., 2006
AT4G27410 atRD26 u 11 11 NAC-type transcription factor nucleus Lee et al.,
2006
9
AT4G34410 - u 11 9 putative AP2 domain-containing
transcription factor unknown -
Literature cited within supporting Table 1
Kang HG, Foley RC, Oñate-Sánchez L, Lin C, Singh KB. Target genes for OBP3, a Dof transcription factor, include novel basic helix-loop-helix domain proteins inducible by salicylic acid. Plant J. 2003 Aug;35(3):362-72.
Chu CC, Lee WC, Guo WY, Pan SM, Chen LJ, Li HM, Jinn TL. Plant Physiol. 2005 Sep;139(1):425-36
Kliebenstein DJ, Monde RA, Last RL. Superoxide dismutase in Arabidopsis: an eclectic enzyme family with disparate regulation and protein localization. Plant Physiol. 1998 Oct;118(2):637-50.
Gong D, Zhang C, Chen X, Gong Z, Zhu JK. Constitutive activation and transgenic evaluation of the function of an arabidopsis PKS protein kinase. J Biol Chem. 2002 Nov 1;277(44):42088-96.
Setya A, Murillo M, Leustek T. Sulfate reduction in higher plants: molecular evidence for a novel 5'-adenylylsulfate reductase. Proc Natl Acad Sci U S A. 1996 Nov 12;93(23):13383-8.
Carabelli M, Sessa G, Baima S, Morelli G, Ruberti I. The Arabidopsis Athb-2 and -4 genes are strongly induced by far-red-rich light. Plant J. 1993 Sep;4(3):469-79
Du L, Poovaiah BW. A novel family of Ca2+/calmodulin-binding proteins involved in transcriptional regulation: interaction with fsh/Ring3 class transcription activators. Plant Mol Biol. 2004 Mar;54(4):549-69.
100

SUPPLEMENTS Taji T, Ohsumi C, Iuchi S, Seki M, Kasuga M, Kobayashi M, Yamaguchi-Shinozaki K, Shinozaki K. Important roles of drought- and cold-inducible genes for galactinol synthase in stress tolerance in Arabidopsis thaliana. Plant J. 2002 Feb;29(4):417-26.
Li L, He Z, Pandey GK, Tsuchiya T, Luan S. Functional cloning and characterization of a plant efflux carrier for multidrug and heavy metal detoxification. J Biol Chem. 2002 Feb 15;277(7):5360-8.
He Y, Fukushige H, Hildebrand DF, Gan S. Evidence supporting a role of jasmonic acid in Arabidopsis leaf senescence. Plant Physiol. 2002 Mar;128(3):876-84.
Dunkley TP, Hester S, Shadforth IP, Runions J, Weimar T, Hanton SL, Griffin JL, Bessant C, Brandizzi F, Hawes C, Watson RB, Dupree P, Lilley KS. Mapping the Arabidopsis organelle proteome. Proc Natl Acad Sci U S A. 2006 Apr 25;103(17):6518-23.
Lee JY, Colinas J, Wang JY, Mace D, Ohler U, Benfey PN. Transcriptional and posttranscriptional regulation of transcription factor expression in Arabidopsis roots. Proc Natl Acad Sci U S A. 2006 Apr 11;103(15):6055-60.
Hamel LP, Nicole MC, Sritubtim S, Morency MJ, Ellis M, Ehlting J, Beaudoin N, Barbazuk B, Klessig D, Lee J, Martin G, Mundy J, Ohashi Y, Scheel D, Sheen J, Xing T, Zhang S, Seguin A, Ellis BE. Ancient signals: comparative genomics of plant MAPK and MAPKK gene families. Trends Plant Sci. 2006 Apr;11(4):192-8.
Gillissen B, Bürkle L, André B, Kühn C, Rentsch D, Brandl B, Frommer WB. A new family of high-affinity transporters for adenine, cytosine, and purine derivatives in Arabidopsis. Plant Cell. 2000 Feb;12(2):291-300.
Rossel JB, Wilson PB, Hussain D, Woo NS, Gordon MJ, Mewett OP, Howell KA, Whelan J, Kazan K, Pogson BJ. Systemic and intracellular responses to photooxidative stress in Arabidopsis. Plant Cell. 2007 Dec;19(12):4091-110.
Gonzali S, Loreti E, Solfanelli C, Novi G, Alpi A, Perata P. Identification of sugar-modulated genes and evidence for in vivo sugar sensing in Arabidopsis. J Plant Res. 2006 Mar;119(2):115-23.
Song WY, Martinoia E, Lee J, Kim D, Kim DY, Vogt E, Shim D, Choi KS, Hwang I, Lee Y. A novel family of cys-rich membrane proteins mediates cadmium resistance in Arabidopsis. Plant Physiol. 2004 Jun;135(2):1027-39.
Yang Z, Tian L, Latoszek-Green M, Brown D, Wu K. Arabidopsis ERF4 is a transcriptional repressor capable of modulating ethylene and abscisic acid responses. Plant Mol Biol. 2005 Jul;58(4):585-96.
Guo Y, Gan S. AtNAP, a NAC family transcription factor, has an important role in leaf senescence. Plant J. 2006 May;46(4):601-12.
Leyman B, Van Dijck P, Thevelein JM. An unexpected plethora of trehalose biosynthesis genes in Arabidopsis thaliana. Trends Plant Sci. 2001 Nov;6(11):510-3.
Chary SN, Hicks GR, Choi YG, Carter D, Raikhel NV. Trehalose-6-phosphate synthase/phosphatase regulates cell shape and plant architecture in Arabidopsis. Plant Physiol. 2008 Jan;146(1):97-107.
Borecky J, Nogueira FT, de Oliveira KA, Maia IG, Vercesi AE, Arruda P. The plant energy-dissipating mitochondrial systems: depicting the genomic structure and the expression profiles of the gene families of uncoupling protein and alternative oxidase in monocots and dicots. J Exp Bot. 2006;57(4):849-64.
AbuQamar S, Chen X, Dhawan R, Bluhm B, Salmeron J, Lam S, Dietrich RA, Mengiste T. Expression profiling and mutant analysis reveals complex regulatory networks involved in Arabidopsis response to Botrytis infection. Plant J. 2006 Oct;48(1):28-44.
Sistrunk ML, Antosiewicz DM, Purugganan MM, Braam J. Arabidopsis TCH3 encodes a novel Ca2+ binding protein and shows environmentally induced and tissue-specific regulation. Plant Cell. 1994 Nov;6(11):1553-65.
101

SUPPLEMENTS Salinas-Mondragón RE, Garcidueñas-Piña C, Guzmán P. Early elicitor induction in members of a novel multigene family coding for highly related RING-H2 proteins in Arabidopsis thaliana. Plant Mol Biol. 1999 Jul;40(4):579-90.
Miller JD, Arteca RN, Pell EJ. Senescence-associated gene expression during ozone-induced leaf senescence in Arabidopsis. Plant Physiol. 1999 Aug;120(4):1015-24.
Sakamoto H, Maruyama K, Sakuma Y, Meshi T, Iwabuchi M, Shinozaki K, Yamaguchi-Shinozaki K. Arabidopsis Cys2/His2-type zinc-finger proteins function as transcription repressors under drought, cold, and high-salinity stress conditions. Plant Physiol. 2004 Sep;136(1):2734-46.
Sanderfoot AA, Assaad FF, Raikhel NV (2000) The Arabidopsis genome. An abundance of soluble N-ethylmaleimide-sensitive factor adaptor protein receptors. Plant Physiol. 24(4):1558-69
Dinant S, Clark AM, Zhu Y, Vilaine F, Palauqui JC, Kusiak C, Thompson GA (2003) Diversity of the superfamily of phloem lectins (phloem protein 2) in angiosperms. Plant Physiol. 131(1):114-28
Weaver LM, Gan S, Quirino B, Amasino RM (1998) A comparison of the expression patterns of several senescence-associated genes in response to stress and hormone treatment. Plant Mol Biol. 37(3):455-6
Bolle C, Koncz C, Chua NH (2000) PAT1, a new member of the GRAS family, is involved in phytochrome A signal transduction. Genes Dev. 14(10):1269-78
Du L, Chen Z (2000) Identification of genes encoding receptor-like protein kinases as possible targets of pathogen- and salicylic acid-induced WRKY DNA-binding proteins in Arabidopsis. Plant J. 24(6):837-47
Pagnussat GC, Yu HJ, Ngo QA, Rajani S, Mayalagu S, Johnson CS, Capron A, Xie LF, Ye D, Sundaresan V (2005) Genetic and molecular identification of genes required for female gametophyte development and function in Arabidopsis. Development. 132(3):603-14
Kawamura Y, Uemura M. (2003) Mass spectrometric approach for identifying putative plasma membrane proteins of Arabidopsis leaves associated with cold acclimation. Plant J. 36(2):141-54
Jensen RB, Jensen KL, Jespersen HM, Skriver K (1998) Widespread occurrence of a highly conserved RING-H2 zinc finger motif in the model plant Arabidopsis thaliana. FEBS Lett. 436(2):283-7
Kranz HD, Denekamp M, Greco R, Jin H, Leyva A, Meissner RC, Petroni K, Urzainqui A, Bevan M, Martin C, Smeekens S, Tonelli C, Paz-Ares J,Weisshaar B (1998) Towards functional characterisation of the members of the R2R3-MYB gene family from Arabidopsis thaliana. Plant J 16:263
Chrispeels HE, Oettinger H, Janvier N, Tague BW (2000) AtZFP1, encoding Arabidopsis thaliana C2H2 zinc-finger protein 1, is expressed downstream of photomorphogenic activation. Plant Mol Biol. 42(2)
Varet A, Parker J, Tornero P, Nass N, Nürnberger T, Dangl JL, Scheel D, Lee J (2002) NHL25 and NHL3, two NDR1/HIN1-1ike genes in Arabidopsis thaliana with potential role(s) in plant defense. Mol Plant Microbe Interact. 15(6):608-16
Kobe B, Kajava AV (2001) The leucine-rich repeat as a protein recognition motif. Curr Opin Struct Biol. 11(6):725-32
Van Gysel A, Van Montagu M, Inzé D (1993) A negatively light-regulated gene from Arabidopsis thaliana encodes a protein showing high similarity to blue copper-binding proteins. Gene. 136(1-2):79-85
Ren T, Qu F, Morris TJ (2000) HRT gene function requires interaction between a NAC protein and viral capsid protein to confer resistance to turnip crinkle virus. Plant Cell. (10):1917-26
Xu W, Purugganan MM, Polisensky DH, Antosiewicz DM, Fry SC, Braam J (1995) Arabidopsis TCH4, regulated by hormones and the environment, encodes a xyloglucan endotransglycosylase. Plant Cell. 7(10):1555-67
102


![Collective Calculation of Actual Values of Non ...unusual positioning 1 (chup1) are defective in chloroplast movement [16]-[18]. phot 2 is the blue light receptor for the chloroplast](https://static.fdocuments.net/doc/165x107/5f6d48aee6a110361902f87f/collective-calculation-of-actual-values-of-non-unusual-positioning-1-chup1.jpg)