chubb Annual Report 1997
68
The Chubb Corporation Annual Report 1997
-
Upload
finance18 -
Category
Economy & Finance
-
view
130 -
download
1
Transcript of chubb Annual Report 1997
The Chubb Corporation
Annual Report 1997
The Chubb Organization
In the spring of 1882, Thomas Caldecot Chubb and
his son Percy opened a marine underwriting busi-
ness in the seaport district of New York City. Hav-
ing collected $1,000 from each of 100 prominent
merchants to start their venture, they began to insure
ships and cargoes. The Chubbs were adept at turning
risk into success, often by helping policyholders prevent disasters before they
occurred. By the turn of the century, Chubb had established strong
relationships with the insurance agents and brokers who placed their clients'
business with Chubb underwriters, and the original subscribers enjoyed a
substantial return on their investment in the young company.
Chubb & Son has never valued size in itself but regards size as a
measure of what has been achieved. Upon the company's 75th anniversary
in 1957, Hendon Chubb Ì who had joined his older brother Percy in the
Ñrm in 1895 Ì noted, ""I think there is perhaps a tendency in American
business to overemphasize mere size, whereas to me it should be a by-
product of a job well done.''
""Never compromise with integrity,'' also a Hendon Chubb principle,
captures the spirit of our companies. Each member of the Chubb organiza-
tion seeks to stand apart in bringing quality, fairness and integrity to each
transaction, for the beneÑt of all involved.
The Chubb Corporation was formed in 1967 and was listed on the New
York Stock Exchange in 1984. Today, Chubb stands among the largest
insurers in the United States and the world. Chubb's 9700 property and
casualty employees serve customers from more than 110 oÇces throughout
North America, Europe, South America and the PaciÑc Rim.
No matter how wide the inÖuence of the Ñrm, we at Chubb still
measure success by a job well done. The principles of Ñnancial stability and
excellent service combined with the high caliber of our employees are the
mainstays of our organization.
The Chubb Corporation
JOHN C. BECK G.G. MICHELSONDirectorsSenior Member Former Senior AdvisorBeck, Mack & Oliver LLC R.H. Macy & Co., Inc.
SHEILA P. BURKE DEAN R. O'HARE
Executive Dean Chairman and Chief Executive OÇcerJohn F. Kennedy School of Government, of the Corporation
Harvard UniversityWARREN B. RUDMAN
JAMES I. CASH, JR. PartnerProfessor Paul, Weiss, Rifkind, Wharton & GarrisonHarvard Graduate School of
SIR DAVID G. SCHOLEY, CBEBusiness AdministrationSenior Advisor
PERCY CHUBB, III SBC Warburg Dillon ReadFormer Vice Chairman of the Corporation
RAYMOND G.H. SEITZ
JOEL J. COHEN Vice ChairmanManaging Director Lehman Bros. International (Europe)Donaldson, Lufkin & Jenrette Securities Corp. Former Ambassador of
The United States of AmericaJAMES M. CORNELIUS
Chairman LAWRENCE M. SMALL
Guidant Corporation President and Chief Operating OÇcerFannie Mae
DAVID H. HOAG
Chairman and Chief Executive OÇcer RICHARD D. WOOD
The LTV Corporation Former Chairman of the BoardEli Lilly and Company
THOMAS C. MACAVOY
Professor JAMES M. ZIMMERMAN
University of Virginia Chairman and Chief Executive OÇcerFormer Vice Chairman Federated Department Stores, Inc.Corning, Inc.
All of the above directors are also directors of Federal Insurance Company. Certain are also directorsof other subsidiaries of the Corporation.
Chairman and Chief Executive OÇcer Vice PresidentsOÇcersDEAN R. O'HARE WILMA J. DAVIS
BRANT W. FREE, JR.President FREDERICK W. GAERTNER
JOHN J. DEGNAN NED I. GERSTMAN
ROBERT A. MARZOCCHI
Executive Vice Presidents MARJORIE D. RAINES
DAVID B. KELSO RICHARD V. WERNER
THOMAS F. MOTAMED ROBERT M. WITKOFF
DONN H. NORTON
MICHAEL O'REILLY Vice President and CounselMICHAEL J. O'NEILL, JR.
Senior Vice PresidentsDANIEL J. CONWAY Vice President and Associate CounselGAIL E. DEVLIN JOHN E. WISINGER
DAVID S. FOWLER
ANDREW A. MCELWEE, JR. Vice President and SecretaryGLENN A. MONTGOMERY HENRY G. GULICK
HENRY B. SCHRAM
Vice President and TreasurerSenior Vice President and General Counsel PHILIP J. SEMPIER
ROBERT RUSIS
Directors and OÇcers as of March 6, 1998
To Our Shareholders:
Dean R. O'Hare
Chairman and Chief Executive OÇcer
In 1997, we again achieved our primary goal of increasing
the value of your investment in Chubb. We produced
signiÑcant earnings growth, a result of record underwriting
proÑts and strong gains in investment income. We
completed the sale of our life insurance business,
returning most of the proceeds directly to shareholders
through the repurchase of approximately 12.9 million
Chubb shares at an average cost of $63.98 per share.
Together with the cash dividends paid during the year, we
distributed more than $1 billion to shareholders in 1997.
During the year, we also sold a substantial portion of our
real estate properties, using the proceeds to reduce debt.
As a result, Chubb's balance sheet is in its strongest
position in my 35 years with the company, giving us
tremendous Öexibility with respect to potential acquisi-
tions, further share repurchases or other initiatives.
2
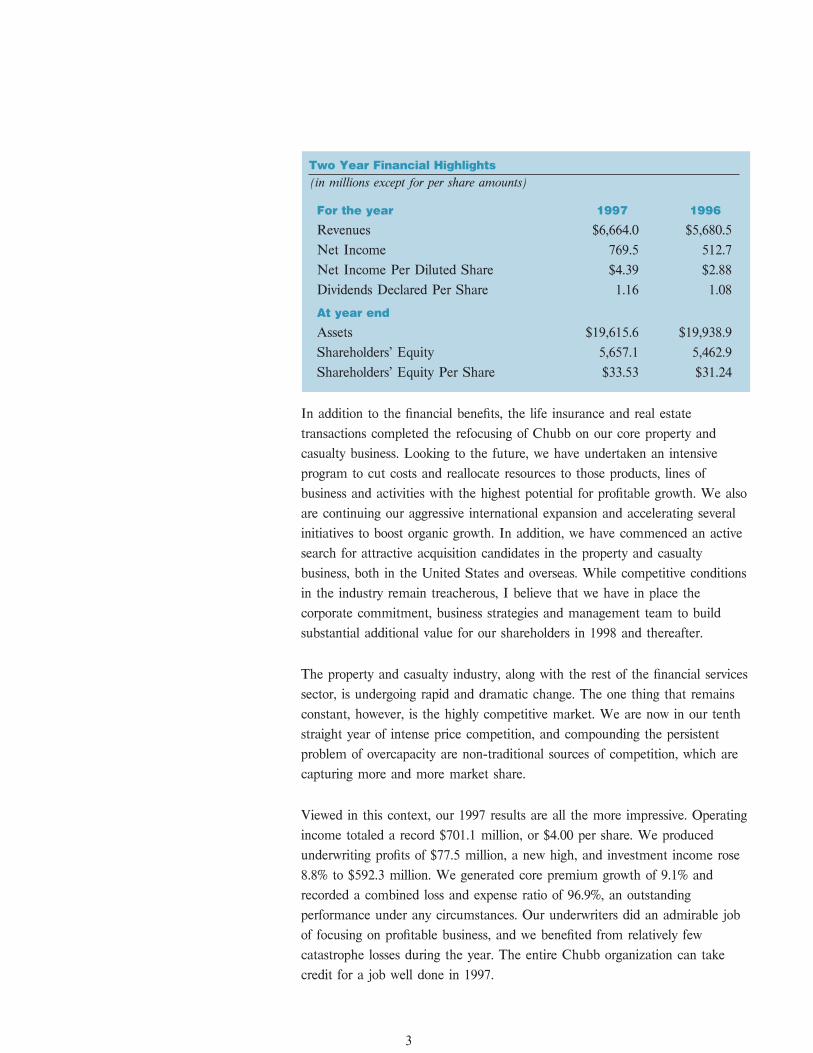
Two Year Financial Highlights
(in millions except for per share amounts)
For the year 1997 1996
Revenues $6,664.0 $5,680.5
Net Income 769.5 512.7
Net Income Per Diluted Share $4.39 $2.88
Dividends Declared Per Share 1.16 1.08
At year end
Assets $19,615.6 $19,938.9
Shareholders' Equity 5,657.1 5,462.9
Shareholders' Equity Per Share $33.53 $31.24
In addition to the Ñnancial beneÑts, the life insurance and real estate
transactions completed the refocusing of Chubb on our core property and
casualty business. Looking to the future, we have undertaken an intensive
program to cut costs and reallocate resources to those products, lines of
business and activities with the highest potential for proÑtable growth. We also
are continuing our aggressive international expansion and accelerating several
initiatives to boost organic growth. In addition, we have commenced an active
search for attractive acquisition candidates in the property and casualty
business, both in the United States and overseas. While competitive conditions
in the industry remain treacherous, I believe that we have in place the
corporate commitment, business strategies and management team to build
substantial additional value for our shareholders in 1998 and thereafter.
The property and casualty industry, along with the rest of the Ñnancial services
sector, is undergoing rapid and dramatic change. The one thing that remains
constant, however, is the highly competitive market. We are now in our tenth
straight year of intense price competition, and compounding the persistent
problem of overcapacity are non-traditional sources of competition, which are
capturing more and more market share.
Viewed in this context, our 1997 results are all the more impressive. Operating
income totaled a record $701.1 million, or $4.00 per share. We produced
underwriting proÑts of $77.5 million, a new high, and investment income rose
8.8% to $592.3 million. We generated core premium growth of 9.1% and
recorded a combined loss and expense ratio of 96.9%, an outstanding
performance under any circumstances. Our underwriters did an admirable job
of focusing on proÑtable business, and we beneÑted from relatively few
catastrophe losses during the year. The entire Chubb organization can take
credit for a job well done in 1997.
3
The Evolving Property
and Casualty Industry
who are responsible for more than halfwo far-reaching trends are
of Chubb's premiums and are ourTreshaping the property and
principal links to the middle marketcasualty industry and are likely to
customers that are the core of ourhave an increasing impact on its
commercial business. Chubb'scompetitive make-up in the coming
traditional high level of service is theyears. One is consolidation among
foundation on which theseboth producers and insurers. The
relationships are built. In recent yearsother is the convergence of insurance
they have been strengthened by aand other Ñnancial services, driven by
steady stream of product innovationsderegulation in the United States and
and our eÅorts to enable principallythe globalization of business and the
domestic producers to leverage theÑnancial markets.
Chubb global network to better serveThe domestic insurance industry is
their customers. We are addingboth mature and highly fragmented.
sophisticated new capabilities, suchProducers and insurers alike are
as alternative risk transfer vehicles forseeking greater size, economies of
the middle market, to keep thesescale, market share and global reach
relationships strong and growing.through mergers and acquisitions.
The other major trend with substantialM&A activity is as fast-paced overseas
ramiÑcations for our future is theas it is in the United States.
deregulation and convergence ofInternational mergers among carriers
Ñnancial services. This convergence isare creating large, powerful
well under way on a global scale, andcompetitors with a big potential
it will accelerate as the last regulatoryadvantage in the U.S. market because
barriers in the U.S. are swept aside.they do not carry the environmental
We are already seeing the emergenceand tort liability baggage that weighs
of a number of broad-based,down many domestic insurers.
multinational Ñnancial servicesThere are several ramiÑcations of this
providers. With their experience atconsolidation activity for Chubb.
managing a wide range of risks andProducer consolidation heightens the
ready access to capital markets, theseimportance of our two largest
competitors will be sought out moreproducers, J&H Marsh & McLennan
and more by commercial customersand Aon, and dictates that we and
looking to secure a full range ofthey work together to Ñnd innovative
Ñnancial services and riskways to provide our mutual customers
management devices from integratedwith better, more cost-eÅective
suppliers.service. The Marsh & McLennan global
Our ability to broaden our ownbroking centers are one example of
organizational capabilities, throughthis. Aon Enterprise is another. Both
either internal growth or acquisition,are described in the adjoining letter.
and deepen our expertise in ourAt the same time, consolidation
chosen specialty niches will be theunderscores the importance of
keys to addressing the advent ofregional and local agents and brokers,
these non-traditional competitors.
4
In light of these results, the Board of Directors voted at its meeting today to
raise the regular quarterly dividend to $0.31 per share from $0.29 per share,
an increase of 6.9%.
The old adage says that change begets opportunity, and within our changing
industry, discussed on the opposite page, we see many opportunities for further
proÑtable growth, both in the United States and overseas. In last year's report
to shareholders, I outlined our strategy for serving the growing needs of the
Chubb property and casualty target customers: middle market growth
companies and individuals or families with substantial assets to protect. In
1997, we developed a three-part program to leverage our strong relationships
with these customers:
1. Get Ñrm, long-term control of our costs and allocate our available resources
more eÅectively to be sure that we are putting our human and Ñnancial
capital where they will generate the highest returns.
2. Accelerate growth in our existing high-proÑt lines of business, i.e., personal
lines, commercial specialty lines and multinational insurance programs, and
develop rapidly new capabilities in such high-potential areas as alternative risk
transfer.
3. Augment this internal growth with strategic property and casualty
acquisitions that will complement and add to Chubb's skills, capabilities, reach
and growth potential.
All aspects of this program are well under way. The balance of this letter
describes each step in more detail.
Cost control and resource allocation
To get better control over our costs and ensure we are putting our available
resources where they count most, we are currently in the midst of an intensive
activity value analysis (AVA) process. The goal of AVA is to identify and
eliminate unproductive activity so we can reduce expenses and redirect
resources to those activities that are making, or have the potential to make,
the biggest contribution to corporate performance. All of Chubb's operations
are participating in this program. We will complete the initial analysis phase
later in March and begin implementation promptly. While we have not yet
quantiÑed with speciÑcity the full impact of AVA, I personally expect that it
will yield permanent annual savings in the $100 to $150 million range,
beginning in 1999. Job reductions are one unfortunate, but inevitable,
consequence. In this connection, we expect to record a restructuring charge
against earnings in the Ñrst quarter of 1998; however, the amount of the
charge has not yet been determined.
5
We have in
place the
corporate
commitment,
business
strategies and
management team
to build
substantial
additional value
for our
shareholders.
In addition to the cost savings, the AVA process will lead to a streamlined,
more agile organization that can respond better and faster to changes in the
marketplace. Speed is becoming an increasingly important competitive
diÅerentiator in many aspects of our business, among them product
development and roll-out, technological innovation and competitive response.
We cannot aÅord to be weighed down by our own structure and bureaucracy.
Igniting internal growth
The U.S. property and casualty market is not expected to grow at more than
3% per year for the foreseeable future. We believe that we can continue to
grow at double this rate, if not faster, by continuing our time-tested strategy of
identifying proÑtable, under-served niches and developing specialized products
and services for them. Putting our capital to work behind high-potential
products and business initiatives and continuing our geographic expansion are
two of the ways we are using our balance sheet to maximize shareholder
returns.
In the last two years, we have stepped up our new product development
considerably. As a result, we have introduced more new products than at any
time in the last decade. Recent additions include multimedia liability
insurance for the computer software industry; professional liability coverage for
insurance companies; combined liability and errors and omissions coverage for
venture capital Ñrms; the broadest industrial insurance coverage in Germany;
and a new unit trust liability program in Singapore. These are in addition to
such products as employment practices liability insurance and the ForeFront
by Chubb package of liability coverages for private companies, which were
introduced a few years ago and continue to pick up steam in the marketplace.
In our personal insurance business, we have clearly established our Master-
piece policy as one of the most recognized brands in insurance and, indeed, all
of Ñnancial services. Thanks to the success of Masterpiece, and to very light
catastrophe losses in 1997, Chubb's Personal Lines Division reported its third
straight year of exceptional results, with core premium growth of 9.2% and a
combined ratio of 83.1%. On pages 10-12, we look at why Masterpiece is so
successful and its prospects for continued growth both in the United States
and in international markets.
In commercial lines, we are beginning to see growing interest in alternative
risk transfer (ART) programs at the top end of the middle market Ì the
heart of our commercial business Ì and we have the opportunity to take the
oÅensive in providing these customers with early access to ART mechanisms.
Alternative risk programs are well established among the world's largest
commercial insurance customers, with almost every major corporation today
6

making some use of self-insurance vehicles, captives, risk retention groups and
Ñnite risk mechanisms. While we participate in many of these programs, we
believe that there is signiÑcant potential in expanding our capabilities, with a
particular eye on our middle market customers, and in developing product
oÅerings that blend traditional insurance coverages with alternative risk
vehicles for this market segment.
Several factors will diÅerentiate Chubb in this market, among them our
unsurpassed underwriting expertise, Ñnancial strength, reputation for service
and our ability to deliver these programs locally through our branch network
and to coordinate blended programs on a worldwide basis. We have additional
building to do, but this is the kind of strategic innovation at which Chubb
excels. I expect to see signiÑcant increases in ART-related premiums and fee
income within the next Ñve years.
Developing creative business arrangements with our major brokers is another
source of growth and eÇciency. For example, we are part of an innovative
joint undertaking with Aon and three other carriers to address the growing
small business market in a centralized, focused and cost-eÅective manner. In
another instance, we are participating in Marsh & McLennan's global broking
program, which consolidates servicing of middle market customers in regional
account centers. While we remain committed to providing underwriting and
loss control services through our local branch network, centralized processing
of certain classes of business does oÅer opportunities for real cost savings for
broker and insurer alike.
To deliver both greater eÇciency and enhanced customer service in claims
handling, we will open our Ñrst ""rapid response unit'' this spring in
Chesapeake, Virginia. This new regional service center will facilitate reporting
and processing of most of Chubb's service-intensive claims east of the
Mississippi River.
We are continuing to grow through geographic expansion, both domestically
and overseas. In the U.S., we are augmenting our 50 full-service branches
with smaller ""production oÇces'' in such cities as Austin, Grand Rapids,
Sacramento, and Salt Lake City, where a cost-eÅective presence can generate
additional, proÑtable premiums. Overseas, we added three new oÇces in
Europe and Latin America, on top of the eight new branches we opened in
1996.
With more than 110 oÇces in 30 countries, our international infrastructure is
largely in place. Our principal emphasis now is on building our global
customer base. This means completing the transition of Chubb from a U.S.-
based insurer selling U.S. products overseas to a global company selling
7
With more than
110 offices in
30 countries,
our international
infrastructure is
largely in place.
Our principal
emphasis now is
on building our
global customer
base.
specialized products and services to a balanced mix of U.S. and international
customers. We made good progress in 1997, as core international premiums
increased 12.5%, and we again produced an underwriting proÑt on this
business. Generating one third of our premiums from outside the United
States by the year 2005 remains a key corporate goal.
We expect that the economic diÇculties in Asia will likely slow our growth in
this region in the near term, but our base of business is not large enough for
there to be a signiÑcant impact on company-wide results. Moreover, recent
events in the region may result in opportunities for Chubb that otherwise
would not have presented themselves. We will be on the lookout for these,
and we remain committed to this region over the long term.
Acquisitions and capital management
The third way in which we can enhance the value of Chubb is with the right
acquisition Ì at the right price. I deÑne the ""right'' acquisition as one that
provides the opportunity for increased earnings and a strategic advantage in
either specialty lines or high-potential markets in the U.S. or abroad. The
right acquisition can also improve our position with independent agents,
provide expertise we do not now possess in various lines of business, open new
or enhanced distribution channels, and give us greater resources for product
development, geographic expansion and technology enhancement.
That said, attractive acquisition candidates that oÅer a sound strategic Ñt and
positive earnings impact are not easy to Ñnd. We do not intend to acquire
another insurer simply to get bigger faster. There is little value in such an
approach. Rather than one large acquisition, it may require several smaller
deals to meet our strategic criteria. I believe that, given time, we will Ñnd
acquisitions that meet our primary strategic criteria of strengthening our
specialty focus and expanding our geographic reach.
While we are looking aggressively for the right acquisition, we are also
prepared to pursue other means of using the strength of our balance sheet to
further build shareholder wealth. Additional share repurchases at current
prices represent good value. We have great Öexibility to use debt more
aggressively, if it is in your interests to do so. As I said at the outset of this
letter, enhancing the value of your investment in Chubb is our primary goal as
we enter each new year. We have a highly talented, diverse, hard-working
team of employees committed to achieving this objective again in 1998.
Board and management changes
With much regret, I report the retirement of two long-time directors of The
Chubb Corporation. Robert V. Lindsay left the board at year-end, and
8
G.G. Michelson will step down in April. Both have been invaluable friends,
advisers and stewards of the corporation. We will miss them.
At its meeting today, the board elected two new directors, James M.
Cornelius and James M. Zimmerman. Mr. Cornelius is chairman of the board
of Guidant Corporation and a former chief Ñnancial oÇcer of Eli Lilly and
Company. Mr. Zimmerman is chairman and chief executive oÇcer of
Federated Department Stores, Inc. I am pleased to welcome these two
distinguished executives to the Chubb board.
Last December, two senior oÇcers, Bob Crawford and Edward Dunlop,
retired, each having served more than 30 years at Chubb. An executive vice
president of The Chubb Corporation, Bob was also president of Chubb & Son
for the last four years and oversaw the strong, proÑtable growth of our
property and casualty business during this period. Ed was a senior vice
president of the corporation and is the executive most directly responsible for
building our worldwide branch network. Both men made innumerable
contributions to the company during their long careers, and we wish them
well.
In December, Tom Motamed was appointed to the new position of executive
vice president and chief operations oÇcer. In a 20-year career with Chubb
that has included positions in claims, marketing, and branch and zone
management, Tom has long demonstrated that he is one of our most capable
executives. Tom has the energy and leadership we need in today's competitive
market. I am conÑdent that he will be a high-impact addition to Chubb's top
management ranks.
As always, we are grateful for the hard work and dedicated support of our
employees and our producers worldwide. They are largely responsible for our
success. I greatly appreciate their eÅorts and ask them to keep up the good
work in 1998.
Sincerely,
Dean R. O'Hare
Chairman and Chief Executive OÇcer
March 6, 1998
9
Redefining Personal Insurance
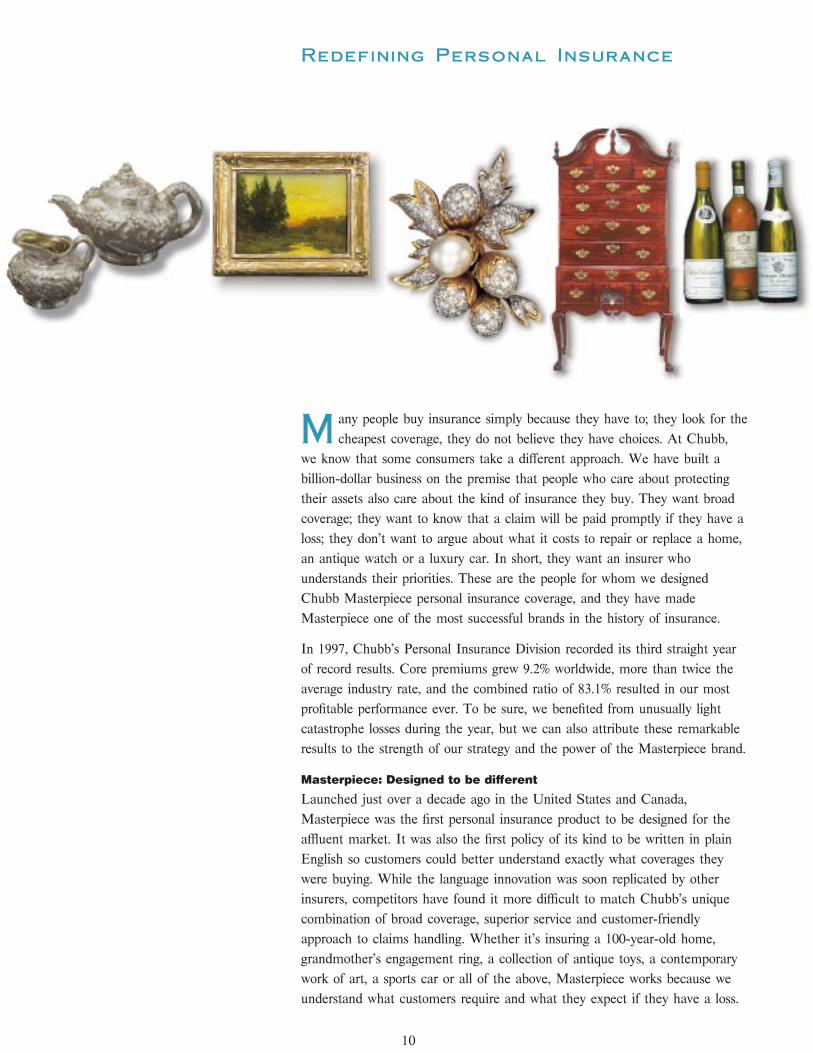
Many people buy insurance simply because they have to; they look for the
cheapest coverage, they do not believe they have choices. At Chubb,
we know that some consumers take a diÅerent approach. We have built a
billion-dollar business on the premise that people who care about protecting
their assets also care about the kind of insurance they buy. They want broad
coverage; they want to know that a claim will be paid promptly if they have a
loss; they don't want to argue about what it costs to repair or replace a home,
an antique watch or a luxury car. In short, they want an insurer who
understands their priorities. These are the people for whom we designed
Chubb Masterpiece personal insurance coverage, and they have made
Masterpiece one of the most successful brands in the history of insurance.
In 1997, Chubb's Personal Insurance Division recorded its third straight year
of record results. Core premiums grew 9.2% worldwide, more than twice the
average industry rate, and the combined ratio of 83.1% resulted in our most
proÑtable performance ever. To be sure, we beneÑted from unusually light
catastrophe losses during the year, but we can also attribute these remarkable
results to the strength of our strategy and the power of the Masterpiece brand.
Masterpiece: Designed to be diÅerent
Launched just over a decade ago in the United States and Canada,
Masterpiece was the Ñrst personal insurance product to be designed for the
aÉuent market. It was also the Ñrst policy of its kind to be written in plain
English so customers could better understand exactly what coverages they
were buying. While the language innovation was soon replicated by other
insurers, competitors have found it more diÇcult to match Chubb's unique
combination of broad coverage, superior service and customer-friendly
approach to claims handling. Whether it's insuring a 100-year-old home,
grandmother's engagement ring, a collection of antique toys, a contemporary
work of art, a sports car or all of the above, Masterpiece works because we
understand what customers require and what they expect if they have a loss.
10
The strategy behind Masterpiece has been to target customers with ""insurable
wealth,'' that is, people who make signiÑcant investments in their home (or
homes), Ñne art, antiques, jewelry, silver, luxury cars or other valuable
possessions. The premise is simple: members of this large and growing group
of consumers care about what they own, they want to insure it for what it is
worth, and they seek value in an insurance relationship, not simply the
cheapest price. The strong economy and the rising stock market has greatly
expanded insurable wealth in the United States. There are currently more
than 4 million homes worth $300,000 or more nationwide. Art and antique
prices are on the rise. The market for Masterpiece is growing rapidly.
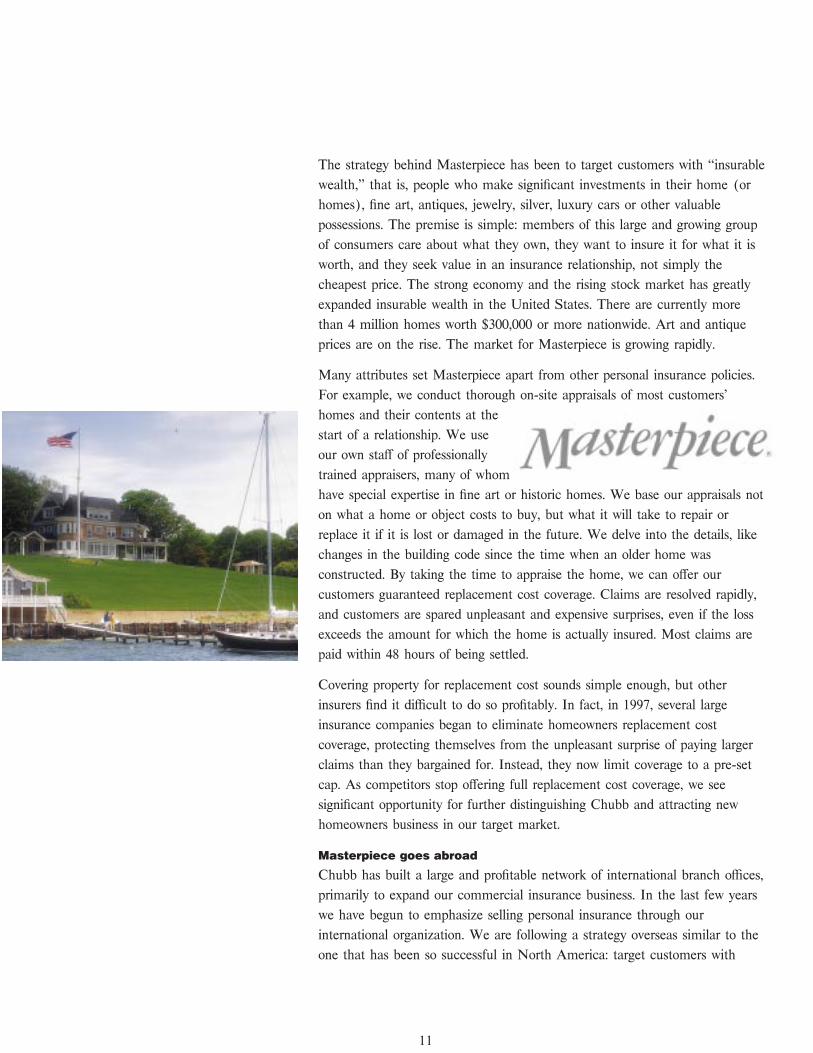
Many attributes set Masterpiece apart from other personal insurance policies.
For example, we conduct thorough on-site appraisals of most customers'
homes and their contents at the
start of a relationship. We use
our own staÅ of professionally
trained appraisers, many of whom
have special expertise in Ñne art or historic homes. We base our appraisals not
on what a home or object costs to buy, but what it will take to repair or
replace it if it is lost or damaged in the future. We delve into the details, like
changes in the building code since the time when an older home was
constructed. By taking the time to appraise the home, we can oÅer our
customers guaranteed replacement cost coverage. Claims are resolved rapidly,
and customers are spared unpleasant and expensive surprises, even if the loss
exceeds the amount for which the home is actually insured. Most claims are
paid within 48 hours of being settled.
Covering property for replacement cost sounds simple enough, but other
insurers Ñnd it diÇcult to do so proÑtably. In fact, in 1997, several large
insurance companies began to eliminate homeowners replacement cost
coverage, protecting themselves from the unpleasant surprise of paying larger
claims than they bargained for. Instead, they now limit coverage to a pre-set
cap. As competitors stop oÅering full replacement cost coverage, we see
signiÑcant opportunity for further distinguishing Chubb and attracting new
homeowners business in our target market.
Masterpiece goes abroad
Chubb has built a large and proÑtable network of international branch oÇces,
primarily to expand our commercial insurance business. In the last few years
we have begun to emphasize selling personal insurance through our
international organization. We are following a strategy overseas similar to the
one that has been so successful in North America: target customers with
11
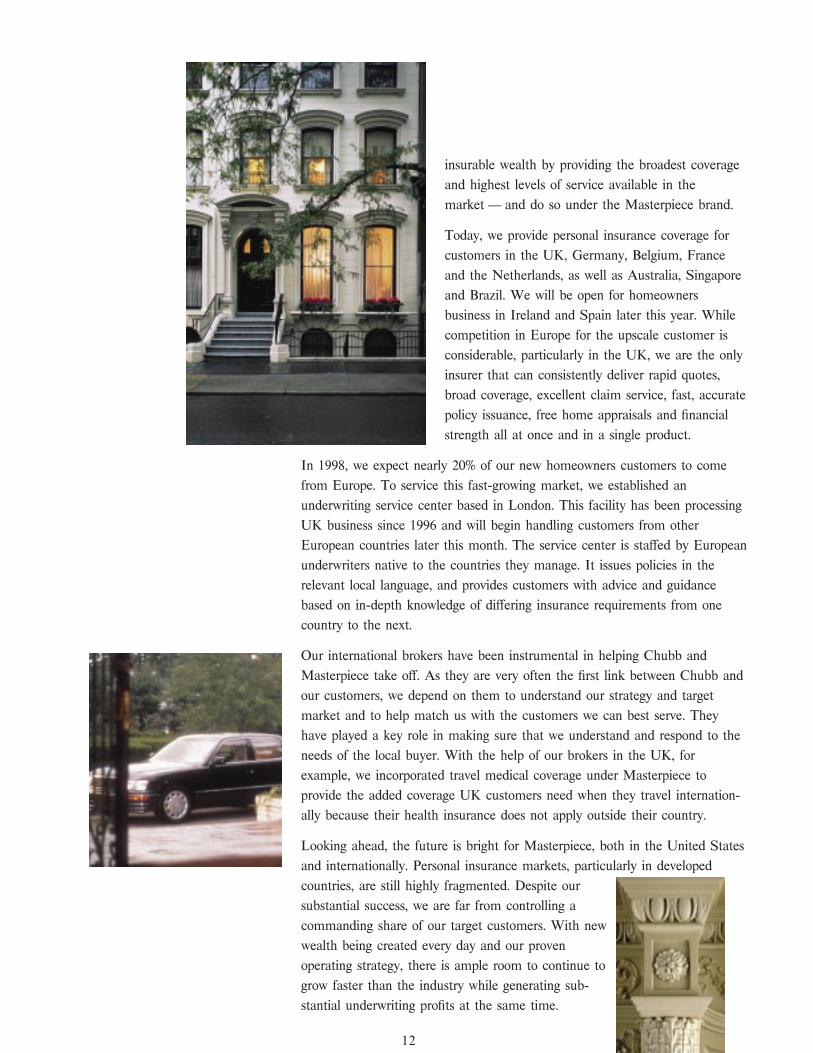
insurable wealth by providing the broadest coverage
and highest levels of service available in the
market Ì and do so under the Masterpiece brand.
Today, we provide personal insurance coverage for
customers in the UK, Germany, Belgium, France
and the Netherlands, as well as Australia, Singapore
and Brazil. We will be open for homeowners
business in Ireland and Spain later this year. While
competition in Europe for the upscale customer is
considerable, particularly in the UK, we are the only
insurer that can consistently deliver rapid quotes,
broad coverage, excellent claim service, fast, accurate
policy issuance, free home appraisals and Ñnancial
strength all at once and in a single product.
In 1998, we expect nearly 20% of our new homeowners customers to come
from Europe. To service this fast-growing market, we established an
underwriting service center based in London. This facility has been processing
UK business since 1996 and will begin handling customers from other
European countries later this month. The service center is staÅed by European
underwriters native to the countries they manage. It issues policies in the
relevant local language, and provides customers with advice and guidance
based on in-depth knowledge of diÅering insurance requirements from one
country to the next.
Our international brokers have been instrumental in helping Chubb and
Masterpiece take oÅ. As they are very often the Ñrst link between Chubb and
our customers, we depend on them to understand our strategy and target
market and to help match us with the customers we can best serve. They
have played a key role in making sure that we understand and respond to the
needs of the local buyer. With the help of our brokers in the UK, for
example, we incorporated travel medical coverage under Masterpiece to
provide the added coverage UK customers need when they travel internation-
ally because their health insurance does not apply outside their country.
Looking ahead, the future is bright for Masterpiece, both in the United States
and internationally. Personal insurance markets, particularly in developed
countries, are still highly fragmented. Despite our
substantial success, we are far from controlling a
commanding share of our target customers. With new
wealth being created every day and our proven
operating strategy, there is ample room to continue to
grow faster than the industry while generating sub-
stantial underwriting proÑts at the same time.
12
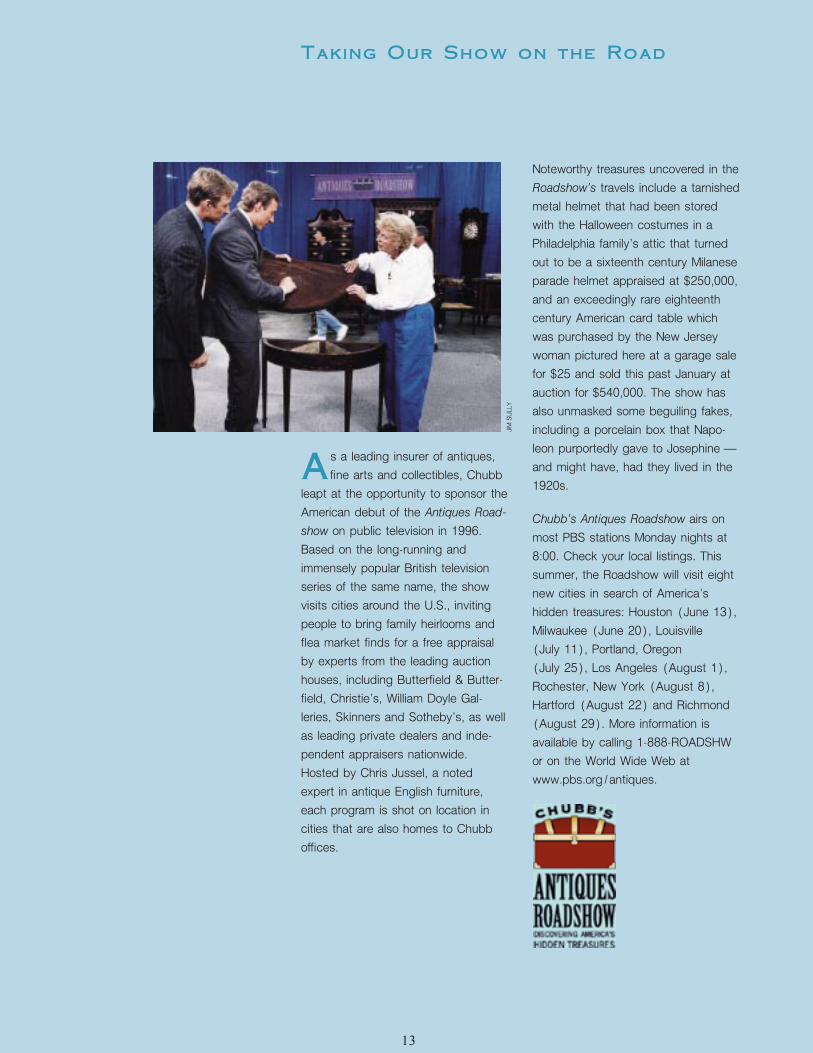
Taking Our Show on the Road
Noteworthy treasures uncovered in the
Roadshow's travels include a tarnished
metal helmet that had been stored
with the Halloween costumes in a
Philadelphia family's attic that turned
out to be a sixteenth century Milanese
parade helmet appraised at $250,000,
and an exceedingly rare eighteenth
century American card table which
was purchased by the New Jersey
woman pictured here at a garage sale
for $25 and sold this past January at
auction for $540,000. The show has
also unmasked some beguiling fakes,
including a porcelain box that Napo-
leon purportedly gave to Josephine Ìs a leading insurer of antiques,
and might have, had they lived in theAÑne arts and collectibles, Chubb1920s.
leapt at the opportunity to sponsor the
American debut of the Antiques Road-Chubb's Antiques Roadshow airs on
show on public television in 1996.most PBS stations Monday nights at
Based on the long-running and8:00. Check your local listings. This
immensely popular British televisionsummer, the Roadshow will visit eight
series of the same name, the shownew cities in search of America's
visits cities around the U.S., invitinghidden treasures: Houston (June 13),
people to bring family heirlooms andMilwaukee (June 20), Louisville
Öea market Ñnds for a free appraisal(July 11), Portland, Oregon
by experts from the leading auction(July 25), Los Angeles (August 1),
houses, including ButterÑeld & Butter-Rochester, New York (August 8),
Ñeld, Christie's, William Doyle Gal-Hartford (August 22) and Richmond
leries, Skinners and Sotheby's, as well(August 29). More information is
as leading private dealers and inde-available by calling 1-888-ROADSHW
pendent appraisers nationwide.or on the World Wide Web at
Hosted by Chris Jussel, a notedwww.pbs.org/antiques.
expert in antique English furniture,
each program is shot on location in
cities that are also homes to Chubb
oÇces.
JIM
SULL
Y
13
Forward Looking Information
Certain statements in this document may be consid- analysis program, year 2000 liabilities, its market risk
ered to be ""forward looking statements'' as that evaluations, potential acquisitions, alternate risk transfer
term is deÑned in the Private Securities Litigation programs, or with respect to announced real estate plans
Reform Act of 1995, such as statements that include the or international expansion and premium growth and
words or phrases ""will likely result'', ""are expected to'', investment income or cash Öow projections and, more
""will continue'', ""is anticipated'', ""estimate'', ""pro- generally, to: general economic conditions including
ject'', or similar expressions. Such statements are sub- changes in interest rates and the performance of the
ject to certain risks and uncertainties. The factors Ñnancial markets, changes in domestic and foreign laws,
which could cause actual results to diÅer materially regulations and taxes, changes in competition and pric-
from those suggested by any such statements include, ing environments, regional or general changes in asset
but are not limited to, those discussed or identiÑed from valuations, the occurrence of signiÑcant natural disas-
time to time in the Corporation's public Ñlings with the ters, the inability to reinsure certain risks economically,
Securities and Exchange Commission and speciÑcally the adequacy of loss reserves, as well as general market
to risks or uncertainties associated with the Corpora- conditions, competition, pricing and restructurings.
tion's expectations with respect to its activity value
14
Supplementary Financial Data
In MillionsYears Ended December 31
1997 1996 1995
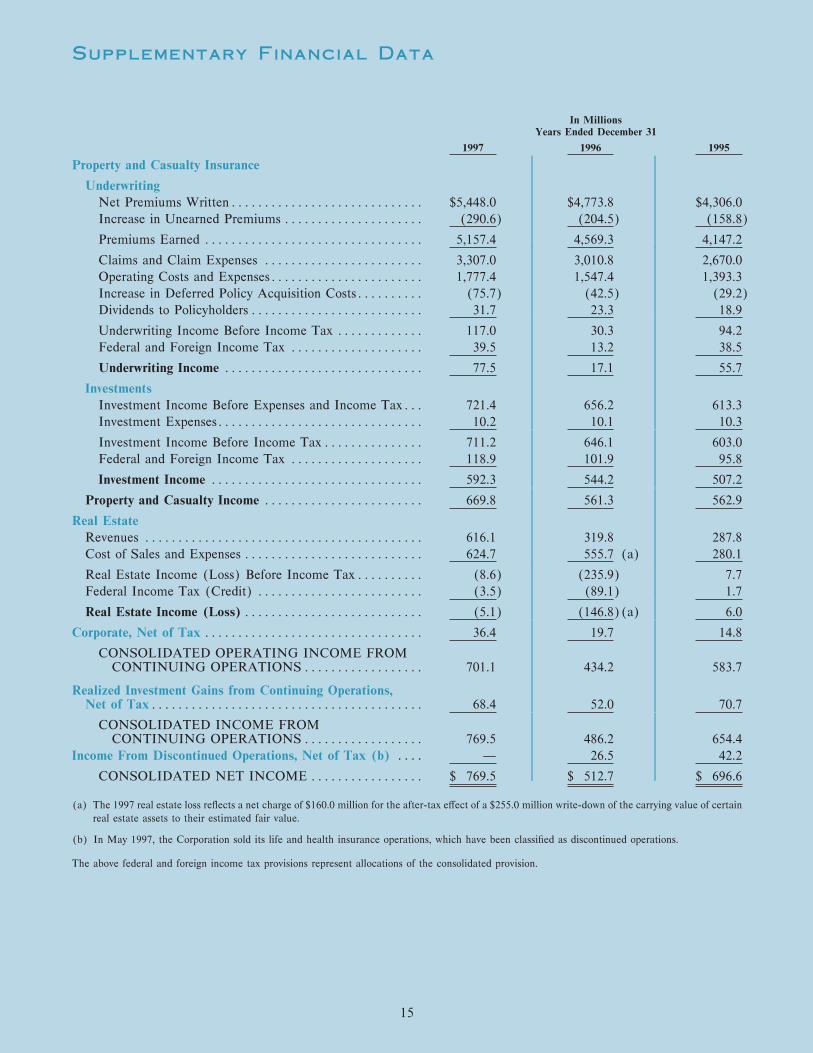
Property and Casualty Insurance
Underwriting
Net Premiums WrittenÏÏÏÏÏÏÏÏÏÏÏÏÏÏÏÏÏÏÏÏÏÏÏÏÏÏÏÏÏ $5,448.0 $4,773.8 $4,306.0
Increase in Unearned Premiums ÏÏÏÏÏÏÏÏÏÏÏÏÏÏÏÏÏÏÏÏÏ (290.6) (204.5) (158.8)
Premiums Earned ÏÏÏÏÏÏÏÏÏÏÏÏÏÏÏÏÏÏÏÏÏÏÏÏÏÏÏÏÏÏÏÏÏ 5,157.4 4,569.3 4,147.2
Claims and Claim Expenses ÏÏÏÏÏÏÏÏÏÏÏÏÏÏÏÏÏÏÏÏÏÏÏÏ 3,307.0 3,010.8 2,670.0
Operating Costs and ExpensesÏÏÏÏÏÏÏÏÏÏÏÏÏÏÏÏÏÏÏÏÏÏÏ 1,777.4 1,547.4 1,393.3
Increase in Deferred Policy Acquisition CostsÏÏÏÏÏÏÏÏÏÏ (75.7) (42.5) (29.2)
Dividends to Policyholders ÏÏÏÏÏÏÏÏÏÏÏÏÏÏÏÏÏÏÏÏÏÏÏÏÏÏ 31.7 23.3 18.9
Underwriting Income Before Income Tax ÏÏÏÏÏÏÏÏÏÏÏÏÏ 117.0 30.3 94.2
Federal and Foreign Income Tax ÏÏÏÏÏÏÏÏÏÏÏÏÏÏÏÏÏÏÏÏ 39.5 13.2 38.5
Underwriting Income ÏÏÏÏÏÏÏÏÏÏÏÏÏÏÏÏÏÏÏÏÏÏÏÏÏÏÏÏÏÏ 77.5 17.1 55.7
Investments
Investment Income Before Expenses and Income TaxÏÏÏ 721.4 656.2 613.3
Investment ExpensesÏÏÏÏÏÏÏÏÏÏÏÏÏÏÏÏÏÏÏÏÏÏÏÏÏÏÏÏÏÏÏ 10.2 10.1 10.3
Investment Income Before Income TaxÏÏÏÏÏÏÏÏÏÏÏÏÏÏÏ 711.2 646.1 603.0
Federal and Foreign Income Tax ÏÏÏÏÏÏÏÏÏÏÏÏÏÏÏÏÏÏÏÏ 118.9 101.9 95.8
Investment Income ÏÏÏÏÏÏÏÏÏÏÏÏÏÏÏÏÏÏÏÏÏÏÏÏÏÏÏÏÏÏÏÏ 592.3 544.2 507.2
Property and Casualty Income ÏÏÏÏÏÏÏÏÏÏÏÏÏÏÏÏÏÏÏÏÏÏÏÏ 669.8 561.3 562.9
Real Estate
Revenues ÏÏÏÏÏÏÏÏÏÏÏÏÏÏÏÏÏÏÏÏÏÏÏÏÏÏÏÏÏÏÏÏÏÏÏÏÏÏÏÏÏÏ 616.1 319.8 287.8
Cost of Sales and Expenses ÏÏÏÏÏÏÏÏÏÏÏÏÏÏÏÏÏÏÏÏÏÏÏÏÏÏÏ 624.7 555.7 (a) 280.1
Real Estate Income (Loss) Before Income TaxÏÏÏÏÏÏÏÏÏÏ (8.6) (235.9) 7.7
Federal Income Tax (Credit) ÏÏÏÏÏÏÏÏÏÏÏÏÏÏÏÏÏÏÏÏÏÏÏÏÏ (3.5) (89.1) 1.7
Real Estate Income (Loss)ÏÏÏÏÏÏÏÏÏÏÏÏÏÏÏÏÏÏÏÏÏÏÏÏÏÏÏ (5.1) (146.8)(a) 6.0
Corporate, Net of Tax ÏÏÏÏÏÏÏÏÏÏÏÏÏÏÏÏÏÏÏÏÏÏÏÏÏÏÏÏÏÏÏÏÏ 36.4 19.7 14.8
CONSOLIDATED OPERATING INCOME FROMCONTINUING OPERATIONSÏÏÏÏÏÏÏÏÏÏÏÏÏÏÏÏÏÏ 701.1 434.2 583.7
Realized Investment Gains from Continuing Operations,Net of TaxÏÏÏÏÏÏÏÏÏÏÏÏÏÏÏÏÏÏÏÏÏÏÏÏÏÏÏÏÏÏÏÏÏÏÏÏÏÏÏÏÏ 68.4 52.0 70.7
CONSOLIDATED INCOME FROMCONTINUING OPERATIONSÏÏÏÏÏÏÏÏÏÏÏÏÏÏÏÏÏÏ 769.5 486.2 654.4
Income From Discontinued Operations, Net of Tax (b) ÏÏÏÏ Ì 26.5 42.2
CONSOLIDATED NET INCOME ÏÏÏÏÏÏÏÏÏÏÏÏÏÏÏÏÏ $ 769.5 $ 512.7 $ 696.6
(a) The 1997 real estate loss reÖects a net charge of $160.0 million for the after-tax eÅect of a $255.0 million write-down of the carrying value of certain
real estate assets to their estimated fair value.
(b) In May 1997, the Corporation sold its life and health insurance operations, which have been classiÑed as discontinued operations.
The above federal and foreign income tax provisions represent allocations of the consolidated provision.
15
Property and Casualty Underwriting Results
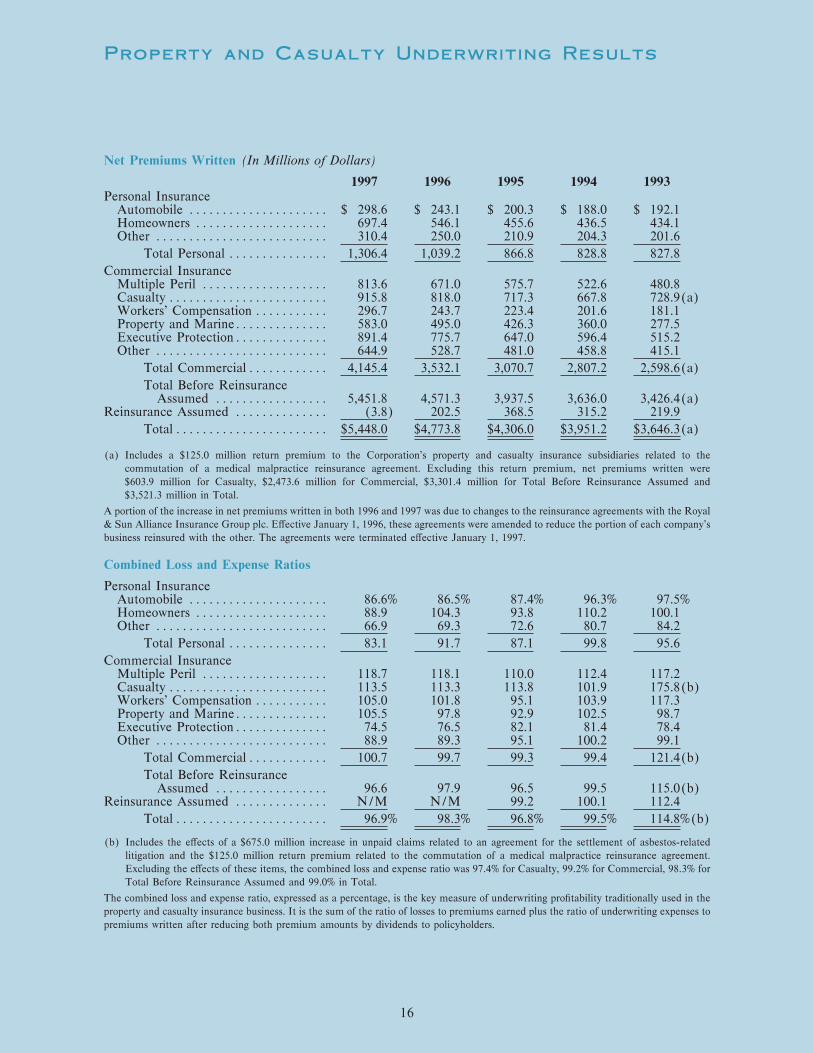
Net Premiums Written (In Millions of Dollars)
1997 1996 1995 1994 1993Personal Insurance
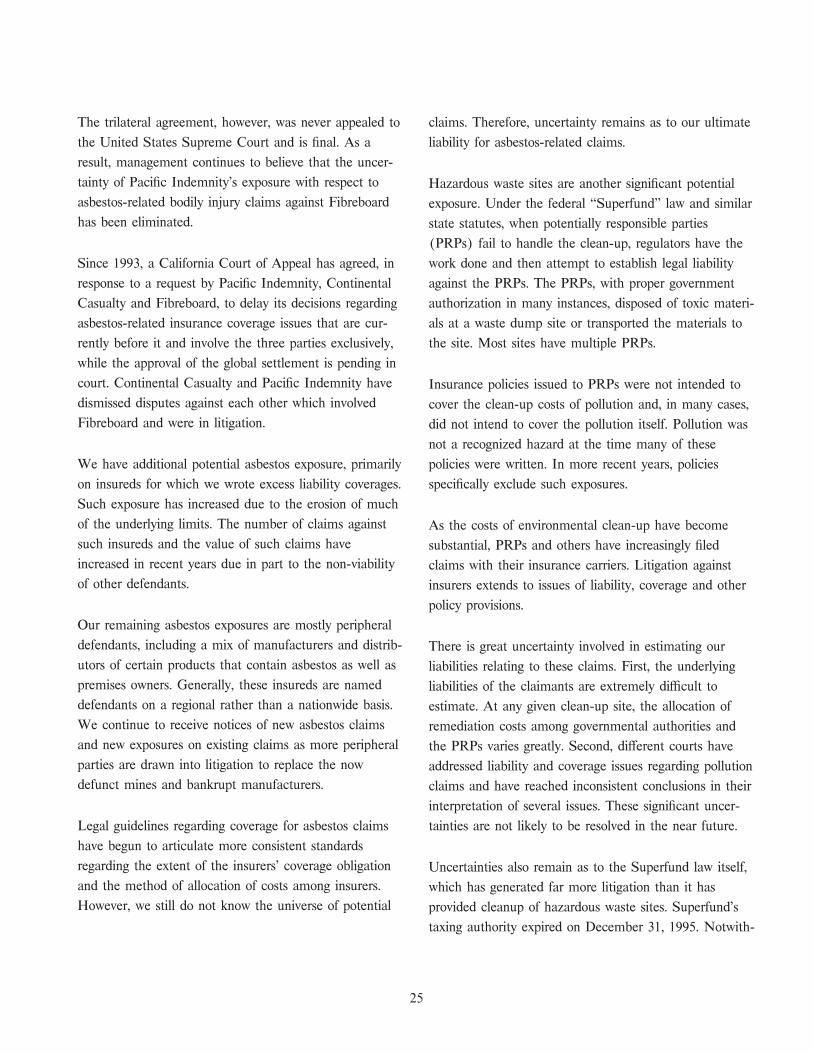
Automobile ÏÏÏÏÏÏÏÏÏÏÏÏÏÏÏÏÏÏÏÏÏ $ 298.6 $ 243.1 $ 200.3 $ 188.0 $ 192.1Homeowners ÏÏÏÏÏÏÏÏÏÏÏÏÏÏÏÏÏÏÏÏ 697.4 546.1 455.6 436.5 434.1Other ÏÏÏÏÏÏÏÏÏÏÏÏÏÏÏÏÏÏÏÏÏÏÏÏÏÏ 310.4 250.0 210.9 204.3 201.6
Total Personal ÏÏÏÏÏÏÏÏÏÏÏÏÏÏÏ 1,306.4 1,039.2 866.8 828.8 827.8
Commercial InsuranceMultiple Peril ÏÏÏÏÏÏÏÏÏÏÏÏÏÏÏÏÏÏÏ 813.6 671.0 575.7 522.6 480.8Casualty ÏÏÏÏÏÏÏÏÏÏÏÏÏÏÏÏÏÏÏÏÏÏÏÏ 915.8 818.0 717.3 667.8 728.9(a)Workers' Compensation ÏÏÏÏÏÏÏÏÏÏÏ 296.7 243.7 223.4 201.6 181.1Property and MarineÏÏÏÏÏÏÏÏÏÏÏÏÏÏ 583.0 495.0 426.3 360.0 277.5Executive ProtectionÏÏÏÏÏÏÏÏÏÏÏÏÏÏ 891.4 775.7 647.0 596.4 515.2Other ÏÏÏÏÏÏÏÏÏÏÏÏÏÏÏÏÏÏÏÏÏÏÏÏÏÏ 644.9 528.7 481.0 458.8 415.1
Total CommercialÏÏÏÏÏÏÏÏÏÏÏÏ 4,145.4 3,532.1 3,070.7 2,807.2 2,598.6(a)
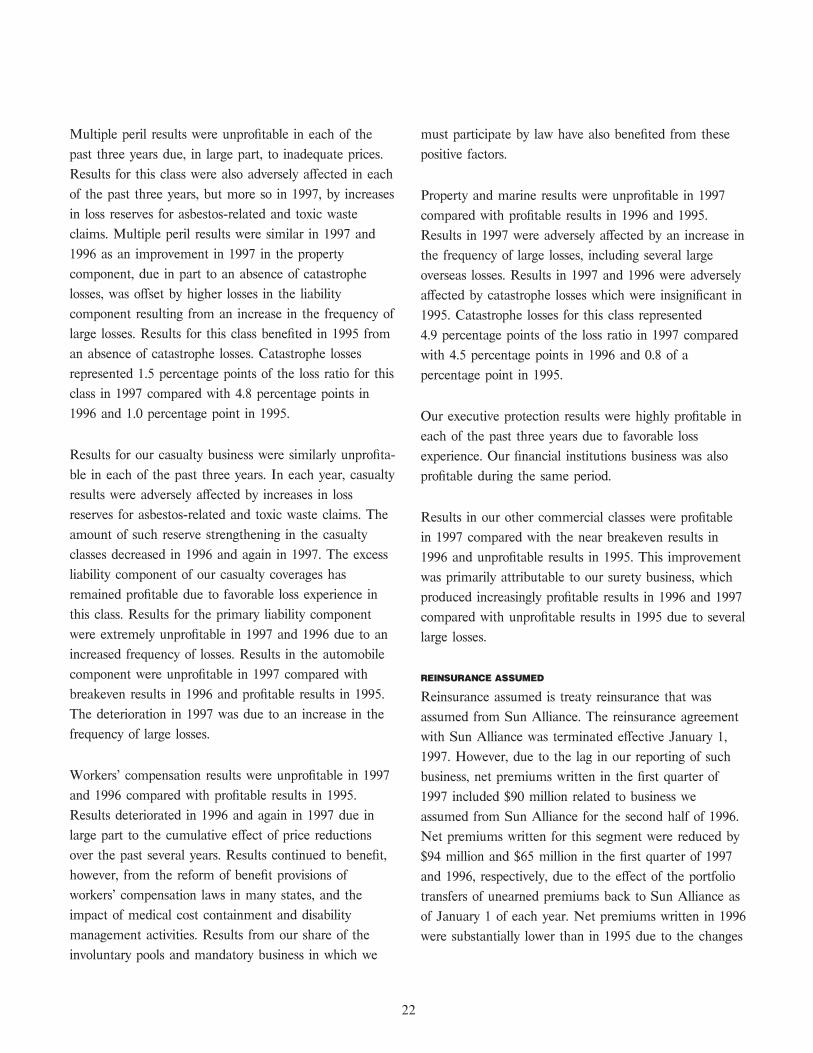
Total Before ReinsuranceAssumed ÏÏÏÏÏÏÏÏÏÏÏÏÏÏÏÏÏ 5,451.8 4,571.3 3,937.5 3,636.0 3,426.4(a)
Reinsurance Assumed ÏÏÏÏÏÏÏÏÏÏÏÏÏÏ (3.8) 202.5 368.5 315.2 219.9
Total ÏÏÏÏÏÏÏÏÏÏÏÏÏÏÏÏÏÏÏÏÏÏÏ $5,448.0 $4,773.8 $4,306.0 $3,951.2 $3,646.3(a)
(a) Includes a $125.0 million return premium to the Corporation's property and casualty insurance subsidiaries related to the
commutation of a medical malpractice reinsurance agreement. Excluding this return premium, net premiums written were
$603.9 million for Casualty, $2,473.6 million for Commercial, $3,301.4 million for Total Before Reinsurance Assumed and
$3,521.3 million in Total.
A portion of the increase in net premiums written in both 1996 and 1997 was due to changes to the reinsurance agreements with the Royal
& Sun Alliance Insurance Group plc. EÅective January 1, 1996, these agreements were amended to reduce the portion of each company's
business reinsured with the other. The agreements were terminated eÅective January 1, 1997.
Combined Loss and Expense Ratios
Personal InsuranceAutomobile ÏÏÏÏÏÏÏÏÏÏÏÏÏÏÏÏÏÏÏÏÏ 86.6% 86.5% 87.4% 96.3% 97.5%Homeowners ÏÏÏÏÏÏÏÏÏÏÏÏÏÏÏÏÏÏÏÏ 88.9 104.3 93.8 110.2 100.1Other ÏÏÏÏÏÏÏÏÏÏÏÏÏÏÏÏÏÏÏÏÏÏÏÏÏÏ 66.9 69.3 72.6 80.7 84.2
Total Personal ÏÏÏÏÏÏÏÏÏÏÏÏÏÏÏ 83.1 91.7 87.1 99.8 95.6
Commercial InsuranceMultiple Peril ÏÏÏÏÏÏÏÏÏÏÏÏÏÏÏÏÏÏÏ 118.7 118.1 110.0 112.4 117.2Casualty ÏÏÏÏÏÏÏÏÏÏÏÏÏÏÏÏÏÏÏÏÏÏÏÏ 113.5 113.3 113.8 101.9 175.8(b)Workers' Compensation ÏÏÏÏÏÏÏÏÏÏÏ 105.0 101.8 95.1 103.9 117.3Property and MarineÏÏÏÏÏÏÏÏÏÏÏÏÏÏ 105.5 97.8 92.9 102.5 98.7Executive ProtectionÏÏÏÏÏÏÏÏÏÏÏÏÏÏ 74.5 76.5 82.1 81.4 78.4Other ÏÏÏÏÏÏÏÏÏÏÏÏÏÏÏÏÏÏÏÏÏÏÏÏÏÏ 88.9 89.3 95.1 100.2 99.1
Total CommercialÏÏÏÏÏÏÏÏÏÏÏÏ 100.7 99.7 99.3 99.4 121.4(b)
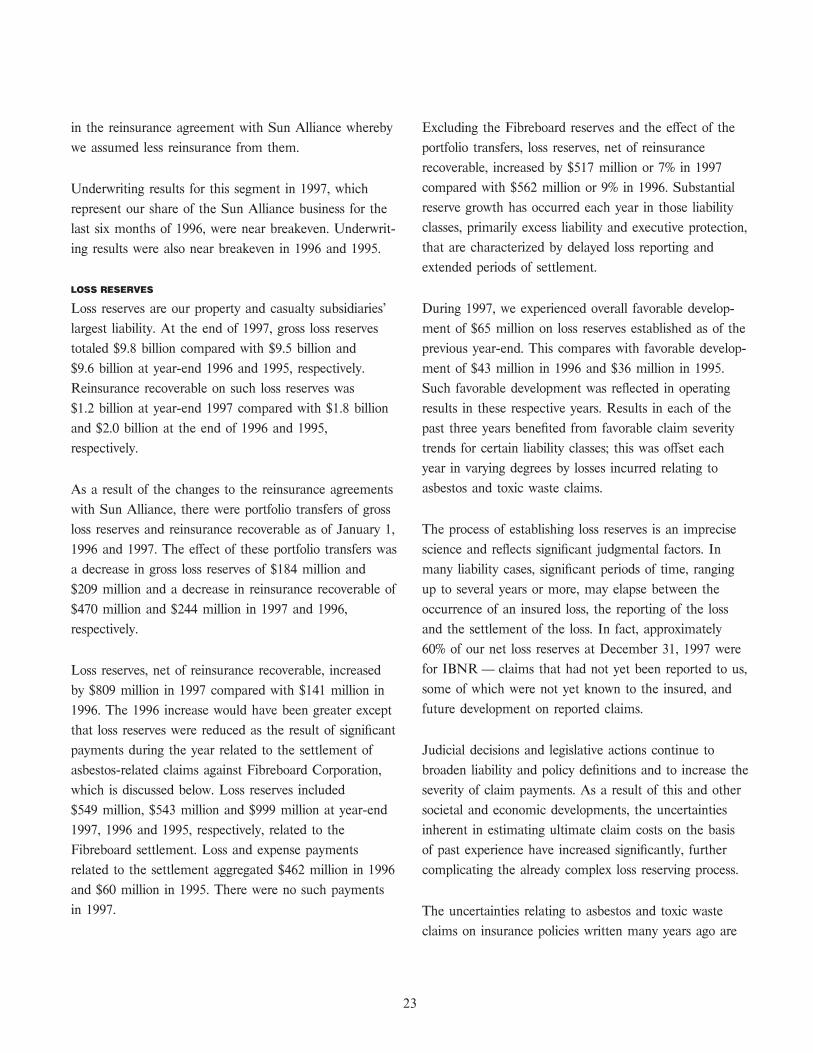
Total Before ReinsuranceAssumed ÏÏÏÏÏÏÏÏÏÏÏÏÏÏÏÏÏ 96.6 97.9 96.5 99.5 115.0(b)
Reinsurance Assumed ÏÏÏÏÏÏÏÏÏÏÏÏÏÏ N/M N/M 99.2 100.1 112.4
Total ÏÏÏÏÏÏÏÏÏÏÏÏÏÏÏÏÏÏÏÏÏÏÏ 96.9% 98.3% 96.8% 99.5% 114.8%(b)
(b) Includes the eÅects of a $675.0 million increase in unpaid claims related to an agreement for the settlement of asbestos-related
litigation and the $125.0 million return premium related to the commutation of a medical malpractice reinsurance agreement.
Excluding the eÅects of these items, the combined loss and expense ratio was 97.4% for Casualty, 99.2% for Commercial, 98.3% for
Total Before Reinsurance Assumed and 99.0% in Total.
The combined loss and expense ratio, expressed as a percentage, is the key measure of underwriting proÑtability traditionally used in the
property and casualty insurance business. It is the sum of the ratio of losses to premiums earned plus the ratio of underwriting expenses to
premiums written after reducing both premium amounts by dividends to policyholders.
16
Management's Discussion and
Analysis of Financial Condition
and Results of Operations
The following discussion presents our past results and Property and Casualty Insurance
our expectations for the near term future. Sepa- Property and casualty earnings were substantially higher
rately, we present our consolidated Ñnancial statements in 1997 than in 1996 and 1995. Property and casualty
and related notes on pages 38 to 59 and other income after taxes was $670 million in 1997 compared
supplementary Ñnancial information on pages 15, 16, 36 with $561 million in 1996 and $563 million in 1995. The
and 37, all of which are integral parts of the following increase in earnings in 1997 was due to highly proÑtable
analysis of our results of operations and our Ñnancial underwriting results as well as strong growth in invest-
position. ment income compared with 1996. Earnings in 1996
were adversely aÅected by higher catastrophe losses,
resulting primarily from the winter storms in the easternOperating income from continuing operations, which
part of the United States in the Ñrst quarter. Investmentexcludes realized investment gains and losses, was
income increased in 1996 compared with the prior year.$701 million in 1997 compared with $434 million in 1996
Earnings in 1995 beneÑted from highly proÑtable under-and $584 million in 1995. Operating income in 1996
writing results.reÖects a fourth quarter charge of $160 million after
taxes related to the write-down of the carrying value of
certain real estate assets. Catastrophe losses were $57 million in 1997, $142 million
in 1996 and $64 million in 1995. Our initial retentionIncome from continuing operations, which includes level for each catastrophic event is approximatelyrealized investment gains and losses related to such $100 million. We did not have any recoveries from ouroperations, was $770 million in 1997 compared with catastrophe reinsurance coverage during the past three$486 million in 1996 and $655 million in 1995. Decisions years since there were no individual catastrophes forto sell securities are governed principally by considera- which our losses exceeded the initial retention.tions of investment opportunities and tax consequences.
Thus, realized investment gains and losses may varyReported net premiums written amounted to $5.4 billion
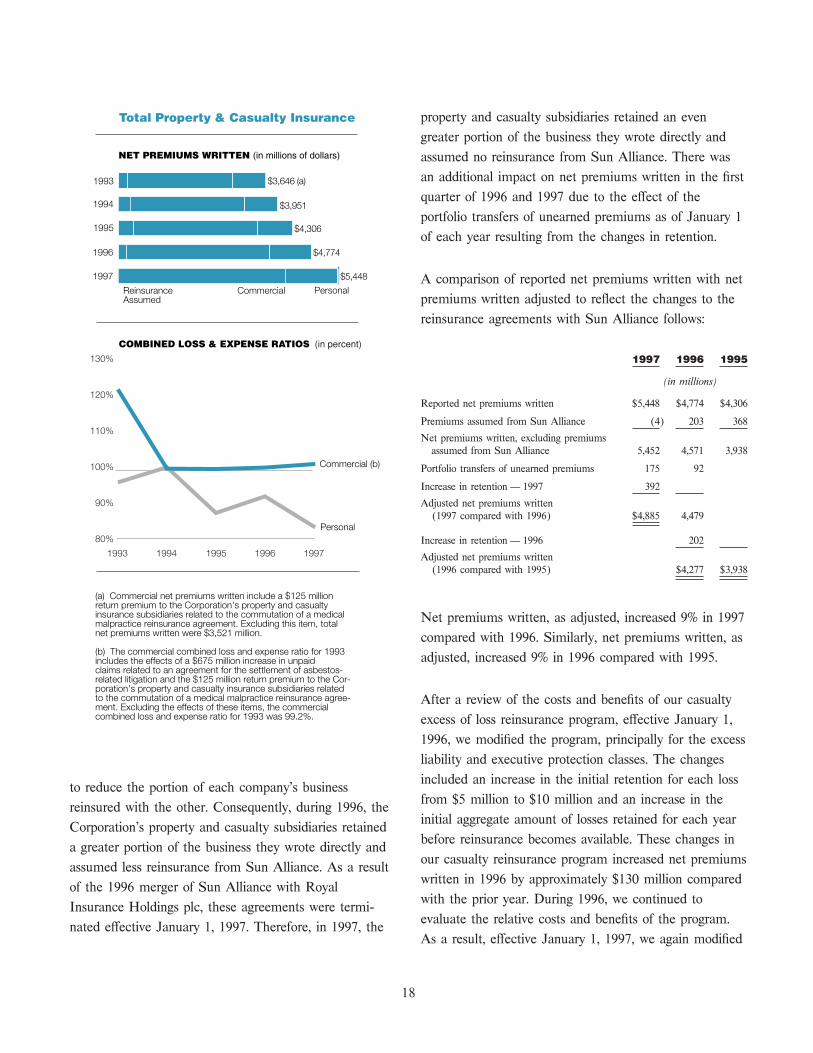
signiÑcantly from year to year.in 1997, an increase of 14% compared with 1996.
Reported net premiums written increased 11% in 1996In May 1997, the Corporation completed the sale of its
compared with 1995. Personal coverages accounted forlife and health insurance operations to JeÅerson-Pilot
$1.3 billion or 24% of 1997 premiums written andCorporation for $875 million in cash, subject to closing
commercial coverages for $4.1 billion or 76%. A portionadjustments, none of which were material. The life and
of the increase in premiums written in both 1997 andhealth insurance operations have been classiÑed as
1996 was due to changes in certain reinsurance agree-discontinued operations.
ments, which are discussed below.
Net income, which includes the results of the discontin-For many years, a portion of the U.S. insurance businessued operations, amounted to $770 million in 1997written by the Corporation's property and casualtycompared with $513 million in 1996 and $697 million insubsidiaries was reinsured on a quota share basis with a1995.subsidiary of the Sun Alliance Group plc. Similarly, a
subsidiary of the Corporation assumed a portion of Sun
Alliance's property and casualty business on a quota
share basis. EÅective January 1, 1996, the agreements
pertaining to the exchange of reinsurance were amended
17
property and casualty subsidiaries retained an even
greater portion of the business they wrote directly and
assumed no reinsurance from Sun Alliance. There was
an additional impact on net premiums written in the Ñrst
quarter of 1996 and 1997 due to the eÅect of the
portfolio transfers of unearned premiums as of January 1
of each year resulting from the changes in retention.
A comparison of reported net premiums written with net
premiums written adjusted to reÖect the changes to the
reinsurance agreements with Sun Alliance follows:
1997 1996 1995
(in millions)
Reported net premiums written $5,448 $4,774 $4,306
Premiums assumed from Sun Alliance (4) 203 368
Net premiums written, excluding premiumsassumed from Sun Alliance 5,452 4,571 3,938
Portfolio transfers of unearned premiums 175 92
Increase in retention Ì 1997 392
Adjusted net premiums written(1997 compared with 1996) $4,885 4,479
Increase in retention Ì 1996 202
Adjusted net premiums written(1996 compared with 1995) $4,277 $3,938
Net premiums written, as adjusted, increased 9% in 1997
compared with 1996. Similarly, net premiums written, as
adjusted, increased 9% in 1996 compared with 1995.
After a review of the costs and beneÑts of our casualty
excess of loss reinsurance program, eÅective January 1,
Reinsurance Assumed
PersonalCommercial
1997
1996
1995
1994
1993 $3,646 (a)
$3,951
$4,306
$4,774
$5,448
(a) Commercial net premiums written include a $125 million return premium to the Corporation's property and casualty insurance subsidiaries related to the commutation of a medical malpractice reinsurance agreement. Excluding this item, total net premiums written were $3,521 million.
(b) The commercial combined loss and expense ratio for 1993 includes the effects of a $675 million increase in unpaid claims related to an agreement for the settlement of asbestos- related litigation and the $125 million return premium to the Cor- poration's property and casualty insurance subsidiaries related to the commutation of a medical malpractice reinsurance agree- ment. Excluding the effects of these items, the commercial combined loss and expense ratio for 1993 was 99.2%.
80%
90%
100%
110%
120%
130%
19971996199519941993
Commercial (b)
Personal
1996, we modiÑed the program, principally for the excess
liability and executive protection classes. The changes
included an increase in the initial retention for each lossto reduce the portion of each company's business
from $5 million to $10 million and an increase in thereinsured with the other. Consequently, during 1996, the
initial aggregate amount of losses retained for each yearCorporation's property and casualty subsidiaries retained
before reinsurance becomes available. These changes ina greater portion of the business they wrote directly and
our casualty reinsurance program increased net premiumsassumed less reinsurance from Sun Alliance. As a result
written in 1996 by approximately $130 million comparedof the 1996 merger of Sun Alliance with Royal
with the prior year. During 1996, we continued toInsurance Holdings plc, these agreements were termi-
evaluate the relative costs and beneÑts of the program.nated eÅective January 1, 1997. Therefore, in 1997, the
As a result, eÅective January 1, 1997, we again modiÑed
18
the program, increasing the initial retention for each loss
from $10 million to $25 million. This change in our
casualty reinsurance program increased net premiums
written in 1997 by approximately $65 million compared
with 1996. These changes have had a positive impact on
the cash Öows and resulting investment income of the
property and casualty subsidiaries.
Premium growth in 1997 and 1996 was also due to the
selective writing of new business, exposure growth on
existing business and the purchase of additional coverages
by current customers. The worldwide marketplace contin-
ued to be competitive, particularly in the commercial
classes in the United States. Competitors continued to
place signiÑcant pressure on pricing as they attempted to
maintain or increase market share. As a result, price
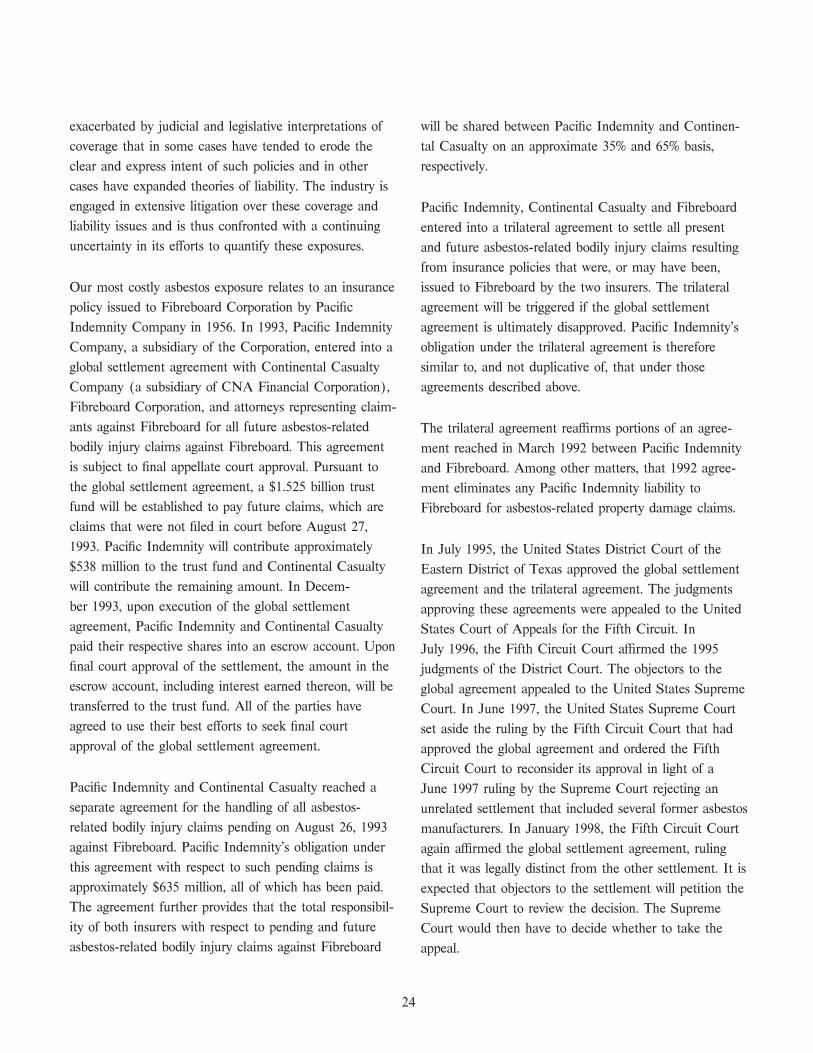
Loss RatioExpense Ratio
1997
1996
1995
1994
1993
(in percent)
114.8% (a)
96.8%
99.5%
98.3%
96.9%
Combined
32.1
32.4
32.1
32.5
32.3
66.2
64.5
64.7
67.0
82.5
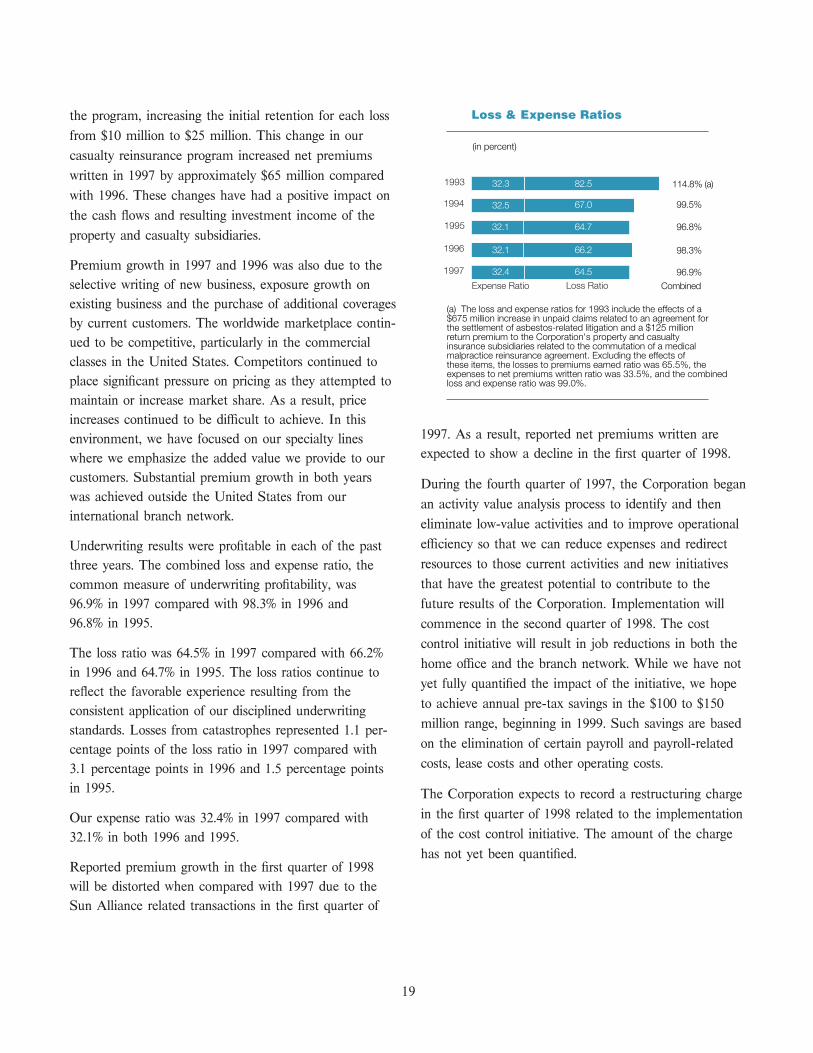
(a) The loss and expense ratios for 1993 include the effects of a $675 million increase in unpaid claims related to an agreement for the settlement of asbestos-related litigation and a $125 million return premium to the Corporation's property and casualty insurance subsidiaries related to the commutation of a medical malpractice reinsurance agreement. Excluding the effects of these items, the losses to premiums earned ratio was 65.5%, the expenses to net premiums written ratio was 33.5%, and the combined loss and expense ratio was 99.0%.
increases continued to be diÇcult to achieve. In this1997. As a result, reported net premiums written areenvironment, we have focused on our specialty linesexpected to show a decline in the Ñrst quarter of 1998.where we emphasize the added value we provide to our
customers. Substantial premium growth in both years During the fourth quarter of 1997, the Corporation beganwas achieved outside the United States from our
an activity value analysis process to identify and theninternational branch network.
eliminate low-value activities and to improve operational
eÇciency so that we can reduce expenses and redirectUnderwriting results were proÑtable in each of the past
resources to those current activities and new initiativesthree years. The combined loss and expense ratio, the
that have the greatest potential to contribute to thecommon measure of underwriting proÑtability, was
96.9% in 1997 compared with 98.3% in 1996 and future results of the Corporation. Implementation will
96.8% in 1995. commence in the second quarter of 1998. The cost
control initiative will result in job reductions in both theThe loss ratio was 64.5% in 1997 compared with 66.2%
home oÇce and the branch network. While we have notin 1996 and 64.7% in 1995. The loss ratios continue to
yet fully quantiÑed the impact of the initiative, we hopereÖect the favorable experience resulting from the
to achieve annual pre-tax savings in the $100 to $150consistent application of our disciplined underwriting
million range, beginning in 1999. Such savings are basedstandards. Losses from catastrophes represented 1.1 per-on the elimination of certain payroll and payroll-relatedcentage points of the loss ratio in 1997 compared withcosts, lease costs and other operating costs.3.1 percentage points in 1996 and 1.5 percentage points
in 1995. The Corporation expects to record a restructuring charge
in the Ñrst quarter of 1998 related to the implementationOur expense ratio was 32.4% in 1997 compared withof the cost control initiative. The amount of the charge32.1% in both 1996 and 1995.has not yet been quantiÑed.
Reported premium growth in the Ñrst quarter of 1998
will be distorted when compared with 1997 due to the
Sun Alliance related transactions in the Ñrst quarter of
19
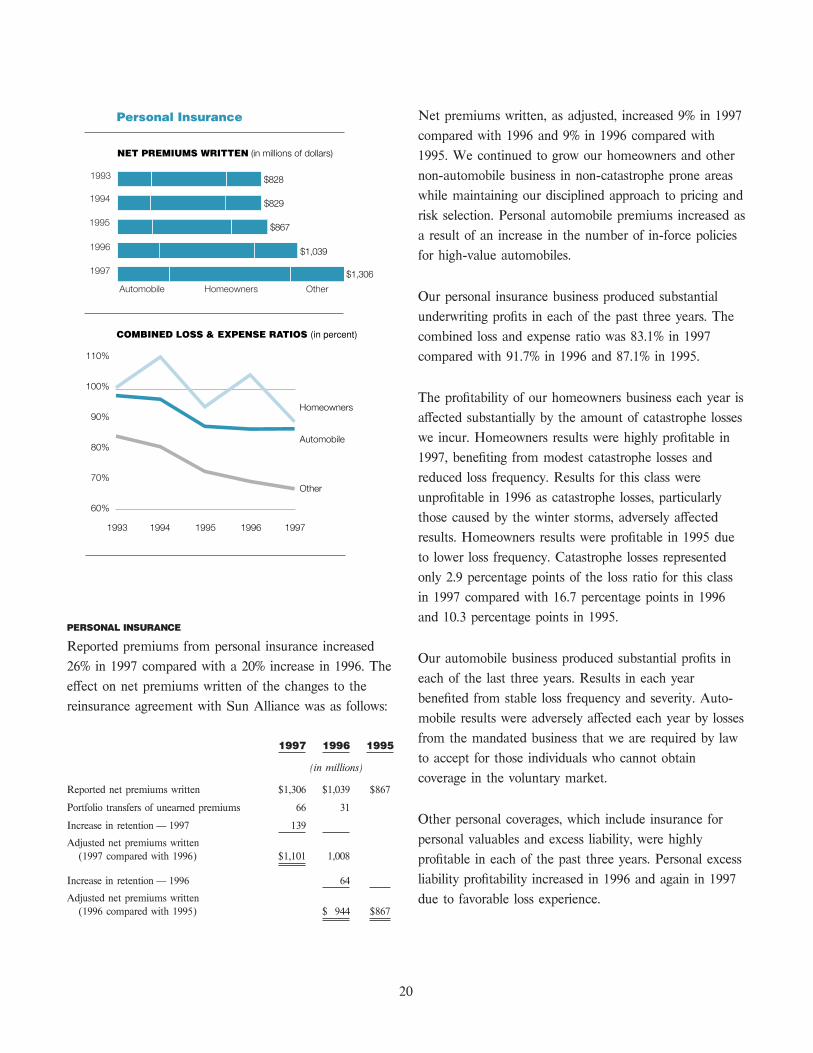
Net premiums written, as adjusted, increased 9% in 1997
compared with 1996 and 9% in 1996 compared with
1995. We continued to grow our homeowners and other
non-automobile business in non-catastrophe prone areas
while maintaining our disciplined approach to pricing and
risk selection. Personal automobile premiums increased as
a result of an increase in the number of in-force policies
for high-value automobiles.
Our personal insurance business produced substantial
underwriting proÑts in each of the past three years. The
combined loss and expense ratio was 83.1% in 1997
compared with 91.7% in 1996 and 87.1% in 1995.
The proÑtability of our homeowners business each year is
aÅected substantially by the amount of catastrophe losses
we incur. Homeowners results were highly proÑtable in
1997, beneÑting from modest catastrophe losses and
reduced loss frequency. Results for this class were
unproÑtable in 1996 as catastrophe losses, particularly
those caused by the winter storms, adversely aÅected
results. Homeowners results were proÑtable in 1995 due
to lower loss frequency. Catastrophe losses represented
OtherHomeownersAutomobile
1997
1996
1995
1994
1993 $828
$829
$867
$1,039
$1,306
70%
60%
80%
90%
100%
110%
Other
Homeowners
Automobile
19971996199519941993
only 2.9 percentage points of the loss ratio for this class
in 1997 compared with 16.7 percentage points in 1996
and 10.3 percentage points in 1995.PERSONAL INSURANCE
Reported premiums from personal insurance increasedOur automobile business produced substantial proÑts in
26% in 1997 compared with a 20% increase in 1996. Theeach of the last three years. Results in each year
eÅect on net premiums written of the changes to thebeneÑted from stable loss frequency and severity. Auto-
reinsurance agreement with Sun Alliance was as follows:mobile results were adversely aÅected each year by losses
from the mandated business that we are required by law1997 1996 1995
to accept for those individuals who cannot obtain(in millions)
coverage in the voluntary market.Reported net premiums written $1,306 $1,039 $867
Portfolio transfers of unearned premiums 66 31Other personal coverages, which include insurance for
Increase in retention Ì 1997 139
personal valuables and excess liability, were highlyAdjusted net premiums written
(1997 compared with 1996) $1,101 1,008 proÑtable in each of the past three years. Personal excess
liability proÑtability increased in 1996 and again in 1997Increase in retention Ì 1996 64
Adjusted net premiums written due to favorable loss experience.(1996 compared with 1995) $ 944 $867
20
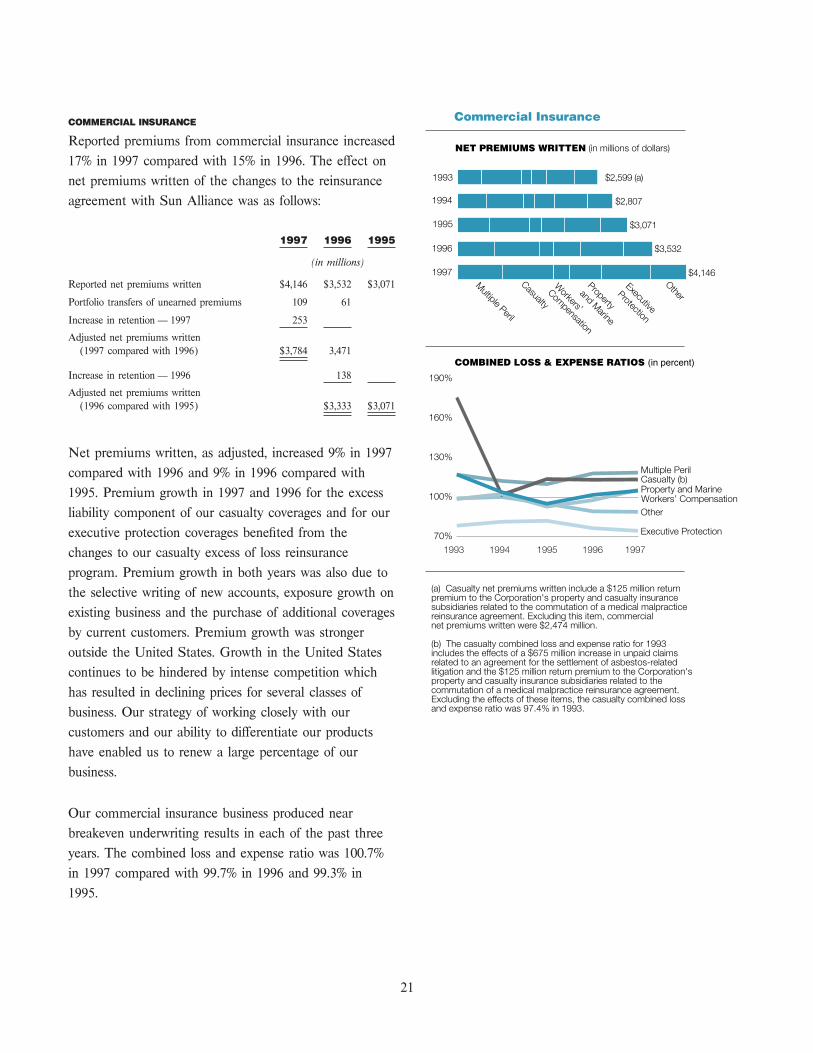
COMMERCIAL INSURANCE
Reported premiums from commercial insurance increased
17% in 1997 compared with 15% in 1996. The eÅect on
net premiums written of the changes to the reinsurance
agreement with Sun Alliance was as follows:
1997 1996 1995
(in millions)
Reported net premiums written $4,146 $3,532 $3,071
Portfolio transfers of unearned premiums 109 61
Increase in retention Ì 1997 253
Adjusted net premiums written
(1997 compared with 1996) $3,784 3,471
Increase in retention Ì 1996 138
Adjusted net premiums written
(1996 compared with 1995) $3,333 $3,071
Net premiums written, as adjusted, increased 9% in 1997
compared with 1996 and 9% in 1996 compared with
1995. Premium growth in 1997 and 1996 for the excess
liability component of our casualty coverages and for our
executive protection coverages beneÑted from the
changes to our casualty excess of loss reinsurance
program. Premium growth in both years was also due to
the selective writing of new accounts, exposure growth on
existing business and the purchase of additional coverages
by current customers. Premium growth was stronger
outside the United States. Growth in the United States
continues to be hindered by intense competition which
has resulted in declining prices for several classes of
business. Our strategy of working closely with our
OtherMultiple Peril
Executive
Protection
Casualty
Property
and Marine
Workers’
Compensation
1997
1996
1995
1994
1993 $2,599 (a)
$2,807
$3,071
$3,532
$4,146
Other
Multiple Peril
Executive Protection
Casualty (b)Property and MarineWorkers’ Compensation
1993 1994 1995 1996 1997
70%
100%
130%
160%
190%
(a) Casualty net premiums written include a $125 million return premium to the Corporation's property and casualty insurance subsidiaries related to the commutation of a medical malpractice reinsurance agreement. Excluding this item, commercial net premiums written were $2,474 million.
(b) The casualty combined loss and expense ratio for 1993 includes the effects of a $675 million increase in unpaid claims related to an agreement for the settlement of asbestos-related litigation and the $125 million return premium to the Corporation's property and casualty insurance subsidiaries related to the commutation of a medical malpractice reinsurance agreement. Excluding the effects of these items, the casualty combined loss and expense ratio was 97.4% in 1993.
customers and our ability to diÅerentiate our products
have enabled us to renew a large percentage of our
business.
Our commercial insurance business produced near
breakeven underwriting results in each of the past three
years. The combined loss and expense ratio was 100.7%
in 1997 compared with 99.7% in 1996 and 99.3% in
1995.
21
Multiple peril results were unproÑtable in each of the must participate by law have also beneÑted from these
past three years due, in large part, to inadequate prices. positive factors.
Results for this class were also adversely aÅected in each
of the past three years, but more so in 1997, by increases Property and marine results were unproÑtable in 1997
in loss reserves for asbestos-related and toxic waste compared with proÑtable results in 1996 and 1995.
claims. Multiple peril results were similar in 1997 and Results in 1997 were adversely aÅected by an increase in
1996 as an improvement in 1997 in the property the frequency of large losses, including several large
component, due in part to an absence of catastrophe overseas losses. Results in 1997 and 1996 were adversely
losses, was oÅset by higher losses in the liability aÅected by catastrophe losses which were insigniÑcant in
component resulting from an increase in the frequency of 1995. Catastrophe losses for this class represented
large losses. Results for this class beneÑted in 1995 from 4.9 percentage points of the loss ratio in 1997 compared
an absence of catastrophe losses. Catastrophe losses with 4.5 percentage points in 1996 and 0.8 of a
represented 1.5 percentage points of the loss ratio for this percentage point in 1995.
class in 1997 compared with 4.8 percentage points in
1996 and 1.0 percentage point in 1995. Our executive protection results were highly proÑtable in
each of the past three years due to favorable loss
Results for our casualty business were similarly unproÑta- experience. Our Ñnancial institutions business was also
ble in each of the past three years. In each year, casualty proÑtable during the same period.
results were adversely aÅected by increases in loss
reserves for asbestos-related and toxic waste claims. The Results in our other commercial classes were proÑtableamount of such reserve strengthening in the casualty in 1997 compared with the near breakeven results inclasses decreased in 1996 and again in 1997. The excess 1996 and unproÑtable results in 1995. This improvementliability component of our casualty coverages has was primarily attributable to our surety business, whichremained proÑtable due to favorable loss experience in produced increasingly proÑtable results in 1996 and 1997this class. Results for the primary liability component compared with unproÑtable results in 1995 due to severalwere extremely unproÑtable in 1997 and 1996 due to an large losses.increased frequency of losses. Results in the automobile
component were unproÑtable in 1997 compared with REINSURANCE ASSUMED
breakeven results in 1996 and proÑtable results in 1995. Reinsurance assumed is treaty reinsurance that wasThe deterioration in 1997 was due to an increase in the assumed from Sun Alliance. The reinsurance agreementfrequency of large losses. with Sun Alliance was terminated eÅective January 1,
1997. However, due to the lag in our reporting of such
Workers' compensation results were unproÑtable in 1997 business, net premiums written in the Ñrst quarter of
and 1996 compared with proÑtable results in 1995. 1997 included $90 million related to business we
Results deteriorated in 1996 and again in 1997 due in assumed from Sun Alliance for the second half of 1996.
large part to the cumulative eÅect of price reductions Net premiums written for this segment were reduced by
over the past several years. Results continued to beneÑt, $94 million and $65 million in the Ñrst quarter of 1997
however, from the reform of beneÑt provisions of and 1996, respectively, due to the eÅect of the portfolio
workers' compensation laws in many states, and the transfers of unearned premiums back to Sun Alliance as
impact of medical cost containment and disability of January 1 of each year. Net premiums written in 1996
management activities. Results from our share of the were substantially lower than in 1995 due to the changes
involuntary pools and mandatory business in which we
22
in the reinsurance agreement with Sun Alliance whereby Excluding the Fibreboard reserves and the eÅect of the
we assumed less reinsurance from them. portfolio transfers, loss reserves, net of reinsurance
recoverable, increased by $517 million or 7% in 1997
compared with $562 million or 9% in 1996. SubstantialUnderwriting results for this segment in 1997, which
reserve growth has occurred each year in those liabilityrepresent our share of the Sun Alliance business for the
classes, primarily excess liability and executive protection,last six months of 1996, were near breakeven. Underwrit-
that are characterized by delayed loss reporting anding results were also near breakeven in 1996 and 1995.
extended periods of settlement.
LOSS RESERVES
Loss reserves are our property and casualty subsidiaries' During 1997, we experienced overall favorable develop-
largest liability. At the end of 1997, gross loss reserves ment of $65 million on loss reserves established as of the
totaled $9.8 billion compared with $9.5 billion and previous year-end. This compares with favorable develop-
$9.6 billion at year-end 1996 and 1995, respectively. ment of $43 million in 1996 and $36 million in 1995.
Reinsurance recoverable on such loss reserves was Such favorable development was reÖected in operating
$1.2 billion at year-end 1997 compared with $1.8 billion results in these respective years. Results in each of the
and $2.0 billion at the end of 1996 and 1995, past three years beneÑted from favorable claim severity
respectively. trends for certain liability classes; this was oÅset each
year in varying degrees by losses incurred relating to
asbestos and toxic waste claims.As a result of the changes to the reinsurance agreements
with Sun Alliance, there were portfolio transfers of gross
loss reserves and reinsurance recoverable as of January 1, The process of establishing loss reserves is an imprecise
1996 and 1997. The eÅect of these portfolio transfers was science and reÖects signiÑcant judgmental factors. In
a decrease in gross loss reserves of $184 million and many liability cases, signiÑcant periods of time, ranging
$209 million and a decrease in reinsurance recoverable of up to several years or more, may elapse between the
$470 million and $244 million in 1997 and 1996, occurrence of an insured loss, the reporting of the loss
respectively. and the settlement of the loss. In fact, approximately
60% of our net loss reserves at December 31, 1997 were
for IBNR Ì claims that had not yet been reported to us,Loss reserves, net of reinsurance recoverable, increased
some of which were not yet known to the insured, andby $809 million in 1997 compared with $141 million in
future development on reported claims.1996. The 1996 increase would have been greater except
that loss reserves were reduced as the result of signiÑcant
payments during the year related to the settlement of Judicial decisions and legislative actions continue to
asbestos-related claims against Fibreboard Corporation, broaden liability and policy deÑnitions and to increase the
which is discussed below. Loss reserves included severity of claim payments. As a result of this and other
$549 million, $543 million and $999 million at year-end societal and economic developments, the uncertainties
1997, 1996 and 1995, respectively, related to the inherent in estimating ultimate claim costs on the basis
Fibreboard settlement. Loss and expense payments of past experience have increased signiÑcantly, further
related to the settlement aggregated $462 million in 1996 complicating the already complex loss reserving process.
and $60 million in 1995. There were no such payments
in 1997. The uncertainties relating to asbestos and toxic waste
claims on insurance policies written many years ago are
23
exacerbated by judicial and legislative interpretations of will be shared between PaciÑc Indemnity and Continen-
coverage that in some cases have tended to erode the tal Casualty on an approximate 35% and 65% basis,
clear and express intent of such policies and in other respectively.
cases have expanded theories of liability. The industry is
engaged in extensive litigation over these coverage and PaciÑc Indemnity, Continental Casualty and Fibreboard
liability issues and is thus confronted with a continuing entered into a trilateral agreement to settle all present
uncertainty in its eÅorts to quantify these exposures. and future asbestos-related bodily injury claims resulting
from insurance policies that were, or may have been,
Our most costly asbestos exposure relates to an insurance issued to Fibreboard by the two insurers. The trilateral
policy issued to Fibreboard Corporation by PaciÑc agreement will be triggered if the global settlement
Indemnity Company in 1956. In 1993, PaciÑc Indemnity agreement is ultimately disapproved. PaciÑc Indemnity's
Company, a subsidiary of the Corporation, entered into a obligation under the trilateral agreement is therefore
global settlement agreement with Continental Casualty similar to, and not duplicative of, that under those
Company (a subsidiary of CNA Financial Corporation), agreements described above.
Fibreboard Corporation, and attorneys representing claim-
ants against Fibreboard for all future asbestos-related The trilateral agreement reaÇrms portions of an agree-
bodily injury claims against Fibreboard. This agreement ment reached in March 1992 between PaciÑc Indemnity
is subject to Ñnal appellate court approval. Pursuant to and Fibreboard. Among other matters, that 1992 agree-
the global settlement agreement, a $1.525 billion trust ment eliminates any PaciÑc Indemnity liability to
fund will be established to pay future claims, which are Fibreboard for asbestos-related property damage claims.
claims that were not Ñled in court before August 27,
1993. PaciÑc Indemnity will contribute approximately In July 1995, the United States District Court of the$538 million to the trust fund and Continental Casualty Eastern District of Texas approved the global settlementwill contribute the remaining amount. In Decem- agreement and the trilateral agreement. The judgmentsber 1993, upon execution of the global settlement approving these agreements were appealed to the Unitedagreement, PaciÑc Indemnity and Continental Casualty States Court of Appeals for the Fifth Circuit. Inpaid their respective shares into an escrow account. Upon July 1996, the Fifth Circuit Court aÇrmed the 1995Ñnal court approval of the settlement, the amount in the judgments of the District Court. The objectors to theescrow account, including interest earned thereon, will be global agreement appealed to the United States Supremetransferred to the trust fund. All of the parties have Court. In June 1997, the United States Supreme Courtagreed to use their best eÅorts to seek Ñnal court set aside the ruling by the Fifth Circuit Court that hadapproval of the global settlement agreement. approved the global agreement and ordered the Fifth
Circuit Court to reconsider its approval in light of a
PaciÑc Indemnity and Continental Casualty reached a June 1997 ruling by the Supreme Court rejecting an
separate agreement for the handling of all asbestos- unrelated settlement that included several former asbestos
related bodily injury claims pending on August 26, 1993 manufacturers. In January 1998, the Fifth Circuit Court
against Fibreboard. PaciÑc Indemnity's obligation under again aÇrmed the global settlement agreement, ruling
this agreement with respect to such pending claims is that it was legally distinct from the other settlement. It is
approximately $635 million, all of which has been paid. expected that objectors to the settlement will petition the
The agreement further provides that the total responsibil- Supreme Court to review the decision. The Supreme
ity of both insurers with respect to pending and future Court would then have to decide whether to take the
asbestos-related bodily injury claims against Fibreboard appeal.
24
The trilateral agreement, however, was never appealed to claims. Therefore, uncertainty remains as to our ultimate
the United States Supreme Court and is Ñnal. As a liability for asbestos-related claims.
result, management continues to believe that the uncer-
tainty of PaciÑc Indemnity's exposure with respect to Hazardous waste sites are another signiÑcant potential
asbestos-related bodily injury claims against Fibreboard exposure. Under the federal ""Superfund'' law and similar
has been eliminated. state statutes, when potentially responsible parties
(PRPs) fail to handle the clean-up, regulators have the
Since 1993, a California Court of Appeal has agreed, in work done and then attempt to establish legal liability
response to a request by PaciÑc Indemnity, Continental against the PRPs. The PRPs, with proper government
Casualty and Fibreboard, to delay its decisions regarding authorization in many instances, disposed of toxic materi-
asbestos-related insurance coverage issues that are cur- als at a waste dump site or transported the materials to
rently before it and involve the three parties exclusively, the site. Most sites have multiple PRPs.
while the approval of the global settlement is pending in
court. Continental Casualty and PaciÑc Indemnity have Insurance policies issued to PRPs were not intended to
dismissed disputes against each other which involved cover the clean-up costs of pollution and, in many cases,
Fibreboard and were in litigation. did not intend to cover the pollution itself. Pollution was
not a recognized hazard at the time many of these
We have additional potential asbestos exposure, primarily policies were written. In more recent years, policies
on insureds for which we wrote excess liability coverages. speciÑcally exclude such exposures.
Such exposure has increased due to the erosion of much
of the underlying limits. The number of claims against As the costs of environmental clean-up have become
such insureds and the value of such claims have substantial, PRPs and others have increasingly Ñled
increased in recent years due in part to the non-viability claims with their insurance carriers. Litigation against
of other defendants. insurers extends to issues of liability, coverage and other
policy provisions.
Our remaining asbestos exposures are mostly peripheral
defendants, including a mix of manufacturers and distrib- There is great uncertainty involved in estimating our
utors of certain products that contain asbestos as well as liabilities relating to these claims. First, the underlying
premises owners. Generally, these insureds are named liabilities of the claimants are extremely diÇcult to
defendants on a regional rather than a nationwide basis. estimate. At any given clean-up site, the allocation of
We continue to receive notices of new asbestos claims remediation costs among governmental authorities and
and new exposures on existing claims as more peripheral the PRPs varies greatly. Second, diÅerent courts have
parties are drawn into litigation to replace the now addressed liability and coverage issues regarding pollution
defunct mines and bankrupt manufacturers. claims and have reached inconsistent conclusions in their
interpretation of several issues. These signiÑcant uncer-
Legal guidelines regarding coverage for asbestos claims tainties are not likely to be resolved in the near future.
have begun to articulate more consistent standards
regarding the extent of the insurers' coverage obligation Uncertainties also remain as to the Superfund law itself,
and the method of allocation of costs among insurers. which has generated far more litigation than it has
However, we still do not know the universe of potential provided cleanup of hazardous waste sites. Superfund's
taxing authority expired on December 31, 1995. Notwith-
25
standing continued pressure by the insurance industry Management believes that the aggregate loss reserves of
and other interested parties to achieve a legislative the property and casualty subsidiaries at December 31,
solution which would reform the liability provisions of the 1997 were adequate to cover claims for losses which had
law, Congress has not yet addressed the issue. It is occurred, including both those known to us and those yet
currently not possible to predict the direction that any to be reported. In establishing such reserves, manage-
reforms may take, when they may occur or the eÅect ment considers facts currently known and the present
that any changes may have on the insurance industry. state of the law and coverage litigation. However, given
the expansion of coverage and liability by the courts and
the legislatures in the past and the possibilities of similarThe Superfund law does not address non-Superfund sites.
interpretations in the future, particularly as they relate toFor that reason, it does not cover all existing hazardous
asbestos and toxic waste claims, as well as the uncer-waste exposures, such as those involving sites that are
tainty in determining what scientiÑc standards will besubject to state law only. There remains signiÑcant
deemed acceptable for measuring hazardous waste siteuncertainty as to the cost of remediating the state sites.
clean-up, additional increases in loss reserves may emergeBecause of the large number of state sites, such sites
that would adversely aÅect results in future periods. Thecould prove even more costly in the aggregate than
amount cannot reasonably be estimated at the presentSuperfund sites.
time.
Litigation costs remain substantial, particularly for haz-OTHER UNCERTAINTIESardous waste claims. A substantial portion of the fundsThe Corporation's property and casualty subsidiaries havewe have expended to date has been for legal feesan exposure to insured losses caused by hurricanes,incurred in the prolonged litigation of coverage issues.earthquakes, winter storms, windstorms and other cata-Primary policies provide a limit on indemnity paymentsstrophic events. The frequency and severity of catastro-but many do not limit defense costs. This sometimesphes are unpredictable. The extent of losses from aleads to the payment of defense costs in multiples of thecatastrophe is a function of both the total amount ofpolicy limits.insured exposure in an area aÅected by the event and the
severity of the event. The Corporation continuallyReserves for asbestos and toxic waste claims cannot beassesses its concentration of underwriting exposures inestimated with traditional loss reserving techniques. Wecatastrophe prone areas and develops strategies to man-have established case reserves and expense reserves forage this exposure through individual risk selection,costs of related litigation where suÇcient information hassubject to regulatory constraints, and through thebeen developed to indicate the involvement of a speciÑcpurchase of catastrophe reinsurance. In recent years, theinsurance policy. In addition, IBNR reserves have beenCorporation has invested in modeling technologies thatestablished to cover additional exposures on both knownallow us to better monitor catastrophe exposures. We alsoand unasserted claims. These reserves are continuallycontinue to explore and analyze credible scientiÑcreviewed and updated. Losses incurred relating to asbes-evidence, including the impact of global climate change,tos and toxic waste claims were $125 million in 1997,that may aÅect our potential exposure under insurance$151 million in 1996 and $182 million in 1995. Furtherpolicies.increases in loss reserves in 1998 and future years are
possible as legal and factual issues concerning asbestos The Year 2000 issue relates to computer programs thatand toxic waste claims are clariÑed, although the were written using two digits rather than four to deÑneamounts cannot be reasonably estimated. the applicable year. Such programs may recognize the
26
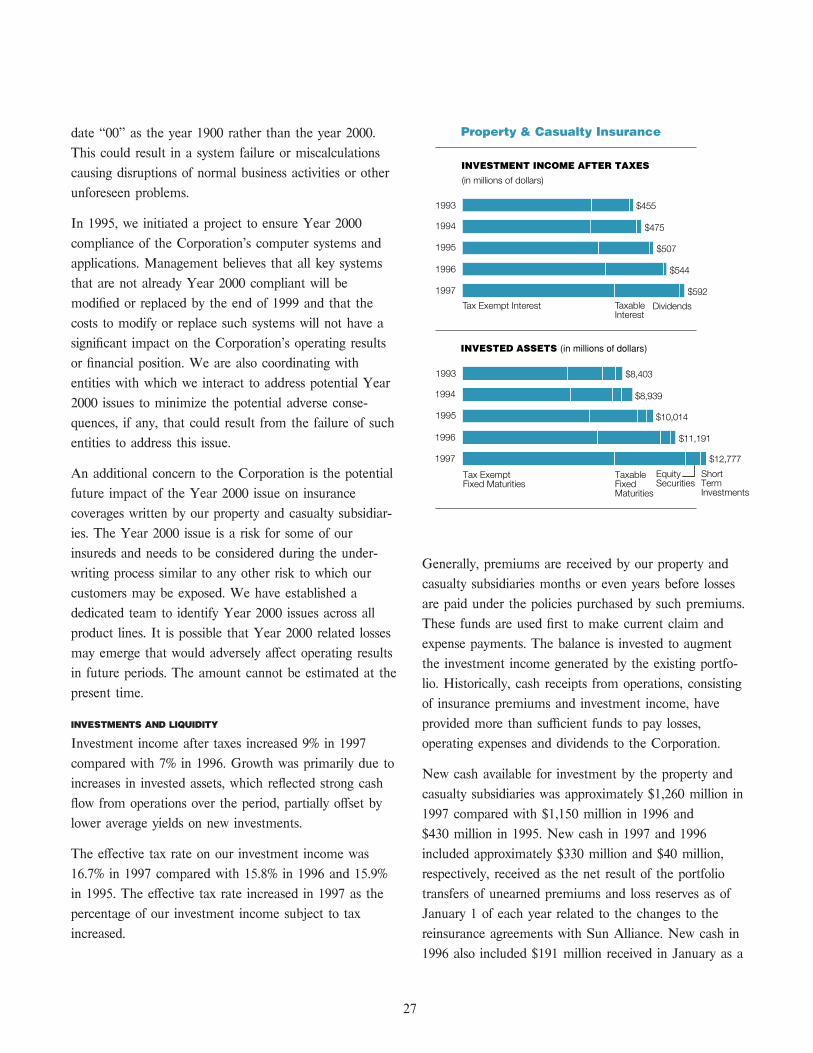
date ""00'' as the year 1900 rather than the year 2000.
This could result in a system failure or miscalculations
causing disruptions of normal business activities or other
unforeseen problems.
In 1995, we initiated a project to ensure Year 2000
compliance of the Corporation's computer systems and
applications. Management believes that all key systems
that are not already Year 2000 compliant will be
modiÑed or replaced by the end of 1999 and that the
costs to modify or replace such systems will not have a
signiÑcant impact on the Corporation's operating results
or Ñnancial position. We are also coordinating with
entities with which we interact to address potential Year
2000 issues to minimize the potential adverse conse-
quences, if any, that could result from the failure of such
entities to address this issue.
An additional concern to the Corporation is the potential
future impact of the Year 2000 issue on insurance
coverages written by our property and casualty subsidiar-
$475
$455
$507
$544
$592
$8,403
$8,939
$10,014
$11,191
$12,777
DividendsTaxable Interest
Tax Exempt Interest
1997
1996
1995
1994
1993
Short Term Investments
Equity Securities
Taxable Fixed Maturities
Tax Exempt Fixed Maturities
1997
1996
1995
1994
1993
ies. The Year 2000 issue is a risk for some of our
insureds and needs to be considered during the under-Generally, premiums are received by our property and
writing process similar to any other risk to which ourcasualty subsidiaries months or even years before losses
customers may be exposed. We have established aare paid under the policies purchased by such premiums.
dedicated team to identify Year 2000 issues across allThese funds are used Ñrst to make current claim and
product lines. It is possible that Year 2000 related lossesexpense payments. The balance is invested to augment
may emerge that would adversely aÅect operating resultsthe investment income generated by the existing portfo-
in future periods. The amount cannot be estimated at thelio. Historically, cash receipts from operations, consisting
present time.of insurance premiums and investment income, have
INVESTMENTS AND LIQUIDITY provided more than suÇcient funds to pay losses,
Investment income after taxes increased 9% in 1997 operating expenses and dividends to the Corporation.
compared with 7% in 1996. Growth was primarily due toNew cash available for investment by the property and
increases in invested assets, which reÖected strong cashcasualty subsidiaries was approximately $1,260 million in
Öow from operations over the period, partially oÅset by1997 compared with $1,150 million in 1996 and
lower average yields on new investments.$430 million in 1995. New cash in 1997 and 1996
The eÅective tax rate on our investment income was included approximately $330 million and $40 million,
16.7% in 1997 compared with 15.8% in 1996 and 15.9% respectively, received as the net result of the portfolio
in 1995. The eÅective tax rate increased in 1997 as the transfers of unearned premiums and loss reserves as of
percentage of our investment income subject to tax January 1 of each year related to the changes to the
increased. reinsurance agreements with Sun Alliance. New cash in
1996 also included $191 million received in January as a
27
in order to provide maximum support to the insuranceresult of the commutation of a stop loss reinsurance
underwriting operations. Investment strategies are devel-agreement related to medical malpractice unpaid claims
oped based on many factors including underwritingarising from business written prior to 1985. The substan-results and our resulting tax position, regulatory require-tially lower amount in 1995 was due to the designation ofments, Öuctuations in interest rates and consideration of$480 million of new cash as funds held for asbestos-other market risks. Investment decisions are centrallyrelated settlement. Income on these assets accrued formanaged by investment professionals based on guidelinesthe beneÑt of participants in the class settlement ofestablished by management and approved by the boardsasbestos-related bodily injury claims against Fibreboard.of directors.
In 1997, new cash was invested primarily in tax-exemptMarket risk represents the potential for loss due tobonds and, to a lesser extent, corporate bonds andadverse changes in the fair value of Ñnancial instruments.
mortgage-backed securities. In addition, $250 million ofThe market risks related to Ñnancial instruments of the
foreign bonds were sold in the Ñrst quarter, due to theCorporation and its property and casualty subsidiaries
reduction in foreign liabilities resulting from the termina-primarily relate to the investment portfolio, which
tion of the reinsurance agreements with Sun Alliance,exposes the Corporation to risks related to interest rates
with the proceeds invested in U.S. dollar denominatedand, to a lesser extent, credit quality, prepayment, foreign
securities. In 1996, we invested new cash primarily incurrency exchange rates and equity prices. Analytical
mortgage-backed securities and tax-exempt bonds. Intools and monitoring systems are in place to assess each
1995, we invested new cash primarily in tax-exemptof these elements of market risk.
bonds. In each year, we tried to achieve the appropriateInterest rate risk is the price sensitivity of a Ñxed incomemix in our portfolio to balance both investment and taxsecurity to changes in interest rates. We view thesestrategies.potential changes in price within the overall context of
The property and casualty subsidiaries maintain suÇcient asset and liability management. Our actuaries estimateinvestments in highly liquid, short-term securities at all the payout pattern of our liabilities, primarily ourtimes to provide for immediate cash needs and the property and casualty loss reserves, to determine theirCorporation maintains bank credit facilities that are duration, which is the present value of the weightedavailable to respond to unexpected cash demands. average payments expressed in years. We set duration
targets for our Ñxed income investment portfolios afterCorporate consideration of the duration of these liabilities and otherInvestment income earned on corporate invested assets factors, which we believe mitigates the overall eÅect ofand interest and other expenses not allocable to the interest rate risk for the Corporation.operating subsidiaries are reÖected in the corporate
The table on the following page provides informationsegment. Corporate income after taxes was $36 million in
about the Corporation's Ñxed maturity investments at1997 compared with $20 million in 1996 and $15 million
December 31, 1997 that are sensitive to changes inin 1995. The increase in corporate income in 1997 was
interest rates. The table presents cash Öows of principaldue primarily to a reduction in interest expense.
amounts and related weighted average interest rates by
expected maturity dates. The cash Öows are based on theMarket Risk
earlier of the call date or the maturity date or, forThe main objectives in managing the investment portfo-
mortgage-backed securities, expected payment patterns.lios of the Corporation and its property and casualty
Actual cash Öows could diÅer from the expectedsubsidiaries are to maximize after-tax investment income
amounts.and total investment returns while minimizing credit risks
28
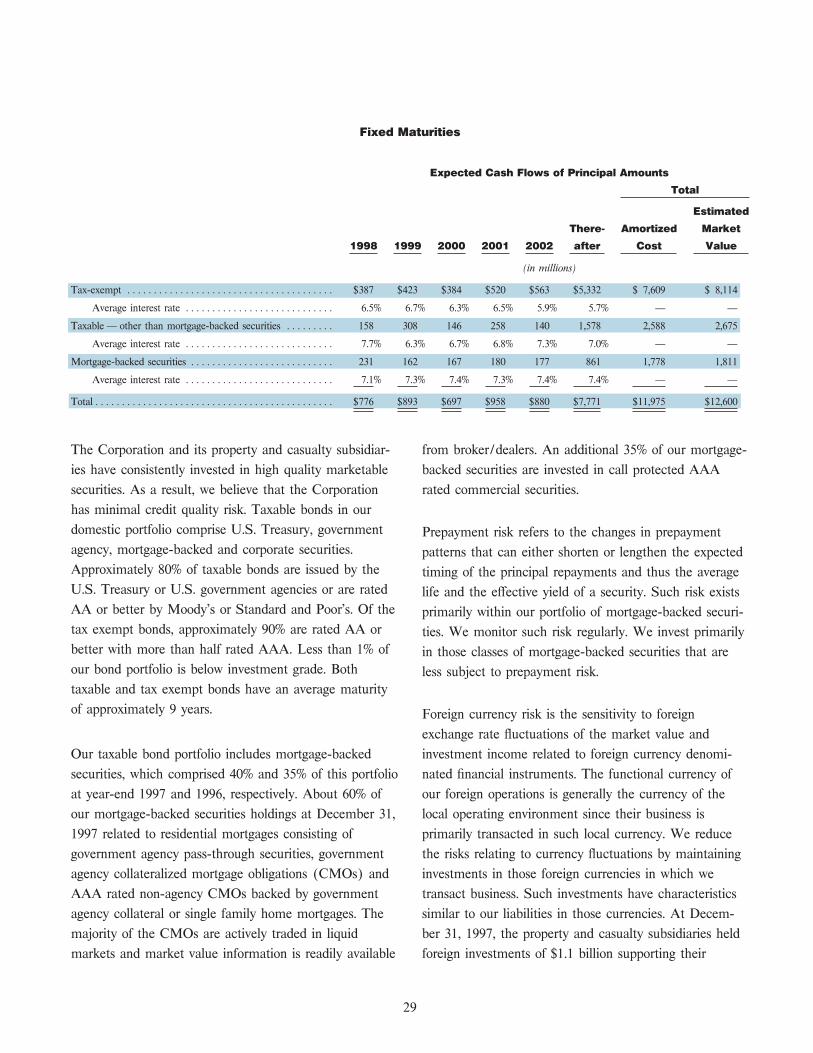
Fixed Maturities
Expected Cash Flows of Principal Amounts
Total
Estimated
There- Amortized Market
1998 1999 2000 2001 2002 after Cost Value
(in millions)
Tax-exempt ÏÏÏÏÏÏÏÏÏÏÏÏÏÏÏÏÏÏÏÏÏÏÏÏÏÏÏÏÏÏÏÏÏÏÏÏÏÏÏ $387 $423 $384 $520 $563 $5,332 $ 7,609 $ 8,114
Average interest rate ÏÏÏÏÏÏÏÏÏÏÏÏÏÏÏÏÏÏÏÏÏÏÏÏÏÏÏÏ 6.5% 6.7% 6.3% 6.5% 5.9% 5.7% Ì Ì
Taxable Ì other than mortgage-backed securities ÏÏÏÏÏÏÏÏÏ 158 308 146 258 140 1,578 2,588 2,675
Average interest rate ÏÏÏÏÏÏÏÏÏÏÏÏÏÏÏÏÏÏÏÏÏÏÏÏÏÏÏÏ 7.7% 6.3% 6.7% 6.8% 7.3% 7.0% Ì Ì
Mortgage-backed securities ÏÏÏÏÏÏÏÏÏÏÏÏÏÏÏÏÏÏÏÏÏÏÏÏÏÏÏ 231 162 167 180 177 861 1,778 1,811
Average interest rate ÏÏÏÏÏÏÏÏÏÏÏÏÏÏÏÏÏÏÏÏÏÏÏÏÏÏÏÏ 7.1% 7.3% 7.4% 7.3% 7.4% 7.4% Ì Ì
TotalÏÏÏÏÏÏÏÏÏÏÏÏÏÏÏÏÏÏÏÏÏÏÏÏÏÏÏÏÏÏÏÏÏÏÏÏÏÏÏÏÏÏÏÏÏ $776 $893 $697 $958 $880 $7,771 $11,975 $12,600
The Corporation and its property and casualty subsidiar- from broker/dealers. An additional 35% of our mortgage-
ies have consistently invested in high quality marketable backed securities are invested in call protected AAA
securities. As a result, we believe that the Corporation rated commercial securities.
has minimal credit quality risk. Taxable bonds in our
domestic portfolio comprise U.S. Treasury, government Prepayment risk refers to the changes in prepayment
agency, mortgage-backed and corporate securities. patterns that can either shorten or lengthen the expected
Approximately 80% of taxable bonds are issued by the timing of the principal repayments and thus the average
U.S. Treasury or U.S. government agencies or are rated life and the eÅective yield of a security. Such risk exists
AA or better by Moody's or Standard and Poor's. Of the primarily within our portfolio of mortgage-backed securi-
tax exempt bonds, approximately 90% are rated AA or ties. We monitor such risk regularly. We invest primarily
better with more than half rated AAA. Less than 1% of in those classes of mortgage-backed securities that are
our bond portfolio is below investment grade. Both less subject to prepayment risk.
taxable and tax exempt bonds have an average maturity
of approximately 9 years. Foreign currency risk is the sensitivity to foreign
exchange rate Öuctuations of the market value and
Our taxable bond portfolio includes mortgage-backed investment income related to foreign currency denomi-
securities, which comprised 40% and 35% of this portfolio nated Ñnancial instruments. The functional currency of
at year-end 1997 and 1996, respectively. About 60% of our foreign operations is generally the currency of the
our mortgage-backed securities holdings at December 31, local operating environment since their business is
1997 related to residential mortgages consisting of primarily transacted in such local currency. We reduce
government agency pass-through securities, government the risks relating to currency Öuctuations by maintaining
agency collateralized mortgage obligations (CMOs) and investments in those foreign currencies in which we
AAA rated non-agency CMOs backed by government transact business. Such investments have characteristics
agency collateral or single family home mortgages. The similar to our liabilities in those currencies. At Decem-
majority of the CMOs are actively traded in liquid ber 31, 1997, the property and casualty subsidiaries held
markets and market value information is readily available foreign investments of $1.1 billion supporting their
29
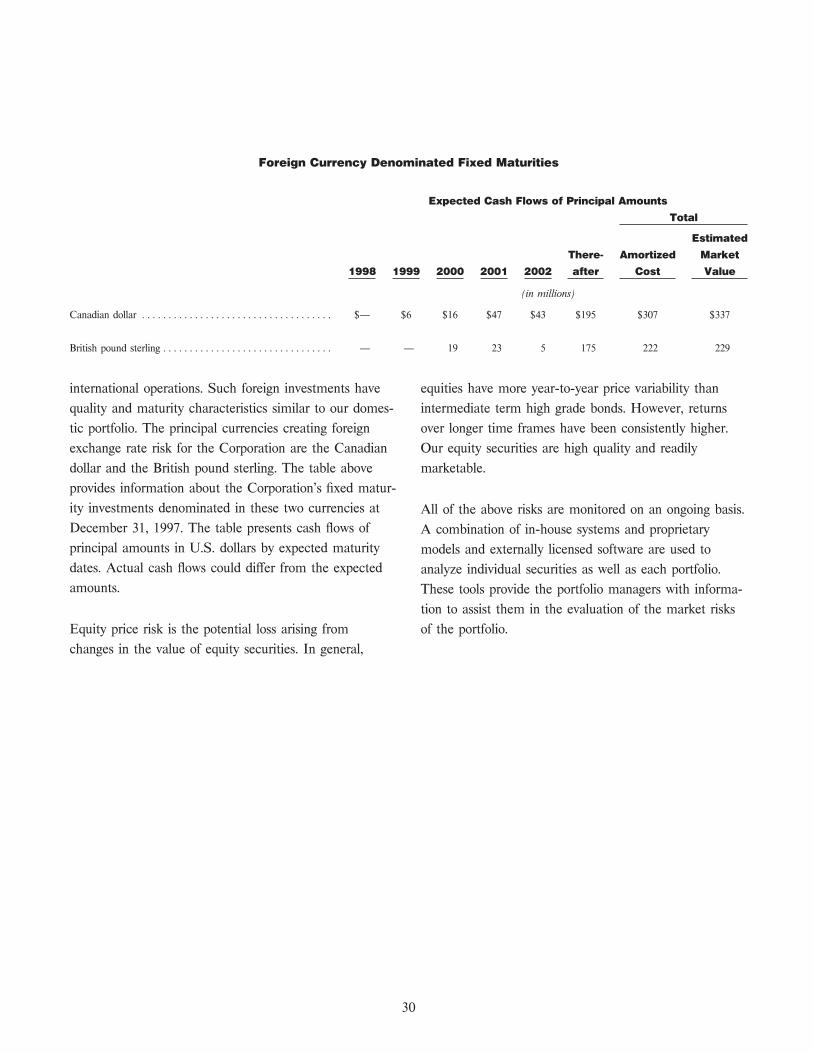
Foreign Currency Denominated Fixed Maturities
Expected Cash Flows of Principal Amounts
Total
Estimated
There- Amortized Market
1998 1999 2000 2001 2002 after Cost Value
(in millions)
Canadian dollar ÏÏÏÏÏÏÏÏÏÏÏÏÏÏÏÏÏÏÏÏÏÏÏÏÏÏÏÏÏÏÏÏÏÏÏÏ $Ì $6 $16 $47 $43 $195 $307 $337
British pound sterling ÏÏÏÏÏÏÏÏÏÏÏÏÏÏÏÏÏÏÏÏÏÏÏÏÏÏÏÏÏÏÏÏ Ì Ì 19 23 5 175 222 229
international operations. Such foreign investments have equities have more year-to-year price variability than
quality and maturity characteristics similar to our domes- intermediate term high grade bonds. However, returns
tic portfolio. The principal currencies creating foreign over longer time frames have been consistently higher.
exchange rate risk for the Corporation are the Canadian Our equity securities are high quality and readily
dollar and the British pound sterling. The table above marketable.
provides information about the Corporation's Ñxed matur-
ity investments denominated in these two currencies at All of the above risks are monitored on an ongoing basis.
December 31, 1997. The table presents cash Öows of A combination of in-house systems and proprietary
principal amounts in U.S. dollars by expected maturity models and externally licensed software are used to
dates. Actual cash Öows could diÅer from the expected analyze individual securities as well as each portfolio.
amounts. These tools provide the portfolio managers with informa-
tion to assist them in the evaluation of the market risks
Equity price risk is the potential loss arising from of the portfolio.
changes in the value of equity securities. In general,
30
Real Estate 1996 reÖects the $160 million after tax impairment
In October 1996, the Corporation announced that it was charge. Results in 1996 beneÑted from the sale of several
exploring the possible sale of all or a signiÑcant portion rental properties and a decrease in interest expense
of its real estate assets. In March 1997, the Corporation caused by lower average interest rates. Results in 1995
entered into an agreement with a prospective purchaser beneÑted from a land sale. Results in both 1996 and
to perform due diligence in anticipation of executing a 1995 also beneÑted from increases in earnings from
contract for the sale of substantially all of its commercial residential sales. In each of the last three years, results
properties. Because the plan to pursue the sales of these were adversely aÅected by a high proportion of interest
assets in the near term represented a signiÑcant change costs charged directly to expense rather than being
in circumstances relating to the manner in which these capitalized.
assets would be used, we reassessed the recoverability of
their carrying value as of December 31, 1996. As a Revenues were $616 million in 1997, $320 million in
result, we recorded an impairment loss of $255 million, 1996 and $288 million in 1995. Revenues in 1997 include
or $160 million after tax, in the fourth quarter of 1996 to $380 million from the November sale of real estate
reduce the carrying value of these assets to their properties. Proceeds received from that sale which related
estimated fair value. to mortgages receivable are not classiÑed as revenues.
Revenues in 1996 and 1995 included higher levels of
In June 1997, a deÑnitive agreement was reached with revenues from residential development. Revenues in 1996
the purchaser. In November, the sale of almost all of the also included the sale of rental properties while 1995
properties covered by the agreement reached in June was revenues included the land sale.
closed for $737 million, which included $628 million in
cash and the assumption of $109 million in debt. The The Corporation adopted Statement of Financial
buyer is a joint venture formed by Paine Webber Real Accounting Standards (SFAS) No. 121, Accounting for
Estate Securities Inc., Morgan Stanley Real Estate Fund the Impairment of Long-Lived Assets and for Long-
II, L.P. and Gale & Wentworth, L.L.C. Closing on the Lived Assets to Be Disposed Of, in the Ñrst quarter of
few remaining properties under the agreement is expected 1996. SFAS No. 121 establishes accounting standards for
to occur in 1998. the impairment of long-lived assets, certain identiÑable
intangibles, and goodwill related to those assets.
In addition to the November sale to the joint venture, we
sold several other commercial properties as well as SFAS No. 121 requires that we analyze our individual
residential properties in 1997. We are continuing to buildings, leased land and development sites on a
explore the sale of certain of our remaining properties. continuing basis to determine if an impairment loss has
occurred. Estimates are made of the revenues and
We plan to retain approximately $375 million of operating costs, plus any additional costs to be incurred
undeveloped land which we expect will be developed in to complete development, of the property in the future
the future. In addition, we plan to retain certain through an assumed holding period based on our
properties and land parcels under lease. intended use of the property. The time value of money is
not considered in assessing whether an impairment has
occurred. If it is determined that impairment hasReal estate operations resulted in a loss after taxes of
occurred, measurement of such impairment is based on$5 million in 1997 compared with a loss of $147 million
the fair value of the assets. The $255 million write-downin 1996 and income of $6 million in 1995. The loss in
31
of real estate assets in 1996 was made in accordance Real estate activities have been funded with short-term
with the provisions of SFAS No. 121. credit instruments, primarily commercial paper, and debt
issued by Chubb Capital Corporation as well as with
term loans and mortgages. The weighted average interestLoans receivable, which were issued in connection with
cost on short-term credit instruments approximatedour joint venture activities and other property sales, are
5 1/4% in 1997, 5 1/2% in 1996 and 6% in 1995. Inprimarily purchase money mortgages. Such loans are
1997, interest rates on term loans approximated 7 1/2%generally collateralized by buildings and, in some cases,
and for mortgages the range of interest rates was 5%land. We continually evaluate the ultimate collectibility
to 12%.of such loans and establish appropriate reserves. Our
valuation approach is similar to that utilized under SFASProceeds from the November 1997 sale were used to
No. 121, except that cash Öows are discounted at therepay the outstanding short term debt and certain term
receivable interest rates. The reserve for possible uncol-loans and mortgages as well as to reduce intercompany
lectible receivables was increased by charges againstborrowings from Chubb Capital. In February 1998, the
income of $18 million in 1995, including $10 millionremaining $300 million of intercompany borrowings from
from the initial application of SFAS No. 114, Account-Chubb Capital was converted into preferred stock of the
ing by Creditors for Impairment of a Loan, whichreal estate subsidiary.
established new criteria for measuring impairment of a
loan. Such charges were not signiÑcant in 1996 and 1997. As a result of the November 1997 sale, real estate
Management believes the reserve of $24 million at revenues will be signiÑcantly reduced in the future. The
December 31, 1997 adequately reÖects the current reduction in revenues will be substantially oÅset by
condition of the portfolio. signiÑcant reductions in interest expense due to the
decrease in debt outstanding and in payroll costs and
other operating expenses.The carrying value of the real estate assets we plan to
dispose of in the near term is based on the estimated fair
value of these assets. The recoverability of the carrying Investment Gains and Losses
value of the remaining real estate assets is assessed basedNet investment gains realized by the Corporation and its
on our ability to fully recover costs through a futureproperty and casualty insurance subsidiaries were as
revenue stream. The process by which SFAS No. 121 isfollows:
applied and necessary write-downs are calculated assumes1997 1996 1995these properties will be developed and disposed of over a
(in millions)period of time. The assumptions reÖect a continued
Equity securities $ 75 $69 $ 89improvement in demand for oÇce space, an increase inFixed maturities 30 11 20rental rates and the ability and intent to obtain ÑnancingRealized investment gains before tax $105 $80 $109in order to hold and develop such remaining properties
Realized investment gains after tax $ 68 $52 $ 71and protect our interests over the long term. Manage-
ment believes that it has made adequate provisions forSales of equity securities in each of the last three yearsimpairment of real estate assets. However, if the assetsresulted in realized investment gains due primarily to theare not sold or developed as presently contemplated, it issigniÑcant appreciation in the United States equitypossible that additional impairment losses may bemarkets. A primary reason for the sale of Ñxed maturitiesrecognized.in each of the last three years has been to improve our
32
after-tax portfolio return without sacriÑcing quality where operations. The purchase price was not adjusted to reÖect
market opportunities have existed to do so. results of operations subsequent to December 31, 1996.
Therefore, the discontinued life and health insurance
operations did not aÅect the Corporation's net income inFixed maturities which the Corporation and its insurance
1997 and will not aÅect net income in future periods.subsidiaries have the ability and intent to hold to
Earnings from the discontinued life and health insurancematurity are classiÑed as held-to-maturity. The remaining
operations were $49 million and $42 million in 1996 andÑxed maturities, which may be sold prior to maturity to
1995, respectively, including realized investment gains ofsupport our investment strategies, such as in response to
$8 million and $14 million.changes in interest rates and the yield curve or to
maximize after-tax returns, are classiÑed as available-for-
sale. Fixed maturities classiÑed as held-to-maturity are Capital Resources
carried at amortized cost while Ñxed maturities classiÑed In February 1994, the Board of Directors authorized the
as available-for-sale are carried at market value. At repurchase of up to 10,000,000 shares of common stock.
December 31, 1997, 18% of the Ñxed maturity portfolio Through March 6, 1997, the Corporation repurchased
was classiÑed as held-to-maturity compared with 22% at 6,851,600 shares under the 1994 share repurchase
December 31, 1996 and 30% at December 31, 1995. program, including 3,148,600 shares repurchased in the
Ñrst quarter of 1997. On March 7, 1997, the Board of
Directors replaced the 1994 program with a new shareThe unrealized appreciation or depreciation of invest-
repurchase program, which authorizes the repurchase ofments carried at market value, which includes equity
up to 17,500,000 shares of common stock. Throughsecurities and Ñxed maturities classiÑed as available-for-
December 31, 1997, the Corporation repurchasedsale, is reÖected in a separate component of shareholders'
9,791,900 shares under the new repurchase program. Inequity, net of applicable deferred income tax.
the aggregate, the Corporation repurchasedThe unrealized market appreciation before tax of those
12,940,500 shares in open-market transactions in 1997 atÑxed maturities carried at amortized cost was $147 mil-
a cost of $828 million. In 1996, 1,700,000 shares werelion, $130 million and $178 million at December 31,
repurchased at a cost of $83 million.1997, 1996 and 1995, respectively. Such unrealized
appreciation was not reÖected in the consolidated Ñnan-The Corporation Ñled a shelf registration statement which
cial statements.the Securities and Exchange Commission declared eÅec-
tive in June 1995, under which up to $400 million ofChanges in unrealized market appreciation of Ñxed
various types of securities may be issued by thematurities were due to Öuctuations in interest rates.
Corporation or Chubb Capital. No securities have been
issued under this registration statement.Discontinued Operations Ì Life and Health
Insurance
The Corporation has outstanding $60 million ofOn May 13, 1997, the Corporation completed the sale of
unsecured 8 3/4% notes due in 1999. In 1998, theChubb Life Insurance Company of America to
Corporation will pay as a mandatory sinking fund anJeÅerson-Pilot Corporation for $875 million in cash,
amount suÇcient to redeem $30 million of principal.subject to various closing adjustments, none of which
were material.
At December 31, 1997, Chubb Capital had outstandingIn 1996, the Corporation recognized a loss of $22 million
$150 million of 6% notes due in 1998 and $100 millionrelated to the sale of the life and health insurance
33
of 6 7/8% notes due in 2003. The notes are unsecured In July 1997, the Corporation entered into two credit
and are guaranteed by the Corporation. A substantial agreements with a group of banks that provide for
portion of the proceeds were used to support our real unsecured borrowings of up to $500 million in the
estate operations. The debt due in 1998 was repaid in aggregate. The $200 million short term revolving credit
February using proceeds from the real estate sales. facility terminates on July 10, 1998 and may be renewed
or replaced. The $300 million medium term revolving
credit facility terminates on July 11, 2002. On theAs of January 1, 1997, Chubb Capital had outstanding
respective termination dates, any loans then outstanding$229 million of 6% exchangeable subordinated notes due
become payable. There have been no borrowings underMay 15, 1998. In 1997, the holders of almost all of the
these agreements. These agreements replaced an agree-notes elected the option to exchange them into shares of
ment similar to the medium term agreement, whichcommon stock of the Corporation, resulting in the
terminated, as well as the Corporation's lines of credit.issuance of 5,316,565 shares of common stock. The
remaining notes were redeemed.
34
Financial Reporting
Responsibility
Management is responsible for the integrity of the The Corporation engages Ernst & Young LLP as
Ñnancial information included in this annual independent auditors to audit its Ñnancial statements
report and for ascertaining that such information and express their opinion thereon. They have full access
presents fairly the Ñnancial position and operating to each member of management in conducting their
results of the Corporation. The accompanying audits. Such audits are conducted in accordance with
consolidated Ñnancial statements have been prepared in generally accepted auditing standards and include a
conformity with generally accepted accounting review and evaluation of the system of internal
principles. Such statements include informed estimates accounting controls, tests of the accounting records and
and judgments of management for those transactions other auditing procedures they consider necessary to
that are not yet complete or for which the ultimate express their opinion on the consolidated Ñnancial
eÅects cannot be precisely determined. Financial statements.
information presented elsewhere in this annual report isThe Corporation's accounting policies and internal
consistent with that in the Ñnancial statements.controls are under the general oversight of the Board of
The accounting systems and internal accounting controls Directors acting through its Audit Committee. This
of the Corporation are designed to provide reasonable Committee is composed entirely of Directors who are
assurance that assets are safeguarded against losses not oÇcers or employees of the Corporation. The
from unauthorized use or disposition, that transactions Committee meets regularly with management, the
are executed in accordance with management's internal auditors and the independent auditors to review
authorization and that the Ñnancial records are reliable the accounting principles and practices employed by the
for preparing Ñnancial statements and maintaining Corporation and to discuss auditing, internal control
accountability for assets. QualiÑed personnel and Ñnancial reporting matters. Both the internal and
throughout the organization maintain and monitor these independent auditors have, at all times, unrestricted
internal accounting controls on an ongoing basis. In access to the Audit Committee, without members of
addition, the Corporation's Internal Audit Department management present, to discuss the results of their
systematically reviews these controls, evaluates their audits, their evaluations of the adequacy of the
adequacy and eÅectiveness and reports thereon. Corporation's internal accounting controls and the
quality of the Corporation's Ñnancial reporting, and any
other matter that they believe should be brought to the
attention of the Committee.
35
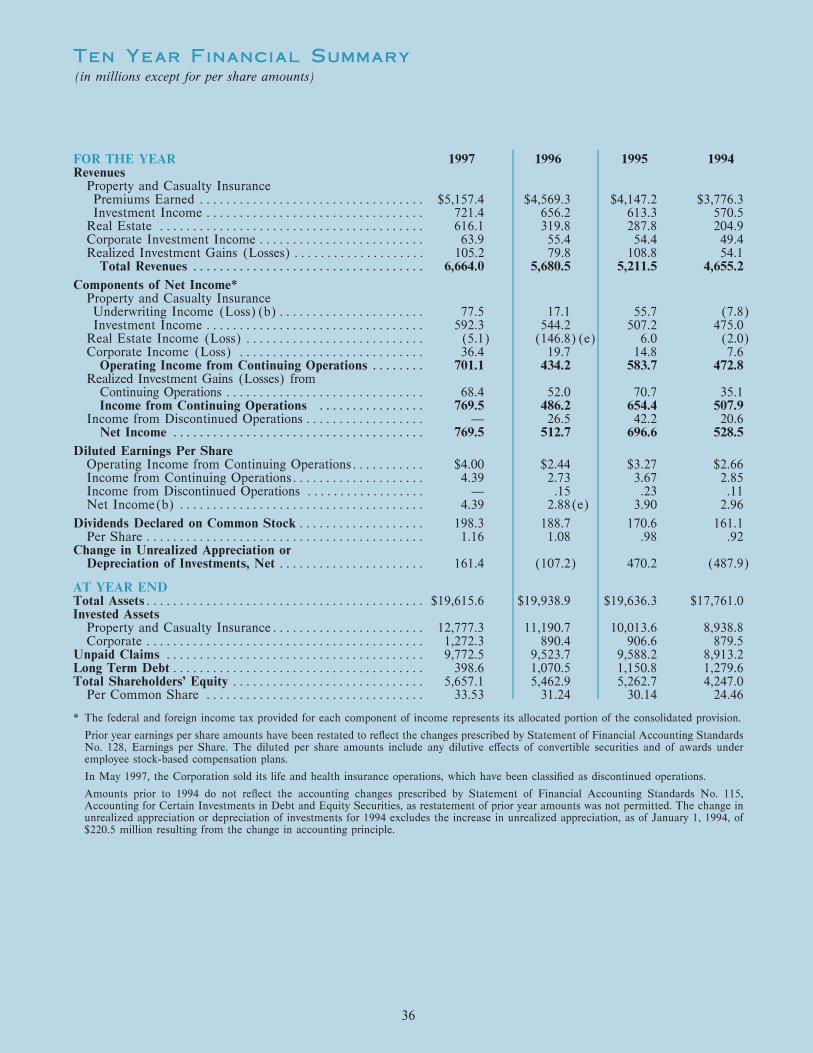
Ten Year Financial Summary
(in millions except for per share amounts)
FOR THE YEAR 1997 1996 1995 1994Revenues
Property and Casualty InsurancePremiums Earned ÏÏÏÏÏÏÏÏÏÏÏÏÏÏÏÏÏÏÏÏÏÏÏÏÏÏÏÏÏÏÏÏÏÏ $5,157.4 $4,569.3 $4,147.2 $3,776.3Investment Income ÏÏÏÏÏÏÏÏÏÏÏÏÏÏÏÏÏÏÏÏÏÏÏÏÏÏÏÏÏÏÏÏÏ 721.4 656.2 613.3 570.5
Real Estate ÏÏÏÏÏÏÏÏÏÏÏÏÏÏÏÏÏÏÏÏÏÏÏÏÏÏÏÏÏÏÏÏÏÏÏÏÏÏÏÏ 616.1 319.8 287.8 204.9Corporate Investment Income ÏÏÏÏÏÏÏÏÏÏÏÏÏÏÏÏÏÏÏÏÏÏÏÏÏ 63.9 55.4 54.4 49.4Realized Investment Gains (Losses)ÏÏÏÏÏÏÏÏÏÏÏÏÏÏÏÏÏÏÏÏ 105.2 79.8 108.8 54.1
Total Revenues ÏÏÏÏÏÏÏÏÏÏÏÏÏÏÏÏÏÏÏÏÏÏÏÏÏÏÏÏÏÏÏÏÏÏÏ 6,664.0 5,680.5 5,211.5 4,655.2
Components of Net Income*Property and Casualty InsuranceUnderwriting Income (Loss)(b)ÏÏÏÏÏÏÏÏÏÏÏÏÏÏÏÏÏÏÏÏÏÏ 77.5 17.1 55.7 (7.8)Investment Income ÏÏÏÏÏÏÏÏÏÏÏÏÏÏÏÏÏÏÏÏÏÏÏÏÏÏÏÏÏÏÏÏÏ 592.3 544.2 507.2 475.0
Real Estate Income (Loss) ÏÏÏÏÏÏÏÏÏÏÏÏÏÏÏÏÏÏÏÏÏÏÏÏÏÏÏ (5.1) (146.8)(e) 6.0 (2.0)Corporate Income (Loss) ÏÏÏÏÏÏÏÏÏÏÏÏÏÏÏÏÏÏÏÏÏÏÏÏÏÏÏÏ 36.4 19.7 14.8 7.6
Operating Income from Continuing Operations ÏÏÏÏÏÏÏÏ 701.1 434.2 583.7 472.8Realized Investment Gains (Losses) from
Continuing Operations ÏÏÏÏÏÏÏÏÏÏÏÏÏÏÏÏÏÏÏÏÏÏÏÏÏÏÏÏÏÏ 68.4 52.0 70.7 35.1Income from Continuing Operations ÏÏÏÏÏÏÏÏÏÏÏÏÏÏÏÏ 769.5 486.2 654.4 507.9
Income from Discontinued OperationsÏÏÏÏÏÏÏÏÏÏÏÏÏÏÏÏÏÏ Ì 26.5 42.2 20.6Net Income ÏÏÏÏÏÏÏÏÏÏÏÏÏÏÏÏÏÏÏÏÏÏÏÏÏÏÏÏÏÏÏÏÏÏÏÏÏÏ 769.5 512.7 696.6 528.5
Diluted Earnings Per ShareOperating Income from Continuing OperationsÏÏÏÏÏÏÏÏÏÏÏ $4.00 $2.44 $3.27 $2.66Income from Continuing OperationsÏÏÏÏÏÏÏÏÏÏÏÏÏÏÏÏÏÏÏÏ 4.39 2.73 3.67 2.85Income from Discontinued Operations ÏÏÏÏÏÏÏÏÏÏÏÏÏÏÏÏÏÏ Ì .15 .23 .11Net Income(b) ÏÏÏÏÏÏÏÏÏÏÏÏÏÏÏÏÏÏÏÏÏÏÏÏÏÏÏÏÏÏÏÏÏÏÏÏÏ 4.39 2.88(e) 3.90 2.96
Dividends Declared on Common Stock ÏÏÏÏÏÏÏÏÏÏÏÏÏÏÏÏÏÏÏ 198.3 188.7 170.6 161.1Per Share ÏÏÏÏÏÏÏÏÏÏÏÏÏÏÏÏÏÏÏÏÏÏÏÏÏÏÏÏÏÏÏÏÏÏÏÏÏÏÏÏÏÏ 1.16 1.08 .98 .92
Change in Unrealized Appreciation orDepreciation of Investments, Net ÏÏÏÏÏÏÏÏÏÏÏÏÏÏÏÏÏÏÏÏÏÏ 161.4 (107.2) 470.2 (487.9)
AT YEAR ENDTotal AssetsÏÏÏÏÏÏÏÏÏÏÏÏÏÏÏÏÏÏÏÏÏÏÏÏÏÏÏÏÏÏÏÏÏÏÏÏÏÏÏÏÏÏ $19,615.6 $19,938.9 $19,636.3 $17,761.0Invested Assets
Property and Casualty InsuranceÏÏÏÏÏÏÏÏÏÏÏÏÏÏÏÏÏÏÏÏÏÏÏ 12,777.3 11,190.7 10,013.6 8,938.8Corporate ÏÏÏÏÏÏÏÏÏÏÏÏÏÏÏÏÏÏÏÏÏÏÏÏÏÏÏÏÏÏÏÏÏÏÏÏÏÏÏÏÏÏ 1,272.3 890.4 906.6 879.5
Unpaid Claims ÏÏÏÏÏÏÏÏÏÏÏÏÏÏÏÏÏÏÏÏÏÏÏÏÏÏÏÏÏÏÏÏÏÏÏÏÏÏÏ 9,772.5 9,523.7 9,588.2 8,913.2Long Term DebtÏÏÏÏÏÏÏÏÏÏÏÏÏÏÏÏÏÏÏÏÏÏÏÏÏÏÏÏÏÏÏÏÏÏÏÏÏÏ 398.6 1,070.5 1,150.8 1,279.6Total Shareholders' Equity ÏÏÏÏÏÏÏÏÏÏÏÏÏÏÏÏÏÏÏÏÏÏÏÏÏÏÏÏÏ 5,657.1 5,462.9 5,262.7 4,247.0
Per Common Share ÏÏÏÏÏÏÏÏÏÏÏÏÏÏÏÏÏÏÏÏÏÏÏÏÏÏÏÏÏÏÏÏÏ 33.53 31.24 30.14 24.46
* The federal and foreign income tax provided for each component of income represents its allocated portion of the consolidated provision.
Prior year earnings per share amounts have been restated to reÖect the changes prescribed by Statement of Financial Accounting StandardsNo. 128, Earnings per Share. The diluted per share amounts include any dilutive eÅects of convertible securities and of awards underemployee stock-based compensation plans.
In May 1997, the Corporation sold its life and health insurance operations, which have been classiÑed as discontinued operations.
Amounts prior to 1994 do not reÖect the accounting changes prescribed by Statement of Financial Accounting Standards No. 115,Accounting for Certain Investments in Debt and Equity Securities, as restatement of prior year amounts was not permitted. The change inunrealized appreciation or depreciation of investments for 1994 excludes the increase in unrealized appreciation, as of January 1, 1994, of$220.5 million resulting from the change in accounting principle.
36
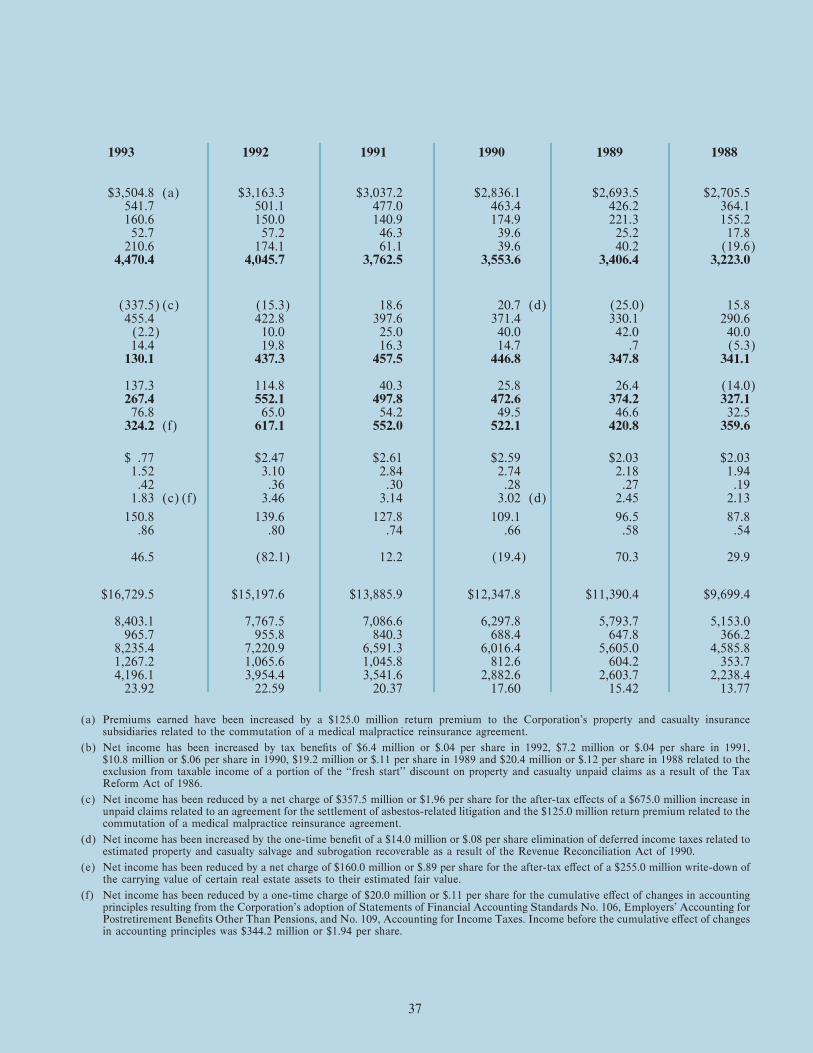
1993 1992 1991 1990 1989 1988
$3,504.8 (a) $3,163.3 $3,037.2 $2,836.1 $2,693.5 $2,705.5541.7 501.1 477.0 463.4 426.2 364.1160.6 150.0 140.9 174.9 221.3 155.252.7 57.2 46.3 39.6 25.2 17.8
210.6 174.1 61.1 39.6 40.2 (19.6)4,470.4 4,045.7 3,762.5 3,553.6 3,406.4 3,223.0
(337.5)(c) (15.3) 18.6 20.7 (d) (25.0) 15.8455.4 422.8 397.6 371.4 330.1 290.6(2.2) 10.0 25.0 40.0 42.0 40.014.4 19.8 16.3 14.7 .7 (5.3)
130.1 437.3 457.5 446.8 347.8 341.1
137.3 114.8 40.3 25.8 26.4 (14.0)267.4 552.1 497.8 472.6 374.2 327.176.8 65.0 54.2 49.5 46.6 32.5
324.2 (f) 617.1 552.0 522.1 420.8 359.6
$ .77 $2.47 $2.61 $2.59 $2.03 $2.031.52 3.10 2.84 2.74 2.18 1.94.42 .36 .30 .28 .27 .19
1.83 (c)(f) 3.46 3.14 3.02 (d) 2.45 2.13
150.8 139.6 127.8 109.1 96.5 87.8.86 .80 .74 .66 .58 .54
46.5 (82.1) 12.2 (19.4) 70.3 29.9
$16,729.5 $15,197.6 $13,885.9 $12,347.8 $11,390.4 $9,699.4
8,403.1 7,767.5 7,086.6 6,297.8 5,793.7 5,153.0965.7 955.8 840.3 688.4 647.8 366.2
8,235.4 7,220.9 6,591.3 6,016.4 5,605.0 4,585.81,267.2 1,065.6 1,045.8 812.6 604.2 353.74,196.1 3,954.4 3,541.6 2,882.6 2,603.7 2,238.4
23.92 22.59 20.37 17.60 15.42 13.77
(a) Premiums earned have been increased by a $125.0 million return premium to the Corporation's property and casualty insurancesubsidiaries related to the commutation of a medical malpractice reinsurance agreement.
(b) Net income has been increased by tax beneÑts of $6.4 million or $.04 per share in 1992, $7.2 million or $.04 per share in 1991,$10.8 million or $.06 per share in 1990, $19.2 million or $.11 per share in 1989 and $20.4 million or $.12 per share in 1988 related to theexclusion from taxable income of a portion of the ""fresh start'' discount on property and casualty unpaid claims as a result of the TaxReform Act of 1986.
(c) Net income has been reduced by a net charge of $357.5 million or $1.96 per share for the after-tax eÅects of a $675.0 million increase inunpaid claims related to an agreement for the settlement of asbestos-related litigation and the $125.0 million return premium related to thecommutation of a medical malpractice reinsurance agreement.
(d) Net income has been increased by the one-time beneÑt of a $14.0 million or $.08 per share elimination of deferred income taxes related toestimated property and casualty salvage and subrogation recoverable as a result of the Revenue Reconciliation Act of 1990.
(e) Net income has been reduced by a net charge of $160.0 million or $.89 per share for the after-tax eÅect of a $255.0 million write-down ofthe carrying value of certain real estate assets to their estimated fair value.
(f) Net income has been reduced by a one-time charge of $20.0 million or $.11 per share for the cumulative eÅect of changes in accountingprinciples resulting from the Corporation's adoption of Statements of Financial Accounting Standards No. 106, Employers' Accounting forPostretirement BeneÑts Other Than Pensions, and No. 109, Accounting for Income Taxes. Income before the cumulative eÅect of changesin accounting principles was $344.2 million or $1.94 per share.
37
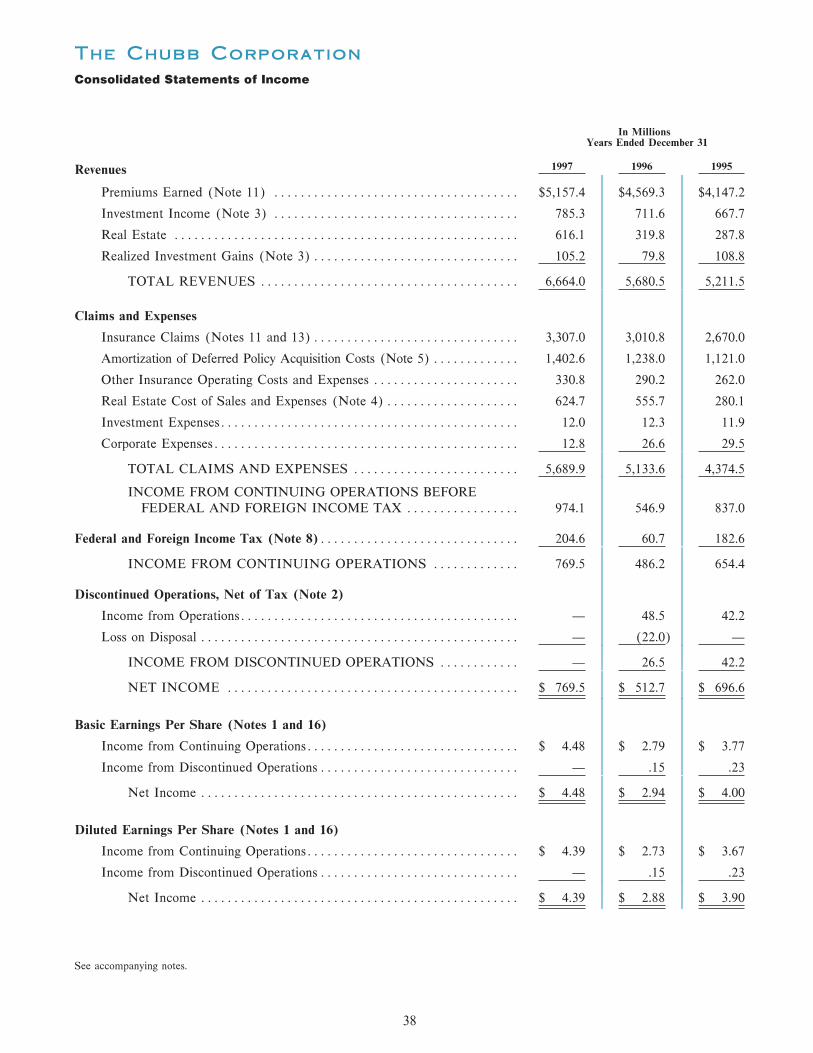
The Chubb Corporation
Consolidated Statements of Income
In MillionsYears Ended December 31
1997 1996 1995Revenues
Premiums Earned (Note 11) ÏÏÏÏÏÏÏÏÏÏÏÏÏÏÏÏÏÏÏÏÏÏÏÏÏÏÏÏÏÏÏÏÏÏÏÏÏ $5,157.4 $4,569.3 $4,147.2
Investment Income (Note 3) ÏÏÏÏÏÏÏÏÏÏÏÏÏÏÏÏÏÏÏÏÏÏÏÏÏÏÏÏÏÏÏÏÏÏÏÏÏ 785.3 711.6 667.7
Real Estate ÏÏÏÏÏÏÏÏÏÏÏÏÏÏÏÏÏÏÏÏÏÏÏÏÏÏÏÏÏÏÏÏÏÏÏÏÏÏÏÏÏÏÏÏÏÏÏÏÏÏÏÏ 616.1 319.8 287.8
Realized Investment Gains (Note 3)ÏÏÏÏÏÏÏÏÏÏÏÏÏÏÏÏÏÏÏÏÏÏÏÏÏÏÏÏÏÏÏ 105.2 79.8 108.8
TOTAL REVENUES ÏÏÏÏÏÏÏÏÏÏÏÏÏÏÏÏÏÏÏÏÏÏÏÏÏÏÏÏÏÏÏÏÏÏÏÏÏÏÏ 6,664.0 5,680.5 5,211.5
Claims and Expenses
Insurance Claims (Notes 11 and 13)ÏÏÏÏÏÏÏÏÏÏÏÏÏÏÏÏÏÏÏÏÏÏÏÏÏÏÏÏÏÏÏ 3,307.0 3,010.8 2,670.0
Amortization of Deferred Policy Acquisition Costs (Note 5) ÏÏÏÏÏÏÏÏÏÏÏÏÏ 1,402.6 1,238.0 1,121.0
Other Insurance Operating Costs and Expenses ÏÏÏÏÏÏÏÏÏÏÏÏÏÏÏÏÏÏÏÏÏÏ 330.8 290.2 262.0
Real Estate Cost of Sales and Expenses (Note 4)ÏÏÏÏÏÏÏÏÏÏÏÏÏÏÏÏÏÏÏÏ 624.7 555.7 280.1
Investment ExpensesÏÏÏÏÏÏÏÏÏÏÏÏÏÏÏÏÏÏÏÏÏÏÏÏÏÏÏÏÏÏÏÏÏÏÏÏÏÏÏÏÏÏÏÏÏ 12.0 12.3 11.9
Corporate ExpensesÏÏÏÏÏÏÏÏÏÏÏÏÏÏÏÏÏÏÏÏÏÏÏÏÏÏÏÏÏÏÏÏÏÏÏÏÏÏÏÏÏÏÏÏÏÏ 12.8 26.6 29.5
TOTAL CLAIMS AND EXPENSES ÏÏÏÏÏÏÏÏÏÏÏÏÏÏÏÏÏÏÏÏÏÏÏÏÏ 5,689.9 5,133.6 4,374.5
INCOME FROM CONTINUING OPERATIONS BEFOREFEDERAL AND FOREIGN INCOME TAX ÏÏÏÏÏÏÏÏÏÏÏÏÏÏÏÏÏ 974.1 546.9 837.0
Federal and Foreign Income Tax (Note 8)ÏÏÏÏÏÏÏÏÏÏÏÏÏÏÏÏÏÏÏÏÏÏÏÏÏÏÏÏÏÏ 204.6 60.7 182.6
INCOME FROM CONTINUING OPERATIONS ÏÏÏÏÏÏÏÏÏÏÏÏÏ 769.5 486.2 654.4
Discontinued Operations, Net of Tax (Note 2)
Income from OperationsÏÏÏÏÏÏÏÏÏÏÏÏÏÏÏÏÏÏÏÏÏÏÏÏÏÏÏÏÏÏÏÏÏÏÏÏÏÏÏÏÏÏ Ì 48.5 42.2
Loss on Disposal ÏÏÏÏÏÏÏÏÏÏÏÏÏÏÏÏÏÏÏÏÏÏÏÏÏÏÏÏÏÏÏÏÏÏÏÏÏÏÏÏÏÏÏÏÏÏÏÏ Ì (22.0) Ì
INCOME FROM DISCONTINUED OPERATIONS ÏÏÏÏÏÏÏÏÏÏÏÏ Ì 26.5 42.2
NET INCOME ÏÏÏÏÏÏÏÏÏÏÏÏÏÏÏÏÏÏÏÏÏÏÏÏÏÏÏÏÏÏÏÏÏÏÏÏÏÏÏÏÏÏÏÏ $ 769.5 $ 512.7 $ 696.6
Basic Earnings Per Share (Notes 1 and 16)
Income from Continuing OperationsÏÏÏÏÏÏÏÏÏÏÏÏÏÏÏÏÏÏÏÏÏÏÏÏÏÏÏÏÏÏÏÏ $ 4.48 $ 2.79 $ 3.77
Income from Discontinued OperationsÏÏÏÏÏÏÏÏÏÏÏÏÏÏÏÏÏÏÏÏÏÏÏÏÏÏÏÏÏÏ Ì .15 .23
Net Income ÏÏÏÏÏÏÏÏÏÏÏÏÏÏÏÏÏÏÏÏÏÏÏÏÏÏÏÏÏÏÏÏÏÏÏÏÏÏÏÏÏÏÏÏÏÏÏÏ $ 4.48 $ 2.94 $ 4.00
Diluted Earnings Per Share (Notes 1 and 16)
Income from Continuing OperationsÏÏÏÏÏÏÏÏÏÏÏÏÏÏÏÏÏÏÏÏÏÏÏÏÏÏÏÏÏÏÏÏ $ 4.39 $ 2.73 $ 3.67
Income from Discontinued OperationsÏÏÏÏÏÏÏÏÏÏÏÏÏÏÏÏÏÏÏÏÏÏÏÏÏÏÏÏÏÏ Ì .15 .23
Net Income ÏÏÏÏÏÏÏÏÏÏÏÏÏÏÏÏÏÏÏÏÏÏÏÏÏÏÏÏÏÏÏÏÏÏÏÏÏÏÏÏÏÏÏÏÏÏÏÏ $ 4.39 $ 2.88 $ 3.90
See accompanying notes.
38
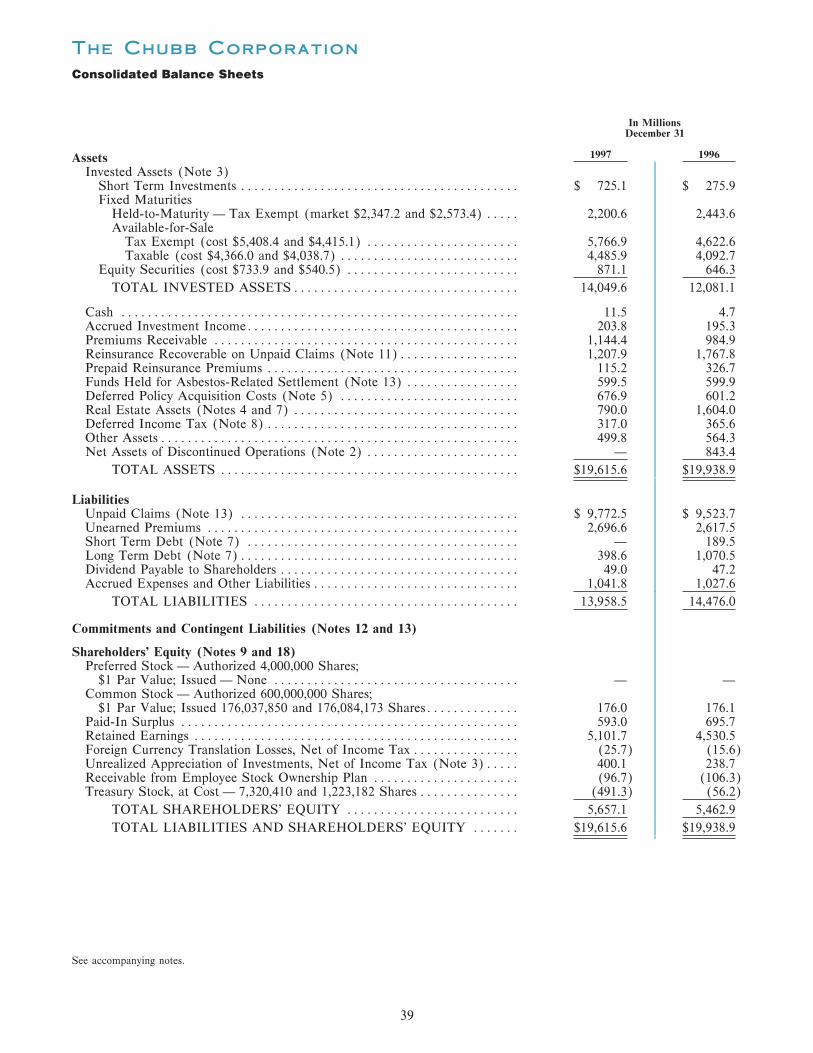
The Chubb Corporation
Consolidated Balance Sheets
In MillionsDecember 31
1997 1996AssetsInvested Assets (Note 3)
Short Term Investments ÏÏÏÏÏÏÏÏÏÏÏÏÏÏÏÏÏÏÏÏÏÏÏÏÏÏÏÏÏÏÏÏÏÏÏÏÏÏÏÏÏÏ $ 725.1 $ 275.9Fixed Maturities
Held-to-Maturity Ì Tax Exempt (market $2,347.2 and $2,573.4) ÏÏÏÏÏ 2,200.6 2,443.6Available-for-Sale
Tax Exempt (cost $5,408.4 and $4,415.1) ÏÏÏÏÏÏÏÏÏÏÏÏÏÏÏÏÏÏÏÏÏÏÏ 5,766.9 4,622.6Taxable (cost $4,366.0 and $4,038.7) ÏÏÏÏÏÏÏÏÏÏÏÏÏÏÏÏÏÏÏÏÏÏÏÏÏÏÏ 4,485.9 4,092.7
Equity Securities (cost $733.9 and $540.5) ÏÏÏÏÏÏÏÏÏÏÏÏÏÏÏÏÏÏÏÏÏÏÏÏÏÏ 871.1 646.3
TOTAL INVESTED ASSETSÏÏÏÏÏÏÏÏÏÏÏÏÏÏÏÏÏÏÏÏÏÏÏÏÏÏÏÏÏÏÏÏÏÏ 14,049.6 12,081.1
Cash ÏÏÏÏÏÏÏÏÏÏÏÏÏÏÏÏÏÏÏÏÏÏÏÏÏÏÏÏÏÏÏÏÏÏÏÏÏÏÏÏÏÏÏÏÏÏÏÏÏÏÏÏÏÏÏÏÏÏÏÏ 11.5 4.7Accrued Investment IncomeÏÏÏÏÏÏÏÏÏÏÏÏÏÏÏÏÏÏÏÏÏÏÏÏÏÏÏÏÏÏÏÏÏÏÏÏÏÏÏÏÏ 203.8 195.3Premiums Receivable ÏÏÏÏÏÏÏÏÏÏÏÏÏÏÏÏÏÏÏÏÏÏÏÏÏÏÏÏÏÏÏÏÏÏÏÏÏÏÏÏÏÏÏÏÏÏ 1,144.4 984.9Reinsurance Recoverable on Unpaid Claims (Note 11)ÏÏÏÏÏÏÏÏÏÏÏÏÏÏÏÏÏÏ 1,207.9 1,767.8Prepaid Reinsurance Premiums ÏÏÏÏÏÏÏÏÏÏÏÏÏÏÏÏÏÏÏÏÏÏÏÏÏÏÏÏÏÏÏÏÏÏÏÏÏÏ 115.2 326.7Funds Held for Asbestos-Related Settlement (Note 13) ÏÏÏÏÏÏÏÏÏÏÏÏÏÏÏÏÏ 599.5 599.9Deferred Policy Acquisition Costs (Note 5) ÏÏÏÏÏÏÏÏÏÏÏÏÏÏÏÏÏÏÏÏÏÏÏÏÏÏÏ 676.9 601.2Real Estate Assets (Notes 4 and 7) ÏÏÏÏÏÏÏÏÏÏÏÏÏÏÏÏÏÏÏÏÏÏÏÏÏÏÏÏÏÏÏÏÏÏ 790.0 1,604.0Deferred Income Tax (Note 8)ÏÏÏÏÏÏÏÏÏÏÏÏÏÏÏÏÏÏÏÏÏÏÏÏÏÏÏÏÏÏÏÏÏÏÏÏÏÏ 317.0 365.6Other AssetsÏÏÏÏÏÏÏÏÏÏÏÏÏÏÏÏÏÏÏÏÏÏÏÏÏÏÏÏÏÏÏÏÏÏÏÏÏÏÏÏÏÏÏÏÏÏÏÏÏÏÏÏÏÏ 499.8 564.3Net Assets of Discontinued Operations (Note 2) ÏÏÏÏÏÏÏÏÏÏÏÏÏÏÏÏÏÏÏÏÏÏÏ Ì 843.4
TOTAL ASSETS ÏÏÏÏÏÏÏÏÏÏÏÏÏÏÏÏÏÏÏÏÏÏÏÏÏÏÏÏÏÏÏÏÏÏÏÏÏÏÏÏÏÏÏÏÏ $19,615.6 $19,938.9
LiabilitiesUnpaid Claims (Note 13) ÏÏÏÏÏÏÏÏÏÏÏÏÏÏÏÏÏÏÏÏÏÏÏÏÏÏÏÏÏÏÏÏÏÏÏÏÏÏÏÏÏÏ $ 9,772.5 $ 9,523.7Unearned Premiums ÏÏÏÏÏÏÏÏÏÏÏÏÏÏÏÏÏÏÏÏÏÏÏÏÏÏÏÏÏÏÏÏÏÏÏÏÏÏÏÏÏÏÏÏÏÏÏ 2,696.6 2,617.5Short Term Debt (Note 7) ÏÏÏÏÏÏÏÏÏÏÏÏÏÏÏÏÏÏÏÏÏÏÏÏÏÏÏÏÏÏÏÏÏÏÏÏÏÏÏÏÏ Ì 189.5Long Term Debt (Note 7)ÏÏÏÏÏÏÏÏÏÏÏÏÏÏÏÏÏÏÏÏÏÏÏÏÏÏÏÏÏÏÏÏÏÏÏÏÏÏÏÏÏÏ 398.6 1,070.5Dividend Payable to Shareholders ÏÏÏÏÏÏÏÏÏÏÏÏÏÏÏÏÏÏÏÏÏÏÏÏÏÏÏÏÏÏÏÏÏÏÏÏ 49.0 47.2Accrued Expenses and Other Liabilities ÏÏÏÏÏÏÏÏÏÏÏÏÏÏÏÏÏÏÏÏÏÏÏÏÏÏÏÏÏÏÏ 1,041.8 1,027.6
TOTAL LIABILITIES ÏÏÏÏÏÏÏÏÏÏÏÏÏÏÏÏÏÏÏÏÏÏÏÏÏÏÏÏÏÏÏÏÏÏÏÏÏÏÏÏ 13,958.5 14,476.0
Commitments and Contingent Liabilities (Notes 12 and 13)
Shareholders' Equity (Notes 9 and 18)Preferred Stock Ì Authorized 4,000,000 Shares;
$1 Par Value; Issued Ì None ÏÏÏÏÏÏÏÏÏÏÏÏÏÏÏÏÏÏÏÏÏÏÏÏÏÏÏÏÏÏÏÏÏÏÏÏÏ Ì ÌCommon Stock Ì Authorized 600,000,000 Shares;
$1 Par Value; Issued 176,037,850 and 176,084,173 SharesÏÏÏÏÏÏÏÏÏÏÏÏÏÏ 176.0 176.1Paid-In Surplus ÏÏÏÏÏÏÏÏÏÏÏÏÏÏÏÏÏÏÏÏÏÏÏÏÏÏÏÏÏÏÏÏÏÏÏÏÏÏÏÏÏÏÏÏÏÏÏÏÏÏÏ 593.0 695.7Retained Earnings ÏÏÏÏÏÏÏÏÏÏÏÏÏÏÏÏÏÏÏÏÏÏÏÏÏÏÏÏÏÏÏÏÏÏÏÏÏÏÏÏÏÏÏÏÏÏÏÏÏ 5,101.7 4,530.5Foreign Currency Translation Losses, Net of Income Tax ÏÏÏÏÏÏÏÏÏÏÏÏÏÏÏÏ (25.7) (15.6)Unrealized Appreciation of Investments, Net of Income Tax (Note 3)ÏÏÏÏÏ 400.1 238.7Receivable from Employee Stock Ownership Plan ÏÏÏÏÏÏÏÏÏÏÏÏÏÏÏÏÏÏÏÏÏÏ (96.7) (106.3)Treasury Stock, at Cost Ì 7,320,410 and 1,223,182 Shares ÏÏÏÏÏÏÏÏÏÏÏÏÏÏÏ (491.3) (56.2)
TOTAL SHAREHOLDERS' EQUITY ÏÏÏÏÏÏÏÏÏÏÏÏÏÏÏÏÏÏÏÏÏÏÏÏÏÏ 5,657.1 5,462.9
TOTAL LIABILITIES AND SHAREHOLDERS' EQUITY ÏÏÏÏÏÏÏ $19,615.6 $19,938.9
See accompanying notes.
39
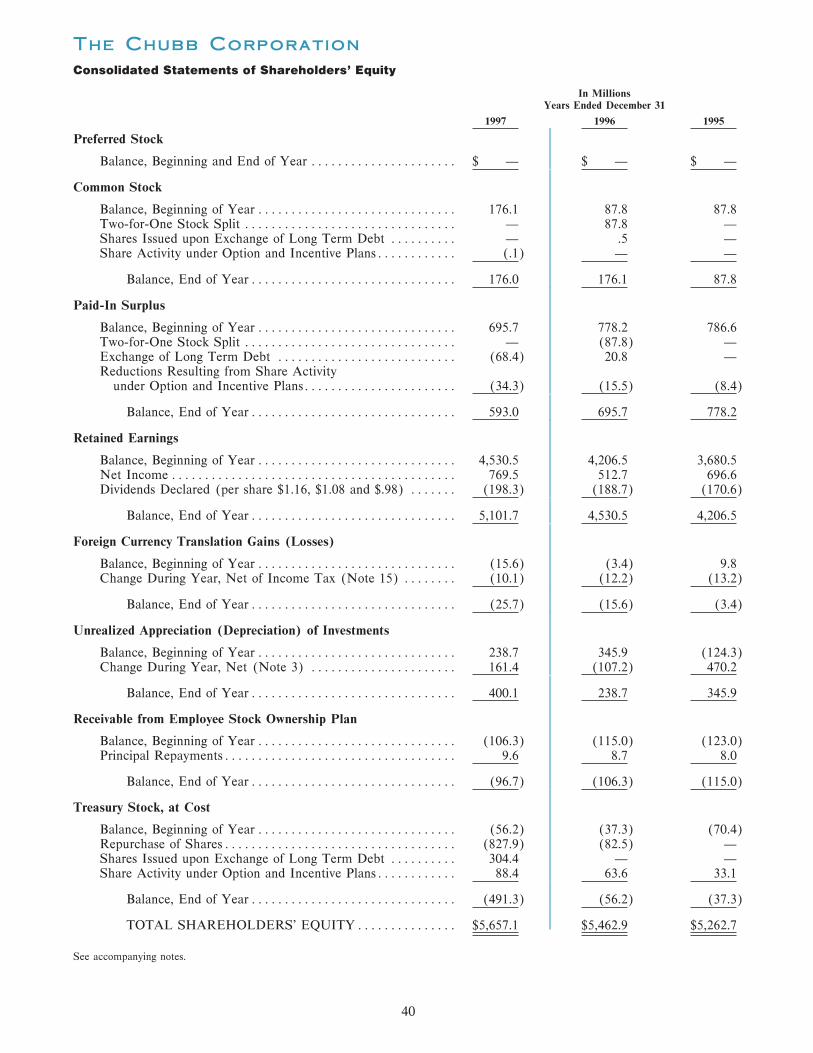
The Chubb Corporation
Consolidated Statements of Shareholders' Equity
In Millions
Years Ended December 31
1997 1996 1995
Preferred Stock
Balance, Beginning and End of Year ÏÏÏÏÏÏÏÏÏÏÏÏÏÏÏÏÏÏÏÏÏÏ $ Ì $ Ì $ Ì
Common Stock
Balance, Beginning of Year ÏÏÏÏÏÏÏÏÏÏÏÏÏÏÏÏÏÏÏÏÏÏÏÏÏÏÏÏÏÏ 176.1 87.8 87.8Two-for-One Stock Split ÏÏÏÏÏÏÏÏÏÏÏÏÏÏÏÏÏÏÏÏÏÏÏÏÏÏÏÏÏÏÏÏ Ì 87.8 ÌShares Issued upon Exchange of Long Term Debt ÏÏÏÏÏÏÏÏÏÏ Ì .5 ÌShare Activity under Option and Incentive PlansÏÏÏÏÏÏÏÏÏÏÏÏ (.1) Ì Ì
Balance, End of YearÏÏÏÏÏÏÏÏÏÏÏÏÏÏÏÏÏÏÏÏÏÏÏÏÏÏÏÏÏÏÏ 176.0 176.1 87.8
Paid-In Surplus
Balance, Beginning of Year ÏÏÏÏÏÏÏÏÏÏÏÏÏÏÏÏÏÏÏÏÏÏÏÏÏÏÏÏÏÏ 695.7 778.2 786.6Two-for-One Stock Split ÏÏÏÏÏÏÏÏÏÏÏÏÏÏÏÏÏÏÏÏÏÏÏÏÏÏÏÏÏÏÏÏ Ì (87.8) ÌExchange of Long Term Debt ÏÏÏÏÏÏÏÏÏÏÏÏÏÏÏÏÏÏÏÏÏÏÏÏÏÏÏ (68.4) 20.8 ÌReductions Resulting from Share Activity
under Option and Incentive PlansÏÏÏÏÏÏÏÏÏÏÏÏÏÏÏÏÏÏÏÏÏÏÏ (34.3) (15.5) (8.4)
Balance, End of YearÏÏÏÏÏÏÏÏÏÏÏÏÏÏÏÏÏÏÏÏÏÏÏÏÏÏÏÏÏÏÏ 593.0 695.7 778.2
Retained Earnings
Balance, Beginning of Year ÏÏÏÏÏÏÏÏÏÏÏÏÏÏÏÏÏÏÏÏÏÏÏÏÏÏÏÏÏÏ 4,530.5 4,206.5 3,680.5Net Income ÏÏÏÏÏÏÏÏÏÏÏÏÏÏÏÏÏÏÏÏÏÏÏÏÏÏÏÏÏÏÏÏÏÏÏÏÏÏÏÏÏÏÏ 769.5 512.7 696.6Dividends Declared (per share $1.16, $1.08 and $.98) ÏÏÏÏÏÏÏ (198.3) (188.7) (170.6)
Balance, End of YearÏÏÏÏÏÏÏÏÏÏÏÏÏÏÏÏÏÏÏÏÏÏÏÏÏÏÏÏÏÏÏ 5,101.7 4,530.5 4,206.5
Foreign Currency Translation Gains (Losses)
Balance, Beginning of Year ÏÏÏÏÏÏÏÏÏÏÏÏÏÏÏÏÏÏÏÏÏÏÏÏÏÏÏÏÏÏ (15.6) (3.4) 9.8Change During Year, Net of Income Tax (Note 15) ÏÏÏÏÏÏÏÏ (10.1) (12.2) (13.2)
Balance, End of YearÏÏÏÏÏÏÏÏÏÏÏÏÏÏÏÏÏÏÏÏÏÏÏÏÏÏÏÏÏÏÏ (25.7) (15.6) (3.4)
Unrealized Appreciation (Depreciation) of Investments
Balance, Beginning of Year ÏÏÏÏÏÏÏÏÏÏÏÏÏÏÏÏÏÏÏÏÏÏÏÏÏÏÏÏÏÏ 238.7 345.9 (124.3)Change During Year, Net (Note 3) ÏÏÏÏÏÏÏÏÏÏÏÏÏÏÏÏÏÏÏÏÏÏ 161.4 (107.2) 470.2
Balance, End of YearÏÏÏÏÏÏÏÏÏÏÏÏÏÏÏÏÏÏÏÏÏÏÏÏÏÏÏÏÏÏÏ 400.1 238.7 345.9
Receivable from Employee Stock Ownership Plan
Balance, Beginning of Year ÏÏÏÏÏÏÏÏÏÏÏÏÏÏÏÏÏÏÏÏÏÏÏÏÏÏÏÏÏÏ (106.3) (115.0) (123.0)Principal RepaymentsÏÏÏÏÏÏÏÏÏÏÏÏÏÏÏÏÏÏÏÏÏÏÏÏÏÏÏÏÏÏÏÏÏÏÏ 9.6 8.7 8.0
Balance, End of YearÏÏÏÏÏÏÏÏÏÏÏÏÏÏÏÏÏÏÏÏÏÏÏÏÏÏÏÏÏÏÏ (96.7) (106.3) (115.0)
Treasury Stock, at Cost
Balance, Beginning of Year ÏÏÏÏÏÏÏÏÏÏÏÏÏÏÏÏÏÏÏÏÏÏÏÏÏÏÏÏÏÏ (56.2) (37.3) (70.4)Repurchase of SharesÏÏÏÏÏÏÏÏÏÏÏÏÏÏÏÏÏÏÏÏÏÏÏÏÏÏÏÏÏÏÏÏÏÏÏ (827.9) (82.5) ÌShares Issued upon Exchange of Long Term Debt ÏÏÏÏÏÏÏÏÏÏ 304.4 Ì ÌShare Activity under Option and Incentive PlansÏÏÏÏÏÏÏÏÏÏÏÏ 88.4 63.6 33.1
Balance, End of YearÏÏÏÏÏÏÏÏÏÏÏÏÏÏÏÏÏÏÏÏÏÏÏÏÏÏÏÏÏÏÏ (491.3) (56.2) (37.3)
TOTAL SHAREHOLDERS' EQUITYÏÏÏÏÏÏÏÏÏÏÏÏÏÏÏ $5,657.1 $5,462.9 $5,262.7
See accompanying notes.
40
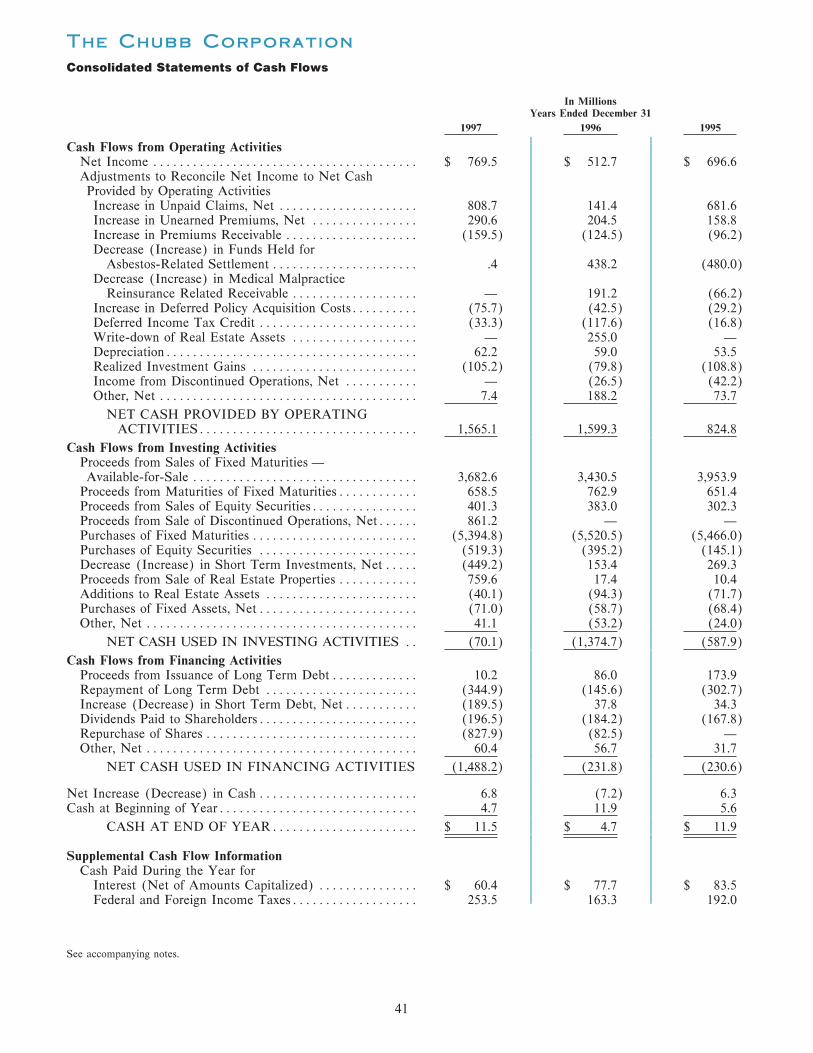
The Chubb Corporation
Consolidated Statements of Cash Flows
In Millions
Years Ended December 31
1997 1996 1995
Cash Flows from Operating ActivitiesNet Income ÏÏÏÏÏÏÏÏÏÏÏÏÏÏÏÏÏÏÏÏÏÏÏÏÏÏÏÏÏÏÏÏÏÏÏÏÏÏÏÏ $ 769.5 $ 512.7 $ 696.6Adjustments to Reconcile Net Income to Net CashProvided by Operating ActivitiesIncrease in Unpaid Claims, Net ÏÏÏÏÏÏÏÏÏÏÏÏÏÏÏÏÏÏÏÏÏ 808.7 141.4 681.6Increase in Unearned Premiums, Net ÏÏÏÏÏÏÏÏÏÏÏÏÏÏÏÏ 290.6 204.5 158.8Increase in Premiums Receivable ÏÏÏÏÏÏÏÏÏÏÏÏÏÏÏÏÏÏÏÏ (159.5) (124.5) (96.2)Decrease (Increase) in Funds Held for
Asbestos-Related Settlement ÏÏÏÏÏÏÏÏÏÏÏÏÏÏÏÏÏÏÏÏÏÏ .4 438.2 (480.0)Decrease (Increase) in Medical Malpractice
Reinsurance Related Receivable ÏÏÏÏÏÏÏÏÏÏÏÏÏÏÏÏÏÏÏ Ì 191.2 (66.2)Increase in Deferred Policy Acquisition CostsÏÏÏÏÏÏÏÏÏÏ (75.7) (42.5) (29.2)Deferred Income Tax Credit ÏÏÏÏÏÏÏÏÏÏÏÏÏÏÏÏÏÏÏÏÏÏÏÏ (33.3) (117.6) (16.8)Write-down of Real Estate Assets ÏÏÏÏÏÏÏÏÏÏÏÏÏÏÏÏÏÏÏ Ì 255.0 ÌDepreciationÏÏÏÏÏÏÏÏÏÏÏÏÏÏÏÏÏÏÏÏÏÏÏÏÏÏÏÏÏÏÏÏÏÏÏÏÏÏ 62.2 59.0 53.5Realized Investment Gains ÏÏÏÏÏÏÏÏÏÏÏÏÏÏÏÏÏÏÏÏÏÏÏÏÏ (105.2) (79.8) (108.8)Income from Discontinued Operations, Net ÏÏÏÏÏÏÏÏÏÏÏ Ì (26.5) (42.2)Other, Net ÏÏÏÏÏÏÏÏÏÏÏÏÏÏÏÏÏÏÏÏÏÏÏÏÏÏÏÏÏÏÏÏÏÏÏÏÏÏÏ 7.4 188.2 73.7
NET CASH PROVIDED BY OPERATINGACTIVITIESÏÏÏÏÏÏÏÏÏÏÏÏÏÏÏÏÏÏÏÏÏÏÏÏÏÏÏÏÏÏÏÏÏ 1,565.1 1,599.3 824.8
Cash Flows from Investing ActivitiesProceeds from Sales of Fixed Maturities ÌAvailable-for-Sale ÏÏÏÏÏÏÏÏÏÏÏÏÏÏÏÏÏÏÏÏÏÏÏÏÏÏÏÏÏÏÏÏÏÏ 3,682.6 3,430.5 3,953.9
Proceeds from Maturities of Fixed MaturitiesÏÏÏÏÏÏÏÏÏÏÏÏ 658.5 762.9 651.4Proceeds from Sales of Equity SecuritiesÏÏÏÏÏÏÏÏÏÏÏÏÏÏÏÏ 401.3 383.0 302.3Proceeds from Sale of Discontinued Operations, NetÏÏÏÏÏÏ 861.2 Ì ÌPurchases of Fixed Maturities ÏÏÏÏÏÏÏÏÏÏÏÏÏÏÏÏÏÏÏÏÏÏÏÏÏ (5,394.8) (5,520.5) (5,466.0)Purchases of Equity Securities ÏÏÏÏÏÏÏÏÏÏÏÏÏÏÏÏÏÏÏÏÏÏÏÏ (519.3) (395.2) (145.1)Decrease (Increase) in Short Term Investments, Net ÏÏÏÏÏ (449.2) 153.4 269.3Proceeds from Sale of Real Estate Properties ÏÏÏÏÏÏÏÏÏÏÏÏ 759.6 17.4 10.4Additions to Real Estate Assets ÏÏÏÏÏÏÏÏÏÏÏÏÏÏÏÏÏÏÏÏÏÏÏ (40.1) (94.3) (71.7)Purchases of Fixed Assets, NetÏÏÏÏÏÏÏÏÏÏÏÏÏÏÏÏÏÏÏÏÏÏÏÏ (71.0) (58.7) (68.4)Other, Net ÏÏÏÏÏÏÏÏÏÏÏÏÏÏÏÏÏÏÏÏÏÏÏÏÏÏÏÏÏÏÏÏÏÏÏÏÏÏÏÏÏ 41.1 (53.2) (24.0)
NET CASH USED IN INVESTING ACTIVITIES ÏÏ (70.1) (1,374.7) (587.9)
Cash Flows from Financing ActivitiesProceeds from Issuance of Long Term DebtÏÏÏÏÏÏÏÏÏÏÏÏÏ 10.2 86.0 173.9Repayment of Long Term Debt ÏÏÏÏÏÏÏÏÏÏÏÏÏÏÏÏÏÏÏÏÏÏÏ (344.9) (145.6) (302.7)Increase (Decrease) in Short Term Debt, Net ÏÏÏÏÏÏÏÏÏÏÏ (189.5) 37.8 34.3Dividends Paid to ShareholdersÏÏÏÏÏÏÏÏÏÏÏÏÏÏÏÏÏÏÏÏÏÏÏÏ (196.5) (184.2) (167.8)Repurchase of Shares ÏÏÏÏÏÏÏÏÏÏÏÏÏÏÏÏÏÏÏÏÏÏÏÏÏÏÏÏÏÏÏÏ (827.9) (82.5) ÌOther, Net ÏÏÏÏÏÏÏÏÏÏÏÏÏÏÏÏÏÏÏÏÏÏÏÏÏÏÏÏÏÏÏÏÏÏÏÏÏÏÏÏÏ 60.4 56.7 31.7
NET CASH USED IN FINANCING ACTIVITIES (1,488.2) (231.8) (230.6)
Net Increase (Decrease) in CashÏÏÏÏÏÏÏÏÏÏÏÏÏÏÏÏÏÏÏÏÏÏÏÏ 6.8 (7.2) 6.3Cash at Beginning of YearÏÏÏÏÏÏÏÏÏÏÏÏÏÏÏÏÏÏÏÏÏÏÏÏÏÏÏÏÏÏ 4.7 11.9 5.6
CASH AT END OF YEARÏÏÏÏÏÏÏÏÏÏÏÏÏÏÏÏÏÏÏÏÏÏ $ 11.5 $ 4.7 $ 11.9
Supplemental Cash Flow InformationCash Paid During the Year for
Interest (Net of Amounts Capitalized) ÏÏÏÏÏÏÏÏÏÏÏÏÏÏÏ $ 60.4 $ 77.7 $ 83.5Federal and Foreign Income TaxesÏÏÏÏÏÏÏÏÏÏÏÏÏÏÏÏÏÏÏ 253.5 163.3 192.0
See accompanying notes.
41
Notes to Consolidated Financial Statements
Premiums and discounts arising from the purchase of(1) Summary of SigniÑcant Accounting Policiesmortgage-backed securities are amortized using the inter-
(a) Basis of Presentation est method over the estimated remaining term of thesecurities, adjusted for anticipated prepayments.The accompanying consolidated Ñnancial statements
have been prepared in accordance with generally accepted Equity securities, which include common stocks andaccounting principles and include the accounts of The non-redeemable preferred stocks, are carried at marketChubb Corporation (Corporation) and its subsidiaries. value as of the balance sheet date.SigniÑcant intercompany transactions have been elimi-
Unrealized appreciation or depreciation of investmentsnated in consolidation. carried at market value is excluded from income and
credited or charged directly to a separate component ofThe consolidated Ñnancial statements reÖect estimatesshareholders' equity, net of applicable deferred incomeand judgments made by management that aÅect thetax.reported amounts of assets and liabilities and disclosure of
contingent assets and liabilities at the date of the Ñnancial Realized gains and losses on the sale of investments arestatements and the reported amounts of revenues and determined on the basis of the cost of the speciÑc invest-expenses during the reporting period. Actual results could ments sold and are credited or charged to income.diÅer from those estimates.
(c) Premium Revenues and Related ExpensesThe Corporation is a holding company with subsidiaries
Property and casualty insurance premiums are earnedprincipally engaged in two industries: property and casu-on a monthly pro rata basis over the terms of the policies.alty insurance and real estate.Revenues include estimates of audit premiums and pre-
On May 13, 1997, the Corporation completed the sale miums on retrospectively rated policies. Unearned premi-of its life and health insurance subsidiaries. The life and ums represent the portion of premiums written applicablehealth insurance subsidiaries have been classiÑed as dis- to the unexpired terms of policies in force.continued operations (see Note (2)). All footnote disclo-
Acquisition costs, consisting of commissions, premiumsures reÖect continuing operations only, unless otherwise
taxes and other costs that vary with and are primarilynoted. related to the production of business, are deferred by
In the fourth quarter of 1997, the Corporation adopted major product groups and amortized over the period inwhich the related premiums are earned. Deferred policyStatement of Financial Accounting Standards (SFAS)acquisition costs are reviewed to determine that they doNo. 128, Earnings per Share. SFAS No. 128 establishesnot exceed recoverable amounts, after considering antici-new standards for computing and presenting earnings perpated investment income.share. SFAS No. 128 requires presentation of basic earn-
ings per share and diluted earnings per share. Prior period(d) Unpaid Claimsearnings per share amounts have been restated. The
Liabilities for unpaid claims include the accumulationadoption of SFAS No. 128 did not have a signiÑcantof individual case estimates for claims reported as well aseÅect on the Corporation's earnings per share.estimates of unreported claims and claim settlement
Certain other amounts in the consolidated Ñnancial expenses, less estimates of anticipated salvage and subro-statements for prior years have been reclassiÑed to con- gation recoveries. Estimates are based upon past claimform with the 1997 presentation. experience modiÑed for current trends as well as prevail-
ing economic, legal and social conditions. Such estimates(b) Investments are continually reviewed and updated. Any resulting ad-
justments are reÖected in current operating results.Short term investments, which have an original matur-ity of one year or less, are carried at amortized cost.
(e) ReinsuranceFixed maturities, which include bonds and redeemable
In the ordinary course of business, the Corporation'spreferred stocks, are purchased to support the investmentinsurance subsidiaries assume and cede reinsurance with
strategies of the Corporation and its insurance subsidiar-other insurance companies and are members of various
ies. These strategies are developed based on many factorspools and associations. These arrangements provide
including rate of return, maturity, credit risk, tax consid- greater diversiÑcation of business and minimize the maxi-erations and regulatory requirements. Fixed maturities mum net loss potential arising from large risks. A largewhich may be sold prior to maturity to support the portion of the reinsurance is eÅected under contractsinvestment strategies of the Corporation and its insurance known as treaties and in some instances by negotiation onsubsidiaries are classiÑed as available-for-sale and carried individual risks. Certain of these arrangements consist ofat market value as of the balance sheet date. Those Ñxed excess of loss and catastrophe contracts which protectmaturities which the Corporation and its insurance sub- against losses over stipulated amounts arising from anysidiaries have the ability and positive intent to hold to one occurrence or event. Ceded reinsurance contracts domaturity are classiÑed as held-to-maturity and carried at not relieve the Corporation's insurance subsidiaries ofamortized cost. their obligation to the policyholders.
42

Prepaid reinsurance premiums represent the portion of agreement. An allowance for uncollectible amounts isinsurance premiums ceded to reinsurers applicable to the established to recognize any such impairment. Measure-unexpired terms of the reinsurance contracts in force. ment of impairment is based on the discounted future
cash Öows of the loan, subject to the estimated fair valueCommissions received related to reinsurance premiumsof the underlying collateral. These cash Öows are dis-ceded are considered in determining net acquisition costscounted at the loan's eÅective interest rate.eligible for deferral.
Rental revenues are recognized on a straight-line basisReinsurance recoverable on unpaid claims representover the term of the lease. ProÑts on land, townhome unitestimates of the portion of such liabilities that will beand commercial building sales are recognized at closing,recovered from reinsurers. Amounts recoverable fromsubject to compliance with applicable accounting guide-reinsurers are recognized as assets at the same time and inlines. ProÑts on high-rise condominium unit sales area manner consistent with the liabilities associated with therecognized using the percentage of completion method,reinsured policies.subject to achievement of a minimum level of unit sales.ProÑts on construction contracts are recognized using the(f) Funds Held for Asbestos-Related Settlementpercentage of completion method.
Funds held for asbestos-related settlement are assets ofthe Corporation's property and casualty insurance subsidi-
(h) Property and Equipmentaries that accrue income for the beneÑt of participants inthe class settlement of asbestos-related bodily injury Property and equipment used in operations are carriedclaims against Fibreboard Corporation (see Note (13)). at cost less accumulated depreciation. Depreciation is
calculated using the straight-line method over the esti-(g) Real Estate mated useful lives of the assets.
Real estate properties are carried at cost, net of write-(i) Stock-Based Compensationdowns for impairment. Real estate taxes, interest and
other carrying costs incurred prior to completion of the The intrinsic value method of accounting is used forassets for their intended use are capitalized. Also, costs stock-based compensation plans. Under the intrinsicincurred during the initial leasing of income producing value method, compensation cost is measured as theproperties are capitalized until the project is substantially excess, if any, of the quoted market price of the stock atcomplete, subject to a maximum time period subsequent the measurement date over the amount an employee mustto completion of major construction activity. pay to acquire the stock.
EÅective January 1, 1996, the Corporation adopted(j) Income TaxesSFAS No. 121, Accounting for the Impairment of Long-
Lived Assets and for Long-Lived Assets to Be Disposed The Corporation and its domestic subsidiaries Ñle aOf. SFAS No. 121 establishes accounting standards for consolidated federal income tax return.the impairment of long-lived assets, certain identiÑableintangibles and goodwill related to those assets. Under Deferred income tax assets and liabilities are recog-SFAS No. 121, real estate properties are reviewed for nized for the expected future tax eÅects attributable toimpairment whenever events or circumstances indicate temporary diÅerences between the Ñnancial reporting andthat the carrying value of such properties may not be tax bases of assets and liabilities, based on enacted taxrecoverable. In performing the review for recoverability of rates and other provisions of tax law. The eÅect of acarrying value, estimates are made of the future undis- change in tax laws or rates is recognized in income in thecounted cash Öows from each of the properties during the period in which such change is enacted.period the property will be held and upon its eventual
U. S. federal income taxes are accrued on undistributeddisposition. If the expected future undiscounted cashearnings of foreign subsidiaries.Öows are less than the carrying value of such properties,
an impairment loss is recognized resulting in a write-down(k) Foreign Exchangeof the carrying value of the property. Measurement of
such impairment is based on the fair value of the Assets and liabilities relating to foreign operations areproperty. translated into U.S. dollars using current exchange rates;
revenues and expenses are translated into U.S. dollarsDepreciation of real estate properties is calculatedusing the average exchange rates for each year.using the straight-line method over the estimated useful
lives of the properties. The functional currency of foreign operations is gener-Real estate mortgages and notes receivable are carried ally the currency of the local operating environment since
at unpaid principal balances less an allowance for uncol- their business is primarily transacted in such local curren-lectible amounts. A loan is considered impaired when it is cies. Translation gains and losses, net of applicable in-probable that all principal and interest amounts will not come tax, are excluded from income and accumulated inbe collected according to the contractual terms of the loan a separate component of shareholders' equity.
43
(l) Cash Flow Information The results of the discontinued operations were asfollows:In the statement of cash Öows, short term investments
Years Ended December 31are not considered to be cash equivalents. The eÅect of1996 1995changes in foreign exchange rates on cash balances was
(in millions)immaterial.Total revenuesÏÏÏÏÏÏÏÏÏÏÏÏÏÏÏÏÏÏÏÏÏÏÏ $816.8 $877.7
In 1997 and 1996, $228.6 million and $20.7 million of Total beneÑts, claims and expenses ÏÏÏÏÏ 743.9 814.6exchangeable subordinated notes were exchanged for Income before federal income tax ÏÏÏÏ 72.9 63.15,316,565 shares and 480,464 shares, respectively, of Federal income taxÏÏÏÏÏÏÏÏÏÏÏÏÏÏÏÏÏÏÏ 24.4 20.9
common stock of the Corporation. In 1997, $108.6 million Income from operationsÏÏÏÏÏÏÏÏÏÏÏÏÏ $ 48.5 $ 42.2of long term debt was assumed by a joint venture as a part
The assets and liabilities of the discontinued operationsof the sale of real estate properties. These noncash trans-at December 31, 1996 were as follows:actions have been excluded from the consolidated state-
(in millions)ments of cash Öows.Assets
Invested assets ÏÏÏÏÏÏÏÏÏÏÏÏÏÏÏÏÏÏÏÏÏÏÏÏÏÏÏÏÏÏÏÏÏÏÏ $3,185.3(m) Accounting Pronouncements Not Yet Adopted Other assets ÏÏÏÏÏÏÏÏÏÏÏÏÏÏÏÏÏÏÏÏÏÏÏÏÏÏÏÏÏÏÏÏÏÏÏÏÏ 1,546.5In June 1996, the Financial Accounting Standards Total assetsÏÏÏÏÏÏÏÏÏÏÏÏÏÏÏÏÏÏÏÏÏÏÏÏÏÏÏÏÏÏÏÏ 4,731.8
Board (FASB) issued SFAS No. 125, Accounting for LiabilitiesLife and health policy liabilitiesÏÏÏÏÏÏÏÏÏÏÏÏÏÏÏÏÏÏÏÏÏ 3,230.7Transfers and Servicing of Financial Assets and Extin-Other liabilities ÏÏÏÏÏÏÏÏÏÏÏÏÏÏÏÏÏÏÏÏÏÏÏÏÏÏÏÏÏÏÏÏÏÏ 657.7guishments of Liabilities. SFAS No. 125 provides new
Total liabilities ÏÏÏÏÏÏÏÏÏÏÏÏÏÏÏÏÏÏÏÏÏÏÏÏÏÏÏÏÏ 3,888.4accounting and reporting standards for transfers of Ñnan-Net assets of discontinued operations ÏÏÏÏÏÏÏÏÏÏÏÏÏÏÏÏÏÏ $ 843.4cial assets and extinguishments of liabilities. The State-
ment provides consistent standards for distinguishingtransfers of Ñnancial assets that are sales from transfers (3) Invested Assets and Related Incomethat are secured borrowings. Transactions covered by this
(a) The sources of net investment income were asStatement would include securitizations, repurchaseagreements and securities lending. SFAS No. 125, as follows:amended by SFAS No. 127, Deferral of the EÅective
Years Ended December 31Date of Certain Provisions of FASB Statement No. 125,1997 1996 1995is eÅective January 1, 1998 and is to be applied prospec-
(in millions)tively. Adoption of this Statement is not expected to haveFixed maturities ÏÏÏÏÏÏÏÏÏÏÏÏÏÏÏÏÏÏÏÏ $726.1 $669.7 $604.3a signiÑcant impact on the Corporation's Ñnancial posi-Equity securities ÏÏÏÏÏÏÏÏÏÏÏÏÏÏÏÏÏÏÏÏ 10.8 10.0 12.3
tion or results of operations. Short term investments ÏÏÏÏÏÏÏÏÏÏÏÏÏÏ 47.6 23.9 35.1Other ÏÏÏÏÏÏÏÏÏÏÏÏÏÏÏÏÏÏÏÏÏÏÏÏÏÏÏÏÏ .8 8.0 16.0In December 1997, the American Institute of CertiÑed
Public Accountants issued Statement of Position (SOP) Gross investment incomeÏÏÏÏÏÏÏÏÏÏÏ 785.3 711.6 667.7Investment expenses ÏÏÏÏÏÏÏÏÏÏÏÏÏÏÏÏ 12.0 12.3 11.997-3, Accounting by Insurance and Other Enterprises for
$773.3 $699.3 $655.8Insurance-Related Assessments. The SOP provides gui-dance for determining when a liability for guaranty-fundand other insurance-related assessments should be recog- (b) Realized investment gains and losses were as follows:nized and how such liability should be measured. The Years Ended December 31Corporation will adopt SOP 97-3 as of January 1, 1998.
1997 1996 1995Restatement of Ñnancial statements for periods before the
(in millions)year SOP 97-3 is adopted is not permitted. The adoption Gross realized investment gains
Fixed maturitiesÏÏÏÏÏÏÏÏÏÏÏÏÏÏÏÏÏÏÏ $ 56.3 $ 56.4 $ 66.7of SOP 97-3 is not expected to have a signiÑcant impactEquity securities ÏÏÏÏÏÏÏÏÏÏÏÏÏÏÏÏÏÏ 93.8 75.5 95.4on the Corporation's Ñnancial position or results of
150.1 131.9 162.1operations.Gross realized investment losses
Fixed maturitiesÏÏÏÏÏÏÏÏÏÏÏÏÏÏÏÏÏÏÏ 26.5 45.7 46.5(2) Discontinued OperationsEquity securities ÏÏÏÏÏÏÏÏÏÏÏÏÏÏÏÏÏÏ 18.4 6.4 6.8
On May 13, 1997, the Corporation completed the sale 44.9 52.1 53.3of Chubb Life Insurance Company of America and its
Realized investment gains ÏÏÏÏÏÏÏÏÏÏÏÏ 105.2 79.8 108.8subsidiaries to JeÅerson-Pilot Corporation for $875.0 mil- Income taxÏÏÏÏÏÏÏÏÏÏÏÏÏÏÏÏÏÏÏÏÏÏÏÏÏ 36.8 27.8 38.1lion in cash, subject to various closing adjustments, none $ 68.4 $ 52.0 $ 70.7of which were material.
In 1996, the Corporation recognized a loss of $22.0million related to the sale of the life and health insurancesubsidiaries. The purchase price was not adjusted toreÖect results of operations subsequent to December 31,1996. Therefore, the discontinued life and health insur-ance operations did not aÅect the Corporation's net in-come in 1997 and will not aÅect net income in futureperiods.
44
(c) The components of unrealized appreciation of investments carried at market value were as follows:
December 31
1997 1996
(in millions)
Equity securitiesGross unrealized appreciationÏÏÏÏÏÏÏÏÏÏÏÏÏÏÏÏÏÏÏÏÏÏÏÏÏÏÏÏÏÏÏÏÏÏÏÏÏÏÏÏÏÏÏÏÏÏÏÏÏÏÏÏÏÏÏÏÏÏÏÏÏÏÏÏÏÏÏÏÏÏÏÏÏÏÏÏÏ $160.6 $115.0Gross unrealized depreciationÏÏÏÏÏÏÏÏÏÏÏÏÏÏÏÏÏÏÏÏÏÏÏÏÏÏÏÏÏÏÏÏÏÏÏÏÏÏÏÏÏÏÏÏÏÏÏÏÏÏÏÏÏÏÏÏÏÏÏÏÏÏÏÏÏÏÏÏÏÏÏÏÏÏÏÏÏ 23.4 9.2
137.2 105.8
Fixed maturitiesGross unrealized appreciationÏÏÏÏÏÏÏÏÏÏÏÏÏÏÏÏÏÏÏÏÏÏÏÏÏÏÏÏÏÏÏÏÏÏÏÏÏÏÏÏÏÏÏÏÏÏÏÏÏÏÏÏÏÏÏÏÏÏÏÏÏÏÏÏÏÏÏÏÏÏÏÏÏÏÏÏÏ 486.0 297.1Gross unrealized depreciationÏÏÏÏÏÏÏÏÏÏÏÏÏÏÏÏÏÏÏÏÏÏÏÏÏÏÏÏÏÏÏÏÏÏÏÏÏÏÏÏÏÏÏÏÏÏÏÏÏÏÏÏÏÏÏÏÏÏÏÏÏÏÏÏÏÏÏÏÏÏÏÏÏÏÏÏÏ 7.6 35.6
478.4 261.5
615.6 367.3Deferred income tax liability ÏÏÏÏÏÏÏÏÏÏÏÏÏÏÏÏÏÏÏÏÏÏÏÏÏÏÏÏÏÏÏÏÏÏÏÏÏÏÏÏÏÏÏÏÏÏÏÏÏÏÏÏÏÏÏÏÏÏÏÏÏÏÏÏÏÏÏÏÏÏÏÏÏÏÏÏÏÏÏ 215.5 128.6
$400.1 $238.7
The change in unrealized appreciation or depreciation of investments carried at market value was as follows:Years Ended December 31
1997 1996 1995
(in millions)Continuing operations
Change in unrealized appreciation of equity securities ÏÏÏÏÏÏÏÏÏÏÏÏÏÏÏÏÏÏÏÏÏÏÏÏÏÏÏÏÏÏÏÏÏÏÏÏÏÏÏÏÏÏÏÏÏ $ 31.4 $ 17.3 $ 60.9Change in unrealized appreciation or depreciation of Ñxed maturities ÏÏÏÏÏÏÏÏÏÏÏÏÏÏÏÏÏÏÏÏÏÏÏÏÏÏÏÏÏÏÏÏ 216.9 (119.6) 499.1
248.3 (102.3) 560.0Deferred income tax (credit)ÏÏÏÏÏÏÏÏÏÏÏÏÏÏÏÏÏÏÏÏÏÏÏÏÏÏÏÏÏÏÏÏÏÏÏÏÏÏÏÏÏÏÏÏÏÏÏÏÏÏÏÏÏÏÏÏÏÏÏÏÏÏÏÏÏÏ 86.9 (35.8) 196.0Decrease in valuation allowance ÏÏÏÏÏÏÏÏÏÏÏÏÏÏÏÏÏÏÏÏÏÏÏÏÏÏÏÏÏÏÏÏÏÏÏÏÏÏÏÏÏÏÏÏÏÏÏÏÏÏÏÏÏÏÏÏÏÏÏÏÏÏÏ Ì Ì (31.6)
Change in unrealized appreciation or depreciation ÏÏÏÏÏÏÏÏÏÏÏÏÏÏÏÏÏÏÏÏÏÏÏÏÏÏÏÏÏÏÏÏÏÏÏÏÏÏÏÏÏÏÏÏÏÏÏÏ 161.4 (66.5) 395.6
Discontinued operations, net ÏÏÏÏÏÏÏÏÏÏÏÏÏÏÏÏÏÏÏÏÏÏÏÏÏÏÏÏÏÏÏÏÏÏÏÏÏÏÏÏÏÏÏÏÏÏÏÏÏÏÏÏÏÏÏÏÏÏÏÏÏÏÏÏÏÏÏÏ Ì (40.7) 74.6
$161.4 $(107.2) $470.2
The unrealized appreciation or depreciation of Ñxed maturities carried at amortized cost is not reÖected in theÑnancial statements. The change in unrealized appreciation of Ñxed maturities of continuing operations carried atamortized cost was an increase of $16.8 million, a decrease of $48.2 million and an increase of $150.4 million for the yearsended December 31, 1997, 1996 and 1995, respectively.
(d) The amortized cost and estimated market value of Ñxed maturities were as follows:
December 31
1997 1996
Gross Gross Estimated Gross Gross EstimatedAmortized Unrealized Unrealized Market Amortized Unrealized Unrealized Market
Cost Appreciation Depreciation Value Cost Appreciation Depreciation Value
(in millions)
Held-to-maturity Ì Tax exempt ÏÏÏÏÏÏÏÏÏÏÏ $ 2,200.6 $146.7 $ .1 $ 2,347.2 $ 2,443.6 $131.2 $ 1.4 $ 2,573.4
Available-for-saleTax exemptÏÏÏÏÏÏÏÏÏÏÏÏÏÏÏÏÏÏÏÏÏÏÏÏÏÏÏ 5,408.4 358.6 .1 5,766.9 4,415.1 210.1 2.6 4,622.6
TaxableU.S. Government and government agency
and authority obligations ÏÏÏÏÏÏÏÏÏÏÏÏÏ 594.3 9.9 .1 604.1 1,092.3 5.8 8.4 1,089.7Corporate bonds ÏÏÏÏÏÏÏÏÏÏÏÏÏÏÏÏÏÏÏÏÏ 819.9 27.0 2.4 844.5 317.7 7.5 1.8 323.4Foreign bondsÏÏÏÏÏÏÏÏÏÏÏÏÏÏÏÏÏÏÏÏÏÏÏ 1,022.5 46.3 2.4 1,066.4 1,169.2 58.5 11.3 1,216.4Mortgage-backed securitiesÏÏÏÏÏÏÏÏÏÏÏÏ 1,778.2 35.8 2.6 1,811.4 1,444.5 15.1 11.5 1,448.1Redeemable preferred stocks ÏÏÏÏÏÏÏÏÏÏ 151.1 8.4 Ì 159.5 15.0 .1 Ì 15.1
4,366.0 127.4 7.5 4,485.9 4,038.7 87.0 33.0 4,092.7
Total available-for-sale ÏÏÏÏÏÏÏÏÏÏÏÏÏ 9,774.4 486.0 7.6 10,252.8 8,453.8 297.1 35.6 8,715.3
Total Ñxed maturitiesÏÏÏÏÏÏÏÏÏÏÏÏÏÏÏ $11,975.0 $632.7 $7.7 $12,600.0 $10,897.4 $428.3 $37.0 $11,288.7
45
The amortized cost and estimated market value of Ñxed In June 1997, a deÑnitive agreement was reached withmaturities at December 31, 1997 by contractual maturity the purchaser. In November, the sale of almost all of thewere as follows: properties covered by the agreement reached in June was
Estimatedclosed for $736.9 million, which included $628.3 millionAmortized Market
Cost Value in cash and the assumption of $108.6 million in debt. The(in millions) buyer is a joint venture formed by Paine Webber Real
Held-to-Maturity Estate Securities Inc., Morgan Stanley Real EstateDue in one year or less ÏÏÏÏÏÏÏÏÏÏÏÏÏÏÏÏ $ 111.3 $ 112.8
Fund II, L.P. and Gale & Wentworth, L.L.C. Closing onDue after one year through Ñve years ÏÏÏÏ 644.8 678.2Due after Ñve years through ten years ÏÏÏÏ 930.6 999.7 the few remaining properties under the agreement isDue after ten yearsÏÏÏÏÏÏÏÏÏÏÏÏÏÏÏÏÏÏÏÏ 513.9 556.5 expected to occur in 1998. The Corporation is continuing
$2,200.6 $2,347.2to explore the sale of certain of its remaining properties.
The components of real estate assets were as follows:Available-for-Sale
December 31Due in one year or less ÏÏÏÏÏÏÏÏÏÏÏÏÏÏÏÏ $ 194.9 $ 197.0Due after one year through Ñve years ÏÏÏÏ 1,100.2 1,132.9 1997 1996Due after Ñve years through ten years ÏÏÏÏ 2,871.2 3,039.4 (in millions)Due after ten yearsÏÏÏÏÏÏÏÏÏÏÏÏÏÏÏÏÏÏÏÏ 3,829.9 4,072.1
7,996.2 8,441.4Mortgages and notes receivable (net of allowance
Mortgage-backed securities ÏÏÏÏÏÏÏÏÏÏÏÏÏ 1,778.2 1,811.4for uncollectible amounts of $24.0 and $85.7) ÏÏÏ $123.8 $ 502.4
$9,774.4 $10,252.8 Income producing properties ÏÏÏÏÏÏÏÏÏÏÏÏÏÏÏÏÏÏÏÏ 163.8 584.5Construction in progress ÏÏÏÏÏÏÏÏÏÏÏÏÏÏÏÏÏÏÏÏÏÏÏ 95.8 135.0Land under development and unimproved land ÏÏÏÏÏÏÏ 406.6 382.1Actual maturities could diÅer from contractual maturities
$790.0 $1,604.0because borrowers may have the right to call or prepayobligations.
Substantially all mortgages and notes receivable are(e) The Corporation engages in securities lending
secured by buildings and land. The ultimate collectibilitywhereby certain securities from its portfolio are loaned to
of the receivables is evaluated continuously and an appro-other institutions for short periods of time. Cash collateral
priate allowance for uncollectible amounts established.from the borrower, equal to the market value of the
Mortgages and notes receivable had an estimated aggre-loaned securities plus accrued interest, is deposited with agate fair value of $121.0 million and $487.2 million atlending agent and retained and invested by the lendingDecember 31, 1997 and 1996, respectively. The fair valueagent to provide additional income for the Corporation.amounts represent point-in-time estimates that are notAt December 31, 1997 and 1996, the Corporation had norelevant in predicting future earnings or cash Öows relatedsecurities loaned to other institutions. The maximumto such receivables.amount of loaned securities outstanding during 1997 was
approximately $230.0 million.Depreciation expense related to income producing
properties was $2.7 million, $11.0 million and $14.1 mil-(4) Real Estate
lion for 1997, 1996 and 1995, respectively.In October 1996, the Corporation announced that itwas exploring the possible sale of all or a portion of its real
(5) Deferred Policy Acquisition Costsestate assets. In March 1997, the Corporation enteredinto an agreement with a prospective purchaser to per-
Policy acquisition costs deferred and the related amor-form due diligence in anticipation of executing a contracttization charged against income were as follows:for the sale of substantially all of its commercial proper-
Years Ended December 31ties. Because the plan to pursue the sale of these assets in
1997 1996 1995the near term represented a signiÑcant change in circum- (in millions)stances relating to the manner in which these assets would
Balance, beginning of year ÏÏÏÏÏÏÏ $ 601.2 $ 558.7 $ 529.5be used, the recoverability of their carrying value as ofCosts deferred during yearDecember 31, 1996 was reassessed. As a result, an im-
Commissions and brokerageÏÏÏÏ 775.0 653.5 592.7pairment loss of $255.0 million was recognized in 1996 to Premium taxes and assessmentsÏÏ 124.9 114.7 108.0
Salaries and overhead ÏÏÏÏÏÏÏÏÏÏ 578.4 512.3 449.5reduce the carrying value of these assets to their esti-1,478.3 1,280.5 1,150.2mated fair value. This charge was included in real estate
Amortization during year ÏÏÏÏÏÏÏÏ (1,402.6) (1,238.0) (1,121.0)cost of sales and expenses in the consolidated statementsBalance, end of year ÏÏÏÏÏÏÏÏÏÏÏÏ $ 676.9 $ 601.2 $ 558.7
of income.
46
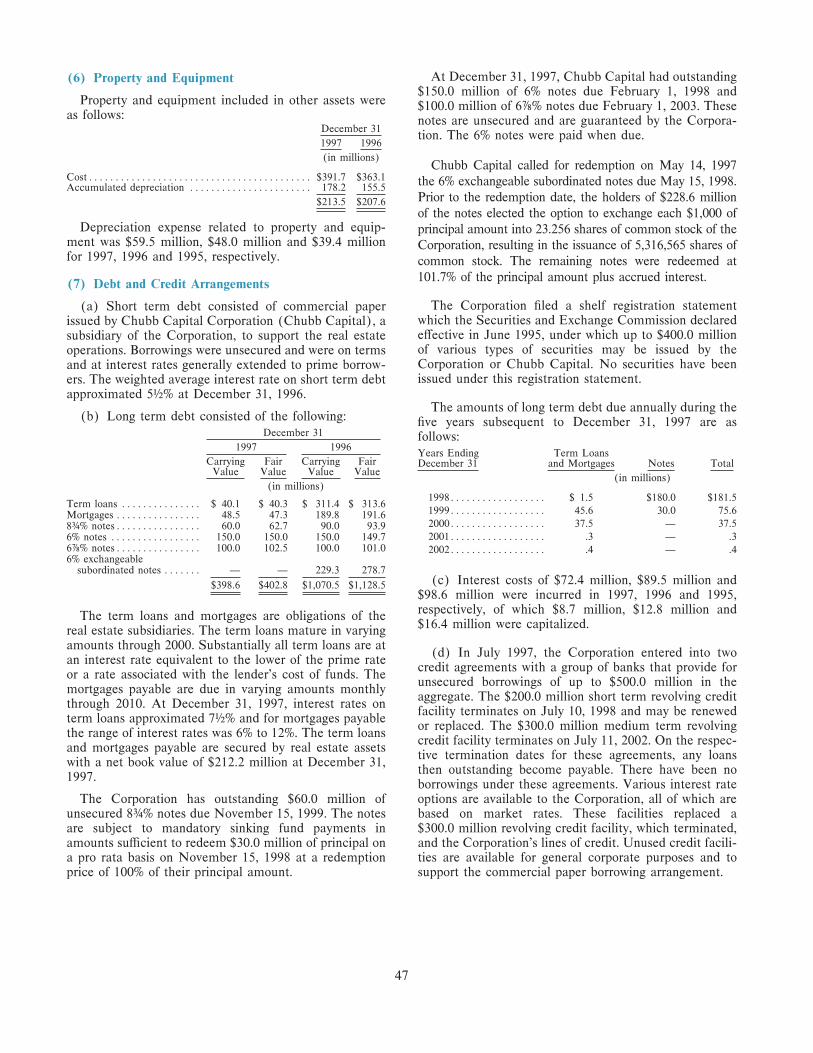
At December 31, 1997, Chubb Capital had outstanding(6) Property and Equipment$150.0 million of 6% notes due February 1, 1998 and
Property and equipment included in other assets were $100.0 million of 6∑% notes due February 1, 2003. Theseas follows: notes are unsecured and are guaranteed by the Corpora-
December 31tion. The 6% notes were paid when due.
1997 1996
(in millions)Chubb Capital called for redemption on May 14, 1997
CostÏÏÏÏÏÏÏÏÏÏÏÏÏÏÏÏÏÏÏÏÏÏÏÏÏÏÏÏÏÏÏÏÏÏÏÏÏÏÏÏÏÏ $391.7 $363.1 the 6% exchangeable subordinated notes due May 15, 1998.Accumulated depreciation ÏÏÏÏÏÏÏÏÏÏÏÏÏÏÏÏÏÏÏÏÏÏÏ 178.2 155.5
Prior to the redemption date, the holders of $228.6 million$213.5 $207.6of the notes elected the option to exchange each $1,000 of
Depreciation expense related to property and equip- principal amount into 23.256 shares of common stock of thement was $59.5 million, $48.0 million and $39.4 million Corporation, resulting in the issuance of 5,316,565 shares offor 1997, 1996 and 1995, respectively. common stock. The remaining notes were redeemed at
101.7% of the principal amount plus accrued interest.(7) Debt and Credit Arrangements
The Corporation Ñled a shelf registration statement(a) Short term debt consisted of commercial paperwhich the Securities and Exchange Commission declaredissued by Chubb Capital Corporation (Chubb Capital), aeÅective in June 1995, under which up to $400.0 millionsubsidiary of the Corporation, to support the real estateof various types of securities may be issued by theoperations. Borrowings were unsecured and were on termsCorporation or Chubb Capital. No securities have beenand at interest rates generally extended to prime borrow-issued under this registration statement.ers. The weighted average interest rate on short term debt
approximated 5¥% at December 31, 1996.The amounts of long term debt due annually during the
(b) Long term debt consisted of the following: Ñve years subsequent to December 31, 1997 are asDecember 31 follows:
1997 1996Years Ending Term Loans
Carrying Fair Carrying Fair December 31 and Mortgages Notes TotalValue Value Value Value
(in millions)(in millions)
1998ÏÏÏÏÏÏÏÏÏÏÏÏÏÏÏÏÏÏ $ 1.5 $180.0 $181.5Term loans ÏÏÏÏÏÏÏÏÏÏÏÏÏÏÏ $ 40.1 $ 40.3 $ 311.4 $ 313.6
1999ÏÏÏÏÏÏÏÏÏÏÏÏÏÏÏÏÏÏ 45.6 30.0 75.6Mortgages ÏÏÏÏÏÏÏÏÏÏÏÏÏÏÏÏ 48.5 47.3 189.8 191.62000ÏÏÏÏÏÏÏÏÏÏÏÏÏÏÏÏÏÏ 37.5 Ì 37.58∂% notesÏÏÏÏÏÏÏÏÏÏÏÏÏÏÏÏ 60.0 62.7 90.0 93.92001ÏÏÏÏÏÏÏÏÏÏÏÏÏÏÏÏÏÏ .3 Ì .36% notes ÏÏÏÏÏÏÏÏÏÏÏÏÏÏÏÏÏ 150.0 150.0 150.0 149.7
6∑% notesÏÏÏÏÏÏÏÏÏÏÏÏÏÏÏÏ 100.0 102.5 100.0 101.0 2002ÏÏÏÏÏÏÏÏÏÏÏÏÏÏÏÏÏÏ .4 Ì .46% exchangeable
subordinated notes ÏÏÏÏÏÏÏ Ì Ì 229.3 278.7(c) Interest costs of $72.4 million, $89.5 million and$398.6 $402.8 $1,070.5 $1,128.5
$98.6 million were incurred in 1997, 1996 and 1995,respectively, of which $8.7 million, $12.8 million andThe term loans and mortgages are obligations of the$16.4 million were capitalized.real estate subsidiaries. The term loans mature in varying
amounts through 2000. Substantially all term loans are at(d) In July 1997, the Corporation entered into two
an interest rate equivalent to the lower of the prime ratecredit agreements with a group of banks that provide for
or a rate associated with the lender's cost of funds. Theunsecured borrowings of up to $500.0 million in the
mortgages payable are due in varying amounts monthlyaggregate. The $200.0 million short term revolving credit
through 2010. At December 31, 1997, interest rates onfacility terminates on July 10, 1998 and may be renewed
term loans approximated 7¥% and for mortgages payableor replaced. The $300.0 million medium term revolving
the range of interest rates was 6% to 12%. The term loanscredit facility terminates on July 11, 2002. On the respec-
and mortgages payable are secured by real estate assetstive termination dates for these agreements, any loans
with a net book value of $212.2 million at December 31,then outstanding become payable. There have been no
1997.borrowings under these agreements. Various interest rate
The Corporation has outstanding $60.0 million of options are available to the Corporation, all of which areunsecured 8∂% notes due November 15, 1999. The notes based on market rates. These facilities replaced aare subject to mandatory sinking fund payments in $300.0 million revolving credit facility, which terminated,amounts suÇcient to redeem $30.0 million of principal on and the Corporation's lines of credit. Unused credit facili-a pro rata basis on November 15, 1998 at a redemption ties are available for general corporate purposes and toprice of 100% of their principal amount. support the commercial paper borrowing arrangement.
47
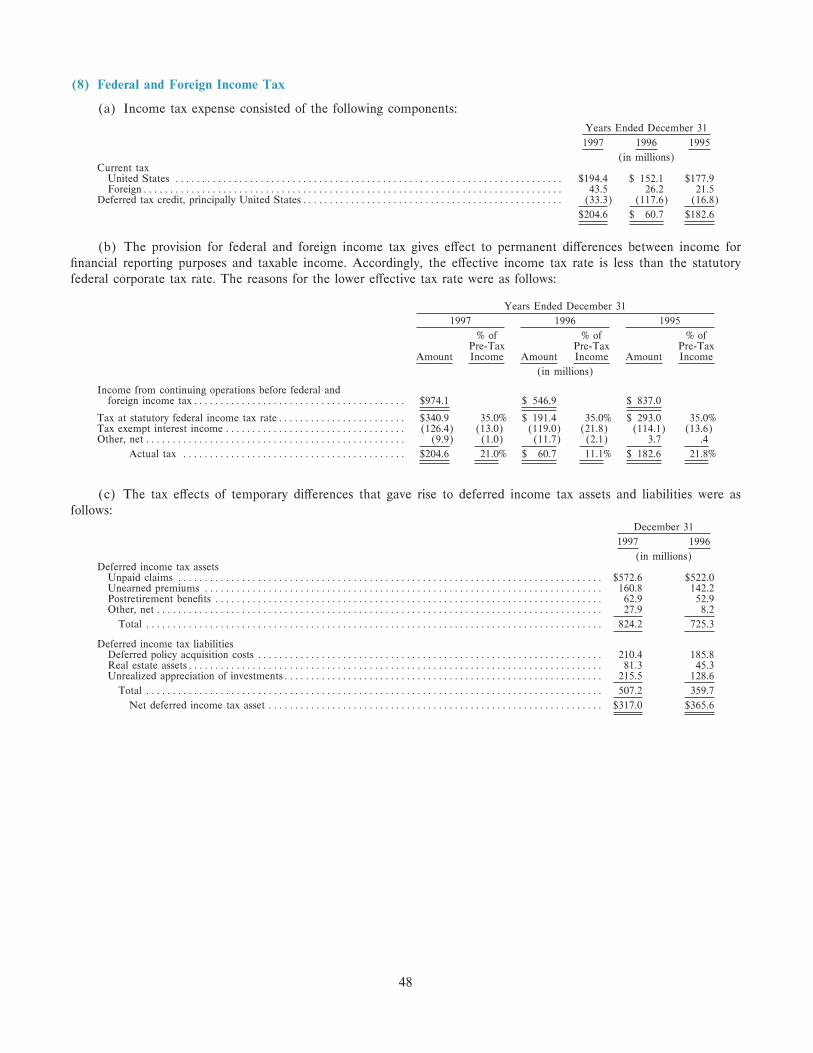
(8) Federal and Foreign Income Tax
(a) Income tax expense consisted of the following components:
Years Ended December 31
1997 1996 1995
(in millions)Current tax
United States ÏÏÏÏÏÏÏÏÏÏÏÏÏÏÏÏÏÏÏÏÏÏÏÏÏÏÏÏÏÏÏÏÏÏÏÏÏÏÏÏÏÏÏÏÏÏÏÏÏÏÏÏÏÏÏÏÏÏÏÏÏÏÏÏÏÏÏÏÏÏÏÏÏ $194.4 $ 152.1 $177.9ForeignÏÏÏÏÏÏÏÏÏÏÏÏÏÏÏÏÏÏÏÏÏÏÏÏÏÏÏÏÏÏÏÏÏÏÏÏÏÏÏÏÏÏÏÏÏÏÏÏÏÏÏÏÏÏÏÏÏÏÏÏÏÏÏÏÏÏÏÏÏÏÏÏÏÏÏÏÏÏÏ 43.5 26.2 21.5
Deferred tax credit, principally United StatesÏÏÏÏÏÏÏÏÏÏÏÏÏÏÏÏÏÏÏÏÏÏÏÏÏÏÏÏÏÏÏÏÏÏÏÏÏÏÏÏÏÏÏÏÏÏÏÏÏ (33.3) (117.6) (16.8)
$204.6 $ 60.7 $182.6
(b) The provision for federal and foreign income tax gives eÅect to permanent diÅerences between income forÑnancial reporting purposes and taxable income. Accordingly, the eÅective income tax rate is less than the statutoryfederal corporate tax rate. The reasons for the lower eÅective tax rate were as follows:
Years Ended December 31
1997 1996 1995
% of % of % ofPre-Tax Pre-Tax Pre-Tax
Amount Income Amount Income Amount Income
(in millions)
Income from continuing operations before federal andforeign income taxÏÏÏÏÏÏÏÏÏÏÏÏÏÏÏÏÏÏÏÏÏÏÏÏÏÏÏÏÏÏÏÏÏÏÏÏÏÏÏÏ $974.1 $ 546.9 $ 837.0
Tax at statutory federal income tax rateÏÏÏÏÏÏÏÏÏÏÏÏÏÏÏÏÏÏÏÏÏÏÏÏ $340.9 35.0% $ 191.4 35.0% $ 293.0 35.0%Tax exempt interest incomeÏÏÏÏÏÏÏÏÏÏÏÏÏÏÏÏÏÏÏÏÏÏÏÏÏÏÏÏÏÏÏÏÏÏ (126.4) (13.0) (119.0) (21.8) (114.1) (13.6)Other, net ÏÏÏÏÏÏÏÏÏÏÏÏÏÏÏÏÏÏÏÏÏÏÏÏÏÏÏÏÏÏÏÏÏÏÏÏÏÏÏÏÏÏÏÏÏÏÏÏÏ (9.9) (1.0) (11.7) (2.1) 3.7 .4
Actual tax ÏÏÏÏÏÏÏÏÏÏÏÏÏÏÏÏÏÏÏÏÏÏÏÏÏÏÏÏÏÏÏÏÏÏÏÏÏÏÏÏÏÏ $204.6 21.0% $ 60.7 11.1% $ 182.6 21.8%
(c) The tax eÅects of temporary diÅerences that gave rise to deferred income tax assets and liabilities were asfollows:
December 31
1997 1996
(in millions)Deferred income tax assets
Unpaid claims ÏÏÏÏÏÏÏÏÏÏÏÏÏÏÏÏÏÏÏÏÏÏÏÏÏÏÏÏÏÏÏÏÏÏÏÏÏÏÏÏÏÏÏÏÏÏÏÏÏÏÏÏÏÏÏÏÏÏÏÏÏÏÏÏÏÏÏÏÏÏÏÏÏÏÏÏÏÏÏÏ $572.6 $522.0Unearned premiums ÏÏÏÏÏÏÏÏÏÏÏÏÏÏÏÏÏÏÏÏÏÏÏÏÏÏÏÏÏÏÏÏÏÏÏÏÏÏÏÏÏÏÏÏÏÏÏÏÏÏÏÏÏÏÏÏÏÏÏÏÏÏÏÏÏÏÏÏÏÏÏÏÏÏÏ 160.8 142.2Postretirement beneÑts ÏÏÏÏÏÏÏÏÏÏÏÏÏÏÏÏÏÏÏÏÏÏÏÏÏÏÏÏÏÏÏÏÏÏÏÏÏÏÏÏÏÏÏÏÏÏÏÏÏÏÏÏÏÏÏÏÏÏÏÏÏÏÏÏÏÏÏÏÏÏÏÏÏ 62.9 52.9Other, net ÏÏÏÏÏÏÏÏÏÏÏÏÏÏÏÏÏÏÏÏÏÏÏÏÏÏÏÏÏÏÏÏÏÏÏÏÏÏÏÏÏÏÏÏÏÏÏÏÏÏÏÏÏÏÏÏÏÏÏÏÏÏÏÏÏÏÏÏÏÏÏÏÏÏÏÏÏÏÏÏÏÏÏÏ 27.9 8.2
Total ÏÏÏÏÏÏÏÏÏÏÏÏÏÏÏÏÏÏÏÏÏÏÏÏÏÏÏÏÏÏÏÏÏÏÏÏÏÏÏÏÏÏÏÏÏÏÏÏÏÏÏÏÏÏÏÏÏÏÏÏÏÏÏÏÏÏÏÏÏÏÏÏÏÏÏÏÏÏÏÏÏÏÏÏÏÏ 824.2 725.3
Deferred income tax liabilitiesDeferred policy acquisition costs ÏÏÏÏÏÏÏÏÏÏÏÏÏÏÏÏÏÏÏÏÏÏÏÏÏÏÏÏÏÏÏÏÏÏÏÏÏÏÏÏÏÏÏÏÏÏÏÏÏÏÏÏÏÏÏÏÏÏÏÏÏÏÏÏÏ 210.4 185.8Real estate assetsÏÏÏÏÏÏÏÏÏÏÏÏÏÏÏÏÏÏÏÏÏÏÏÏÏÏÏÏÏÏÏÏÏÏÏÏÏÏÏÏÏÏÏÏÏÏÏÏÏÏÏÏÏÏÏÏÏÏÏÏÏÏÏÏÏÏÏÏÏÏÏÏÏÏÏÏÏÏ 81.3 45.3Unrealized appreciation of investmentsÏÏÏÏÏÏÏÏÏÏÏÏÏÏÏÏÏÏÏÏÏÏÏÏÏÏÏÏÏÏÏÏÏÏÏÏÏÏÏÏÏÏÏÏÏÏÏÏÏÏÏÏÏÏÏÏÏÏÏÏ 215.5 128.6
Total ÏÏÏÏÏÏÏÏÏÏÏÏÏÏÏÏÏÏÏÏÏÏÏÏÏÏÏÏÏÏÏÏÏÏÏÏÏÏÏÏÏÏÏÏÏÏÏÏÏÏÏÏÏÏÏÏÏÏÏÏÏÏÏÏÏÏÏÏÏÏÏÏÏÏÏÏÏÏÏÏÏÏÏÏÏÏ 507.2 359.7
Net deferred income tax asset ÏÏÏÏÏÏÏÏÏÏÏÏÏÏÏÏÏÏÏÏÏÏÏÏÏÏÏÏÏÏÏÏÏÏÏÏÏÏÏÏÏÏÏÏÏÏÏÏÏÏÏÏÏÏÏÏÏÏÏÏÏÏÏ $317.0 $365.6
48
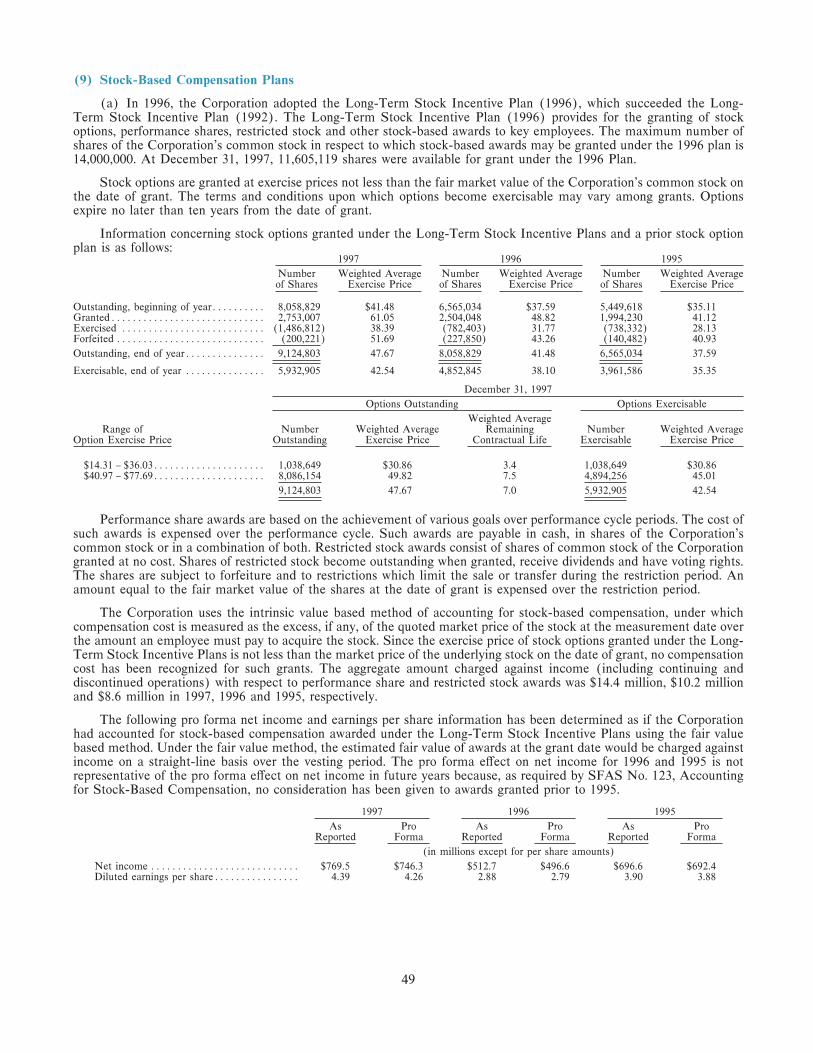
(9) Stock-Based Compensation Plans
(a) In 1996, the Corporation adopted the Long-Term Stock Incentive Plan (1996), which succeeded the Long-Term Stock Incentive Plan (1992). The Long-Term Stock Incentive Plan (1996) provides for the granting of stockoptions, performance shares, restricted stock and other stock-based awards to key employees. The maximum number ofshares of the Corporation's common stock in respect to which stock-based awards may be granted under the 1996 plan is14,000,000. At December 31, 1997, 11,605,119 shares were available for grant under the 1996 Plan.
Stock options are granted at exercise prices not less than the fair market value of the Corporation's common stock onthe date of grant. The terms and conditions upon which options become exercisable may vary among grants. Optionsexpire no later than ten years from the date of grant.
Information concerning stock options granted under the Long-Term Stock Incentive Plans and a prior stock optionplan is as follows:
1997 1996 1995
Number Weighted Average Number Weighted Average Number Weighted Averageof Shares Exercise Price of Shares Exercise Price of Shares Exercise Price
Outstanding, beginning of yearÏÏÏÏÏÏÏÏÏÏ 8,058,829 $41.48 6,565,034 $37.59 5,449,618 $35.11GrantedÏÏÏÏÏÏÏÏÏÏÏÏÏÏÏÏÏÏÏÏÏÏÏÏÏÏÏÏÏ 2,753,007 61.05 2,504,048 48.82 1,994,230 41.12Exercised ÏÏÏÏÏÏÏÏÏÏÏÏÏÏÏÏÏÏÏÏÏÏÏÏÏÏÏ (1,486,812) 38.39 (782,403) 31.77 (738,332) 28.13Forfeited ÏÏÏÏÏÏÏÏÏÏÏÏÏÏÏÏÏÏÏÏÏÏÏÏÏÏÏÏ (200,221) 51.69 (227,850) 43.26 (140,482) 40.93
Outstanding, end of yearÏÏÏÏÏÏÏÏÏÏÏÏÏÏÏ 9,124,803 47.67 8,058,829 41.48 6,565,034 37.59
Exercisable, end of year ÏÏÏÏÏÏÏÏÏÏÏÏÏÏÏ 5,932,905 42.54 4,852,845 38.10 3,961,586 35.35
December 31, 1997
Options Outstanding Options Exercisable
Weighted AverageRange of Number Weighted Average Remaining Number Weighted Average
Option Exercise Price Outstanding Exercise Price Contractual Life Exercisable Exercise Price
$14.31 Ó $36.03ÏÏÏÏÏÏÏÏÏÏÏÏÏÏÏÏÏÏÏÏÏ 1,038,649 $30.86 3.4 1,038,649 $30.86$40.97 Ó $77.69ÏÏÏÏÏÏÏÏÏÏÏÏÏÏÏÏÏÏÏÏÏ 8,086,154 49.82 7.5 4,894,256 45.01
9,124,803 47.67 7.0 5,932,905 42.54
Performance share awards are based on the achievement of various goals over performance cycle periods. The cost ofsuch awards is expensed over the performance cycle. Such awards are payable in cash, in shares of the Corporation'scommon stock or in a combination of both. Restricted stock awards consist of shares of common stock of the Corporationgranted at no cost. Shares of restricted stock become outstanding when granted, receive dividends and have voting rights.The shares are subject to forfeiture and to restrictions which limit the sale or transfer during the restriction period. Anamount equal to the fair market value of the shares at the date of grant is expensed over the restriction period.
The Corporation uses the intrinsic value based method of accounting for stock-based compensation, under whichcompensation cost is measured as the excess, if any, of the quoted market price of the stock at the measurement date overthe amount an employee must pay to acquire the stock. Since the exercise price of stock options granted under the Long-Term Stock Incentive Plans is not less than the market price of the underlying stock on the date of grant, no compensationcost has been recognized for such grants. The aggregate amount charged against income (including continuing anddiscontinued operations) with respect to performance share and restricted stock awards was $14.4 million, $10.2 millionand $8.6 million in 1997, 1996 and 1995, respectively.
The following pro forma net income and earnings per share information has been determined as if the Corporationhad accounted for stock-based compensation awarded under the Long-Term Stock Incentive Plans using the fair valuebased method. Under the fair value method, the estimated fair value of awards at the grant date would be charged againstincome on a straight-line basis over the vesting period. The pro forma eÅect on net income for 1996 and 1995 is notrepresentative of the pro forma eÅect on net income in future years because, as required by SFAS No. 123, Accountingfor Stock-Based Compensation, no consideration has been given to awards granted prior to 1995.
1997 1996 1995
As Pro As Pro As ProReported Forma Reported Forma Reported Forma
(in millions except for per share amounts)
Net income ÏÏÏÏÏÏÏÏÏÏÏÏÏÏÏÏÏÏÏÏÏÏÏÏÏÏÏÏ $769.5 $746.3 $512.7 $496.6 $696.6 $692.4Diluted earnings per shareÏÏÏÏÏÏÏÏÏÏÏÏÏÏÏÏ 4.39 4.26 2.88 2.79 3.90 3.88
49

The weighted average fair value of options granted The number of allocated and unallocated shares heldunder the Long-Term Stock Incentive Plans during 1997, by the ESOP at December 31, 1997 were 3,023,768 and1996 and 1995 were $13.83, $11.04 and $10.18, respec- 3,636,364, respectively. All such shares are consideredtively. The fair value of each option grant was estimated outstanding for the computation of earnings per share.on the date of grant using the Black-Scholes option-
(c) The Corporation has a Stock Purchase Plan underpricing model with the following weighted average as-which substantially all employees are eligible to purchasesumptions. The risk-free interest rates for 1997, 1996 andshares of the Corporation's common stock based on1995 were 6.5%, 5.9% and 6.3%, respectively. The ex-compensation. Shares are purchased at a price equal topected volatility of the market price of the Corporation'sthe fair market value on the date of grant. At Decem-common stock for 1997, 1996 and 1995 grants was 16.3%,ber 31, 1997, there were 469,326 subscribed shares at a18.3% and 19.3%, respectively. The expected averageprice of $52.81. The right to purchase such shares expiresterm of the granted options was 5 years for 1997 and 51/2in December 1998. No compensation cost has been rec-years for 1996 and 1995. The dividend yield was 1.9% forognized for such rights. Had the fair value method been1997 and 2.1% for 1996 and 1995.used, the cost would have been immaterial.
(b) The Corporation has a leveraged Employee Stock(10) Employee BeneÑts
Ownership Plan (ESOP) in which substantially all em-ployees are eligible to participate. At its inception in 1989,
(a) The Corporation and its subsidiaries have severalthe ESOP used the proceeds of a $150.0 million loan
non-contributory deÑned beneÑt pension plans coveringfrom the Corporation to purchase 7,792,204 newly issued
substantially all employees. The beneÑts are generallyshares of the Corporation's common stock. The loan is
based on an employee's years of service and averagedue in September 2004 and bears interest at 9%. The
compensation during the last Ñve years of employment.Corporation has recorded the receivable from the ESOP
Pension costs are determined using the projected unitas a separate reduction of shareholders' equity on the
credit method. The Corporation's policy is to make an-consolidated balance sheets. This balance is reduced as
nual contributions that meet the minimum funding re-repayments are made on the loan principal.
quirements of the Employee Retirement Income SecurityAct of 1974. Contributions are intended to provide not
The Corporation and its participating subsidiaries makeonly for beneÑts attributed to service to date but also for
semi-annual contributions to the ESOP in amounts deter-those expected to be earned in the future.
mined at the discretion of the Corporation's Board ofDirectors. The contributions, together with the dividends
The components of net pension cost (including contin-on the shares of common stock in the ESOP, are used by
uing and discontinued operations) were as follows:the ESOP to make loan interest and principal payments
Years Ended December 31to the Corporation. As interest and principal are paid, a
1997 1996 1995portion of the common stock is allocated to eligible
(in millions)employees.
Service cost of current periodÏÏÏÏÏÏ $ 19.9 $ 20.6 $ 20.4
Interest cost on projectedThe Corporation uses the cash payment method of benefit obligationÏÏÏÏÏÏÏÏÏÏÏÏÏÏ 30.3 26.0 23.8
recognizing ESOP expense. In 1997, 1996 and 1995, cash Actual return on plan assets ÏÏÏÏÏÏÏ (78.7) (49.1) (68.5)
Net amortization and deferral ÏÏÏÏÏ 41.6 17.5 42.7contributions to the ESOP of $12.2 million, $12.7 millionNet pension cost ÏÏÏÏÏÏÏÏÏÏÏ $ 13.1 $ 15.0 $ 18.4and $12.3 million, respectively, were charged against
income (including continuing and discontinued opera-The decrease in net pension cost in 1996 was duetions). Dividends on shares of common stock in the
primarily to the reduction, eÅective January 1, 1996, inESOP used for debt service were $6.2 million, $4.6 mil-the assumed rate of increase in future compensationlion and $4.5 million in 1997, 1996 and 1995, respectively.levels.
50
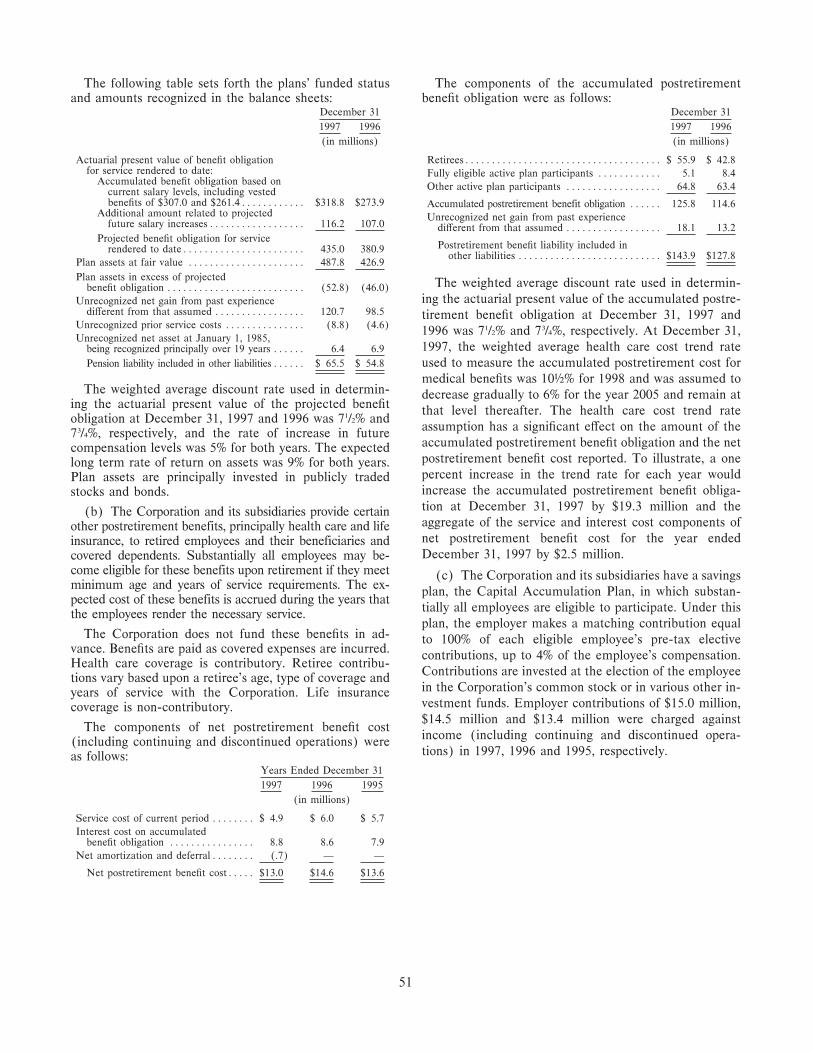
The following table sets forth the plans' funded status The components of the accumulated postretirementand amounts recognized in the balance sheets: beneÑt obligation were as follows:
December 31 December 31
1997 1996 1997 1996
(in millions) (in millions)
Actuarial present value of beneÑt obligation RetireesÏÏÏÏÏÏÏÏÏÏÏÏÏÏÏÏÏÏÏÏÏÏÏÏÏÏÏÏÏÏÏÏÏÏÏÏÏ $ 55.9 $ 42.8for service rendered to date: Fully eligible active plan participants ÏÏÏÏÏÏÏÏÏÏÏÏ 5.1 8.4
Accumulated beneÑt obligation based onOther active plan participants ÏÏÏÏÏÏÏÏÏÏÏÏÏÏÏÏÏÏ 64.8 63.4
current salary levels, including vestedbeneÑts of $307.0 and $261.4ÏÏÏÏÏÏÏÏÏÏÏÏ $318.8 $273.9 Accumulated postretirement benefit obligation ÏÏÏÏÏÏ 125.8 114.6
Additional amount related to projected Unrecognized net gain from past experiencefuture salary increasesÏÏÏÏÏÏÏÏÏÏÏÏÏÏÏÏÏÏ 116.2 107.0 diÅerent from that assumed ÏÏÏÏÏÏÏÏÏÏÏÏÏÏÏÏÏÏ 18.1 13.2
Projected beneÑt obligation for servicePostretirement beneÑt liability included inrendered to dateÏÏÏÏÏÏÏÏÏÏÏÏÏÏÏÏÏÏÏÏÏÏÏ 435.0 380.9
other liabilities ÏÏÏÏÏÏÏÏÏÏÏÏÏÏÏÏÏÏÏÏÏÏÏÏÏÏÏ $143.9 $127.8Plan assets at fair value ÏÏÏÏÏÏÏÏÏÏÏÏÏÏÏÏÏÏÏÏÏÏ 487.8 426.9
Plan assets in excess of projectedThe weighted average discount rate used in determin-beneÑt obligation ÏÏÏÏÏÏÏÏÏÏÏÏÏÏÏÏÏÏÏÏÏÏÏÏÏÏ (52.8) (46.0)
ing the actuarial present value of the accumulated postre-Unrecognized net gain from past experiencediÅerent from that assumed ÏÏÏÏÏÏÏÏÏÏÏÏÏÏÏÏÏ 120.7 98.5 tirement beneÑt obligation at December 31, 1997 and
Unrecognized prior service costs ÏÏÏÏÏÏÏÏÏÏÏÏÏÏÏ (8.8) (4.6)1996 was 71/2% and 73/4%, respectively. At December 31,
Unrecognized net asset at January 1, 1985,1997, the weighted average health care cost trend ratebeing recognized principally over 19 years ÏÏÏÏÏÏ 6.4 6.9
Pension liability included in other liabilitiesÏÏÏÏÏÏ $ 65.5 $ 54.8 used to measure the accumulated postretirement cost formedical beneÑts was 10¥% for 1998 and was assumed to
The weighted average discount rate used in determin- decrease gradually to 6% for the year 2005 and remain ating the actuarial present value of the projected beneÑt
that level thereafter. The health care cost trend rateobligation at December 31, 1997 and 1996 was 71/2% and
assumption has a signiÑcant eÅect on the amount of the73/4%, respectively, and the rate of increase in future
accumulated postretirement beneÑt obligation and the netcompensation levels was 5% for both years. The expectedpostretirement beneÑt cost reported. To illustrate, a onelong term rate of return on assets was 9% for both years.percent increase in the trend rate for each year wouldPlan assets are principally invested in publicly tradedincrease the accumulated postretirement beneÑt obliga-stocks and bonds.tion at December 31, 1997 by $19.3 million and the(b) The Corporation and its subsidiaries provide certainaggregate of the service and interest cost components ofother postretirement benefits, principally health care and lifenet postretirement beneÑt cost for the year endedinsurance, to retired employees and their beneficiaries andDecember 31, 1997 by $2.5 million.covered dependents. Substantially all employees may be-
come eligible for these benefits upon retirement if they meet (c) The Corporation and its subsidiaries have a savingsminimum age and years of service requirements. The ex-
plan, the Capital Accumulation Plan, in which substan-pected cost of these benefits is accrued during the years that
tially all employees are eligible to participate. Under thisthe employees render the necessary service.
plan, the employer makes a matching contribution equalThe Corporation does not fund these beneÑts in ad- to 100% of each eligible employee's pre-tax elective
vance. BeneÑts are paid as covered expenses are incurred.contributions, up to 4% of the employee's compensation.
Health care coverage is contributory. Retiree contribu-Contributions are invested at the election of the employee
tions vary based upon a retiree's age, type of coverage andin the Corporation's common stock or in various other in-years of service with the Corporation. Life insurancevestment funds. Employer contributions of $15.0 million,coverage is non-contributory.$14.5 million and $13.4 million were charged against
The components of net postretirement beneÑt costincome (including continuing and discontinued opera-
(including continuing and discontinued operations) weretions) in 1997, 1996 and 1995, respectively.as follows:
Years Ended December 31
1997 1996 1995
(in millions)
Service cost of current period ÏÏÏÏÏÏÏÏ $ 4.9 $ 6.0 $ 5.7
Interest cost on accumulatedbeneÑt obligation ÏÏÏÏÏÏÏÏÏÏÏÏÏÏÏÏ 8.8 8.6 7.9
Net amortization and deferralÏÏÏÏÏÏÏÏ (.7) Ì Ì
Net postretirement beneÑt costÏÏÏÏÏ $13.0 $14.6 $13.6
51
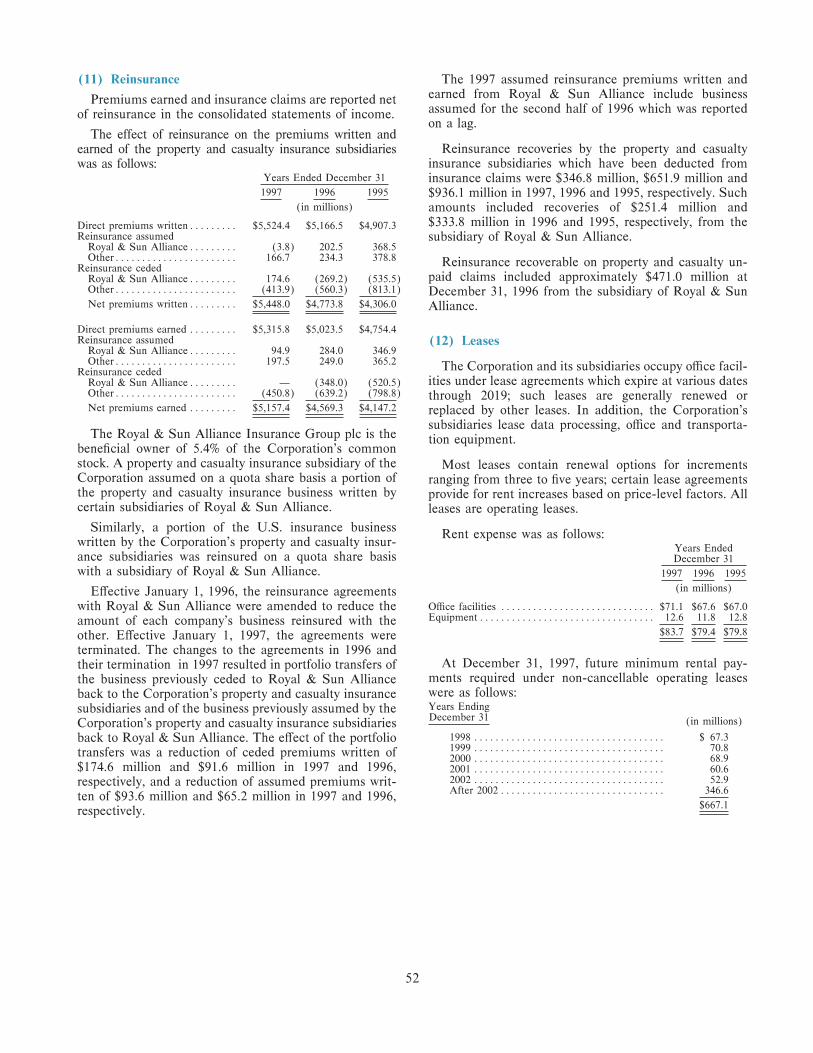
(11) Reinsurance The 1997 assumed reinsurance premiums written andearned from Royal & Sun Alliance include businessPremiums earned and insurance claims are reported netassumed for the second half of 1996 which was reportedof reinsurance in the consolidated statements of income.on a lag.
The effect of reinsurance on the premiums written andReinsurance recoveries by the property and casualtyearned of the property and casualty insurance subsidiaries
insurance subsidiaries which have been deducted fromwas as follows:Years Ended December 31 insurance claims were $346.8 million, $651.9 million and1997 1996 1995 $936.1 million in 1997, 1996 and 1995, respectively. Such
(in millions) amounts included recoveries of $251.4 million and$333.8 million in 1996 and 1995, respectively, from theDirect premiums writtenÏÏÏÏÏÏÏÏÏ $5,524.4 $5,166.5 $4,907.3
Reinsurance assumed subsidiary of Royal & Sun Alliance.Royal & Sun AllianceÏÏÏÏÏÏÏÏÏ (3.8) 202.5 368.5OtherÏÏÏÏÏÏÏÏÏÏÏÏÏÏÏÏÏÏÏÏÏÏÏ 166.7 234.3 378.8 Reinsurance recoverable on property and casualty un-
Reinsurance cededpaid claims included approximately $471.0 million atRoyal & Sun AllianceÏÏÏÏÏÏÏÏÏ 174.6 (269.2) (535.5)
OtherÏÏÏÏÏÏÏÏÏÏÏÏÏÏÏÏÏÏÏÏÏÏÏ (413.9) (560.3) (813.1) December 31, 1996 from the subsidiary of Royal & SunNet premiums writtenÏÏÏÏÏÏÏÏÏ $5,448.0 $4,773.8 $4,306.0 Alliance.
Direct premiums earned ÏÏÏÏÏÏÏÏÏ $5,315.8 $5,023.5 $4,754.4Reinsurance assumed (12) Leases
Royal & Sun AllianceÏÏÏÏÏÏÏÏÏ 94.9 284.0 346.9OtherÏÏÏÏÏÏÏÏÏÏÏÏÏÏÏÏÏÏÏÏÏÏÏ 197.5 249.0 365.2 The Corporation and its subsidiaries occupy oÇce facil-Reinsurance ceded
ities under lease agreements which expire at various datesRoyal & Sun AllianceÏÏÏÏÏÏÏÏÏ Ì (348.0) (520.5)OtherÏÏÏÏÏÏÏÏÏÏÏÏÏÏÏÏÏÏÏÏÏÏÏ (450.8) (639.2) (798.8) through 2019; such leases are generally renewed orNet premiums earned ÏÏÏÏÏÏÏÏÏ $5,157.4 $4,569.3 $4,147.2 replaced by other leases. In addition, the Corporation's
subsidiaries lease data processing, oÇce and transporta-The Royal & Sun Alliance Insurance Group plc is the tion equipment.
beneÑcial owner of 5.4% of the Corporation's commonstock. A property and casualty insurance subsidiary of the Most leases contain renewal options for incrementsCorporation assumed on a quota share basis a portion of ranging from three to Ñve years; certain lease agreementsthe property and casualty insurance business written by provide for rent increases based on price-level factors. Allcertain subsidiaries of Royal & Sun Alliance. leases are operating leases.
Similarly, a portion of the U.S. insurance businessRent expense was as follows:
written by the Corporation's property and casualty insur-Years Ended
ance subsidiaries was reinsured on a quota share basis December 31with a subsidiary of Royal & Sun Alliance. 1997 1996 1995
(in millions)EÅective January 1, 1996, the reinsurance agreementsOÇce facilities ÏÏÏÏÏÏÏÏÏÏÏÏÏÏÏÏÏÏÏÏÏÏÏÏÏÏÏÏÏ $71.1 $67.6 $67.0with Royal & Sun Alliance were amended to reduce theEquipmentÏÏÏÏÏÏÏÏÏÏÏÏÏÏÏÏÏÏÏÏÏÏÏÏÏÏÏÏÏÏÏÏÏ 12.6 11.8 12.8amount of each company's business reinsured with the
$83.7 $79.4 $79.8other. EÅective January 1, 1997, the agreements wereterminated. The changes to the agreements in 1996 and
At December 31, 1997, future minimum rental pay-their termination in 1997 resulted in portfolio transfers ofments required under non-cancellable operating leasesthe business previously ceded to Royal & Sun Alliancewere as follows:back to the Corporation's property and casualty insuranceYears Endingsubsidiaries and of the business previously assumed by theDecember 31 (in millions)Corporation's property and casualty insurance subsidiaries
1998 ÏÏÏÏÏÏÏÏÏÏÏÏÏÏÏÏÏÏÏÏÏÏÏÏÏÏÏÏÏÏÏÏÏÏÏÏ $ 67.3back to Royal & Sun Alliance. The eÅect of the portfolio1999 ÏÏÏÏÏÏÏÏÏÏÏÏÏÏÏÏÏÏÏÏÏÏÏÏÏÏÏÏÏÏÏÏÏÏÏÏ 70.8transfers was a reduction of ceded premiums written of2000 ÏÏÏÏÏÏÏÏÏÏÏÏÏÏÏÏÏÏÏÏÏÏÏÏÏÏÏÏÏÏÏÏÏÏÏÏ 68.9
$174.6 million and $91.6 million in 1997 and 1996, 2001 ÏÏÏÏÏÏÏÏÏÏÏÏÏÏÏÏÏÏÏÏÏÏÏÏÏÏÏÏÏÏÏÏÏÏÏÏ 60.62002 ÏÏÏÏÏÏÏÏÏÏÏÏÏÏÏÏÏÏÏÏÏÏÏÏÏÏÏÏÏÏÏÏÏÏÏÏ 52.9respectively, and a reduction of assumed premiums writ-After 2002 ÏÏÏÏÏÏÏÏÏÏÏÏÏÏÏÏÏÏÏÏÏÏÏÏÏÏÏÏÏÏÏ 346.6
ten of $93.6 million and $65.2 million in 1997 and 1996,$667.1
respectively.
52
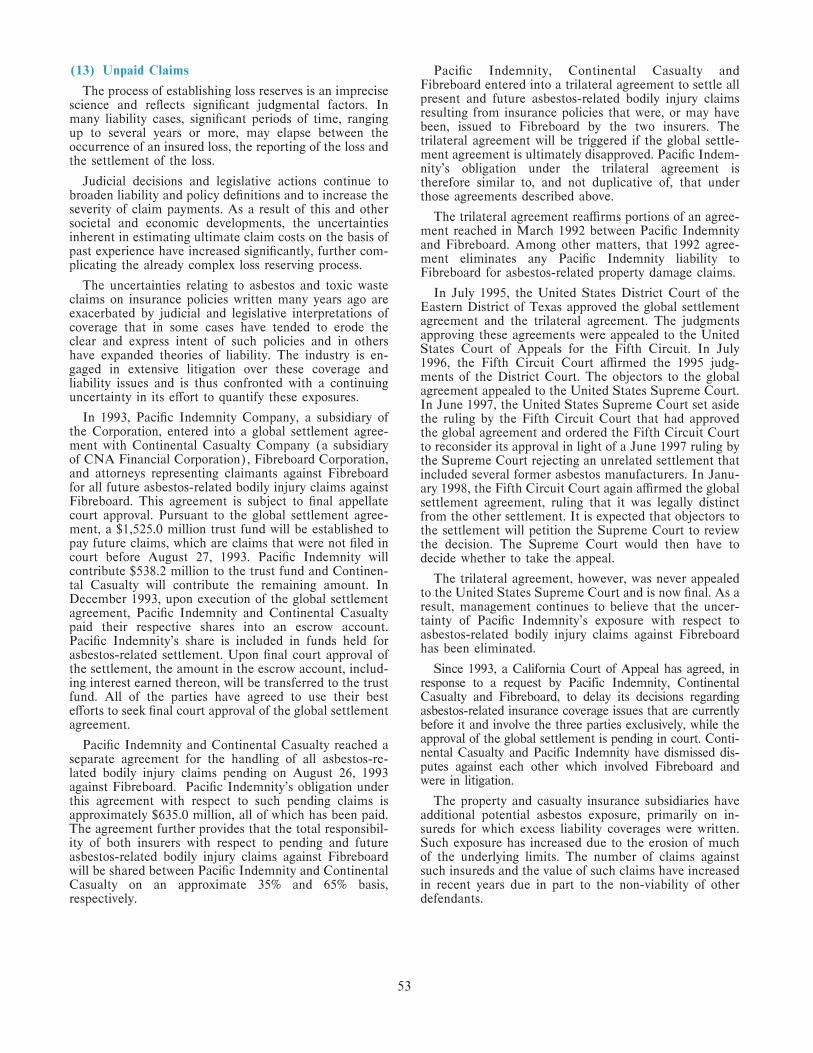
(13) Unpaid Claims PaciÑc Indemnity, Continental Casualty andFibreboard entered into a trilateral agreement to settle allThe process of establishing loss reserves is an imprecisepresent and future asbestos-related bodily injury claimsscience and reÖects signiÑcant judgmental factors. Inresulting from insurance policies that were, or may havemany liability cases, signiÑcant periods of time, rangingbeen, issued to Fibreboard by the two insurers. Theup to several years or more, may elapse between thetrilateral agreement will be triggered if the global settle-occurrence of an insured loss, the reporting of the loss andment agreement is ultimately disapproved. PaciÑc Indem-the settlement of the loss.nity's obligation under the trilateral agreement is
Judicial decisions and legislative actions continue to therefore similar to, and not duplicative of, that underbroaden liability and policy deÑnitions and to increase the those agreements described above.severity of claim payments. As a result of this and other
The trilateral agreement reaÇrms portions of an agree-societal and economic developments, the uncertaintiesment reached in March 1992 between PaciÑc Indemnityinherent in estimating ultimate claim costs on the basis ofand Fibreboard. Among other matters, that 1992 agree-past experience have increased signiÑcantly, further com-ment eliminates any PaciÑc Indemnity liability toplicating the already complex loss reserving process.Fibreboard for asbestos-related property damage claims.
The uncertainties relating to asbestos and toxic wasteIn July 1995, the United States District Court of theclaims on insurance policies written many years ago are
Eastern District of Texas approved the global settlementexacerbated by judicial and legislative interpretations ofagreement and the trilateral agreement. The judgmentscoverage that in some cases have tended to erode theapproving these agreements were appealed to the Unitedclear and express intent of such policies and in othersStates Court of Appeals for the Fifth Circuit. In Julyhave expanded theories of liability. The industry is en-1996, the Fifth Circuit Court aÇrmed the 1995 judg-gaged in extensive litigation over these coverage andments of the District Court. The objectors to the globalliability issues and is thus confronted with a continuingagreement appealed to the United States Supreme Court.uncertainty in its eÅort to quantify these exposures.In June 1997, the United States Supreme Court set aside
In 1993, PaciÑc Indemnity Company, a subsidiary of the ruling by the Fifth Circuit Court that had approvedthe Corporation, entered into a global settlement agree- the global agreement and ordered the Fifth Circuit Courtment with Continental Casualty Company (a subsidiary to reconsider its approval in light of a June 1997 ruling byof CNA Financial Corporation), Fibreboard Corporation, the Supreme Court rejecting an unrelated settlement thatand attorneys representing claimants against Fibreboard included several former asbestos manufacturers. In Janu-for all future asbestos-related bodily injury claims against ary 1998, the Fifth Circuit Court again aÇrmed the globalFibreboard. This agreement is subject to Ñnal appellate settlement agreement, ruling that it was legally distinctcourt approval. Pursuant to the global settlement agree- from the other settlement. It is expected that objectors toment, a $1,525.0 million trust fund will be established to the settlement will petition the Supreme Court to reviewpay future claims, which are claims that were not Ñled in the decision. The Supreme Court would then have tocourt before August 27, 1993. PaciÑc Indemnity will decide whether to take the appeal.contribute $538.2 million to the trust fund and Continen-
The trilateral agreement, however, was never appealedtal Casualty will contribute the remaining amount. Into the United States Supreme Court and is now Ñnal. As aDecember 1993, upon execution of the global settlementresult, management continues to believe that the uncer-agreement, PaciÑc Indemnity and Continental Casualtytainty of PaciÑc Indemnity's exposure with respect topaid their respective shares into an escrow account.asbestos-related bodily injury claims against FibreboardPaciÑc Indemnity's share is included in funds held forhas been eliminated.asbestos-related settlement. Upon Ñnal court approval of
the settlement, the amount in the escrow account, includ- Since 1993, a California Court of Appeal has agreed, ining interest earned thereon, will be transferred to the trust response to a request by Pacific Indemnity, Continentalfund. All of the parties have agreed to use their best Casualty and Fibreboard, to delay its decisions regardingeÅorts to seek Ñnal court approval of the global settlement asbestos-related insurance coverage issues that are currentlyagreement. before it and involve the three parties exclusively, while the
approval of the global settlement is pending in court. Conti-PaciÑc Indemnity and Continental Casualty reached anental Casualty and Pacific Indemnity have dismissed dis-separate agreement for the handling of all asbestos-re-putes against each other which involved Fibreboard andlated bodily injury claims pending on August 26, 1993were in litigation.against Fibreboard. PaciÑc Indemnity's obligation under
this agreement with respect to such pending claims is The property and casualty insurance subsidiaries haveapproximately $635.0 million, all of which has been paid. additional potential asbestos exposure, primarily on in-The agreement further provides that the total responsibil- sureds for which excess liability coverages were written.ity of both insurers with respect to pending and future Such exposure has increased due to the erosion of muchasbestos-related bodily injury claims against Fibreboard of the underlying limits. The number of claims againstwill be shared between PaciÑc Indemnity and Continental such insureds and the value of such claims have increasedCasualty on an approximate 35% and 65% basis, in recent years due in part to the non-viability of otherrespectively. defendants.
53
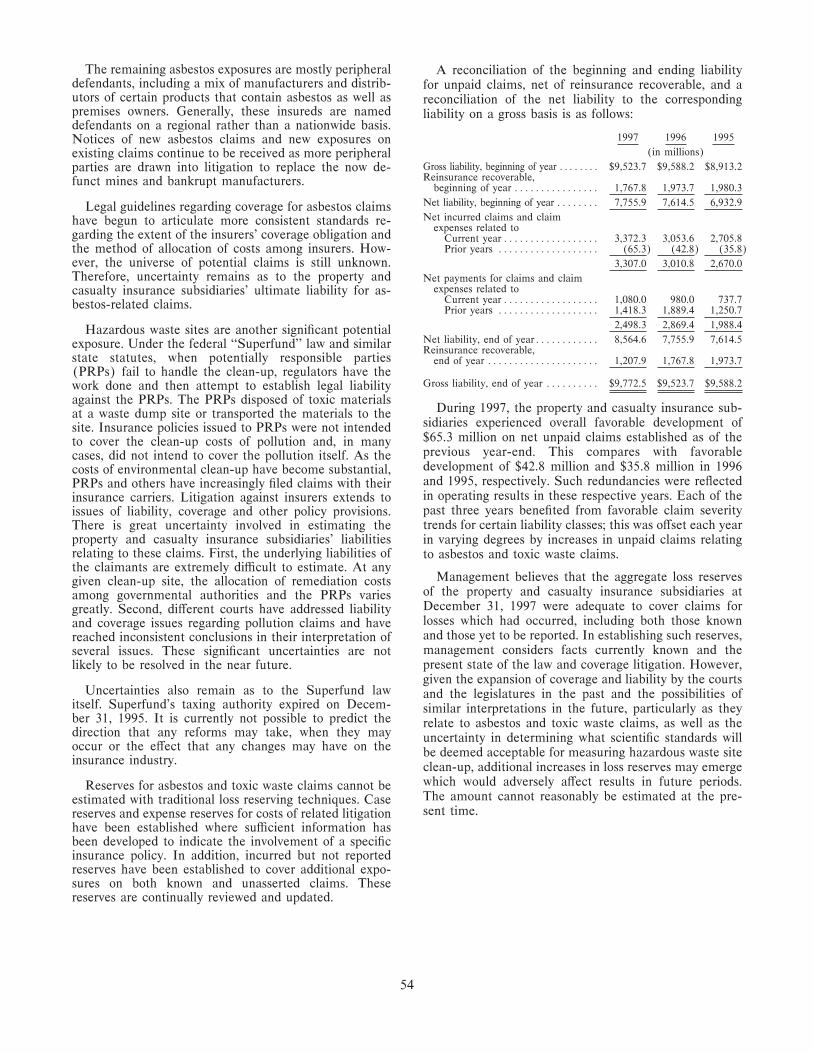
The remaining asbestos exposures are mostly peripheral A reconciliation of the beginning and ending liabilitydefendants, including a mix of manufacturers and distrib- for unpaid claims, net of reinsurance recoverable, and autors of certain products that contain asbestos as well as reconciliation of the net liability to the correspondingpremises owners. Generally, these insureds are named liability on a gross basis is as follows:defendants on a regional rather than a nationwide basis.
1997 1996 1995Notices of new asbestos claims and new exposures on(in millions)existing claims continue to be received as more peripheral
Gross liability, beginning of year ÏÏÏÏÏÏÏÏ $9,523.7 $9,588.2 $8,913.2parties are drawn into litigation to replace the now de-Reinsurance recoverable,funct mines and bankrupt manufacturers.
beginning of year ÏÏÏÏÏÏÏÏÏÏÏÏÏÏÏÏ 1,767.8 1,973.7 1,980.3
Net liability, beginning of year ÏÏÏÏÏÏÏÏ 7,755.9 7,614.5 6,932.9Legal guidelines regarding coverage for asbestos claimsNet incurred claims and claimhave begun to articulate more consistent standards re-
expenses related togarding the extent of the insurers' coverage obligation and Current year ÏÏÏÏÏÏÏÏÏÏÏÏÏÏÏÏÏÏ 3,372.3 3,053.6 2,705.8
Prior years ÏÏÏÏÏÏÏÏÏÏÏÏÏÏÏÏÏÏÏ (65.3) (42.8) (35.8)the method of allocation of costs among insurers. How-ever, the universe of potential claims is still unknown. 3,307.0 3,010.8 2,670.0
Therefore, uncertainty remains as to the property and Net payments for claims and claimexpenses related tocasualty insurance subsidiaries' ultimate liability for as-
Current year ÏÏÏÏÏÏÏÏÏÏÏÏÏÏÏÏÏÏ 1,080.0 980.0 737.7bestos-related claims. Prior years ÏÏÏÏÏÏÏÏÏÏÏÏÏÏÏÏÏÏÏ 1,418.3 1,889.4 1,250.7
2,498.3 2,869.4 1,988.4Hazardous waste sites are another signiÑcant potentialNet liability, end of yearÏÏÏÏÏÏÏÏÏÏÏÏ 8,564.6 7,755.9 7,614.5exposure. Under the federal ""Superfund'' law and similarReinsurance recoverable,
state statutes, when potentially responsible parties end of year ÏÏÏÏÏÏÏÏÏÏÏÏÏÏÏÏÏÏÏÏÏ 1,207.9 1,767.8 1,973.7(PRPs) fail to handle the clean-up, regulators have the
Gross liability, end of year ÏÏÏÏÏÏÏÏÏÏ $9,772.5 $9,523.7 $9,588.2work done and then attempt to establish legal liabilityagainst the PRPs. The PRPs disposed of toxic materials
During 1997, the property and casualty insurance sub-at a waste dump site or transported the materials to thesidiaries experienced overall favorable development ofsite. Insurance policies issued to PRPs were not intended$65.3 million on net unpaid claims established as of theto cover the clean-up costs of pollution and, in manyprevious year-end. This compares with favorablecases, did not intend to cover the pollution itself. As thedevelopment of $42.8 million and $35.8 million in 1996costs of environmental clean-up have become substantial,and 1995, respectively. Such redundancies were reÖectedPRPs and others have increasingly Ñled claims with theirin operating results in these respective years. Each of theinsurance carriers. Litigation against insurers extends topast three years beneÑted from favorable claim severityissues of liability, coverage and other policy provisions.trends for certain liability classes; this was oÅset each yearThere is great uncertainty involved in estimating the
property and casualty insurance subsidiaries' liabilities in varying degrees by increases in unpaid claims relatingrelating to these claims. First, the underlying liabilities of to asbestos and toxic waste claims.the claimants are extremely diÇcult to estimate. At any
Management believes that the aggregate loss reservesgiven clean-up site, the allocation of remediation costsof the property and casualty insurance subsidiaries atamong governmental authorities and the PRPs variesDecember 31, 1997 were adequate to cover claims forgreatly. Second, diÅerent courts have addressed liabilitylosses which had occurred, including both those knownand coverage issues regarding pollution claims and haveand those yet to be reported. In establishing such reserves,reached inconsistent conclusions in their interpretation ofmanagement considers facts currently known and theseveral issues. These signiÑcant uncertainties are notpresent state of the law and coverage litigation. However,likely to be resolved in the near future.given the expansion of coverage and liability by the courts
Uncertainties also remain as to the Superfund law and the legislatures in the past and the possibilities ofitself. Superfund's taxing authority expired on Decem- similar interpretations in the future, particularly as theyber 31, 1995. It is currently not possible to predict the relate to asbestos and toxic waste claims, as well as thedirection that any reforms may take, when they may uncertainty in determining what scientiÑc standards willoccur or the eÅect that any changes may have on the be deemed acceptable for measuring hazardous waste siteinsurance industry.
clean-up, additional increases in loss reserves may emergewhich would adversely aÅect results in future periods.Reserves for asbestos and toxic waste claims cannot beThe amount cannot reasonably be estimated at the pre-estimated with traditional loss reserving techniques. Casesent time.reserves and expense reserves for costs of related litigation
have been established where suÇcient information hasbeen developed to indicate the involvement of a speciÑcinsurance policy. In addition, incurred but not reportedreserves have been established to cover additional expo-sures on both known and unasserted claims. Thesereserves are continually reviewed and updated.
54
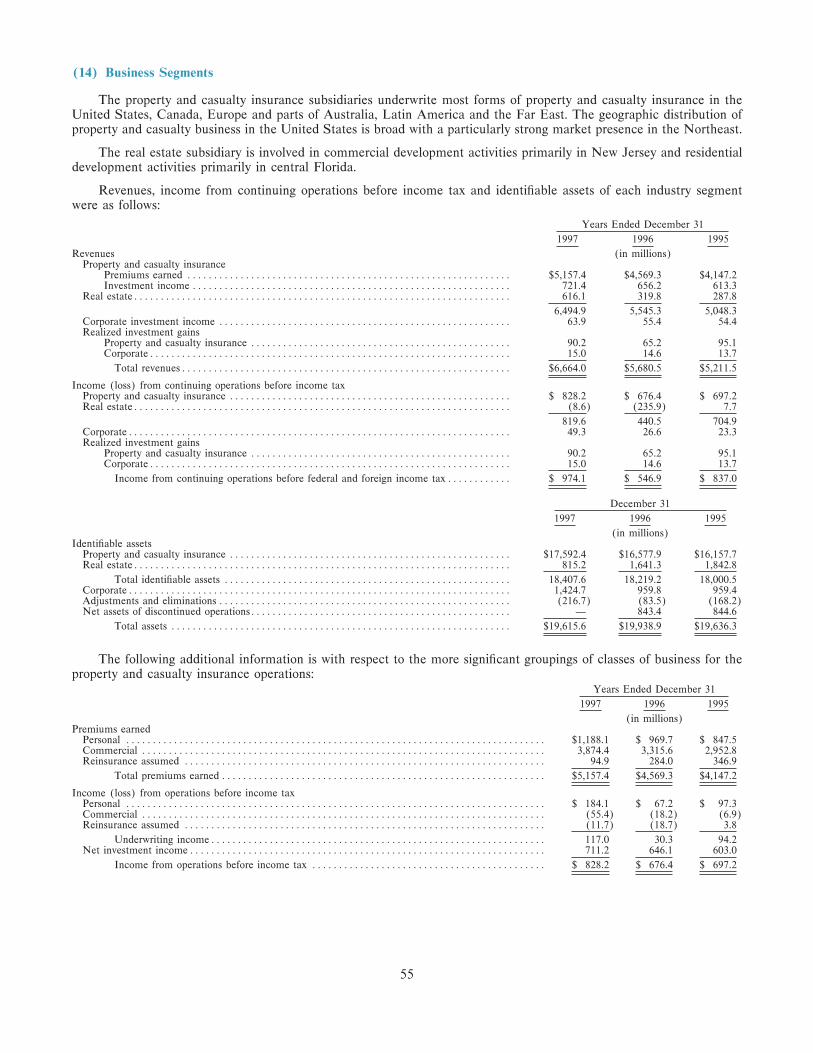
(14) Business Segments
The property and casualty insurance subsidiaries underwrite most forms of property and casualty insurance in theUnited States, Canada, Europe and parts of Australia, Latin America and the Far East. The geographic distribution ofproperty and casualty business in the United States is broad with a particularly strong market presence in the Northeast.
The real estate subsidiary is involved in commercial development activities primarily in New Jersey and residentialdevelopment activities primarily in central Florida.
Revenues, income from continuing operations before income tax and identiÑable assets of each industry segmentwere as follows:
Years Ended December 31
1997 1996 1995
Revenues (in millions)Property and casualty insurance
Premiums earned ÏÏÏÏÏÏÏÏÏÏÏÏÏÏÏÏÏÏÏÏÏÏÏÏÏÏÏÏÏÏÏÏÏÏÏÏÏÏÏÏÏÏÏÏÏÏÏÏÏÏÏÏÏÏÏÏÏÏÏÏÏ $5,157.4 $4,569.3 $4,147.2Investment income ÏÏÏÏÏÏÏÏÏÏÏÏÏÏÏÏÏÏÏÏÏÏÏÏÏÏÏÏÏÏÏÏÏÏÏÏÏÏÏÏÏÏÏÏÏÏÏÏÏÏÏÏÏÏÏÏÏÏÏÏ 721.4 656.2 613.3
Real estateÏÏÏÏÏÏÏÏÏÏÏÏÏÏÏÏÏÏÏÏÏÏÏÏÏÏÏÏÏÏÏÏÏÏÏÏÏÏÏÏÏÏÏÏÏÏÏÏÏÏÏÏÏÏÏÏÏÏÏÏÏÏÏÏÏÏÏÏÏÏÏ 616.1 319.8 287.8
6,494.9 5,545.3 5,048.3Corporate investment income ÏÏÏÏÏÏÏÏÏÏÏÏÏÏÏÏÏÏÏÏÏÏÏÏÏÏÏÏÏÏÏÏÏÏÏÏÏÏÏÏÏÏÏÏÏÏÏÏÏÏÏÏÏÏÏ 63.9 55.4 54.4Realized investment gains
Property and casualty insurance ÏÏÏÏÏÏÏÏÏÏÏÏÏÏÏÏÏÏÏÏÏÏÏÏÏÏÏÏÏÏÏÏÏÏÏÏÏÏÏÏÏÏÏÏÏÏÏÏÏ 90.2 65.2 95.1CorporateÏÏÏÏÏÏÏÏÏÏÏÏÏÏÏÏÏÏÏÏÏÏÏÏÏÏÏÏÏÏÏÏÏÏÏÏÏÏÏÏÏÏÏÏÏÏÏÏÏÏÏÏÏÏÏÏÏÏÏÏÏÏÏÏÏÏÏÏ 15.0 14.6 13.7
Total revenuesÏÏÏÏÏÏÏÏÏÏÏÏÏÏÏÏÏÏÏÏÏÏÏÏÏÏÏÏÏÏÏÏÏÏÏÏÏÏÏÏÏÏÏÏÏÏÏÏÏÏÏÏÏÏÏÏÏÏÏÏÏÏ $6,664.0 $5,680.5 $5,211.5
Income (loss) from continuing operations before income taxProperty and casualty insurance ÏÏÏÏÏÏÏÏÏÏÏÏÏÏÏÏÏÏÏÏÏÏÏÏÏÏÏÏÏÏÏÏÏÏÏÏÏÏÏÏÏÏÏÏÏÏÏÏÏÏÏÏÏ $ 828.2 $ 676.4 $ 697.2Real estateÏÏÏÏÏÏÏÏÏÏÏÏÏÏÏÏÏÏÏÏÏÏÏÏÏÏÏÏÏÏÏÏÏÏÏÏÏÏÏÏÏÏÏÏÏÏÏÏÏÏÏÏÏÏÏÏÏÏÏÏÏÏÏÏÏÏÏÏÏÏÏ (8.6) (235.9) 7.7
819.6 440.5 704.9CorporateÏÏÏÏÏÏÏÏÏÏÏÏÏÏÏÏÏÏÏÏÏÏÏÏÏÏÏÏÏÏÏÏÏÏÏÏÏÏÏÏÏÏÏÏÏÏÏÏÏÏÏÏÏÏÏÏÏÏÏÏÏÏÏÏÏÏÏÏÏÏÏÏ 49.3 26.6 23.3Realized investment gains
Property and casualty insurance ÏÏÏÏÏÏÏÏÏÏÏÏÏÏÏÏÏÏÏÏÏÏÏÏÏÏÏÏÏÏÏÏÏÏÏÏÏÏÏÏÏÏÏÏÏÏÏÏÏ 90.2 65.2 95.1CorporateÏÏÏÏÏÏÏÏÏÏÏÏÏÏÏÏÏÏÏÏÏÏÏÏÏÏÏÏÏÏÏÏÏÏÏÏÏÏÏÏÏÏÏÏÏÏÏÏÏÏÏÏÏÏÏÏÏÏÏÏÏÏÏÏÏÏÏÏ 15.0 14.6 13.7
Income from continuing operations before federal and foreign income tax ÏÏÏÏÏÏÏÏÏÏÏÏ $ 974.1 $ 546.9 $ 837.0
December 31
1997 1996 1995
(in millions)IdentiÑable assets
Property and casualty insurance ÏÏÏÏÏÏÏÏÏÏÏÏÏÏÏÏÏÏÏÏÏÏÏÏÏÏÏÏÏÏÏÏÏÏÏÏÏÏÏÏÏÏÏÏÏÏÏÏÏÏÏÏÏ $17,592.4 $16,577.9 $16,157.7Real estateÏÏÏÏÏÏÏÏÏÏÏÏÏÏÏÏÏÏÏÏÏÏÏÏÏÏÏÏÏÏÏÏÏÏÏÏÏÏÏÏÏÏÏÏÏÏÏÏÏÏÏÏÏÏÏÏÏÏÏÏÏÏÏÏÏÏÏÏÏÏÏ 815.2 1,641.3 1,842.8
Total identiÑable assets ÏÏÏÏÏÏÏÏÏÏÏÏÏÏÏÏÏÏÏÏÏÏÏÏÏÏÏÏÏÏÏÏÏÏÏÏÏÏÏÏÏÏÏÏÏÏÏÏÏÏÏÏÏÏ 18,407.6 18,219.2 18,000.5CorporateÏÏÏÏÏÏÏÏÏÏÏÏÏÏÏÏÏÏÏÏÏÏÏÏÏÏÏÏÏÏÏÏÏÏÏÏÏÏÏÏÏÏÏÏÏÏÏÏÏÏÏÏÏÏÏÏÏÏÏÏÏÏÏÏÏÏÏÏÏÏÏÏ 1,424.7 959.8 959.4Adjustments and eliminations ÏÏÏÏÏÏÏÏÏÏÏÏÏÏÏÏÏÏÏÏÏÏÏÏÏÏÏÏÏÏÏÏÏÏÏÏÏÏÏÏÏÏÏÏÏÏÏÏÏÏÏÏÏÏÏ (216.7) (83.5) (168.2)Net assets of discontinued operationsÏÏÏÏÏÏÏÏÏÏÏÏÏÏÏÏÏÏÏÏÏÏÏÏÏÏÏÏÏÏÏÏÏÏÏÏÏÏÏÏÏÏÏÏÏÏÏÏÏ Ì 843.4 844.6
Total assets ÏÏÏÏÏÏÏÏÏÏÏÏÏÏÏÏÏÏÏÏÏÏÏÏÏÏÏÏÏÏÏÏÏÏÏÏÏÏÏÏÏÏÏÏÏÏÏÏÏÏÏÏÏÏÏÏÏÏÏÏÏÏÏÏ $19,615.6 $19,938.9 $19,636.3
The following additional information is with respect to the more signiÑcant groupings of classes of business for theproperty and casualty insurance operations:
Years Ended December 31
1997 1996 1995
(in millions)Premiums earned
Personal ÏÏÏÏÏÏÏÏÏÏÏÏÏÏÏÏÏÏÏÏÏÏÏÏÏÏÏÏÏÏÏÏÏÏÏÏÏÏÏÏÏÏÏÏÏÏÏÏÏÏÏÏÏÏÏÏÏÏÏÏÏÏÏÏÏÏÏÏÏÏÏÏÏÏÏÏÏÏÏ $1,188.1 $ 969.7 $ 847.5Commercial ÏÏÏÏÏÏÏÏÏÏÏÏÏÏÏÏÏÏÏÏÏÏÏÏÏÏÏÏÏÏÏÏÏÏÏÏÏÏÏÏÏÏÏÏÏÏÏÏÏÏÏÏÏÏÏÏÏÏÏÏÏÏÏÏÏÏÏÏÏÏÏÏÏÏÏÏ 3,874.4 3,315.6 2,952.8Reinsurance assumed ÏÏÏÏÏÏÏÏÏÏÏÏÏÏÏÏÏÏÏÏÏÏÏÏÏÏÏÏÏÏÏÏÏÏÏÏÏÏÏÏÏÏÏÏÏÏÏÏÏÏÏÏÏÏÏÏÏÏÏÏÏÏÏÏÏÏÏÏ 94.9 284.0 346.9
Total premiums earned ÏÏÏÏÏÏÏÏÏÏÏÏÏÏÏÏÏÏÏÏÏÏÏÏÏÏÏÏÏÏÏÏÏÏÏÏÏÏÏÏÏÏÏÏÏÏÏÏÏÏÏÏÏÏÏÏÏÏÏÏÏ $5,157.4 $4,569.3 $4,147.2
Income (loss) from operations before income taxPersonal ÏÏÏÏÏÏÏÏÏÏÏÏÏÏÏÏÏÏÏÏÏÏÏÏÏÏÏÏÏÏÏÏÏÏÏÏÏÏÏÏÏÏÏÏÏÏÏÏÏÏÏÏÏÏÏÏÏÏÏÏÏÏÏÏÏÏÏÏÏÏÏÏÏÏÏÏÏÏÏ $ 184.1 $ 67.2 $ 97.3Commercial ÏÏÏÏÏÏÏÏÏÏÏÏÏÏÏÏÏÏÏÏÏÏÏÏÏÏÏÏÏÏÏÏÏÏÏÏÏÏÏÏÏÏÏÏÏÏÏÏÏÏÏÏÏÏÏÏÏÏÏÏÏÏÏÏÏÏÏÏÏÏÏÏÏÏÏÏ (55.4) (18.2) (6.9)Reinsurance assumed ÏÏÏÏÏÏÏÏÏÏÏÏÏÏÏÏÏÏÏÏÏÏÏÏÏÏÏÏÏÏÏÏÏÏÏÏÏÏÏÏÏÏÏÏÏÏÏÏÏÏÏÏÏÏÏÏÏÏÏÏÏÏÏÏÏÏÏÏ (11.7) (18.7) 3.8
Underwriting incomeÏÏÏÏÏÏÏÏÏÏÏÏÏÏÏÏÏÏÏÏÏÏÏÏÏÏÏÏÏÏÏÏÏÏÏÏÏÏÏÏÏÏÏÏÏÏÏÏÏÏÏÏÏÏÏÏÏÏÏÏÏÏÏ 117.0 30.3 94.2Net investment incomeÏÏÏÏÏÏÏÏÏÏÏÏÏÏÏÏÏÏÏÏÏÏÏÏÏÏÏÏÏÏÏÏÏÏÏÏÏÏÏÏÏÏÏÏÏÏÏÏÏÏÏÏÏÏÏÏÏÏÏÏÏÏÏÏÏÏÏ 711.2 646.1 603.0
Income from operations before income tax ÏÏÏÏÏÏÏÏÏÏÏÏÏÏÏÏÏÏÏÏÏÏÏÏÏÏÏÏÏÏÏÏÏÏÏÏÏÏÏÏÏÏÏÏ $ 828.2 $ 676.4 $ 697.2
55
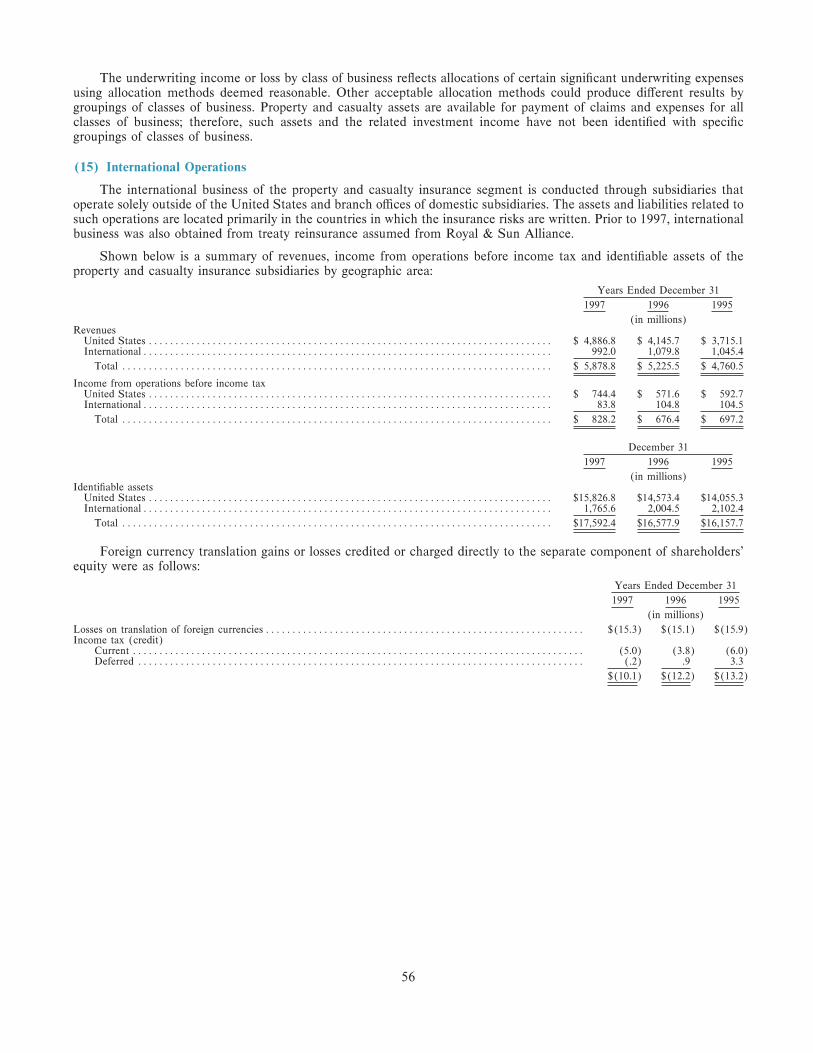
The underwriting income or loss by class of business reÖects allocations of certain signiÑcant underwriting expensesusing allocation methods deemed reasonable. Other acceptable allocation methods could produce diÅerent results bygroupings of classes of business. Property and casualty assets are available for payment of claims and expenses for allclasses of business; therefore, such assets and the related investment income have not been identiÑed with speciÑcgroupings of classes of business.
(15) International Operations
The international business of the property and casualty insurance segment is conducted through subsidiaries thatoperate solely outside of the United States and branch oÇces of domestic subsidiaries. The assets and liabilities related tosuch operations are located primarily in the countries in which the insurance risks are written. Prior to 1997, internationalbusiness was also obtained from treaty reinsurance assumed from Royal & Sun Alliance.
Shown below is a summary of revenues, income from operations before income tax and identiÑable assets of theproperty and casualty insurance subsidiaries by geographic area:
Years Ended December 31
1997 1996 1995
(in millions)Revenues
United States ÏÏÏÏÏÏÏÏÏÏÏÏÏÏÏÏÏÏÏÏÏÏÏÏÏÏÏÏÏÏÏÏÏÏÏÏÏÏÏÏÏÏÏÏÏÏÏÏÏÏÏÏÏÏÏÏÏÏÏÏÏÏÏÏÏÏÏÏÏÏÏÏÏÏÏÏ $ 4,886.8 $ 4,145.7 $ 3,715.1InternationalÏÏÏÏÏÏÏÏÏÏÏÏÏÏÏÏÏÏÏÏÏÏÏÏÏÏÏÏÏÏÏÏÏÏÏÏÏÏÏÏÏÏÏÏÏÏÏÏÏÏÏÏÏÏÏÏÏÏÏÏÏÏÏÏÏÏÏÏÏÏÏÏÏÏÏÏÏ 992.0 1,079.8 1,045.4
Total ÏÏÏÏÏÏÏÏÏÏÏÏÏÏÏÏÏÏÏÏÏÏÏÏÏÏÏÏÏÏÏÏÏÏÏÏÏÏÏÏÏÏÏÏÏÏÏÏÏÏÏÏÏÏÏÏÏÏÏÏÏÏÏÏÏÏÏÏÏÏÏÏÏÏÏÏÏÏÏÏÏ $ 5,878.8 $ 5,225.5 $ 4,760.5
Income from operations before income taxUnited States ÏÏÏÏÏÏÏÏÏÏÏÏÏÏÏÏÏÏÏÏÏÏÏÏÏÏÏÏÏÏÏÏÏÏÏÏÏÏÏÏÏÏÏÏÏÏÏÏÏÏÏÏÏÏÏÏÏÏÏÏÏÏÏÏÏÏÏÏÏÏÏÏÏÏÏÏ $ 744.4 $ 571.6 $ 592.7InternationalÏÏÏÏÏÏÏÏÏÏÏÏÏÏÏÏÏÏÏÏÏÏÏÏÏÏÏÏÏÏÏÏÏÏÏÏÏÏÏÏÏÏÏÏÏÏÏÏÏÏÏÏÏÏÏÏÏÏÏÏÏÏÏÏÏÏÏÏÏÏÏÏÏÏÏÏÏ 83.8 104.8 104.5
Total ÏÏÏÏÏÏÏÏÏÏÏÏÏÏÏÏÏÏÏÏÏÏÏÏÏÏÏÏÏÏÏÏÏÏÏÏÏÏÏÏÏÏÏÏÏÏÏÏÏÏÏÏÏÏÏÏÏÏÏÏÏÏÏÏÏÏÏÏÏÏÏÏÏÏÏÏÏÏÏÏÏ $ 828.2 $ 676.4 $ 697.2
December 31
1997 1996 1995
(in millions)IdentiÑable assets
United States ÏÏÏÏÏÏÏÏÏÏÏÏÏÏÏÏÏÏÏÏÏÏÏÏÏÏÏÏÏÏÏÏÏÏÏÏÏÏÏÏÏÏÏÏÏÏÏÏÏÏÏÏÏÏÏÏÏÏÏÏÏÏÏÏÏÏÏÏÏÏÏÏÏÏÏÏ $15,826.8 $14,573.4 $14,055.3InternationalÏÏÏÏÏÏÏÏÏÏÏÏÏÏÏÏÏÏÏÏÏÏÏÏÏÏÏÏÏÏÏÏÏÏÏÏÏÏÏÏÏÏÏÏÏÏÏÏÏÏÏÏÏÏÏÏÏÏÏÏÏÏÏÏÏÏÏÏÏÏÏÏÏÏÏÏÏ 1,765.6 2,004.5 2,102.4
Total ÏÏÏÏÏÏÏÏÏÏÏÏÏÏÏÏÏÏÏÏÏÏÏÏÏÏÏÏÏÏÏÏÏÏÏÏÏÏÏÏÏÏÏÏÏÏÏÏÏÏÏÏÏÏÏÏÏÏÏÏÏÏÏÏÏÏÏÏÏÏÏÏÏÏÏÏÏÏÏÏÏ $17,592.4 $16,577.9 $16,157.7
Foreign currency translation gains or losses credited or charged directly to the separate component of shareholders'equity were as follows:
Years Ended December 31
1997 1996 1995
(in millions)
Losses on translation of foreign currencies ÏÏÏÏÏÏÏÏÏÏÏÏÏÏÏÏÏÏÏÏÏÏÏÏÏÏÏÏÏÏÏÏÏÏÏÏÏÏÏÏÏÏÏÏÏÏÏÏÏÏÏÏÏÏÏÏÏÏÏÏ $(15.3) $(15.1) $(15.9)Income tax (credit)
Current ÏÏÏÏÏÏÏÏÏÏÏÏÏÏÏÏÏÏÏÏÏÏÏÏÏÏÏÏÏÏÏÏÏÏÏÏÏÏÏÏÏÏÏÏÏÏÏÏÏÏÏÏÏÏÏÏÏÏÏÏÏÏÏÏÏÏÏÏÏÏÏÏÏÏÏÏÏÏÏÏÏÏÏÏÏ (5.0) (3.8) (6.0)Deferred ÏÏÏÏÏÏÏÏÏÏÏÏÏÏÏÏÏÏÏÏÏÏÏÏÏÏÏÏÏÏÏÏÏÏÏÏÏÏÏÏÏÏÏÏÏÏÏÏÏÏÏÏÏÏÏÏÏÏÏÏÏÏÏÏÏÏÏÏÏÏÏÏÏÏÏÏÏÏÏÏÏÏÏÏ (.2) .9 3.3
$(10.1) $(12.2) $(13.2)
56
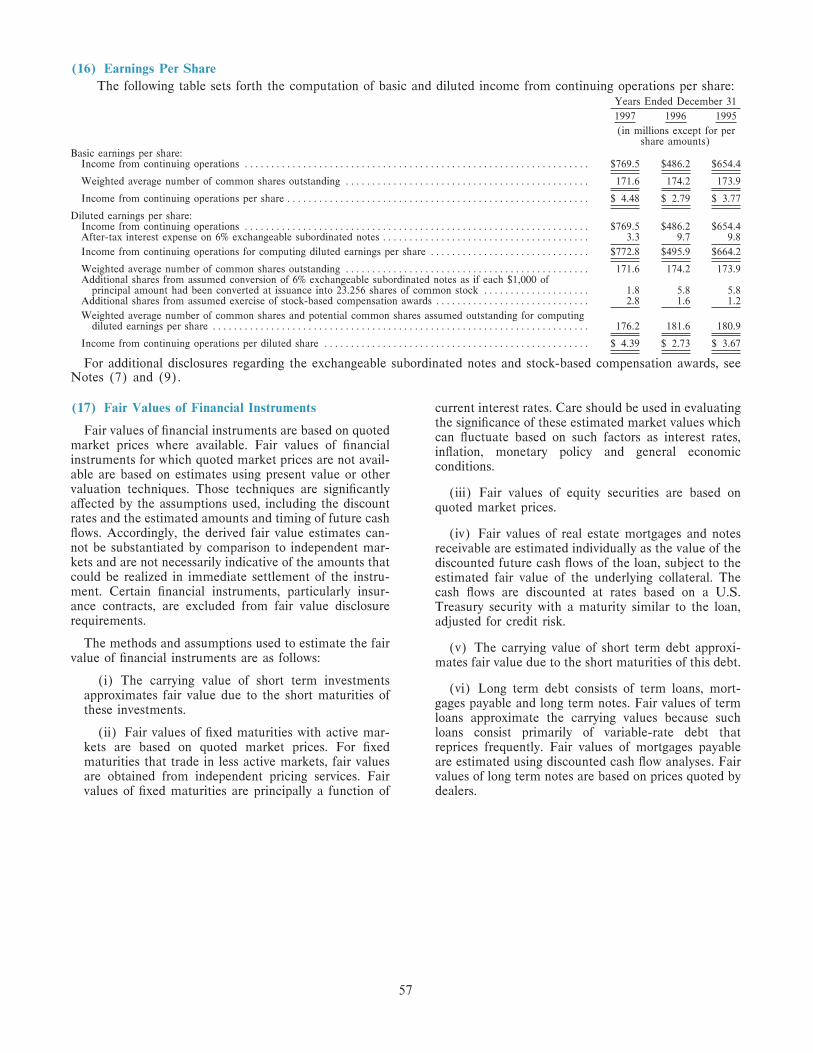
(16) Earnings Per Share
The following table sets forth the computation of basic and diluted income from continuing operations per share:Years Ended December 31
1997 1996 1995
(in millions except for pershare amounts)
Basic earnings per share:Income from continuing operations ÏÏÏÏÏÏÏÏÏÏÏÏÏÏÏÏÏÏÏÏÏÏÏÏÏÏÏÏÏÏÏÏÏÏÏÏÏÏÏÏÏÏÏÏÏÏÏÏÏÏÏÏÏÏÏÏÏÏÏÏÏÏÏÏÏ $769.5 $486.2 $654.4
Weighted average number of common shares outstanding ÏÏÏÏÏÏÏÏÏÏÏÏÏÏÏÏÏÏÏÏÏÏÏÏÏÏÏÏÏÏÏÏÏÏÏÏÏÏÏÏÏÏÏÏÏÏ 171.6 174.2 173.9
Income from continuing operations per share ÏÏÏÏÏÏÏÏÏÏÏÏÏÏÏÏÏÏÏÏÏÏÏÏÏÏÏÏÏÏÏÏÏÏÏÏÏÏÏÏÏÏÏÏÏÏÏÏÏÏÏÏÏÏÏÏÏ $ 4.48 $ 2.79 $ 3.77
Diluted earnings per share:Income from continuing operations ÏÏÏÏÏÏÏÏÏÏÏÏÏÏÏÏÏÏÏÏÏÏÏÏÏÏÏÏÏÏÏÏÏÏÏÏÏÏÏÏÏÏÏÏÏÏÏÏÏÏÏÏÏÏÏÏÏÏÏÏÏÏÏÏÏ $769.5 $486.2 $654.4After-tax interest expense on 6% exchangeable subordinated notes ÏÏÏÏÏÏÏÏÏÏÏÏÏÏÏÏÏÏÏÏÏÏÏÏÏÏÏÏÏÏÏÏÏÏÏÏÏÏÏ 3.3 9.7 9.8
Income from continuing operations for computing diluted earnings per share ÏÏÏÏÏÏÏÏÏÏÏÏÏÏÏÏÏÏÏÏÏÏÏÏÏÏÏÏÏÏ $772.8 $495.9 $664.2
Weighted average number of common shares outstanding ÏÏÏÏÏÏÏÏÏÏÏÏÏÏÏÏÏÏÏÏÏÏÏÏÏÏÏÏÏÏÏÏÏÏÏÏÏÏÏÏÏÏÏÏÏÏ 171.6 174.2 173.9Additional shares from assumed conversion of 6% exchangeable subordinated notes as if each $1,000 of
principal amount had been converted at issuance into 23.256 shares of common stock ÏÏÏÏÏÏÏÏÏÏÏÏÏÏÏÏÏÏÏÏ 1.8 5.8 5.8Additional shares from assumed exercise of stock-based compensation awards ÏÏÏÏÏÏÏÏÏÏÏÏÏÏÏÏÏÏÏÏÏÏÏÏÏÏÏÏÏ 2.8 1.6 1.2
Weighted average number of common shares and potential common shares assumed outstanding for computingdiluted earnings per share ÏÏÏÏÏÏÏÏÏÏÏÏÏÏÏÏÏÏÏÏÏÏÏÏÏÏÏÏÏÏÏÏÏÏÏÏÏÏÏÏÏÏÏÏÏÏÏÏÏÏÏÏÏÏÏÏÏÏÏÏÏÏÏÏÏÏÏÏÏÏÏ 176.2 181.6 180.9
Income from continuing operations per diluted share ÏÏÏÏÏÏÏÏÏÏÏÏÏÏÏÏÏÏÏÏÏÏÏÏÏÏÏÏÏÏÏÏÏÏÏÏÏÏÏÏÏÏÏÏÏÏÏÏÏÏ $ 4.39 $ 2.73 $ 3.67
For additional disclosures regarding the exchangeable subordinated notes and stock-based compensation awards, seeNotes (7) and (9).
(17) Fair Values of Financial Instruments current interest rates. Care should be used in evaluatingthe signiÑcance of these estimated market values which
Fair values of Ñnancial instruments are based on quotedcan Öuctuate based on such factors as interest rates,
market prices where available. Fair values of ÑnancialinÖation, monetary policy and general economic
instruments for which quoted market prices are not avail-conditions.
able are based on estimates using present value or othervaluation techniques. Those techniques are signiÑcantly (iii) Fair values of equity securities are based onaÅected by the assumptions used, including the discount quoted market prices.rates and the estimated amounts and timing of future cashÖows. Accordingly, the derived fair value estimates can- (iv) Fair values of real estate mortgages and notesnot be substantiated by comparison to independent mar- receivable are estimated individually as the value of thekets and are not necessarily indicative of the amounts that discounted future cash Öows of the loan, subject to thecould be realized in immediate settlement of the instru- estimated fair value of the underlying collateral. Thement. Certain Ñnancial instruments, particularly insur- cash Öows are discounted at rates based on a U.S.ance contracts, are excluded from fair value disclosure Treasury security with a maturity similar to the loan,requirements. adjusted for credit risk.
The methods and assumptions used to estimate the fair (v) The carrying value of short term debt approxi-value of Ñnancial instruments are as follows: mates fair value due to the short maturities of this debt.
(i) The carrying value of short term investments(vi) Long term debt consists of term loans, mort-
approximates fair value due to the short maturities ofgages payable and long term notes. Fair values of term
these investments.loans approximate the carrying values because such
(ii) Fair values of Ñxed maturities with active mar- loans consist primarily of variable-rate debt thatkets are based on quoted market prices. For Ñxed reprices frequently. Fair values of mortgages payablematurities that trade in less active markets, fair values are estimated using discounted cash Öow analyses. Fairare obtained from independent pricing services. Fair values of long term notes are based on prices quoted byvalues of Ñxed maturities are principally a function of dealers.
57
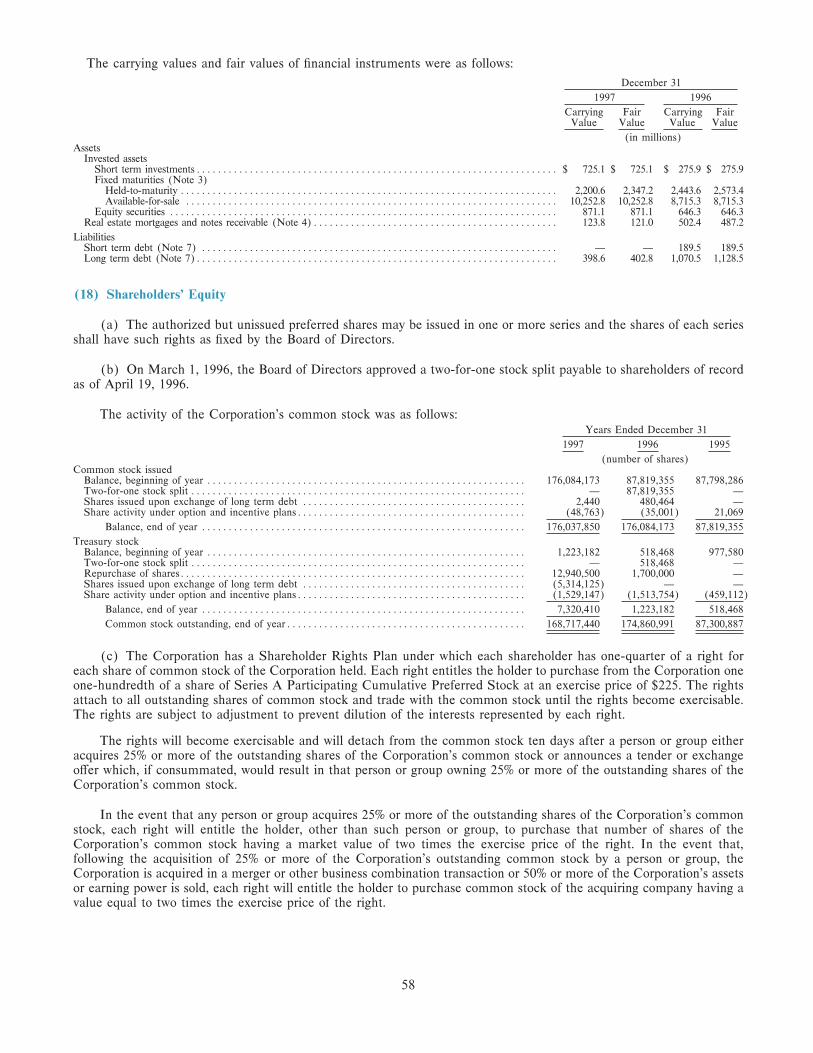
The carrying values and fair values of Ñnancial instruments were as follows:
December 31
1997 1996
Carrying Fair Carrying FairValue Value Value Value
(in millions)Assets
Invested assetsShort term investmentsÏÏÏÏÏÏÏÏÏÏÏÏÏÏÏÏÏÏÏÏÏÏÏÏÏÏÏÏÏÏÏÏÏÏÏÏÏÏÏÏÏÏÏÏÏÏÏÏÏÏÏÏÏÏÏÏÏÏÏÏÏÏÏÏÏÏÏÏ $ 725.1 $ 725.1 $ 275.9 $ 275.9Fixed maturities (Note 3)
Held-to-maturity ÏÏÏÏÏÏÏÏÏÏÏÏÏÏÏÏÏÏÏÏÏÏÏÏÏÏÏÏÏÏÏÏÏÏÏÏÏÏÏÏÏÏÏÏÏÏÏÏÏÏÏÏÏÏÏÏÏÏÏÏÏÏÏÏÏÏÏÏÏÏÏ 2,200.6 2,347.2 2,443.6 2,573.4Available-for-sale ÏÏÏÏÏÏÏÏÏÏÏÏÏÏÏÏÏÏÏÏÏÏÏÏÏÏÏÏÏÏÏÏÏÏÏÏÏÏÏÏÏÏÏÏÏÏÏÏÏÏÏÏÏÏÏÏÏÏÏÏÏÏÏÏÏÏÏÏÏÏ 10,252.8 10,252.8 8,715.3 8,715.3
Equity securities ÏÏÏÏÏÏÏÏÏÏÏÏÏÏÏÏÏÏÏÏÏÏÏÏÏÏÏÏÏÏÏÏÏÏÏÏÏÏÏÏÏÏÏÏÏÏÏÏÏÏÏÏÏÏÏÏÏÏÏÏÏÏÏÏÏÏÏÏÏÏÏÏÏ 871.1 871.1 646.3 646.3Real estate mortgages and notes receivable (Note 4)ÏÏÏÏÏÏÏÏÏÏÏÏÏÏÏÏÏÏÏÏÏÏÏÏÏÏÏÏÏÏÏÏÏÏÏÏÏÏÏÏÏÏÏÏÏÏ 123.8 121.0 502.4 487.2
LiabilitiesShort term debt (Note 7) ÏÏÏÏÏÏÏÏÏÏÏÏÏÏÏÏÏÏÏÏÏÏÏÏÏÏÏÏÏÏÏÏÏÏÏÏÏÏÏÏÏÏÏÏÏÏÏÏÏÏÏÏÏÏÏÏÏÏÏÏÏÏÏÏÏÏÏ Ì Ì 189.5 189.5Long term debt (Note 7)ÏÏÏÏÏÏÏÏÏÏÏÏÏÏÏÏÏÏÏÏÏÏÏÏÏÏÏÏÏÏÏÏÏÏÏÏÏÏÏÏÏÏÏÏÏÏÏÏÏÏÏÏÏÏÏÏÏÏÏÏÏÏÏÏÏÏÏÏ 398.6 402.8 1,070.5 1,128.5
(18) Shareholders' Equity
(a) The authorized but unissued preferred shares may be issued in one or more series and the shares of each seriesshall have such rights as Ñxed by the Board of Directors.
(b) On March 1, 1996, the Board of Directors approved a two-for-one stock split payable to shareholders of recordas of April 19, 1996.
The activity of the Corporation's common stock was as follows:Years Ended December 31
1997 1996 1995
(number of shares)Common stock issued
Balance, beginning of year ÏÏÏÏÏÏÏÏÏÏÏÏÏÏÏÏÏÏÏÏÏÏÏÏÏÏÏÏÏÏÏÏÏÏÏÏÏÏÏÏÏÏÏÏÏÏÏÏÏÏÏÏÏÏÏÏÏÏÏÏ 176,084,173 87,819,355 87,798,286Two-for-one stock split ÏÏÏÏÏÏÏÏÏÏÏÏÏÏÏÏÏÏÏÏÏÏÏÏÏÏÏÏÏÏÏÏÏÏÏÏÏÏÏÏÏÏÏÏÏÏÏÏÏÏÏÏÏÏÏÏÏÏÏÏÏÏÏ Ì 87,819,355 ÌShares issued upon exchange of long term debt ÏÏÏÏÏÏÏÏÏÏÏÏÏÏÏÏÏÏÏÏÏÏÏÏÏÏÏÏÏÏÏÏÏÏÏÏÏÏÏÏÏÏ 2,440 480,464 ÌShare activity under option and incentive plansÏÏÏÏÏÏÏÏÏÏÏÏÏÏÏÏÏÏÏÏÏÏÏÏÏÏÏÏÏÏÏÏÏÏÏÏÏÏÏÏÏÏÏ (48,763) (35,001) 21,069
Balance, end of year ÏÏÏÏÏÏÏÏÏÏÏÏÏÏÏÏÏÏÏÏÏÏÏÏÏÏÏÏÏÏÏÏÏÏÏÏÏÏÏÏÏÏÏÏÏÏÏÏÏÏÏÏÏÏÏÏÏÏÏÏÏ 176,037,850 176,084,173 87,819,355
Treasury stockBalance, beginning of year ÏÏÏÏÏÏÏÏÏÏÏÏÏÏÏÏÏÏÏÏÏÏÏÏÏÏÏÏÏÏÏÏÏÏÏÏÏÏÏÏÏÏÏÏÏÏÏÏÏÏÏÏÏÏÏÏÏÏÏÏ 1,223,182 518,468 977,580Two-for-one stock split ÏÏÏÏÏÏÏÏÏÏÏÏÏÏÏÏÏÏÏÏÏÏÏÏÏÏÏÏÏÏÏÏÏÏÏÏÏÏÏÏÏÏÏÏÏÏÏÏÏÏÏÏÏÏÏÏÏÏÏÏÏÏÏ Ì 518,468 ÌRepurchase of sharesÏÏÏÏÏÏÏÏÏÏÏÏÏÏÏÏÏÏÏÏÏÏÏÏÏÏÏÏÏÏÏÏÏÏÏÏÏÏÏÏÏÏÏÏÏÏÏÏÏÏÏÏÏÏÏÏÏÏÏÏÏÏÏÏÏ 12,940,500 1,700,000 ÌShares issued upon exchange of long term debt ÏÏÏÏÏÏÏÏÏÏÏÏÏÏÏÏÏÏÏÏÏÏÏÏÏÏÏÏÏÏÏÏÏÏÏÏÏÏÏÏÏÏ (5,314,125) Ì ÌShare activity under option and incentive plansÏÏÏÏÏÏÏÏÏÏÏÏÏÏÏÏÏÏÏÏÏÏÏÏÏÏÏÏÏÏÏÏÏÏÏÏÏÏÏÏÏÏÏ (1,529,147) (1,513,754) (459,112)
Balance, end of year ÏÏÏÏÏÏÏÏÏÏÏÏÏÏÏÏÏÏÏÏÏÏÏÏÏÏÏÏÏÏÏÏÏÏÏÏÏÏÏÏÏÏÏÏÏÏÏÏÏÏÏÏÏÏÏÏÏÏÏÏÏ 7,320,410 1,223,182 518,468
Common stock outstanding, end of yearÏÏÏÏÏÏÏÏÏÏÏÏÏÏÏÏÏÏÏÏÏÏÏÏÏÏÏÏÏÏÏÏÏÏÏÏÏÏÏÏÏÏÏÏÏ 168,717,440 174,860,991 87,300,887
(c) The Corporation has a Shareholder Rights Plan under which each shareholder has one-quarter of a right foreach share of common stock of the Corporation held. Each right entitles the holder to purchase from the Corporation oneone-hundredth of a share of Series A Participating Cumulative Preferred Stock at an exercise price of $225. The rightsattach to all outstanding shares of common stock and trade with the common stock until the rights become exercisable.The rights are subject to adjustment to prevent dilution of the interests represented by each right.
The rights will become exercisable and will detach from the common stock ten days after a person or group eitheracquires 25% or more of the outstanding shares of the Corporation's common stock or announces a tender or exchangeoÅer which, if consummated, would result in that person or group owning 25% or more of the outstanding shares of theCorporation's common stock.
In the event that any person or group acquires 25% or more of the outstanding shares of the Corporation's commonstock, each right will entitle the holder, other than such person or group, to purchase that number of shares of theCorporation's common stock having a market value of two times the exercise price of the right. In the event that,following the acquisition of 25% or more of the Corporation's outstanding common stock by a person or group, theCorporation is acquired in a merger or other business combination transaction or 50% or more of the Corporation's assetsor earning power is sold, each right will entitle the holder to purchase common stock of the acquiring company having avalue equal to two times the exercise price of the right.
58
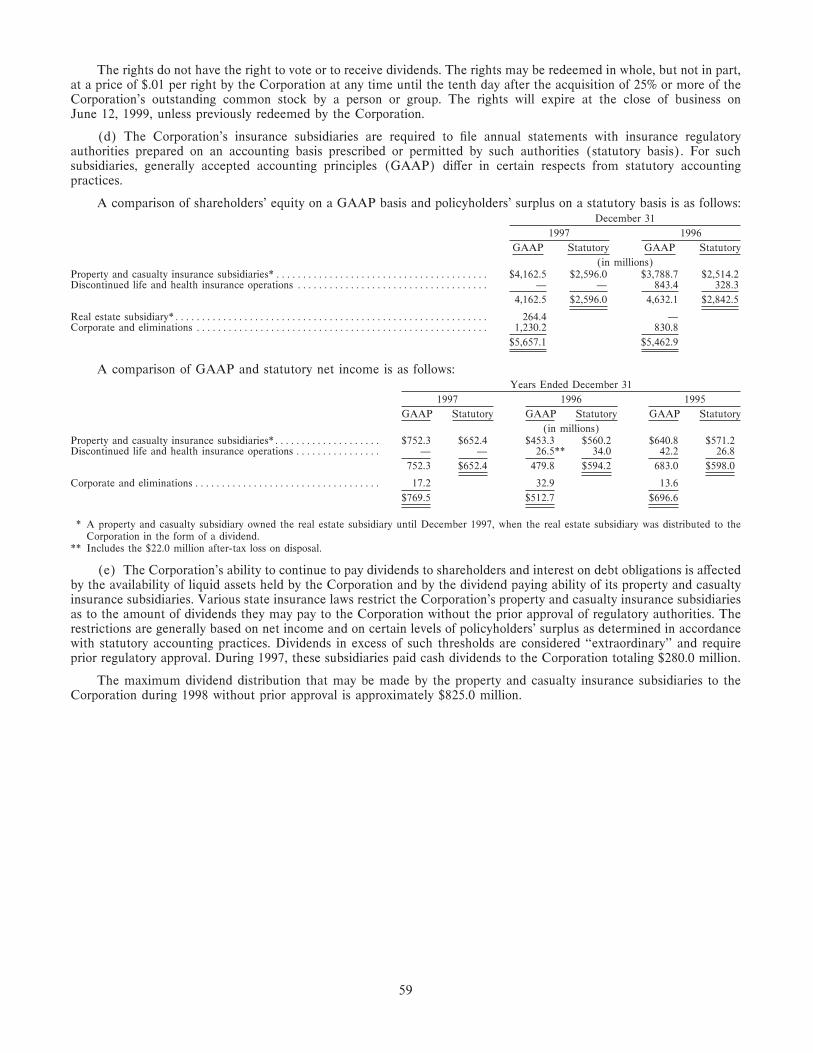
The rights do not have the right to vote or to receive dividends. The rights may be redeemed in whole, but not in part,at a price of $.01 per right by the Corporation at any time until the tenth day after the acquisition of 25% or more of theCorporation's outstanding common stock by a person or group. The rights will expire at the close of business onJune 12, 1999, unless previously redeemed by the Corporation.
(d) The Corporation's insurance subsidiaries are required to Ñle annual statements with insurance regulatoryauthorities prepared on an accounting basis prescribed or permitted by such authorities (statutory basis). For suchsubsidiaries, generally accepted accounting principles (GAAP) diÅer in certain respects from statutory accountingpractices.
A comparison of shareholders' equity on a GAAP basis and policyholders' surplus on a statutory basis is as follows:December 31
1997 1996
GAAP Statutory GAAP Statutory
(in millions)Property and casualty insurance subsidiaries*ÏÏÏÏÏÏÏÏÏÏÏÏÏÏÏÏÏÏÏÏÏÏÏÏÏÏÏÏÏÏÏÏÏÏÏÏÏÏÏÏ $4,162.5 $2,596.0 $3,788.7 $2,514.2Discontinued life and health insurance operations ÏÏÏÏÏÏÏÏÏÏÏÏÏÏÏÏÏÏÏÏÏÏÏÏÏÏÏÏÏÏÏÏÏÏÏÏ Ì Ì 843.4 328.3
4,162.5 $2,596.0 4,632.1 $2,842.5
Real estate subsidiary*ÏÏÏÏÏÏÏÏÏÏÏÏÏÏÏÏÏÏÏÏÏÏÏÏÏÏÏÏÏÏÏÏÏÏÏÏÏÏÏÏÏÏÏÏÏÏÏÏÏÏÏÏÏÏÏÏÏÏÏ 264.4 ÌCorporate and eliminations ÏÏÏÏÏÏÏÏÏÏÏÏÏÏÏÏÏÏÏÏÏÏÏÏÏÏÏÏÏÏÏÏÏÏÏÏÏÏÏÏÏÏÏÏÏÏÏÏÏÏÏÏÏÏÏ 1,230.2 830.8
$5,657.1 $5,462.9
A comparison of GAAP and statutory net income is as follows:Years Ended December 31
1997 1996 1995
GAAP Statutory GAAP Statutory GAAP Statutory
(in millions)Property and casualty insurance subsidiaries*ÏÏÏÏÏÏÏÏÏÏÏÏÏÏÏÏÏÏÏÏ $752.3 $652.4 $453.3 $560.2 $640.8 $571.2Discontinued life and health insurance operations ÏÏÏÏÏÏÏÏÏÏÏÏÏÏÏÏ Ì Ì 26.5** 34.0 42.2 26.8
752.3 $652.4 479.8 $594.2 683.0 $598.0
Corporate and eliminations ÏÏÏÏÏÏÏÏÏÏÏÏÏÏÏÏÏÏÏÏÏÏÏÏÏÏÏÏÏÏÏÏÏÏÏ 17.2 32.9 13.6
$769.5 $512.7 $696.6
* A property and casualty subsidiary owned the real estate subsidiary until December 1997, when the real estate subsidiary was distributed to theCorporation in the form of a dividend.
** Includes the $22.0 million after-tax loss on disposal.
(e) The Corporation's ability to continue to pay dividends to shareholders and interest on debt obligations is aÅectedby the availability of liquid assets held by the Corporation and by the dividend paying ability of its property and casualtyinsurance subsidiaries. Various state insurance laws restrict the Corporation's property and casualty insurance subsidiariesas to the amount of dividends they may pay to the Corporation without the prior approval of regulatory authorities. Therestrictions are generally based on net income and on certain levels of policyholders' surplus as determined in accordancewith statutory accounting practices. Dividends in excess of such thresholds are considered ""extraordinary'' and requireprior regulatory approval. During 1997, these subsidiaries paid cash dividends to the Corporation totaling $280.0 million.
The maximum dividend distribution that may be made by the property and casualty insurance subsidiaries to theCorporation during 1998 without prior approval is approximately $825.0 million.
59
Report of Independent Auditors
ERNST & YOUNG LLP
787 Seventh AvenueNew York, New York 10019
The Board of Directors and ShareholdersThe Chubb Corporation
We have audited the accompanying consolidated balance sheets of The Chubb Corporation as of December 31, 1997and 1996, and the related consolidated statements of income, shareholders' equity and cash Öows for each of the threeyears in the period ended December 31, 1997. These Ñnancial statements are the responsibility of the Corporation'smanagement. Our responsibility is to express an opinion on these Ñnancial statements based on our audits.
We conducted our audits in accordance with generally accepted auditing standards. Those standards require that weplan and perform the audit to obtain reasonable assurance about whether the Ñnancial statements are free of materialmisstatement. An audit includes examining, on a test basis, evidence supporting the amounts and disclosures in theÑnancial statements. An audit also includes assessing the accounting principles used and signiÑcant estimates made bymanagement, as well as evaluating the overall Ñnancial statement presentation. We believe that our audits provide areasonable basis for our opinion.
In our opinion, the Ñnancial statements referred to above present fairly, in all material respects, the consolidatedÑnancial position of The Chubb Corporation at December 31, 1997 and 1996 and the consolidated results of its operationsand its cash Öows for each of the three years in the period ended December 31, 1997 in conformity with generallyaccepted accounting principles.
As described in Note (1)(g) to the Ñnancial statements, The Chubb Corporation changed its methods of accountingfor impairment of long-lived assets in 1996.
February 20, 1998
60
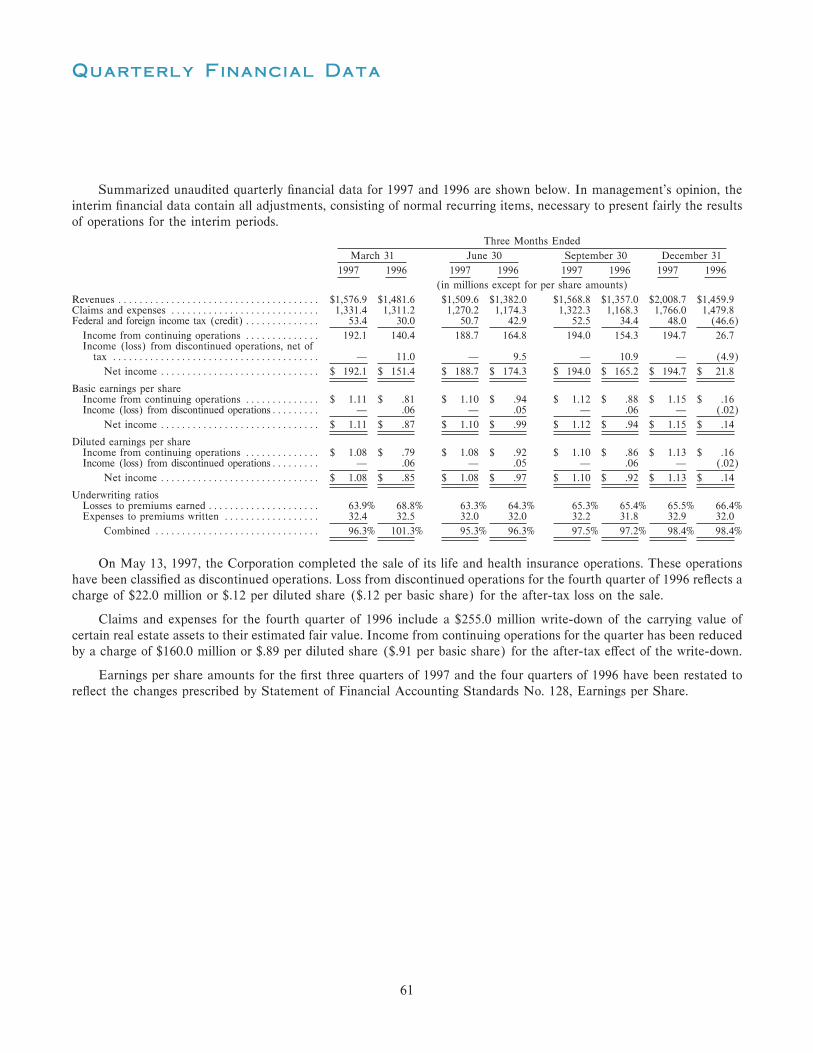
Quarterly Financial Data
Summarized unaudited quarterly Ñnancial data for 1997 and 1996 are shown below. In management's opinion, theinterim Ñnancial data contain all adjustments, consisting of normal recurring items, necessary to present fairly the resultsof operations for the interim periods.
Three Months Ended
March 31 June 30 September 30 December 31
1997 1996 1997 1996 1997 1996 1997 1996
(in millions except for per share amounts)
Revenues ÏÏÏÏÏÏÏÏÏÏÏÏÏÏÏÏÏÏÏÏÏÏÏÏÏÏÏÏÏÏÏÏÏÏÏÏÏÏ $1,576.9 $1,481.6 $1,509.6 $1,382.0 $1,568.8 $1,357.0 $2,008.7 $1,459.9Claims and expenses ÏÏÏÏÏÏÏÏÏÏÏÏÏÏÏÏÏÏÏÏÏÏÏÏÏÏÏÏ 1,331.4 1,311.2 1,270.2 1,174.3 1,322.3 1,168.3 1,766.0 1,479.8Federal and foreign income tax (credit)ÏÏÏÏÏÏÏÏÏÏÏÏÏÏ 53.4 30.0 50.7 42.9 52.5 34.4 48.0 (46.6)
Income from continuing operations ÏÏÏÏÏÏÏÏÏÏÏÏÏÏ 192.1 140.4 188.7 164.8 194.0 154.3 194.7 26.7Income (loss) from discontinued operations, net of
tax ÏÏÏÏÏÏÏÏÏÏÏÏÏÏÏÏÏÏÏÏÏÏÏÏÏÏÏÏÏÏÏÏÏÏÏÏÏÏÏ Ì 11.0 Ì 9.5 Ì 10.9 Ì (4.9)
Net income ÏÏÏÏÏÏÏÏÏÏÏÏÏÏÏÏÏÏÏÏÏÏÏÏÏÏÏÏÏÏ $ 192.1 $ 151.4 $ 188.7 $ 174.3 $ 194.0 $ 165.2 $ 194.7 $ 21.8
Basic earnings per shareIncome from continuing operations ÏÏÏÏÏÏÏÏÏÏÏÏÏÏ $ 1.11 $ .81 $ 1.10 $ .94 $ 1.12 $ .88 $ 1.15 $ .16Income (loss) from discontinued operationsÏÏÏÏÏÏÏÏÏ Ì .06 Ì .05 Ì .06 Ì (.02)
Net income ÏÏÏÏÏÏÏÏÏÏÏÏÏÏÏÏÏÏÏÏÏÏÏÏÏÏÏÏÏÏ $ 1.11 $ .87 $ 1.10 $ .99 $ 1.12 $ .94 $ 1.15 $ .14
Diluted earnings per shareIncome from continuing operations ÏÏÏÏÏÏÏÏÏÏÏÏÏÏ $ 1.08 $ .79 $ 1.08 $ .92 $ 1.10 $ .86 $ 1.13 $ .16Income (loss) from discontinued operationsÏÏÏÏÏÏÏÏÏ Ì .06 Ì .05 Ì .06 Ì (.02)
Net income ÏÏÏÏÏÏÏÏÏÏÏÏÏÏÏÏÏÏÏÏÏÏÏÏÏÏÏÏÏÏ $ 1.08 $ .85 $ 1.08 $ .97 $ 1.10 $ .92 $ 1.13 $ .14
Underwriting ratiosLosses to premiums earned ÏÏÏÏÏÏÏÏÏÏÏÏÏÏÏÏÏÏÏÏÏ 63.9% 68.8% 63.3% 64.3% 65.3% 65.4% 65.5% 66.4%Expenses to premiums written ÏÏÏÏÏÏÏÏÏÏÏÏÏÏÏÏÏÏ 32.4 32.5 32.0 32.0 32.2 31.8 32.9 32.0
Combined ÏÏÏÏÏÏÏÏÏÏÏÏÏÏÏÏÏÏÏÏÏÏÏÏÏÏÏÏÏÏÏ 96.3% 101.3% 95.3% 96.3% 97.5% 97.2% 98.4% 98.4%
On May 13, 1997, the Corporation completed the sale of its life and health insurance operations. These operationshave been classiÑed as discontinued operations. Loss from discontinued operations for the fourth quarter of 1996 reÖects acharge of $22.0 million or $.12 per diluted share ($.12 per basic share) for the after-tax loss on the sale.
Claims and expenses for the fourth quarter of 1996 include a $255.0 million write-down of the carrying value ofcertain real estate assets to their estimated fair value. Income from continuing operations for the quarter has been reducedby a charge of $160.0 million or $.89 per diluted share ($.91 per basic share) for the after-tax eÅect of the write-down.
Earnings per share amounts for the Ñrst three quarters of 1997 and the four quarters of 1996 have been restated toreÖect the changes prescribed by Statement of Financial Accounting Standards No. 128, Earnings per Share.
61
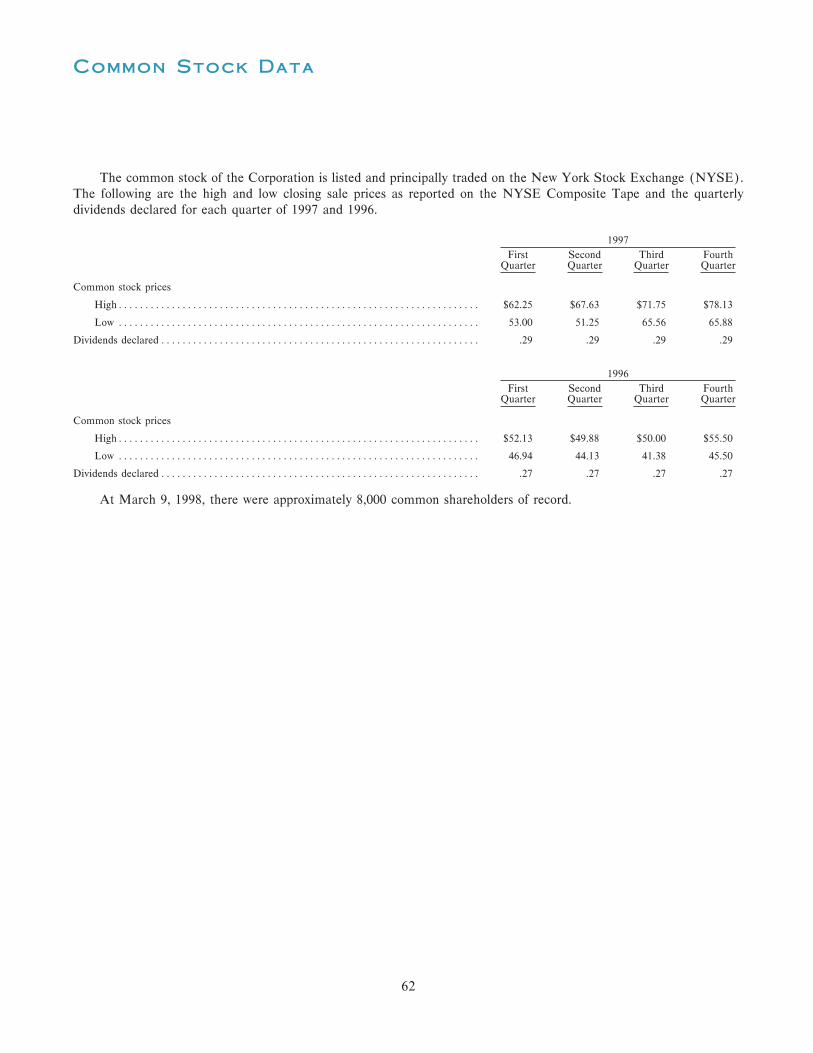
Common Stock Data
The common stock of the Corporation is listed and principally traded on the New York Stock Exchange (NYSE).The following are the high and low closing sale prices as reported on the NYSE Composite Tape and the quarterlydividends declared for each quarter of 1997 and 1996.
1997
First Second Third FourthQuarter Quarter Quarter Quarter
Common stock prices
HighÏÏÏÏÏÏÏÏÏÏÏÏÏÏÏÏÏÏÏÏÏÏÏÏÏÏÏÏÏÏÏÏÏÏÏÏÏÏÏÏÏÏÏÏÏÏÏÏÏÏÏÏÏÏÏÏÏÏÏÏÏÏÏÏÏÏÏÏ $62.25 $67.63 $71.75 $78.13
Low ÏÏÏÏÏÏÏÏÏÏÏÏÏÏÏÏÏÏÏÏÏÏÏÏÏÏÏÏÏÏÏÏÏÏÏÏÏÏÏÏÏÏÏÏÏÏÏÏÏÏÏÏÏÏÏÏÏÏÏÏÏÏÏÏÏÏÏÏ 53.00 51.25 65.56 65.88
Dividends declaredÏÏÏÏÏÏÏÏÏÏÏÏÏÏÏÏÏÏÏÏÏÏÏÏÏÏÏÏÏÏÏÏÏÏÏÏÏÏÏÏÏÏÏÏÏÏÏÏÏÏÏÏÏÏÏÏÏÏÏÏ .29 .29 .29 .29
1996
First Second Third FourthQuarter Quarter Quarter Quarter
Common stock prices
HighÏÏÏÏÏÏÏÏÏÏÏÏÏÏÏÏÏÏÏÏÏÏÏÏÏÏÏÏÏÏÏÏÏÏÏÏÏÏÏÏÏÏÏÏÏÏÏÏÏÏÏÏÏÏÏÏÏÏÏÏÏÏÏÏÏÏÏÏ $52.13 $49.88 $50.00 $55.50
Low ÏÏÏÏÏÏÏÏÏÏÏÏÏÏÏÏÏÏÏÏÏÏÏÏÏÏÏÏÏÏÏÏÏÏÏÏÏÏÏÏÏÏÏÏÏÏÏÏÏÏÏÏÏÏÏÏÏÏÏÏÏÏÏÏÏÏÏÏ 46.94 44.13 41.38 45.50
Dividends declaredÏÏÏÏÏÏÏÏÏÏÏÏÏÏÏÏÏÏÏÏÏÏÏÏÏÏÏÏÏÏÏÏÏÏÏÏÏÏÏÏÏÏÏÏÏÏÏÏÏÏÏÏÏÏÏÏÏÏÏÏ .27 .27 .27 .27
At March 9, 1998, there were approximately 8,000 common shareholders of record.
62
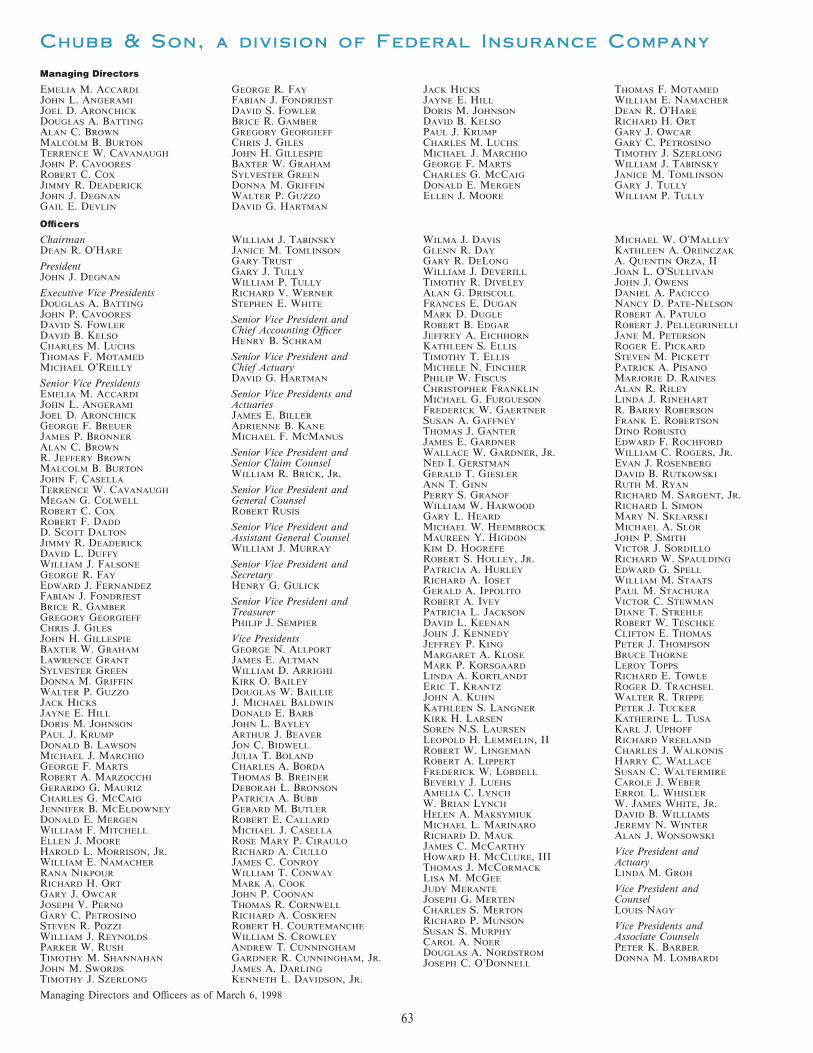
Chubb & Son, a division of Federal Insurance Company
Managing Directors
EMELIA M. ACCARDI GEORGE R. FAY JACK HICKS THOMAS F. MOTAMED
JOHN L. ANGERAMI FABIAN J. FONDRIEST JAYNE E. HILL WILLIAM E. NAMACHER
JOEL D. ARONCHICK DAVID S. FOWLER DORIS M. JOHNSON DEAN R. O'HARE
DOUGLAS A. BATTING BRICE R. GAMBER DAVID B. KELSO RICHARD H. ORT
ALAN C. BROWN GREGORY GEORGIEFF PAUL J. KRUMP GARY J. OWCAR
MALCOLM B. BURTON CHRIS J. GILES CHARLES M. LUCHS GARY C. PETROSINO
TERRENCE W. CAVANAUGH JOHN H. GILLESPIE MICHAEL J. MARCHIO TIMOTHY J. SZERLONG
JOHN P. CAVOORES BAXTER W. GRAHAM GEORGE F. MARTS WILLIAM J. TABINSKY
ROBERT C. COX SYLVESTER GREEN CHARLES G. MCCAIG JANICE M. TOMLINSON
JIMMY R. DEADERICK DONNA M. GRIFFIN DONALD E. MERGEN GARY J. TULLY
JOHN J. DEGNAN WALTER P. GUZZO ELLEN J. MOORE WILLIAM P. TULLY
GAIL E. DEVLIN DAVID G. HARTMAN
OÇcers
Chairman WILLIAM J. TABINSKY WILMA J. DAVIS MICHAEL W. O'MALLEY
DEAN R. O'HARE JANICE M. TOMLINSON GLENN R. DAY KATHLEEN A. ORENCZAK
GARY TRUST GARY R. DELONG A. QUENTIN ORZA, IIPresidentGARY J. TULLY WILLIAM J. DEVERILL JOAN L. O'SULLIVAN
JOHN J. DEGNANWILLIAM P. TULLY TIMOTHY R. DIVELEY JOHN J. OWENS
Executive Vice Presidents RICHARD V. WERNER ALAN G. DRISCOLL DANIEL A. PACICCO
DOUGLAS A. BATTING STEPHEN E. WHITE FRANCES E. DUGAN NANCY D. PATE-NELSON
JOHN P. CAVOORES MARK D. DUGLE ROBERT A. PATULOSenior Vice President andDAVID S. FOWLER ROBERT B. EDGAR ROBERT J. PELLEGRINELLIChief Accounting OÇcerDAVID B. KELSO JEFFREY A. EICHHORN JANE M. PETERSON
HENRY B. SCHRAMCHARLES M. LUCHS KATHLEEN S. ELLIS ROGER E. PICKARD
THOMAS F. MOTAMED Senior Vice President and TIMOTHY T. ELLIS STEVEN M. PICKETT
MICHAEL O'REILLY Chief Actuary MICHELE N. FINCHER PATRICK A. PISANO
DAVID G. HARTMAN PHILIP W. FISCUS MARJORIE D. RAINESSenior Vice PresidentsCHRISTOPHER FRANKLIN ALAN R. RILEY
EMELIA M. ACCARDI Senior Vice Presidents andMICHAEL G. FURGUESON LINDA J. RINEHART
JOHN L. ANGERAMI ActuariesFREDERICK W. GAERTNER R. BARRY ROBERSON
JOEL D. ARONCHICK JAMES E. BILLERSUSAN A. GAFFNEY FRANK E. ROBERTSON
GEORGE F. BREUER ADRIENNE B. KANETHOMAS J. GANTER DINO ROBUSTO
JAMES P. BRONNER MICHAEL F. MCMANUSJAMES E. GARDNER EDWARD F. ROCHFORD
ALAN C. BROWN Senior Vice President and WALLACE W. GARDNER, JR. WILLIAM C. ROGERS, JR.R. JEFFERY BROWN Senior Claim Counsel NED I. GERSTMAN EVAN J. ROSENBERGMALCOLM B. BURTON
WILLIAM R. BRICK, JR. GERALD T. GIESLER DAVID B. RUTKOWSKIJOHN F. CASELLA
ANN T. GINN RUTH M. RYANTERRENCE W. CAVANAUGH Senior Vice President and
PERRY S. GRANOF RICHARD M. SARGENT, JR.MEGAN G. COLWELL General Counsel
WILLIAM W. HARWOOD RICHARD I. SIMONROBERT C. COX ROBERT RUSIS
GARY L. HEARD MARY N. SKLARSKIROBERT F. DADD Senior Vice President and MICHAEL W. HEEMBROCK MICHAEL A. SLORD. SCOTT DALTON Assistant General Counsel MAUREEN Y. HIGDON JOHN P. SMITHJIMMY R. DEADERICK
WILLIAM J. MURRAY KIM D. HOGREFE VICTOR J. SORDILLODAVID L. DUFFY
ROBERT S. HOLLEY, JR. RICHARD W. SPAULDINGWILLIAM J. FALSONE Senior Vice President and
PATRICIA A. HURLEY EDWARD G. SPELLGEORGE R. FAY Secretary
RICHARD A. IOSET WILLIAM M. STAATSEDWARD J. FERNANDEZ HENRY G. GULICK
GERALD A. IPPOLITO PAUL M. STACHURAFABIAN J. FONDRIEST Senior Vice President and ROBERT A. IVEY VICTOR C. STEWMANBRICE R. GAMBER Treasurer PATRICIA L. JACKSON DIANE T. STREHLEGREGORY GEORGIEFF
PHILIP J. SEMPIER DAVID L. KEENAN ROBERT W. TESCHKECHRIS J. GILES
JOHN J. KENNEDY CLIFTON E. THOMASJOHN H. GILLESPIE Vice Presidents
JEFFREY P. KING PETER J. THOMPSONBAXTER W. GRAHAM GEORGE N. ALLPORT
MARGARET A. KLOSE BRUCE THORNELAWRENCE GRANT JAMES E. ALTMAN
MARK P. KORSGAARD LEROY TOPPSSYLVESTER GREEN WILLIAM D. ARRIGHI
LINDA A. KORTLANDT RICHARD E. TOWLEDONNA M. GRIFFIN KIRK O. BAILEY
ERIC T. KRANTZ ROGER D. TRACHSELWALTER P. GUZZO DOUGLAS W. BAILLIE
JOHN A. KUHN WALTER R. TRIPPEJACK HICKS J. MICHAEL BALDWIN
KATHLEEN S. LANGNER PETER J. TUCKERJAYNE E. HILL DONALD E. BARB
KIRK H. LARSEN KATHERINE L. TUSADORIS M. JOHNSON JOHN L. BAYLEY
SOREN N.S. LAURSEN KARL J. UPHOFFPAUL J. KRUMP ARTHUR J. BEAVER
LEOPOLD H. LEMMELIN, II RICHARD VREELANDDONALD B. LAWSON JON C. BIDWELL
ROBERT W. LINGEMAN CHARLES J. WALKONISMICHAEL J. MARCHIO JULIA T. BOLAND
ROBERT A. LIPPERT HARRY C. WALLACEGEORGE F. MARTS CHARLES A. BORDA
FREDERICK W. LOBDELL SUSAN C. WALTERMIREROBERT A. MARZOCCHI THOMAS B. BREINER
BEVERLY J. LUEHS CAROLE J. WEBERGERARDO G. MAURIZ DEBORAH L. BRONSON
AMELIA C. LYNCH ERROL L. WHISLERCHARLES G. MCCAIG PATRICIA A. BUBB
W. BRIAN LYNCH W. JAMES WHITE, JR.JENNIFER B. MCELDOWNEY GERARD M. BUTLER
HELEN A. MAKSYMIUK DAVID B. WILLIAMSDONALD E. MERGEN ROBERT E. CALLARD
MICHAEL L. MARINARO JEREMY N. WINTERWILLIAM F. MITCHELL MICHAEL J. CASELLA
RICHARD D. MAUK ALAN J. WONSOWSKIELLEN J. MOORE ROSE MARY P. CIRAULO
JAMES C. MCCARTHYHAROLD L. MORRISON, JR. RICHARD A. CIULLO Vice President and
HOWARD H. MCCLURE, IIIWILLIAM E. NAMACHER JAMES C. CONROY Actuary
THOMAS J. MCCORMACKRANA NIKPOUR WILLIAM T. CONWAY LINDA M. GROH
LISA M. MCGEERICHARD H. ORT MARK A. COOK
JUDY MERANTE Vice President andGARY J. OWCAR JOHN P. COONAN
JOSEPH G. MERTEN CounselJOSEPH V. PERNO THOMAS R. CORNWELL
CHARLES S. MERTON LOUIS NAGYGARY C. PETROSINO RICHARD A. COSKREN
RICHARD P. MUNSONSTEVEN R. POZZI ROBERT H. COURTEMANCHE Vice Presidents and
SUSAN S. MURPHYWILLIAM J. REYNOLDS WILLIAM S. CROWLEY Associate Counsels
CAROL A. NOERPARKER W. RUSH ANDREW T. CUNNINGHAM PETER K. BARBER
DOUGLAS A. NORDSTROMTIMOTHY M. SHANNAHAN GARDNER R. CUNNINGHAM, JR. DONNA M. LOMBARDI
JOSEPH C. O'DONNELLJOHN M. SWORDS JAMES A. DARLING
TIMOTHY J. SZERLONG KENNETH L. DAVIDSON, JR.
Managing Directors and OÇcers as of March 6, 1998
63
Chubb Insurance Company of Canada
Directors
DIANE P. BAXTER STUART K. MANN DEAN R. O'HARE CRAWFORD W. SPRATT
BARRY T. GRANT D. UDO NIXDORF PETER B. SMITH JANICE M. TOMLINSON
OÇcers
Chairman and President Vice Presidents SCOTT GUNTER Treasurer and Chief AccountantJANICE M. TOMLINSON DANIEL M. ANBER JAMES V. NEWMAN GEOFFREY D. SHIELDS
JANICE S. BINDON RICHARD F. NOBLESSenior Vice Presidents SecretaryJAMES CALLAHANDIANE P. BAXTER CRAWFORD W. SPRATT
D. UDO NIXDORF
Chubb Insurance Company of Europe, S.A.
Directors
JOHN P. CAVOORES VICTOR HAENECOUR SIR DAVID G. SCHOLEY, CBECECILE COUNE DEAN R. O'HARE
OÇcers
Chairman THOMAS WARDEN Vice Presidents ERIC SIDGWICK
JOHN P. CAVOORES WITOLD WILDEN JANIC BAUDRIHAYE JOHN SIMS
JOHN BOARDMAN PAUL STACHURASenior Vice Presidents Senior Vice President,JOERG BODE DAVID STEVENSDANIEL ANBER General Counsel andMARION BROWN PAMELA L. STRADERJ. MICHAEL BALDWIN Company SecretaryBERNHARD BUDDE ALBERT VAN KERCKHOVENCHARLES BOEZIEK LOUIS NAGYTED R. CLAYTON PAUL VAN PELTROSS BUCHMUELLER
Senior Vice President and CHRISTIAN DE HERICOURT WOLFGANG WEISCECILE COUNEChief Financial OÇcer CHRISTOPHER HAMILTON R. CABOT WIGGERD. KEITH DAVIESKEVIN O'SHIEL ERIC HASSEL JEREMY N. WINTERCHRIS J. GILES
HORST IHLAS CAROLYN WYNNECARLOS MERINO Senior Vice President and BOGISLAV GRAF VON SCHWERINFINLEY MIDDLETON ActuaryWILLIAM E. NAMACHER MICHAEL F. MCMANUSSTEVEN PRICE
JOHN REDMOND
Federal Insurance Company
OÇcers
Chairman and President Senior Vice President LAWRENCE GRANT ERIC M. STEPHANUS
and General CounselDEAN R. O'HARE RICK A. GRAY STEPHEN TASY
ROBERT RUSIS MICHAEL S. HOWEY MARK VON HAARTMANSenior Vice Presidents JAMES KERNS DOREEN YIPVice PresidentsROGER C.P. BROOKHOUSE MARK T. LINGAFELTER
DOUGLAS A. BATTING Vice President andJOHN J. DEGNAN AMELIA C. LYNCHTHOMAS B. BREINER ActuaryDAVID S. FOWLER ROBERT A. MARZOCCHIJOHN M. BURNETT DAVID G. HARTMANCHRIS J. GILES MELISSA S. MASLESMALCOLM B. BURTONIAN LANCASTER GERARDO G. MAURIZ Vice President andROBERT E. CALLARDDONALD E. MERGEN SecretaryMARK A. MILEUSNICMICHAEL J. CASELLAMICHAEL O'REILLY HENRY G. GULICKGLENN A. MONTGOMERYFLORA CHINGARY J. OWCAR NAOKI OIKEGAIL E. DEVLIN Vice President andGARY C. PETROSINO MARJORIE D. RAINES TreasurerRICK J. ELDRIDGERUSS L.S. SOH FRANK E. ROBERTSON PHILIP J. SEMPIERIAN R. FARAGHER
PARKER W. RUSHBRANT W. FREE, JR.
HENRY B. SCHRAMBRICE R. GAMBER
Directors and OÇcers as of March 6, 1998
64
Subsidiaries AÇliates
Property and Casualty Insurance ASSOCIATED AVIATION UNDERWRITERS, INC.
CHUBB INSURANCE COMPANY (THAILAND), LIMITEDFEDERAL INSURANCE COMPANY
VIGILANT INSURANCE COMPANYDividend Agent, Transfer Agent and Registrar
GREAT NORTHERN INSURANCE COMPANY
FIRST CHICAGO TRUST COMPANY OF NEW YORKPACIFIC INDEMNITY COMPANY
P.O. BOX 2500NORTHWESTERN PACIFIC INDEMNITY COMPANY
JERSEY CITY, NJ 07303-2500TEXAS PACIFIC INDEMNITY COMPANY
TELEPHONE 800-317-4445CHUBB CUSTOM INSURANCE COMPANY
COMPANY CODE 1816CHUBB INDEMNITY INSURANCE COMPANY
CHUBB INSURANCE COMPANY OF NEW JERSEYStock Listing
CHUBB NATIONAL INSURANCE COMPANY
THE COMMON STOCK OF THE CORPORATIONCHUBB ATLANTIC INDEMNITY, LTD.IS TRADED ON THE NEW YORK STOCK EXCHANGECHUBB INSURANCE COMPANY OF AUSTRALIA, LIMITED
UNDER THE SYMBOL CB.CHUBB INSURANCE COMPANY OF CANADA
CHUBB INSURANCE COMPANY OF EUROPE, S.A.The Chubb Corporation
CHUBB ARGENTINA DE SEGUROS, S.A.15 MOUNTAIN VIEW ROAD, P.O. BOX 1615
CHUBB DO BRASIL COMPANHIA DE SEGUROSWARREN, NJ 07061-1615
CHUBB DE COLOMBIA COMPA ¿Nπ A DE SEGUROS S.A.TELEPHONE (908) 903-2000
CHUBB DE CHILE COMPA ¿Nπ A DE SEGUROS GENERALES S.A.http://www.chubb.com
CHUBB DE MEXICO, COMPANIA AFIANZADORA, S.A. DE S.V.
CHUBB DE MEXICO, COMPANIA DE SEGUROS, S.A. DE S.V.
Property and Casualty Insurance Underwriting Managers
CHUBB & SON, A DIVISION OF FEDERAL INSURANCE COMPANY
CHUBB CUSTOM MARKET, INC.
CHUBB MULTINATIONAL MANAGERS, INC.
Consulting Ì Claims Administration Ì Services
CHUBB CUSTOMER CENTER, INC.
CHUBB SERVICES CORPORATION
Insurance Agency
PERSONAL LINES INSURANCE BROKERAGE, INC.
Real Estate
BELLEMEAD DEVELOPMENT CORPORATION
Financing
CHUBB CAPITAL CORPORATION
Registered Investment Adviser
CHUBB ASSET MANAGERS, INC.
Education
CHUBB COMPUTER SERVICES, INC.
CHUBB PROFESSIONAL RESOURCES, INC.
As of March 6, 1998

The Chubb Corporation15 Mountain View Road, P.O. Box 1615Warren, New Jersey 07061-1615http://www.chubb.com