Chrysa Leventi and Manos Matsaganis(2) of private and public sector employees, it also created a new...
38
Disentangling Annuities and Transfers: Redistribution in Greek Retirement Benefits 1 DISENTANGLING ANNUITIES AND TRANSFERS: REDISTRIBUTION IN GREEK RETIREMENT BENEFITS Chrysa Leventi (1) and Manos Matsaganis (2) (1) Institute for Social and Economic Research (ISER), University of Essex (2) Athens University of Economics and Business Abstract The objective of this paper is to identify the relative importance of annuities and transfers in Greek retirement benefits and draw conclusions as to their impact on intergenerational and intragenerational equity. As one of the core objectives of a pension system is to redistribute income over the life span of individuals, their equity effects are examined by adopting a longitudinal approach. This approach compares the balance between the net present value of total contributions paid and pensions received by individuals throughout the course of their lives. The difference between the two is the implicit transfer that can be either positive (a transfer received by the rest of society) or negative (a transfer paid to the rest of society). The methodological line of inquiry involves the analysis of a representative sample of retirees from the biggest social insurance fund of the country in 2008. Annuities and transfers were calculated according to the rules that were in place both before and after the major pension reform that took place in Greece in 2010. The impact of the 2010-2013 austerity measures on lifetime pension benefits were also taken into account. Our findings suggest that the vast majority of retirees are receiving positive -and quite substantial, in absolute terms- net transfers from the system. This outcome implies that the underlying pension rules seriously deviate from actuarial fairness and are thus violating the principle of intergenerational equity. Key words: public pensions, lifetime contributions, lifetime benefits, redistribution, progressivity. JEL classification: D31, H55, J26
Transcript of Chrysa Leventi and Manos Matsaganis(2) of private and public sector employees, it also created a new...

Disentangling Annuities and Transfers: Redistribution in Greek Retirement Benefits
1
DISENTANGLING ANNUITIES AND TRANSFERS: REDISTRIBUTION IN
GREEK RETIREMENT BENEFITS
Chrysa Leventi(1) and Manos Matsaganis(2)
(1) Institute for Social and Economic Research (ISER), University of Essex
(2) Athens University of Economics and Business
Abstract
The objective of this paper is to identify the relative importance of annuities and transfers in
Greek retirement benefits and draw conclusions as to their impact on intergenerational and
intragenerational equity. As one of the core objectives of a pension system is to redistribute
income over the life span of individuals, their equity effects are examined by adopting a
longitudinal approach. This approach compares the balance between the net present value of
total contributions paid and pensions received by individuals throughout the course of their
lives. The difference between the two is the implicit transfer that can be either positive (a
transfer received by the rest of society) or negative (a transfer paid to the rest of society). The
methodological line of inquiry involves the analysis of a representative sample of retirees from
the biggest social insurance fund of the country in 2008. Annuities and transfers were calculated
according to the rules that were in place both before and after the major pension reform that
took place in Greece in 2010. The impact of the 2010-2013 austerity measures on lifetime
pension benefits were also taken into account. Our findings suggest that the vast majority of
retirees are receiving positive -and quite substantial, in absolute terms- net transfers from the
system. This outcome implies that the underlying pension rules seriously deviate from actuarial
fairness and are thus violating the principle of intergenerational equity.
Key words: public pensions, lifetime contributions, lifetime benefits, redistribution,
progressivity.
JEL classification: D31, H55, J26
Disentangling Annuities and Transfers: Redistribution in Greek Retirement Benefits
2
1. Introduction
Pensions represent the backbone of the Greek social protection system, providing households
with a far from negligible 36.1% of their total equivalised disposable income in 2011. Not much
remains for other social benefits (such as unemployment, family, sickness, housing and social
assistance benefits), accounting for a mere 4.4% of household disposable income (El.Stat.,
2013).
Expenditure on pensions is the second highest in the EU; from 12.3% of GDP in 2007 it reached
14.9% of GDP in 2011, two percentage points above the EU-28 average (Eurostat, 2014). At the
same time, although monetary poverty in old age has fallen significantly between the late 1990s
and 2011, it still remains well above the EU-28 average (17.2% versus 14.5% in 2011),
especially if poverty is measured by using a fixed poverty line (25.7% versus 13.5% in 2011,
with the poverty line being anchored in 2005 and adjusted for inflation).1 It appears that the
country’s pension system is failing to deploy the large resources it commands to meet
fundamental distributional objectives.
On top of its limited anti-poverty effectiveness, the Greek retirement pension system also seems
to be performing poorly with respect to intragenerational equity, i.e., with respect to the way it
treats different groups of retirees within the same generation (EC, 2010). In a context of large
institutional fragmentation, pension entitlements vary widely between different occupational
groups; as a result of that, workers with identical contributory records can be eligible for very
different pension benefits, depending on occupation, cohort or gender.
Since one of the main objectives of a pension system is to redistribute income over the life span
of individuals, their equity effects can be best examined by adopting a longitudinal approach.
This approach compares the balance between total contributions paid and total benefits
received by individuals throughout the course of their lives. If the present value of lifetime
benefits is equal to the present value of lifetime contributions, then retirement benefits can be
said to be equivalent to annuities, such as those offered by private insurers. The difference
between the two is the (implicit) transfer that can be either positive (i.e. a transfer received by
the rest of society) or negative (i.e. a transfer paid to the rest of society).
The objective of this paper is to identify the relative importance of annuities and transfers in
Greek retirement benefits and draw conclusions as to their impact on intergenerational and
1 While both poverty indicators reveal different parts of the same picture, the use of an anchored poverty line is arguably better suited to periods of rapid change in living standards, as is the case in Greece since 2009.

Disentangling Annuities and Transfers: Redistribution in Greek Retirement Benefits
3
intragenerational equity. Annuities and transfers are calculated according to the rules that were
in place both before and after the major pension reform that took place in Greece in 2010. The
impact of the 2010-13 austerity measures on lifetime pension benefits is also taken into
account. The research focuses on main old-age pensions, leaving aside survivors’, invalidity and
supplementary pensions. The methodological line of inquiry involves the analysis of a
representative sample of 2008 retirees from IKA, the country’s largest social insurance fund for
private sector workers.
The importance of identifying the relative weight of annuities and transfers in Greek retirement
benefits is twofold. Establishing that current pension system rules severely violate inter-
generational equity would strengthen the case for pension reforms. On the contrary, finding that
the relevant transfers are not significantly higher than zero would inevitably call into question
the legitimacy of reforms, as the latter would mean that pensioners have “earned” their
pensions through their and their employers’ contributions during their working life, and
therefore attempts by governments to cut back their entitlements would amount to a breach of
the implicit social contract.
Moreover, even if net transfers are zero on aggregate, they may still be taking place between
different categories of pensioners. These may be entirely consistent with stated public policy
goals: this is the case when low earning workers are awarded pension benefits that are above
their lifetime contributions, since without the implicit transfer the level of pension benefit
corresponding to a pure annuity would fail to provide adequate pension income. Alternatively,
transfers between different categories may be perverse, as when workers with identical
contributory histories end up receiving pension benefits that differ significantly in value (which
constitutes a violation of horizontal equity), or when redistribution is from low to high earners
(which is a violation of vertical equity). Hence, determining the pattern of annuities versus
transfers and clarifying the nature of intra-generational redistribution between groups is of
relevance and interest.
The main findings of this paper can be summarised as follows. The present value of IKA main
old-age pensions is estimated to exceed the present value of lifetime contributions by wide
margins. The 2010-2013 austerity measures have led to an increase in the progressivity of
transfers received, significantly reducing the non-contributory part of pensions paid to retirees
with the highest amounts of lifetime contributions. Finally, it is estimated that, on average, the
new pension system established by the 2010 reform will further reduce (but not fully eliminate)
the non-contributory part of old-age pensions provided by IKA.

Disentangling Annuities and Transfers: Redistribution in Greek Retirement Benefits
4
The structure of the paper is the following. Section 2 presents the main features of the Greek
pension system before and after the 2010 reform; section 3 offers a literature review of the
subject; section 4 explains the methodology of the study; section 5 reports the results and
discusses the main findings of the research; section 6 reflects on the policy implications of the
findings, on the limitations of the approach and on issues for further research.
2. Overview of the Greek pensions system
Retirement pensions in Greece are public and have a compulsory character. They work at a pay-
as-you-go basis: the contributions of current workers (and their employers) are financing
current pension recipients. The state is the ultimate responsible for covering any shortages
between contributions and pension expenditure. Contributions/pensions are
collected/provided by a large number of social security organisations, called funds. This
plethora of funds stems from historical reasons, as they were gradually created to insure people
working in different economic sectors. Workers can be insured to one or more primary funds.
They can also be insured in supplementary funds. Most of the latter were created in the early
1980s in order to enhance pensioners’ incomes. In addition, some workers such as public sector
workers, some groups of professionals and private sector employees also contribute towards a
lump-sum separation payment which is received at the time of retirement. Hence, the Greek
pension system is segmented both in a horizontal (i.e. across economic sectors) and in a vertical
way (i.e. by levels of pension receipt, i.e. main, supplementary and separation pension
payments).
Pension reform has been high on the political agenda since the early 1990s (see Featherstone,
2005; Tinios, 2005; Sakellaropoulos and Angelaki, 2007; Vlachantoni, 2007; Matsaganis, 2010;
Tinios, 2010). The pension reform of 1992 created a new, more uniform -and also significantly
less generous- system for those entering the labour market from 1993 onwards: the age limit
was set to 65 for both men and women, the minimum contribution period was set to 15 years,
the calculation of pensionable earnings was fixed to the average of the five final employment
years, replacement rates (i.e. the pension benefit as a percentage of income upon retirement)
were reduced, contributions rates were increased and a tripartite financing mechanism was
introduced. According to this mechanism, employees, employers and the state had to provide
2/9, 4/9 and 3/9 of total social insurance contributions respectively. While this reform reduced
some of the inequities of the previous situation, especially those arising from the unequal
treatment of private and public sector employees, it also created a new important segmentation:
between pre and post-1993 entrants to the labour market.

Disentangling Annuities and Transfers: Redistribution in Greek Retirement Benefits
5
A few years later, with the pension reform of 2002 replacement rates for all workers were set
equal to 70% of pensionable income. The calculation of pensionable earnings became somewhat
more favourable for those first-insured before 1993, by being calculated as the average of the
best five years of the decade before retirement. Finally, the yearly state contribution to the
financing of retirement benefits of workers belonging to the post-1993 regime was changed and
set equal to 1% of GDP.
In 2008 another piece of legislation tried to tackle the horizontal fragmentation of the Greek
social insurance system by consolidating the 155 existing social insurance funds into 13; five
responsible for the provision of main pensions, eight for supplementary and two for separation
payments. This consolidation was criticised as being mostly on paper, since in reality many of
the merged funds were allowed to keep their autonomy and their special contribution and
pension benefit regulations. The five funds that are responsible for the delivery of primary
pensions are: i) IKA - for most private sector employees; ii) ΟΓΑ - for farmers; iii) ΟΑΕΕ - for
most self-employed workers; iv) ΕΤΑΑ - for doctors, pharmacists, lawyers and engineers; and v)
ΕΤΑΠ-ΜΜΕ - for employees working in the media sector. Civil servants’ pensions are paid
directly from the state budget.
In December 2013 the largest of these five funds was IKA, providing 984,525 primary pensions.
It was followed by OΓA and OAEE, which provided 714,829 and 355,039 primary pensions
respectively. ΕΤΑΑ and ΕΤΑΠ-ΜΜΕ are much smaller, providing primary pensions to 80,315
and 8,115 individuals respectively. Finally, primary pensions were paid by the state budget to
453,407 retired civil servants (Ministry of Labour, Social Security and Welfare, 2013).
Descriptive statistics on the distribution of pensions by type and fund are provided in the
Appendix (Tables A1-A3).
Primary pensions are subject to a guaranteed minimum threshold, intended to ensure that no
pension falls below this specified level. The thresholds applicable in IKA in 2004-2014 are
shown in Table 1.

Disentangling Annuities and Transfers: Redistribution in Greek Retirement Benefits
6
Table 1. IKA minimum monthly primary old-age pension amounts (2004-2014)
year single with spouse with spouse
+ 1 child with spouse + 2 children
with spouse + 3 children
2004 411.77 442.06 461.73 481.15 500.64 2005 428.24 459.74 480.20 500.40 520.40 2006 445.37 478.13 499.41 520.42 541.50 2007 463.39 498.16 521.37 544.44 567.59
Jan 2008 – Sept 2008 477.29 513.10 537.01 560.77 584.61
Oct 2008 – 2014 486.84 523.37 547.76 571.99 596.31
Source: IKA.
2.1 The 2010 pension reform
In 2010, pension reform returned to the top of the political agenda in the context of the
country’s economic crisis: the Memorandum of Economic and Financial Policies that was signed
in return for the €110 billion loan agreed on with the European Commission, the European
Central Bank and the International Monetary Fund (known as ‘Troika’) contained the blueprint
of a drastic pension reform. The reform (Law 3865/10 for public sector workers and 3863/10
for all other workers) established a new pension structure starting in 2015. The retirement age
was set to 65 for all workers with a contributory record of at least 15 years and 62 for workers
with a contribution record of at least 40 years. The new structure combines a tax-funded basic
pension with a contributory proportional pension.
With respect to the proportional pension, accrual rates vary by length of insurance period. The
return on contributions ranges from 0.8% per year for a contributor with less than 15 insurance
years, to 1.5% per year for one with 40 or more insurance years. As noted in Matsaganis and
Leventi (2011), although this gradual progression was meant to serve as a motivation for
workers to stay longer in employment, it might also increase the risk that low-paid workers
with uncertain career prospects see little incentive to pay pension contributions at all. The
calculation of pensionable earnings was extended from the average of the best five years of the
decade before retirement to the average of lifetime earnings. In cases of early retirement, the
basic pension is reduced by 1/200 for each month short of age 65.
The basic pension, fixed at €360 per month in 2010 prices and paid 12 times a year, is available
with no means test to all recipients of a proportional pension with a contributory record of at
least 15 years. The full rate is payable at age 65, reduced pro rata for those who were resident in
the country for fewer than 35 years between the ages of 15 and 65. In cases of early retirement
the basic pension is reduced by 6% each year short of age 65.

Disentangling Annuities and Transfers: Redistribution in Greek Retirement Benefits
7
The total pension amount (basic plus proportional) is subject to a guaranteed minimum
threshold. This is equal to the equivalent of 15 minimum daily wages per month, as defined in
the National Collective Labour Agreement for 2015. Since February 2012 the minimum wage is
statutory, i.e. set unilaterally by the government rather than by the social partners in the context
of collective bargaining. The daily minimum wage was reduced from €33.57 to €26.18 (hence
€392.70 per month) for employees over 25 and hasn’t changed since. An indexation system was
also introduced: since January 2014 pensions are supposed to be indexed by the average of the
previous year’s inflation and GDP growth, with inflation being used as an upper threshold.2 The
new pension laws allow pension spending to grow faster than GDP but set a ceiling at 2.5
percentage points relative to 2009 (exceeding that will trigger corrective action).
Finally, according to the 2010 pension reform persons aged 65 and over with a contributory
record shorter than 15 years are also eligible for the basic pension, but only if they pass a means
test: personal/family income must be below €5,400/€10,800 per year (in 2010 prices). Same as
the non means-tested version of the basic pension, it is also reduced by 1/35 for each year short
of 35 that people have spent abroad between the ages of 15 and 65.
In 2013 the retirement age was raised by two more years, to 67 for workers with a contributory
record of 15-39 years (and for the recipients of the means-tested basic pension) and to 62 for
workers with a contribution record of 40 years or more. Special regulations apply for people
working in hard and arduous occupations3 and for women with dependent children.
2.2 Austerity measures related to pensions
Under the terms of the 2010 Memorandum and its regular revisions pensions have been subject
to various forms of cuts.
Pension cuts
Christmas, Easter and summer bonuses, amounting to two months’ pay, were abolished in
2010.4 They were replaced by flat-rate vacation allowances totalling €800 a year, payable to
pensioners aged over 60. If average pensions plus bonuses exceeded €2,500 per month,
2 At the time of writing (December 2014) this indexation rule has not been applied. The freezing of pensions until 2017 was being discussed between the Greek government and the Troika.
3 Special category of contributors who are eligible for early retirement in exchange for somewhat higher contributions.
4 Invalidity pensions, farmers’ basic pensions, social pension and pensions below €400 were not subject to this change.

Disentangling Annuities and Transfers: Redistribution in Greek Retirement Benefits
8
bonuses were provided up to the approach of that threshold. In January 2013 these allowances
were also abolished.5
Pensioners’ solidarity contributions
The first special levy on pension incomes (labelled ‘Pensioners’ solidarity contribution’) was
introduced in August 2010. Since then, a large number of such levies were legislated. These are
presented in Table 2.
Table 2. Pensioners’ solidarity contributions (2010-2013)
3. Literature review
Although the importance of disentangling the annuity from the transfer component of public
pensions has been discussed in theoretical terms both in the economics literature (Feldstein
and Siebert, 2002) and in policy documents (Queisser and Whitehouse, 2006; World Bank,
1994), the empirical research on the issue remains relatively limited. The most important
problem that these studies face is the lack of adequate data. Only in very few countries (such as
U.S.A. and Germany) there exist income data covering a sufficiently large sample over a long
period. For this reason, simulation techniques have often been used in order to generate data
(i.e. lifetime flows of labour income of hypothetical workers) that are then used to compute the
net present value of lifetime contributions and benefits.
5 The 13th and 14th monthly installments of invalidity pensions, social pensions and farmers’ basic pensions were also abolished.
year description
2010
Introduction of pensioners’ solidarity contribution, i.e. a special levy on main pensions, with rates between 3% for pensions above €1,400 per month to 14% for pensions above €3,500 per month.
2011
a. Increase in pensioners’ solidarity contribution’s rates (varying from 3% to 14%)
b. Introduction of additional pensioners’ solidarity contribution for pensioners below 60 with main pensions exceeding €1,700 per month, with rates between 6% and 10%.
c. Pensioners below (above) 55 with main old-age pensions exceeding €1,000 (€1,200) were subject to an extra solidarity contribution equal to 40% (20%).
2012 Main old-age pensions exceeding €1,300 were subject to an extra 12% contribution.
2013 If the sum of main and supplementary pensions exceeds €1,000 they are subject to an additional levy varying from 5% to 20%.

Disentangling Annuities and Transfers: Redistribution in Greek Retirement Benefits
9
A comprehensive review of the existing empirical studies in several European countries and the
U.S. can be found in Grammenos et al. (2006). Keeping in mind that the estimates of these
studies rely on different sets of assumptions and make use of various methodological strategies,
the literature on the lifetime redistributive impact of pension systems seem to be offering the
following key insights: (a) with respect to intragenerational redistribution, most pension
systems appear to favour low-income groups (with the exception of some studies for Italy and
Spain), female over men, married over single persons and employees over self-employed; (b)
with respect to intergenerational redistribution, average transfers rates are found to be positive
in all pension systems studied (c) recent pension reforms seem to have weakened the
progressive redistributive pattern of most pension systems and to have reduced the transfer
component of pensions.
Moving to the case of Greece, to the best of our knowledge, the only relevant available research
is the study of Mylonas and de la Maisonneuve (1999). The authors calculate the ratio of the
present value of lifetime pension benefits to contributions and the annual rate of return of
contributions under various hypothetical work and retirement scenarios. Their baseline
scenario involves male workers in five economic sectors6, starting their employment career at
age 25 and retiring after 35 years, having equivalent salary paths (indexed to 100 at the start of
their career and growing annually by 2% in real terms) and making pension contributions
according to the contribution rates in place in each sector both before and after a major reform
that took place in 1992. Pensions are indexed to inflation, remain constant in real terms and are
received for a period of 15 years.
The main conclusion of this work is that the pre-reform contribution and replacement rates
differ widely across sectors, but both of them are very high in all five sectors studied; in each
occupational sector, the present value of main pension payments exceeds the present value of
contributions by wide margins, often higher than 2:1. In the baseline scenario, civil servants
seem to have by far the most generous main pension scheme, with a rate of return equal to 4.6.
They are followed by employees in public enterprises, farmers, own account and self-employed
workers and, finally, private sector employees with a rate of return equal to 0.9. Though the
post-reform system is considerably less generous than any of the pre-reform regimes, the
present value of lifetime main pension benefits continues to exceed the present value of lifetime
contributions; its internal rate of return (i.e. the discount rate at which the present value of
6 The authors study the following occupational sectors: (i) private sector employees; (ii) own account and self-employed workers; (iii) farmers; (iv) civil servants and (v) employees in public enterprises.

Disentangling Annuities and Transfers: Redistribution in Greek Retirement Benefits
10
lifetime pension benefits is equal to the present value of lifetime pension contributions) is
estimated to be equal to 0.2.
It becomes obvious that workers that are identical in all respects apart from membership in a
social insurance fund are treated very differently, and in ways that severely violate the rules of
inter-generational equity. Are these results still valid two decades later full with (less, or more
successful) pension reform attempts? How representative is the type of employee/pensioner
described in the baseline scenario of Mylonas and de la Maisonneuve? The following sections
attempt to shed light on these highly contested issues.
4. Data and methodology
In general, disentangling annuities and transfers in retirement benefits amounts to estimating
the present value of lifetime contributions and comparing it to the present value of lifetime
pension benefits usually at the time of retirement. In order to do that, a representative sample
of 2008 retirees was used. The sample was provided by IKA, the country’s largest social
insurance fund, and covered 5,430 old age pensioners, i.e. 15.7% of all IKA contributors who
retired on an old-age pension in 2008. More specifically, it contained information on the
following variables:
• Gender
• Age at retirement
• Length of contribution record
• Type of occupation (‘hard and arduous’ or not)
• Insurance class7 at the time of retirement
• Total pension amount
• Legal basis for retirement8
• Total pension amount
After omitting observations with missing information regarding their insurance class, age,
number of contribution days, as well as people with acquired pension rights from countries
other than Greece and individuals previously contributing to funds that were administratively
merged with IKA in 2008, the final sample was reduced to 4,795 observations (i.e. 14.7% of all
7 In IKA social insurance contributions are related to workers’ “reference earnings”. Reference earnings reflect the notional earnings for every one of IKA’s 28 insurance classes where private sector employees are placed according to their actual earnings.
8 The law that was used for the pension entitlement to be claimed.

Disentangling Annuities and Transfers: Redistribution in Greek Retirement Benefits
11
IKA old-age retirees in 2008). The distribution of the sample’s pensioners by retirement age and
gender is presented in Figure 1. The average retirement age is 60.8 for men and 58.4 for women.
The distribution has three local maxima for men at the ages of 61, 59 and 66 and three for
women at the ages of 56, 61 and 51. Individuals retiring below 60 (65) represent 45.9%
(87.5%) of the total sample.
Figure 1. Distribution of IKA old-age retirees by retirement age
Source: Own estimations based on the sample of old-age pension retirees of year 2008, provided by IKA.
Although it has not been possible to gain access to workers’ full record of contributions paid as
such information is not available, we have been able to calculate their last notional monthly
earnings (and hence contributions paid) by using the information on their insurance class at the
time of retirement (see Figure 2).9 The distribution of IKA old-age retirees according to the
length of their contributory record is shown in Table 3. The backward induction of earnings
throughout the whole contributory period was made by assuming that the workers’ earnings
rose in line with minimum wages. The evolution of the minimum wage in 1973-2007 and IKA’s
social insurance contributions formulae for main pensions are presented in the Appendix
(Tables A4-A5).
9 By using employees’ insurance class in order to reconstruct their last notional daily earnings, we have also been able to take into account IKA’s upper earnings threshold, which is applicable to both employers’ and employees’ social insurance contributions. Note that employees’ last (notional) earnings refer to year 2007.
0%
2%
4%
6%
8%
10%
12%
14%
16%
18%
20%
41 43 45 47 49 51 53 55 57 59 61 63 65 67 69 71 73 75 77 79
% o
f re
tire
es
retirement age
men (%)
women (%)

Disentangling Annuities and Transfers: Redistribution in Greek Retirement Benefits
12
Figure 2. Distribution of IKA old-age retirees according to their last monthly notional earnings by sex
Note: Employees’ last notional earnings refer to year 2007. The average last salary was €1,595 for men and €1,276 for women.
Source: Own estimations based on the sample of old-age pension retirees of year 2008, provided by IKA.
Table 3. Distribution of IKA old-age retirees according to their contributory record
contribution years men
(as % of all) women
(as % of all) all (%)
<=15 5.8 9.7 15.5 16-20 9.1 13.0 22.1 21-25 7.9 8.9 16.8 25-20 7.8 6.0 13.9 31-35 13.5 4.4 17.9 >=36 11.9 2.0 13.9
Notes: Average contribution years: 28 for men and 22 for women. Minimum contribution years: 11. Maximum contribution years: 51
Source: Own estimations based on the sample of old-age pension retirees of year 2008, provided by IKA.
Actuarial fairness requires lifetime contributions to be equal to lifetime benefits, as if
contributions were paid not into a defined-benefit pay-as-you-go scheme, but into a defined-
contribution funded one. This begs two questions: first, what a reasonable return on
contributions, had they been invested in a funded pension scheme, might have been. Second,
what rate might be applied at the time of retirement in order to convert the stock of
0
5
10
15
20
25
30
% o
f re
tire
es
last monthly notional earnings (€)
men
women
all

Disentangling Annuities and Transfers: Redistribution in Greek Retirement Benefits
13
accumulated contributions into a flow of periodic payments (‘annuities’). As regards the first
question, we work with two assumptions: (a) return equal to 2% in real terms, i.e. providing
full protection against inflation risk plus a premium, or (b) return equal to that of yearly
government bonds, i.e. assumed to be providing considerable protection against investment
risk. The first assumption is part of the baseline scenario, whereas the second one is used as a
sensitivity check. For example, under assumption (a) an investment of €100 in 1961 would
yield €18,209 in 2007; the same investment would yield €9,802 under assumption (b). On the
other hand, an investment of €100 in 1985 would yield €1,010 in 2007 under assumption (a)
and €1,205 and under assumption (b).
Note that in reality pension funds tend to invest in safer assets, such as bonds,10 and impose
investment restrictions in certain asset categories, such as equities or property.11 Inflation and
yearly Greek government bond returns in 1961-2007 are presented in Figure 3.
Figure 3. Inflation and yearly government bond returns (1961-2007)
Sources: El.Stat. (annual average rate of change of Harmonized Index of Consumer Prices- HICP), Bank of Greece (annual average rate of return of 52-week government bonds).
10 Even though bonds are usually considered as a safe option for an investment portfolio, in Greece pension funds were subject to significant losses in 2011 due to the 53% ‘haircut’ of Greek bonds in the context of the PSI (‘Private Sector Involvement’) programme. 11 The vast majority of OECD countries set quantitative limits on the investment decisions of pension funds. Investments in equities are capped in 21 out of the 34 OECD countries (OECD, 2014).
-5%
0%
5%
10%
15%
20%
25%
30%inflation
yearly government bond returns

Disentangling Annuities and Transfers: Redistribution in Greek Retirement Benefits
14
Valuing this income stream in the year in which retirement takes place (2008), the total social
insurance contributions amount would be the cumulated sum of employees’ and employers’
contributions revalued at these implicit interest rates.
As regards the second question, the present value of lifetime pension benefits was computed on
the basis of the following assumptions:12
• The period for which benefits are received is equal to the life expectancy at the age of
retirement. Information on life expectancy at selected ages for both men and women can be
found in the Appendix (Table A7).13
• In line with the relevant literature, the discount rate applied to express the future stream of
pensions in terms of present values (i.e. 2008) in the baseline scenario is set equal to 2%.14
By way of sensitivity analysis, the rate of return of 15 and 32-year government bonds in
2008 (i.e. 4.76% and 4.95% respectively) were linearly expanded in order to construct a
series of returns that corresponds to the life expectancy of each retiree, ranging from 4.68%
(for retirees with life expectancy equal to 8 years) to 5.04% (for retirees with life
expectancy equal to 40 years).
So far we have discussed how we estimate actuarial fairness of pension benefits as of 2008.
However, as has been seen in the previous sections, the 2010-2013 austerity measures have
significantly affected the amounts of main pensions. The 2010 pension reform also provides for
a completely different calculation of pensions. In our attempt to account for these
developments, three different scenarios have been constructed:
1. Pre-austerity scenario: in this scenario we assume that pension amounts are paid 14
times per year. In 2009-2013 they are uprated in line with the harmonised consumer
prices index and from 2014 onwards they are assumed to remain constant in their 2013
levels.
2. Post-austerity scenario: in the scenario we simulate in a gradual way (i.e. year by year,
taking into account the exact month that each measure was introduced) the austerity
measures related to main pensions that were legislated in the period 2010-2013, as
12 The detailed process that has been followed for the calculation of the present value of lifetime contributions and benefits of ΙΚΑ retirees is available upon request (VBA code).
13 Note that in the sample of IKA retirees average life expectancy is 20.7 years for men and 25.5 years for women. 14 This rate is also close to the one actually used in countries that have adopted notional defined contribution pension systems such as Sweden and Italy (1.6% and 1.5% respectively).

Disentangling Annuities and Transfers: Redistribution in Greek Retirement Benefits
15
described in Section 2.3.2. From 2014 onwards pension amounts are assumed to remain
constant in their 2013 levels and to be paid 12 times per year.15
3. 2010 pension reform scenario: in this scenario we re-calculate pensions received in 2008
according to the rules that were established by the 2010 pension reform (as described in
Section 2.3.1). In other words, we estimate the pension amounts that retirees would have
received if the rules established by Law 3863/10 had been applicable in 2008. In order to -
partially- take into consideration the high disincentives for retirement that this reform has
introduced for people with short contribution histories, retirees with less than 4,500 days
of contributions are excluded from the sample (196 cases). These pension amounts are
assumed to remain constant throughout the lives of retirees and to be payable 12 times per
year.
Table 4 presents the 2014 yearly16 average pension amounts of the three scenarios per decile,
as well as their percentage changes. The sample’s observations have been ranked in deciles
according to the present value of lifetime contributions; as lifetime contributions are the same
in all three scenarios, this ranking guarantees that the estimated changes are not due to re-
ranking effects. We estimate that the average decrease in main old-age IKA pensions due to the
2010-2013 austerity measures has been 28.8%. Interestingly, average reductions are uniform
for deciles 1-6; this finding suggests that these deciles have only been affected by the austerity
measures related to the provision of the 13th and 14th monthly pension instalments. As we move
on to higher contribution deciles, the estimated average reductions become much larger,
exceeding 38% for decile 10. Assuming that the pension system introduced by Law 3863/10
had been in place throughout the lives of the 2008 retirees (column 3), we estimate that average
pensions would have been 9.3% lower compared to the post-austerity scenario.17 Changes in
average pensions paid to deciles 1-6 are found to be rather limited - and positive for deciles 2-4.
Again, as we move to higher contribution deciles, reductions in the average pension amounts
are estimated to exceed 10%, and to reach a maximum of 17.5% for decile 9. This seems to be
the combined effect of the introduction of the basic pension amount (which is common for all
retirees, irrespective of contributions paid) and the new benefit computation formula that takes
15 By remaining constant in their 2013 levels, pensions are allowed to decrease in real terms. In principle, this is in accordance with the rules established by the 2010 pension reform. It is also an indirect way of taking into account the possibility of further pension cuts in the near future, followed by pension increases in the longer term.
16 Pensions are presented in yearly terms in order to take into account the austerity measures related to the provision of the 13th and 14th monthly pension instalments. 17 Comparisons are made with the post-austerity (rather than the pre-austerity) scenario, as this is the one actually in place in 2014.

Disentangling Annuities and Transfers: Redistribution in Greek Retirement Benefits
16
into account the earnings of the whole working life of individuals rather than those of the last
few years.
Table 4. Average pension amounts per decile (2014, yearly amounts)
deciles pre-austerity
(1) post-austerity
(2) 2010 pension
reform (3) % change (1) vs (2)
% change (2) vs (3)
1 6,855.6 5,368.9 5,212.9 -21.8 -2.9 2 7,178.6 5,621.9 5,743.8 -21.6 2.2 3 7,703.4 6,032.9 6,159.3 -21.7 2.1 4 8,331.1 6,524.5 6,531.6 -21.7 0.1 5 9,211.6 7,214.0 7,156.9 -21.7 -0.8 6 10,836.0 8,482.6 8,116.0 -21.7 -4.3 7 13,576.9 10,504.8 9,332.6 -22.6 -11.2 8 17,111.4 12,769.7 10,801.4 -25.4 -15.4 9 23,111.4 15,806.0 13,041.9 -31.6 -17.5 10 28,201.5 17,442.6 15,013.7 -38.2 -13.9 all 13,456.2 9,735.7 8,831.1 -28.8 -9.3
Notes: Deciles are constructed on the basis of the present value of lifetime contributions. The rate of return on contributions is equal to 2% in real terms. Pensions are in € per year. For comparative reasons, retirees with less than 4,500 days of contributions have been excluded from the sample in all three scenarios (n = 4,599).
Source: Own calculations, based on the IKA sample of 2008 retirees.
The main objective of this research is to quantify the transfer component of IKA main
pensions, as described in the three above-mentioned scenarios. Let NPVC denote the net present
value of lifetime social insurance contributions and NPVB denote the discounted value of
lifetime pension benefits. Both income streams are valued in year 2008. The transfer
component of pensions is defined as:
Transfer component (%) = (NPVB – NPVc) / NPVB
If positive, the transfer component represents the implicit subsidy paid to pensioners by
taxpayers, as a proportion of the lifetime pensions received. If negative, it represents the
implicit subsidy paid from pensioners to taxpayers. In this context, a pension system can be
defined as progressive if the transfer component is higher for those situated in the lower
contribution deciles of Table 5 and decreases as we move to higher deciles. A pension systems
that attempts to combine the (conflicting) objectives of actuarial fairness with progressive
redistributive would feature a close-to-zero average transfer component; this would be the joint
effect of positive transfers to those on low lifetime contributions, smoothly declining as
contributions rise. The transfers would have to be reasonably small, so that they do not create
incentives for early retirement or contribution evasion.

Disentangling Annuities and Transfers: Redistribution in Greek Retirement Benefits
17
Since lifetime contributions were assumed to be treated as an investment, the internal rate of
return (IRR) of this ‘investment’ was also calculated. The IRR is defined as the discount rate at
which the present value of lifetime pension benefits NPVb is equal to the present value of
lifetime pension contributions NPVc. If the IRR is greater than the discount rate used to express
the future stream of pensions in terms of present values then the system is considered to have
an implicit rate of return that is higher than the actuarially fair rate of return.
5. Results and discussion
Have IKA old-age pensioners who retired before the current crisis ‘earned’ their pensions
through their (and their employers’) contributions? Or was their retirement subsidised by
current and, especially, future generations of taxpayers? More formally, what proportion of
their pension benefits was ‘annuities’ (i.e. corresponded to the pension contributions they and
their employers had paid over their working life), and what was ‘transfers’ (i.e. amounted to a
subsidy paid for by society at large)? How did the 2010-2013 austerity cuts affect the relative
shares of annuities vs. transfers? How would these shares change if pensions in 2008 were
calculated according to the rules established by the 2010 pension reform? In this section we
attempt to provide some tentative answers to these questions.
5.1 Transfer component of IKA main old-age pensions
Table 5 presents the share of lifetime contributions of each decile for both men and women. It is
estimated that individuals in the first five deciles have accumulated a relatively low amount of
contributions: their share is almost 25% of total contributions. On the other hand, the share of
decile 10 alone (i.e. the 10% of the sample with the highest lifetime contributions) is estimated
to be as high as 22% of total contributions. Women’s lifetime contributions are found to be
significantly lower than men’s. This can be explained by women’s shorter employment careers
(22 years on average versus 28 for men – also see Table 3) as well as their lower earnings at the
time of retirement: 38.1% of women received less than €1,000 as a final monthly -notional-
salary, whereas the respective percentage for men was 10.4% (also see Figure 2). Table 6 also
shows that the share of men (women) rises (falls) steeply as we move from lower to higher
deciles. In fact, in decile 10 only 12% of observations are women.

Disentangling Annuities and Transfers: Redistribution in Greek Retirement Benefits
18
Table 5. Relative frequency distribution of lifetime contributions
deciles share of contributions (%) as % of observations
men women all men women
1 0.4 2.0 2.4 17.9 82.1 2 1.2 2.6 3.8 31.9 68.1 3 1.9 3.1 5.0 38.1 61.9 4 3.0 3.1 6.1 49.1 50.9 5 4.3 3.2 7.5 56.9 43.1 6 6.1 3.2 9.3 64.9 35.1 7 7.9 3.6 11.5 68.8 31.3 8 9.6 4.7 14.3 67.2 32.8 9 14.0 4.2 18.2 77.1 22.9 10 19.2 2.5 21.7 87.9 12.1 all 67.7 32.3 100.0 56.0 44.0
Notes: Deciles are constructed on the basis of the present value of lifetime contributions. The rate of return on contributions is equal to 2% in real terms.
Source: Own calculations, based on the IKA sample of 2008 retirees.
The share of lifetime benefits of each contribution decile is presented in Table 6. We can see that
the shares increase as we move to higher contribution deciles in all estimated scenarios. The
share of benefits held by the 30% of the sample with the highest lifetime contributions
decreases from 52% in the pre-austerity scenario to 49% in the post-austerity scenario and to
46% in the 2010 pension reform scenario. As seen in Section 2, under the regime established by
Law 3863/10 pension benefits have a basic and a proportional part. We estimate that the basic
part of total lifetime pensions declines monotonically from 82.7% for decile 1 to 28.8% for
decile 10. Note that, in total, the basic part of lifetime pension benefits is found to be almost
equal to the proportional one.
Table 6. Relative frequency distribution of lifetime benefits (ranked by lifetime contributions)
deciles pre-austerity post-austerity 2010 pension reform
total benefits …of which,
basic part (%) …proportional
part (%)
1 5.1 5.4 5.4 82.7 17.3 2 5.6 5.9 6.1 75.2 24.8 3 5.9 6.3 6.2 70.1 29.9 4 6.5 6.9 7.6 66.1 33.9 5 7.0 7.4 8.5 60.3 39.7 6 8.1 8.6 9.5 53.3 46.7 7 10.1 10.7 10.9 46.4 53.6 8 13.1 13.3 12.8 40.0 60.0 .09 17.5 16.7 15.4 33.2 66.8 10 21.2 18.7 17.5 28.8 71.2 all 100.0 100.0 100.0 49.0 51.0
Notes: Deciles are constructed on the basis of the present value of lifetime contributions.
Source: Own calculations, based on the IKA sample of 2008 retirees.

Disentangling Annuities and Transfers: Redistribution in Greek Retirement Benefits
19
Tables 7-9 present the average transfer components of IKA main old-age pensions that were
estimated in the pre-austerity, post-austerity and 2010 pension reform scenarios, by
contribution decile. Separate estimates are provided for both men and women. Figure 4
compiles the overall estimates into a single graph. Average lifetime transfer amounts (in 2008
euros) per contribution decile are also presented in the tables and assembled together in Figure
5.
We observe that in all three scenarios the average transfer component of pensions is well above
zero; this finding suggests that the vast majority of transfers correspond to implicit subsidies
paid by current and future tax payers to the 2008 IKA retirees. In the pre-austerity scenario the
estimated average transfer reaches 49.3% of lifetime pension benefits. In absolute terms,
average lifetime transfers are estimated to be a bit more than €114 thousand. The 2010-2013
austerity measures seem to have reduced the transfer component by almost 14 percentage
points (to 35.8%) and the average transfer amount by approximately 55 thousand euros (to
€59.4 thousand) but still, 98.6% of retirees continue to receive positive transfers (versus 99.5%
of retirees in the pre-crisis scenario). In the 2010 reform scenario, the estimated transfer
component of pensions is reduced even further to 27.1% on average. In absolute terms, average
lifetime transfers slightly exceed €35 thousand, whereas the percentage of retirees receiving
positive transfers falls to 87.6%.
Focusing on gender differences, the non-contributory part of women’s pensions is estimated to
be significantly larger than that of men: by 14 percentage points on average in the pre-austerity,
19 percentage points in the post-austerity and more than 29 percentage points in the 2010
reform scenario. A reason that explains part of the difference in all three scenarios is biological:
women live longer than men. The existence of favourable legislation for women retiring in 2008
(i.e. allowing for earlier exit from work, special conditions for mothers of dependent children
etc.) exacerbates the disparities. The increase in the difference between the pre and post-
austerity scenarios implies that women were relatively less affected by the recent pension cuts
than men. This is because, as was previously shown, the austerity measures affected much
more severely deciles 9 and 10, and in these deciles men feature prominently. An equivalent
reasoning holds for the estimated increase in the difference between the post-austerity and the
2010 reform scenarios; the pension system introduced by Law 3863/10 mostly made a
difference to individuals with long contributory records and, as can been seen in Table 3, these
are typically men.
As can be seen in Figure 4, the estimated transfer paid to retirees belonging to the first decile
exceeds two-thirds of lifetime benefits in all three scenarios. This result is mostly due to the
Disentangling Annuities and Transfers: Redistribution in Greek Retirement Benefits
20
existence of minimum pensions, which are intended to ensure that all pensions reach at least a
specified minimum threshold.18
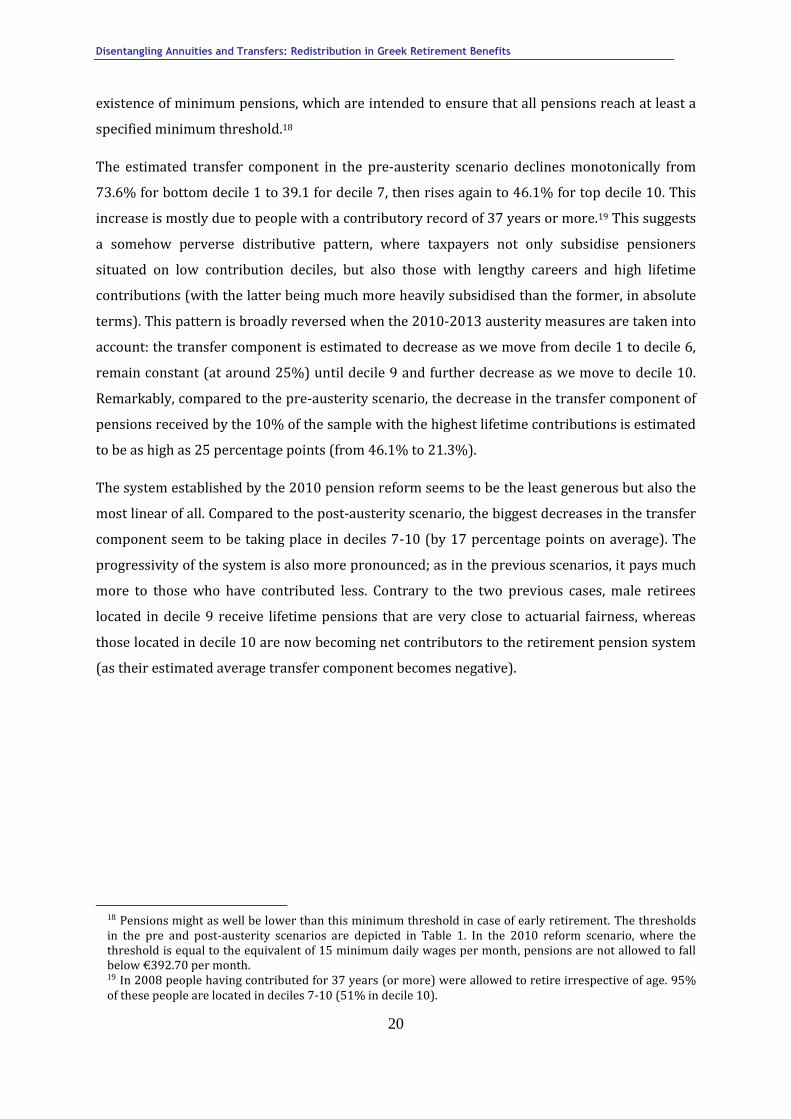
The estimated transfer component in the pre-austerity scenario declines monotonically from
73.6% for bottom decile 1 to 39.1 for decile 7, then rises again to 46.1% for top decile 10. This
increase is mostly due to people with a contributory record of 37 years or more.19 This suggests
a somehow perverse distributive pattern, where taxpayers not only subsidise pensioners
situated on low contribution deciles, but also those with lengthy careers and high lifetime
contributions (with the latter being much more heavily subsidised than the former, in absolute
terms). This pattern is broadly reversed when the 2010-2013 austerity measures are taken into
account: the transfer component is estimated to decrease as we move from decile 1 to decile 6,
remain constant (at around 25%) until decile 9 and further decrease as we move to decile 10.
Remarkably, compared to the pre-austerity scenario, the decrease in the transfer component of
pensions received by the 10% of the sample with the highest lifetime contributions is estimated
to be as high as 25 percentage points (from 46.1% to 21.3%).
The system established by the 2010 pension reform seems to be the least generous but also the
most linear of all. Compared to the post-austerity scenario, the biggest decreases in the transfer
component seem to be taking place in deciles 7-10 (by 17 percentage points on average). The
progressivity of the system is also more pronounced; as in the previous scenarios, it pays much
more to those who have contributed less. Contrary to the two previous cases, male retirees
located in decile 9 receive lifetime pensions that are very close to actuarial fairness, whereas
those located in decile 10 are now becoming net contributors to the retirement pension system
(as their estimated average transfer component becomes negative).
18 Pensions might as well be lower than this minimum threshold in case of early retirement. The thresholds in the pre and post-austerity scenarios are depicted in Table 1. In the 2010 reform scenario, where the threshold is equal to the equivalent of 15 minimum daily wages per month, pensions are not allowed to fall below €392.70 per month. 19 In 2008 people having contributed for 37 years (or more) were allowed to retire irrespective of age. 95% of these people are located in deciles 7-10 (51% in decile 10).

Disentangling Annuities and Transfers: Redistribution in Greek Retirement Benefits
21
Table 7. Average transfer component of pensions (%): pre-austerity scenario
deciles men women all average lifetime
transfer (€)
1 71.1 74.1 73.6 90,251 2 55.8 64.8 62.0 84,778 3 49.2 57.4 54.3 77,534 4 46.0 54.2 50.1 78,909 5 39.1 48.9 43.3 73,455 6 35.7 45.7 39.2 78,812 7 35.9 46.1 39.1 99,315 8 38.2 46.1 40.8 134,264 9 44.0 48.2 45.0 191,959 10 45.6 50.4 46.1 236,242 all 43.2 57.2 49.3 114,543
Notes: Deciles are constructed on the basis of the present value of lifetime contributions. The rate of return on contributions is equal to 2% in real terms.
Lifetime transfer = NPVB - NPVC (both income streams are valued in year 2008).
Source: Own calculations, based on the IKA sample of 2008 retirees.
Table 8. Average transfer component of pensions (%): post-austerity scenario
deciles men women all average lifetime
transfer (€)
1 65.3 68.4 67.9 68,636 2 46.8 56.7 53.6 60,499 3 38.6 47.7 44.2 52,076 4 34.4 43.4 39.0 50,579 5 25.9 36.9 30.6 43,158 6 21.5 32.9 25.5 43,163 7 21.1 33.0 24.8 53,013 8 22.0 31.5 25.1 66,969 9 24.0 30.5 25.5 81,045 10 20.4 27.7 21.3 75,074 all 27.3 46.5 35.8 59,421
Notes: Deciles are constructed on the basis of the present value of lifetime contributions. The rate of return on contributions is equal to 2% in real terms.
Lifetime transfer = NPVB - NPVC (both income streams are valued in year 2008).
Source: Own calculations, based on the IKA sample of 2008 retirees.

Disentangling Annuities and Transfers: Redistribution in Greek Retirement Benefits
22
Table 9. Average transfer component of pensions (%) – 2010 pension reform scenario
deciles men women all average lifetime
transfer (€)
1 61.6 68.7 67.3 62,145 2 44.9 59.3 54.8 59,860 3 34.4 49.0 44.0 51,504 4 30.0 44.5 37.5 47,522 5 21.3 37.3 28.2 38,667 6 14.9 30.9 20.5 32,433 7 9.6 24.3 14.2 26,542 8 3.8 20.5 9.3 22,430 9 1.1 16.2 4.5 14,918 10 -0.6 12.3 0.9 5,095 all 14.4 43.8 27.1 35,278
Notes: Deciles are constructed on the basis of the present value of lifetime contributions. The rate of return on contributions is equal to 2% in real terms.
Lifetime transfer = NPVB - NPVC (both income streams are valued in year 2008).
Source: Own calculations, based on the IKA sample of 2008 retirees.
Figure 4. Average transfer component of pensions by contribution decile (%)
Notes: Deciles are constructed on the basis of the present value of lifetime contributions. The rate of return on contributions is equal to 2% in real terms.
Source: Own calculations, based on the IKA sample of 2008 retirees.
0%
10%
20%
30%
40%
50%
60%
70%
80%
1 2 3 4 5 6 7 8 9 10
tran
sfer
co
mp
on
ent
(%)
contribution deciles
pre-austerity
post-austerity
2010 pension reform

Disentangling Annuities and Transfers: Redistribution in Greek Retirement Benefits
23
Figure 5. Average lifetime transfers by contribution decile (€)
Notes: Lifetime transfer = NPVB - NPVC (both income streams are valued in year 2008).
Deciles are constructed on the basis of the present value of lifetime contributions. The rate of return on contributions is equal to 2% in real terms.
Source: Own calculations, based on the IKA sample of 2008 retirees.
Figures 6 – 8 offer a visual representation of the relationship between lifetime contributions
and lifetime transfers under the three considered scenarios, as well as the fitted OLS regression
lines. The black solid line shows the scenario of actuarial fairness, where lifetime contributions
equal lifetime benefits. We can see that in all scenarios our explanatory variable (i.e. lifetime
contributions) explains around 85% of the variability of lifetime transfers around their mean.
The return on contributions, proxied by the slope of the fitted lines, is positive and decreases as
we move from the pre-crisis to the 2010 pension reform scenario (from 1.66 to 0.76). In the
latter, the fitted line is much closer to the line of actuarial fairness and goes below it when
lifetime contributions exceed €270 thousand.
0
20,000
40,000
60,000
80,000
100,000
120,000
140,000
160,000
180,000
200,000
220,000
240,000
1 2 3 4 5 6 7 8 9 10
mea
n li
feti
me
tran
sfer
s (€
)
contribution deciles
pre-austerity
post-austerity
2010 pension reform

Disentangling Annuities and Transfers: Redistribution in Greek Retirement Benefits
24
Figure 6. Scatter plot and fitted OLS regresion line: pre-crisis scenario
Notes: Both income streams are valued in year 2008.
Source: Own calculations, based on the IKA sample of 2008 retirees.
Figure 7. Scatter plot and fitted OLS regresion line: post-crisis scenario
Notes: Both income streams are valued in year 2008.
Source: Own calculations, based on the IKA sample of 2008 retirees.
0
100,000
200,000
300,000
400,000
500,000
600,000
700,000
0 100,000 200,000 300,000 400,000 500,000
lifet
ime
ben
efit
s (i
n €
)
lifetime contributions (in €)
R2 = 0.85
0
100,000
200,000
300,000
400,000
500,000
600,000
700,000
0 100,000 200,000 300,000 400,000 500,000
lifet
ime
ben
efit
s (i
n €
)
lifetime contributions (in €)
R2 = 0.86

Disentangling Annuities and Transfers: Redistribution in Greek Retirement Benefits
25
Figure 8. Scatter plot and fitted OLS regresion line: 2010 pension reform scenario
Notes: Both income streams are valued in year 2008.
Source: Own calculations, based on the IKA sample of 2008 retirees.
The high variability of transfers between different population sub-categories is clearly depicted
in Table 10. In all three scenarios the transfer part of pensions increases when retirement age
goes down. Even though the average transfer components are falling for all age clusters as we
move from the pre-austerity to the pension reform scenario, the difference in the transfer parts
between those retiring at the age of 55 or earlier and those retiring after they reach the age of
65 remains relatively stable (around 20 percentage points).
The pre-austerity system seems to be benefiting both those with the least contribution years as
well as those with the most. This picture seems to change drastically when pensions are
calculated according to the rules established by Law 3863/10; the non-contributory part of
pensions for those with the longest contribution histories (i.e. more than 31 years) decreases
substantially to less than 10 percent, i.e. almost 18 percentage points below the estimated
average of this scenario. The transfer component of retirees previously employed in hard and
arduous occupations is 6 percentage points below the average in the pre-austerity scenario, 7 in
the post-austerity and almost 12 in the 2010 pension reform scenario. On the other hand, the
respective transfer for mothers of dependent children seems to remain well above the average
(by more than 15 percentage points) in all three scenarios.
0
100,000
200,000
300,000
400,000
500,000
600,000
700,000
0 100,000 200,000 300,000 400,000 500,000
lifet
ime
ben
efit
s (i
n €
)
lifetime contributions (in €)
R2 = 0.84

Disentangling Annuities and Transfers: Redistribution in Greek Retirement Benefits
26
Table 10. Average transfer component of pensions by sub-categories (%)
scenarios
nr of cases (as % of total) pre-austerity post-austerity
2010 pension reform
retirement age <=54 62.3 51.2 44.1 7.4
55-59 51.0 36.7 28.6 38.5 60-64 47.3 33.7 24.0 41.6 >=65 43.4 30.5 22.8 12.5
contribution years <=15 62.6 54.7 53.4 15.5
16-20 56.5 46.8 44.7 22.1 21-25 45.4 32.9 29.2 16.8 25-20 39.4 24.8 16.7 13.9 31-35 42.5 24.6 8.6 17.9 >=36 46.7 26.0 9.6 13.9
hard and arduous no 52.4 39.6 33.0 64.2
yes 43.8 28.8 16.4 35.8 mothers of dependent children 60.4 53.9 49.4 6.3 all 49.3 35.8 27.1 100.0
Source: Own calculations, based on the IKA sample of 2008 retirees.
The results obtained so far have been based on the hypothesis that lifetime contributions are
converted to present values by using a rate of return equal to 2% in real terms. The use of a rate
of return equal to yearly government bonds does not seem to significantly affect the calculated
transfers or their distributional patterns; the average transfer components of pension benefits
are estimated to go slightly up in all three scenarios (from 49.3% to 50.3%, from 35.8% to 37%
and from 27.1% to 28.5% in the pre-austerity, post-austerity and 2010 pension reform
scenarios respectively).
5.2 Internal rates of return of main old-age IKA pensions
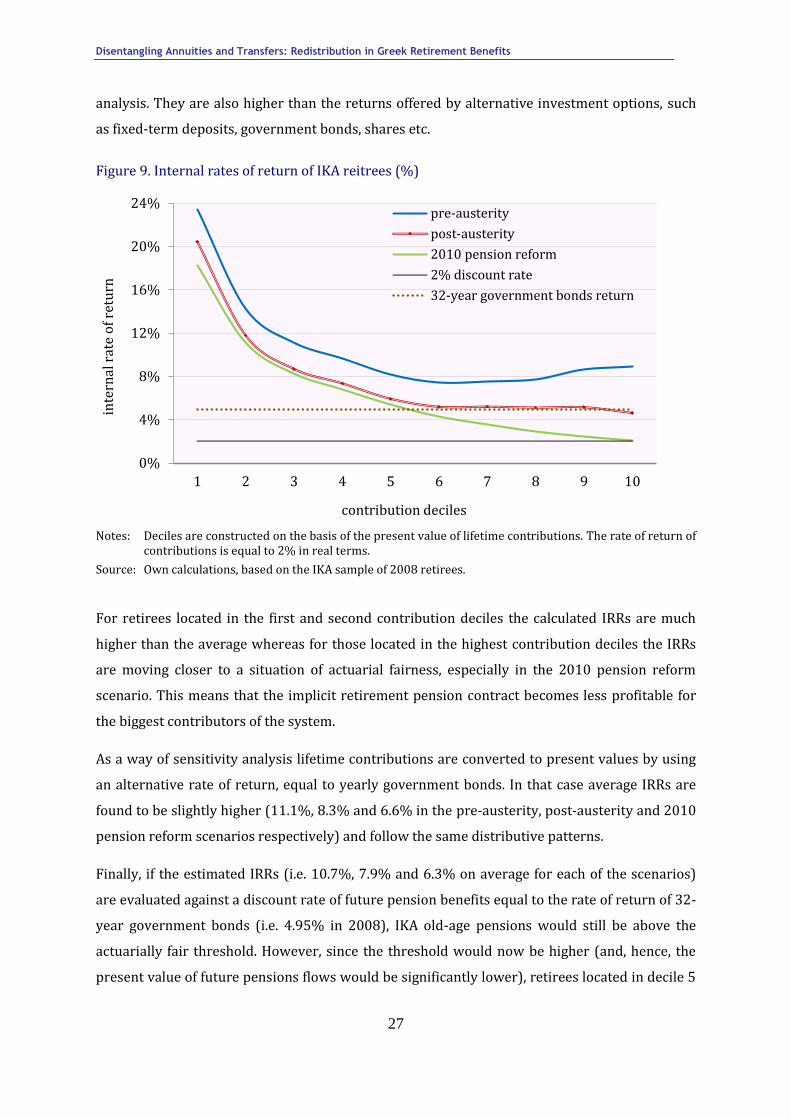
As can be seen in Figure 9, the estimated internal rates of return (IRRs) of lifetime contributions
mirror the patterns of transfers described above. The average IRR was estimated to be 10.7% in
the pre-austerity scenario, to fall to 7.9% when the 2010-2013 austerity measures are taken
into account and to be further reduced to 6.3% in the pension reform scenario.20 We observe
that in all cases the IRRs remain well above the discount rate of 2% applied in our baseline
20 Note that, in the pre-austerity and 2010 pension reform scenarios future cash flows are assumed to remain constant in their 2008 nominal levels. In the post-austerity scenario, pension amounts up to 2013 were recalculated on a year-by-year basis, taking into account (i.e. simulating) all the implemented austerity measures; from 2014 onwards pensions are assumed to remain constant in their 2013 nominal levels.
Disentangling Annuities and Transfers: Redistribution in Greek Retirement Benefits
27
analysis. They are also higher than the returns offered by alternative investment options, such
as fixed-term deposits, government bonds, shares etc.
Figure 9. Internal rates of return of IKA reitrees (%)
Notes: Deciles are constructed on the basis of the present value of lifetime contributions. The rate of return of contributions is equal to 2% in real terms.
Source: Own calculations, based on the IKA sample of 2008 retirees.
For retirees located in the first and second contribution deciles the calculated IRRs are much
higher than the average whereas for those located in the highest contribution deciles the IRRs
are moving closer to a situation of actuarial fairness, especially in the 2010 pension reform
scenario. This means that the implicit retirement pension contract becomes less profitable for
the biggest contributors of the system.
As a way of sensitivity analysis lifetime contributions are converted to present values by using
an alternative rate of return, equal to yearly government bonds. In that case average IRRs are
found to be slightly higher (11.1%, 8.3% and 6.6% in the pre-austerity, post-austerity and 2010
pension reform scenarios respectively) and follow the same distributive patterns.
Finally, if the estimated IRRs (i.e. 10.7%, 7.9% and 6.3% on average for each of the scenarios)
are evaluated against a discount rate of future pension benefits equal to the rate of return of 32-
year government bonds (i.e. 4.95% in 2008), IKA old-age pensions would still be above the
actuarially fair threshold. However, since the threshold would now be higher (and, hence, the
present value of future pensions flows would be significantly lower), retirees located in decile 5
0%
4%
8%
12%
16%
20%
24%
1 2 3 4 5 6 7 8 9 10
inte
rnal
rat
e o
f re
turn
contribution deciles
pre-austerity
post-austerity
2010 pension reform
2% discount rate
32-year government bonds return

Disentangling Annuities and Transfers: Redistribution in Greek Retirement Benefits
28
and above can be considered as receiving lifetime pensions that are very close to actuarial
fairness in the post-austerity scenario and less than actuarially fair in the 2010 pensions reform
scenario.
5.3 Reasons for caution
A certain amount of caution is called for when interpreting the above results. The main
limitations to do with the assumptions used are discussed below.
In the absence of data on workers’ lifetime contributory record (only their last notional daily
earnings are available in the data), we attempt to reconstruct their earnings profile on the basis
of a backward induction, assuming that they followed the evolution of minimum wages.21 To
some extent, this is a reasonable assumption, since the course of minimum wages usually
reflects, in broad terms, the course of the overall economy (and also considering the fact that
the last earnings of almost ¼ of retirees in the sample are very close to this level). However,
other earning profiles such as steeper or more erratic, more stable or with periods of inactivity
or unemployment spells, rising faster or slower than the minimum wage, are bound to exist. To
some extent they are also bound to cancel each other out. As most of the labour market
literature suggests that that job displacements cause workers’ future earnings to drop, including
such events when reconstructing individuals’ contributory records would decrease the present
value of lifetime contributions and hence further increase the estimated transfer component of
pensions. The same would be true if the evolution of average earnings was used instead of that
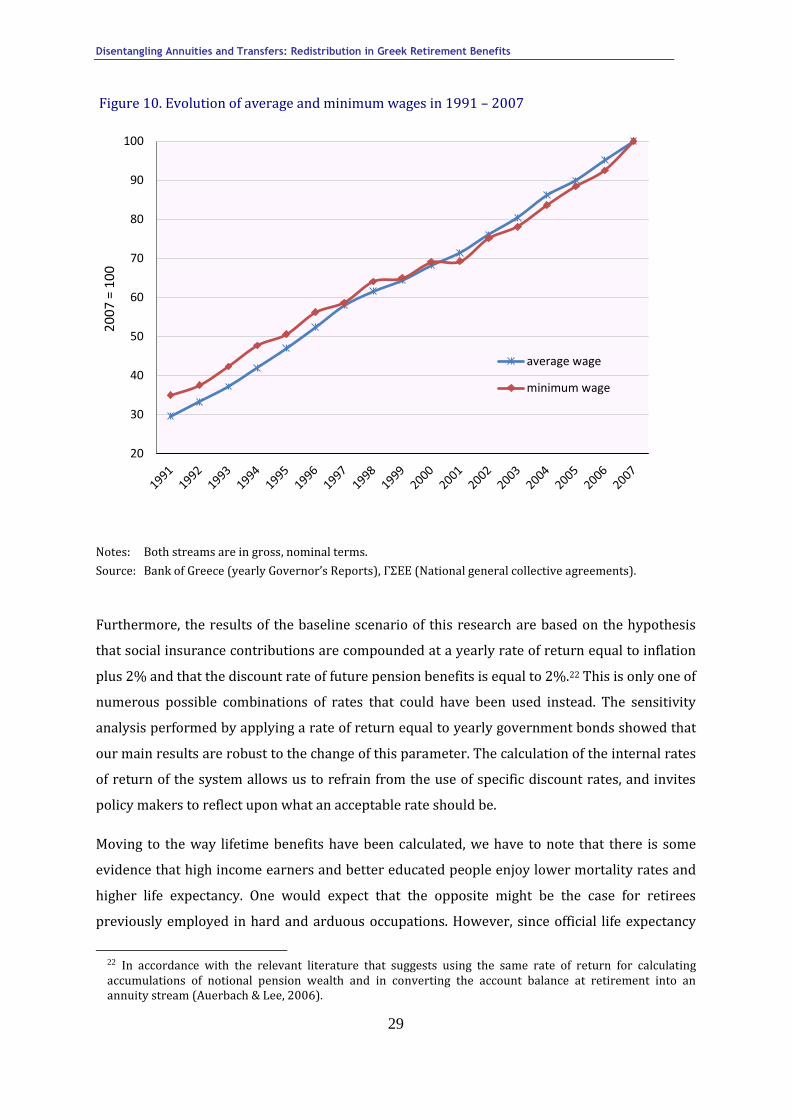
of minimum wages (at least for the period for which data on the former are available). Figure 10
shows the evolution of both indicators from 1991 onwards. We observe that, if the evolution of
average earnings had been chosen, lifetime contributions of individuals with a contributory
record of up to 17 years (21% of the sample) would have been lower than those calculated
using the evolution of minimum wages, and hence the non-contributory part of pensions would
have been even bigger.
21 The assumption that the income distribution of this pseudo-panel is stable over time is commonly used in the relevant literature (see Klazar and Slintáková, 2012).
Disentangling Annuities and Transfers: Redistribution in Greek Retirement Benefits
29
Figure 10. Evolution of average and minimum wages in 1991 – 2007
Notes: Both streams are in gross, nominal terms.
Source: Bank of Greece (yearly Governor’s Reports), ΓΣΕΕ (National general collective agreements).
Furthermore, the results of the baseline scenario of this research are based on the hypothesis
that social insurance contributions are compounded at a yearly rate of return equal to inflation
plus 2% and that the discount rate of future pension benefits is equal to 2%.22 This is only one of
numerous possible combinations of rates that could have been used instead. The sensitivity
analysis performed by applying a rate of return equal to yearly government bonds showed that
our main results are robust to the change of this parameter. The calculation of the internal rates
of return of the system allows us to refrain from the use of specific discount rates, and invites
policy makers to reflect upon what an acceptable rate should be.
Moving to the way lifetime benefits have been calculated, we have to note that there is some
evidence that high income earners and better educated people enjoy lower mortality rates and
higher life expectancy. One would expect that the opposite might be the case for retirees
previously employed in hard and arduous occupations. However, since official life expectancy
22 In accordance with the relevant literature that suggests using the same rate of return for calculating accumulations of notional pension wealth and in converting the account balance at retirement into an annuity stream (Auerbach & Lee, 2006).
20
30
40
50
60
70
80
90
100
20
07
= 1
00
average wage
minimum wage

Disentangling Annuities and Transfers: Redistribution in Greek Retirement Benefits
30
data for different earnings, educational or occupational profiles are not available, the general
life expectancy tables (different for men and women) have been used throughout the analysis.
Accounting for life expectancy differentials would have a flattening effect on the curves depicted
in Figures 4, 5 and 9.
On a different note, the estimation of the transfer component of pensions in the pension reform
scenario was performed assuming away the behavioural responses of retirees to this new piece
of legislation. Excluding retirees with less than 4,500 contribution days from the analysis takes
only partially into account the high disincentives for early retirement that the 2010 reform has
introduced. For this reason, the results of this scenario for the lowest distribution deciles should
be treated with caution and be considered as upper bound estimates. The increase in retirement
age from 65 to 67 that was introduced in 2013 is also expected to cause the transfer component
of future retirees’ pensions to fall (and to disproportionately affect women, as they are the ones
with the shortest contributory records and lower age at retirement).
Finally, due to the lack of data from other social insurance funds, this analysis has only focused
on IKA main old-age pensions. The acquisition of data from more social insurance funds would
certainly improve our understanding of the relative importance of annuities and transfers in
Greek retirement benefits as a whole, and would allow for a more comprehensive examination
of their impact on intragenerational equity. However, we can safely infer that the addition of the
two biggest funds after IKA (i.e. OΓΑ and civil servants’)23 would further reinforce the imbalance
between lifetime benefits and lifetime contributions as (a) in the case of ΟΓΑ, famers were not
required to pay any social insurance contributions until 1987, whereas contributions for main
old-age pension only became compulsory in 1998, and (b) in the case of civil servants, until
2007 the conditions for individuals who have entered the labour market before 1993 were
much more favourable than private sector workers (in terms of retirement age, replacement
rates, pensionable earnings etc.). Adding survivor and invalidity pensions in the frame of
analysis would also increase the relative importance of transfers, as the annuity component of
these pensions is by definition small.
6. Summary and conclusions
The purpose of this paper has been to investigate the relative importance of annuities and
transfers in Greek retirement benefits and attempt to draw conclusions as to the impact of
transfers on intra- and intergenerational equity by using a longitudinal approach. This approach
23 Note that these three funds together provided 49% of pensions and accounted for 61% of total pension spending in 2013 (Ministry of Labour, Social Security and Welfare, 2013).

Disentangling Annuities and Transfers: Redistribution in Greek Retirement Benefits
31
compares the balance between lifetime contributions paid and lifetime benefits received by
individuals: the difference between the two is the implicit transfer that can be either positive
(i.e. a transfer received by the rest of society) or negative (i.e. a transfer paid to the rest of
society).
Based on a representative sample of IKA retirees in the year 2008, the transfer component and
internal rates of return of main old-age IKA pensions were calculated according to the rules that
were in place both before and after the implementation of the 2010-13 austerity measures
related to pensions. The research also tried to provide some early estimates of the impact of the
2010 pension reform (to be gradually implemented after 2015) on lifetime pension benefits. As
discussed in the previous section, this analysis performed is by necessity static: 2008 retirees
are responding to the incentives inherent to 2008 pension rules. Austerity cuts and the 2010
reform have changed those rules, and hence the incentives faced by retirees. Analysing the
structure of incentives of current pension rules lies beyond the scope of this research.24
In accordance with Mylonas and de la Maisonneuve (1999), our results showed that the vast
majority of IKA retirees are receiving positive -and quite substantial, in absolute terms- net
transfers from the system. In other words, the present value of lifetime pension benefits seems
to largely outweigh the present value of lifetime social insurance contributions. This finding
implies that the underlying pension rules seriously deviate from the principle of actuarial
fairness and are thus violating intergenerational equity. The perception that pensioners have
fully earned their retirement benefits is not supported by the evidence.
Our analysis has shown that the recent changes in the pension system have improved
intergenerational equity by reducing (but not fully eliminating) transfers. Compared to the pre-
austerity scenario, the average transfer component of pensions was estimated to fall from
49.3% to 35.8% when the 2010-2013 austerity measures are taken into account. In the case
where lifetime pensions are calculated according to the rules established by the 2010 pension
reform, the estimated transfers are further reduced, reaching 27.1% of lifetime pension benefits
on average.25 Interestingly, our findings suggest that male retirees located in contribution decile
9 are now becoming recipients of lifetime pensions that are very close to actuarial fairness,
whereas those located in the highest decile are becoming net contributors of the retirement
24 An analysis of the incentives introduced by the 2010 pension reform can be found in Matsaganis & Leventi (2011). 25 Note that this is less than 3/9 of total social insurance contributions, which is the rate that Law 2084/92 assigned to the state (as one of the three parties responsible for the financing of pensions – together with employers and employees).
Disentangling Annuities and Transfers: Redistribution in Greek Retirement Benefits
32
pension system; in the pre-crisis world, they would be receiving transfers as high as 41% of
lifetime benefits.
With respect to intragenerational equity, the pre-reform system treated more favourably those
who retire earlier, with fewer contributions, on a lower (or minimum) pension. Austerity cuts
and the 2010 reform have only slightly mitigated these features; in all three scenarios retirees
located in the first contribution decile are the recipients of intragenerational transfers that
correspond to more than two-thirds of their lifetime pension benefits.
Within the current generation of pensioners, women also seem to be benefiting considerably
more than men. The reason is twofold. On the one hand, the annuity part of their pensions is
smaller both because of lower employment incomes and shorter professional careers. On the
other hand, their longer life expectancy combined with the favourable rules that apply for
minimum pension recipients -where women appear prominently- and mothers of under-age
children renders the transfer component of their lifetime pension benefits significantly higher
than the one of men. Austerity cuts and the 2010 reform seem to have exacerbated this
difference, as both of them affected much more severely contribution deciles 9 and 10 – and in
these deciles men feature prominently.
Differences in occupational sector are also found to be playing a role in the level of transfers, as
workers in hard and arduous occupations (typically workers in construction, heavy industry
etc.) seem to be less favoured than workers in non-arduous employments in terms of transfers
received by the system. Although differences in the transfer component of pensions reflecting
different need for assistance (as in the cases of minimum pensions) can arguably be justified as
serving anti-poverty objectives, differences related to characteristics such as gender or
occupational sector can be considered as a violation of the principles of intragenerational
equity.
The internal rates of return that have been estimated revealed very similar patterns for all the
above-mentioned scenarios. The results also seem to be robust to different choices of rates of
return used for the calculation of the present value of lifetime contributions.
Overall, this research has shown that the link between pension payments and their supporting
contributions in IKA main old-age pensions remains relatively loose. Designing a pension
system that is fair to current as well as future generations, ensures that pensions do not fall
below a minimum threshold and at the same time enhances incentives to work and pay
contributions is not an easy task. Trade-offs are present, e.g. between the wish to protect low
pensions (by deviating from the principle of actuarial fairness, but enhancing the progressivity

Disentangling Annuities and Transfers: Redistribution in Greek Retirement Benefits
33
of the system) and the concern to guarantee a decent return on contributions for all, including
those who have contributed the most. Even though our estimates suggest that the 2010-2013
austerity measures and the 2010 reform have been successful in strengthening this relation, it
seems that there is still scope -and need- for improvement.

Disentangling Annuities and Transfers: Redistribution in Greek Retirement Benefits
34
References
Auerbach A. and Lee R. (2006) "Notional Defined Contribution Pension Systems in a Stochastic Context: Design and Stability," NBER Working Papers 12805, National Bureau of Economic Research.
Εl.Stat. (2013) Survey of income and living conditions 2012. Press release, 29 November 2013. Pireaus: National Statistical Survey of Greece.
European Commission (2010) The Social Situation in the European Union 2009. Luxembourg: Office for Official Publications of the European Communities.
Eurostat (2014) Online statistics (last accessed: November 2014), Luxembourg: Eurostat.
Feldstein M. and Siebert H. (2002) Social security pension reform in Europe, Chicago: University of Chicago Press.
Featherstone K. (2005) ‘’Soft’ co-ordination meets ‘hard’ politics: the European Union and pension reform in Greece’, Journal of European Public Policy, vol. 12, issue 4, pp. 733- 750.
Grammenos S., Lefèbvre M., Perelman S. and Pestieau P. (2006) Literature review on the redistributive effects of pension systems, Centre for European Social and Economic Policy, Centre de Politique Sociale et Economique Européenne ASBL.
Klazar S. and Slintáková B. (2012) How progressive is the Czech pension security? Prague Economic Papers 3/2012, pp. 309-327.
Matsaganis M. (2010) ‘Pension reform and the future of the welfare state in Greece, Revue du Droit de l’ Assurance Sociale, vol. 10 (620), pp. 859-871 (in Greek).
Matsaganis M. and Leventi C. (2011) ‘Pathways to a universal basic pension in Greece’, Basic Income Studies, vol. 6, issue 1, pp. 1-20.
Ministry of Labour, Social Security and Welfare (2013) Helios Pension Benefits Report - December 2013, Athens: Ministry of Labour, Social Security and Welfare.
Mylonas P. and de la Maisonneuve C. (1999) The problems and prospects faced by pay-as-you-go pension systems: a case study of Greece. Economics Department Working Paper 215. Paris: Organisation for Economic Co-operation and Development.
OECD (2014) Annual Survey of Investment Regulation of Pension Funds, Paris: Organisation for Economic Co-operation and Development.
Queisser M. and Whitehouse E.R. (2006) ‘Neutral or fair? Actuarial concepts and pension-system design’, Social, Employment and Migration Working Paper No. 40, OECD, Paris.
Sakellaropoulos T. and Angelaki M. (2007) ‘The politics of pension reform in South European welfare states’, in van Langendock, J. (ed.), The Right to Social Security, Antwerpen, Intersentia, pp. 121-144.
Tinios P. (2005) ‘Pension Reform in Greece: ‘Reform by Instalments’- A Blocked Process’, West European Politics, vol. 28, issue 2, pp. 402-419.
Tinios P. (2010) Vacillations around a pension reform trajectory: time for a change? GreeSe Paper No. 34, Hellenic Observatory Papers on Greece and Southern Europe, London School of Economics.

Disentangling Annuities and Transfers: Redistribution in Greek Retirement Benefits
35
Vlachantoni A. (2005) Greek pension reform and the change from ‘within’, paper presented in the 2nd LSE PhD Symposium on ‘Modern Greece: Current Social Research on Greece’, 10 June 2005.
World Bank (1994) Averting the old age crisis: policies to protect the old and promote growth, Washington DC: World Bank.

Disentangling Annuities and Transfers: Redistribution in Greek Retirement Benefits
36
Appendix
Table A1. Distribution of pensioners by pension type (Dec. 2013)
pension brackets (€)
old-age survivors invalidity number of
pensioners % of total
number of pensioners
% of total number of
pensioners % of total
0-500 451,897 22.7 101,491 24.9 95,616 40.9 500-1,000 756,710 37.9 243,056 59.6 108,658 46.5
1,000-1,500 460,028 23.1 55,173 13.5 26,273 11.2 1,500-2,000 283,278 14.2 7,062 1.7 2,534 1.1 2,000-2,500 33,141 1.7 852 0.2 358 0.2
>2,500 9,786 0.5 142 0.0 177 0.1 all 1,994,840 100.0 407,776 100.0 233,616 100.0
Notes: Pension amounts are gross. Note that pensioners usually receive more than one pension (e.g. both main and supplementary).
Source: Own elaboration of data from the Ministry of Labour, Social Security and Welfare (December 2013 Helios Report).
Table A2. Distribution of main old-age pensions (Dec. 2013)
pension brackets (€)
number of pensions
% of total average pension
amount (€)
0-500 647,871 32.0 370.1 500-1,000 770,755 38.0 677.4
1,000-1,500 528,018 26.1 1,234.2 1,500-2,000 77,377 3.8 1,641.7 2,000-2,500 1,452 0.1 2,198.8
>2,500 748 0.0 2,678.5 all 2,026,221 100.0
Notes: Pension amounts are gross.
Source: Own elaboration of data from the Ministry of Labour, Social Security and Welfare (December 2013 Helios Report).
Table A3. Average main pension by fund (Dec. 2013)
average pension IKA 641.7 OΓΑ 435.2 Civil servants’ 1,010.3 ΟΑΕΕ 736.3 ΕΤΑΑ 841.2 ΕΤΑΠ-ΜΜΕ 889.9
Notes: Pension amounts (€) are gross. All types of pensions are included (i.e. old-age, survivors’ and invalidity pensions).
Source: Own elaboration of data from the Ministry of Labour, Social Security and Welfare (December 2013 Helios Report).

Disentangling Annuities and Transfers: Redistribution in Greek Retirement Benefits
37
Table A4. Monthly minimum wage (1973-2007)
year min. wage (€)
1973 10.04 1974 11.04 1975 13.25 1976 14.69 1977 17.18 1978 21.42 1979 25.31 1980 30.05 1981 36.03 1982 54.53 1983 62.31 1984 79.27 1985 93.71 1986 106.58 1987 117.68 1988 136.30 1989 160.90 1990 191.06 1991 217.52 1992 244.05 1993 267.66 1994 303.73 1995 336.42 1996 362.49 1997 393.14 1998 416.89 1999 432.91 2000 450.90 2001 465.90 2002 490.04 2003 519.87 2004 540.66 2005 572.30 2006 608.32 2007 657.89
Notes: Monthly minimum wage in nominal terms.
Source: ΓΣΕΕ (national general collective agreements).
Table A5. IKA contribution formulae for pensions (1973-2007)
year pension SIC: employees (%) pension SIC: employers (%)
normal hard and arduous
normal hard and arduous
1973 – 1975 4.75 4.25 9.50 10.00 1976 – 1990 5.25 7.45 10.50 11.90 1991 – 1992 5.75 7.95 11.50 12.90 1993 – 2007 6.67 8.87 13.33 14.73
Notes: Monthly minimum wage in nominal terms. Source: IKA.

Disentangling Annuities and Transfers: Redistribution in Greek Retirement Benefits
38
Table A6. Life expectancy at selected ages in 2007
age men women
50 29.68 33.33 51 28.81 32.39 52 27.94 31.45 53 27.08 30.52 54 26.22 29.59 55 25.38 28.66 56 24.54 27.73 57 23.71 26.81 58 22.90 25.89 59 22.09 24.98 60 21.29 24.07 61 20.50 23.17 62 19.72 22.27 63 18.95 21.38 64 18.18 20.49 65 17.42 19.60 66 16.67 18.72 67 15.94 17.85 68 15.22 16.99 69 14.51 16.14 70 13.82 15.30 71 13.15 14.48 72 12.50 13.67 73 11.85 12.88 74 11.23 12.10 75 10.62 11.35 76 10.03 10.63 77 9.46 9.93 78 8.92 9.26 79 8.41 8.63 80 7.93 8.03 81 7.47 7.47 82 7.04 6.95 83 6.63 6.48 84 6.25 6.06 85 5.90 5.68 86 5.59 5.33 87 5.29 5.02 88 5.00 4.73 89 4.73 4.45 90 4.46 4.18
Notes: As life tables for 2008 are not available, 2007 life tables were used as a proxy.
Source: El.Stat. (Life tables 2007: Life expectancy at selected ages).