
Chronic Diseases - Canada
56
Chronic Diseases in Canada Volume 28, Number 4, 2008
Transcript of Chronic Diseases - Canada

Chronic Diseasesin CanadaVolume 28, Number 4, 2008

Chronic Diseases in Canadaa publication of the
Public Health Agency of Canada
Sylvie Stachenko Principal Scientific Editor (613) 946-3537 Howard Morrison Deputy Scientific Editor (613) 941-1286 Michelle Tracy Managing Editor (613) 954-0697
Robert A Spasoff Associate Scientific Editor Claire Infante-Rivard Associate Scientific Editor Elizabeth Kristjansson Associate Scientific Editor
CDIC Editorial Board
Jacques Brisson Université Laval Neil E Collishaw Physicians for a Smoke-Free Canada James A Hanley McGill University Clyde Hertzman University of British Columbia
C Ineke Neutel University of Ottawa Institute on Care of the Elderly Kathryn Wilkins Health Statistics Division Statistics Canada
Chronic Diseases in Canada (CDIC) is a quarterly scientific journal focussing on current evidence relevant to the control and prevention of chronic (i.e. non-communicable) diseases and injuries in Canada. Since 1980 the journal has published a unique blend of peer-reviewed feature articles by authors from the public and private sectors and which may include research from such fields as epidemiology, public/community health, biostatistics, the behavioural sciences, and health services or economics. Only feature articles are peer reviewed. Authors retain responsibility for the content of their articles; the opinions expressed are not necessarily those of the CDIC editorial committee nor of the Public Health Agency of Canada.
Subscription is free upon request.
Chronic Diseases in Canada Public Health Agency of Canada
130 Colonnade Road Address Locator 6501G
Ottawa, Ontario K1A 0K9
Fax: (613) 941-3605 E-mail: [email protected]
Indexed in Index Medicus/MEDLINE
To promote and protect the health of Canadians through leadership, partnership, innovation and action in public health. — Public Health Agency of Canada
Published by authority of the Minister of Health.
© Her Majesty the Queen in Right of Canada, represented by the Minister of Health, 2008
ISSN 0228-8699 Également disponible en français sous le titre : Maladies chroniques au Canada
Risk factors for falling among community-dwelling seniors using home-care services: An extended hazards model with time-dependent covariates and multiple events
BS Leclerc, C Bégin, É Cadieux, L Goulet, N Leduc, M-J Kergoat, and P Lebel
Gender and the smoking behaviour of Ethiopian immigrants in Toronto
I Hyman, H Fenta, and S Noh
Ethnicity and mental health: Conceptualization, definition and operationalization of ethnicity from a Canadian context
DE Clarke, A Colantonio, AE Rhodes, and M Escobar
Association of comorbid mood disorders and chronic illness with disability and quality of life in Ontario, Canada
T Gadalla
Costs associated with mood and anxiety disorders, as evaluated by telephone survey
SB Patten, JVA Williams, and C Mitton
Information for Authors: Special Call for Papers
111
121
128
148
155
163

Chronic Diseases in Canada 111 Vol 28, No 4, 2008
BS Leclerc, MSc (1); C Bégin, MSc (1); É Cadieux, MSc (1); L Goulet, MD, PhD (2); N Leduc, PhD (2);M-J Kergoat, MD (3); P Lebel, MD (3,4)
Abstract
The identifi cation of risk factors for falls in longitudinal studies becomes diffi cult because of exposures that change during the follow-up and also because individual subjects may experience an event more than once. These issues have been neglected and improper statistical techniques have been used. The typical approaches have been to report the proportion of fallers or the time to fi rst fall. Both avoid the underlying assumption of independence between events and discard pertinent data. We review the existing methods and propose a Cox hazards extension. We exemplify it in the study of potential risk factors associated with all falls in 959 seniors. Finally, we compare the results of the proposed Wei, Lin, & Weissfeld (WLW) method with those of several other techniques. Stable exposure variables measured at baseline and updated time-varying exposures include socio-demographic characteristics, BMI, nutritional risk, alcohol consumption, home hazards, gait and balance, and medications. Results demonstrate that the usual methods of analyzing risk factors for falling are inappropriate, as they produce considerable biases relative to the WLW model using time-dependent covariates. Results also show that modeling for fi rst events may be ineffi cient, given that the risk of occurrence varies between falls.
Key words: Accidental falls, Cox model, elderly, environmental hazards, negative binomial distribution, hazards model, regression analysis, survival analysis, logistic models
Author References
1 Direction de santé publique et d’évaluation, Agence de la santé et des services sociaux de Lanaudière, Joliette, Quebec2 Groupe de recherche interdisciplinaire en santé, Université de Montréal, Montréal, Quebec3 Centre de recherche, Institut universitaire de gériatrie de Montréal, Montréal, Quebec4 Centre d’expertise sur la santé des personnes âgées et des aidants, Institut universitaire de gériatrie de Montréal, Montréal, Quebec Correspondence: Bernard-Simon Leclerc, Service de surveillance, recherche et évaluation, Direction de santé publique et d’évaluation, Agence de la santé et des services sociaux de Lanaudière, 245, rue du Curé-Majeau, Joliette, J6E 8S8, Tel: (450) 759-1157 extension 4324, Email: [email protected]
Introduction
Falls are common, recurrent problems with serious consequences for elderly people and the health care system.1 Evidence of fall-risk factors has generally been identifi ed by prospective observational designs. These studies may suffer from problems similar to those found in cohort studies of other issues, such as loss to follow-up and variable follow-up time. The identifi cation of fall-risk factors deals with additional problems such as
exposure changes during follow-up and recurrent events in the same person. These issues have been neglected and ineffi cient statistical techniques have been used. As a result, this may have distorted the magnitude in estimates of particular predictors or produced misleading results. Moreover, this may have missed questions of great clinical relevance.2-5
More than 15 years ago, Cumming, Kelsey, and Nevitt6 advised that more attention be paid to repeated measures regarding both
risk factors and rates for all falls. Despite this, few researchers have challenged the design of their studies and the analysis of their data. Rather, they seem to have been adversely affected, circumventing the methodological complications by discarding much relevant information.
The aim of the present paper is to raise the awareness of researchers about some epidemiological and statistical considera-tions. We review the statistical background of methods of fall studies, introduce the philosophical issues of time-dependent covariates and multiple events, and discuss the existing statistical techniques which deal with them. We propose an extension of the Cox proportional hazards traditional model and use it in the identifi cation of potential risk factors associated with all falls in elderly people living at home. Finally, we compare the different results obtained by various statistical methods.
Statistical background of methods of fall studies
A variety of strategies has been used to study the risk factors for recurrent falls. Their analysis is complicated by the within-subject correlation. In other words, the occurrence of an event acts on the risk of the next one. Failure to account for dependence in the data leads to the usual estimator of variance being underestimated. This produces confi dence
Risk factors for falling among community-dwelling seniors using home-care services: An extendedhazards model with time-dependent covariates and multiple events

112 Chronic Diseases in CanadaVol 28, No 4, 2008
intervals that are too narrow and a test of signifi cance too liberal (i.e. rejects the null hypothesis too often).3,5,7
A summary of some of the discussed methods is provided in Figure 1. A simplistic approach to such problems involves reporting the proportion of fallers (subjects who fall at least once over an arbitrarily defi ned period) or the time to a fi rst fall.8 Both possibilities avoid the underlying assumption of independent association between multiple events. However, the use of all available data for each individual could be more effi cient.4,8,9 The author of a key paper has argued that the incidence rate for falls was a public health priority6, particularly for less robust elderly people.10 The challenge in analysing all falls arises because some elderly are more prone to recurrences than others; hence, they run a higher risk of fall-related injury as opposed to those who fall only once. The choice of outcome, according to whether the focus is on fallers or on the rate of falls, could also affect the conclusion; i.e., knowing whether a particular exposure constitutes a risk factor. Stable over-time factors are more likely to be related to the state of “being a faller” than exposures that vary over time.6
Alternatives have been proposed for dealing with multiple events. Among these are the negative binomial regression, some extensions to the Cox proportional hazards model, and a modifi ed logistic regression. The dependent variable in the negative binomial regression is the individual event rate adjusted for the follow-up time i.e., the number of falls for a person divided by their specifi c follow-up time (Figure 1).4,11 Since the negative binomial distribution has one more parameter than the Poisson, it naturally accommodates for over-dispersion (i.e., the variance typically exceeds the mean).8 Therefore, this approach is robust for dependent structure data, and suitable for frequent and recurrent events.
One problem using event rates is that the likelihood of event occurrence must be assumed to be constant through time within one participant. A critical example could be to consider the equivalent event rates for three
participants, each of whom is observed over three years and suffers three falls. One has fallen once each year, another three times in the fi rst year, and the last three times in the third year. The outcome variable ignores the time of occurrence of these events.8 Thus, a negative binomial modeling event rates may not be the method of choice when the value of important covariates or the likelihood of event occurrence changes with the passing of time.3 Greater effi ciency and accuracy can be obtained by modelling the lengths of inter-episode intervals via time-to-event techniques.9 Rather than focusing on the numbers of cases, the time-to-event approach considers the time between falls. If the incidence rate is high, the intervals between events will be short, and vice versa.3
In addition, measured risk factors of which we want to evaluate the effects are usually only fi xed variables, defi ned at the initial examination.2 They refer to the intrinsic characteristics of the subjects (e.g., the sex), the past exposures (e.g., prior falls) or exposures present at baseline (e.g., use of medication). Exposures that occur after the starting point or vary over time for an individual are not taken into account. Examples, which can potentially cause falls through short-term exposure preceding the event, include environmental hazards, alcohol consumption, and use of medication. A great advantage of the time-to-event approach is its ability to handle time-dependent covariates.3
The hazards models include the counting process of Andersen & Gill16 (hereafter referred to as AG), the conditional model of Prentice, Williams, & Peterson17 (PWP), and the marginal model of Wei, Lin, & Weissfeld18 (WLW). None of these approaches explicitly models the dependence structure between failure times. Instead, robust estimates of variance are used to account for correlated observations within subjects; i.e., the so-called «variance-corrected» hazards models.12-15
The distinction of the hazards methods can be seen in terms of who is in the risk-set at each failure.15,19 The AG rests on the strong assumption that the risk of an event for a given subject is unaffected by any earlier
events, unless a term that captures such dependence (i.e., number of previous falls) is included as a time-dependent covariate.3,7 In other words, the data for each subject with multiple events could be described as data for multiple subjects, where each has delayed entry and is followed until the next event (Figure 1). This model ignores the order of the events; i.e., all falls are indistinguishable, leaving each subject to be “at risk” for an event as long as the subject is still under observation at the time the event occurs.3,7,8,13-15,19
The PWP is based on the idea that a subject is not technically at risk for a later event until all previous events have been experienced. This is accomplished by stratifying data by event order. Accordingly, the risk-set at time t for the kth event is limited to those subjects under study at t who have already experienced k-1 events (not exemplifi ed in Figure 1).13-15,19 However, Robertson20 has argued that the conditional assumption of the order of events does not hold for falls. As an illustration of her argument (personal communication), let us speculate that a person has slipped on water on the kitchen fl oor without injury and, at another time, has fallen on the pavement outside. This has resulted in a hip fracture. The person is at risk for both these falls from the beginning of the study period; i.e., the time at risk for the second fall on the pavement does not start only after the fi rst fall in the kitchen has occurred.
The risk-set of the WLW marginal approach includes all patients under observation who have not yet experienced the kth event. The time for each event starts at the beginning of follow-up time for each subject. Furthermore, each subject is considered to be at risk for all events, regardless of how many events each subject has actually experienced. The WLW does not impose any dependence structure among the related failure times. Thus, it ignores the ordering of events but takes into account previous events by situating each failure in an independent stratum (Figure 1).4,7,8,13-15,19
The logistic regression analysis is the most commonly used method in epidemiological

Vol 28, No 4, 2008Chronic Diseases in Canada 113
research. D’Agostino et al.21 showed that a so-called pooled logistic regression is identical to the time-dependent covariate Cox regression. This is what makes the technique attractive to evaluate the relationship of risk factors to disease development. O’Loughlin22 applied such an approach to the study of falls. The theoretical basis for the use of this logistic regression variant is well established when the intervals between measurements of risk factors are short, the probability of an event within an interval small, and the intercept for the pooled logistic constant across intervals.21 The underlying statistical requirements and the data setup for the pooled logistic regression are very close to those defi ned for the AG. Each of the follow-up intervals for a single subject is assumed to represent intervals from different subjects. The method pools the subjects at risk and the events developed in each interval. The follow-up interview number is included as a categorical variable to test this assumption. Similarly, the dependence between multiple falls within the same individual is accounted for by considering the occurrence of previous falls as a predictor variable.23
However, the way in which the interval observations are set up, as well as the outcome variable of interest, differs in both methods. The AG builds the intervals according to the precise dates of events. For example, the fi rst interval will cover the time span from entry into the study until the time of the event, and the following interval spans the time from the fi rst event to the next one, and so on (Figure 1).15 In contrast, the logistic regression uses stable time points fi xed by the researcher. For example, an exam could be performed at the same date each month to up-date risk factors and to gather information on falls that occurred in the interval of observation (not exemplifi ed in Figure 1).22,23 The analysis above is, in essence, an investigation of fallers versus non-fallers in successive short intervals.22 Even if, taken as a whole, the analysis allows for more than one outcome to occur per subject, less appreciated is the fact that it
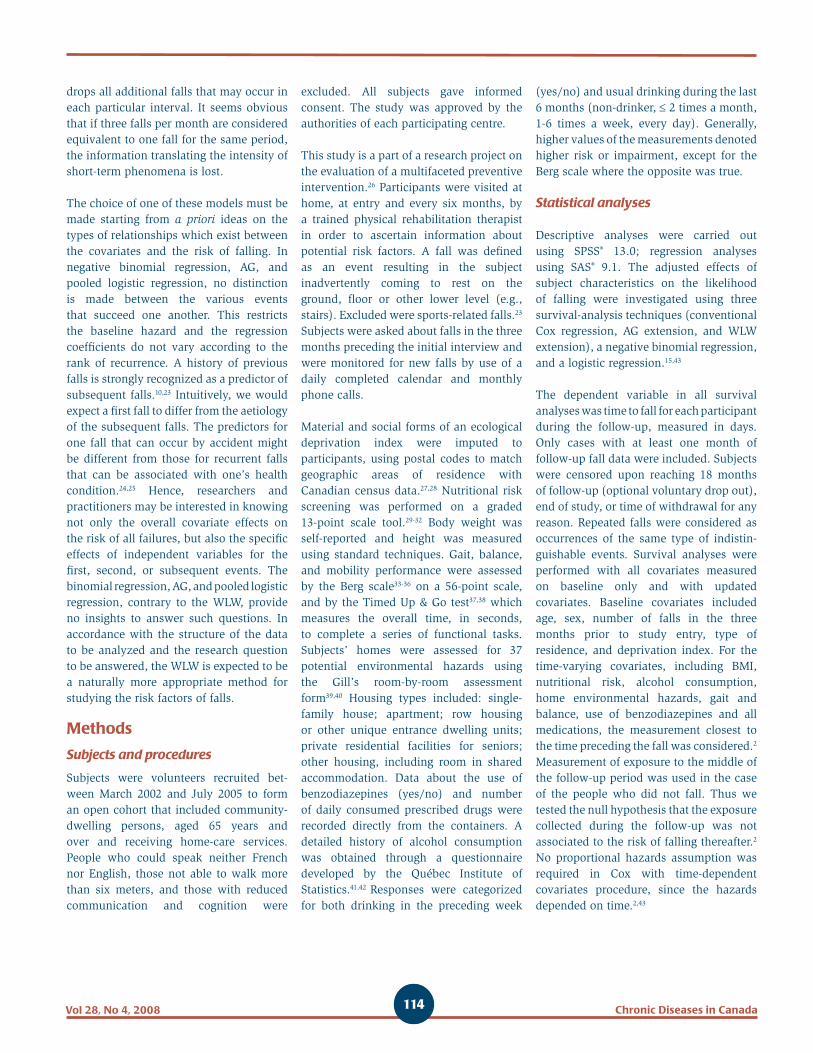
FIGURE 1Schematic representation of statistical models for the study of risk factors for falls
(Modifi ed from a fi gure published by Robertson, Campbell and Herbison8)
Hypothetical subject with follow-up of 12 days, falls on day 5 and 8. Let (0) represent no fall and (1) a fall, xi a risk factor of subject i measured at time t, and ki its number of falls. Then the baseline hazard is illustrated by λ0(t), the hazard for a fall for the ith subject by λi and the hazard of the kth fall for this subject by λik. Person-time, pt
i is length of time at risk
for subject i, β’x denotes the effect size of factor x, p is the probability of event in exposed, e, and unexposed, u, subjects.
Standard Cox regression. One data record covers entry until the 1st fall and discards any information past that point. Total follow-up time is assigned to individual that never fell. The dependent variable is time to fi rst fall.
Andersen-Gill Cox regression. Three records cover entry until the 1st fall, from the 1st until 2nd fall, from the last fall to the end of follow-up, the latter period being fall-free. The dependent variable is time to each fall.
Marginal Wei, Lin & Weissfeld regression. Three records. Each fall as well as the fi nal fall-free period are treated in an independent stratum and time measured from entry. The dependent variable is time to each fall.
Negative binomial regression. One record covers entry until the end of follow-up and includes simply the total number of falls and follow-up time per subject. The dependent variable is number of falls.
Logistic regression. One data record, which does not account for follow-up time and ignores multiple falls by subject. The binary dependent variable is status of faller.
114 Chronic Diseases in CanadaVol 28, No 4, 2008
drops all additional falls that may occur in each particular interval. It seems obvious that if three falls per month are considered equivalent to one fall for the same period, the information translating the intensity of short-term phenomena is lost.
The choice of one of these models must be made starting from a priori ideas on the types of relationships which exist between the covariates and the risk of falling. In negative binomial regression, AG, and pooled logistic regression, no distinction is made between the various events that succeed one another. This restricts the baseline hazard and the regression coeffi cients do not vary according to the rank of recurrence. A history of previous falls is strongly recognized as a predictor of subsequent falls.10,23 Intuitively, we would expect a fi rst fall to differ from the aetiology of the subsequent falls. The predictors for one fall that can occur by accident might be different from those for recurrent falls that can be associated with one’s health condition.24,25 Hence, researchers and practitioners may be interested in knowing not only the overall covariate effects on the risk of all failures, but also the specifi c effects of independent variables for the fi rst, second, or subsequent events. The binomial regression, AG, and pooled logistic regression, contrary to the WLW, provide no insights to answer such questions. In accordance with the structure of the data to be analyzed and the research question to be answered, the WLW is expected to be a naturally more appropriate method for studying the risk factors of falls.
Methods
Subjects and procedures
Subjects were volunteers recruited bet-ween March 2002 and July 2005 to form an open cohort that included community-dwelling persons, aged 65 years and over and receiving home-care services. People who could speak neither French nor English, those not able to walk more than six meters, and those with reduced communication and cognition were
excluded. All subjects gave informed consent. The study was approved by the authorities of each participating centre.
This study is a part of a research project on the evaluation of a multifaceted preventive intervention.26 Participants were visited at home, at entry and every six months, by a trained physical rehabilitation therapist in order to ascertain information about potential risk factors. A fall was defi ned as an event resulting in the subject inadvertently coming to rest on the ground, fl oor or other lower level (e.g., stairs). Excluded were sports-related falls.23 Subjects were asked about falls in the three months preceding the initial interview and were monitored for new falls by use of a daily completed calendar and monthly phone calls.
Material and social forms of an ecological deprivation index were imputed to participants, using postal codes to match geographic areas of residence with Canadian census data.27,28 Nutritional risk screening was performed on a graded 13-point scale tool.29-32 Body weight was self-reported and height was measured using standard techniques. Gait, balance, and mobility performance were assessed by the Berg scale33-36 on a 56-point scale, and by the Timed Up & Go test37,38 which measures the overall time, in seconds, to complete a series of functional tasks. Subjects’ homes were assessed for 37 potential environmental hazards using the Gill’s room-by-room assessment form39,40 Housing types included: single-family house; apartment; row housing or other unique entrance dwelling units; private residential facilities for seniors; other housing, including room in shared accommodation. Data about the use of benzodiazepines (yes/no) and number of daily consumed prescribed drugs were recorded directly from the containers. A detailed history of alcohol consumption was obtained through a questionnaire developed by the Québec Institute of Statistics.41,42 Responses were categorized for both drinking in the preceding week
(yes/no) and usual drinking during the last 6 months (non-drinker, ≤ 2 times a month, 1-6 times a week, every day). Generally, higher values of the measurements denoted higher risk or impairment, except for the Berg scale where the opposite was true.
Statistical analyses
Descriptive analyses were carried out using SPSS® 13.0; regression analyses using SAS® 9.1. The adjusted effects of subject characteristics on the likelihood of falling were investigated using three survival-analysis techniques (conventional Cox regression, AG extension, and WLW extension), a negative binomial regression, and a logistic regression.15,43
The dependent variable in all survival analyses was time to fall for each participant during the follow-up, measured in days. Only cases with at least one month of follow-up fall data were included. Subjects were censored upon reaching 18 months of follow-up (optional voluntary drop out), end of study, or time of withdrawal for any reason. Repeated falls were considered as occurrences of the same type of indistin-guishable events. Survival analyses were performed with all covariates measured on baseline only and with updated covariates. Baseline covariates included age, sex, number of falls in the three months prior to study entry, type of residence, and deprivation index. For the time-varying covariates, including BMI, nutritional risk, alcohol consumption, home environmental hazards, gait and balance, use of benzodiazepines and all medications, the measurement closest to the time preceding the fall was considered.2 Measurement of exposure to the middle of the follow-up period was used in the case of the people who did not fall. Thus we tested the null hypothesis that the exposure collected during the follow-up was not associated to the risk of falling thereafter.2 No proportional hazards assumption was required in Cox with time-dependent covariates procedure, since the hazards depended on time.2,43

Vol 28, No 4, 2008Chronic Diseases in Canada 115
The dependent variable in the logistic regression was the state of being a faller (subjects who fall at least once) over a 12-month period. The negative binomial and logistic regressions were performed with all covariates measured on baseline. The statistical methods are summarized in Figure 1. The linearity assumption of the relationships was checked for continuous predictor variables. All models were fi t using a stepwise-like process to retain any variable in the presence of others with a p-value ≤ 0.05. Robust sandwich estimates of variance were used in the survival-analysis, as well as the negative binomial regression techniques, in order to compensate for the lack of independence between multiple falls.
The WLW approach estimated both common and event-specifi c β for the fi rst fi ve falls of each subject, as well as the common β for all the observed falls. The number of subjects at risk for a given stratum, after the fi rst fall, was made up of all subjects who experienced a fall in the preceding stratum minus those who were
lost in the follow-up; n of subjects at risk for a given pooled fall group was made up of all subjects under observation in all considered strata, as if subjects in each stratum represented a different subject. Each model was examined both with and without past fall strata, as it could have masked the effects of other variables of interest.6,23
Results
Study subjects
Of the 959 persons who met the study inclusion criteria, agreed to participate, and received a home visit, 22 withdrew without completely fi lling the baseline assessments or before one month of follow-up. Mean and median follow-up times of the remaining 937 subjects were 488 and 458 days, respectively (range, 27 to 1330 days). Some 549 subjects (57.2%) remained in the study at 12 months and 377 (39.3%) at 18 months. Respondents were mainly women (75.7%). Mean age (standard deviation) was 79.5 (6.7), of which 76.4% were 75 years of age or older.
Thirty-nine percent (39.0%) experienced at least one fall in the three months prior to study entry and 14.9% had two or more.
Comparison of statistical methods
Table 1 summarizes the differences in relative risks for falling obtained through several statistical methods. Firstly, the logistic regression (1) and time-to-fi rst fall using a standard Cox (3a) overlooked the recurrence of falls and identifi ed less signifi cant risk factors than did the negative binomial (2), AG (4a), and WLW (5a), that considered all the available information (number between parentheses refers to the concerned model in Table 1). Although both logistic regression and standard Cox identifi ed the same risk factors, logistic regression ignored the time of occurrence of falling. This led to a conclusion of higher magnitude of the related relative risks, compared to standard Cox. The values obtained by the logistic regression were between 17.6% (1.47 vs 1.25) and 39.6% (3.28 vs 2.35) greater than those of standard Cox.
TABLE 1Adjusted relative risk estimates of factors for falls among the community-dwelling elderly,
according to different statistical regression methods
Risk factor
1Logistic
(fallersc)
2Negative binomial (all falls)
3aStandard
Cox/WLW (fi rst fall)
4aAG Coxa
(all falls)
5aWLW
(all falls)
3bStandard
Cox/WLW (fi rst fall)
4bAG Coxb
(all falls)
5bWLW
(all falls)
with baseline covariatesd with time-varying covariatese
Home hazards (nb) — — — — — 1.12**** 1.08*** 1.19****
BMI (kg/m2) — — — 0.98** — — 0.98** 0.99*
Berg score — 0.98** — 0.98**** 0.98*** 0.99** 0.98**** 0.99****
Time Up & Go score — — — — 0.99** — — —
Male 1.47* — 1.25* — 1.22* 1.34** — 1.30**
Age (yrs) — 0.97** — 0.97** 0.98** 0.98* 0.97** 0.98***
Residential facility housing — — — — 1.29* 1.45** — 1.61****
One prior fallf 1.95*** 1.41* 1.47*** 1.40** 1.26* 1.45*** 1.37* 1.24*
Two or more prior fallsf 3.28**** 3.15**** 2.35**** 2.31**** 2.12**** 2.07**** 2.21**** 1.86****
Signifi cant (two-tailed): *p ≤ 0.05; **p ≤ 0.01; ***p ≤ 0.001; ****p ≤ 0.0001Included number of previous falls during the follow-up as a time-dependent covariate to account for dependence between falls:a IRR =1.10****; b IRR =1.09****.c Subjects monitored less than 12 months who did not declare any falls (n = 221) were excluded, given that we could not defi ne the status of faller.d All covariates measured on baseline only; e up-dated covariates included home hazards, BMI, Berg and Timed Up & Go scales.f History of falls in 3 months preceding initial interview.

116 Chronic Diseases in CanadaVol 28, No 4, 2008
Secondly, three methods - the negative binomial regression (2), the AG (4a), and WLW (5a) extensions of the Cox model considered follow-up time, rate of all falls, as well as dependence between falls, using robust estimates of variance. WLW revealed more signifi cant fall-risk factors than the other methods and accorded less importance to the history of falls in the three months preceding the initial interview. Notably, the negative binomial regression, in relation to the WLW, exhibited a difference of 48.6% (3.15 vs 2.12) for the variable “two or more prior falls”. The different emphasis given by these three approaches to the dependence among multiple event times explains the difference in results. The negative binomial regression does not integrate the length of inter-fall intervals. The AG explicitly models the impact of earlier falls on future events. In this regard, the incidence rate ratio (IRR, virtually equivalent to the so-called hazard ratios) of 1.10 of the time-dependent term “number of previous falls” modelled in the
AG (4a) indicates a 10% increase in hazard for each unit increase in number of prior falls. In contrast, WLW estimates separate relationships for each fall and computes the coeffi cients and the within-subject correlation more directly than the AG, thus providing effi cient weighted average estimates of effect (and variance).
Thirdly, results were compared for the models both with and without time-dependent covariables. The number of home hazards, an exposure particularly likely to vary during the follow-up, was not signifi cantly associated with falls in any of the models that had only baseline covariates (1 to 5a). On the contrary, the variable was always statistically signifi cant in the same models that controlled variation of exposure throughout time (3b to 5b). All survival models with time-varying covariables identifi ed a greater number of fall-risk factors than did the corresponding technique with only baseline covariates (3b vs 3a, 4b vs 4a, and 5b vs 5a), even when estimates were calculated from the robust
variance. A more marked difference was noted between techniques that modeled only time to fi rst fall and those that took into consideration time to each fall. For the marginal WLW model, inattention to time-varying covariables produced bias in various directions. Lastly, results from the usual methods of analysis of risk factors for falling (1 and 3, in Table 1) produced considerable biases relative to the WLW model using time-dependent covariates (5b).
Risk factors for falls
The sample of 937 subjects reported 1,270 falls during a total of 457,283 person-days of observation, given that a same person could report more than one event. Among the subjects, 495 had no falls, 192 experienced one episode, and 250 had more than one. The consideration of the fi rst fi ve falls gathered 90.0% of the 442 fallers and 95.3% of the 937 individuals in the sample. Of all falls for which information on consequences was
TABLE 2Adjusted and variance-corrected WLW incidence rate ratio by selected risk factors for falls among the
community-dwelling elderly, according to the fall rank or pooled fall group
Risk factor
Fall rank number Fst 5 falls All falls
1na = 937
2n = 429
3n = 244
4n = 140
5n = 93 n = 1 843 n = 2 169
Falls (nb) 442 250 144 99 66 1 001 1 270
Home hazards (nb) 1.12**** 1.19**** 1.20**** 1.17*** 1.36**** 1.16**** 1.19****
BMI (kg/m2) — — 0.95*** — — [0.99*]b 0.99*
Berg balance score 0.99** 0.98*** 0.98** — 0.97*** 0.98**** 0.99****
Benzodiazepine use — 1.37* — — — [1.22**] [1.21*]
Alcohol use, past 6 months
≤ 2 times per month vs. other categories — — 1.50* — — [1.20*] —
Male 1.34** — — — 2.02** 1.28** 1.30**
Age (yrs) 0.98* — 0.97* 0.96* — 0.98** 0.98***
Residential facility housing 1.45** 1.70** — — 2.52* 1.51*** 1.61****
Material deprivation index
Fourth vs. other quartiles — — — — 3.81**** — —
One fall prior initial interviewc 1.45*** — — — — 1.37*** 1.24*
≥ 2 falls prior initial interviewc 2.07**** 1.65** 2.15**** 1.49* — 1.95**** 1.86****
Signifi cant (two-tailed): *p ≤ 0.05; **p ≤ 0.01; ***p ≤ 0.001; ****p ≤ 0.0001.a n of subjects at risk for the considered fall stratum or pooled fall group.b The brackets show the variables had not reached statistical signifi cance after “previous falls” were introduced.c History of falls in 3 months preceding initial interview.

Vol 28, No 4, 2008Chronic Diseases in Canada 117
available, 44.4% resulted in injuries, 25.2% in activity limitations, 17.1% in a medical consultation, and 5.6% in a hospitalization. Altogether, 82.1% of falls occurred in the subjects’ home.
Table 2 displays the adjusted associations between the potential risk factors and the incidence rate for specifi c and pooled falls. The WLW marginal risk estimates for the fi rst fall stratum in Table 2 are precisely the same as would occur if the analysis were restricted to data on time to fi rst fall using a standard Cox model (column 3b, in Table 1). The only difference is that the p-values presented in the former were calculated from the robust rather than standard (“naïve”) statistics. However, while the estimates for the fi rst fall stratum are essentially equivalent in these two cases, results for the other strata vary substantially according to whether coeffi cients are calculated from robust or from naïve methods, providing some indication as to the degree of dependence among the events. Thus, male sex, residential facility for seniors, number of home hazards, Berg balance score, and age signifi cantly and independently predict time-to-fi rst fall. For example, the IRR = 1.45 found for the residential facility for seniors indicated that the subjects living in such places experienced falls at a rate which was 45% higher than for those living in any other kind of housing. Similarly, the IRR of 1.12 for the home hazards indicated a 12% increase in hazard for each unit increase in number of items. However, since age has an IRR of less than 1 (i.e. 0.98), increase in age by one year led to decrease in hazard by 2%.
Table 2 also compares the results when distinct β were fi t for each fall. Covariates as age, home hazards, and Berg scale show sustained and relatively constant effects across the strata. Some others differ both in the nature and magnitude of the statistically signifi cant variables, depending on their position in the sequence. The greatest differences in IRR appear in the fi fth episode. The entry, in the last step of history of falling in the three months prior to study entry, turned out to be highly signifi cant and did not alter either the magnitude or signifi cance of the IRR for
the other variables already included in all stratum models. The right-hand section of Table 2 repeats the analysis under the constraints of overall common β (weighted average of the event-specifi c hazards), both when falls beyond the fi fth were not applied (censored model) and when all fall data were utilized (complete model). The censored model identifi ed seven variables, three more than the time-to-fi rst-fall model (BMI, use of benzodiazepines, and occasional alcohol consumption in the past six months of follow-up) and one more than the complete model (alcohol consumption). However, these additional variables were no longer signifi cant in the context of the contribution of all others, once the history of falling was joined to the censored model; furthermore, the use of benzodiazepines and alcohol consumption became insignifi cant in the complete set. An age-sex interaction term tested in each fi nal model was not signifi cant.
Discussion
This article addresses the proper method of examining falls and their determinants. No statistical technique can reproduce human behaviour exactly, and makeshift solutions to time-varying exposures and recurrence of events can lead to severe bias. To our knowledge, the fi rst and only example where time-varying exposures and multiple falls were ascertained simultaneously was in a doctoral thesis deposited in 199122 and published later in a scientifi c review.23 However, substantial statistical progress has appeared since then. In the current issue, we discuss the various methods for studying the exposure changes during follow-up and recurrent events in the same person. We further illustrate them by identifying the risk factors for falls in the elderly. We have concentrated on the statistical/methodological aspects and have mentioned the risk factor fi ndings only to the extent of showing different results obtained by different analyses.
Methods that handle the aforementioned data analytical features in a statistically correct manner are now available in commercial packages. They have been addressed extensively in the statistical literature, but not yet routinely applied and
reported for fall studies, as new advances in the statistical world are often slow to reach the clinical and public health fi elds.4 We have presented throughout our paper our arguments as to why the WLW approach is expected to be an appropriate choice in the context of our study. It provides a natural framework for analysing time-varying exposures and multiple events data using minimal assumptions.2,44 Other authors have reported that the WLW is robust and performs quite well in many practical situations.14
The differences in the estimates obtained through several statistical methods analysing the risk factors for falling, have been illustrated according to the information provided. Results clearly reveal that the usual methods, such as binary outcome using a logistic regression and time to fi rst fall using a standard Cox, produce considerable biases, as opposed to the WLW model that uses time-dependent covariates. In addition, modeling for fi rst events implicitly assumes that the fi rst event is representative of all events. Our study denotes that this assumption is questionable, more in the qualitative facet of IRR estimates than in the quantitative. Our results provide additional evidence regarding the convenient choice of a stratifi ed model rather than a non-stratifi ed one, given that the risk of occurrence varies substantially between occurrences. Mahé and Chevret45 expect such possibilities when the frequency of events per unit is “small”, such as falls among community-dwelling elderly people.
Furthermore, our results are coherent with earlier fi ndings, although we are more confi dent of the magnitude in estimates of predictors. A few fi ndings merit comment. Number of home hazards and history of falling are strong and consistent predictors of falls, whatever their rank or pooling. Prior overall falls increase the risk of subsequent overall falls. This suggests that if the causes of past falls - for which the variable acts as a proxy - are not corrected, the chances of sustaining further falls due to the same causes are increased.23 The people living in a residential facility for seniors are more at risk than others to fall, possibly because the variable

118 Chronic Diseases in CanadaVol 28, No 4, 2008
acts as a surrogate measure of various chronic conditions and poorer functional autonomy. Similarly, younger people reveal themselves to be at a higher risk of falling compared to the older, probably because of more vigorous lifestyle activities.
We further hope to eliminate any misunderstanding about any incidence measures reported in the research literature, especially the dubious events per person-time relating the number of falls (single in some subjects, multiple in others) to the cumulative time of observation of all subjects. It should not be confused with the individual event rate adjusted for the follow-up time that we discuss in our paper, or with the incidence rate widely used in epidemiology. In the events per person-time measure, the numerator does not express a number of subjects wherein the event only occurs once, but rather a number of events scattered among the study subjects. Windeler and Lange46 have vigorously denounced this concept because it has no exact interpretation on an individual level. Hence, event rates are the same (20 per 100 person-years) whether 20 subjects are observed for 10 years and each suffers two falls, or 1000 subjects are observed for half a year and 100 (10%) of them have one fall each. Having been introduced in the ‘80s and still, unfortunately, sometimes reported in peer-reviewed journals47-50, this concept should be abandoned,46 as it impedes the search for new approaches.
Happily, prospective design, frequent contacts, repeated measures, and clinical measurements performed by a therapist limited information bias. Nonetheless, some other exposures, such as nutrition screening and alcohol use, were derived from self-reports. Differential misclassifi cation could occur if the fact of a fall or recurrent falls affected the accuracy with which the individuals recalled relevant exposures and subsequent outcomes. This would exaggerate the magnitude of the effect on the risk of falling.6 Also, the length of time between a fall and the measure of follow-
up exposure obviously varied according to the day on which the fall occurred. Hence, an accurate assessment of exactly when a change in exposure to time-dependent covariates might have happened between each six-month follow-up was not possible. It would result in non-differential errors in the measurement of exposures, thereby diluting the observed relation. Another potential for biased results might have occurred because of dropouts, particularly when the latter do not have the same rate of outcome (risk of falling) as those who continue in the study. With the exception of people who refused the services and who were less likely to fall, as opposed to the active participants completing the study, no other reason for loss to follow-up was associated with the falls. Male sex, ageing, residential facility for seniors, fi rst quartile deprivation index, lower Berg score, and daily alcohol consumption at baseline were associated with a signifi cant shorter duration in participation. As Campbell et al.51 have already noted, those individuals who are more frail and may be at greater risk of falling are the ones most diffi cult to involve and sustain in follow-up. This would also lead to an underestimation of the effects.
All the aforementioned considerations lead us to believe that the results observed in our study tend to be conservative. A practical drawback of the WLW is the pre-processing effort and care required in the dataset construction. The application of this method depends on the completeness of the reports of falls and knowledge of calendar dates of falls. Future research must make the transition from risk factors for falling to community implementation of interventions.
Finally, it would be useful to talk about two substantive clinical fi ndings that have been deleted from the text. Firstly, the degree to which balance and gait mediate the relationship between medication and the likelihood of falling was estimated.6 A mediator is an intermediate variable that occurs in the causal chain between an
exposure and an outcome. If a variable is truly in the causal pathway, the association between the latter two variables should disappear upon adjustment for the mediator.52 Adjustments for Berg balance scale resulted in a maximum increase of 21% in the effect of benzodiazepines, contrary to the hypothesized reduction. Consequently, the covariate does not act as a mediator or as an appreciable confounder.
Secondly, falls leading to a medical con-sultation were examined as a secondary outcome, hypothesized as a measure of severity. For these cases, a variable “previous falls” was included as a time-dependent covariate. It was created to consider whether a fall not resulting in a medical consultation had been reported in the three-month period preceding any fall-related medical consultation. Adjusted results identifi ed the number of home hazards (incidence rate ratio = 1.09), the nutrition screening score (1.09), living in a residential facility for seniors (1.67) and fall history (1 prior fall = 0.59; ≥ 2 prior falls = 0.64) as signifi cant and independent predictors for all pooled fall-related medical consultations. Having fallen in the three months before each new event under study was protective against any fall for which people sought medical attention.
Acknowledgements
The authors gratefully thank all older clients and health care workers from the community centres in Lanaudière who participated in the study. We also acknowledge the special contribution of Josée Payette for her effort in preparing the data fi les used in the analyses; Nancy Leblanc, Julie Meloche, and Jean-François Allaire from the Research Centre at the Philippe-Pinel Institute of Montreal for the statistical computations of regression analyses; and Bruce Charles Bezeau for the English revision of the manuscript. The research was sponsored by the Agence de la santé et des services sociaux de Lanaudière.

Vol 28, No 4, 2008Chronic Diseases in Canada 119
References
1. Ministère de la Santé et des Services sociaux
du Québec. La prévention des chutes dans un
continuum de services pour les aînés vivant
à domicile, Cadre de référence, Québec,
Direction générale de la santé publique, 2004,
61 p. Available from: URL http://msssa4.
msss.gouv.qc.ca/fr/document/publication.
nsf/fb143c75e0c27b69852566aa0064b01c/
e69780d1c112de3d85256f55007354f5?Ope
nDocument (last accessed July 14, 2007).
2. Desquilbet L, Meyer L. [Time-dependent
covariates in the Cox proportional hazards
model. Theory and practice]. Rev Épidemiol
Santé Publique 2005;53(1):51-68. French.
3. Moulton LH, Dibley MJ. Multivariate time-
to-event models for studies of recurrent
childhood diseases. Int J Epidemiol 1997;
26(6):1334-9.
4. Mahé C, Chevret S. Estimation of the
treatment effect in a clinical trial when
recurrent events define the endpoint. Stat
Med 1999;18(14):1821-9.
5. Glynn RJ, Buring JE. Counting recurrent
events in cancer research. J Natl Cancer
Inst 2001;93(7):488-9.
6. Cumming RG, Kelsey JL, Nevitt MC.
Methodologic issues in the study of frequent
and recurrent health problems. Falls in the
elderly. Ann Epidemiol 1990;1(1):49-56.
7. Goodman AC, Hankin JR, Kalist DE, Peng
Y, Spurr SJ. Estimating determinants of
multiple treatment episodes for substance
abusers. J Ment Health Policy Econ
2001;4(2):65-77.
8. Robertson MC, Campbell AJ, Herbison
P. Statistical analysis of efficacy in falls
prevention trials. J Gerontol A Biol Sci Med
Sci 2005;60(4):530-4.
9. Wang SJ, Winchell CJ, McCormick CG,
Nevius SE, O’Neill RT. Short of complete
abstinence: an analysis exploration of
multiple drinking episodes in alcoholism
treatment trials. Alcohol Clin Exp Res
2002;26(12):1803-9.
10. Hogan DB, MacDonald FA, Betts J, Bricker
S, Ebly EM, Delarue B, Fung TS, Harbidge
C, Hunter M, Maxwell CJ, Metcalf
B. A randomized controlled trial of a
community-based consultation service to
prevent falls. CMAJ 2001;165(5):537-43.
11. Glynn RJ, Buring JE. Ways of measuring
rates of recurrent events. BMJ 1996;
312(7027):364-7.
12. Lin DY. Cox regression analysis of
multivariate failure time data: the marginal
approach. Stat Med 1994;13(21):2233-47.
13. Finkelstein DM, Schoenfeld DA,
Stamenovic E. Analysis of multiple failure
time data from an AIDS clinical trial. Stat
Med 1997;16(8):951-61.
14. Wei LJ, Glidden DV. An overview of
statistical methods for multiple failure
time data in clinical trials. Stat Med
1997;16(8):833-9.
15. Cleves M. How do I analyze multiple failure-
time data using Stata?, Stata FAQ, 2002, 11
p. Available from: URL http://www.stata.
com/support/faqs/stat/stmfail.html (last
accessed July 14, 2007).
16. Andersen PK, Gill DR. Cox’s regression
model for counting processes. Ann Statist
1982;10(4):1100-1120.
17. Prentice RL, Williams BJ, Peterson AV.
On the regression analysis of multi-
variate failure time data. Biometrika
1981;68(2):373-379.
18. Wei LJ, Lin DY, Weissfeld L. Regression
analysis of multivariate incomplete
failure time data by modelling
marginal distributions. J Am Stat Assoc
1989;84(408):1065–73.
19. Lancar R. [Robust analysis methods for
multivariate survival times]. Rev Épidemiol
Santé Publique 1999;47(3):287-96. French
20. Roberston MC. Development of a falls
prevention programme for elderly people
: evaluation of efficacy, effectiveness, and
efficiency. A Ph.D. thesis submitted at
the University of Otago, Department of
Medical and Surgical Sciences, Dunedin,
New Zealand, 2001.
21. D’Agostino RB, Lee ML, Belanger AJ,
Cupples LA, Anderson K, Kannel WB.
Relation of pooled logistic regression to
time dependent Cox regression analysis:
the Framingham Heart Study. Stat Med
1990;9(12):1501-15.
22. O’Loughlin J. The incidence of and risk
factors for falls and fall-related injury
among elderly persons living in the
community. A Ph.D. thesis at the McGill
University, Department of Epidemiology
and Biostatistics, Montreal, Québec,
Canada, 1991, 270 p.
23. O’Loughlin JL, Robitaille Y, Boivin JF,
Suissa S. Incidence of and risk factors
for falls and injurious falls among the
community-dwelling elderly. Am J
Epidemiol 1993;137(3):342-54.
24. Nevitt MC, Cummings SR, Kidd S, Black
D. Risk factors for recurrent nonsyncopal
falls. A prospective study. JAMA 1989;
261(18):2663-8.
25. Fletcher PC, Hirdes JP. Risk factors for
falling among community-based seniors
using home care services. J Gerontol A Biol
Sci Med Sci 2002;57(8):M504-10.
26. Bégin C. Projet-pilote régional de prévention
des chutes à domicile chez les personnes
âgées, Devis d’implantation dans les
CLSC, Saint-Charles-Borromée, Service de
prévention et de promotion, Direction de
santé publique, Régie régionale de la santé
et des services sociaux de Lanaudière,
2002, 120 p.
27. Pampalon R, Hamel D, Raymond G. Indice
de défavorisation pour l’étude de la santé et
du bien-être au Québec - Mise à jour 2001.
Institut national de santé publique du Québec,
2004, 11 p. Available from: URL http://
www.inspq.qc.ca/pdf/publications/295-
IndiceDefavorisation_2001.pdf (last accessed
December 24, 2006).

120 Chronic Diseases in CanadaVol 28, No 4, 2008
28. Leclerc BS, Marquis G, Payette J. Tableau
de bord lanaudois sur la défavorisation.
Territoire de Lanaudière. Calibrage à
l’échelle de la région de Lanaudière,
Joliette. Agence de la santé et des services
sociaux de Lanaudière, Direction de
santé publique et d’évaluation, Service
de surveillance, recherche et évaluation,
2005, 87 p.
29. Payette H. Développement, validation et
évaluation d’un programme de dépistage
nutritionnel pour les personnes âgées
en perte d’autonomie vivant dans la
communauté, Sherbrooke, Centre de
recherche en gérontologie et gériatrie, Centre
d’expertise en gérontologie et gériatrie
inc., Institut universitaire de gériatrie de
Sherbrooke, non daté, pages multiples.
30. Payette H, Guigoz Y, Vellas BJ. Study
design for nutritional assessments in the
elderly », in Methods in Aging Research,
B.P. YU (ed), Boca Raton (Florida), CRC
Press LLC, 1999, p. 301-20.
31. Laporte M, Villalon L, Payette H. Simple
nutrition screening tools for healthcare
facilities: development and validity
assessment. Can J Diet Pract Res
2001;62(1):26-34.
32. Laporte M, Villalon L, Thibodeau J,
Payette H. Validity and reliability of simple
nutrition screening tools adapted to the
elderly population in healthcare facilities.
J Nutr Health Aging 2001;5(4):292-4.
33. Berg K. Balance and its measure in
the elderly: a review. Physiother Can
1989;41(5):240-6.
34. Berg KO, Maki BE, Williams JI, Holliday
PJ, Wood-Dauphinee SL. Clinical and
laboratory measures of postural balance
in an elderly population. Arch Phys Med
Rehabil 1992;73(11):1073-80.
35. Berg KO, Wood-Dauphinee SL, Williams JI,
Maki B. Measuring balance in the elderly:
validation of an instrument. Can J Public
Health 1992;83(suppl. 2):S7-11.
36. Berg K, Wood-Dauphinee S, Williams JI.
The Balance Scale: reliability assessment
with elderly residents and patients with
an acute stroke. Scand J Rehabil Med
1995;27(1):27-36.
37. Podsiadlo D, Richardson S. The timed «Up
& Go»: a test of basic functional mobility
for frail elderly persons. J Am Geriatr Soc
1991;39(2):142-8.
38. Lin MR, Hwang HF, Hu MH, Wu HD,
Wang YW, Huang FC. Psychometric
comparisons of the timed up and go,
one-leg stand, functional reach, and
Tinetti balance measures in community-
dwelling older people. J Am Geriatr Soc
2004;52(8):1343-8.
39. Gill TM, Williams CS, Robison JT,
Tinetti ME. A population-based study
of environmental hazards in the homes
of older persons. Am J Public Health
1999;89(4):553-6.
40. Gill TM, Williams CS, Tinetti ME.
Environmental hazards and the risk
of nonsyncopal falls in the homes of
community-living older persons. Med Care
2000;38(12):1174-83.
41. Chevalier S, Lemoine O. Consommation
d’alcool, in Enquête sociale et de santé
1998, Québec, Institut de la statistique du
Québec, 2000, p. 117-33. (Collection La
santé et le bien-être)
42. Institut de la statistique du Québec Annexe
3. Questionnaire autoadministré (QAA) VI
– L’alcool, in Enquête sociale et de santé
1998, Québec, Institut de la statistique du
Québec, 2000, p. 15-7. (Collection La santé
et le bien-être)
43. Allison PD. Survival analysis using SAS:
A practical guide. Cary NC: SAS Institute
inc., 1995, 304 p.
44. Li QH, Lagakos SW.Use of the Wei-Lin-
Weissfeld method for the analysis of a
recurring and a terminating event. Stat
Med 1997;16(8):925-40.
45. Mahé C, Chevret S. Analysis of recur-
rent failure times data: should the
baseline hazard be stratified? Stat Med
2001;20(24):3807-15.
46. Windeler J, Lange S. Events per
person year - a dubious concept. BMJ
1995;310(6977):454-6.
47. Saari P, Heikkinen E, Sakari-Rantala R,
Rantanen T. Fall-related injuries among
initially 75- and 80-year old people during
a 10-year follow-up. Arch Gerontol Geriatr
2007;45(2):207-15.
48. Sambrook PN, Cameron ID, Chen JS,
Cumming RG, Lord SR, March LM, Schwarz
J, Seibel MJ, Simpson JM. Influence of
fall related factors and bone strength on
fracture risk in the frail elderly. Osteoporos
Int 2007;18(5):603-10.
49. Cook WL, Tomlinson G, Donaldson M,
Markowitz SN, Naglie G, Sobolev B, Jassal
SV. Falls and fall-related injuries in older
dialysis patients. Clin J Am Soc Nephrol
2006;1(6):1197-204.
50. Mahoney JE, Palta M, Johnson J, Jalaluddin
M, Gray S, Park S, Sager M. Temporal
association between hospitalization and
rate of falls after discharge. Arch Intern
Med 2000;160(18):2788-95.
51. Campbell AJ, Robertson MC, Gardner MM,
Norton RN, Buchner DM. Falls prevention
over 2 years: a randomized controlled trial
in women 80 years and older. Age Ageing
1999;28(6):513-8.
52. Szklo M, Nieto FJ. Epidemiology: Beyond
the basics. Gaithersburg, MD: Aspen
Publications, 2000, 494 p.

Vol 28, No 4, 2008Chronic Diseases in Canada 121
I Hyman, PhD (1); H Fenta, PhD (2); S Noh, PhD (3)
Abstract
The objective of this paper is to present descriptive data on gender and smoking among Ethiopian immigrants in Toronto, Canada. The study used a cross-sectional epidemiological survey design (N = 342). The main outcome measures identified subjects as current (regular or occasional) smokers, daily smokers and former smokers. Overall, 20.8% of the individuals in the sample were current smokers and 15.7% were daily smokers. Although smoking rates (current and daily) were significantly higher among males compared to females, nearly twice as many female as male daily smokers reported that they began smoking post-migration (60.0% vs. 30.2%). Furthermore, 80.0% of female compared to nearly 56% of male daily smokers reported that they were smoking more post-migration. A significantly higher proportion of males compared to females were former daily smokers (17.8% vs. 4.4%). These findings present a challenge for public health professionals in terms of preventing the adoption of smoking among Ethiopian females and facilitating smoking cessation among Ethiopian males. Correlates with current smoking suggested that smoking prevention and cessation programs in newcomer immigrant communities may benefit from incorporating social, economic and religious contexts of these newcomers’ lives from a gender-specific perspective.
Key words: smoking, immigration, gender
Author References
1 Department of Public Health Services, University of Toronto2 The Ontario HIV Treatment Network3 Department of Psychiatry, University of TorontoCorrespondence: Ilene Hyman, CERIS – The Ontario Metropolis Centre, 246 Bloor St. West, 7th Floor, Toronto, Ontario, Canada, M5S 1V4, Tel: (416) 946-0116, Email: [email protected]
Introduction
Smoking is a major risk factor for mortality and morbidity.1,2 Several studies suggest that smoking rates among immigrants to Western countries have increased and this is why many cancer rates among immigrants are converging with those of the native-born population.3-5 Risk and protective factors associated with smoking behaviour are well documented in the literature. These include age, gender, religiosity, level of education, employment, stress and social support.6-9 Among these, gender is a parti-cularly prominent factor for immigrant communities, with female immigrants typically exhibiting significantly lower rates of smoking than males.10-13,16 However, few studies have examined smoking and cor-relates of smoking among recent immigrants to Canada. This information is critical to
disadvantaged socio-economic status or the loss of social networks, smoking behaviour as a coping response to dis-crimination and poverty, and acculturative changes in beliefs, values and norms about smoking.14,15
It is further recognized that immigrants are not a homogeneous group.15 Using data from the 1996 National Population Health Survey and the 2000-01 & 2002-03 Canadian Community Health Surveys, McDonald16 found major differences in smoking rates within Canadian immigrants characterized by gender and length of stay in the host country. For example, both immigrant males and females showed an increase in rates of smoking by length of stay in Canada but after adjusting for differences in demographic and socio-economic characteristics, there was only evidence of significant convergence for male immigrants. Regional differences were also observed. For example, among non-English speaking immigrants born in countries outside of Europe, immigrants from the Middle East and Western Asia were more likely to smoke compared to immigrants from East Asian countries (control group), while immigrants from Southern Asia were less likely to smoke compared to the control group. The log-odds ratio for daily smoking for African immigrants was not significantly different from that of the control region of birth.
Gender is increasingly being recognized as a determinant of immigrant women’s health.17 Gender is known to influence both settlement processes as well as cognitive schemas about health.17,18 The intersections of gender with minority
Gender and the smoking behaviour of Ethiopian immigrants in Toronto
inform the development of smoking prevention and cessation strategies targeting newcomer communities. This study draws on a community survey of Ethiopian immigrants and refugees in Toronto, Canada. The purpose of this paper is to present descriptive data on the smoking behaviour and on the risk and protective factors associated with smoking in this population.
Literature Review
Post-migration changes in smoking behaviour are well-documented3-5. Less well documented are the determinants of smoking in immigrant populations although proposed models to explain these changes include prolonged exposure to stressful events, adverse circumstances such as

122 Chronic Diseases in CanadaVol 28, No 4, 2008
status, income, employment and social integration may impact directly on exposure to stressful events and indirectly on health.18- 20
Few studies have examined the smoking behaviour or psychosocial and economic determinants of smoking behaviour among specific immigrant populations by gender. It seems clear that to address identified knowledge gaps, smoking research needs to include: 1) studies of the prevalence and correlates of smoking in specific immigrant communities; and 2) intersectional studies that examine smoking behaviour from both a gender and a migration perspective.
Study Background
Since the mid-1970’s, Ethiopia has experienced a major exodus of refugees. An estimated 1.25 million Ethiopians fled to neighbouring countries, such as Sudan, Kenya, Djibouti and Yemen, and a relatively smaller proportion of Ethiopians immigrated to Europe and North America.21 Between 1974 and September 1998, over 13 000 Ethiopians migrated to Ontario.22 According to the Ethiopian Association in Toronto, the current Ethiopian population of Toronto numbers from 45 000 to 50 000. In 1997, a partnership was formed between the Culture, Community and Health Studies Program of the Centre for Addiction and Mental Health and the Ethiopian Association in Toronto to examine mental health, health, and access issues experienced by the community. The current paper draws on an epidemiological study, Pathways and Barriers to Health Care for Ethiopians in Toronto, conducted by the authors, that collected extensive data on the health and resettlement experiences of this community. Ethics approval for this research was obtained from the University of Toronto Ethics Board.
Methods
Sample and Data. The study used a cross-sectional epidemiological survey design. A variety of strategies were used to recruit subjects. Using a snowball technique, we
identified all possible Ethiopian ethnic, religious, political and social organizations in Toronto and obtained membership lists from each organization. In addition, a list of Ethiopian specific names was compiled using the city telephone directory. Since some Ethiopian Islamic names (e.g. Mohammed, Osman, Fatuma) could not be readily distinguished from non-Ethiopian Islamic names, the Islamic names from the telephone directory were compiled separately and given to different Ethiopian Muslim organizations and other Ethiopian associations to identify those who were of Ethiopian origin. We specu-lated that the Ethiopian organizations and associations in Toronto could know some of these Muslims although they might not necessarily be included in their member-ship lists. The membership lists from the different organizations, the Ethiopian specific names and non-Ethiopian specific Islamic names from the telephone directory were combined to form a sampling frame.
The resulting sampling frame consisted of 4854 households. From this list, 400 house-holds were selected using simple random sampling method and one individual, eighteen years or older, was selected from each household. Ethiopians who resided in Canada for less than 12 months were excluded from the study. The interviews were conducted by trained Ethiopian inter-viewers in Amharic. All interviewers underwent extensive training including interview skills training, procedures for contacting potential subjects and general information on immigration, settlement, immigrant health and mental health. The project was announced to the members of the Ethiopian community through religious organizations, community media and a community newsletter. Between May 1999 and May 2000 a total of 342 individuals completed the structured interview with an overall response rate of 85%.
Measurement. Questions on smoking were modelled on those appearing in national and provincial health surveys. All respon-dents were asked to classify themselves as current smokers (regular or occasional), non-smokers and former daily smokers.
For current smoking status, respondents who were smoking cigarettes at the time of survey, regularly or occasionally, were coded as 1.
Respondents who smoked cigarettes regu-larly or occasionally were asked whether they smoked daily. Daily smokers were then asked to provide information on the age they began smoking and the number of cigarettes smoked daily. Using informa-tion on age of arrival in Canada and the age at which respondents started smoking daily, we were able to determine the post-immigration onset of smoking – respon-dents who had started smoking daily in Canada. In a separate question, daily smokers were asked to indicate changes in smoking habits since leaving Ethiopia (smoking more now = 1, smoking less now = 2, no change = 3). These two variables were not mutually exclusive.
Former smoking status was determined for respondents who used to smoke daily but now classified themselves as non-smokers or occasional smokers.
An array of potential risk and protective factors were included in the analysis. Marital status was coded as: currently married (1), single, separated, divorced, widowed (0). To determine levels of religiosity respondents were asked to rate the importance of their religious beliefs. Responses were coded as: very important or important (1), not so important or not important (0). Level of education was coded as: high school or less than high school (1), college (2), and university degree (3). Employment was coded as: currently employed (1) and currently not employed (0).
To assess post-migration stress, we used the 14-item recent life events scale included in the Quebec Health Survey (QHS), which was derived from Paykel and colleagues.23 The QHS included events specifically relevant to immigrant and minority com-munities (e.g. trouble because people didn’t understand your language, trouble with prejudice or discrimination). Stress was computed as the count of events

Vol 28, No 4, 2008Chronic Diseases in Canada 123
experienced by the respondents during 12 months prior to the interview.
To assess exposure to pre-migration stres-sors, subjects were asked whether they had experienced pre-migration traumatic exposures to war and killing (coded as yes=1, no=0), or whether they had been interned in a refugee camp (yes=1, no=0).
The social support measure used was adapted from Wolchik, et al.24 Three dimen-sions of social support were assessed – advice and information, instrumental, and emotional. For each dimension of support, subjective ratings of satisfaction with supports available were obtained on a scale of 1 to 10. In this study, we used the index score that combined the scores of the three dimensions. The scale had internal con-sistency of 0.96 as measured by Cronbach’s alpha.
Data Analysis. Data analysis consisted of descriptive analysis of the study population in terms of socio-demographic character-istics and smoking behaviours. The propor-tion of the population considered to be former smokers was calculated. Daily smokers were described in terms of the number of cigarettes smoked per day, time of initiation of smoking (i.e. post-migra-tion), and changes in smoking habits since leaving Ethiopia.
Correlates of current smoking were exa-mined using bivariate logistic regression analysis. All analyses were gender-specific. Multivariate analyses for females were not conducted due to small cell sizes for female smokers, a limitation of the present study. Thus the results of this study do not identify a model of smoking; rather, potential risk and protective factors associated with current smoking are identified that can be tested in future studies.
Results
Sample Description. Table 1 summarizes data on the socio-demographic char-acteristics of the study sample by gender. Approximately 60% of the sample was
male. The respondents were predominantly a young group with a mean age of 35.3 years, and female respondents were significantly younger than males. The majority of respondents were married (55.4%) and members of the Ethiopian Orthodox church (67.7%). A significantly higher proportion of female respondents considered religion to be very important compared to male respondents (96.2% vs. 88.5%). More than two-third of the respondents (67.8%) had some post-secondary education and the majority (78.1%) were currently employed. Com-pared to males, females were significantly less likely to have a university education and be employed (p < 0.001). The average length of stay in Canada was 9.2 years (9.5 years for males and 8.7 years for females). A significantly higher proportion of males
than females experienced pre-migration trauma (26.71% vs. 11.94%) and refugee camp internment (12.6% vs. 7.2%), although in the latter case the difference was not significant. Approximately half of male and female participants had experienced at least one stressful life event. Males and females were similar in their reported levels of satisfaction with social support.
Descriptive Data on Smoking. Table 2 describes the study population by smoking status and gender. Overall, 20.8% of the sample were current smokers (used cigarettes regularly or occasionally). The current smoking rate was 2.7 times higher among male respondents (n = 56, 27.7%) compared to female respondents (n = 14, 10.4%). The gender differential in current
TABLE 1Description of the study of population by gender
VariableTotal
(n = 342)Male
(n = 203)Female
(n = 139)
Age in years (mean ± SD)*** 35.4 ± 7.2 36.7 ± 7.3 33.3 ± 6.3
Marital status (married) — (%) 55.4% 56.5% 53.7%
Religion — (%)
Ethiopian Orthodox 67.7% 72.1% 61.0%
Protestant 22.3% 19.4% 22.3%
Roman Catholic 5.3% 3.5% 8.1%
Muslim 2.4% 2.0% 2.9%
No religion 2.4% 3.0% 1.5%
Importance of religiosity — (%)*
Religion is important to me 91.6% 88.5% 96.2%
Religion is not important to me 8.4% 11.5% 3.8%
Level of education — (%)***
High school or less 32.1% 26.0% 41.2%
College education 44.0% 41.0% 48.5%
University degree 23.8% 33.0% 10.3%
Currently employed — (%)*** 78.1% 87.6% 64.0%
Length of stay in Canada (mean ± SD) 9.2 ± 4.5 9.5 ± 4.7 8.7 ± 4.2
Pre-migration trauma exposure — (%)** 20.8% 26.7% 11.9%
Refugee camp internment experience — (%) 10.6% 12.6% 7.2%
Number of post-migration life events — (%)
no stressful life events 50.1% 48.0% 53.3%
1-2 stressful life events 36.2% 36.6% 35.6%
≥ 3 stressful life events 13.6% 15.3% 11.1%
Satisfaction with social support (mean ± SD) 8.3 ± 1.7 8.2 ± 1.8 8.5 ± 1.4
* p < 0.05; ** p < 0.01; *** p < 0.001

124 Chronic Diseases in CanadaVol 28, No 4, 2008
smoking rates was significant (p < 0.001). There was also a significant gender difference in the proportion of the population who were former smokers (17.8% males, 4.4% females, p < 0.001).
Among the 53 daily smokers, 21.3% (n = 43) were male and 7.4% (n = 10) were female (p < 0.001). The mean number of cigarettes smoked daily was similar for males and females (12.0 and 11.8, respectively). Approximately 35.8% of daily smokers (n = 53) started smoking post-migration and gender differences were apparent; only 30.2% of males but 60.0% of females were non-smokers before they
TABLE 2Description of the study of population by smoking status and gender
Smoking variablesTotal
(n = 342)Male
(n = 203)Female
(n = 139)
Current smoker (regular or occasional) — (%)*** 20.8 27.7 10.4
Former smoker — (%)*** 12.4 18.3 4.4
Daily smoker — (%)*** 15.7 21.3 7.4
Daily smoking variablesTotal
(n = 53)Male
(n = 43)Female(n = 10)
Number of cigarettes smoked daily — Mean (SD) 12.0 (6.7) 12.0 (6.7) 11.8 (6.7)
Initiation of daily smoking post-migration — (%)a 35.8 30.2 60.0
Increase in daily smoking post-migration — (%) 60.4 55.8 80.0
*** p < 0.001; a p < 0.1
left Ethiopia, and began smoking after they left the homeland (p < 0.1). Gender dif-ferences were also apparent among the respondents to the question on changes in smoking habits since leaving Ethiopia. Approximately 56% of male smokers and 80.0% of female smokers reported an increase in smoking post-migration; this difference did not reach statistical significance.
Correlates of Current Smoking. Bivariate associations of current smoking (regular or occasional) with potential risk and pro-tective factors were assessed using logistic regression. Results are shown in Table 3.
Among male respondents, current smokers (compared to non-current smokers), were less likely to report religion as important or very important to them and more likely to have experienced pre-migration trauma, and to have reported higher levels of satisfaction with social support. The same associations were not observed among Ethiopian females. Among Ethiopian females, current smokers (compared to non-current smokers) were less likely to be currently married and more likely to have spent more years in Canada and to have experienced post-migration life events. We found different sets of correlates for males and females. Multiple logistic regression analysis of factors associated with current smoking in men confirmed the results of the bivariate analysis among Ethiopian males. This analysis was not performed for Ethiopian females due to small sample sizes (data available upon request).
Discussion
Our study findings highlight dramatic gender differentials in the smoking behaviour of Ethiopian males and females, which persist post-migration. Striking differences were also observed in the
Male Female
Variable B OR CI B OR CI
Age (years) 0.012 1.012 (0.97, 1.05) 0.026 1.026 (0.94, 1.11)
Currently married (= 1) -0.465 0.628 (0.33, 1.16) -1.587* 0.205 (0.05, 0.77)
Religion very important (=1) -1.605*** 0.201 (0.08, 0.51) na na na
Education High school or less (=1) 0.041 1.042 (0.44, 2.42) 0.365 1.440 (0.15, 13.11)
College (=1) 0.428 1.534 (0.74, 3.17) 0.353 1.424 (0.16, 12.66)
University (reference) 1.000 1.000
Employment (1 = employed) -0.235 0.791 (0.32, 1.95) 0.392 1.480 (0.43, 4.99)
Length of stay in Canada 0.031 1.032 (0.96, 1.10) 0.156* 1.169 (1.02, 1.33)
Exposed to pre-migration trauma (=1) 0.720* 2.055 (1.10, 3.99) -0.610 0.544 (0.06, 4.46)
Refugee camp internment (=1) 0.687 1.988 (0.77, 5.07) 0.067 1.069 (0.11, 9.68)
Number of post-migration life events 0.078 1.081 (0.88, 1.32) 0.335* 1.398 (0.99, 1.97)
Satisfaction with social support 0.209* 1.232 (1.01, 1.49) 0.049 1.051 (0.68, 1.60)
OR = Odds RatioCI = 95% confidence interval of the estimated ORna = No estimate due to empty cells* p < 0.05; *** p < 0.001
TABLE 3Bivariate logistic regression of factors associated with regular/occasional smoking by gender

Vol 28, No 4, 2008Chronic Diseases in Canada 125
correlates of current smoking by gender. Among Ethiopian males, factors associated with regular or occasional smoking included pre-migration trauma, religiosity, and satisfaction with social support. Female smokers (compared to non-smokers) were more likely to be married, have spent more years in Canada and to have experienced a higher number of stressful life events.
The results of this study are consistent with gender differentials in smoking rates observed in the 2003 Global Youth Tobacco Survey among Ethiopian students (grades 9-11), which reported smoking rates of 15.2% and 5.7% for boys and girls, respectively.25 They are also consistent with other studies conducted among native-born and foreign-born populations in the United States that suggest that immigrant women are less likely to smoke than their male immigrant and female native-born counterparts.9-12 Although McDonald16 did not find significant increases in the log-odds of smoking among immigrant women by length of stay, similar trends were observed for immigrant women. It is also possible that his findings may have masked country-specific variations in immigrant smoking behaviour.
This study is the first study to collect data on the smoking behaviour of Ethiopian immigrants in Canada. Although current smoking rates in Ethiopia are not available, studies conducted in the 1980s showed that 38% of males and 3.4% of females were smokers,26 suggesting that male Ethiopian immigrants may have had a healthier lifestyle (e.g. lower smoking rate) than Ethiopians in their home country, but females appear to exhibit the opposite pattern. Still, compared to smoking rates among males and females in the Toronto population as a whole, the smoking rate for Ethiopian males in Toronto (27.7%) was slightly higher (25.6%), whereas the rate for Ethiopian females in Toronto (10.4%) was con-siderably lower (17.8%).27
The data presented in this paper confirm other studies that suggest that immigrant behaviours, such as consumption of a high
fat diet, smoking and alcohol abuse, increase over time to resemble those of the majority culture.13,28-29 Only 44.2% of male- and 20.0% of female- daily smokers reported “no change” in smoking since migration. The vast majority of female daily smokers (80%) and over half of male daily smokers reported that they were smoking more since they left Ethiopia. Furthermore, 18.3% of Ethiopian males but only 4.4% of Ethiopian females could be classified as “former smokers.” In the case of male Ethiopians, this is a positive finding, suggesting that the daily smoking rate for Ethiopian males is declining and converging with that of the Toronto male population as a whole. On the other hand, the prevalence of current smoking among females in the Ethiopian community was initially much lower than that among females in the Toronto population as a whole, but may be increasing.
Among Ethiopian males, factors associated with regular or occasional smoking included religiosity and satisfaction with social support. Religiosity had an inverse effect on smoking behaviour (i.e. highly religious people were less likely to smoke). Other studies have found strong religious beliefs and cultural retention to be associated with maintaining health-enhancing behaviour such as a traditional high-fibre diet, non-smoking and non-use of alcohol.15,30-31 While social support is usually associated with positive health behaviours,4,32-33 in the Ethiopian com-munity, with regards to smoking, the opposite pattern was observed. This may be because many Ethiopian males, particularly without close family in Canada, socialise in smoking environments such as cafes and bars. The same may not be true for women because of social norms restricting women’s freedom of movement and gender role expectations.21,34
Pre-migration traumatic experiences were associated with an increased risk of smoking, but only among males. This finding was consistent with other research suggesting strong relationships between traumatic stress and smoking behaviour in non-immigrant populations.35-36 It is pos-sible that this association was not observed among females because only a small subset
of women experienced pre-migration trauma and smoked.
Despite the finding that Ethiopian males experienced more stressful life events compared to Ethiopian females, post-migration stressful life events were only associated with regular or occasional smoking in the latter group. The accultura-tive stress model proposes that immigrants turn to artificial support when they find the experience of immigration stressful and disorienting. Alternatively, it has been suggested that alcohol and substance use are “learned” as a part of an assimilation process.37 Our findings suggest that male and female Ethiopian immigrants may use different coping behaviours in response to stress. For example, Ethiopian women may have less opportunity to consume alcohol and drugs and/or these behaviours may be considered less culturally acceptable com-pared with smoking.
Our finding that females who resided in Canada longer were more likely to smoke is not surprising. A study of pregnant Southeast Asian immigrant females in Montreal found that women who were in Canada longer were less likely to report adequate social support and more likely to report stressful life experiences than newcomer immigrant women.38 Similarly newcomers’ strategies for coping with stress may also change with time spent in the host country.
The present study was the first community health survey of Ethiopian immigrants in North America. Among its strengths are the attempts made to develop a compre-hensive sampling frame and the excellent response rate. However the study had certain limitations that must be acknow-ledged. Firstly, potential candidates were excluded if they had no telephone, stable address or membership status in Ethiopian organisations. Secondly, the low prevalence rate of smoking among Ethiopian females in the study population limited statistical power and prevented the identification of interaction terms in a multivariate logistic regression analysis.
These findings present an obvious chal-lenge for public health professionals and

126 Chronic Diseases in CanadaVol 28, No 4, 2008
the Ethiopian community; that is, how to prevent the adoption of smoking among Ethiopian females and how to facilitate smoking cessation among Ethiopian males. Feminist researchers increasingly view smoking and substance abuse not simply as a negative lifestyle choice but as a rational response to real pressures asso-ciated with gender and class inequity.39-40 New immigrant women face multiple and more barriers to maintaining or changing health behaviour, compared to women in the general population.42-43 Study findings suggest that smoking prevention and cessation programs in the Ethiopian community must acknowledge and address the gender, social and religious contexts of these newcomers’ lives. These findings are equally relevant to other newcomer communities in Canada who may experience similar contextual and gender-specific issues.
Acknowledgements:
Support from our community partner, the Ethiopian Association in Toronto. Funding from the Centre of Excellence for Immigra-tion and Settlement (CERIS) and Heritage Canada. The authors acknowledge the contribution of Dr. Lorraine Greaves, Executive Director, British Columbia Centre of Excellence for Women’s Health who reviewed the final manuscript.
References
1. Heart and Stroke Foundation of Canada.
The Changing Face of Heart Disease and
Stroke in Canada 2000. Ottawa: Heart and
Stroke Foundation of Canada, 1999.
2. Cancer Care Ontario. Cancer Incidence
and Mortality in Ontario, 1964-1996.
Toronto: Cancer Care Ontario, 2000.
3. Kliewer EV, Smith KR. Ovarian cancer
mortality among immigrants in Australia
and Canada. Cancer Epidemiol Biomarkers
Prev. 1995;4:453-58.
4. Acevedo M. The role of acculturation in
explaining ethnic differences in the prenatal
health-risk behaviours, mental health, and
parenting beliefs of Mexican American and
European American at-risk women. Child
Abuse Neglect. 2000;24:111-27.
5. Acevedo-Garcia D, Pan J, Jun HJ, Osypuk
TL, Emmons KM. The effect of immigrant
generation on smoking. Soc Sci Med.
2005;61:1223-42.
6. Ng E, Wilkins R, Gendron F, Berthelot JM.
Dynamics of Immigrants’ Health in Canada:
Evidence from the National Population
Health Survey. 2005. URL: http://www.
statcan.ca:8096/bsolc/english/bsolc?catno=
82-618-MWE2005002
7. Public Health Agency of Canada. Toward a
Healthy Future: Second Report on the
Health of Canadians. 1999. URL: http://
www.phac-aspc.gc.ca/ph-sp/phdd/report/
toward/index.html
8. Baron-Epel O, Haviv-Messika A, Tamir D,
Nitzan-Kaluski D, Green M. Multiethnic
differences in smoking in Israel: Pooled
analysis from three national surveys. Eur J
Public Health. 2004;14:384-89.
9. Maxwell AE, Bernaards CA, McCarthy
WJ. Smoking prevalence and correlates
among Chinese- and Filipino-American
adults: Findings from the 2001 California
Health Interview Survey. Prev Med.
2005;41:693-99.
10. Wilkinson LM, Spitz MR, Strom SS, et al.
Effects of nativity, age at migration, and
acculturation on smoking among adult
Houston residents of Mexican descent. Am
J Public Health. 2005;95:1043-49.
11. Taylor KL, Kerner JF, Gold KF, Mandelblatt
JS. Ever vs. never smoking among an
urban, multiethnic sample of Haitian-,
Caribbean-, and US-born blacks. Prev Med.
1997;26:855-65.
12. King G, Polednak AP, Bendel R, Hovey D.
Cigarette smoking among native and
foreign-born African Americans. Ann
Epidemiol. 1999;9:236-44.
13. Chen J, Ng E, Wilkins R. The health of
Canada’s immigrants in 1994-5. Health
Rep. 1996;7(4):33-45.
14. Albrido-Lanza AF, Armbrister AN, Florez
KR, Aguirre AN. Toward a theory-driven
model of acculturation in public health
research. Am J Public Health. 2006;96:1342-
1346.
15. Hyman I. Immigration and Health. Working
Paper 01-05. Health Policy Working Paper
Series. Ottawa: Health Canada, September,
2001. URL: http://www.hc-sc.gc.ca/iacb-
dgiac/arad-draa/english/rmdd/wpapers/
wpapers1.html
16. McDonald JT. The health behaviours of
immigrants and native-born people in
Canada. Working Paper No 01-06. Halifax/
Moncton: Atlantic Metropolis Centre, 2006.
17. Thurston WE and Vissandjee B. An
ecological model for understanding culture
as a determinant of women’s health.
Critical Public Health. 2005;15:229-242.
18. Walters V. The social context of women’s
health. BMC Women’s Health. 2004; 4: S2.
19. Im E & Yang K. Theories on immigrant
women’s health. Health Care for Women
International. 2006;6:666-681.
20. Agnew V. Gender, Migration and Citizenship
Resources Project, Part II: A Literature
Review and Bibliography on Health.
Toronto: Centre for Feminist Research,
York University, 2002.
21. McSpadden L, Moussa H. I have a name:
The gender dynamics in asylum and in
resettlement of Ethiopian and Eritrean
refugees in North America. J Refugee
Studies. 1993;6:203-25.

Vol 28, No 4, 2008Chronic Diseases in Canada 127
22. George U, Mwarigha MA. Consultation on
Settlement Programming for African
Newcomers: Final report. Toronto:
University of Toronto: Centre for Applied
Social Research, 1999.
23. Paykel ES, Mayers JK, Diendelt MN,
Klerman GL, Lindenthal JJ, Pepper MP.
Life events and depression: A controlled
study. Arch Gen Psychiat. 1969;25:340-47.
24. Wolchik SA, Beals J, Sandler IN. Mapping
children’s support networks: Conceptual
and methodological issues. In: Belle D, ed.
Children’s Social Networks and Social
Supports. New York: John Wiley & Sons,
1989:191-220.
25. Centres for Disease Control. 2003. Ethiopia
– Addis Ababa Global Youth Tobacco
Survey (GYTS). URL: http://www.afro.
who.int/tfi/publications/gyp_factsheet/
ethiopia/addis_ababa.2003.doc
26. World Health Organization. Tobacco or
Health: A Global Status Report, Country
Profiles by Region. 1997. URL: http://
www.cdc.gov/tobacco/who/whofirst.htm.
27. Toronto Health Profiles. 2001. URL: http://
www.torontohealthprofiles.ca/
28. Hyman I. Immigrant and visible minority
women. In: Stewart DE, Cheung A, Ferris
LE, Hyman I, Cohen M, Williams IJ, eds.
Ontario Women’s Health Status Report.
Toronto: Ontario Women’s Health Council,
2002:338-58.
29. Statistics Canada. How Healthy are
Canadians? Annual report. Ottawa:
Statistics Canada, 1999. Cat. No. 82-003-
SIE.
30. Marmot MG, Syme SL. Acculturation and
coronary heart disease in Japanese-
Americans. Am J Epidemiol. 1976;
104:225-47.
31. Scribner R, Dwyer JH. Acculturation and
low birthweight among Latinos in the
Hispanic HANES. Am J Public Health.
1989;79:1263-67.
32. Sabogal F, Marin G, Otero-Sabogal R,
Marin BV, Pérez-Stable EJ. Hispanic
familism and acculturation: What changes
and what doesn’t? Hispanic J Behav Sci.
1987;9:397-412.
33. Suarez L. Pap smear and mammogram
screening in Mexican-American women:
The effects of acculturation. Am J Public
Health. 1994;84:742-46.
34. Matsuoka A, Sorenson J. Ghosts and
Shadows: Construction of Identity and
Community in an African Diaspora. Toronto:
University of Toronto Press, 2001:13-14.
35. Vlahov D, Galea S, Ahern J, et al. Consump-
tion of cigarettes, alcohol, and marijuana
among New York City residents six months
after the September 11 terrorist attacks. Am
J Drug Alcohol Ab. 2004;30:385-407.
36. op den Velde W, Aarts PGH, Falger PRJ, et
al. Alcohol use, cigarette consumption and
chronic post-traumatic stress disorder.
Alcohol Alcoholism. 2002;37:355-61.
37. Rebhun LA. Substance use among
immigrants to the United States. In: Loue
S, ed. Handbook of Immigrant Health.
New York: Plenum Press, 1998:493-519.
38. Hyman I, Dussault G. Negative consequences
of acculturation: Low birthweight in a
population of pregnant immigrant women.
Can J Public Health. 2000;91:357-61.
39. Adrian M, Lundy C, Eliany M, eds.
Women’s use of alcohol, tobacco and other
drugs in Canada. Toronto: Addiction
Research Foundation, 1996.
40. Horne T. Women and Tobacco. A Frame-
work for Action. Ottawa: Health Canada,
1995.
41. Gomberg ESL and Nirenberg TD.
Antecedents and Consequences. In
Gomberg ESL and Nirenberg TD eds.
Women and Substance Abuse. New Jersey:
Ablex Publishing Corporation, 1993.
42. Oxman-Martinez J, Abdool SN and
Loiselle-Leonard M. Immigration, women
and health in Canada. Can J Public Health.
2000; 91:394-395.
43. Vissandjee B, Weinfeld M, Dupéré S, et al.
Sex, gender, ethnicity and access to health
care services: Research and policy chal-
lenges for immigrant women in Canada.
JIMI. 2001;2(1).

128 Chronic Diseases in CanadaVol 28, No 4, 2008
DE Clarke, PhD (1-4); A Colantonio, PhD (3-6); AE Rhodes, PhD (2,3,7-9); M Escobar, PhD (3)
Abstract
The current study provides a critical review of Canadian studies on ethnicity and mental health with respect to the definition, conceptualization and operationalization of ethnicity. It provides a discussion on the methodological issues related to these factors and their implications to guide future research and enable comparability of results across studies. Sociological Abstracts, PsycINFO, MEDLINE and CINAHL were used to identify relevant Canadian articles published between January 1980 and December 2004. The review highlights a number of key issues for future researchers to consider such as the need for: 1) clear rationales as to why ethnicity is important to their outcome of interest; 2) clarity on the definition of ethnicity, which affects its conceptualization and operationalization; 3) a theoretically driven conceptualization of ethnicity, which should be related to the research question of interest; and 4) clear rationales for the decisions made regarding the data source used, the operationalization of ethnicity, and the ethnic categories included in their studies.
Key words: ethnicity, ethnic origin, culture, race, mental health
Author References
1 Department of Mental Health, Johns Hopkins Bloomberg School of Public Health, Baltimore, Maryland2 Department of Psychiatry, University of Toronto, Toronto, Ontario3 Graduate Department of Public Health Sciences, University of Toronto4 Toronto Rehabilitation Institute, Toronto, Ontario5 Department of Occupational Science and Occupational Therapy, University of Toronto6 Department of Rehabilitation Sciences, University of Toronto7 Suicide Studies Unit, St. Michael’s Hospital, Toronto, Ontario 8 Inner City Health Research Units, St. Michael’s Hospital9 Institute for Clinical Evaluative Sciences, Sunnybrook & Women’s College Hospital, Toronto, OntarioCorrespondence: Diana E Clarke, Department of Mental Health, Johns Hopkins Bloomberg School of Public Health, Room 802, 624 N Broadway, Baltimore, MD 21205, Tel : (410) 955-0416, Email: [email protected]
Introduction
Canada’s immigrant population originates from all over the globe with increasing numbers from Africa, Asia, the Caribbean, and the Middle East (i.e. visible minori-ties).1 Its culturally diverse Aboriginal population adds to the ethnic mix.2 Canada prides itself on being a multicultural society by acknowledging the right of every person to identify with his/her cultural background while partaking in the Canadian way of life.3-6 This was advocated in its 1971 legislated policy on multiculturalism, which emphasized fair treatment of everyone, regardless of race, colour or ethnicity; particularly in terms of educational and occupational opportunities.3-6 Evidence of
relevance. Much of the existing studies in this area were conducted in the United States (US)10-15 and the United Kingdom (UK),16-19 which has uncertain applicability to Canada. The political, social and economic ramifications associated with ethnicity or ethnic identity, likely differ from country to country. Differences in the countries’ ethnic compositions, his-tories of immigration policies and racism/slavery and ethnic or racial categorizations hinder cross-country comparisons. The history of slavery and segregation has a great deal of meaning for ethno-racial groupings in the US.2 Furthermore, the US is seen as a society that assimilates immi-grants by the “melting pot” phenomenon, in which the immigrants are expected to adapt to the American way of life rather than retaining their culture.3 Canada has not had the same history of racial segregation and is viewed as a mosaic in which immigrants are encouraged to retain their unique cultural background while partaking in the greater Canadian society.3,6,20 Also, Latin Americans com-prise a larger component of the US immigrant population than Canada’s.2,3
The time of arrival and ethnic composition of the immigrant population in the UK and Canada also differ. Up to 1962, citizens of previously colonized countries such as Jamaica and India (countries that remained within the Commonwealth) were granted open access and actively recruited for
Ethnicity and mental health: Conceptualization, defi nition and operationalization of ethnicity from a Canadian context
systemic inequalities, including access to educational and employment opportunities, housing, health and mental health care, are still evident across ethnic groups,7,8 which can impact the mental health of the popula-tion.2,9 For instance, Aboriginal peoples con-tinue to have poorer mental health compared to the general population and, along with visible minorities, have ongoing difficulties accessing culturally sensitive mental health care.9 Better understanding of the relationship between ethnicity and mental health is compelling and highly relevant for policy-makers and mental health practitioners in the Canadian context.
Canadian literature on ethnicity and mental health is quite limited despite its

Vol 28, No 4, 2008Chronic Diseases in Canada 129
immigration to the UK.21 During this time, Canada’s immigrant population came primarily from Europe, the UK and the US.22,23 Post-1971, when the UK changed its immigration act, the majority of its immigrant population originated from Europe and South Africa,21 while the majority of Canada’s immigrants came from Asia, Africa, the Caribbean, Latin America and the Middle East.23-26 These points indicate that results based on UK and/or US data might not be applicable to Canada.
With respect to the operationalization of ethnicity, variations exist across the literature on ethnicity and mental health. Lack of a clear definition of ethnicity and ongoing debate regarding how the variable should be conceptualized might account for this.27,28 Other factors such as data source used, feasibility, time period of data collection, region of study and sample size also affect the operationalization of the variable. To date, there is no seminal Canadian paper that discusses the metho-dological issues related to the definition, conceptualization and operationalization of ethnicity and their implications, to guide future research and to enable comparability across studies. This paper provides a critical review of the original empirical Canadian studies on ethnicity and mental health with emphasis on these issues. A general overview of the definition and conceptualization of ethnicity is first pro-vided to guide the review process. Quantitative studies involving population-based data with more than one ethnic group are highlighted.
Methods
The bibliographic databases Sociological Abstracts, PsycINFO, MEDLINE and CINAHL were used to identify relevant original empirical studies that were quantitative in nature for this review with the application of Group 1 and 2 search terms outlined in Figure 1. Studies were included if they: 1) concerned ethnicity and mental health; 2) involved data on
Canadians; 3) involved more than one ethnic group; 4) were published between January 1980 and December 2004; and 5) were quantitative in nature.
General review articles and chapters on the theories and definition of ethnicity, not specific to Canada, were used to provide an overview on the definition and conceptua-lization of ethnicity. As well, they guided the critique of the identified studies on ethnicity and mental health reviewed herein. Articles on ethnicity and immigration policies specific to Canada were used to provide historical context to facilitate understanding of the ethnic composition of the Canadian population over time and its impact on the studies reviewed.
Results
After all duplicates were removed, 49 empirical quantitative studies that involved two or more ethnic groups were identified and included in this review (Figure 1) and summarized in Appendix 1. Twenty-seven studies2,5,29-53 were based on population or community surveys with secondary data analysis, 12 were smaller studies using non-clinical samples54-65 and 10 were smaller studies based on clinical/specialized samples.66-75 The year and region of publication, sample size, ethnic groups included and critique regarding the definition of ethnicity are outlined in Appendix 1.
Discussion
1. Definition
The lack of consensus on the definition of ethnicity20,76-80 was reflected in the 49 included Canadian studies on ethnicity and mental health,2,5,29-75 which failed to explicitly define the variable. There are two major perspectives on how ethnicity emerges: the primordialist and constructivist views.20,76,81 Traditional primordialists view ethnicity as “an ascribed status, given at birth, that is more or less fixed and
permanent.”20,76,81-85 Accordingly, the indivi-dual’s identity includes the biological, cultural, political and economic conditions of the group into which s/he is born, be it dominant over, or dominated by, other groups.20,78,81,84 A softer primordialist view stresses the social and non-biological basis of ethnicity, acknowledging that ethnic identity can also be socially constructed and based on “the circumstances at hand” thereby being “situational not biological” and “flexible not fixed.”81 The constructivists view ethnicity as “a social construction with ecological and social factors being its key determinants.”12,24-26 Kaufman85stated that distinction between the two perspectives is artificial, so the definition of ethnicity should include a synthesis of both. Hence, the underlying theme is that ethnicity involves sharing of a common culture, which may be based on a combination of factors such as language, religion, national identity, customs, social and/or political position within a country’s social system.81
2. Conceptualization
There are two major perspectives on how ethnicity is conceptualized: 1) ethnic identity which refers to self-identification with particular cultural group/s,20,76,80,81 or 2) ethnic origin which refers to classification due to the ethnic or cultural groups to which the individual’s ancestors belong.20 Specific cultural traits such as language, surnames, or region of birth were used as proxies for ethnic origin in some studies.
From a Canadian perspective, the country’s policy on multiculturalism, which has guided government policies since 1971 and advocated for individuals to retain their ethno-cultural background,8 dictates that ethnicity comprised “ethno-cultural parti-cularism” and adherence to Canadian “values.”76 This is reflected in the con-ceptualization of ethnicity across national surveys, which forces participants to identify with their ancestral background regardless of time in Canada. As well, this policy accounts for the designation of all non-Aboriginal persons who originate

130 Chronic Diseases in CanadaVol 28, No 4, 2008
FIG
UR
E 1
Res
ult
s o
f th
e se
arch
str
ateg
ies
use
d a
cro
ss b
iblio
grap
hic
dat
abas
es to
iden
tify
Can
adia
n li
tera
ture
on
eth
nic
ity
and
men
tal h
ealt
h

Vol 28, No 4, 2008Chronic Diseases in Canada 131
from Africa, Asia, the Caribbean, Latin America and the Middle East, “who are non-Caucasian in race or non-white in colour” as visible minorities.1,3,6
Conceptualization based on Ethnic Identity
Ethnic identity can be internal or external.20,78 Internal ethnic identity refers to the individual’s self-identification with specific ethnic group/s.78,86,87 This conceptualization reflects the individual’s level of adherence to and identification with the values, customs and ideologies of a particular culture,87 which can be internally or externally driven.78,86-89 Individuals may choose to identify with particular ethnic group/s because of their belief in the customs, norms and ideologies and the meaning such identification gives to their life (i.e. internally driven). However, circumstances in the individuals’ external environments, such as discrimination based on ethnicity and the feeling of being different from the ethnic majority, may cause some to self-identify with particular ethnic groups because of the sense of solidarity and belonging they may garner from such groups (i.e. externally driven).78,80,87
Since external ethnic identity relates to categorization by others based on the person’s nationality or ethnic origin and does not reflect the individual’s adherence to and/or identification with specific culture/s,15 it is discussed in the context of ethnic origin in the ensuing section. Such external assignment of ethnicities to individuals by the dominant society might conflict with their subscription and adherence to particular ethnic groups and is potentially distressing. This was illustrated by Mahtani6 in her interview with Canadian-born visible minority mixed-racial women who often feel forced by the ethnic majority to identify their ancestral background when asked about their ethnic identity (i.e. by the question, “but where are you from?”).
A major weakness with self-identification of ethnicity is that it is based on the individual’s perception, which may change from situation to situation and over time and likely produce different results depending on the time and research question being investigated.27,28 This possibly accounted for the lack of conceptualization of ethnicity based on ethnic identity across studies, with the exception of the respective studies of De Wit et al.,40 De Wit and Beneteau,41,42 and Feldman et al.43 De Wit et al.40-42 conducted secondary data analysis on the 1990 Ontario Health Survey in which respondents were asked to select up to four ethnic categories that matched their “ethnic or cultural identity.” De Wit and Beneteau41,42 further utilized information on the primary language that respondents used at home to help “better identify ethnic groups.” If respondents identified French or French-plus other ethnic groups but did not select French as their primary language they were reclassified as Anglophones41,42 indicating externally driven classification of ethnic identity. This externally driven classification of ethnic identity might have been in conflict with the individual’s true ethnic identity. If level of adherence to particular cultural values, customs and ideologies are important in the individual’s perception of, and subsequent likelihood to acknowledge, discuss or report a mental health condition, and this is a key issue being investigated, then the use of ethnic identity would provide more appropriate information. Feldman et al.43 used the item, “Please write down the term that best describes the ethnic character of your everyday home environment,” which implies an ethnic identity conceptualization of the variable.
Conceptualization based on Ethnic Origin
Ethnic origin refers to categorization of individuals into ethnic group/s based on ancestral origins.78 The question “To which ethnic or cultural group/s do your ancestors
belong?” has been used to capture ethnic origin.90,91,84,95 This method of conceptualiza-tion is reportedly more objective and produces well-defined ethnic groups that are representative of the population, but fails to capture level of adherence with cultural ideologies or customs.27,92,93
Conceptualization of ethnicity based on ethnic origin was observed in some Canadian studies on ethnicity and mental health, particularly those that used national or regional survey data,2,5,31,32,35,46-48,52 including the National Population Health Survey (NPHS),90 Canadian Community Health Survey (CCHS),91 National Longitudinal Survey of Children and Youth (NLSCY),94 National Survey of Giving, Volunteering and Participating (NSGVP)95 and the 1971 Aging in Manitoba (AIM) survey.31 Each survey inquired about the ethnic or cultural group/s of the individuals’ ancestors and provided a list of ethnic categories to enable multiple choices.90,91,94,95 This acknowledged the existence of multi-ethnic groups, which are typical of Canada,8 and improved the reliability of the groups identified.27 Reflective of the emphasis of the country’s multiculturalism policy, survey respondents who identified themselves as “Canadian” were required to select their ancestral origin even if they were Canadian-born.
Specifi c Cultural Traits as Proxies for Ethnic Origin
One might assume that studies utilizing data from surveys in which ethnicity was based on ethnic origin would conceptualize ethnicity accordingly; however, this was not the case. Ali5 and Ma47 used country of birth in thinking about ethnicity despite utilization of the CCHS91 and the NLSCY94 data respectively, both with specific ethnicity questions. The rationale for using country of birth rather than responses to the ethnicity questions was not provided but likely due to the use of public-use data. Public-use versions of Canadian national surveys are readily available to researchers

132 Chronic Diseases in CanadaVol 28, No 4, 2008
but are stripped of unique identifying information and lack the detailed informa-tion on ethnicity and culture available in the restricted-use versions.
Penning32 utilized the Social Change in Canada Survey (SCCS) data, in which country of birth was used to determine ethnicity. Ascertainment of ethnicity based on country of birth in the study pinpoints an inherent limitation with conducting secondary data analyses where one has to make do with whatever variables are available. With this in mind, it is still important to mention that with increasing global industrialization and migration it has become inappropriate to use country/region of birth as the sole indicator of ethnicity. Individuals might have been born in one country to parents from another country, spent only a few years in that country and returned with their parents to the countries of their ancestral background thus choosing to identify with their ancestral culture. Therefore, country/region of birth, also utilized by Ali,5 Barnes et al.,35 Ma,47 Cohen and MacLean,51 Rousseau et al.53,61 and Aubert et al.,65 would inaccurately classify such indivi-duals. Most countries are comprised of many ethnic groups and most ethnic groups can be found to have many different countries of birth. Country of birth as a proxy for ethnic origins fails to capture such complexities and likely misclassifies some people. This does not negate the use of country/region of birth as a proxy for ethnicity but it underlines the need for detailed discussions of the inherent limita-tions of its use and implications for the interpretation of subsequent results.
Language and surname were proxies for ethnic origin in some studies37,54-59 but are susceptible to misclassification of some individuals. The utilization of surnames to identify ethnic groups by Dion and Giordano57 in their investigation of ethnic difference in depression in university students in Toronto, failed to correctly classify non-white/non-Caucasian indivi-duals with non-ethnic last names. If specific ethnic groups were more likely to have individuals with non-ethnic sur-names, for example Blacks from the Caribbean and South Asians of Christian
descent,57 and these individuals were more or less likely to have depression, their exclusion would have biased the results obtained. Bagley58 also used surnames and language, but in combination with an unspecified “ethnicity” question to con-ceptualize ethnicity. Surnames were initially used to identify Chinese elderly persons living in Calgary, Alberta, with follow-up phone calls by the study recruiters who identified eligible Cantonese-speaking individuals and inquired about their ethnicity. This combination of factors overcame the shortcomings of using surnames alone.
Walter37 and Dion59 used language as a proxy for ethnicity, which might have accurately classified some ethnic groups but not others (e.g. Chinese for individuals who specified Chinese dialect). The English-speaking population is ethnically heterogeneous, with English being the primary language for many countries, so treating the group as homogenous is erroneous.59 Also, although French and Spanish are primary languages for France and Spain respectively, they are also the primary languages for some countries in the Caribbean and Africa. The assumption that all individuals who endorsed these languages are of European descent would be inaccurate.59 Different ethnic groups may speak the same language or there may be language differences within ethnic groups, which would not be captured with language as the sole proxy for ethnic origin.
Ethnicity, Race or Ethnicity plus Race
In examining the studies by Weekes, et al.71 and Cohen and McLean,51 respectively, it became apparent that categorization was based on race, despite the use of the term “ethnicity”. Also, the researchers51,71 implied that race and culture were the same concepts despite numerous theoreti-cal articles indicating otherwise.28,76-79,85-99 To illustrate, Cohen and McLean51 utilized data from the 1999 General Social Survey (GSS) in which respondents were asked about their “cultural or racial back-grounds”96 and Weekes and colleagues71 expressed interest in examining the “cultural sensitivity” of their outcome
scale. Ethnicity refers to mutual cultural characteristics such as religion, language, customs, and ancestry,20,76,78 but race refers to common physical characteristics.28,65,78,86-
101 Winker,28 Williams77 and LaVeist97 stressed the importance of differentiating race from ethnicity or culture. Race is a poor proxy for ethnicity despite overlapping features28,97 and is questionable as its sole indicator in respective studies by Fry and Grover54 and Devins et al.74
Wu et al.2 used ethnic origin and racial background to create ethno-racial groups. This enabled the identification of visible minority groups2 and acknowledged the argument that power and status differences also exist across racial groups.77 This is important since “the dominant or minority status of the group mirrors its position within the stratification system of the larger society,”101 which in turn affects access to social, political, and economic resources.3,4,101 The authors2 explained that their ethno-racial groups reflected the social stratification of the Canadian society (i.e. the vertical mosaic),2-4,7,8 which provided a context that facilitated inter-pretation of results obtained. The vertical mosaic refers to the hypothesis that ethnic groups are differentially integrated in the larger Canadian society based on histories of immigration policies that were linked to changing industrial and employment demands over time.2-4,7,8 This differential integration into the Canadian society affected the groups’ socioeconomic status,2-4 which is significantly associated with mental health outcomes.
Summary
The identified studies appeared to have conceptualized ethnicity on the basis of ethnic origin by using ethnicity questions, cultural traits as proxies for ethnic origin, or a combination of ethnic origin and racial background. For some studies, although the term “ethnicity” was used it was unclear how it was conceptualized and as- certained.30,33,34,54,55,70,75 The intrinsic weak-nesses of using proxy measures such as country of birth, language or surnames underline the need for ethnicity to be ascertained using rigorously tested and validated questions. Questions aimed at

Vol 28, No 4, 2008Chronic Diseases in Canada 133
capturing ethnic identity or ethnic origin are unable to tell which aspect of ethnicity the individual brings forward in response during an interview and whether this might be affected by the interviewer and/or by the specific question being asked.76 This highlights the need for clear and theoretically driven rationales for studying ethnicity across mental health outcomes.
3. Operationalization
The operationalization of ethnicity is important for interpretation of study results and enabling cross-study compari-son. However, variations existed in the operationalization of ethnicity across studies. Even studies that utilized the same data sources and conceptualized ethnicity similarly operationalized the variable differently. Factors that influenced this included diversity of the study population, time period and region of data collection, sample size restrictions and purpose of the study. The effects of these issues are discussed in the ensuing sections.
Time Period of Data Collection and Study
Time period of data collection and study influenced the operationalization of ethnicity across studies. Time period of data collection is related to changes in the immigration policy over time, which were influenced by economic changes that dictated labour shortages and the need for immigrants to fill specific employment opportunities.20,102 Canada’s earlier immigration policy was based on national origin and gave preference to immigrants from Britain, Europe and the US to fill such occupational demands.22,25,103-105 Hence, immigrants from these regions represented approximately 95% of Canada’s immigrant population up to 198622,25 and studies using data collected at this time had little or no representation of other ethnic groups.29,31,32,35,66,67
The 1967 change to a universal point system was the force behind the increased ethnic diversity of the Canadian population, with European immigrants comprising
57% of immigrants in 1970 but only 20% in 1996.22,105 Changes in the ethnic composition of the immigrant population occurred gradually with small numbers from Africa, Asia, the Caribbean, Latin America, and the Middle East initially before their proportions increased significantly over time.22,24,25,102,105,106 This was reflected in the 3 to 5% representation of these immigrants in Canada up to the 1980s compared to their 73% representation between 1996 and 2001.107 Variations in the proportions of these immigrant groups relative to each other and to immigrants from Britain, the US and Europe were reflected in studies conducted with ethnicity data collected over the years. Earlier studies had little or no visible minority groups29,31,35,66,67 but their numbers increased in later studies.2,5,35,38,43,46-49,53,61-63 Whether these groups were kept as separate categories depended on the outcome of interest and the nature of the study (i.e. secondary data analysis using public-use data that lacked detailed ethnicity information). In the investigation of rare outcomes, such as some mental health conditions, small sample sizes for specific visible minority ethnic groups resulted in them being collapsed into a single category, which likely failed to capture the individuals’ perception of their ethnic identity. This also limited the interpretation of the results of such studies.
Region of Data Collection and Study
Variations in settlement patterns of different ethnic groups in Canada resulted in different ethnic compositions across geographic regions. This affected the operationalization of ethnicity as it relates to the region of data collection and study. Settlement patterns of immigrant groups have always been related to the location of employment opportunities, which were dictated by economic changes over time.78,102 Earlier immigrants from Britain, Europe and the US106 came to Canada in response to the rapid expansion of the Canadian West with integration of the region with the domestic and world markets and international demand for wheat.78 Therefore, many earlier immigrants settled in rural areas of Western
Canada to fill the demands for laborers and farmers.66,102 Studies conducted in Western Canada (e.g. Manitoba,31,35,70 Alberta66 and the Northwest Territories67) were likely to have significant representation of British, European, North American and Aboriginal ethnic groups but almost no representation of visible minority groups.
Later immigrants from Asia, Africa, the Caribbean, Latin America and the Middle East were more likely to settle in Montreal, Toronto and Vancouver102,108 because of their perception of better employment opportunities that corresponded to their skills and educational background.102 Supportive data showed that only 58% of recent immigrants settled in these areas in 1981 but the percentage rose to 78% by 2001.102 Recent studies based on data that includes these three regions had varying proportions of visible minority ethnicities.2,5,32,43,44,46-51,53-55,57-63,65,72,74,75 Reliance on public-use data prevented examination of very specific ethnic categories because of the inaccessibility of such detailed information.
The Purpose of the Research Study
As seen in the respective studies of Barnes et al.,35 Lavallee and Bourgault, 45 Seltzer and Langford,67 and others,29,30,34,37,50,51,58,61,64
,66,69,70,73,75 there is flexibility in whether broad or specific categories are used when operationalizing ethnicity in descriptive or enumerative studies as long as they reflect the ethnic composition of the population under investigation.20 However, the use of specific ethnic categories is more informative.20 For analytic studies, opera-tionalization of ethnicity needs to be theoretically driven to provide a framework for the analyses and interpretation of the results.20 Operationalization of ethnicity in the analytic studies reviewed in this paper2,5,31,32,36-43,45-49,52,58,59,75 appeared to be based on the social stratification system in Canada, though not always explicitly stated.
Studies interested in examining the mental health status or outcome in specific ethnic groups tended to be clear in their selection and ascertainment of those groups but often aggregated all other ethnic
134 Chronic Diseases in CanadaVol 28, No 4, 2008
groups.30,31,33,34,36,38-42,44,45,51,54,61,67-71 For example, Fry and Grover54 were interested in examining mental health outcomes in Asians compared to Caucasians and therefore only included these groups. Liban and Smart,30 Tonkin,34 Beiser et al.,39 Borzecki et al.,68 Tcheng-Laroche and Prince33 and Dewit and Beneteau,35,42 in their studies, were mainly interested in the mental health of Native Indians30,34,39,68 and Francophones33,41,42 respectively and therefore selected these groups specifically while aggregating all other ethnicities in the comparison groups.
Havens and Chappell, in investigating the effects of age, sex and ethnicity on mental health in Manitoba, included North American, British, French, Polish/Russian/Ukrainian and ‘Other European’ ethnic groups.31 These groups were reflective of the time period and region of study. North Americans, British and French were among the earlier immigrants admitted to Canada to fill occupational demands based on the country’s immigration policy at that time. The ‘Other European’ group, which included immigrants from Germany, Norway, Denmark, Sweden, Iceland, the Netherlands and Belgium,31 was granted entry into Canada over the Polish/Russian/Ukrainian when the demand for more immigrants arose.22,106 After World War II and prior to the change to the universal points system immigration policy, immigrants from Poland, Russia, the Ukraine and other Eastern European countries were admitted to Canada to help survivors of the Nazi Holocaust and to fill specific occupational roles.22,106 Therefore, the ethnic groups included in the study31 were incorporated into the social hierarchy of Canada at different levels and different points in time, emphasizing the segregation of the Canadian society along ethnic lines.22,104 Aboriginal peoples also contri-buted to the ethnic diversity of Manitoba’s population, specifically its rural regions,109 but were excluded from the study to “reduce cultural bias”.31 This statement implied that cultural aspects of ethnicity were important in mental health functioning and needed to be kept constant
across groups. It further implied that either the ethnic categories included in the study were culturally similar to each other yet different from Aboriginal peoples or that the individual ethnic groups that comprised each broader ethnic category were culturally similar but the individual ethnic groups that comprised the broader Aboriginal category were too culturally dissimilar to be combined.
Penning32 included similar ethnic groups as Havens and Chappell31 in examining the same hypothesis with psychosocial well-being as the outcome and using a nationally representative sample of Canadians aged 30 and over. The groups also mirrored the social stratification of the Canadian society. Havens and Chappell,31 but not Penning,32 found ethnic differences in mental health functioning with a “triple jeopardy” effect of age, sex and ethnicity. Methodological issues related to differences in the definition and ascertainment of the mental health outcomes, the conceptualization (e.g. use of country of birth32 versus a specific ethnicity question31) and operationalization of ethnicity, the ethnic and age composition of the study populations, and the regions of study likely played a role in the discrepancy observed.
Since Penning32 used country of birth to ascertain ethnicity and mentioned no excluded ethnic groups, it is assumed that Aboriginal peoples and any Canadian-born visible minority individuals, though minimal, were included into the Canadian group. This would make the Canadian group heterogeneous and different from those included in the North American group in Havens and Chappell.31 Also, since Penning32 utilized data from a national survey, the ethnic category ‘Other’ probably comprised participants who were members of Canada’s visible minority groups whereas these groups were excluded by Haven and Chappell31 because of small sample size. Penning,32 separated Canadians and Americans while combining immigrants from France, Germany, Norway, Denmark, Sweden, Iceland, the Netherlands and Belgium into a Northern
European group. These factors affected the ability to compare the results of the two studies.
Understanding the mental health of Canada’s immigrant population in terms of depression and alcohol dependency was the aim of the study by Ali.5 Ethnic differences were examined as a secondary objective in the immigrant group only.5 Using region of birth, the ethnic groups examined (i.e. US/Mexico, South and Central America and the Caribbean, Europe, Africa and Asia) mirrored the variation in time of entry into Canada by the different immigrant groups and their differential incorporation in the social hierarchy of the country. This provided a framework for analyses and interpretation of the results. Disaggregation of only the immigrant group based on ethnicity implied that either the investigation of ethnic variation in mental health was only important for immigrant groups and not Canadian-born or all Canadian-born individuals had similar experiences that potentially affected their mental health. Since the Canadian-born group probably had many first generation Canadians who likely had similar experiences as their immigrant parents, these assumptions were likely inaccurate. Given the report of poor mental health in Canada’s Aboriginal population,8 combining them into the Canadian-born group might not be appropriate. The use of region of birth has numerous drawbacks that could have potentially biased the results obtained but was likely used because of the lack of ethnicity-related information in the public-use version of the CCHS Cycle 1.1 dataset, which is assumed to be the data source used by Ali.5
In examining behavioural and emotional problems in immigrant versus non-immigrant children in Canada, Ma47 considered ethnicity relevant but only for the immigrant group. Immigrant children were disaggregated into ethnic groups based on region of birth, including those from the US, Europe, Asia and other regions47 possibly due to the use of the
Vol 28, No 4, 2008Chronic Diseases in Canada 135
public-use version of the NLSCY.94 These ethnic categories differed from Ali5 despite the same method of conceptualizing ethnicity. The studies tested different hypotheses, and were interested in different populations and different outcomes, which affected the ability to compare results across studies.
Beiser et al.46 utilized NLSCY94 data to examine familial poverty and emotional and behavioural problems in immigrant children versus Canadian-born and included ethnicity as a control variable. Unlike Ma,47 ethnicity was examined in the entire sample46 thereby eliminating the ambiguities observed in interpreting the results of the former studies. Although the study utilized a data source in which various ethnic categories were available, ethnicity was operationalized by using four broad categories including White/European, Asian, Black and Other.46 This implied an interest in, or expectation of, an effect based on visible minority status. The NLSCY included Aboriginal peoples living off-reserves,94 and since there was no explicit indication of their exclusion, it is assumed that they were either combined in the ‘Other’ category or included in the ‘White/European’ category. The appropriateness of the inclusion of Aboriginal children into either category is questionable given major cultural and social differences.
The NSGVP95 was utilized by Mata48 to investigate satisfaction with life in Canada across ethnic groups and to test the hypothesis that any variations could be explained by ethnic differences in socioeconomic status (SES). Nineteen mutually exclusive ethnic categories were derived for the study with sample size limitations being integral in the collapsing of different ethnic groups into broader categories (e.g. ‘Black’, ‘South Asian’, ‘Italian’ and ‘Portuguese’ ethnic groups collapsed into ‘Black/South Asian’ and ‘Italian/Portuguese’).48 The distinction between certain other ethnic categories was unclear. For instance, the categories ‘European’, ‘Italian/Portuguese’, ‘German’, ‘French’ ‘Ukrainian’, ‘Polish’, etc., all of definite European origin were used without the provision of a clear rationale. This combination of specific and broad ethnic
categories without rationale limited the interpretation and comparability of the results. It would have been beneficial if the ethnic categories were guided by a theoretical framework so as to provide more meaning to the results and decrease the observed ambiguity.20
Wu et al.2 tested the hypothesis that ethnic differences in depression could be explained by variations in SES and access to social support resources (1996 NPHS90 data). The included ‘ethno-racial’ groups were ‘East/Southeast Asian’, ‘Chinese’, ‘South Asian’, ‘Aboriginal’, ‘Black’, ‘Arabic/West Asian’, ‘Latin American’, ‘Jewish’, ‘French’, ‘English’, ‘Other Whites’, and ‘mixed racial’, were “representative of the social stratification of the Canadian society” and reflected differences in SES and access to social support resources.2 The partial disaggregation of the Asian group into ‘East/Southeast Asian’ and ‘Chinese’ was likely due to the overwhelming presence of ‘Chinese’ (approximately 56%) in the group, which would have obscured the interpretation of any association with depression. A clear rationale for this partial disaggregation was not provided but left to the readers to assume. Lack of sufficient sample size prevented the disaggregation of other ethnic groups including Blacks and South Asians.2
Wang and El-Guebaly52 used a ‘White’ versus ‘non-White’ dichotomy in operationalizing ethnicity despite the utilization of the 1996 NPHS90 data. This was likely due to the use of the public-use version of the survey data, though not explicitly stated. This dichotomy, although handy in separating visible minorities from the ethnic majority, has been criticized for its inadequacy in giving a clear view of ethnic differences in mental health.2,27,104 Refinement is needed to account for cultural and/or ecological differences within such broad ethnic groups,104 which might include cultural biases in reporting mental health issues. Although the specific ethnicities within the broad ‘non-White’ group are distinct from each other in languages, histories, customs and social mobility,2 discrimination in educational and occupational opportunities based on visible minority status2,22,103,109 lends some
support to combining the groups into this category. The use of such a broad ethnic category is appropriate if the researchers were asserting that it is the common experience of being ‘non-White’ that impacts mental health above and beyond the effect of cultural differences in individuals’ perceptions of, and attitudes towards, mental health problems, but this was not stated.98
Dion and Giordano included ‘Anglo-Celtics’, ‘North European’, ‘South European’, ‘East European’, ‘East Asian’, and ‘South Asian’ in their study.57 These ethnic groups were said to parallel the ethnic composition of the University of Toronto population in 198857 and reflected variations in immigration experiences, entrance status and adaptation to life in Canada with respect to parental conflicts, and the likelihood to perceive economic discrimination.57 According to the study, ‘South Asians’ and ‘Southern Europeans’ were more likely to suffer depression than the ‘Anglo-Celtics’ and ‘Northern Europeans’ because of higher likelihood of parental conflict and perceived economic discrimination.57 Surnames were used to ascertain ethnicity,57 which likely misclassified ‘Blacks’ and ‘South Asians’ of Christian background. Since ‘South Asian’ was an ethnic group of interest in the study,57 this misclassification would have likely affected the results obtained by diluting the measure of effect and affected the generalizability of the results to all ‘South Asians’ in Toronto. The researchers57 explained that since an earlier study including 300 students at the same university found less than 3% indicating West Indian heritage, the potential misclassification by surnames created little or no bias to their results. This inaccurately implied that among ‘South Asians’ only those of West Indian heritage had non-ethnic last names. India’s Christian population accounted for about 2.3% of its total population according to its 1991 and 2001 censuses.110
Summary
In summary, the operationalization of ethnicity in the existing Canadian studies differed depending on how the variable

136 Chronic Diseases in CanadaVol 28, No 4, 2008
was conceptualized, on which data sources were used, on time period and region of data collection, the purpose of the study, and whether the study involved secondary data analysis using public-use versions of national surveys. Some studies tried to disaggregate ethnic categories but were faced with sample size limitations that led to collapsing of distinct ethnic groups while keeping others disaggregated, with no clear rationale. Sample size limitations were found across national survey datasets, particularly for the visible minority ethnic groups, thus underlining the need for future population surveys aimed at providing information on the health and/or mental health of the Canadian population to over-sample these groups. This would enable the examination of mental health differences across visible minority groups, which is important for the planning of mental health programs to serve Canada’s ethnically diverse population.
Conclusions
This critique of the definition, conceptualization and operationalization of ethnicity across Canadian studies on ethnicity and mental health uncovered a number of key issues that are highlighted below.
a) Ethnicity is a complex and abstract term for which a single and generally accepted definition has not been derived. However, the underlying theme is that it involves the sharing of a common culture. Across studies, ethnicity was not defined a priori, which was likely due to lack of consensus on its definition. Therefore, as suggested by reviewers from the US28,77,79 and UK,27,92,93 clear rationales as to why ethnicity is important to the outcome of interest are necessary.
b) Examination of the relationship between ethnicity and mental health needs to be encouraged with better infrastructure involving improved funding opportuni-
ties, given the relevance to the Canadian context. Secondary data analysis is valuable in such research efforts. Therefore, making detailed information on ethnicity more readily available to researchers while maintaining survey participants’ confidentiality is vital.
c) Some researchers seemed to have utilized public-use versions of survey data, which hindered their ability to disaggregate ethnic groups due to lack of such detailed information in these files. Their use need to be stated explicitly and their inherent limitations discussed.
d) Ethnicity can be conceptualized based on ethnic origin, ethnic identity, or a combination of ethnic origin and race. Each method has strengths and weak-ness. Its conceptualization should be theoretically driven and related to the research question of interest. The identified studies conceptualized ethnicity based on ethnic origin, whether through the use of a specific questions or proxy measures such as language, surname or country of birth. Countries of birth, language and surnames are prone to misclassification of certain ethnic groups and biased results if rate of misclassification differed across outcome groups. This does not negate their use as proxies for ethnicity; however, there is a need for researchers to clearly outline their inherent limitations and the implications for the results obtained.
e) Ethnicity based on ethnic origin can be more stable if participants are given a list of ethnic categories with the option of choosing multiple categories.27,93 This list should be based on preliminary fieldwork to identify common ethnic categories. An open-ended ‘other’ option should be included so as not to restrict the individuals’ choices. The list should be appended to the research results or made available upon request to enable study replication and to enable readers
to ascertain the representativeness of the ethnic categories to the general population.
f) Operationalization of ethnicity varied from very broad to very specific ethnic categories even if ethnicity was con-ceptualized similarly or the same data source was used. These variations were related to the lack of a clear definition of ethnicity, differences in the time period, region of study and data collection, the purpose of the studies and the utilization of public-use data. Researchers are encouraged to provide a clear outline of the decisions made regarding the data source used (parti-cularly in secondary data analysis), the operationalization of ethnicity, and the categories included in their studies. This will facilitate the interpretation of the results and attempts to replicate the research findings.
g) Differences in the outcomes of interest, how such outcomes were measured and variability in the relevant variables controlled for were additional factors that affected the ability to compare results across studies. Therefore, researchers should clearly define their outcomes of interest and summarize the strengths and weaknesses of the measures used to ascertain outcomes and other relevant variables.
Acknowledgements
Diana E. Clarke is a Research Associate in the Department of Mental Health at Johns Hopkins Bloomberg School of Public Health and Fellow in Population Health Studies in the Department of Psychiatry at University of Toronto. Dr. Clarke is supported by a Canadian Institute for Health Research Post-doctoral Fellowship Award (Grant # 200602MFE-159564-115967), the Toronto Rehabilitation Institute Foundation and in part by the Population Health Fellowship Award from the Department of Psychiatry at the
Vol 28, No 4, 2008Chronic Diseases in Canada 137
University of Toronto. This study was funded in part by the Ministry of Health and Long-term Care and the Ontario Mental Health Foundation.
References
1. Statistics Canada. 2001 Census Visible
Minority and Population Group User Guide.
URL: http://www12.statcan.ca/english/
census01/Products/Reference/tech_rep/
vismin.cfm.
2. Wu Z, Noh S, Kaspar V, Schimmele CM.
Race, Ethnicity, and Depression in
Canadian Society. J Health Social Behav.
2003;44:426-441.
3. Esses VM, Gardner RC. Multiculturalism in
Canada: Context and Current Status.
Canadian Journal of Behavioral Science.
1996;28:145-152.
4. Li PS. Social Inclusion of Visible Minorities
and Newcomers: The Articulation of
“Race” and “Racial” Difference in Canadian
Society. Prepared for 2003 Social Inclusion
Conference. What Do We Know and Where
Do We Go: Building a Social Inclusion
Research Agenda. Ottawa, March 27-28,
2003. URL: http://www.ccsd.ca/events/
inclusion/papers/peter_li.pdf.
5. Ali J. Mental Health of Canada’s
Immigrants. Supplement of Health Reports.
2002;13:1-11.
6. Mahtani M. Interrogating the hyphen-
nation: Canadian multicultural policy and
“mixed race” identities. In Hier SP and
Bolaria BS, eds. Identity and Belonging:
Rethinking race and ethnicity in Canadian
society. Toronto, Canada: Canadian
Scholars’ Press Inc, 2006;Chapter 2:31-42.
7. Porter J. The Vertical Mosaic: An Analysis
of Social Class and Power in Canada.
Toronto: University of Toronto Press,
1965:60-103.
8. Lian JZ, Matthews DR. Does the Vertical
Mosaic Still Exist? Ethnicity and Income in
Canada, 1991. Can Rev Sociol Anthropol.
1998;35:461.
9. Kirmayer LJ, Minas H. The future of
cultural psychiatry: An international
perspective. Can J Psychiatry. 2000;45:438-
446.
10. Centers for Disease Control and Prevention.
Suicide among Black youths – United
States, 1980-1995. MMWR Morb Mortal
Wkly Rep. 1998;47:106-193.
11. Shiang J. Does culture make a difference?
Racial/ethnic patterns of completed suicide
in San Francisco, CA 1987-1996 and clinical
implications. Suicide Life Threat Behav.
1998,28:338-354.
12. Joe S, & Kaplan MS. Suicide Among African
American Men. Suicide Life Threat Behav.
2001;Vol.31:S¹106-121.
13. Oquendo MA, Ellis SP, Greenwald S,
Malone KM, Weissman MM, Mann JJ.
Ethnic and sex differences in suicide rates
relative to major depression in the United
States. Am J Psychiatry. 2001;158:1652-
1658.
14. Price JH, Dake JA, Kuchareswki R. Assets
as predictors of suicide attempts in African
American inner-city youths. Am J Health
Behav. 2001;25:367-375.
15. O’Donnell L, O’Donnell C, Merrit Wardlaw
D, Stueve A. Risk and resiliency factors
influencing suicidality among African
American and Latino youth. Am J
Community Psychol. 2004;33:37-49.
16. Neeleman J, Mak V, Wessely S. Suicide by
age, ethnic group, coroners’ verdicts and
country of birth: A three year survey in
Inner London. Br J Psychiatry.
1997;171:463-467.
17. Neeleman J, Wessely S. Ethnic minority
suicide: A small area geographical study in
South London. Psychol Med. 1999;29:429-
436.
18. Bhugra D, Desai M, Baldwin D. Attempted
suicide in west London: Rates across ethnic
communities. Psychol Med, 1999;29:1125-
1130.
19. McKenzie K, van Os J, Samele C, van Horn
E, Tattan T, Murrau R. Suicide and
attempted suicide among people of
Caribbean origin with psychosis living in
the UK. Br J Psychiatry. 2003;183:40-44.
20. Isajiw WW. Definitions of Ethnicity.
Ethnicity. 1974;1:111-124.
21. Bell, BD. The Performance of Immigrants
in the United Kingdom: Evidence from the
GHS. The Economic Journal. 1997;107:333-
344.
22. Green AG, Green DA. The Economic Goals
of Canada’s Immigration Policy, Past and
Present. Departmet of Economics,
University of British Columbia. 1996.
23. Li PS. Race and ethnicity. In Li PS (Ed)
Race and Ethnic Relations in Canada,
Second Edition. Oxford University Press,
Canada. 1999;3-20.
24. Beaujot R. Immigration and Canadian
Demographics: State of the Research.
Citizenship and Immigration Canada.
1998. URL: http://www.cic.gc.ca/english/
research/papers/demographics.html
25. Citizenship and Immigration Canada.
Citizenship and Immigration Statistics,
1966-1996. 2004. URL: http://epe.lac-bac.
gc.ca/100/202/301/immigration_statistics-
ef/index.html
26. Belanger A, Malenfant EC. Population
projections of visible minority groups,
Canada, provinces and regions 2001-2017.
Ottawa: Statistics Canada, Demography
Division. 2005. Cat. No. 91-541-XIE.
27. Aspinall PJ. Operationalising the collection
of ethnicity data in studies of the sociology
of health and illness. Sociol Health Illn.
2001;23:829-862.
28. Winker MA. Measuring Race and Ethnicity:
Why and How? JAMA. 2004;292:1612-
1614.

138 Chronic Diseases in CanadaVol 28, No 4, 2008
29. Murphy HBM. European cultural offshoots
in the New World: Differences in their
mental hospitalization patterns. Part II:
German, Dutch, and Scandinavian
influences. Archiv fur Psychiatrie und
Nervenkrankheiten (Archives of Psychiatry
and Neurological Sciences). 1980;228:161-
174.
30. Liban CB, Smart RG. Drinking and drug
use among Ontario Indian students. Drug
Alcohol Depend. 1982;9:161-171.
31. Havens B, Chappell NL. Triple Jeopardy:
Age, Sex, and Etnicity. Canadian Ethnic
Studies. 1983;15:119-129.
32. Penning MJ. Multiple Jeopardy: Age, Sex,
and Ethnic Variations. Canadian Ethnic
Studies. 1983;15:81-105.
33. Tcheng-Laroche F, Prince R. Separated and
divorced women compared with married
controls: Selected life satisfaction, stress
and health indices from a community
survey. Soc Sci Med. 1983;17:95-105.
34. Tonkin RS. Suicide methods in British
Columbian adolescents. J Adolesc Health
Care. 1984;5:172-177.
35. Barnes GE, Currie RF, Segall A. Symptoms
of Depression in a Canadian Urban Sample.
Can J Psychiatry. 1988;33:386-392.
36. Sack WH, Beiser M, Phillips N, Baker-
Brown G. Co-morbid symptoms of
depression and conduct disorder in First
Nations children: Some findings from the
Flower of Two Soils Project. Cult Med
Psychiatry. 1993;16:471-486.
37. Walters, V. Stress, Anxiety and Depression:
Women’s Accounts of their Health
Problems. Soc Sci Med. 1993;36:393-402.
38. Beiser M, Cargo M, Woodbury MA. A
comparison of psychiatric disorder in
different cultures: Depressive typologies in
Southeast Asian refugees and resident
Canadians. Int J Methods Psychiatr Res.
1994;4:157-172.
39. Beiser M, Sack W, Manson SM, Redshirt R,
Dion R. Mental and the academic
performance of First Nations and majority-
culture children. Am J Orthopsychiatry.
1998;68:455-467.
40. De Wit ML, Embree BG, De Wit DJ.
Determinants of the risk and timing of
alcohol and illicit drug use onset among
natives and non-natives: Similarities and
differences in family attachment. Soc Biol.
1999;46:100–121.
41. DeWit DJ, Beneteau B. Predictors of the
prevalence of alcohol use and related
problems among Francophones and
Anglophones in the province of Ontario,
Canada. Journal of the Study of Alcoholism.
1998;59:78-88.
42. DeWit DJ, Beneteau B. Predictors of the
prevalence of tobacco use among
Francophones and Anglophones in the
province of Ontario. Health Educ Res.
1999;14:209-223.
43. Feldman L, Harvey B, Holowaty P, Shortt
L. Alcohol use beliefs and behaviors among
high school students. J Adolesc Health.
1999;24:48-58.
44. Beiser M, Dion R, Gotowiec A. The
structure of attention-deficit and
hyperactivity symptoms among Native and
Non-Native elementary school children. J
Abnorm Child Psychol. 2000;28:425-437.
45. Lavallee C, Bourgault C. The health of
Cree, Inuit and Southern Quebec Women:
Similarities and Differences. Can J Public
Health. 2000; 91:212-216.
46. Beiser M, Hou F, Hyman I, Tousignant M.
Poverty, Family Process, and the Mental
Health of Immigrant Children in Canada.
Am J Public Health. 2002;92:220-227.
47. Ma X. The First Ten Years in Canada: a
Multi-Level Assessment of Behavioral and
Emotional Problems of Immigrant Children.
Canadian Public Policy. 2002;28:395-418.
48. Mata F. A Look at Life Satisfaction and
Ethnicity in Canada. Canadian Ethnic
Studies. 2002;34: 51-63.
49. Wu Z, Hart R. Social and health factors
associated with support among elderly
immigrants in Canada. Research on Aging.
2002;24:391-412.
50. Blackstock C, Trocme N, Bennett M. Child
maltreatment investigations among
Aboriginal and Non-Aboriginal families in
Canada. Violence Against Women.
2004;10:901-906.
51. Cohen MM, MacLean H. Violence against
Canadian Women. BMC Women’s Health.
2004;4:S22.
52. Wang JW, El-Guebaly N. Sociodemographic
Factors Associated with Comorbid Major
Depressive Episodes and Alcohol
Dependence in the General Population.
Can J Psychiatry. 2004;49:37-44.
53. Rousseau C, Drapeau A. Premigration
exposure to political violence among
independent immigrants and its association
with emotional distress. J Nerv Ment Dis.
2004;192:852-856.
54. Fry PS, Grover SC. Cognitive Appraisals of
Life Stress and Depression in the Elderly: A
Cross-Cultural Comparison of Asians and
Caucasians. International Journal of
Psychology. 1982;17:437-454.
55. Dyal, James A; Chan, Carolina. Stress and
distress: A study of Hong Kong Chinese
and Euro-Canadian students. Journal of
Cross-Cultural Psychology. 1985;16(4):447-
466.
56. Blandford AA, Chappell NL. Subjective
well-being among Native and non-Native
elderly persons: Do differences exist? Can
J Aging. 1990;9(4):386-399.
57. Dion KL, Giordano C. Ethnicity and Sex as
Correlates of Depression Symptoms in a
Canadian University Sample. Int J Soc
Psychiatry. 1990;36:30-41.
58. Bagley CR. Mental health and social
adjustment of elderly Chinese immigrants
in Canada. Canada’s Mental Health.
1993;Fall:6-10.

Vol 28, No 4, 2008Chronic Diseases in Canada 139
59. Dion KL. Ethnolinguistic Correlates of
Alexithymia: Toward a Cultural Perspective.
J Psychosom Res. 1996;41:531-539.
60. Heine SJ, Lehman DR. Culture, Self-
Discrepancies, and Self-Satisfaction. Pers
Soc Psychol Bull. 1999;25:915-925.
61. Rousseau C, Mekki-Berrada A, Moreau S.
Trauma and extended separation from
family among Latin American and African
refugees in Montreal. Psychiatry.
2001;64:40-59.
62. Howard LA, Ahluwalia JS, Lin SK, Sellers
EM, Tyndale RF. CYP2E1*1D regulatory
polymorphism: association with alcohol
and nicotine dependence. Pharmaco-
genetics. 2003;13:321-328.
63. Tweed RG, White K, Lehman DR. Culture,
stress and coping: Internally- and
externally-targeted control strategies of
European Canadians, East Asian Canadians
and Japanese. Journal of Cross-Cultural
Psychology. 2004;35:652-668.
64. Khanlou N. Influences on adolescent self-
esteem in multicultural Canadian
secondary schools. Public Health Nurs.
2004;21:404-411.
65. Aubert P, Daigle MS, Daigle JG. Cultural
Traits and Immigration: Hostility and
Suicidality in Chinese Canadian Students.
Trancultural psychiatry. 2004;41: 514-532.
66. Bland RC, Orn H. Schizophrenia:
Sociocultural Factors. Can J Psychiatry.
1981;26:186-188.
67. Seltzer A, Langford A. Forensic psychiatric
assessments in the Northwest Territories.
Can J Psychiatry. 1984;29:665-668.
68. Borzecki M, Wormith JS, Black WH. An
examination of differences between native
and non-native psychiatric offenders on
the MMPI. Canadian Journal of Behavioural
Sciences. 1988;20:287-301.
69. Chandrasena R, Beddage V, Fernando
MLD. Suicide among immigrant psychiatric
patients in Canada. Br J Psychiatry.
1991;159:707-709.
70. Norton GR, Rockman GE, Malan J, Cox BJ,
Hewitt PL. Panic attacks, chemical abuse
and suicidal ideation: A comparison of
native and non-native Canadians.
Alcoholism Treatment Quarterly.
1995;12:33-41.
71. Weekes JR, Morison SJ, Millson WA, Fettig
DM. A comparison of Native, Métis, and
Caucasian offender profiles on the MCMI.
Canadian Journal of Behavioural Science.
1995;27:187-198.
72. Pawliuk N, Grizenko N, Chan-Yip A,
Gantous P, Mathew J, Nguyen D.
Acculturation style and psychological
functioning in children of immigrants. Am
J Orthopsychiatry. 1996;66:111-121.
73. Zapf PA, Roesch R, Hart SD. An examination
of the relationship of homelessness to
mental disorder, criminal behaviour, and
health care in a pretrial jail population.
Can J Psychiatry. 1996;41:435-440.
74. Devins GM, Edworthy SM, Aramis Lupus
State Models Research Group. Illness
intrusiveness explains race-related quality-
of-life differences among women with
systemic lupus erythematosus. Lupus.
2000;9:534-541.
75. Hodelet N. Psychosis and offending in
British Columbia: characteristics of a
secure hospital population. Crim Behav
Ment Health. 2001;11163-172.
76. Troper H, Weinfeld M. Ethnicity, Politics
and Public Policy: Case studies in Canadian
Diversity. Toronto: University of Toronto
Press, 1999:3-25.
77. Williams DR. Race and Health: Basic
Questions, Emerging Directions. Annual
Review of Epidemiology. 1997;7:322-333.
78. Isajiw WW. Understanding diversity:
Ethnicity and race in the Canadian Context.
Toronto: Thompson Educational Publishing
Inc., 1999:17-36.
79. Comstock RD, Castillo EM, Lindsay SP.
Four-Year Review of the Use of Race and
Ethnicity in Epidemiologic and Public
Health Research. Am J Epidemiol.
2004;159:611-619.
80. Trimble JE, Dickson R. Ethnic Identity. In
Fisher CB and Lerner RM, eds. Applied
developmental science: An encyclopedia
of research, policies, and programs.
Thousand Oaks: Sage. In press.
81. Allahar A. The social construction of
primordial identities. In Hier SP and Bolaria
BS, eds. Identity and Belonging: Rethinking
race and ethnicity in Canadian society.
Toronto: Canadian Scholars’ Press Inc.,
2006;Chapter 2:31-42.
82. Connor W. Ethnonationalism: The Quest
for Understanding. Princeton: Princeton
University Press, 1994:89-117.
83. Smith AD. The ethnic origins of nations.
New York: Basil Blackwell, 1986:1-20.
84. Van Den Berghe PL. Ethnicity and the
sociobiology debate. In Rex J and Mason,
D, eds. Theories of Race and Ethnic
Relations. Cambridge University Press,
1986:246-263.
85. Kaufman SJ. Ethnic fears and ethnic war in
Karabagh. Centre for Strategic and
International Studies. 1998. URL: www.
csis.org/ruseura/pronars/working_papers
.
86. Cheung YW. Approaches to ethnicity:
Clearing roadblocks in the study of
ethnicity and substance abuse. International
Journal of Addictions. 1993;28(12):1209-
1226.
87. Phinney J. Ethnic identity and acculturation.
In Chun K, Organista PB, and Marin G,
eds. Acculturation: Advances in theory,
measurement, and applied research.
Washington, DC: American Psychological
Association, 2003:63-81
88. Tajfel H. Social identity and intergroup
relations. Cambridge: Cambridge University
Press, 1982:207-240.
89. Weinreich P, Saunderson W, eds. Analyzing
identity: Cross-cultural, societal and
clinical contexts. New York: Routledge,
2003:7-110 & 115-170.

140 Chronic Diseases in CanadaVol 28, No 4, 2008
90. Statistics Canada. National Population
Health Survey, Cycle 2. 1996. URL: http://
www.statcan.ca/cgi-bin/imdb/p2SV.pl?Fu
nction=getSurvey&SDDS=3225&lang=e
n&db=IMDB&dbg=f&adm=8&dis=2 .
91. Statistics Canada. Canadian Community
Health Survey, Cycle 1.1. 2000. URL:
http://www.statcan.ca/english/concepts/
health/ .
92. Nazroo JY. Genetic, cultural or socio-
economic vulnerability? Explaining ethnic
inequalities in health. Sociol Health Illn.
1998;20:710-730.
93. Nazroo JY. The structuring of ethnic
inequalities in health: economic position,
racial discrimination and racism. Am J
Public Health. 2003;93(2):277-84.
94. Statistics Canada. National Longitudinal
Survey for Child and Youth, Cycle 1. 1994.
URL: http://www.statcan.ca/cgi-bin/imdb/
p2SV.pl?Function=getSurvey&SurvId=44
50&SurvVer=0&InstaId=16044&InstaVer
=1&SDDS=4450&lang=en&db=imdb&d
bg=f&adm=8&dis=2 .
95. Statistics Canada. National Survey of
Giving, Volunteering and Participating,
Cycle 1. 1997. URL: http://www.statcan.
ca/cgi-bin/imdb/p2SV.pl?Function=getSur
vey&SurvId=4430&SurvVer=0&InstaId=1
6024&InstaVer=1&SDDS=4430&lang=en
&db=imdb&dbg=f&adm=8&dis=2 .
96. Statistics Canada. General Social Survey –
Victimization. 1999. URL: http://www.
statcan.ca/cgi-bin/imdb/p2SV.pl?Function
=getSurvey&SDDS=4504&lang=en&db
=IMDB&dbg=f&adm=8&dis=2.
97. LaVeist TA. Beyond Dummy Variables and
Sample Selection: What Health Services
Researchers Ought to Know about Race as
a variable. Health Serv Res. 1994;29:1-16.
98. Yinger JM. Ethnicity: Source of
Strength? Source of Conflict? New York:
State University of New York Press, 1994:1-
67 & 167-198.
99. Stolley PD. Race in Epidemiology. Int J
Health Serv. 1999;29:905-909.
100. Chaturvedi N. Ethnicity as an
epidemiological determinant-crudely racist
or crucially important? Int J Epidemiol.
2001;30:925-927.
101. James CE. Race, ethnicity and cultural
identity. In Hier SP and Bolaria BS, eds.
Identity and Belonging: Rethinking race
and ethnicity in Canadian society. Toronto,
Canada: Canadian Scholars’ Press Inc.,
2006;Chapter 3:43-55.
102. Di Biase S, Bauder H. Immigrants in
Ontario: Linking Spatial Settlement
Patterns and Labour Force Characteristics.
Department of Geography, University of
Guelph. 2004. URL: www.uoguelph.ca/
geography/research/ffw/papers/
Settlement%20in%20Ontario_report.pdf .
103. Ali J, Grabb E. Ethnic origin, class origin
and educational attainment in Canada:
Further evidence on the mosaic thesis.
Journal of Canadian Studies. 1998;32:
3-21.
104. Breton R, Roseborough H. Ethnic
differences in status. In Blishen BR et al.,
eds. Canadian Society. Toronto: Macmillan,
1968:683-701.
105. Thompson EN. Immigrant Occupational
Skill Outcomes and the Role of Region-Of-
Origin-Specific Human Capital-September
2000. Ottawa: Human Resources Develop-
ment Canada. 2000. Cat. No. W-00-8E.
106. Wallace M. “Planning Amidst Diversity:
The Challenges of Multiculturalism in
Urban and Suburban Greater Toronto.”
PhD Thesis. University of Waterloo, 1999.
107. Beshiri, R. Immigrants in rural Canada:
2001 update. Rural and Small Town Canada
Analysis Bulletin. 2004;5:1-27. Cat. No.
21-006-XIE.
108. Schellenberg G. Trends and Conditions in
Census Metropolitan Areas: Immigrants in
Canada’s Census Metropolitan Areas.
Statistics Canada. 2004. Cat. No. 89-613-
MIE - No. 003. URL: http://www.statcan.
ca/english/research/89-613-MIE/2004003/
89-613-MIE2004003.pdf .
109. Manitoba and Northern Affairs. Aboriginal
People in Manitoba 2000. URL: http://
www.gov.mb.ca/ana/apm2000/index.
html .
110. Office of the Registrar General, India.
Proportion and growth rate of population
by religious communities - India : 1961-
2001. URL: http://www.censusindia.net/
religiondata/statement.pdf .

Vol 28, No 4, 2008Chronic Diseases in Canada 141
APPENDIX IQuantitative empiric studies on ethnicity and mental health conducted in Canada
(or with Canadian data) that included two or more ethnic groups
N = Sample size of study, A = Age range of study individuals, S = Source(s) of data, D = Data type, DA = Data analyses, T = Type of study,
DV = Dependent Variable, IV = Independent Variable
Author(s), year of publication & region
of study
Study Sample(sample size, data source, age
group included and study design) Ethnic groups included Outcome Examined Comments
Studies based on population-based or large community-based surveys/samples (n = 27)
1. Murphy, 1980 (Canada)29
N = not givenA = 15+S = Dominion Bureau of Statistics reports on first admissions to Canadian Mental Hospitals in 1961 and the 1961 Population Census.D = Cross-sectionalDA = Standardized Morbidity Ratio (SMR)T = Descriptive
German Origin;Dutch Origin;Scandinavian Origin;Canadian-born
DV: Mental hospitalizations 1. A clear definition of ethnicity not given.
2. Ethnicity based on “country from which the individual’s ancestors on the male side came when they settled in Canada”, therefore an ethnic origin conceptualization.
3. Ethnic groups reflective of the immigration pattern in Canada during the time period (i.e. 1960’s)
2. Liban & Smart, 1982 (Ontario, Canada)30
N =128A = 10 to 20 (i.e. Grade 7 to 13)S = 1979 Survey of Alcohol and Drug Use among Ontario studentsD = Cross-sectionalDA = Descriptive and Chi-square analysesT = Descriptive
Native Indian [64];Non-Native Indian [64]
DV: Frequency and problems with alcohol and drug use
1. A clear definition of ethnicity not given.
2. Ethnicity based on cultural background but how ascertained not specified.
3. Although cultural background in the survey included a breakdown into English Canadian, French Canadian, Asian, Native Indian and other, the non-Native Indian categories were aggregated for the study based on matching.
3. Havens & Chappell, 1983 (Manitoba, Canada)31
N = 3647A = 65+S = Aging in Manitoba Survey (1971)D = Cross-sectionalDA = ANOVAT = Analytic
North American [370]; British [1633]French [216]; Polish/Russian/Ukrainian [685]; Other European (German, Norwegian, Danish, Swedish, Icelandic, Dutch, Belgian) [743]
DV: Perceived well-being, perceived health status, mental health functioning
1. The ethnic groups in the study not representative of the whole of Canada but of Manitoba specifically.
2. Ethnic groups reflective of the immigration pattern in the province and of the time period.
3. Ethnic origin based on ethnicity question in the survey
4. Penning, 1983 (Canada)32
N = 2253A = 30+S = Social Change in Canada Survey (1977)D = Cross-sectionalDA = ANOVAT = Analytic
Canadian [1720]; American [57]; British [159]; North European (France, Germany, Austria, Scandinavia, Netherlands) [96]; South European (Greece, Portugal, Spain, Italy) [65]; East European (Russia, Hungary, Poland) [96]; Others [62]
DV: Perceived psychological well-being
1. A clear definition of ethnicity not given.
2. Some ethnic categories not clearly explained for example the ethnic group referred to as “Other”.
3. Ethnic origin based on country of birth.
5. Tcheng-Laroche & Prince, 1983 (Montreal, Quebec, Canada)33
N = 128A = not givenS = Community survey of a representative sample of separated or divorced mothers in MontrealD = Cross-sectionalDA = Chi-square, ANOVAT = Analytic
Francophone [62];Anglophone [66]
DV: Psychosocial stress per the Langner Scale, self-esteem per the RSE and life satisfaction
1. A clear definition of ethnicity not given.
2. Study interested in examining “cultural effects”.
3. Study included French- and English-Canadians in Montreal. It is unclear how being French and/or English-Canadian were ascertained.
6. Tonkin, 1984 (British Columbia, Canada)34
N = 122A = < 20 years oldS = Vital statistics data (with follow-up review of all deaths reported to the provincial Chief Coroner’s office 1978/9)D = Cross-sectionalDA = Descriptive and chi-square analysesT = Descriptive
Native Indian [33];Non-Natives [89]
DV: Suicides and psychiatric diagnoses
1. A clear definition of ethnicity not given.
2. Ethnicity used as a covariate but how it was ascertained not indicated because it was abstracted from the coroners’ records.
3. The rationale for the inclusion of ethnicity as a covariate not explained.
7. Barnes et al., 1988 (Winnipeg, Manitoba, Canada)35
N = 524A = 18 to 80 S = 1983 Winnipeg Area Study D = Cross-sectionalDA = ANOVA, X2, & multiple classification analysesT = Exploratory
English [84];East European [62]; West European [82]; Canadian [193]; Other [97]
DV: Depression (CES-D) 1. Ethnicity examined as a predictor of depression.
2. Ethnic groups reflective of the ethnic composition region of study.
3. Ethnic origin based on country of birth.

142 Chronic Diseases in CanadaVol 28, No 4, 2008
Author(s), year of publication & region
of study
Study Sample(sample size, data source, age
group included and study design) Ethnic groups included Outcome Examined Comments
8. Sack et al., 1993 (Canada & US)36
N = 1115A = 7 to 9 (Grades 2 and 4)S = Flower of Two Soils ProjectD = Prospective and longitudinal (3 year follow-up)DA = Correlation analyses, ANOVA, chi-square analysesT = Analytic
First Nation children from the Plains (South Dakota, US), Northern Woodlands (Manitoba, Canada), Desert (New Mexico, US) and Coastal (British Columbia, Canada) compared to a sample of non-Native children at each site
DV: Depressive symptoms using new measures of psycho-pathology and mental health (the SOS)
1. No explicit definition given for ethnicity.
2. Study specifically interested in cultural differences between the various First Nation groups across North America, hence it is implied that ethnicity is based on culture.
9. Walters, 1993 (Hamilton, Ontario, Canada)37
N = 356 A = 21+S = A stratified random sample of women in HamiltonD = Cross-sectionalDA = Chi-squareT = Descriptive
English-speaking vs. other language
DV: Stress, anxiety and depression
1. Ethnic origin based on primary language.
2. No definition for ethnicity.
3. Language stated as a possible proxy for ethnicity.
10. Beiser et al., 1994 (Vancouver, British Columbia, Canada)38
N = 1667A = ?S = 1348 refugees from the Refugee Resettlement Project and an area-probability sample of 319 Vancouver residents matched to refugees on age and sexD = Cross-sectionalDA = Grade of Membership analysis (GOM: a multivariate clustering technique)T = Analytic
Southeast Asians [1348];Resident Canadians [319];Southeast Asian group disaggregated: Chinese [755]; Vietnamese/Laotian [593]
DV: Psychiatric disorders including depression, anxiety and somatization per the CES-D, DIS and the Senegal Health Scales
1. No explicit definition given for ethnicity.
2. Researchers interested in “psychopathological expression among different ethno-cultural groups”, therefore ethnicity based on culture.
3. Ethnicity based on where the individual emigrated from.
11. Beiser et al., 1998 (Canada & US)39
N = 1708A = 7 to 9 (Grades 2 and 4)S = Flower of Two Soils ProjectD = Prospective and longitudinal DA = Principal component factor analysis on the psychopathology measure, correlation analyses, ANOVA, chi-square analysesT = Analytic
First Nation children from the Plains (South Dakota, US), Northern Woodlands (Manitoba, Canada), Desert (New Mexico, US) and Coastal (British Columbia, Canada) [1251] compared to a sample of non-Native children at each site [457]
DV: Depressive symptoms using new measures of psychopathology and mental health (the SOS)
1. No explicit definition given for ethnicity.
2. Study specifically interested in cultural differences between the various First Nation groups across North America.
12. DeWit et al., 1999 (Ontario, Canada)40
N = 4531A = 19+S = Native Ontario Community Survey and the Mental Health Supplement of the Ontario Health Survey.D = Cross-sectional (but age at onset information used to look at incidence)DA = Descriptive and chi-square and survival analysesT = Analytic
Native Indian [876];Non-Natives [3655]
DV: Alcohol drug use and onset
1. No explicit definition given for ethnicity.
2. Study specifically interested in cultural differences between Native Indians and non-Natives in Canada.
13. DeWit and Beneteau, 1999 (Ontario, Canada)41
N = 5150A = 16+S = 1990 Ontario Health SurveyD = Cross-sectional but age at onset information allowed survival analysesDA = Chi-square, survival and logistic regression analysesT = Analytic
Anglophone [4023];Francophone [1127]
DV: Alcohol consumption (i.e. frequency and volume); alcohol-related problems (i.e. driving under the influence, family conflicts, work conflicts, sought help for drinking, hospitalization for drinking, and/or arrested for drunk behaviour)
1. No explicit definition of ethnicity given.
2. Ethnicity based on a combination of ethnic identity and primary language used at home.
14. DeWit and Beneteau, 1999 (Ontario, Canada)42
N = 5150A = 16+S = 1990 Ontario Health SurveyD = Cross-sectional but age at onset information allowed survival analysesDA = Chi-square, survival and logistic regression analysesT = Analytic
Anglophone [4023];Francophone [1127]
DV: Daily tobacco consumption (i.e. frequency and volume)
1. No explicit definition of ethnicity given.
2. Ethnicity based on a combination of ethnic identity and primary language used at home.
15. Feldman et al., 1999 (Toronto, Ontario, Canada)43
N = 1236A = Grade 9 to 13 students S = 1994 Survey of Grade 9 to 13 students in the Borough of East York, TorontoD = Cross-sectionalDA = descriptive analyses, stratified analyses and multiple logistic regression analysesT = Analytic
Canadian [379]; European [277]; Asian [314];Other [140];Not stated [126]
DV: Alcohol use beliefs and behaviour
1. No definition given for ethnicity.
2. “Please write down the term that best describes the ethnic character of your everyday home environment” was used to ascertain ethnicity indicating an ethnic identity conceptualization.
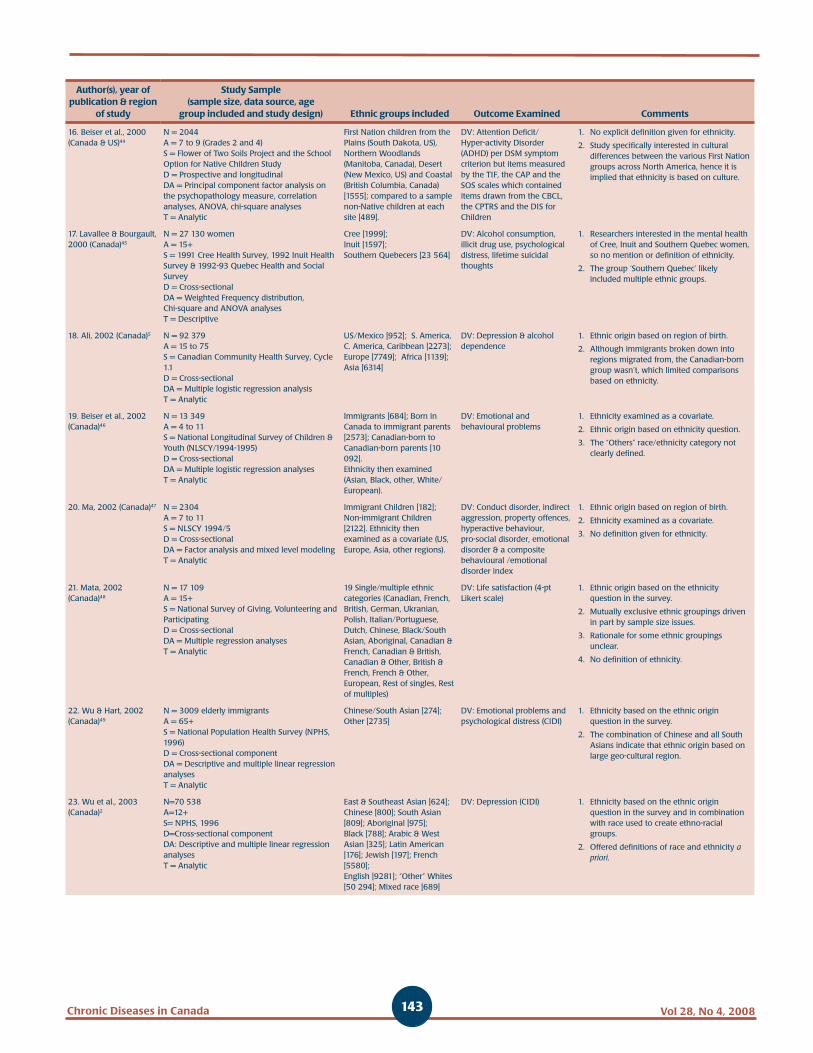
Vol 28, No 4, 2008Chronic Diseases in Canada 143
Author(s), year of publication & region
of study
Study Sample(sample size, data source, age
group included and study design) Ethnic groups included Outcome Examined Comments
16. Beiser et al., 2000 (Canada & US)44
N = 2044A = 7 to 9 (Grades 2 and 4)S = Flower of Two Soils Project and the School Option for Native Children StudyD = Prospective and longitudinal DA = Principal component factor analysis on the psychopathology measure, correlation analyses, ANOVA, chi-square analysesT = Analytic
First Nation children from the Plains (South Dakota, US), Northern Woodlands (Manitoba, Canada), Desert (New Mexico, US) and Coastal (British Columbia, Canada) [1555]; compared to a sample non-Native children at each site [489].
DV: Attention Deficit/Hyper-activity Disorder (ADHD) per DSM symptom criterion but items measured by the TIF, the CAP and the SOS scales which contained items drawn from the CBCL, the CPTRS and the DIS for Children
1. No explicit definition given for ethnicity.
2. Study specifically interested in cultural differences between the various First Nation groups across North America, hence it is implied that ethnicity is based on culture.
17. Lavallee & Bourgault, 2000 (Canada)45
N = 27 130 womenA = 15+S = 1991 Cree Health Survey, 1992 Inuit Health Survey & 1992-93 Quebec Health and Social Survey D = Cross-sectionalDA = Weighted Frequency distribution, Chi-square and ANOVA analysesT = Descriptive
Cree [1999]; Inuit [1597];Southern Quebecers [23 564]
DV: Alcohol consumption, illicit drug use, psychological distress, lifetime suicidal thoughts
1. Researchers interested in the mental health of Cree, Inuit and Southern Quebec women, so no mention or definition of ethnicity.
2. The group ‘Southern Quebec’ likely included multiple ethnic groups.
18. Ali, 2002 (Canada)5 N = 92 379A = 15 to 75S = Canadian Community Health Survey, Cycle 1.1 D = Cross-sectionalDA = Multiple logistic regression analysisT = Analytic
US/Mexico [952]; S. America, C. America, Caribbean [2273]; Europe [7749]; Africa [1139]; Asia [6314]
DV: Depression & alcohol dependence
1. Ethnic origin based on region of birth.
2. Although immigrants broken down into regions migrated from, the Canadian-born group wasn’t, which limited comparisons based on ethnicity.
19. Beiser et al., 2002 (Canada)46
N = 13 349A = 4 to 11S = National Longitudinal Survey of Children & Youth (NLSCY/1994-1995)D = Cross-sectionalDA = Multiple logistic regression analysesT = Analytic
Immigrants [684]; Born in Canada to immigrant parents [2573]; Canadian-born to Canadian-born parents [10 092].Ethnicity then examined (Asian, Black, other, White/ European).
DV: Emotional and behavioural problems
1. Ethnicity examined as a covariate.
2. Ethnic origin based on ethnicity question.
3. The “Others” race/ethnicity category not clearly defined.
20. Ma, 2002 (Canada)47 N = 2304A = 7 to 11S = NLSCY 1994/5D = Cross-sectionalDA = Factor analysis and mixed level modelingT = Analytic
Immigrant Children [182]; Non-immigrant Children [2122]. Ethnicity then examined as a covariate (US, Europe, Asia, other regions).
DV: Conduct disorder, indirect aggression, property offences, hyperactive behaviour, pro-social disorder, emotional disorder & a composite behavioural /emotional disorder index
1. Ethnic origin based on region of birth.
2. Ethnicity examined as a covariate.
3. No definition given for ethnicity.
21. Mata, 2002 (Canada)48
N = 17 109A = 15+S = National Survey of Giving, Volunteering and ParticipatingD = Cross-sectionalDA = Multiple regression analysesT = Analytic
19 Single/multiple ethnic categories (Canadian, French, British, German, Ukranian, Polish, Italian/Portuguese, Dutch, Chinese, Black/South Asian, Aboriginal, Canadian & French, Canadian & British, Canadian & Other, British & French, French & Other, European, Rest of singles, Rest of multiples)
DV: Life satisfaction (4-pt Likert scale)
1. Ethnic origin based on the ethnicity question in the survey.
2. Mutually exclusive ethnic groupings driven in part by sample size issues.
3. Rationale for some ethnic groupings unclear.
4. No definition of ethnicity.
22. Wu & Hart, 2002 (Canada)49
N = 3009 elderly immigrantsA = 65+S = National Population Health Survey (NPHS, 1996)D = Cross-sectional componentDA = Descriptive and multiple linear regression analysesT = Analytic
Chinese/South Asian [274];Other [2735]
DV: Emotional problems and psychological distress (CIDI)
1. Ethnicity based on the ethnic origin question in the survey.
2. The combination of Chinese and all South Asians indicate that ethnic origin based on large geo-cultural region.
23. Wu et al., 2003 (Canada)2
N=70 538A=12+S= NPHS, 1996D=Cross-sectional componentDA: Descriptive and multiple linear regression analysesT = Analytic
East & Southeast Asian [624]; Chinese [800]; South Asian [809]; Aboriginal [975]; Black [788]; Arabic & West Asian [325]; Latin American [176]; Jewish [197]; French [5580]; English [9281]; “Other” Whites [50 294]; Mixed race [689]
DV: Depression (CIDI) 1. Ethnicity based on the ethnic origin question in the survey and in combination with race used to create ethno-racial groups.
2. Offered definitions of race and ethnicity a priori.

144 Chronic Diseases in CanadaVol 28, No 4, 2008
Author(s), year of publication & region
of study
Study Sample(sample size, data source, age
group included and study design) Ethnic groups included Outcome Examined Comments
24. Blackstock et al., 2004 (Canada)50
N =3159A = childhood (range not given)S = 1998 Canadian Incidence Study of Reported Child Abuse and Neglect (CIS-98)D = Cross-sectionalDA = Chi-square and ANOVA analysesT = Descriptive
Aboriginal [614];White [2114];Other Visible Minority [431]
DV: Frequency of Child Maltreatment (physical and sexual abuse and neglect); psychosocial problems
1. No explicit definition of ethnicity given.
2. Ethno-racial classification determined by ethno-racial status of one or both biological parents.
3. Conceptualized based on ethnic origin.
25. Cohen & Maclean, 2004 (Canada)51
N = 26 000A = 15+S = All females from the 1999 General Social SurveyD = Cross-sectionalDA = z-test with p < 0.05 significance levelT = Descriptive
Visible minority vs. non-visible minority;Aboriginal vs. non-Aboriginal
DV: Physical, sexual, financial or emotional abuse; medication use for anxiety, depression or insomnia in those abused.
1. Ethnicity based on country of birth.
2. No definition given for visible minority.
26. Wang & El-Guebaly, 2004 (Canada)52
N = 72 940A = 12+S = NPHS (1996/7)D = Cross-sectionalDA = Multiple logistic regression analysesT = Analytic
White [67 802];Non-White [5138]
DV: Major depressive episode (MDE), alcohol dependence (AD) and mental health service use
1. Ethnicity examined as a covariate.
2. No description of the groups included in the non-white category.
3. Non-white population likely included Aboriginals, a group with great likelihood of MDE and AD, which likely explains the higher risk observed in non-immigrant non-whites.
4. Race only categorization despite use of the term “ethnicity”.
27. Rousseau & Drapeau, 2004 (Montreal, Quebec, Canada)53
N = 1871A = 15 to 87S = Quebec Cultural Communities Survey (survey of recent immigrants living in the metropolitan Montreal area who landed in Canada between 1988 and 1997) D = Cross-sectionalDA = Chi-square, t-test, ANOVAT = Descriptive
Chinese;Arab;Haitian;Hispanics Note: indicated in the article that equal numbers of each ethnic group were selected from the registry to represent the target population [n = 750 * 4 = 3000] but the eligible population was 1871 with no breakdown of the numbers in each ethnic group
DV: Emotional distress (i.e. depression and anxiety) per the SCL-25 based on the Hopkins Symptom Checklist
1. Explicit definition of ethnicity not given.
2. Researchers interested in recent immigrants in the Montreal area who were born in one of four geocultural areas (China, Hong Kong, Taiwan and Macao [Chinese], Haiti [Haitian], North Africa and the Middle East [Arabs] and Latin America [Hispanics]. Therefore, ethnicity conceptualized based on region of birth.
Smaller studies with primary data collection – non-clinical sample (n = 12)
28. Fry & Grover, 1982 (Canada & USA)54
N = 320A = 65 to 80S = Random sample drawn form professional clubs, community associations, recreation centres for elderly, social welfare agencies and private homes.D = Cross-sectionalDA = ANOVAT = Analytic
Asian-Indian [160]; Caucasian [160]
DV: Depression (per the BDI), life stress [per the Life Event Inventory], cognitive appraisal and locus of control
1. Definition of ethnicity not given.
2. How ethnicity ascertained unclear.
3. Seem to be a race only categorization.
29. Dyal & Chan, 1985 (Waterloo, Ontario, Canada)55
N = 251A = 17 to 29S = Samples of convenience (i.e. students in undergraduate courses and some volunteers)D = Cross-sectionalDA = ANOVA and ANCOVAT = Analytic
Euro-Canadian [112];Hong Kong Chinese [100];Chinese immigrants to Canada [39]
DV: Stressful life events per the Problems with Living Adjustment scale (developed for the study); distress per the DSS based on Langer 22-item scale of impaired functioning; 12- items from the DDS; worry per the worry scale of the SEAS.
1. No explicit definition given for ethnicity.
2. Implication that ethnicity based on culture since the study interested in cross-cultural differences.
3. Unclear whether the Euro-Canadian groups actually identified themselves as such or if this categorization based on the researchers’ observations.
30. Blandford & Chappell, 1990 (Winnipeg, Manitoba, Canada)56
N = 390A = 50 and overS = Survey of Natives in Winnipeg in 1981D = Cross-sectionalDA = Chi-square and logistic regression analysesT = Analytic
Natives [193]Non-Natives [197]
DV: Satisfaction with life; loneliness per the UCLA Loneliness Scale
1. Ethnicity not specifically defined.
2. Conceptualized based on ethnic identity but no indication of how ethnic identity was ascertained.
31. Dion & Giordano, 1990 (Toronto, Ontario, Canada)57
N = 352A = 1st-year university students – mean age of 20.32 years (1988)S = A sample of undergraduate students in an introductory psychology courseD = Cross-sectionalDA = ANOVA, X2, and multivariate log-linear analysesT = Analytic
Anglo-Celtic [165]; North European [22]; South European [79]; East European [36]; East Asians [25]; South Asians [25] IV: Sex and ethnicity
DV: Depression (total & item scores for the BDI)
1. Ethnic origin based on surnames, with the aid of a number of dictionaries of surnames/family names.
2. This limited the ability to identify black individuals with West Indian ethno-cultural background and South Asians of Christian background.

Vol 28, No 4, 2008Chronic Diseases in Canada 145
Author(s), year of publication & region
of study
Study Sample(sample size, data source, age
group included and study design) Ethnic groups included Outcome Examined Comments
32. Bagley, 1993 (Calgary, Alberta, Canada & Kowloop, Hong Kong, China)58
N = 300A = 60 to 74 years oldS = The 100 Canadian-dwelling elderly Cantonese-speaking Chinese sample was recruited by randomly selecting Chinese surnames from the telephone directory with an initial call by a Cantonese-speaking individual who established the presence of an elderly person (aged 60 to 74) and then inquired about and established the ethnic origin of the individual. Stratified sampling of young to elderly in Kowloop, Hong Kong to match the age and sex profile of Canadian-dwelling Cantonese-speaking elderly Chinese group.D = Cross-sectionalDA = Comparison of the standardized scoresT = Descriptive
Canadian born of European descent [100];Chinese immigrants long established in Canada [50]; Chinese immigrants newly arrived in Canada [50]; Chinese in Hong Kong [100]
DV: Physical and mental health as measured by the GHQ; loneliness per the UCLA Loneliness Scale; quality of life & acculturation; & global satisfaction with life
1. Explicit definition given for ethnicity.
2. Different techniques seem to have been used to establish ethnicity across groups. Surnames, language and unknown question for Canadian dwelling Chinese; country of birth for Hong Kong Chinese and unknown method for Euro-Canadians.
33. Dion, 1996 (Toronto, Canada)59
N = 950A = ?18-21: 1st-year university studentsS = Convenience sampleD = Cross-sectionalDA = ANOVAT = Exploratory
Language as indicator of ethnic origin
English;Chinese;European
DV: Alexithymia (TAS-20) and three under-lying factors (DIF= difficulty identifying feelings, DDF= difficulty describing feelings, EOT= externally oriented thinking)
1. Language identified by Dion as a possible proxy of ethnicity (i.e. ethnic origin).
2. No definition for ethnicity.
34. Heine and Lehman, 1999 (Canada & Japan)60
N = 402A = 18 to 25?S = Survey of university studentsD = Cross-sectionalDA = ANOVA with post hoc tests (Tukey’s HSD)T = Analytic
Japanese [161]; Asian-Canadian [151]; Euro-Canadian [90]
DV: Personality traits: 20 items to capture the individuals’ ratings of their actual & ideal self and what they thought described the average student traits; difference between actual & ideal self, and importance of traits to success in one’s country were also assessed; depression (ZSDS)
1. No explicit definition given for ethnicity; it appeared to be based on culture.
2. Method of sample selection unclear.
3. SES and/or SS hypotheses not tested.
35. Rousseau et al., 2001 (Montréal, Canada)61
N = 113 A = 20 to 65S = Sample of refugees who sought help from community organizations that provide services to refugees/immigrants in the Montreal areaD = Qualitative & cross-sectional quantitative design combinedDA = Descriptive analyses and Spearman rank correlation and t-tests for comparative analysesT = Descriptive
Latin American [60]; African American [53]
DV: Emotional profile of subjects based on the SCL-90R; Post-traumatic stress disorder per the DSM-IV.
1. Ethnic origin based on geo-cultural region of birth.
2. Explicit definition of ethnicity not given.
36. Howard et al, 2003 (Toronto, Ontario, Canada; USA; Taipei City, Taiwan)62
N = 3030A = not givenS = All participants from Canada are volunteers recruited through newspaper and flyer advertisements in Toronto; Taiwanese recruited at the Taipei City Psychiatric Center; African American smokers recruited at the University of Kansas Medical Center (Clinical and community settings)D = Association Analysis (Cross-sectional)DA = ANOVA; T-test, Mann-Whitney U-test and Chi-square analysesT = Analytic
From Canada:Indo-Asian [48];Chinese [210];Japanese [128];African Canadian [58];Native Indian [228];Caucasian [1734]
Elsewhere:Taiwanese [420];African American [204]
DV: CYP2E1*1D allele; alcohol inactivation
1. Ethnicity not explicitly defined.
2. Ethnic background based on the individual’s grandparents therefore an ethnic origin conceptualization.
37. Tweed et al., 2004 (British Columbia, Canada and Japan)63
N = 123 (Study 1) 415 (Study 2)A = 18 to 47S = Undergraduate students from the University of British Columbia, Canada and from Ritsumeikan University (Study 1) or Kurume University (Study 2), JapanD = Cross-sectionalDA = MANCOVAT = Analytic
Study 1:Western European Canadian [22];East Asian Canadian [57];South Asian/Mixed descent Canadian [18];Japanese [26]
Study 2:European Canadian [68];East-Asian Canadian [106];Japanese [241]
DV: Stressful and negative life events; coping skills per the WCCL and Japanese coping items
1. Ethnicity not explicitly defined but based on culture.
2. Conceptualized based on descent, therefore ethnic origin.
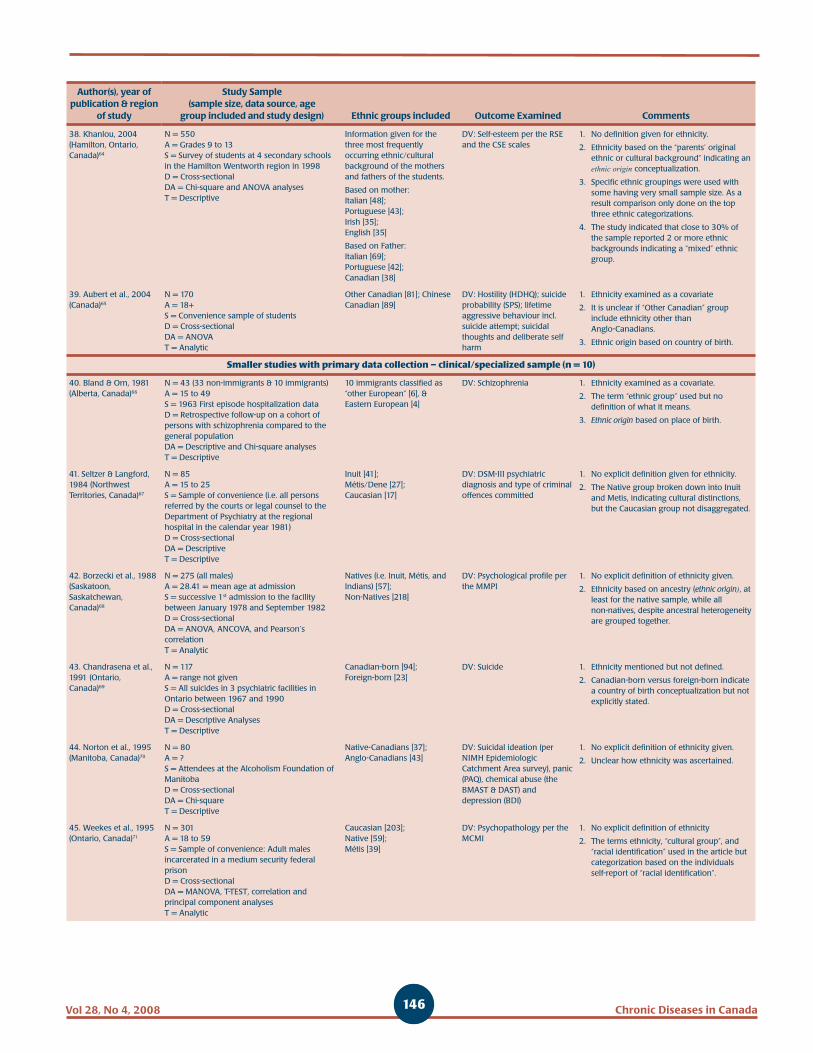
146 Chronic Diseases in CanadaVol 28, No 4, 2008
Author(s), year of publication & region
of study
Study Sample(sample size, data source, age
group included and study design) Ethnic groups included Outcome Examined Comments
38. Khanlou, 2004 (Hamilton, Ontario, Canada)64
N = 550A = Grades 9 to 13S = Survey of students at 4 secondary schools in the Hamilton Wentworth region in 1998D = Cross-sectionalDA = Chi-square and ANOVA analysesT = Descriptive
Information given for the three most frequently occurring ethnic/cultural background of the mothers and fathers of the students.
Based on mother:Italian [48];Portuguese [43];Irish [35];English [35]
Based on Father:Italian [69];Portuguese [42];Canadian [38]
DV: Self-esteem per the RSE and the CSE scales
1. No definition given for ethnicity.
2. Ethnicity based on the “parents’ original ethnic or cultural background” indicating an ethnic origin conceptualization.
3. Specific ethnic groupings were used with some having very small sample size. As a result comparison only done on the top three ethnic categorizations.
4. The study indicated that close to 30% of the sample reported 2 or more ethnic backgrounds indicating a “mixed” ethnic group.
39. Aubert et al., 2004 (Canada)65
N = 170A = 18+S = Convenience sample of studentsD = Cross-sectionalDA = ANOVAT = Analytic
Other Canadian [81]; Chinese Canadian [89]
DV: Hostility (HDHQ); suicide probability (SPS); lifetime aggressive behaviour incl. suicide attempt; suicidal thoughts and deliberate self harm
1. Ethnicity examined as a covariate
2. It is unclear if “Other Canadian” group include ethnicity other than Anglo-Canadians.
3. Ethnic origin based on country of birth.
Smaller studies with primary data collection – clinical/specialized sample (n = 10)
40. Bland & Orn, 1981 (Alberta, Canada)66
N = 43 (33 non-immigrants & 10 immigrants)A = 15 to 49S = 1963 First episode hospitalization data D = Retrospective follow-up on a cohort of persons with schizophrenia compared to the general populationDA = Descriptive and Chi-square analysesT = Descriptive
10 immigrants classified as “other European” [6], & Eastern European [4]
DV: Schizophrenia 1. Ethnicity examined as a covariate.
2. The term “ethnic group” used but no definition of what it means.
3. Ethnic origin based on place of birth.
41. Seltzer & Langford, 1984 (Northwest Territories, Canada)67
N = 85A = 15 to 25S = Sample of convenience (i.e. all persons referred by the courts or legal counsel to the Department of Psychiatry at the regional hospital in the calendar year 1981)D = Cross-sectionalDA = Descriptive T = Descriptive
Inuit [41];Métis/Dene [27];Caucasian [17]
DV: DSM-III psychiatric diagnosis and type of criminal offences committed
1. No explicit definition given for ethnicity.
2. The Native group broken down into Inuit and Metis, indicating cultural distinctions, but the Caucasian group not disaggregated.
42. Borzecki et al., 1988 (Saskatoon, Saskatchewan, Canada)68
N = 275 (all males)A = 28.41 = mean age at admissionS = successive 1st admission to the facility between January 1978 and September 1982D = Cross-sectionalDA = ANOVA, ANCOVA, and Pearson’s correlationT = Analytic
Natives (i.e. Inuit, Métis, and Indians) [57];Non-Natives [218]
DV: Psychological profile per the MMPI
1. No explicit definition of ethnicity given.
2. Ethnicity based on ancestry (ethnic origin), at least for the native sample, while all non-natives, despite ancestral heterogeneity are grouped together.
43. Chandrasena et al., 1991 (Ontario, Canada)69
N = 117A = range not givenS = All suicides in 3 psychiatric facilities in Ontario between 1967 and 1990D = Cross-sectionalDA = Descriptive AnalysesT = Descriptive
Canadian-born [94];Foreign-born [23]
DV: Suicide 1. Ethnicity mentioned but not defined.
2. Canadian-born versus foreign-born indicate a country of birth conceptualization but not explicitly stated.
44. Norton et al., 1995 (Manitoba, Canada)70
N = 80A = ?S = Attendees at the Alcoholism Foundation of ManitobaD = Cross-sectionalDA = Chi-squareT = Descriptive
Native-Canadians [37];Anglo-Canadians [43]
DV: Suicidal ideation (per NIMH Epidemiologic Catchment Area survey), panic (PAQ), chemical abuse (the BMAST & DAST) and depression (BDI)
1. No explicit definition of ethnicity given.
2. Unclear how ethnicity was ascertained.
45. Weekes et al., 1995 (Ontario, Canada)71
N = 301A = 18 to 59S = Sample of convenience: Adult males incarcerated in a medium security federal prisonD = Cross-sectionalDA = MANOVA, T-TEST, correlation and principal component analysesT = Analytic
Caucasian [203];Native [59];Métis [39]
DV: Psychopathology per the MCMI
1. No explicit definition of ethnicity
2. The terms ethnicity, “cultural group”, and “racial identification” used in the article but categorization based on the individuals self-report of “racial identification”.

Vol 28, No 4, 2008Chronic Diseases in Canada 147
Author(s), year of publication & region
of study
Study Sample(sample size, data source, age
group included and study design) Ethnic groups included Outcome Examined Comments
46. Pawliuk et al., 1996 (Montreal, Canada)72
N = 34 multiethnic families (one parent included) with a total of 48 children (of which 8 born in Asia and 3 in India. No other mention of the ethnic breakdown of the children).A = age range of parents not given but children ranged in age from 6.5 to 17 years oldS = convenience sample of the parents and their children seen in a Pediatric Clinic in Montreal, CanadaD = Cross-sectionalDA = ANOVA and MANOVAT = Analytic
Ethnic breakdown of the parents given but not for the children.
Asian [26];European [5];Indian/S. American/Middle Eastern [3]
DV: Revised CBCL; Depression Self-rating Scale; the What I Think and Feel Scale; the Children’s Psycho-somatic Symptom Checklist; and the Hare Self-Esteem Scale.
1. No explicit definition given for ethnicity
2. There were 34 parents and 48 children so unclear of the ethnicity breakdown of the children.
3. Since ethnicity for parents given but not for children, it appears that ethnicity based on region/place of parent’s birth.
47. Zapf et al., 1996 (Vancouver, British Columbia, Canada)73
N = 790A = not specified S = Adult males randomly selected from Vancouver Pretrial Service Centre between August 1, 1989 and July 31, 1990D = Cross-sectionalDA = Chi-square and Pearson Correlation AnalysesT = Descriptive
Although the term “ethnicity” used, there was no breakdown of the ethnic group.
DV: Mental disorder per the BPRS and the Diagnostic Profile
1. Ethnicity stated as a covariate.
2. No definition given for ethnicity.
3. No indication of how ethnicity conceptualized or operationalized.
48. Devins et al., 2000 (Canada & US)74
N = 405A = not specifiedS = The Arthritis, Rheumatism and Aging Medical Information System Lupus ProjectD = LongitudinalDA = Principal component and path analysesT = Analytic
White [335]; Black [40]; Asian [30](all female)
DV: Psychosocial well-being (ABS); learned helplessness (RAI); emotional distress (CES-D); musculo-skeletal pain (HAQ); overall psycho-social well-being
1. The Black and Asian groups comprised of mostly (i.e. 97% & 83%) individuals from the US, whereas almost equal proportion of whites from the US and Canada).
2. Racial classification rather than ethnicity.
49. Hodelet, 2001 (British Columbia, Canada)75
N = 175A = 19 to 75S = Secure Forensic Psychiatry Hospital, all case records for patients in hospital between December 1, 1998 and February 28, 1999D = Cross-sectionalDA = Chi-square and ANOVA analysesT = Descriptive
White [153];Native American [26];Oriental/East Asian [11];South Asian [5];Black [1]
DV: Type of offence; type of psychiatric diagnosis; psychosis; psychotic drive
1. Explicit definition of ethnicity not given.
2. “Ethnic origin” indicated but unclear how this was ascertained in the individuals’ medical records.

148 Chronic Diseases in CanadaVol 28, No 4, 2008
T Gadalla, PhD (1)
Abstract
Mood disorders are more prevalent in individuals with chronic physical illness compared to individuals with no such illness. These disorders amplify the disability associated with the physical condition and adversely affect its course, thus contributing to occupational impairment, disruption in interpersonal and family relationships, poor health and suicide. This study used data collected in the Canadian Community Health Survey, cycle 3.1 (2005) to examine factors associated with comorbid mood disorders and to assess their association with the quality of life of individuals living in Ontario. Results indicate that individuals with chronic fatigue syndrome, fibromyalgia, bowel disorder or stomach or intestinal ulcers had the highest rates of mood disorders. The odds of having a comorbid mood disorder were higher among women, the single, those living in poverty, the Canadian born and those between 30 and 69 years of age. The presence of comorbid mood disorders was significantly associated with short-term disability, requiring help with instrumental daily activities and suicidal ideation. Health care providers are urged to proactively screen chronically ill patients for mood disorders, particularly among the subgroups found to have elevated risk for these disorders.
Key words: Ontario, mood disorders, chronic diseases, quality of life, short-term disability
Author References
1 Faculty of Social Work at the University of TorontoCorrespondence: Tahany Gadalla, Assistant Professor, Faculty of Social Work/University of Toronto, 246 Bloor Street West, Toronto, Ontario, Canada M5S 1A1, Tel: (416) 946-0623, Email: [email protected]
Introduction
Mood disorders (major depressive disorder, bipolar disorder, mania or dysthymia) are the most prevalent of all mental disorders. One in 7 adults (13.4%) living in Canada reported symptoms that met the criteria for a mood disorder at some point in their lives and about 5.3% of the Canadian population aged 15 years and over were identified as suffering from a mood disorder in 2002.1 The burden of depression to individuals and societies is such that the World Health Organization has projected that by the year 2020, unipolar major depression will be the leading cause of disability-adjusted life years (DALYs) after cardiovascular disease.2 Evidence
that among Canadians who had inflam-matory bowel disease in 2002, 16.3% suffered from depression.
High prevalence of mood disorders among individuals with chronic physical condi-tions represents a significant burden to individuals and society. At the individual level, they can lead to occupational impair-ment, disruption in interpersonal and family relationships, poor health and suicide.6 Existing research suggests that major depression interacts with physical illness to amplify the disability associated with many physical conditions as well as adversely affect the course of physical illnesses.4 Individuals with physical health problems often experience anxiety or depression, which affects their response to the treatment of their physical illness. On the other hand, individuals with mental illness can develop physical symptoms and illnesses, such as weight loss and biological disturbances associated with eating disorders. Most of the research done in this field focuses on the impact of depression on quality of life after adjusting for the severity of physical illness (e.g. Vali and Walkup7 and Ades, et al.8) rather than comparing the impact of comorbid mental disorders in individuals with and without physical illness. These studies usually find that depression adversely affect patients’ quality of life after adjusting for severity of physical illness. Ferketich, et al.9 analyzed data collected in a National longitudinal study and found that depres-sed men had a 71% greater risk of developing heart disease and were 2.34 times more likely than non-depressed men
Association of comorbid mood disorders and chronic illness with disability and quality of life in Ontario, Canada
exists that the prevalence of mood disorders in individuals with chronic physical illness is noticeably higher compared to individuals with no such illness. According to the 2002 Mental Health and Well-being Survey, an indivi-dual with a chronic physical condition was twice as likely as an individual without such a condition to have a mood disorder.3 Depressive disorders often accompany chronic illnesses such as heart disease, stroke, Parkinson’s disease, cancer and HIV/AIDS (Evans et al, 2005).4 For example, reported prevalence rates of depression range from 17% to 27% in patients with cardiac disease, from 22% to 29% in patients with cancer and from 9% to 26% in patients with diabetes.4 Fuller-Thomson and Sulman5 reported

Vol 28, No 4, 2008Chronic Diseases in Canada 149
to die from this condition. Simon, et al.10 compared SF-36 subscale ratings on a clinical sample of depressed patients with and without chronic physical illness and concluded that depressive disorders and chronic physical illness produced differing patterns of impairment, and that comorbid depressive disorders created a substantial burden of additional functional impairment. Katon11 estimated medical costs for patients with major depression to be almost 50% higher than the costs of chronic physical illness alone. The associations between other mood disorders such as bipolar disorder or dysthymia and physical illness and their effect on the quality of life of the physically ill have not been examined.
At the national level, comorbid mood disorders can adversely affect the economy through reduced productivity and higher health care costs. Several studies have investigated the impact of comorbid depressive disorders on the cost of health services using patients with specific physical conditions such as arthritis.7 In a study of the economic burden of mental health in Canada, Stephens and Joubert12 estimated work-related productivity losses due to mood disorders alone to be $4.5 billion annually. Little is known about the impact of comorbid mood disorders on individuals’ productivity, daily functioning and quality of life in the Canadian population. Further, the cost to society of the comorbidity of mental disorders and physical conditions requires further investigation.
The widely reported under-treatment of mood disorders magnifies and reinforces their adverse impact on the lives of the physically ill and society as a whole. Although effective interventions for the treatment of mood disorders are available, most individuals who suffer from them fail to consult health professionals. Strakes, et al.13 reported that only 40% of people with probable depression in Atlantic Canada consulted a general practitioner or a mental health specialist about their condition. Despite a universal coverage of physician and hospital services in Canada, only 56.4% of Canadian women identified as having at least one major depressive episode (MDE) in 2002 reported accessing
health care resources in the 12 months prior to the interview.14 Among Canadians with inflammatory bowel disease who were identified as having major depression, only 40% were using antidepressants, and between one third and one half were not consulting any mental health profes-sionals.5 Identification of the socio-demographic characteristics of physically ill individuals at high risk of having mood disorders provides health care providers with essential knowledge for targeting high risk individuals leading to early diagnosis and intervention.
Most studies that explored the comorbidity of mental disorders and physical conditions have used clinical samples, which may lead to biased results. Thus, researchers have highlighted the role of population-based studies in determining the extent and nature of comorbidity between mental disorders and physical illness and the impact of such comorbidity on the afflicted individuals and the society at large. To date, only a few studies which have examined the comorbidity between mental disorders and physical conditions have been conducted in community based samples. In addition, most of these studies used self-reported diagnosis of physical conditions or self-reported symptoms of mental disorders. The present investigation was based on the most recent data available on a representative sample of individuals living in the province of Ontario, Canada. This investigation had two objectives. First, it examined the relationship between socio-demographic characteristics and mood disorders in Ontarians with chronic physical conditions. Second, it assessed short-term disability, limitations in activities of daily living and suicidal ideation in individuals with comorbid mood disorders compared with those with chronic physical illness only.
Methods
Sample
This research was based on a subset of the data collected by Statistics Canada in cycle 3.1 of the Canadian Community Health Survey and are available for public use.15
The survey was conducted in 2005 and employed a multistage stratified cluster probability sampling in which dwelling was the final sampling unit. The sample was stratified by province, and urban versus rural regions, within province. The survey sample represented approximately 98% of the Canadian population aged 12 or older who resided in private dwellings in the ten provinces and the three territories. Persons living on Indian Reserves, residents of institutions, full-time members of the Canadian Armed Forces and residents of certain remote regions were excluded from the survey. Fifty percent of the respondents were inter-viewed face-to-face using the computer-assisted personal interviewing (CAPI) method and 50% were interviewed by telephone using the computer-assisted telephone interviewing (CATI) method. Cycle 3.1 of the CCHS included a list of common questions to be used in all provinces and a number of lists of optional questions for provinces to select among them. This was done to allow each province to select questions related to their particular needs and priorities. Consequently, not all variables are available for all provinces. Data collected from Ontario participants included all the variables required for the present analysis. Hence, Ontario data were used in this research.
Measures
Participants were asked the following question, “Now I’d like to ask about certain chronic health conditions which you may have. We are interested in long-term conditions, which are expected to last or have already lasted 6 months or more and that have been diagnosed by a health professional.” The list of chronic physical illnesses included food allergies, other allergies, asthma, fibromyalgia, arthritis or rheumatism, back problems, high blood pressure, migraine headaches, chronic bronchitis, emphysema, pulmonary disease, diabetes, epilepsy, cancer, heart disease, bowel disorder, cataracts, glaucoma, thyroid condition, chronic fatigue syndrome, mood disorders (such as major depressive disorder, bipolar disorder, mania or dysthymia), and anxiety disorders (such

150 Chronic Diseases in CanadaVol 28, No 4, 2008
as phobia, obsessive-compulsive disorder or panic disorder).
Two variables were used to measure short-term disability: the number of disability days during the two weeks prior to the interview and whether the participants required help with their usual daily activities. Survey participants were asked about the number of days they stayed in bed for all or most of the day due to illness or emotional/mental health during the two weeks prior to the interview. They were also asked a series of questions about whether they needed help with instru-mental activities of daily living such as preparing meals, shopping for groceries and other necessities, getting to appoint-ments, doing everyday housework, personal care or moving about inside their home because of a long-term health condition. A long-term health condition was defined as a condition that is expected to last or has lasted 6 months or more. In addition, survey participants who live in Ontario were asked whether they had considered suicide in the 12 months prior to the interview.
Socio-demographic characteristics and health indicators used in this research included gender, age group (12 to 29 years, 30 to 49 years, 50 to 69 years, 70 years or older), marital status (married/common law versus divorced/separated/widower/never married), immigration status (immi-grant versus Canadian born), education level (less than secondary school degree, secondary school graduate, some post secondary education and post secondary graduate) and income level (low 30%, middle 40% and upper 30% of the income distribution in Ontario). The income level variable was derived by Statistics Canada to measure the participant’s household income relative to the household incomes of all participants living in the province and having the same household size.15 First, an adjusted ratio of the participant’s total household income to the low-income cutoff corresponding to their household size and community size was calculated. The adjusted ratios were then divided into deciles, i.e. 10 categories including approxi-mately the same percentage of residents.
Data analyses
Prevalence of comorbid mood disorders among individuals with chronic physical conditions was calculated. Expected pro-babilities of random co-occurrence of chronic physical conditions and mood disorders were calculated and compared with the observed probabilities. Chi-square tests were used to assess bivariate relation-ships between prevalence of comorbid mood disorders and socio-demographic characteristics in individuals with chronic physical illness as well as bivariate relation-ships between mood disorders and quality of life. Logistic regression analysis was used to identify socio-demographic factors associated with a high risk of having mood disorders in individuals with chronic physical illness. Sampling weights were rescaled and used in all analyses. Rescaling the weights to have an average of one has two advantages. First, it takes into account the unequal probabilities of selection of survey participants and adjusts the sample results to the demographic composition of Ontario population so that the results represent the population of Ontario and not just the sample itself. Second, it keeps the total sample size unchanged to guard against inflating the sample size for hypothesis testing.
Results
Table 1 shows the prevalence of chronic physical illness and mood disorders by gender. Based on data presented in this table, the prevalence of mood disorders among men with chronic physical illness was 6.5% compared with 1.9% among men with no such illness. The prevalence of mood disorders among women with chronic physical illness was 10.5% com-pared with 3.8% among women with no chronic physical illness. Using the sampling weights published by Statistics Canada, it can be estimated that approximately 2 557 000 men and 3 170 000 women of Ontario residents were living with chronic physical illness in 2005. Among them, approximately 165 000 men and 334 000 women had been diagnosed with at least one mood disorder.
As shown in Table 1, 10 105 of all men (49.3%) were diagnosed by a health professional as having a chronic physical illness and 4.1% of all men were diagnosed as having a mood disorder. If these condi-tions were independent, the probability that they co-occur by chance alone would be 2.02% (49.3% x 4.1%). However, the observed probability of their co-occurrence was 3.18% indicating an association bet-
TABLE 1Prevalence of chronic physical illness and mood disorders by gender,
Ontario 2005 (sample size = 41 701)
Mood disorders
Chronic physical condition
TotalYes
Number (%)No
Number (%)
Men Yes 652 (6.5%) 198 (1.9%) 850 (4.1%)
No 9 453 (93.5%) 10 191 (98.1%) 19 644 (95.9%)
Total 10 105 10 389 20 494
Women Yes 1 319 (10.5%) 334 (3.8%) 1 653 (7.8%)
No 11 209 (89.5%) 8 345 (96.2%) 19 554 (92.2%)
Total 12 528 8 679 21 207
Total Yes 1 971 (8.7%) 532 (2.8%) 2 503 (6.0%)
No 20 662 (91.3%) 18 536 (97.2%) 39 198 (94.0%)
Total 22 633 19 068 41 701

Vol 28, No 4, 2008Chronic Diseases in Canada 151
ween the two conditions. Similarly, the observed probability of chronic physical illness and mood disorders in women was found to be 6.22% compared with a probability of 4.61% of the two conditions occurring by chance alone.
The prevalence rates of comorbid mood disorders among individuals with different demographic and health characteristics are presented in Table 2. Higher prevalence of mood disorders were found among women, individuals 30 to 49 years of age, lower income groups, Canadian-born, and indivi-duals who were divorced, separated, widowed or never married. The highest proportions of individuals with mood disorders were found among individuals who were diagnosed with chronic fatigue syndrome, fibromyalgia, bowel disorder, stomach or intestinal ulcers, chronic bronchitis or those suffering from the effects of a stroke.
Bivariate chi-square tests indicated that the prevalence of comorbid mood disorders was significantly associated with the individual’s gender, age, marital status, immigration status, and education and income levels. Hence, these variables were used in a logistic regression analysis to predict presence of mood disorders in the physically ill. Logistic regression analysis results shown in Table 3 indicate that the odds of having a mood disorder were higher among women, the single, those living in poverty, the Canadian-born and those between 30 and 69 years of age. Chronically ill woman were 65% more likely than chronically ill men to have mood disorders. The odds of suffering from mood disorders among chronically ill individuals 30 to 49 years of age were almost three times higher than the odds for individuals 70 years or older. Those who were 50 to 69 years old had more than twice the odds of suffering from mood
disorders than individuals 70 years of age or older. The odds of having mood disorders for those in the lower 30% of income distribution were twice the odds of high income individuals. Respondents who were divorced, separated, widowed or never married were 50% more likely to have mood disorders than those with partners. Education level was not a significant predictor of mood disorders.
Table 4 includes a comparison of quality of life measures in individuals with chronic physical conditions with and without mood disorders. Data presented in this table show that 41.7% of men with mood disorders had disability days in the two weeks prior to the interview, compared with only 17.7% without mood disorders (p < 0.0005). Forty-four percent of women with mood disorders reported disability days compared with 22.0% without mood disorders (p < 0.0005). Thirty-six percent
TABLE 2Prevalence of mood disorders in individuals with chronic conditions by socio-demographic characteristics,
Ontario 2005 (sample size = 22 633)
Characteristic Total Number% With mood
disorder Characteristic Total Number% With mood
disorder
Men 10 105 6.5% Chronic condition:
Women 12 528 10.5% Food allergies 2 108 11.7%
Age group, years: Other allergies 7 636 10.9%
12 to 29 3 721 8.1% Asthma 3 325 11.4%
30 to 49 7 512 10.9% Fibromyalgia 637 26.5%
50 to 69 7 699 8.7% Arthritis/rheumatism 7 140 10.9%
70+ 3 701 4.9% Other back problems 8 089 11.7%
Married/common law 14 803 7.6% High blood pressure 6 365 8.1%
Single/Sep/Div/Widowed 7 811 10.8% Migraine headaches 4 721 14.1%
Education level: Bronchitis 1 009 16.9%
Less than second. school 4 975 8.6% Diabetes 2 014 9.3%
Second. school grad. 3 670 9.1% Epilepsy 215 13.5%
Some post-secondary 1 621 10.8% Heart disease 1 997 9.8%
Post-secondary graduate 11 571 8.4% Cancer 621 10.1%
Immigrant 6 421 7.2% Stomach/intest. ulcers 1 296 17.0%
Canadian-born 15 500 9.4% Effects of smoke 476 15.5%
Income within Ontario: Bowel disorder 1 672 17.3%
Low 6 127 11.2% Cataracts 1 861 8.2%
Middle 7 727 8.6% Glaucoma 610 6.9%
High 5 490 6.6% Thyroid condition 2 183 10.9%
Chronic fatigue syndrome 543 37.2%

152 Chronic Diseases in CanadaVol 28, No 4, 2008
of chronically ill men and 43.7% of chroni-cally ill women with mood disorders reported needing help in activities of their daily living such as preparing meals, getting to appointments, doing housework, personal care or moving about inside their home. In contrast, only 15.2% of men and 25.1% of women with no comorbid mood disorders reported experiencing such limitations. Data in Table 4 also show that 14.9% of chronically ill men with mood disorders reported having suicidal thoughts
in the 12 months prior to the interview compared with only 1% of those without a mood disorder (p < 0.0005). In women, the percentages were 11.7% in those with a mood disorder compared to 0.7% without a mood disorder (p < 0.0005). Using the sampling weights published by statistics Canada, it can be estimated that among Ontarians with comorbid mood disorders and chronic physical illness in 2005, approximately 24 000 men and 39 000 women had suicidal thoughts.
Discussion
The rates of mood disorders in chronically ill individuals living in Ontario in 2005 ranged between 7.9% in those with cataracts and 37.2% in those with chronic fatigue syndrome compared with 2.8% in individuals with no chronic physical condi-tions. The prevalence of mood disorders in chronically ill men was more than three-fold than in men with no chronic illness. In women with one or more chronic physical condition, it was almost three-fold than in non chronically ill women. Prevalence of mood disorders were highest among individuals who had been diag-nosed as having fibromyalgia, bowel disorder, stomach or intestinal ulcers, chronic bronchitis or those suffering from the effects of a stroke. Rates of mood disorders in individuals with heart disease, cancer and diabetes observed in this study were lower than those reported in the literature.4 This is not surprising since this is a community sample that included those individuals with cancer in remission. Individuals with comorbid mood disorders were more likely to be female, middle aged, living in poverty, without a partner and born in Canada. These characteristics are similar to those of individuals with depression in the general population.16
Findings of this investigation showed a highly significant impact of the presence of
TABLE 3Socio-demographic factors associated with comorbid mood disorders
among individuals with chronic physical illness, Ontario 2005(sample size = 19 213)
Variable Odds ratio (95% CI) p-value
Female 1.65 (1.49, 1.84) < 0.0005
Age group, years:
12 to 29 1.42 (1.14, 1.76) < 0.0005
30 to 49 2.89 (2.40, 3.49) < 0.0005
50 to 69 2.31 (1.90, 2.79) < 0.0005
70+ (reference) −
Single/Sep/Div/Widowed 1.51 (1.35, 1.70) < 0.0005
Married/common law (reference) −
Immigrant 0.64 (0.57, 0.73) < 0.0005
Canadian-born (reference) −
Income within Ontario:
Low 1.96 (1.70, 2.25) 0.002
Middle 1.38 (1.20, 1.58) < 0.0005
High (reference) −
TABLE 4Relationship between comorbid mood disorders and quality of life of individuals with
chronic physical conditions by gender, Ontario 2005 (sample size = 22 633)
Mood disorder
Chi-square (df = 1) p-valueYes
number (%)No
number (%)
Men
Disability days in last 2 weeks ≥ 1 day 272 (41.7%) 1 671 (17.7%) 232.4 < 0.0005
Need help with daily activities 234 (35.9%) 1 438 (15.2%) 189.1 < 0.0005
Suicidal thoughts 97 (14.9%) 95 (1.0%) 629.7 < 0.0005
Total – Men 652 9 453
Women
Disability days in last 2 weeks ≥ 1 day 575 (43.6%) 2 469 (22.0%) 304.0 < 0.0005
Need help with daily activities 576 (43.7%) 2 814 (25.1%) 205.2 < 0.0005
Suicidal thoughts 154 (11.7%) 83 (0.7%) 760.3 < 0.0005
Total – Women 1 319 11 209

Vol 28, No 4, 2008Chronic Diseases in Canada 153
mood disorders on all measures of quality of life for the chronically ill. The presence of mood disorders was associated with more than double the risk of short-term disability for men and almost double the risk for women. It was also associated with double the proportions of chronically ill men and women requiring help with their daily living activities. In addition, the presence of comorbid mood disorders was associated with an increase in the propor-tion of those having suicidal ideation – 15-fold in men and 17-fold in women.
A bidirectional relationship between mood disorders and chronic physical illness has been proposed that may explain their high comorbidity.4 A diagnosis of a disabling physical illness and the associated decline in physical health may cause enough distress to trigger a depressive episode in vulnerable persons. On the other hand, research is discovering that depression itself may act as a risk factor for a variety of chronic illnesses. Goodman and Whitaker (2002)17 noted that patients with major depression had higher rates of unhealthy behaviors such as smoking and overeating, which may lead to higher incidence of diabetes and heart disease. Depression has also been shown to be an independent risk factor for type 2 diabetes mellitus.18 Perretta, et al.19 suggested that depression and mania may act as risk factors for HIV infection by promoting high-risk behaviors. Large population studies indicate that depressed mood or stressful life events may increase the risk of cancer.4 In addition, the presence of depression can hinder compliance to treat-ment and weaken cognitive function, thus, adversely affecting patients’ prognosis and increasing their morbidity.
Ample research has focused on trying to understand the mechanisms of the relation-ship between depression and cardiovascular disease. In addition to promoting unhealthy behaviors and noncompliance with cardiac rehabilitation and medical regimens, some of the possible biologic mechanisms that may explain the increased risk associated with depression in heart disease patients
are that depressed patients have decreased heart rate variability,20 increased platelet aggregation21 and higher levels of inflamma-tory risk markers.22 Other mood disorders may also act as risk factors for physical ill-nesses and/or adversely affect their prog-nosis; however, the underlying mechanisms are not as extensively researched as those of depression.
This study has a number of limitations. The identification of individuals as having mood disorders and/or chronic physical illness was not done by clinicians. The survey did not include individuals living in nursing homes, mental institutions or chronic care hospitals, thus, the data underestimate the prevalence of both mood disorders and chronic illnesses. Participants were not asked about each mood disorder separately. Instead, major depressive disorder, bipolar disorder, mania or dysthymia were combined in one question. Consequently, the prevalence and impact of each of these disorders on quality of life cannot be inferred. Further, the cross-sectional nature of the data precluded an examination of the temporal sequence of onset of mood disorders and chronic physical conditions. Given these limitations, the present study determined the prevalence and correlates of mood disorders among individuals with physical chronic illness using the most up-to-date data available on a representative sample of Canadians living in Ontario. In addition, survey respondents were asked to only report mood disorders and physical condi-tions that had been diagnosed by a health professional. To the authors’ knowledge, this is the first study to examine the associations between comorbid mood disorders and short-term disability, limita-tions of daily activities and suicidal ideation in this population.
Results of this study indicate that detecting and treating depression is as important as treating the physical illness for maintaining quality of life and helping the individual cope with and manage the physical illness. The identification of subgroups of physi-cally ill individuals who are at high risk of
suffering from mood disorders provide clinicians with important knowledge for targeting these vulnerable groups for the purpose of early diagnosis and interven-tion. Health care providers are urged to proactively screen chronically ill patients for mood disorders, particularly among the subgroups found to have elevated risk for these disorders. Based on a survey done by the Depression and Bipolar Support Alliance,23 it was concluded that most primary care physicians lacked knowledge about mood disorders in general and bipolar disorder in particular. Findings of this study stressed the importance of providing physicians with more information about the connection between mental and physical health and of including the treatment of the patient’s mood disorders as an integral part of the treatment plan of the chronic condition.
It is also imperative to encourage indivi-duals with physical illness to communicate their psychological symptoms to their health care providers and not to accept such symptoms as natural consequence to their physical condition. Barriers to seeking help for mental health, whether perceived or real, should be recognized and removed. The collection of data on cultural and social factors, such as beliefs about stigma and shame in association with mental illness and trust in health care providers, is essential for developing innovative and creative strategies for promoting mental health. Culturally appropriate psycho-educational programs could help Canadians learn to recognize the symptoms of mood disorders and be aware of the importance and potential benefits of treatment. Such programs could promote self-identifica-tion and lead to early diagnosis and intervention.
Acknowledgements
This research was based on data collected and made available by Statistics Canada. The views and opinions expressed do not represent the views of Statistics Canada.

154 Chronic Diseases in CanadaVol 28, No 4, 2008
References
1. Statistics Canada. Canadian Community
Health Survey, Mental Health and Well
Being. Public-Use Microdata Documentation.
Ottawa: Statistics Canada, 2002.
2. Michaud CM, Murray CJ, Bloom BR.
Burden of disease: Implications for future
research. JAMA. 2001;285:535-539.
3. Public Health Agency of Canada. The
Human Face of Mental Health and Mental
Illness in Canada. Ottawa: Public Health
Agency of Canada, 2006. Cat. No. HP5-
19/2006E.
4. Evans DL, Charney DS, Lewis L, Golden
RN, Gorman JM, Krishnan KR, Nemeroff
CB, Bremner JD, Carney RM, et al. Mood
disorders in the medically ill: Scientific
review and recommendations. Biol
Psychiatry. 2005;58:175-189.
5. Fuller-Thomson E, Sulman J. Depression
and inflammatory bowel disease: findings
from two nationally representative
Canadian surveys. Inflamm Bowel Dis.
2006;12(8):696-706.
6. Olfson M, Klerman GL. Depressive symp-
toms and mental health service utilization
in a community sample. Soc Psychiatry
Psychiatr Epidemiol. 1992;27(4):161-167.
7. Vali F, Walkup J. Combined medical and
psychological symptoms: Impact on
disability and health care utilization of
patients with arthritis. Med Care. 1998;
36:1073-1084.
8. Ades P, Savage P, Tischler M, Poehlman E,
Dee J, Niggel J. Determinants of disability
in older coronary patients. Am Heart J.
2002;143:151-156.
9. Ferketich A, Schwartzbaum J, Frid D,
Moeschberger M. Depression as an ante-
cedent to heart disease among women and
men in the WHANES I study. National
Health and Nutrition Survey. Arch Intern
Med. 2000;160:1261-1268.
10. Simon G, Von Kroff M, Rutter C, Paterson
D. Treatment process and outcomes for
managed care patients receiving new anti-
depressant prescriptions from psychiatrists
and primary care physicians. Arch Gen
Psychiatry. 2001;58:395-401.
11. Katon WJ. Clinical and health services
relationships between major depression,
depressive symptoms and general medical
illness. Biol Psychiatry. 2003;54:216-226.
12. Stephens T & Joubert N. The economic
burden of mental health problems in Canada.
Chronic Dis Can. 2001;22(1):18-23.
13. Starkes J, Poulin C, Kisely S. Unmet need
for the treatment of depression in Atlantic
Canada. Can J Psychiatry. 2005;50:580-90.
14. Gadalla TM. Comparison of users and non-
users of mental health services among
depressed women: A National Study.
Women&Health. 2008;47(1):1-19.
15. Statistics Canada. Canadian Community
Health Survey, Cycle 3.1, 2005. Public-Use
Microdata Documentation. Ottawa: Statistics
Canada, 2006.
16. Patten SB. Incidence of major depression
in Canada. Can Med Assoc J. 2000;
163:714-715.
17. Goodman E, Whitaker R. A prospective
study of the role of depression in the
development and persistence of adult
obesity. Pediatrics. 2002;110:497-504.
18. Kawakami N, Takatsuka N, Shimizu H,
Ishibashi H. Depressive symptoms and
occurrence of type 2 diabetes among
Japanese men. Diabetes. 1999;22:1071-1076.
19. Perretta P, Akiskal HS, Nisita C, Lorenzetta
C, Zaccagnini E, Della Santa M, Cassano
GB. The high prevalence of bipolar II and
associated cyclothymic and hyperthymic
temperaments in HIV-patients. J Affect
Disord. 1998;50:215-224.
20. Gormen JM, Sloan RP. Heart rate variability
in depressive and anxiety disorders. Am
Heart J. 2000;140(4 suppl):77-83.
21. Whyte E, Pollock B, Wagner W, Mulsant B,
Ferrel R, Mazumdor S, Reynolds C 3rd.
Influence of serotonin-transporter-linked
promoter region polymorphism on the
platelet activation in geriatric depression.
Am J Psychiatry. 2001;158:2074-2076.
22. Miller GE, Stetler CA, Carney RM,
Freedland KE, Banks WA. Clinical
depression and inflammatory risk markers
for coronary artery disease. Am J Cardiol.
2002;90:1279-1283.
23. Depression and Bipolar Support Alliance
(2002). General Public Survey (Report).
Chicago, IL: DBSA.

Vol 28, No 4, 2008Chronic Diseases in Canada 155
SB Patten, MD, PhD (1); JVA Williams, MSc (1); C Mitton, MSc (2)
Abstract
Costing studies are central to health policy decisions. Available costing estimates for mood and anxiety disorders in Canada may, however, be out of date. In this study, we estimated a set of direct health care costs using data collected in a provincial telephone survey of mood and anxiety disorders in Alberta. The survey used random digit dialing to reach a sample of 3394 household residents aged 18 to 64. A telephone interview included items assessing costs without reference to whether these were incurred by the respondent, government or a health plan. The survey interview also included the Mini Neuropsychiatric Diagnostic Interview (MINI). Costs for antidepressant medications appear to have increased since the last available estimates were published. Surprisingly, most medication costs for antidepressants were incurred by respondents without an identified disorder. Also, an unexpectedly large proportion of medication costs were for psychotropic medications other than antidepressants and anxiolytic-sedative-hypnotics. These results suggest that major changes have occurred in the costs associated with antidepressant treatment. Available cost-of-illness data may be outdated, and some assumptions made by previous studies may now be invalid.
Key words: Cross-sectional studies, Depressive Disorders, Costs and Cost Analysis
Author References
1 University of Calgary, Department of Community Health Sciences, Calgary, Alberta2 Health Studies, University of British Columbia, Kelowna, British ColumbiaCorrespondence: Scott B. Patten, University of Calgary, Department of Community Health Sciences, 3330 Hospital Drive NW, Calgary, Alberta T2N 4N1, Tel: (403) 220-8752, Email: [email protected]
Background
Depressive disorders present an important challenge to population health.1 According to the Global Burden of Disease Project, unipolar major depression is the 4th leading contributor to disease burden world-wide, ranking second in developed countries such as Canada.2 The impact of this condition on population health relates partially to its high prevalence: approxi-mately 5% of Canadians experience an episode of major depression in any given year.3 However, its impact is magnified by a peak prevalence in the 25-44 year age group4 which is a critical period for education, establishment of relationships and economic productivity. Major depres-sion is also a recurrent condition, and one that is frequently associated with psychia-tric and medical comorbidity.5,6 All of
available estimates for Europe.9 However, the approach taken to assess some costing elements was crude. For example, in the assessment of medication costs, treated prevalence was estimated using a formula that began with administrative data for physician visits. The estimated number of people making visits for depression was multiplied by the proportion of antidepres-sant medications prescribed nationally in specific antidepressant categories, and in turn, by the average costs of prescriptions in those categories. This approach assumes that the total cost can be conceptualized as the treated prevalence multiplied by the cost per treated person. The approach seems reasonable on the surface, but does not consider that antidepressant treatment is often continued long after the remission of depressive episodes.10
Stephens and Joubert11 estimated the total burden of major depression and distress in Canada in 1998, also using data from a variety of sources. Their overall cost estimate was $14.4 billion. Their analysis was based partially on data from the National Population Health Survey (NPHS) and partially on data collected by the 1998 Economic Burden of Illness in Canada (EBIC) project (http://www.phac-aspc.gc.ca/publicat/ebic-femc98/index.html). All of the data on medication costs came from EBIC. In turn, the EBIC estimates were taken from a cost tracking database at the Canadian Institute for Health Infor-mation (CIHI) containing cost estimates from a private-sector company: IMS Health Canada. This approach is useful because IMS Health Canada databases can identify both the total volume of medication sales and the proportion of treatment recom-
Costs associated with mood and anxiety disorders, as evaluated by telephone survey
these factors tend to magnify its impact on population health. Finally, major depres-sion has an impact on mortality.7
Around the world, a variety of costing studies for depressive disorders have been carried out. Typically, the goal of these studies has been to estimate overall costs, including direct and indirect treatment costs. Population-based costing studies typically use data from a variety of sources such as government reports, administrative data and national surveys. This is because data collected from any particular source (e.g. a national survey) are unlikely to be comprehensive enough for detailed costing.
Recently, Thomas and Morris8 published cost-of-illness estimates for depression in England. Their study integrated data from a large number of sources and provides what has been considered the best

156 Chronic Diseases in CanadaVol 28, No 4, 2008
mendations for specific indications. According to EBIC, $108 million was spent on drugs for anxiety states, and $252 million, for depressive disorders. However, this analysis is now 10 years old, and some of its estimates are nearly 15 years old. The ensuing period of time has seen increasing recognition of major depression as a health problem, likely diminishing stigma related to the condition and the emergence of new pharmacological and non-pharmacological treatments.
In 2003, sponsored by the Alberta Mental Health Board, a provincial mental health survey was conducted in Alberta, called the Alberta Mental Health Survey.12 In 2004 another initiative, sponsored by Alberta Health and Wellness and Administered by the Institute of Health Economics, called the Alberta Depression Initiative, was established. As a component of this latter initiative, a second provincial telephone survey focusing on mental health was carried out in the following year, this time with an emphasis on depression. Some of the survey results are relevant to future costing studies for mood and/or anxiety disorders in Canada and are summarized in this report.
Methods
Survey Data Collection
Alberta is a Canadian province with a popu-lation of 3.3 million residents, dispersed over an area of 661 190 km2. Telephone survey methods were the most feasible strategy for obtaining an approximately representative sample in this geographically dispersed population. Approximately 2/3 of the Alberta population resides in two cites: Edmonton and Calgary. The sampling pro-cedure was stratified so that 1/3 of the sample would come from each of these cities, with the balance coming from remaining rural areas. Data collection was restricted to household residents between the ages of 18 and 64 with a residential telephone line.
Data collection was carried out by the population survey unit of the Quality, Safety and Health Information (QSHI)
portfolio in the Calgary Health Region (www.calgaryhealthregion.ca) during 2005. A listing of provincial, residential telephone numbers was initially sampled and the last digit was substituted with a random integer in order to increase coverage of unlisted numbers13,14 and to avoid bias that might be introduced if households with unlisted numbers differed from those with listed numbers. When a household was reached, a pseudo-random procedure, the “last birthday method” was used to randomly select a single subject from the household. As many as nine call-backs were made in an effort to reach all sampled individuals. These calls were distributed over working hours, evening and weekends.
The Mini Neuropsychiatric Interview (MINI), a brief structured diagnostic inter-view,15,16 was used as a diagnostic indicator for Major Depression (MD) and a set of other common mood and anxiety disorders. For major depressive episodes, past-14-day prevalence was assessed (essentially, the point prevalence for this disorder), for dysthymia, past-2-year prevalence was assessed. For panic disorder, agoraphobia, generalized anxiety disorder and social phobia, current prevalence was also assessed. Since it has been shown that differences between survey instruments often relate to the role of “clinical significance” probes in the scoring algorithms,17 we incorporated an interference item asking respondents whether their psychiatric symptoms inter-fered with their life. Episodes were considered clinically significant if respondents reported “a lot” of interference.
A pharmacoepidemiology module and a module designed to identify non-pharmaco-logical treatment were also included in the interview. The pharmacoepidemiology module operated with a cyclical item-flow structure, initially asking about medications taken for the treatment of broadly defined but relevant symptoms (“Do you currently take any prescription medications for anxiety, depression, stress, energy levels, sleeping, pain management, fibromyalgia or migraine headaches?”), and then looping through each reported medication with a series of items inquiring about the number and size of tablets, reasons for use
of the medication and duration of use. Respondents were prompted to report information directly from their pill bottle labels to ensure accuracy of this information. Dosage was determined by combining information about the size(s) and number of relevant tablets or capsules taken, including pro re nata (prn) schedules. The dosages were recorded in milligrams per day. The survey interview also included items evaluating the frequency of use of health services. These items were typically paired, with an initial item asking about use of the service and a second quantifying the frequency of use. For example, one item asked: “In the past 6 months have you consulted with a specialist physician other than a general practitioner, family doctor, emergency room physician or psychiatrist about your health?” If the answer was “yes” this was followed by “How many times?” Similar items assessed visits with family physicians, psychiatrists, psychologists and social workers, as well as emergency and walk-in clinic attendance, radiological procedures, and hospitalizations.
Costing Procedures
We obtained costs per milligram for each medication from the provincial drug plan costing guide (http://www.pao.gov.ab.ca/benefits/choice/prescription-drug-plan.pdf). In situations where various dosage forms had different per milligram costs, we calculated the cost for the lowest milligram dosage for each drug. The costs associated with generic preparations were used when a generic preparation was available, since pharmacists can substitute the lowest cost alternative when filling a prescription. When a person was taking more than one drug from a particular class, the costs were estimated in the same way for each drug, and the costs of individual drugs were added together. For ease of interpretation, the daily costs were multiplied by 365 to project an annual medication cost. This approach seemed reasonable since 80% of survey respondents who reported taking antidepressants in the survey reported taking them for longer than one year. The same procedure was followed for anxiolytic-sedative-hypnotic and antipsy-chotic medications.

Vol 28, No 4, 2008Chronic Diseases in Canada 157
For utilization of professional services, fee codes for the various professional groups were used. For physicians, fee codes from the Alberta Health Care Insurance Plan (AHCIP) were used. For family physicians, a basic code for an office visit not requiring a complete history and evaluation was used (fee code 03.03A). Emergency room visits were handled separately, using an estimated cost per single visit at twice the fee for a visit to a family physician. For specialist physicians, the fee code for a single referred consultation visit for 15 minutes was used (fee code 03.03FA). Fees associated with 45 minutes of clinical management time were used for psychiatrists (skill level code 08.19A) and for psychologists, fee schedules published by the Provincial Psychological Association were used.
It was not feasible to itemize radiological procedures and laboratory tests reported by survey participants. Instead, representat-ive mid-point costing estimates were identified for common or typical procedures within each category. In this study these were: a chest X-ray, basic CT of the head and a basic MRI of the head. The per procedure costing estimates used in the study came from a costing guide produced by the Calgary Health Region. This guide is intended to ensure cost recovery in research projects, including materials and supplies and personnel-related costs. Similarly, mean per diem costs associated with hospitalizations from across the province used estimates developed by the Calgary Health Region for administrative purposes. The documents from the Calgary Health Region were considered to be a reasonable source since the Region includes the city of Calgary, but also rural areas stretching southwest of the city to the border with British Columbia.
For each category, a cost projection to the total population was made. The weighted prevalence for the mood and/or anxiety disorder diagnostic category was multiplied by the total provincial population in the studied age range, the proportion using the specific procedure, treatment or service and by the mean cost associated with it to
produce a final cost estimate. Sampling weights were calculated as the inverse of an estimated selection probability within age and sex categories in each of the three sampling regions for the provincial popula-tion. The resulting weight was further adjusted by multiplying it by the ratio of the number of eligible residents in each household divided by the number of tele-phone lines going into the household. The weights were treated as relative weights in the analysis.
Results
In total, 18 113 telephone numbers were called. More than half of these were disqualified from the sample for the following reasons: 1663 households had no eligible residents, 329 were blocked calls, 846 reached only answering machines or voice mailboxes (i.e. no person could be contacted with call-backs), 1747 were business lines, 3333 were not in service, 1385 reached fax machines, 378 reached non-English-speaking households, 845 were never answered during the call-back protocols, 11 met with hostile interruptions and 79 were disqualified for miscellaneous reasons. There were 7497 calls that suc-cessfully reached eligible households. At the household level, there were 3443 refusals (45.9%). Of the 4054 households from which respondents could be selected, there were 635 individual refusals (15.7%). Of the 3419 consenting respondents, inter-views were completed in all but 25 (0.7%), so that 3394 interviews were completed. After checks for data completeness and accuracy, 45 records were removed from the data set because of concerns about data quality. The final analysis included data collected from the remaining 3345 individuals (82.5% of individuals who were invited to participate and provided adequate data). If the response rate is calculated using the number of eligible households in the denominator, however, it is 44.6%. Using the Marketing Research and Intelligence Association (MRIA) method of calculation (http://www.tpsgc-pwgsc.gc.ca/por/text/pebptel-intro-e.html), 7628
of the 18 113 can be classified as “out of scope” leading to a response rate of 31.9%.
There were 168 survey participants with a mood disorder (current major depression or dysthymia) according to the MINI, leading to a prevalence estimate of 4.6%. This estimate is consistent with existing litera-ture. The 30-day prevalence of major depression in the Canadian Community Health Survey, Mental Health and Wellbeing (CCHS 1.2) was 1.8%.4 The CCHS 1.2 did not assess dysthymic disorder, but a systematic review by Waraich estimated a past-year prevalence of approximately 2%.18 One hundred and ninety two respondents had one or more anxiety disorders, leading to a prevalence estimate of 6.3%. This is slightly higher than the CCHS 1.2 past-year estimate of anxiety disorder prevalence (4.7%),19 but the CCHS 1.2 did not assess generalized anxiety disorder, which has an annual population prevalence of 3.1% in the US.20 Most respondents with disorders had comorbid mood and anxiety disorders. Only 2.2% had a mood or anxiety disorder without having both. 4.1% had comorbid mood and anxiety disorders. Since the MINI is a brief screening instrument, its ability to distinguish between mood and anxiety disorders is questionable. The analysis therefore focussed on two groups: respon-dents with a mood or anxiety disorder (but not both) and respondents with a comorbid mood and anxiety disorder.
With respect to medication use at the time of the survey, 7.4% of the population reported taking an antidepressant, 3.1% reported taking a sedative hypnotic medi-cation and 1.5% took another medication potentially related to the management of mood disorders: mood stabilizers, psycho-stimulants or atypical antipsychotic medi-cations. Although the latter group of medications are pharmacologically distinct, they were grouped together in the subse-quent analysis because there were insuf-ficient numbers to examine these categories separately. It should also be noted that the question stems indicated that the medica-tions of interest were those taken for psychotropic purposes, and this category

158 Chronic Diseases in CanadaVol 28, No 4, 2008
would not include, for example, anticonvul-sant mood stabilizers taken for the treat-ment of epilepsy.
Of the 2.2% of the population with non-comorbid mood or anxiety disorders, 20.4% were taking one or more antidepressant medications. Of those with comorbid mood and anxiety disorders, 44.4% were taking one or more antidepressant medications. In the group with no detected mood or anxiety disorders, 5.6% were taking an antidepres-sant. The estimated mean annual cost for antidepressants in each of these groups is summarized in Table 1. At the time of the survey, there were 2 105 167 provincial residents in the 18 to 64 age range. The average cost per person multiplied by the estimated prevalence and number of people in the province in each diagnostic category led to a total cost estimate of $124 million for antidepressants. This included $7 million for people with a noncomorbid mood or anxiety disorder, $35 million for people with comorbid disorders and $83 million for those with no MINI-detected disorder.
Although the frequency with which anti-depressants were taken by respondents without detected mood or anxiety disorders was relatively low at 5.6%, and while the projected annual per person cost in this group was slightly lower than the group with MINI-detected disorders (see Table 1), the overall cost in this group was highest because the number of people in this category was the highest. This suggests that most of the costs associated with antidepressant treatment now occur in the continuation and maintenance phases10 of treatment since these respondents no longer met symptomatic criteria for mood or anxiety disorders. The result is in itself not necessarily surprising since acute treatment with antidepressants usually takes 6 to 8 weeks, whereas maintenance treatment lasting one year or longer is generally recommended, and indefinite treatment may be indicated in those with highly recurrent disorders.10 There are however, other possible explanations for this result, as discussed below.
A similar pattern was seen for sedative-hypnotic medications (see Table 1). In people with mood or anxiety disorders, the
frequency of use of these medications was much higher than that of respondents without these disorders. However, most people taking these medications did not have a mood or anxiety disorder. Hence, most of the costs occurred in the no-disorder group. The estimated total cost of sedative-hypnotic use in the population was $8 million, much lower than the cost of antidepressants.
A variety of other medications were reported by the survey respondents: lithium (n = 7), carbamazepine (n = 3), valproate (n = 5), gabapentin (n = 9), lamotrigine (n = 1), topiramide (n = 20), dexamphetamine (n = 6), chlorpromazine (n = 1), olanza-pine (n = 10), quetiapine (n = 8), clozapine (n = 2) and risperidone (n = 20). Ninety-two respondents reported taking one or more of these medications. Unfortunately, only 69 of these respondents (75%) were willing or able to provide dosage informa-tion. Considered as a group, an estimated 1.5% of the total population was taking one or more medications from this category. The frequency of use in respondents with non-comorbid mood or anxiety disorders was similar to that of the total population (see Table 1), but the frequency was much higher in the group with comorbid disorders (16.4%). Approximately 1% of the popula-tion without a mood or anxiety disorder was taking one of these medications – approximately consistent with the pre-valence of psychotic disorders in the population. The projected total cost was $38 million, $25 million of which was accounted for by the group with no detected disorder. These results suggest, however, that a sizable proportion of treatment costs for mood and anxiety disorders may now occur outside of the pharmaceutical classes traditionally believed to be most important in the treatment of mood and anxiety disorders: antidepressant medications and sedative-hypnotic medications.
Table 2 presents the costs associated with utilization of services provided by mental health professionals. The frequency with which the services of psychiatrists and psychologists were utilized was much higher in people with mood and anxiety disorders, especially in the comorbid category. Having a mood or anxiety
disorder was associated with a three-fold increase in these costs, whereas a more than eight-fold increase was seen in the comorbid group. However, most of the costs for psychologists occurred in the group with no MINI-defined disorder, suggesting that these professionals may often be engaged in treatment activities not specifically directed at these disorders, e.g. marital therapy. Table 3 presents the costs associated with service utilization for family physicians and specialist physicians other than psychiatrists. The respondents with mood and anxiety disorders were more likely to see a physician, and to have more visits. Both factors contributed to higher per-respondent costs in the group with mood and anxiety disorders.
Costing data for diagnostic tests are pre-sented in Table 4. In the case of radiological procedures, the frequency of testing (and hence, per-subject costs according to the procedures employed in this study) did not differ by disorder category. However, the proportion of subjects in the various sub-groups having these tests was higher in subjects with mood and anxiety disorders. As shown in Table 5, the costs associated with emergency room visits and hospitali-zations were also elevated in respondents having comorbid mood and anxiety disorders.
Conclusions
Many of the results presented here are consistent with an existing literature of costing studies for depressive disorders. They illustrate that costs associated with medication use and utilization of services are increased in people with these dis-orders. As expected, this was true both for measures of mental health care and for general medical care. An important inter-pretive issue is that mood disorders are strongly associated with long-term medical conditions,21-23 such that these increased costs may reflect an indirect effect of non-psychiatric conditions. When one considers that approximately 10% of the Canadian population live in Alberta, the results suggest a substantial increase in the costs of pharmacotherapy for depression since the publication of the 1998 EBIC. In the

Vol 28, No 4, 2008Chronic Diseases in Canada 159
EBIC, the total national costs for medica-tions for mood and anxiety disorders was only twice as high as that found in the province of Alberta alone. In other words, if one assumes that 10% of the $360 million estimated by the EBIC was spent in Alberta, the provincial estimate would be approximately $36 million; however, the current study indicates that the cost of antidepressant medications in Alberta may be between 3 and 4 times higher than that. The increase in cost is not unexpected, as both the number of retail prescriptions for medications and the average cost per prescription are increasing in Canada.24
Although antidepressants and sedative-hypnotic medications were the most frequently taken medications, an appreciable number of respondents reported taking other medications such as atypical anti-psychotics. These medications now appear to make a substantial contribution to total treatment costs. Future analyses should include costs for atypical antipsychotics, stimulants and mood stabilizers.
Another interesting finding is the high proportion of costs in the no-disorder
group. It should be emphasized that the MINI would not detect treated disorders that are in remission, so in some proportion of instances these costs may represent appropriate use of the medications. How-ever, it is likely that some of the medication use in the no-disorder group is inappro-priate (i.e. no disorder indicating treatment is present). Symptoms of depression and anxiety can occur in response to losses, threats and stressors. The Canadian health system is not well-structured for delivering the brief psychological interventions that would generally be appropriate in such cases. In Canada, primary mental health care is usually funded on a fee-for-service model. Primary care practices in Canada typically see large volumes of patients for brief visits. Antidepressants may some-times be prescribed inappropriately due to a lack of time or expertise on the part of primary care physicians. Similarly, the use of sedative-hypnotic and atypical anti-psychotic medications in the comorbid group may partially reflect poor access to non-pharmacologic treatments such as sleep hygiene and relaxation techniques. Finally, some proportion of medication use in this group may be due to treatment for
conditions other than mood and anxiety disorders. For example, antidepressants are frequently used for chronic pain and migraine prophylaxis.
The results may have important implica-tions for future costing studies. For example, the UK study discussed above8 used billing data to identify treated preva-lence, but people on long-term maintenance treatment may not have visits coded specifically for a mood or anxiety disorder. In fact, any approach that begins with prevalence data is likely to miss a large proportion of medication costs, since the treated disorders may be in remission and may also be missed in symptom-based prevalence measures used in surveys.
There are several limitations associated with this study. First, the study focused on psychotropic medication use. Since some chronic medical conditions are associated with mood and anxiety disorders, it is likely that increased costs associated with non-psychiatric procedures and treatments would occur in the subjects with mood and anxiety disorders. It was not considered feasible to record all medications being
TABLE 1Annual and six-month costs associated with medication use, by disorder category
Current mood or anxiety disorder
Current comorbid mood and anxiety
disordersNo current mood or
anxiety disorder
Prevalence 2.2% Prevalence 4.1% Prevalence 93.7%
Antidepressants % Utilizing 20.4 44.4 5.6
Mean cost/person Annual $800 $910 $754
6-month $400 $455 $377
Provincial total cost Annual $7,573,665 $34,868,074 $82,684,848
6-month $3,786,832 $17,434,037 $41,342,424
Sedative-hypnotics % Utilizing 3.9 24.0 2.2
Mean cost/person Annual −* $140 $98
6-month $70 $49
Provincial total cost Annual −* $2,894,450 $4,272,739
6-month $1,447,225 $2,136,370
Antipsychotics, mood stabilizers, stimulants
% Utilizing 1.6 16.4 0.9
Mean cost/person Annual $1,208 $926 $1,388
6-month $604 $463 $694
Provincial total cost Annual $899,391 $13,107,662 $24,638,358
6-month $449,695 $6,553,831 $12,319,179
* numbers too small to support estimation.

160 Chronic Diseases in CanadaVol 28, No 4, 2008
taken by the subjects during the telephone interview, however. Second, the recording of costs was certainly not exhaustive. In particular, indirect costs were not assessed. Whereas various categories of cost were estimated in respondents with and without evidence of a disorder, it does not follow that the disorders are necessarily the cause for the costs. For example, we looked at the costs associated with hospitalization for any reason. Since chronic illnesses are associated with mood disorders, the hospital costs may more closely reflect these medical comorbidities than the depression itself. Mechanisms linking depression to health care costs are likely to be complex. For example, a negative effect of depression on self-management of chronic conditions could lead to an increased frequency of hospital admissions. It is doubtful whether such costs can confidently be attributed to a specific diagnostic category.
Additional limitations pertain to the use of telephone survey methods. Declining response rates to telephone surveys in recent decades have heightened concerns about vulnerability of such studies to bias (see recent report by Public Works and Government Services Canada at http://www.pwgsc.gc.ca/por/text/pebptel-intro- e.html). Because brevity is needed in tele-phone survey interviews, the assessment of utilization was necessarily crude. How-ever, telephone-based data collection did allow the collection of data from a large
sample dispersed across a large geographi-cal region, and this included more detailed information about medication use than has generally been available in prior costing studies. However, response rates were less than ideal, raising questions about the validity of the estimates. Also, the interviewers encountered some difficulty with the collection of detailed information about dosages from respondents who were taking multiple medications or medications that involve variable dosages or prn sche-dules. A high frequency of missing data, for example, in the case of medications
other than antidepressants and sedative-hypnotics may limit the validity of those estimates.
Telephone survey methods are unlikely to be sufficient, in themselves, as a source of data for cost-of-illness studies. However, as the results of this study show, data collected in telephone surveys can help to inform the planning and interpretation of comprehensive cost-of-illness studies. The focus of this study was restricted to direct costs associated with mood and anxiety disorders. A detailed cost of illness study would also need to include indirect costs such as diminished productivity due to the effects of these disorders. Another limita-tion of the current study is the lack of assessment of substance dependence and abuse. Since this was not measured, it was not possible to determine whether the frequency of sedative-hypnotic use, in particular, may have been related to abuse or dependence on these substances.
Even though many of the cost estimates in the current study were based on approxima-tions, these approximations were made in the same way across disorder categories, which should facilitate valid comparisons. However, the comparisons may be mis-leading if the assumptions employed are variably valid across disorder groups. For example, if hospital admissions for mood
TABLE 2Utilization of services provided by mental health specialists, by disorder category
(during the 6 months prior to the survey)
TABLE 3Costs associated with service utilization, family and specialist physicians
(not including psychiatrists), by disorder category(during the 6 months prior to the survey)
Current mood or anxiety disorder
Current comorbid mood and
anxiety disorders
No current mood or anxiety disorder
Prevalence 2.2%
Prevalence 4.1%
Prevalence 93.7%
Psychiatrist % Utilizing 6.1 26.1 1.8
Mean number of visits 2.4 10.4 3.2
Mean cost/person $351 $1,501 $467
Provincial total cost $996,754 $33,811,137 $16,544,730
Psychologist % Utilizing 6.2 14.5 1.7
Mean number of visits 4.7 6.6 4.2
Mean cost/person $698 $987 $632
Provincial total cost $2,013,150 $12,354,147 $21,110,090
Current mood or anxiety disorder
Current comorbid mood and
anxiety disorders
No current mood or anxiety disorder
Prevalence 2.2%
Prevalence 4.1%
Prevalence 93.7%
Family physician
% Utilizing 58.1 74.5 53.1
Mean number of visits 4.9 7.2 2.8
Mean cost/person $113 $168 $130
Provincial total cost $3,076,347 $10,815,008 $68,375,547
Other physician
% Utilizing 28.7 42.8 22.0
Mean number of visits 2.2 5.8 2.8
Mean cost/person $80 $216 $105
Provincial total cost $3,725,192 $18,653,716 $208,201,753

Vol 28, No 4, 2008Chronic Diseases in Canada 161
and anxiety disorders are less expensive than hospitalizations for other reasons, bias could be introduced.
In Canada, future costing studies will need to maximize the use of available data about the frequency of maintenance treat-ment and adopt a broad view of drug costs in order to obtain valid cost estimates. The economic “landscape” associated with mood and anxiety disorders appears to be evolving over time and future costing studies will need to accommodate these new realities.
Acknowledgements
This project was funded by the Institute of Health Economics through the Alberta Depression Initiative. Dr. Patten is supported by a Health Scholar award from the Alberta Heritage Foundation for Medical Research and is a Fellow with the Institute of Health Economics. Dr. Mitton is supported by the Michael Smith Foundation for Health Research and holds a Canada Research Chair in Health Care Priority Setting.
TABLE 4Diagnostic testing, by disorder category (during the 6 months prior to the survey)
Current mood or anxiety disorder
Current comorbid mood and
anxiety disorders
No current mood or anxiety disorder
Prevalence 2.2%
Prevalence 4.1%
Prevalence 93.7%
X-ray % Utilizing 17.6 28.9 14.4
Mean number of tests 1.6 2.6 2.3
Mean cost/person $142 $226 $165
Total cost $1,164,288 $5,636,873 $46,827,952
CT scan % Utilizing 2.8 11.6 2.6
Mean number of tests 1.3 1.5 1.2
Mean cost/person $224 $255 $209
Total cost $292,946 $2,551,402 $10,669,647
MRI % Utilizing 1.0 10.7 3.2
Mean number of tests 1.9 1.2 1.1
Mean cost/person $1,206 $749 $669
Total cost $561,240 $6,915,813 $42,095,483
Lab tests % Utilizing 38.8 55.4 33.7
Mean number of tests 2.5 7.8 2.3
Mean cost/person $22 $70 $20
Total cost $401,824 $3,329,481 $13,278,868
TABLE 5Emergency room visits and hospitalizations, by disorder status (during the 6 month prior to the survey)
Current mood or anxiety disorder
Current comorbid mood and anxiety disorders
No current mood or anxiety disorder
Prevalence 2.2% Prevalence 4.1% Prevalence 93.7%
Emergency room visits % with a visit 12.3 26.9 10.7
Mean number of visits 1.3 3.1 1.5
Mean cost/person $61 $144 $68
Total cost $351,360 $3,348,484 $14,209,483
Hospitalizations % with a hospitalization 9.4 23.7 5.6
Mean number of hospital days 4.7 23.5 5.0
Mean cost/person $4,988 $25,151 $5,338
Total cost $21,714,793 $514,496,354 $587,712,652

162 Chronic Diseases in CanadaVol 28, No 4, 2008
References
1. Insel TR, Fenton WS. Psychiatric epidemio-
logy. It’s not just about counting anymore.
Arch Gen Psychiatry. 2005;62:590-3.
2. Ayuso-Mateos JL. Global burden of uni-
polar depressive disorders in the year 2000.
Global Burden of Disease Draft 28-05-03.
World Health Organization Global Program
on Evidence for Health Policy. 2003.
3. Statistics Canada. Canadian Community
Health Survey Mental Health and Well-being.
Ottawa: Statistics Canada, 2004 Mar 9.
4. Patten SB, Wang JL, Williams JVA, Currie
SR, Beck CA, Maxwell CJ, et al. Descriptive
epidemiology of major depression in
Canada. Can J Psychiatry. 2006;51:84-90.
5. Blazer DG, Kessler RC, McGonagle KA,
Swartz MS. The prevalence and distribution
of Major Depression in a national com-
munity sample: the National Comorbidity
Survey. Am J Psychiatry. 1994;151:979-86.
6. Kessler RC, Berglund P, Demler O, Jin R,
Koretz D, Merikangas KR, et al. The
epidemiology of major depressive disorder:
results from the National Comorbidity
Survey Replication (NCS-R). JAMA. 2003;
289:3095-105.
7. Wulsin LR, Vaillant GE, Wells VE. A
systematic review of the mortality of
depression. Psychosom Med. 1999;61:6-17.
8. Thomas CM, Morris S. Cost of depression
among adults in England in 2000. Br J
Psychiatry. 2003;183:514-9.
9. Andlin-Sobocki P, Wittchen H-U. Cost of
affective disorders in Europe. Eur J Neurol.
2005;12(Suppl. 1):34-8.
10. Kennedy SH, Lam RW, Cohen NL, Ravindran
AV, and the CANMAT Depression Work
Group. Clinical guidelines for the treatment
of depressive disorders. IV. Medications and
other biological treatments. Can J Psychiatry.
2001;46(Suppl 1):38S-58S.
11. Stephens T, Dulberg C, Joubert N. Mental
health of the Canadian population: a com-
prehensive analysis. Chronic Dis Can.
1999;20:118-26.
12. Patten SB, Adair CE, Williams JVA, Brant
R, Wang JL, Casebeer A, et al. Assessment
of mental health and illness by telephone
survey: Experience with an Alberta Mental
Health Survey. Chronic Dis Can. 2006;
27(3):99-109
13. Mullet GM. The efficacy of plus-one dialing:
Self reported status. American Statistical
Association: Proceedings of the Section on
Survey Research Methods 1982;575-6.
14. Potthoff RF. Telephone sampling in epide-
miological research: to reap the benefits,
avoid the pitfalls. Am J Epidemiol. 1994;
139:967-78.
15. Lecubier Y, Sheehan DV, Weiller E, Amorim
P, Bonora I, Sheehan KH, et al. The MINI
International Neuropsychiatric Interview
(MINI). A short diagnostic structured inter-
view: reliability and validity according to the
CIDI. Eur Psychiatry. 1997;12:224-31.
16. Sheehan DV, Lecubier Y, Sheehan KH,
Janavs J, Weiller E, Keskiner A, et al. The
validity of the Mini International Neuro-
psychiatric Interview (MINI) according to
the SCID-P and its validity. Eur Psychiatry.
1997;12:232-41.
17. Narrow WE, Rae DS, Robins LN, Regier
DA. Revised prevalence estimates of mental
disorders in the United States: using a
clinical significance criterion to reconcile 2
surveys’ estimates. Arch Gen Psychiatry.
2002;59:115-23.
18. Waraich PS, Goldner EM, Somers JM, Hsu L.
Prevalence and incidence studies of mood
disorders: a systematic review of the litera-
ture. Can J Psychiatry. 2004;49:124-38.
19. Kessler RC, Chiu WT, Demler O, Merikangas
KR, Walters EE. Prevalence, severity, and
comorbidity of 12-month DSM-IV disorders
in the National Comorbidity Survey Repli-
cation. Arch Gen Psychiatry. 2005 Jun;
62(6):617-27.
20. Statistics Canada. Canadian Community
Health Survey: Mental health and well-
being. The Daily, Wednesday, September
3, 2003. URL: http://www.statcan.ca/
Daily/English/030903/d030903a.htm
21. Patten SB, Beck CA, Kassam A, Williams
JVA, Barbui C, Metz LM. Long-term medical
conditions and major depression: strength
of association in the general population.
Can J Psychiatry. 2005;50:195-202.
22. Gagnon LM, Patten SB. Major depression
and its association with long-term
medical conditions. Can J Psychiatry.
2002;47:167-73.
23. Wells KB, Golding JM, Burnam MA.
Psychiatric disorder in a sample of the
general population with and without
chronic medical conditions. Am J
Psychiatry. 1988;145(8):976-81.
24. Pharmaceutical trends: Top products,
classes and companies sourced from IMS
data. URL: http://www.imshealthcanada.
com/web/channel/0,3147,77303623_6387
2702_77770072,00.html

Vol 28, No 4, 2008Chronic Diseases in Canada 163
Chronic Diseases in Canada (CDIC) is a quarterly scientific journal focussing on the prevention and control of non- communicable diseases and injuries in Canada. Its feature articles are peer reviewed. The content of articles may include research from such fields as epidemiology, public/community health, biostatistics, the behavioural sciences, and health services or economics. CDIC endeavours to foster communication on chronic diseases and injuries among public health practitioners, epidemiologists and researchers, health policy planners and health educators. Submissions are selected based on scientific quality, public health relevance, clarity, conciseness and technical accuracy. Although CDIC is a publication of the Public Health Agency of Canada, contributions are welcomed from both the public and private sectors. Authors retain responsibility for the contents of their papers, and opinions expressed are not necessarily those of the CDIC editorial committee nor of the Public Health Agency of Canada.
Letter to the Editor: Comments on articles recently published in CDIC will be considered for publication (maximum 500 words). Abstract not required.
Book/Software Review: Usually solicited by the editors (500B1,300 words), but requests to review are welcomed. Abstract not required.
Submitting Manuscripts
Submit manuscripts to the Editor-in-Chief, Chronic Diseases in Canada, Public Health Agency of Canada 130 Colonnade Road, Address Locator: 6501G, Ottawa, Ontario K1A 0K9, e-mail: [email protected].
Since CDIC adheres in general (section on illustrations not applicable) to the “Uniform Requirements for Manu-scripts Submitted to Biomedical Journals” as approved by the International Committee of Medical Journal Editors,
Article Types
Peer-reviewed Feature Article: Maximum 4,000 words for main text body (excluding abstract, tables, figures, references) in the form of original research, surveillance reports, meta-analyses or methodological papers.
Status Report: Describe ongoing national programs, studies or information systems bearing on Canadian public health (maximum 3,000 words). Abstract not required.
Workshop/Conference Report: Summa-rize significant, recently held events relating to national public health (maximum 1,200 words). Abstract not required.
Cross-Canada Forum: For authors to present or exchange information and opinions on regional or national surveillance findings, programs under development or public health policy initiatives (maximum 3,000 words). Abstract not required.
Information for Authors
www.publichealth.gc.ca/cdic
The Public Health Agency’s peer-reviewed journal.
Special: Call for papers on chronic disease intervention research.
Subscribe today! Submit your manuscripts!
ARE YOU ON TOP OF CHRONICDISEASE PREVENTION RESEARCH?
Chronic Diseases in Canada:Research. Intervention. Prevention.

164 Chronic Diseases in CanadaVol 28, No 4, 2008
authors should refer to this document for complete details before submitting a manuscript to CDIC (see <www.icmje.org>.
Checklist for Submitting Manuscripts
Cover letter: Signed by all authors, stating that all have seen and approved the final manuscript and have met the authorship including a full statement regarding any prior or duplicate publication or submission for publication.
First title page: Concise title; full names of all authors and institutional affiliations; name, postal and e-mail addresses, tele-phone and fax numbers for corresponding author; separate word counts for abstract and text.
Second title page: Title only; start page numbering here as page 1.
Abstract: Unstructured (one paragraph, no headings), maximum 175 words (100 for short reports); include 3B8 key words (preferably from the Medical Subject Headings (MeSH) of Index Medicus).
Text: Double-spaced, 1 inch (25 mm) margins, 12 point font size.
Acknowledgements: Include disclosure of financial and material support in acknow-ledgements; if anyone is credited in acknow-ledgements with substantive scientific contributions, authors should state in cover letter that they have obtained written permission.
References: In AVancouver style@ (consult a recent CDIC issue for examples); numbered in superscript in the order cited in text, tables and figures; listing up to six authors (first three and Aet al.@ if more); without any automatic reference numbering feature used in word processing; any unpublished observations/data or personal communications used (discouraged) to be
cited in the text in parentheses (authors responsible for obtaining written permis-sion); authors are responsible for verifying accuracy of references.
Tables and Figures: Send vector graphics only. Each on a separate page and in electronic file(s) separate from the text (not imported into the text body); as self- explanatory and succinct as possible; not too numerous; numbered in the order that they are mentioned in the text; explanatory material for tables in footnotes, identified by lower-case superscript letters in alpha-betical order; figures limited to graphs or flow charts/templates (no photographs), with software used specified and titles/footnotes on a separate page.
Number of copies: If submitting by mail, one complete copy, including tables and figures; one copy of any related supple-mentary material, and a copy of the manuscript on diskette. If submitting by e-mail to [email protected], please fax or mail the covering letter to the address on the inside front cover.