Chromatography and Extraction Techniques for …7935/FULLTEXT01.pdfChromatography and Extraction...
86
Chromatography and Extraction Techniques for New Evaluation Methods of Polyolefins Long- Term Performance Lina Burman Akademisk avhandling som med tillstånd av Kungliga Tekniska Högskolan framlägges till offentlig granskning för avläggande av teknisk doktorsexamen torsdagen den 16 juni, kl. 13 i sal K2, Kungliga Tekniska Högskolan, Teknikringen 28, Stockholm. Avhandlingen försvaras på engelska.
Transcript of Chromatography and Extraction Techniques for …7935/FULLTEXT01.pdfChromatography and Extraction...
Chromatography and Extraction Techniques for
New Evaluation Methods of Polyolefins Long-
Term Performance
Lina Burman
Akademisk avhandling som med tillstånd av Kungliga Tekniska Högskolan framlägges till offentlig granskning för avläggande av teknisk doktorsexamen
torsdagen den 16 juni, kl. 13 i sal K2, Kungliga Tekniska Högskolan, Teknikringen 28, Stockholm.
Avhandlingen försvaras på engelska.


To my family

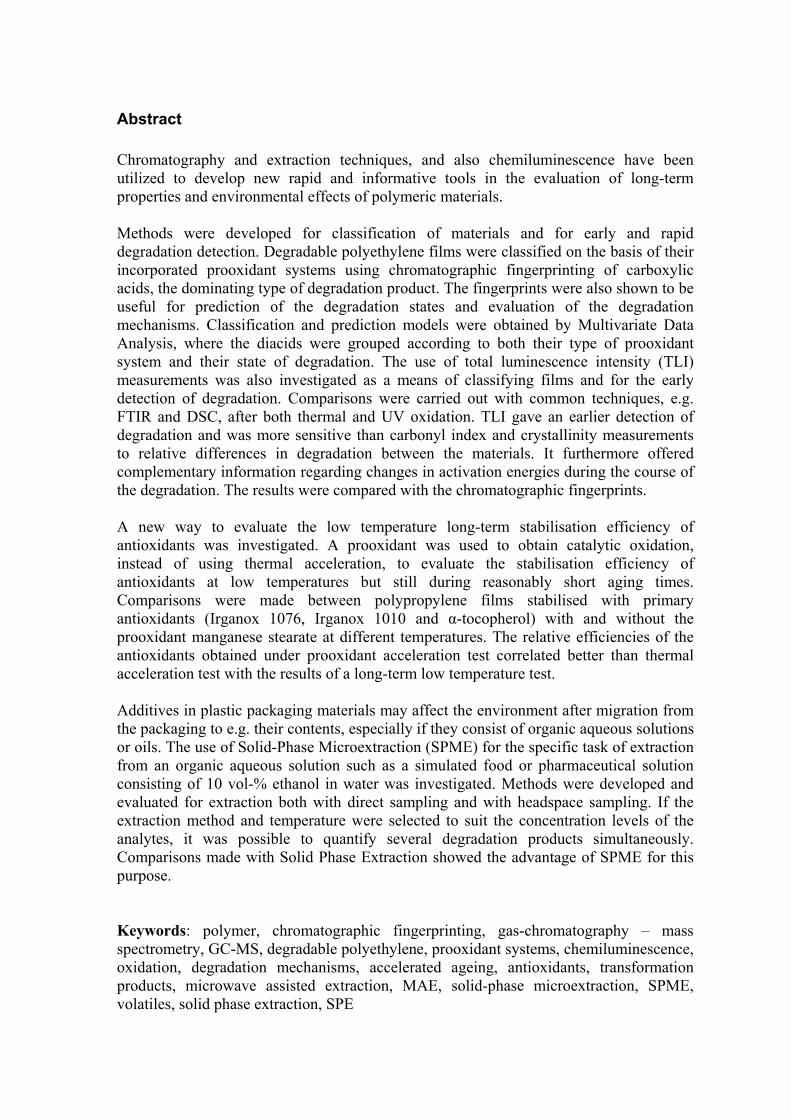
Abstract Chromatography and extraction techniques, and also chemiluminescence have been utilized to develop new rapid and informative tools in the evaluation of long-term properties and environmental effects of polymeric materials. Methods were developed for classification of materials and for early and rapid degradation detection. Degradable polyethylene films were classified on the basis of their incorporated prooxidant systems using chromatographic fingerprinting of carboxylic acids, the dominating type of degradation product. The fingerprints were also shown to be useful for prediction of the degradation states and evaluation of the degradation mechanisms. Classification and prediction models were obtained by Multivariate Data Analysis, where the diacids were grouped according to both their type of prooxidant system and their state of degradation. The use of total luminescence intensity (TLI) measurements was also investigated as a means of classifying films and for the early detection of degradation. Comparisons were carried out with common techniques, e.g. FTIR and DSC, after both thermal and UV oxidation. TLI gave an earlier detection of degradation and was more sensitive than carbonyl index and crystallinity measurements to relative differences in degradation between the materials. It furthermore offered complementary information regarding changes in activation energies during the course of the degradation. The results were compared with the chromatographic fingerprints. A new way to evaluate the low temperature long-term stabilisation efficiency of antioxidants was investigated. A prooxidant was used to obtain catalytic oxidation, instead of using thermal acceleration, to evaluate the stabilisation efficiency of antioxidants at low temperatures but still during reasonably short aging times. Comparisons were made between polypropylene films stabilised with primary antioxidants (Irganox 1076, Irganox 1010 and α-tocopherol) with and without the prooxidant manganese stearate at different temperatures. The relative efficiencies of the antioxidants obtained under prooxidant acceleration test correlated better than thermal acceleration test with the results of a long-term low temperature test. Additives in plastic packaging materials may affect the environment after migration from the packaging to e.g. their contents, especially if they consist of organic aqueous solutions or oils. The use of Solid-Phase Microextraction (SPME) for the specific task of extraction from an organic aqueous solution such as a simulated food or pharmaceutical solution consisting of 10 vol-% ethanol in water was investigated. Methods were developed and evaluated for extraction both with direct sampling and with headspace sampling. If the extraction method and temperature were selected to suit the concentration levels of the analytes, it was possible to quantify several degradation products simultaneously. Comparisons made with Solid Phase Extraction showed the advantage of SPME for this purpose. Keywords: polymer, chromatographic fingerprinting, gas-chromatography – mass spectrometry, GC-MS, degradable polyethylene, prooxidant systems, chemiluminescence, oxidation, degradation mechanisms, accelerated ageing, antioxidants, transformation products, microwave assisted extraction, MAE, solid-phase microextraction, SPME, volatiles, solid phase extraction, SPE
Svensk sammanfattning Kromatografi- och extraktionstekniker, samt kemiluminescens, har använts vid utvecklande av nya snabba och informativa verktyg, vid utvärdering av polyolefiners långtidsegenskaper och miljöeffekter. Metoder utvecklades för klassificering av material och för tidig och snabb nedbrytningsdetektering. Nedbrytbara polyetenfilmer klassificerades utifrån deras prooxidantsystem med hjälp av kromatografiska mönster av karboxylsyror, vilket är den mest påtagliga gruppen av nedbrytningsprodukter. Det visades även att dessa mönster är användbara för att bestämma filmernas nedbrytningsstadier samt för utvärdering av nedbrytningsmekanismer. Klassificerings- och prediktionsmodeller erhölls med hjälp av multivariat dataanalys. Disyrorna från de olika proverna grupperade sig utifrån både deras variant av prooxidantsystem och nedbrytningsgrad. En annan möjlighet som utreddes för klassificering av filmerna och för tidig nedbrytningsdetektering var användande av total luminescens intensitets (TLI) mätningar. Jämförelser gjordes med vanliga tekniker som FTIR och DSC efter både termisk- och foto-oxidation. TLI gav en tidigare nedbrytningsdetektering och var känsligare för relativa skillnader i nedbrytningen än karbonylindex och kristallinitetsmätningar. TLI gav dessutom kompletterande information gällande förändringar i aktiveringsenergin under nedbrytningsförloppet. Resultaten jämfördes med de kromatografiska mönstren. Ett nytt sätt att utvärdera antioxidanters långtidsstabiliserande effekt vid låg temperatur studerades. Prooxidanter tillsattes till polymera filmer för katalytisk oxidation istället för termisk accelerering för att på så sätt kunna utvärdera stabiliseringseffektiviteten vid låga temperaturer, utan termiska effekter på materialets morfologi, men ändå under relativt kort tid. Jämförelser gjordes vid olika temperaturer mellan polypropenfilmer stabiliserade med primära antioxidanter (Irganox 1076, Irganox 1010 och a-tocopherol) och med eller utan innehåll av en prooxidant (manganstearat). Den relativa effektiviteten hos antioxidanterna vid försök med prooxidantacceleration korrelerade bättre till långtidsförsök vid låga temperaturer än vad försök med termisk acceleration gjorde. Tillsatser i plastförpackningar kan påverka den omgivande miljön om de migrerar ut från förpackningen, exempelvis till dess innehåll, speciellt om innehållet består av en organisk vattenlösning eller en olja. Användning av fastfas mikroextraktion (SPME) utvärderades för det specifika syftet att extrahera lågmolekylära nedbrytningsprodukter av antioxidanter från en organisk vattenlösning, liknande mat eller läkemedelslösning, bestående av 10 vol-% etanol i vatten. Metoder utvecklades och utvärderades för extraktion både direkt från lösningen samt ur gasfasen ovanför lösningen. Det var möjligt att kvantifiera mer än en produkt simultant genom urval av extraktionsmetod och temperatur utifrån koncentrationsnivåerna hos proverna. Fördelen med SPME för denna applikation visades genom jämförelse med fastfasextaktion.
List of Papers This thesis is a summary of the following papers: I Total Luminescence Intensity as a Tool to Classify Degradable Polyethylene
Films by Early Degradation Detection and Changes in Activation Energy Lina Ragnarsson and Ann-Christine Albertsson Biomacromolecules, 4 (2003) 900
II Chromatographic Fingerprinting - a Tool for Classification and for Predicting the
Degradation State of Degradable Polyethylene Lina Burman and Ann-Christine Albertsson Polymer Degradation and Stabilisation, 89 (2005) 50 III Solid-Phase Microextraction for Qualitative and Quantitative Determination of
Migrated Degradation Products of Antioxidants in an Organic Aqueous Solution Lina Burman, Ann-Christine Albertsson and Anders Höglund Accepted by Journal of Chromatography A
IV Evaluation of Long-Term Performance of Antioxidants Using Prooxidants instead of Thermal Acceleration
Lina Burman and Ann-Christine Albertsson Accepted by Journal of Polymer Science Part A: Polymer Chemistry

Table of Contents
Abstract .............................................................................................................................. 5
Svensk sammanfattning .................................................................................................... 6
List of Papers ..................................................................................................................... 7
Table of Contents............................................................................................................... 9
1 Purpose of the study ..................................................................................................... 11
2 Introduction .................................................................................................................. 13
2.1 Degradation and stabilisation of polyolefins .......................................................... 14
2.2 Extraction techniques before chromatographic analysis ........................................ 15 2.2.1 Extraction from solid matrix............................................................................. 16
2.2.2 Extraction from liquid matrix ........................................................................... 16
2.3 Chromatographic techniques .................................................................................. 19
2.4 Chemiluminescence ................................................................................................. 20
2.5 Multivariate data analysis ....................................................................................... 20
3 Experimental................................................................................................................. 23
3.1 Materials.................................................................................................................. 23 3.1.1 Degradable polyethylene .................................................................................. 23
3.1.2 Stabilised polypropylene .................................................................................. 23
3.2 Degradation procedures.......................................................................................... 24 3.2.1 Degradation in air ............................................................................................. 24
3.2.2 Degradation in organic aqueous solution ......................................................... 24
3.3 Extraction methods .................................................................................................. 25 3.3.1 Liquid-solid extraction (LSE)........................................................................... 25
3.3.2 Microwave-Assisted Extraction (MAE)........................................................... 25
3.3.3 Solid-Phase Microextraction (SPME) .............................................................. 26
3.3.4 Solid-Phase Extraction (SPE)........................................................................... 27
3.3.5 Soxhlet extraction............................................................................................. 28
3.3.6 Ultrasonic extraction......................................................................................... 28
3.5 Analytical techniques............................................................................................... 28 3.5.1 Gas Chromatography - Mass Spectrometry (GC-MS) ..................................... 28
3.5.2 High Performance Liquid Chromatography (HPLC) ....................................... 29
3.5.3 Chemiluminescence (CL) ................................................................................. 29
3.5.4 Differential Scanning Calorimetry (DSC)........................................................ 29
3.5.5 Fourier Transform Infrared Spectroscopy (FTIR)............................................ 30
3.5.6 Size - Exclusion Chromatography (SEC)......................................................... 30
4 Results and Discussion ................................................................................................. 31
4.1 Extraction methods for the evaluation of the long-term performance of polyolefins....................................................................................................................................... 31
4.1.1 Liquid/solid extraction for fingerprinting the degradation products from
polyolefins with focus on carboxylic acid................................................................. 31
4.1.2 Microwave Assisted Extraction (MAE) for quantification of antioxidants
within polyolefins ...................................................................................................... 33
4.1.3 Solid-Phase Microextraction of volatile and semi-volatile degradation products
of antioxidants in an organic aqueous solution ......................................................... 37
4.2 Evaluation of long-term performance of degradable polyethylene......................... 43 4.2.1 Classification and product control using Chromatographic fingerprinting ...... 43
4.2.2 Degradation state prediction using chromatographic fingerprinting................ 48
4.2.3 Early degradation state prediction using Total Luminescence Intensity
measurements ............................................................................................................ 51
4.2.4 Changes in activation energies versus degradation mechanisms – evaluation
using chromatographic fingerprinting and FTIR....................................................... 62
4.3 Evaluation of long-term performance of stabilised polypropylene ......................... 67 4.3.1 Rapid evaluation of antioxidant efficiency with a prooxidant as catalyst - time
to failure and oxidation induction times using TLI measurements ........................... 67
4.3.2 Rapid evaluation of antioxidant efficiency with a prooxidant as catalyst –
normalisation using MAE.......................................................................................... 70
4.3.3 Quantification of degradation products of antioxidants migrated to an organic
aqueous solution ........................................................................................................ 75
5. Conclusions................................................................................................................... 79
6. Acknowledgements ...................................................................................................... 81
7. References..................................................................................................................... 83
Purpose of the Study
- 11 -
1 Purpose of the study The focus of this thesis is on the development of extraction methods as tools in chromatographic evaluations of long-term performance and environmental effects of polymers. These are essential issues in the production of tailored materials, for both degradable and stabilized systems. The main hypotheses were that:
• Different prooxidant systems should lead to different degradation mechanisms and this should affect the chromatographic fingerprints. This should make it possible to classify the type of prooxidant system and predict the degradation state from the product patterns; i.e. the materials state in relation to its own lifetime cycle. The idea was to use chromatographic fingerprinting with a focus on the most abundant group of degradation products, i.e. carboxylic acids, in combination with multivariate data analysis.
• The Total Luminescence Intensity (TLI) is a potential method for the rapid
classification of degradable polyethylene and for the comparison of changes in activation energy. The idea was to compare photo-oxidation and thermal oxidation of four different degradable films using TLI and evaluate its usefulness in comparison with other techniques such as FTIR, DSC and SEC. The idea was also to use FTIR and chromatograpic fingerprints in attempts to correlate changes in activation energies needed for hydroperoxide decomposition with degradation mechanisms of the samples.
• If a prooxidant could be used to catalyse the low temperature, then it would be
possible to predict the low temperature efficiencies of antioxidants without high temperature acceleration. We would thus be possible to create a more realistic accelerated method by avoiding thermal effects on the morphology of the polymer and the solubility and evaporation rate of the antioxidants. The idea was to compare the evaluations of the relative efficiencies of various antioxidants performed at different temperatures with and without manganese stearate as prooxidant. The idea was also to make recalculations on the basis of microwave-assisted extractions to correct for differences in the amounts of antioxidants present after processing.
• It should be possible to identify and quantify very small amounts of low-molecular
weight degradation products of antioxidants in an organic aqueous solution, such as a simulated food or pharmaceutical solution consisting of 10 % ethanol in water, using Solid Phase Microextraction (SPME). The idea was to perform the evaluation using two of the most common antioxidants, Irganox 1010 and Irgafos 168, as model substances, since their degradation products have chemical structures similar to those of many other common antioxidants. Comparisons were made with solid phase extraction (SPE).

- 12 -
Introduction
- 13 -
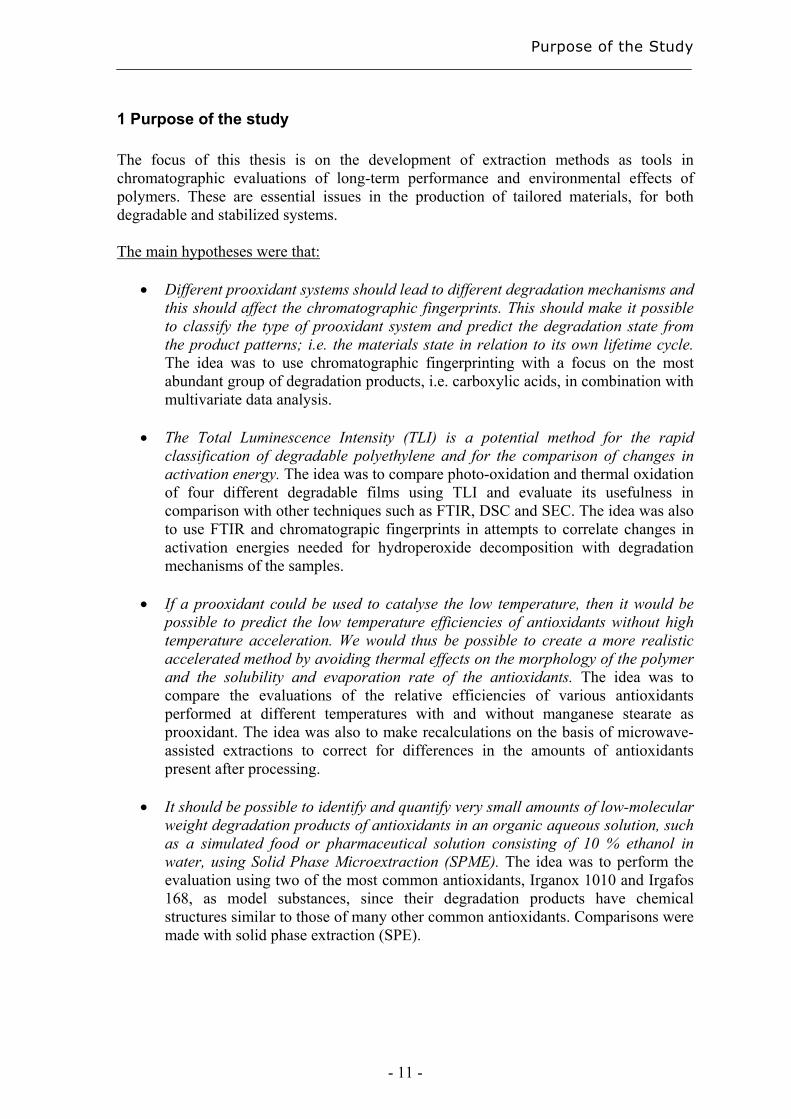
2 Introduction The methods presented in this thesis for classification and rapid degradation state predictions are valuable tools in the determination of long-term properties as part of the task of developing tailored polymer materials. The group of professor Ann-Christine Albertsson at the Royal Institute of Technology, Stockholm, has since the early 1980’s used chromatography to study the long-term performance of polymers [1, 2]. This thesis is a continuation of earlier work, focusing on the need for new rapid and informative tools to provide a greater understanding within this area. A good example of a class of material with specific stability and degradability criteria is mulch films for corn productions. Their purpose is to increase the production, as seen in figure 1, and they shall protect the crops in the beginning of the season but be brittle enough after 4 to 6 weeks for the crops to puncture the films without being damaged. However, the films must also be sufficiently resistant so that they are not torn into pieces by wind and normal weather conditions during the time when the plants are still small. Such demands make it valuable to understand the degradation process in the early stage of degradation of the polymer in order to develop new degradable polyethylene materials and to choose between already existing ones. A classification method based on the initial degradation would be a valuable tool.
Figure 1 Corn production with and without using mulchfilm.
Early degradation state detection is also a key issue in the field of stabilized materials. The evaluation of the long-term efficiency of antioxidants under non-accelerated conditions takes too much time to be practical. The accelerated tests currently in use are however made under unrealistic physical conditions, and this leads to unreliable results. Early degradation detection is an essential component in the efforts to reduce the acceleration needed to reach practical test times.
Introduction
- 14 -
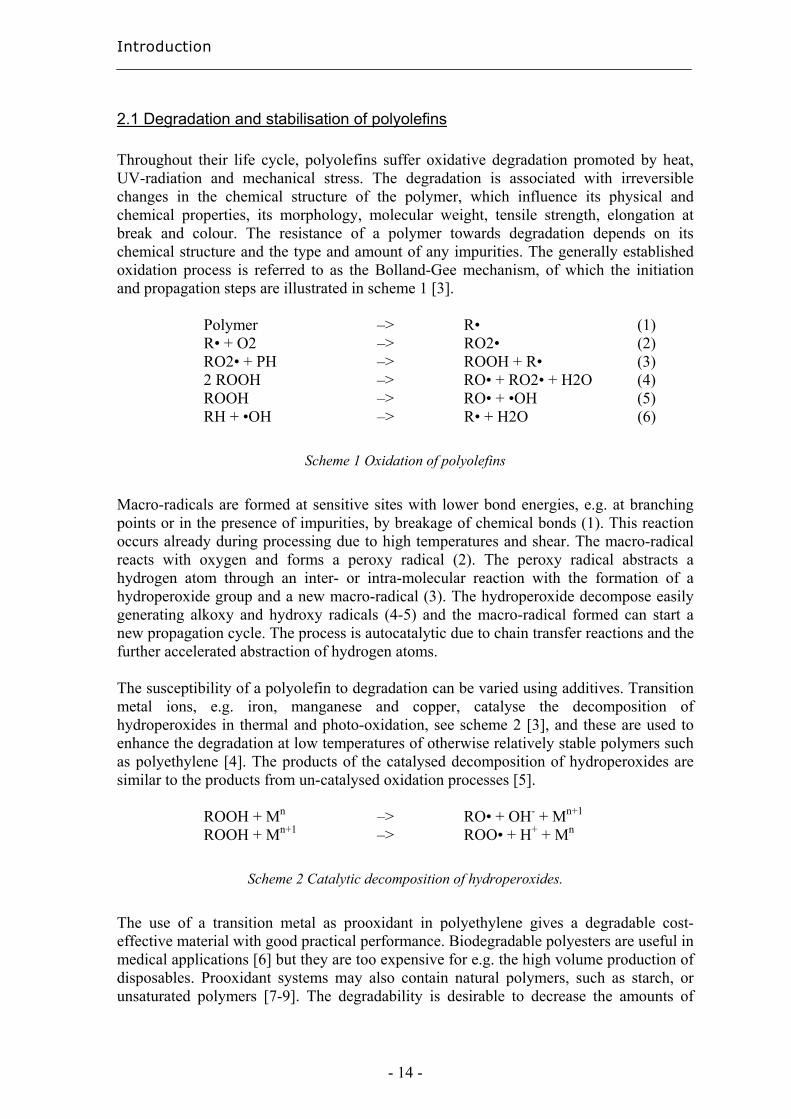
2.1 Degradation and stabilisation of polyolefins Throughout their life cycle, polyolefins suffer oxidative degradation promoted by heat, UV-radiation and mechanical stress. The degradation is associated with irreversible changes in the chemical structure of the polymer, which influence its physical and chemical properties, its morphology, molecular weight, tensile strength, elongation at break and colour. The resistance of a polymer towards degradation depends on its chemical structure and the type and amount of any impurities. The generally established oxidation process is referred to as the Bolland-Gee mechanism, of which the initiation and propagation steps are illustrated in scheme 1 [3].
Polymer –> R• (1) R• + O2 –> RO2• (2) RO2• + PH –> ROOH + R• (3) 2 ROOH –> RO• + RO2• + H2O (4) ROOH –> RO• + •OH (5) RH + •OH –> R• + H2O (6)
Scheme 1 Oxidation of polyolefins
Macro-radicals are formed at sensitive sites with lower bond energies, e.g. at branching points or in the presence of impurities, by breakage of chemical bonds (1). This reaction occurs already during processing due to high temperatures and shear. The macro-radical reacts with oxygen and forms a peroxy radical (2). The peroxy radical abstracts a hydrogen atom through an inter- or intra-molecular reaction with the formation of a hydroperoxide group and a new macro-radical (3). The hydroperoxide decompose easily generating alkoxy and hydroxy radicals (4-5) and the macro-radical formed can start a new propagation cycle. The process is autocatalytic due to chain transfer reactions and the further accelerated abstraction of hydrogen atoms. The susceptibility of a polyolefin to degradation can be varied using additives. Transition metal ions, e.g. iron, manganese and copper, catalyse the decomposition of hydroperoxides in thermal and photo-oxidation, see scheme 2 [3], and these are used to enhance the degradation at low temperatures of otherwise relatively stable polymers such as polyethylene [4]. The products of the catalysed decomposition of hydroperoxides are similar to the products from un-catalysed oxidation processes [5].
ROOH + Mn –> RO• + OH- + Mn+1 ROOH + Mn+1 –> ROO• + H+ + Mn
Scheme 2 Catalytic decomposition of hydroperoxides.
The use of a transition metal as prooxidant in polyethylene gives a degradable cost- effective material with good practical performance. Biodegradable polyesters are useful in medical applications [6] but they are too expensive for e.g. the high volume production of disposables. Prooxidant systems may also contain natural polymers, such as starch, or unsaturated polymers [7-9]. The degradability is desirable to decrease the amounts of
Introduction
- 15 -
litter and there are, for this reason, a large number of different degradable polyethylene materials on the market today. Enhanced degradation is a good way to decrease the amount of litter, but in most plastic applications degradation is seen as a problem rather than an advantage, as for example in construction applications where the plastic material needs to retain its performance for a long period of time. Oxidative degradation must then be avoided, and this can be achieved by using antioxidants. A polymer with pendant groups such as polypropylene is, due to the lower dissociation energy at the branching points, much more susceptible to oxidation than an unbranched polymer such as polyethylene. The presence of an antioxidant is especially important during the high-temperature processing of the polymer material to form the final product. The most common way to protect the material during the processing is to combine a chain-breaking donor (primary antioxidant), e.g. a hindered phenol, and a hydroperoxide decomposer (secondary antioxidant), e.g. a trivalent phosphite or phosphonite ester. This leads to a synergistic effect at high temperatures, which is assumed to be due to the simultaneous scavenging of peroxy radicals by the phenol and the non-radical deactivation of hydroperoxides by the secondary antioxidant [10]. Phenolic antioxidants are effective both during processing at high temperatures and during long-term use at low temperatures. The reaction proceeds stepwise with a combination of stabilisation by the antioxidant itself and stabilisation by its transformation products [11]. The transformation products are e.g. phenoxyls, quinones, quinomethides and various complexes [10, 11]. Phosphite and phosphonite esters are effective at processing temperatures but not at ambient temperatures. A stabilising effect has been noticed for transformation products formed both by thermal oxidation and hydrolysis [10-13]. New antioxidants are being sought that are ecologically more suitable, or are more effective so that they can be used in lower amounts, e.g. to decrease the potential risk of migration from food packages.
2.2 Extraction techniques before chromatographic analysis A large part of the development of chromatographic analysis for the evaluation of the long-term performance of polymers are the task of sample preparation. Using different extraction methods, over 200 degradation products have been identified and fingerprints have been obtained for the identification of the mechanisms involved in the complex degradation pattern of polyethylene [14-19]. Some of the possible extraction techniques are presented in this chapter. They are divided into two main categories depending on whether the extraction is from the solid or the liquid matrix. Solid Phase Microextraction (SPME) has been shown to be an efficient technique for the extraction of volatile analytes from both liquid and solid samples. It has been successful for the identification and quantification of degradation products from solid samples of e.g. polyamide 6-6, nitrile rubber and polyvinylchloride / polycaprolactone-PC [20-22]. SPME is however discussed only with reference to extraction from the liquid phase since that was the context in which it was used in this work.
Introduction
- 16 -
2.2.1 Extraction from solid matrix Liquid-solid extraction (LSE), where a solid material is added to a suitable solvent, is a well established way to extract substances from a solid phase. LSE is an effective way to extract soluble substances from the surface of a material and it can to some extent, due to diffusion, also extract substances from the bulk of the material. The extraction from the bulk is however limited. Heat is usually needed for efficient extraction from the bulk of polyolefins such as polyethylene and polypropylene due to the difficulty in disolving the materials and thereby releasing the substances. Soxhlet extraction is a common technique for the extraction of additives from polymer materials. The extraction solvent is boiled and condensed in cycles through a permeable thimble of glass fibre containing the material. The samples are extracted one by one using 100 to 150 ml solvent for 1 to 30 g of material. Each extraction takes from 3 to 48 hours [23], depending on the thickness of the material and the thermal sensitivity of the substances of interest. Microwave Assisted Extraction (MAE) has been shown to be as effective an extraction method for additives as a soxhlet extraction, but it is less time-consuming and uses less solvent [24]. Soxhlet extractions are normally performed using chloroform, whereas MAE requires less solvent and less environmentally harmful solvents. A polar solvent is needed to absorb heat from the microwaves created by vibration of the molecules due to the absorption of microwave energy. A polar solvent, e.g. isopropanol, acetone, ethylacetate or dichloromethane [23, 25-27], is often used in combination with a swelling solvent to increase the possibility of extracting analytes from the bulk of the material [25, 26, 28, 29]. Other parameters to be considered, apart from the choice of extraction solution, are the volume of the extraction solution relative to the amount of sample, the geometry of the sample, and especially the extraction time and temperature. One of the main advantages of MAE is its ability to heat the sample solution rapidly [23]. The extraction can be performed under pressure, and thus at temperatures above the boiling point of the solvents, and this accelerate the extraction process [23]. This must however be avoided if solvents that may be explosive under such conditions are used. The temperature is carefully controlled during the total extraction. For the extraction, 10 to 50 ml solvent is used for 0.5 to 10 g of polymer material [23, 25, 30]. The extraction time may be as short as 3 min depending on the geometry and properties of the sample, the substances to be extracted, and the selected extraction condition [26]. In addition, several samples can be extracted simultaneously, and this makes this technique even more time-efficient than the soxhlet method. Polymer granules are usually ground to approximately 20 mesh to improve the extraction performance [25, 26].
2.2.2 Extraction from liquid matrix The traditional methods used for extraction from solutions are liquid-liquid extraction (LLE) and solid phase extraction (SPE). LLE is based on a difference in the solubility of the analytes between the sample solution and the extraction solvent. The efficiency depends on how large this difference is, and also on the concentration of the analytes in the sample solution, since the amount of solvent is rather large. Evaporation is a way to increase the concentration of analytes in the extract if their volatility is sufficiently low. The evaporation will otherwise decrease not only the volume of the solution but also the amount of the volatile species present.
Introduction
- 17 -
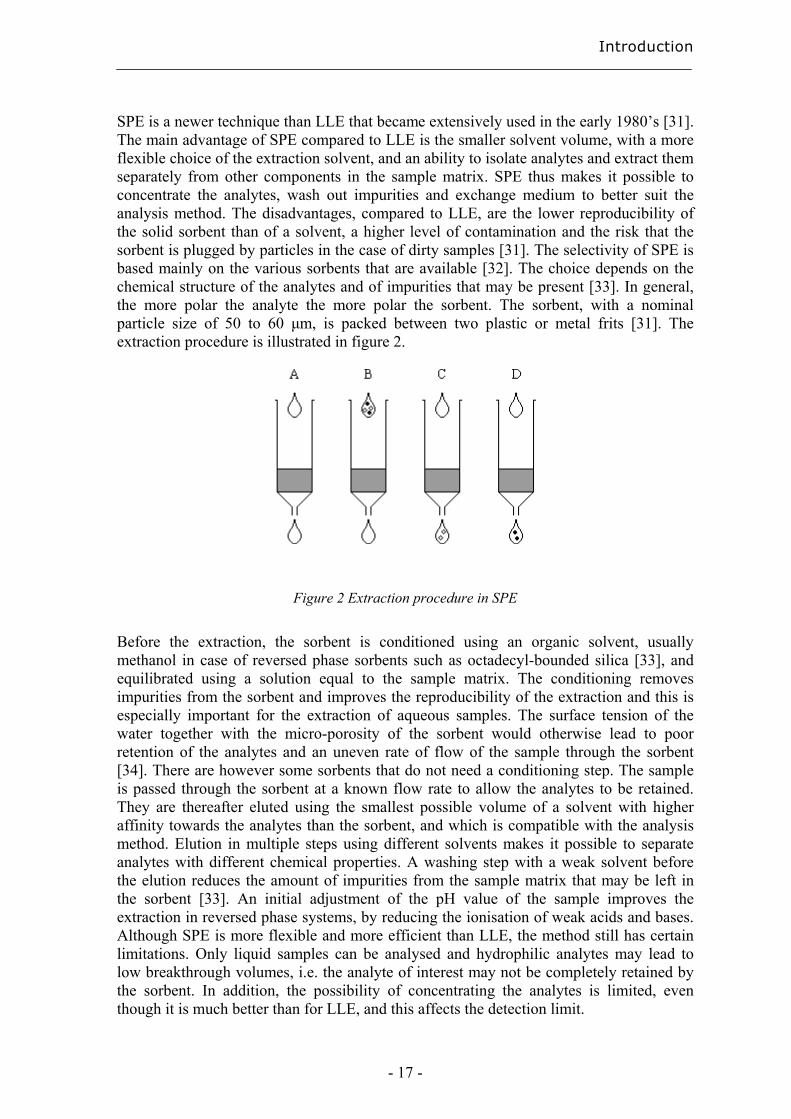
SPE is a newer technique than LLE that became extensively used in the early 1980’s [31]. The main advantage of SPE compared to LLE is the smaller solvent volume, with a more flexible choice of the extraction solvent, and an ability to isolate analytes and extract them separately from other components in the sample matrix. SPE thus makes it possible to concentrate the analytes, wash out impurities and exchange medium to better suit the analysis method. The disadvantages, compared to LLE, are the lower reproducibility of the solid sorbent than of a solvent, a higher level of contamination and the risk that the sorbent is plugged by particles in the case of dirty samples [31]. The selectivity of SPE is based mainly on the various sorbents that are available [32]. The choice depends on the chemical structure of the analytes and of impurities that may be present [33]. In general, the more polar the analyte the more polar the sorbent. The sorbent, with a nominal particle size of 50 to 60 µm, is packed between two plastic or metal frits [31]. The extraction procedure is illustrated in figure 2.
Figure 2 Extraction procedure in SPE
Before the extraction, the sorbent is conditioned using an organic solvent, usually methanol in case of reversed phase sorbents such as octadecyl-bounded silica [33], and equilibrated using a solution equal to the sample matrix. The conditioning removes impurities from the sorbent and improves the reproducibility of the extraction and this is especially important for the extraction of aqueous samples. The surface tension of the water together with the micro-porosity of the sorbent would otherwise lead to poor retention of the analytes and an uneven rate of flow of the sample through the sorbent [34]. There are however some sorbents that do not need a conditioning step. The sample is passed through the sorbent at a known flow rate to allow the analytes to be retained. They are thereafter eluted using the smallest possible volume of a solvent with higher affinity towards the analytes than the sorbent, and which is compatible with the analysis method. Elution in multiple steps using different solvents makes it possible to separate analytes with different chemical properties. A washing step with a weak solvent before the elution reduces the amount of impurities from the sample matrix that may be left in the sorbent [33]. An initial adjustment of the pH value of the sample improves the extraction in reversed phase systems, by reducing the ionisation of weak acids and bases. Although SPE is more flexible and more efficient than LLE, the method still has certain limitations. Only liquid samples can be analysed and hydrophilic analytes may lead to low breakthrough volumes, i.e. the analyte of interest may not be completely retained by the sorbent. In addition, the possibility of concentrating the analytes is limited, even though it is much better than for LLE, and this affects the detection limit.
Introduction
- 18 -
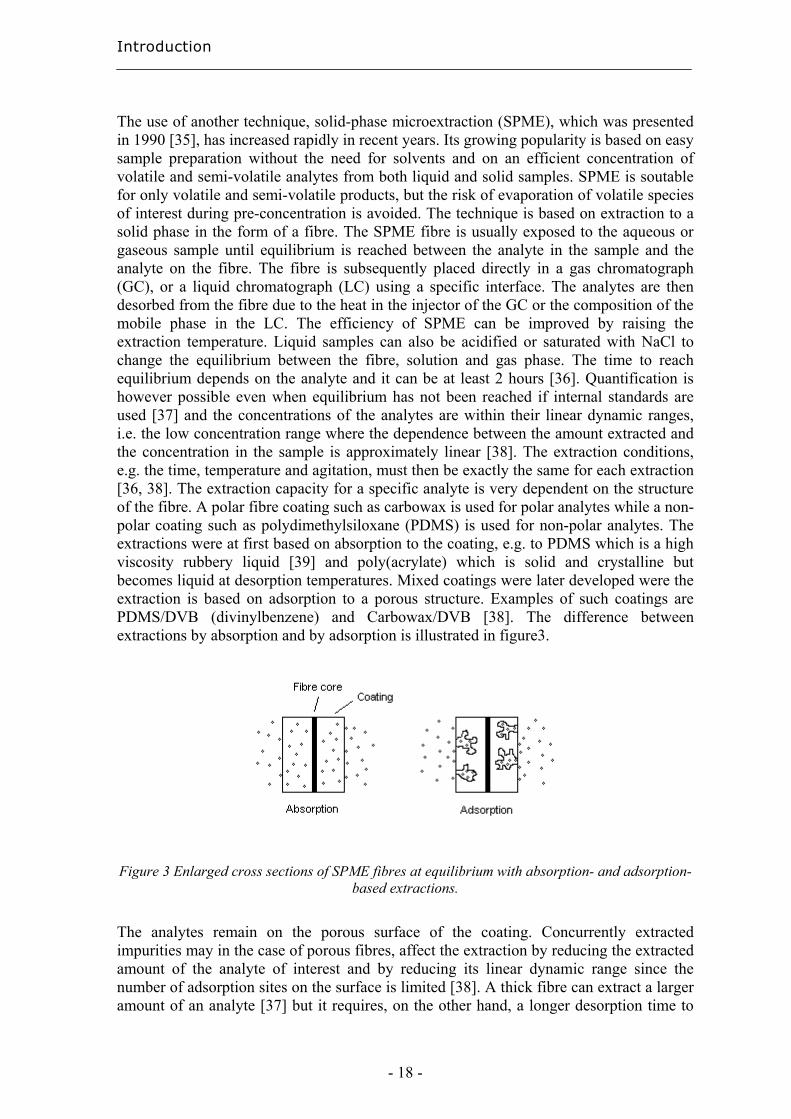
The use of another technique, solid-phase microextraction (SPME), which was presented in 1990 [35], has increased rapidly in recent years. Its growing popularity is based on easy sample preparation without the need for solvents and on an efficient concentration of volatile and semi-volatile analytes from both liquid and solid samples. SPME is soutable for only volatile and semi-volatile products, but the risk of evaporation of volatile species of interest during pre-concentration is avoided. The technique is based on extraction to a solid phase in the form of a fibre. The SPME fibre is usually exposed to the aqueous or gaseous sample until equilibrium is reached between the analyte in the sample and the analyte on the fibre. The fibre is subsequently placed directly in a gas chromatograph (GC), or a liquid chromatograph (LC) using a specific interface. The analytes are then desorbed from the fibre due to the heat in the injector of the GC or the composition of the mobile phase in the LC. The efficiency of SPME can be improved by raising the extraction temperature. Liquid samples can also be acidified or saturated with NaCl to change the equilibrium between the fibre, solution and gas phase. The time to reach equilibrium depends on the analyte and it can be at least 2 hours [36]. Quantification is however possible even when equilibrium has not been reached if internal standards are used [37] and the concentrations of the analytes are within their linear dynamic ranges, i.e. the low concentration range where the dependence between the amount extracted and the concentration in the sample is approximately linear [38]. The extraction conditions, e.g. the time, temperature and agitation, must then be exactly the same for each extraction [36, 38]. The extraction capacity for a specific analyte is very dependent on the structure of the fibre. A polar fibre coating such as carbowax is used for polar analytes while a non-polar coating such as polydimethylsiloxane (PDMS) is used for non-polar analytes. The extractions were at first based on absorption to the coating, e.g. to PDMS which is a high viscosity rubbery liquid [39] and poly(acrylate) which is solid and crystalline but becomes liquid at desorption temperatures. Mixed coatings were later developed were the extraction is based on adsorption to a porous structure. Examples of such coatings are PDMS/DVB (divinylbenzene) and Carbowax/DVB [38]. The difference between extractions by absorption and by adsorption is illustrated in figure3.
Figure 3 Enlarged cross sections of SPME fibres at equilibrium with absorption- and adsorption-
based extractions.
The analytes remain on the porous surface of the coating. Concurrently extracted impurities may in the case of porous fibres, affect the extraction by reducing the extracted amount of the analyte of interest and by reducing its linear dynamic range since the number of adsorption sites on the surface is limited [38]. A thick fibre can extract a larger amount of an analyte [37] but it requires, on the other hand, a longer desorption time to
Introduction
- 19 -
avoid carry-over. Thick fibres should therefore be avoided with semi-volatile analytes. Complex samples can with advantage be analysed using fibres with different polarities to reduce the complexity in the final chromatogram. [16]. The possibility of extracting from the gaseous phase (HS-SPME) is a great advantage with dirty samples and it provides a faster extraction than from a liquid due to the higher diffusion coefficients of the analytes [37]. The disadvantage is that the number of substances that can be extracted is limited, since they have to be sufficiently volatile. Direct extraction, with the fibre immersed in the sample solution, allows extraction of less volatile substances than at HS-SPME, but there are also limits in this case.
2.3 Chromatographic techniques Lacoste et al have quantified groups of degradation products using FTIR by derivatisation with NO and SF4 [40]. FTIR is a valuable technique for obtaining average values of the amounts of various product groups. Chromatographic techniques are however necessary if information is required regarding the positions of these groups on the individual chains, i.e. the structure of the molecules. The choice of chromatographic technique depends on the substances that are to be analysed. Gas Chromatography coupled to Mass-Spectrometry (GCMS) is very valuable for the identification of volatile and semi-volatile substances, while High Performance Liquid Chromatography (HPLC) provides high reproducibility and the possibility of also detecting and quantifying non-volatile substances. HPLC analysis has limits with regard to the size of the analysed molecules. High molecular weight substances can, depending on their size and structure, be analysed using other techniques such as Size Exclusion Chromatography (SEC), Matrix Assistant Laser Desorption-Time of Flight (MALDI-TOF) [41, 42], and Electrospray Ionisation-Mass Spectrometry (ESI-MS) [43, 44]. Gas Chromatography (GC) is based on separation due to the establishment of equilibrium between a gas stream and a solid or liquid phase in a thin column (inner diameter of approximately 0.1 to 0.53 mm) together with the effect of increasing temperature on the volatility of the analytes. For analysis, the analytes need to be volatile at the upper temperature limit of approximately 350 ºC. The volatility of the substances can sometimes be increased by reaction with a derivative agent [45]. The choice of column depends on the chemical properties of the analytes of interest. HPLC is the best choice for thermally unstable substances since they may decompose in the GC [46, 47]. The substances are separated due to the establishment of equilibrium between a mobile liquid phase and a stationary phase inside a column with an inner diameter of approximately 2 to as much as 21 mm. The efficiency of the separation depends on the chemical properties of the analytes, the structure and pore size of the stationary phase, the length and inner diameter of the column and the composition of the mobile phase. The pore size of the stationary phase is approximately 3 to 10 µm where 3 or 5 µm are the most commonly used sizes. An increase in temperature using a column oven decreases the total analysis time but it can decrease the sensitivity of the analysis.
Introduction
- 20 -
2.4 Chemiluminescence Polyolefins emit a weak light, luminescence, when heated in air. In the early 1960’s this luminescence effect was linked to the oxidation of the polymer [48]. Ashby noted differences in the intensity of the light emitted from PP that contained different antioxidant concentrations and types, which suggested that the phenomenon could be used to study polymer stability. It was early seen [49] that a larger number of tertiary carbon atoms generally leads to a higher light intensity and that the light emission does not stop immediately but decays exponentially with time when the atmosphere is changed from oxygen to nitrogen. The number of photons emitted from a polyolefin can be counted during the degradation time and this number can be related to the amount of hydroperoxides and thereby the degree of aging. It is not entirely clear what mechanism causes the chemiluminescence (CL). The most accepted is the Russel Mechanism [50] where the termination of alkyl-peroxy radicals is the source of excited ketones and singlet molecular oxygen, which can be capable of exciting photon emission. It has earlier also been suggested that the chemiluminescence can be caused by the decomposition of polymer hydroperoxides [51]. Neither of these reactions requires the presence of oxygen. In CL studies, the sample is most often aged by thermal oxidation in the sample chamber during the measurement. This procedure is unfortunately ineffective for large quantities of sample, and it means that the degradation must take place at high temperatures to make emission detection possible since the emission per time unit decreases rapidly with decreasing temperature. This is true for polyethylene, more than polypropylene, since polyethylene emit less photons per time unit and melt at a lower temperature. Evaluation of the long-term performance requires measurements below the melting temperature to obtain relevant data. The measurement of total luminescence intensity allow for degradation outside the instrument at low temperatures and of many samples at the same time. The pre-aged sample is analysed in an atmosphere of nitrogen to avoid further oxidation. The temperature is increased at a constant rate and the area under the curve of the CL intensity versus the temperature, i.e. the total luminescence intensity (TLI), can be related to the amount of hydroperoxides present in the sample after the specific time of ageing [52, 53].
2.5 Multivariate data analysis The amount of data that can be obtained by analysis using e.g. chromatographic and spectrometric techniques has increased dramatically. Wold [54] introduced the principle of Multivariate Data Analysis (MDA) in the mid-seventies as a way to be able to get as much information as possible from these data. Estimates based on many variables have in addition the advantage of being more robust than estimates from a few measurements since the first are decided with higher degrees of freedom [55]. Principal Component Analysis (PCA) is a qualitative method where the X-data, e.g. the amounts of different degradation products, can be studied without any knowledge of the Y-data, e.g. the degradation time. A score plot of the X-data gives an overview of possible patterns in the data and it is therefore a useful tool for classification. The X-data are explained using uncorrelated vectors in pairs called principal components (PC). The first principal component (PC1) is in the direction of the largest variation in the
Introduction
- 21 -
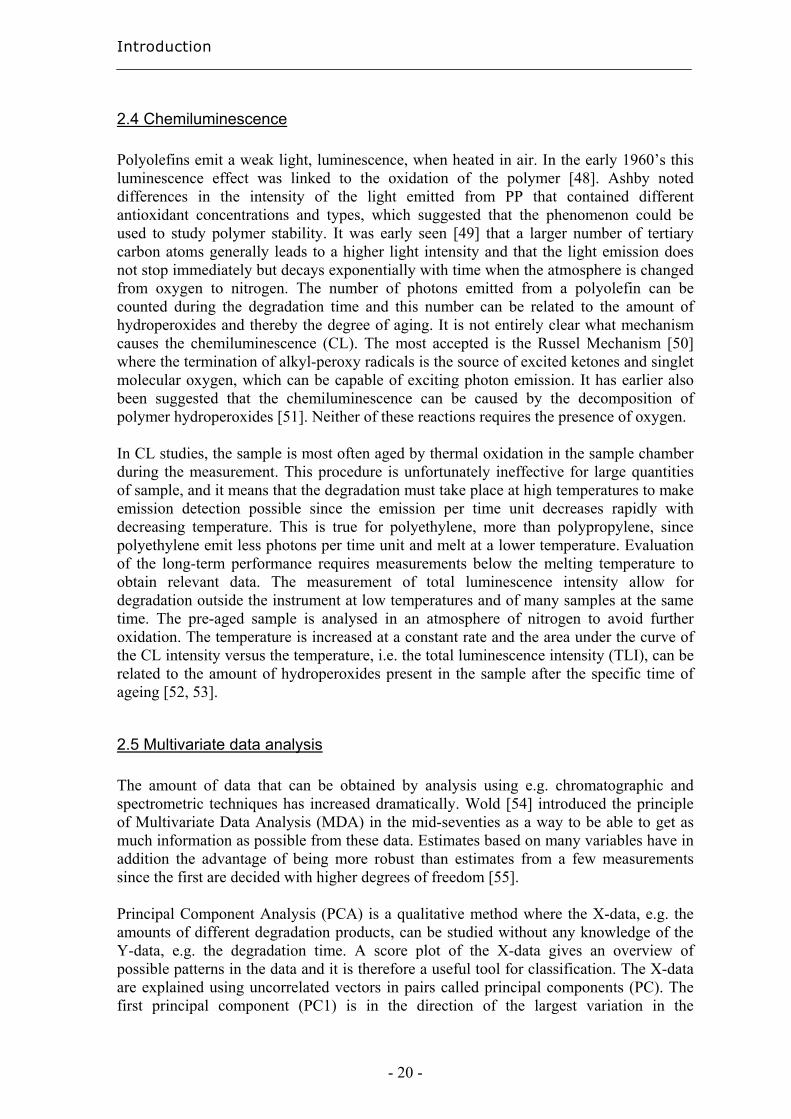
multidimensional X space, figure 4. PC2 is in the direction of the second largest variation perpendicular to PC1 etc, all orthogonal to each other. The two-dimensional plane containing two principal components, e.g. PC1 and PC2, is called a score plot.
Figure 4 Position of principal components in a PCA model
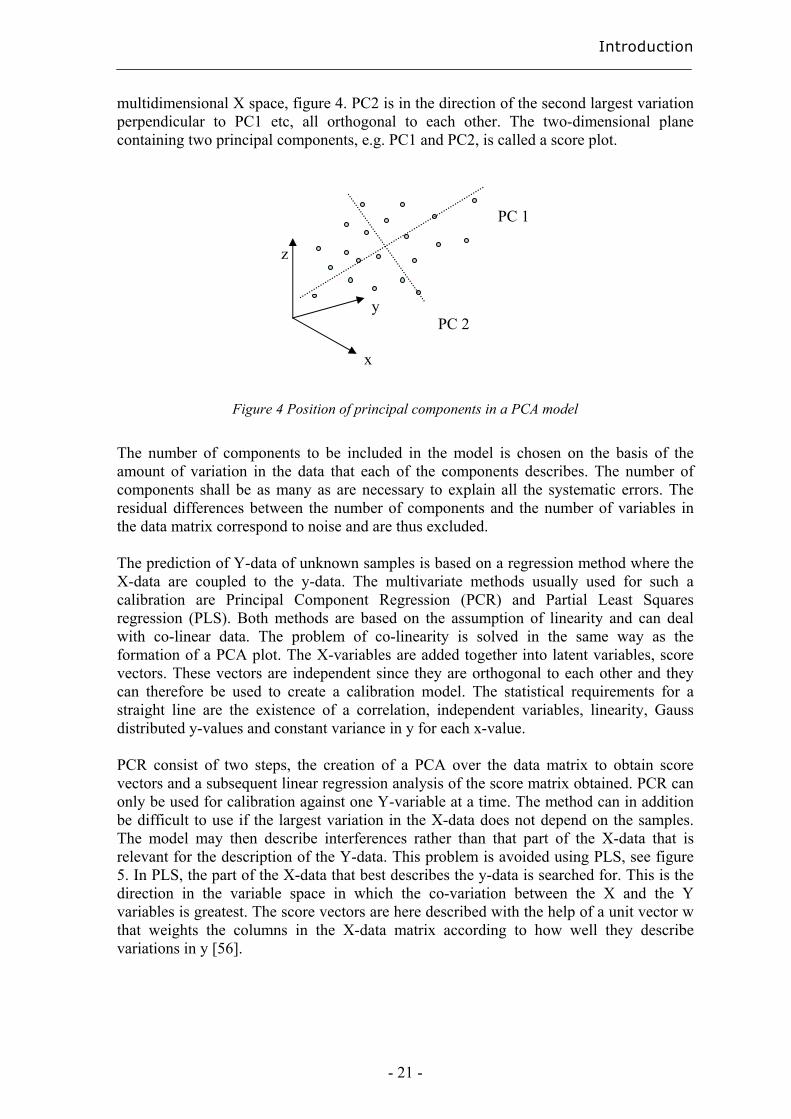
The number of components to be included in the model is chosen on the basis of the amount of variation in the data that each of the components describes. The number of components shall be as many as are necessary to explain all the systematic errors. The residual differences between the number of components and the number of variables in the data matrix correspond to noise and are thus excluded. The prediction of Y-data of unknown samples is based on a regression method where the X-data are coupled to the y-data. The multivariate methods usually used for such a calibration are Principal Component Regression (PCR) and Partial Least Squares regression (PLS). Both methods are based on the assumption of linearity and can deal with co-linear data. The problem of co-linearity is solved in the same way as the formation of a PCA plot. The X-variables are added together into latent variables, score vectors. These vectors are independent since they are orthogonal to each other and they can therefore be used to create a calibration model. The statistical requirements for a straight line are the existence of a correlation, independent variables, linearity, Gauss distributed y-values and constant variance in y for each x-value. PCR consist of two steps, the creation of a PCA over the data matrix to obtain score vectors and a subsequent linear regression analysis of the score matrix obtained. PCR can only be used for calibration against one Y-variable at a time. The method can in addition be difficult to use if the largest variation in the X-data does not depend on the samples. The model may then describe interferences rather than that part of the X-data that is relevant for the description of the Y-data. This problem is avoided using PLS, see figure 5. In PLS, the part of the X-data that best describes the y-data is searched for. This is the direction in the variable space in which the co-variation between the X and the Y variables is greatest. The score vectors are here described with the help of a unit vector w that weights the columns in the X-data matrix according to how well they describe variations in y [56].
x
z
y
PC 1
PC 2
Introduction
- 22 -
Figure 5 The differences in the direction of the first component for PCR and PLS when the largest
variation in the X-data does not depend on the samples
There are two kinds of PLS, viz. PLS 1 and PLS 2 [57]. PLS 1 can only be used for calibration towards one Y-variable at a time whereas PLS 2 can be used for the calibration of many Y-variables simultaneously in the same model. PLS 2 gives a more general model with a poorer prediction especially in the case of non-linearity, but it can be better than PLS 1 if there is a covariation between the samples. A PLS model can deal only with values that fit into its domain. The model does not take into consideration the possibility that the calibration curve can be non-linear at high and low concentrations. In the case of multivariate calibration, the variables can have different units. It is then necessary to scale these variables to eliminate differences in their relative sizes so that they are all taken into consideration. When the variables are scaled, each of them is divided by its standard deviation. The variables are usually also centred to make sure that the largest variation in the space is described by the principal components [58].
x
y
PC
PLS
Experimental
- 23 -
3 Experimental
3.1 Materials
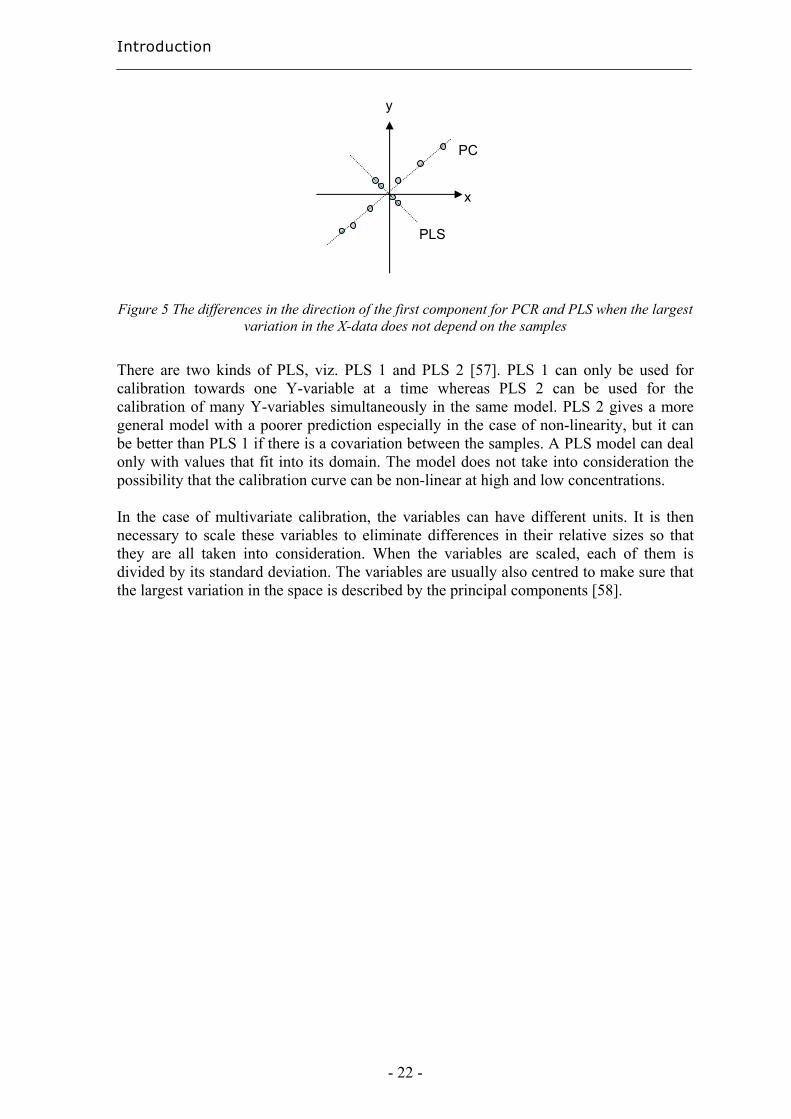
3.1.1 Degradable polyethylene The LLDPE used was an octene copolymer from Dow Plastics with a melting index of 1 and a density of 0.916 g/ml. The films were made on a two-layer axon line with extruders with screw diameters of 18 mm. The thickness of the films was 15 µm. Three film samples containing prooxidants were studied with pure LLDPE as reference. The samples are listed in table 1. The prooxidants in the films were a Fe(II)-stearate MB that consisted of Fe(II)-stearate from Alfa Aesar containing 9% iron and LDPE from Borealis (LE 6100) with a density of 0.923 g/ml, polyoctylene from Creanova (Vestenamer 6213), and a commercial metal catalyst Ampacet masterbatch No 30091 (Ampacet Scandinavia AB, Malmö, Sweden). The amount of Ampacet MB used in the film was chosen to be comparable to 10% Fe(II)-stearate MB. All the films were kindly provided by Tenova AB (Norrköping, Sweden).
Abbreviation Composition PE 100% LLDPE
PE-M 10% Fe(II)-stearate MB and 90% LLDPE PE-MO 10% Fe(II)-stearate MB, 10% polyoctylene and 80% LLDPE PE-A 7.5% Ampacet MB and 92.5% LLDPE
Table 1 Composition and abbreviation of degradable polyethylene
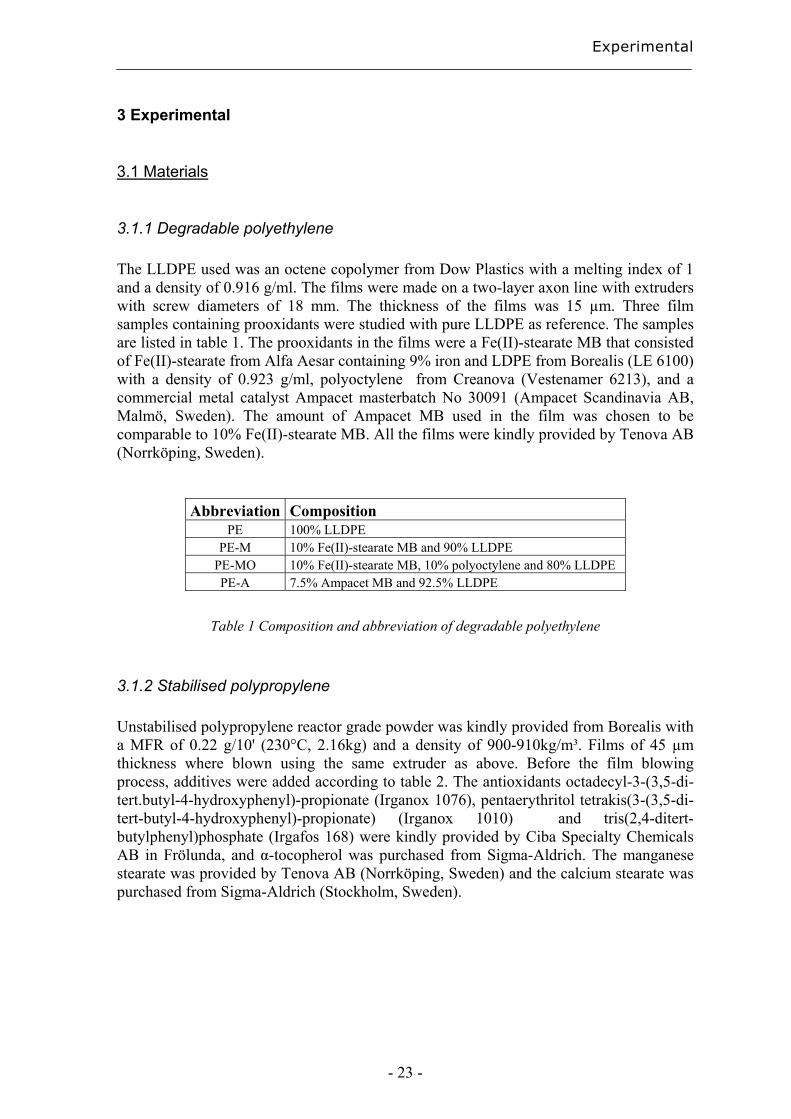
3.1.2 Stabilised polypropylene Unstabilised polypropylene reactor grade powder was kindly provided from Borealis with a MFR of 0.22 g/10' (230°C, 2.16kg) and a density of 900-910kg/m³. Films of 45 µm thickness where blown using the same extruder as above. Before the film blowing process, additives were added according to table 2. The antioxidants octadecyl-3-(3,5-di-tert.butyl-4-hydroxyphenyl)-propionate (Irganox 1076), pentaerythritol tetrakis(3-(3,5-di-tert-butyl-4-hydroxyphenyl)-propionate) (Irganox 1010) and tris(2,4-ditert-butylphenyl)phosphate (Irgafos 168) were kindly provided by Ciba Specialty Chemicals AB in Frölunda, and α-tocopherol was purchased from Sigma-Aldrich. The manganese stearate was provided by Tenova AB (Norrköping, Sweden) and the calcium stearate was purchased from Sigma-Aldrich (Stockholm, Sweden).
Experimental
- 24 -
Abbreviation Additive content
1076-ref 0.1% Irganox 1076 + 0,1% calcium stearate 1010-ref 0.1% Irganox 1010 + 0,1% calcium stearate a-toc-ref 0.1% a-tocopherol + 0,1% calcium stearate 1076-Mn 0.1% Irganox 1076 + 0,1% manganese stearate 1010-Mn 0.1% Irganox 1010 + 0,1% manganese stearate a-toc-Mn 0.1% a-tocopherol + 0,1% manganese stearate
Table 2 Composition of additives in polypropylene
3.2 Degradation procedures
3.2.1 Degradation in air The degradable polyethylene samples were degraded using UV or thermal oxidation. The thermal oxidation was carried out in open containers in air at 80°C. The UV-degraded samples were aged using a QUV/SE accelerated Weathering Tester with eight UVA-340 lamps. The unit was programmed to give cycles with 8 h condensation at 50ºC and then 16 h UV at 60ºC and an intensity of 0.77 W/m2/nm continuously during the total degradation time. Samples were withdrawn after different times of degradation, sealed and put in a refrigerator to await analysis. The thermal oxidation of polypropylene films for antioxidant efficiency studies was carried out in air in an oven at 40, 60, 80, 100 and 120°C. Films containing only stabilisers and those containing prooxidant were oxidised in separate ovens. Samples were frequently inspected visually and taken out for analysis.
3.2.2 Degradation in organic aqueous solution Samples were prepared by filling 20 ml glass vials with strips of polypropylene film containing antioxidants, approximately 5 cm long, to a total weight of about 0.3 g. 14 ml of 10 % EtOH/H2O solution (99.5% pure ethanol from Kemetyl AB and Mill-Q water), simulating a pharmaceutical solution, was subsequently transferred to each vial. Each vial was closed with a PTFE Butyl septum (Perkin Elmer, Upplands-Väsby, Sweden). The samples were thereafter stored in an oven at 40 °C (+/- 0.5°C) for up to 12 months and at 60 °C (+/- 1°C) for 2.5 months before SPE and at 80 °C (+/- 1°C) for 4 months before SPME. After this period, the samples were placed in a refrigerator at 4 °C where further degradation was considered negligible. Some of the samples aged at 40 or 60 °C went through a sterilisation procedure using a Certo Clav A-4050 Tisch-Autoclav, at 120 °C for 20 min, before the ageing.
Experimental
- 25 -
3.3 Extraction methods
3.3.1 Liquid-solid extraction (LSE) LSE was used to extract degradation products from degradable polyethylene films. The focus was on the extraction of carboxylic acids. A 0.1 vol-% HCl / MeOH extraction solution was prepared containing 0.005mg/ml of 5-phenylvaleric acid and 4-phenylbutyric acid as internal standards. The degraded film was analysed in triplicate (approximately 0.13 g each). 4 ml of the extraction solution was added to each sample vial and a blank. The vials were then sealed and kept at room temperature for 4.5 h and in an oven at 60ºC for 1.5 h for extraction and methylation. The vials were cooled for 30 min at room temperature and were then opened for slow evaporation in a fume cupboard to total dryness during approximately 12 h. A second extraction solution was prepared containing 0.02 mg/ml of decanoic acid ethyl ester in hexane. 1 ml of this solution was added to each sample. The samples were stirred and sealed. The extracts were finally collected after 3 h for analysis. The degree of evaporation of the acids, due to the change of solvent, was calculated by extracting two different aged samples as described above, but here 100 µl of the extracts was taken before the evaporation of the acidified methanol. The responses of the acid peaks, relative to those of standards and large acids, were compared with the corresponding values in the final extract, and this gave the percentage decrease. Each analysis was carried out in duplicate. Methanol and hexanol of HPLC quality were used for the extractions. The internal standards 5-phenylvaleric acid, 4-phenylbutyric acids and decanoic acid ethylester were supplied by Sigma-Aldrich. Analytical standards were used for the identification.
3.3.2 Microwave-Assisted Extraction (MAE) A microwave extraction system, MES 1000 manufactured by CEM (CEM Corp. Indian Trail, NC, USA) with a nominal power output of 950 ± 50 W, was used for the extraction of antioxidants from polypropylene films. 12 samples were extracted simultaneously. 0,4 g of film was cut into approximately 1*1 cm pieces and added, together with 5 ml isopropanol (HPLC quality) and 5 ml internal standard (0.04 mg/ml) in isopropanol, to each extraction vial. The temperature was first ramped in two stages up to 110 ˚C for totally 10.3 min, with 75% power during the first 6 min (up to 80 ˚C) and then 100% power. The extraction was thereafter continued at 110 ˚C for 30 min. The extraction vessels were allowed to cool for 30 min before they were opened. The extracts were filtered prior to analysis using filters of Teflon with a pore size of 0.45 µm. Extractions using other extraction times (20 to 60 min), other temperatures (60 to 120 ˚C) and other solvents (cyclohexane/isopropanol, cyclohexane/acetone and acetonitrile) were evaluated in the development of the method. All the solvents used were of HPLC quality. The data analysis program Modde (Umetrics AB, Umeå, Sweden) was used for optimisation models.
Experimental
- 26 -
3.3.3 Solid-Phase Microextraction (SPME) SPME is a useful technique for the analysis of very small amounts of volatile and semi-volatile substances. SPME methods were investigated with the fibre either immersed in the sample solution (direct SPME) or with the fibre exposed to the headspace above the solution (HS-SPME). The extractions were performed in sealed 20 ml glass vials using 15 ml (direct) or 10 ml solutions (headspace) from aged samples or solutions containing standard substances of known concentrations. The pH of the samples was adjusted to 2, with a 0.5 M HCl-solution, and they were saturated with salt except for in the part of the method development were the effect of these factors were investigated. The desorption time was 6 min and the temperature 250 °C unless stated otherwise. The experiments with direct SPME sampling were executed using a manual fibre holder (Supelco, Bellefonte, PA, USA) and analysed using a GC with FID detector, in order to avoid salts entering the ion-trap mass detector otherwise used. During each extraction, the fibre was placed at the same height with respect to the surface of the aqueous phase in the sample, with 75 % of the fibre immersed and the remaining 25 % of the fibre in the headspace, in order to prevent the ethanol in the solution from destroying the means of attachment of the fibre. The vials were placed in a water bath with adjustable temperature. The solutions in the vials were agitated at the highest possible constant stirring rate without any bouncing motion of the magnet. Single or, when appropriate, several fibre blanks were run daily to check that no carry-over was present. To avoid systematic errors, all analyses were carried out in random order. Five fibres were initially compared, polydimethylsiloxane (PDMS), 100 µm; polydimethylsiloxane-divinylbenzene (PDMS/DVB), 65 µm; polyacrylate, 85 µm; carboxen™/polydimethylsiloxane (CAR/PDMS), StableFlex 85 µm; and carbowax©/divinylbenzene (CW/DVB), 65 µm (Supelco, Bellefonte, PA, USA). Solutions from 14 of the original sample vials were mixed in order to exclude deviations in results due to sample inconsistency. The water bath was kept at 40 °C, the extraction time was 60 min and the desorption time 6 min. Prior to each sample analysis, an extraction run and a subsequent analysis of a blank vial were carried out for each fibre, in order to eliminate interfering peaks. Two analyses were performed using HS-SPME and a PDMS/DVB fibre in order to compare the capacities of HS-SPME and direct SPME. These comparisons and the remaining extractions in the method development were made on standard solutions. By comparing responses in the analyses, the concentrations of the analytes in the standard solution were adjusted to correspond to the concentrations of the analytes in the sample solutions. The substances used and their abbreviations are presented in table 3. The 2,6-ditertbutyl-p-benzoquinone (98%) was purchased from Lancaster Synthesis (Morecambe, England), 3,5-ditertbutyl-4-hydroxyphenylpropionic acid (98%) from Alfa Aesar (Karlsruhe, Germany), diphenyl phosphate (98%) from Sigma-Aldrich (Steinheim, Germany) and 2,4-ditertbutyl-phenol (97 %), 2,6-ditertbutyl-4-methoxyphenol (97%), 3,5-ditertbutyl-4-hydroxybenzoic acid (99%), triphenyl phosphate (99%) and tri-p-tolyl phosphate (90%) were purchased from Acros Organics (Geel, Belgium). The standard solution for the development of the direct SPME method contained dtb-p, dtb-mp, dtb-bq, dtb-hba, dpp and ttp. The validation was performed using a new standard solution that contained also dtb-hppa and a 10 times larger amount of tpp compared to the solution used in the method development.
Experimental
- 27 -
Substance Abbrevation 2,4-ditertbutyl-phenol Dtb-p 2,6-ditertbutyl-p-benzoquinone Dtb-bq 3,5-ditertbutyl-4-hydroxyphenylpropionic acid Dtb-hppa 2,6-ditertbutyl-4-methoxyphenol Dtb-mp 3,5-ditertbutyl-4-hydroxybenzoic acid Dtb-hba Triphenyl phosphate Tpp Tri-p-tolyl phosphite Ttp Diphenyl phosphite Dpp
Table 3 Substances and abbreviations
Headspace extractions were tested at 40 °C for 60 and 80 min, at 55 °C for 40, 60 and 80 min and at 70 °C for 20, 40 and 60 min, to identify the best extraction conditions. Subsequent desorptions were carried out at 250 ºC for 6 min. The extractions were made in duplicate on a standard solution containing all the standards listed in table 3. The pH of the samples was adjusted to 2, saturated with NaCl, and sealed with magnetic silicon/PTFE crimp caps (Varian, Lake Forest, CA, USA). The concentrations in the standard solutions were adjusted for the extraction from headspace, since some of the analytes had higher responses than those of the real samples. Standard deviations and detection limits were estimated to validate the final HS-SPME methods.
3.3.4 Solid-Phase Extraction (SPE) Extractions were performed using SPE for comparison with SPME. The SPE sorbents used, C18 (octadedcyl), and 101 (polystyrene-divinylbenzene), were kindly provided from Sorbent AB, Västra Frölunda, Sweden. The sorbents were obtained within cartridges of different sizes depending on the amount and kind of sorbent, 25 mg of C18 and 25 mg of 101 were in 1 ml cartridges, and 100 mg of C18 and 100 mg of 101 were in 3 ml cartridges. The solvents used were methanol, (Merck, Darmstadt, Germany) and isopropanol (Scharlau, Barcelona, Spain), both of HPLC quality, and ethanol (Kemetyl AB, Haninge, Sweden) of 99.5% purity. The validation of the optimised method was carried out using a 10 % solution of ethanol in water containing 0.0002 mg/ml of dtb-p, dtb-bq, dtb-mp, dpp, Irganox 1010, Irganox 168 and ethylated dtb-hppa. The dtb-hppa was ethylated using a 0.1 vol-% HCl in ethanol solution prior to being mixed with the other analytes. The substances are presented in table 3 and in chapter 3.1.1. The sorbents were conditioned in 1 ml of methanol. They were thereafter equilibrated using 2 ml of a 10 % solution of ethanol in water. 10 ml of the standard or sample solution was used for each extraction. Both the equilibrium solution and the standard or sample solutions were acidified to pH 2 using a 0.5 M HCl solution. The sorbents were dried using compressed air prior to the elutions. The solutions and solvents were allowed to pass through the sorbent under the influence of gravity. The sample solutions were extracted after storage at 80 ˚C using 100 mg of C18 and 100 mg of 101 and after storage at 40 and 60 ˚C using 25 mg of 101 as sorbent. 500 µl isopropanol was used for the elution. The extractions were performed in duplicates unless stated otherwise.
Experimental
- 28 -
3.3.5 Soxhlet extraction The soxhlet extractions were performed with 1.5 g of film in 100 ml chloroform for 5 and 10 hours. The extracts were thereafter evaporated to dryness using a rotor evaporator, disolved in 5 ml chloroform, filtered and finally analysed with normal-phase HPLC. The soxhlet thimbles were purchased from GTF, Gothenburg, Sweden.
3.3.6 Ultrasonic extraction Ultrasonic extractions were performed using a 2210 Branson ultrasonic cleaner (Branson Ultrasonics B.V., Soest, Netherland). Four different extraction methods were used: extraction with 4 ml 1:1 dichloromethane/cyclohexane, with 8 ml 1:1 dichloromethane/cyclohexane, with 3 ml acetonitrile and with 8 ml chloroform. All extractions were performed with 0.3 g film for 1 hour. All the extractions were performed in duplicates.
3.5 Analytical techniques
3.5.1 Gas Chromatography - Mass Spectrometry (GC-MS) Analyses of extracted degradation products from degradable polyethylene and from HS-SPME were performed on a GCQ GC-MS from ThermoFinnigan (San José, CA, USA) equipped with a Gestel MPS2 (Mülheim and der Ruhr, Germany) SPME autosampler, except for the early comparisons with direct SPME on the instrument described below. The column was a CP-Sil 8 CB/MS from Varian with dimensions 30 m * 0.25 mm * 0.25 µm (purchased from Scantec Lab, Partille, Sweden). The injector temperature was 250 ºC. The oven temperature was initially 40ºC for 5 min. Thereafter it was increased at a rate of 5 ºC/min to 250 ºC and finally remained at 250 ºC for 10 min. The ion-trap mass spectrometer scanned in the mass range of 35 - 650 m/z. Helium (99.9999% purity from AGA, Stockholm, Sweden) was used as carrier gas. The analyses were performed with splitless injection. The filament was switched off during the first 5 min for the polyethylene extracts and the first 4 min for the SPME analysis to avoid overloading the ion-trap. All analyses by direct SPME were performed on a Varian 3400 Gas Chromatograph (Walnut creek, CA, USA) with a WCOT fused silica CP-Sil 8 CB low bleed column, 30 m × 0.25 mm × 0.25 µm (Varian purchased from Scantec Lab, Partille, Sweden). The GC was equipped with a FID detector. With the exception of the last step in the method development, the column temperature was kept at 40 °C for 3 minutes and subsequently programmed to increase to 250 °C at a rate of 10 °C/min, after which the column was held at 250 °C for 10 minutes. The injector temperature was 250 °C and the detector temperature 275 °C. The splitter vent was closed and nitrogen (99.9999% purity from AGA, Stockholm, Sweden) was used as carrier gas.
Experimental
- 29 -
3.5.2 High Performance Liquid Chromatography (HPLC) The HPLC analysis after microwave extraction and some of the ultrasonic extractions were performed using a Hewlett Packard series 1100 equipped with a variable wavelength detector and connected to a LC-Load Shimadzu pump. The analyses were run under isocratic conditions with a solution of 95% acetonitrile and 5% water as the mobile phase, both of HPLC quality. The column used was a Symetry C18, 3.9’50 mm, 5 µm (Waters, Sollentuna, Sweden). The injection volume was 10 µl, the flow rate 1 ml/min and the column temperature 40 °C. The detections were made at 220 nm. The time for each run was 20 min. All the normal phase HPLC analysis, after soxhlet extractions and some ultrasonic extractions, and all the reversed phase HPLC analysis, after solid phase extractions, were performed on a Hewlett Packard 1090 HPLC series II equipped with a DAD detector. The column used for the normal phase analysis was a Supelcosil LC-Si column (purchased from Sigma-Aldrich, Stockholm, Sweden) 150*4.5 mm with 5 µm pore size. Chloroform of HPLC quality was used as mobile phase. The flow rate was 1 ml/min and the detections were made at 280 nm. The column used for analysis after solid phase extraction was a Discovery RP Amide C16 150*4.6 mm, 5 µm. A Vaco pre-column frit filter, 5 µm and a Discovery RP Amide C16 Guard column 20*4.0 mm, 5 µm, were used to protect the column (all purchased from Sigma-Aldrich, Stockholm, Sweden). Acetonitrile was used as mobile phase A and water as mobile phase B, both of HPLC grade (Merck, Darmstadt, Germany). The mobile phases were degassed using helium (99.9999% purity from AGA, Stockholm, Sweden). 50 µl were injected each time and detections were made at 220 nm. The gradient method was carried out in several steps viz.: (1) 30 % A with 0.25 ml/min for 5 min, (2) increase to 98 % A during 40 min with 0.25 ml/min, (3) increase to 0.4 ml/min during 5 min with 98 % A, (4) decrease to 0.25 ml/min during 20 min with 98 % A, (5) 98 % A with 0.25 ml/min for 5 min, (6) decrease to 30 % A during 5 min, 0.25 ml/min, (7) 30 % A with 0.25 ml/min for 5 min.
3.5.3 Chemiluminescence (CL) Ramp tests in an atmosphere of pure nitrogen were performed using a Lumipol-2 chemiluminescence instrument to determine the changes in the amount of hydroperoxides in the samples after different aging times. The samples were first held at 60 °C for 10 min to allow the oxygen in the sample chamber to disappear. The temperature was then increased at a rate of 2.5 °C/min up to 180 °C. Duplicate tests were carried out for each film.
3.5.4 Differential Scanning Calorimetry (DSC) The crystallinity and melting behaviour were measured with a Mettler-Toledo 820 DSC with samples weighing 3-7 mg in 100 µl Al cups. The heating and cooling rates were 10ºC/min. Thermograms were recorded in five steps: (1) Heating from 0 to 180ºC, (2) constant temperature of 180ºC for 3 min, (3) cooling from 180 to 0ºC, (4) constant temperature of 0ºC for 3 min, and finally (5) a second heating from 0 to 180ºC. The crystallinity was calculated from the ratio of the melting enthalpy of the sample to the melting enthalpy for 100% crystalline polyethylene, with an enthalpy of 293 J/g
Experimental
- 30 -
according to Wunderlich [59]. All data were taken from the second heating. Triplicate or duplicate measurements were obtained for each measuring point.
3.5.5 Fourier Transform Infrared Spectroscopy (FTIR) FTIR measurements were performed on a Perkin-Elmer 2000X FTIR spectrometer to enable changes in the carbonyl region to be assessed. The instrument was equipped with a Golden Gate single reflection ATR unit with a diamond crystal. The spectra were taken as an average of 20 scans at a resolution of 4 cm-1.
3.5.6 Size - Exclusion Chromatography (SEC) The molecular weights were assessed by Rapra Technology Limited on a PL200 SEC from Polymer Laboratories. The instrument was equipped with a PLgel guard column and two mixed bed-B columns (30 cm, 10µm) and a refractive index detector. 1,2-dichlorobenzene (stabilised with Santonox R) was used as mobile phase with a flow rate of 1.0 ml/min and a temperature of 140ºC. 30 mg sample was dissolved in 15 ml 1,2-dichlorobenzene. Calibration was performed using standards of polystyrene and a mathematical procedure involving the use of viscosity constants from literature to compensate for differences between the standards and samples. .
Results and Discussion
- 31 -
4 Results and Discussion The following chapter presents first the development of various extraction methods. These methods, together with chromatographic analysis, are thereafter used as tools for the evaluation of the long-term properties and environmental effects of polyolefins. The last part deals with the development of methods for the classification of materials and for early and rapid degradation detection.
4.1 Extraction methods for the evaluation of the long-term performance of polyolefins Suitable extraction methods are vital for the chromatographic analysis of the long-term performance of polymers and their environmental interactions. The choice of extraction technique depends on the analytes, on the surrounding media and on the purpose of the extraction.
4.1.1 Liquid/solid extraction for fingerprinting the degradation products from polyolefins with focus on carboxylic acid Chromatographic fingerprinting demands comparable patterns, which does not necessarily means that complicated extraction procedures are necessary as long as the products of interest can be relatively quantified with the aid of a suitable internal standard. The most abundant group of degradation products from polyethylene consist of carboxylic acids [45, 60, 61]. An extraction method was developed with a focus on these acids. Carboxylic acids within polyethylene films were extracted and simultaneously methylated using acidified methanol [16, 45]. The methylation facilitates the analysis using gas chromatography mass spectrometry (GC-MS) by decreasing the acids polarity and thereby increasing the volatility of the acids. Standard solutions containing 0.025 µl/ml of monoacids and decanoic acid ethyl ester as internal standard were methylated at 60 and 80 °C for 0.25 to 2.5 h to find suitable methylation conditions. Such methylation conditions were determined by the changes in detection responses for the acids in comparison with the standard and by the formation of new compounds due to the degradation of the acids. The best conditions were 60°C for 1,5 h or 80°C for 30 min. The first alternative was chosen due to the greater risk of degradation and to the greater time-sensitivity at 80°C. The extraction solvent was changed, by evaporation, from the acidified methanol to n-hexane to obtain better peaks in the chromatograms and more different large carboxylic acids and larger amounts of the acids. The increase in sensitivity was most obvious in the case of the large mono-carboxylic acids. The change to the more hydrophobic solvent barely affected the complexity of the chromatogram due to the relatively short contact with the sample, but it led to evaporation of the low molecular weight acids. The evaporation was compensated for by multiplying the detection response of each acid with a factor corresponding to the degree of evaporation of the acid.
Results and Discussions
- 32 -
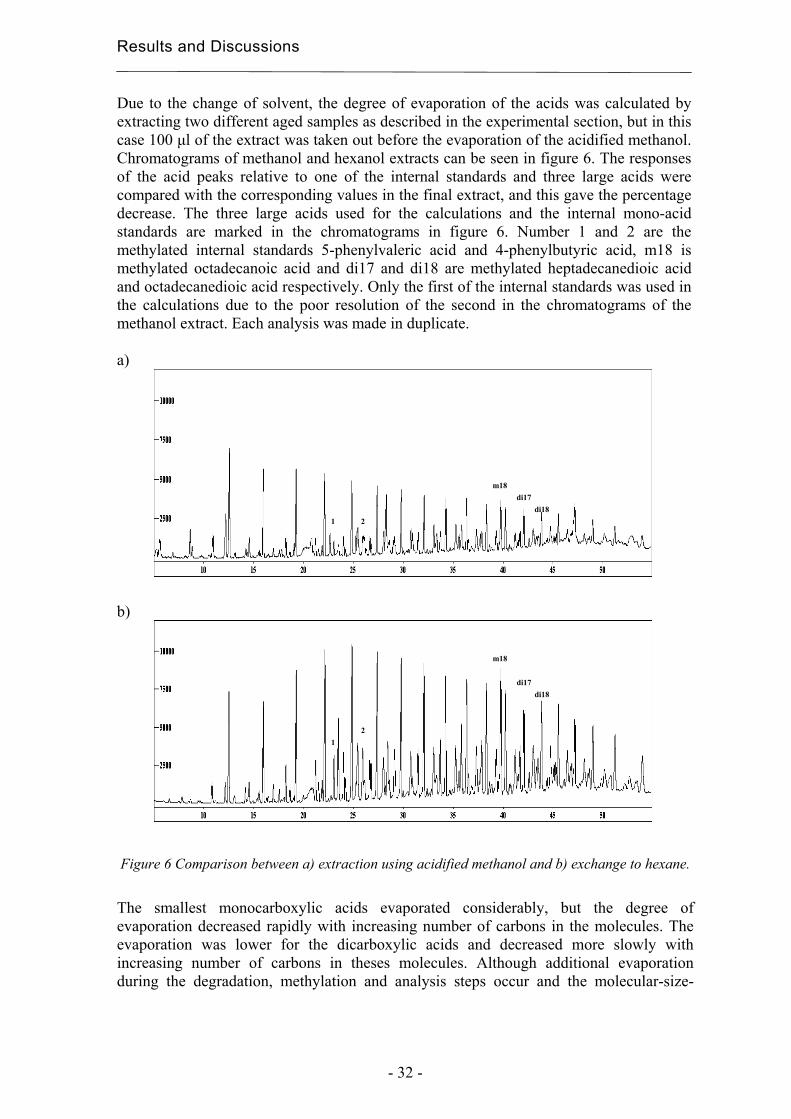
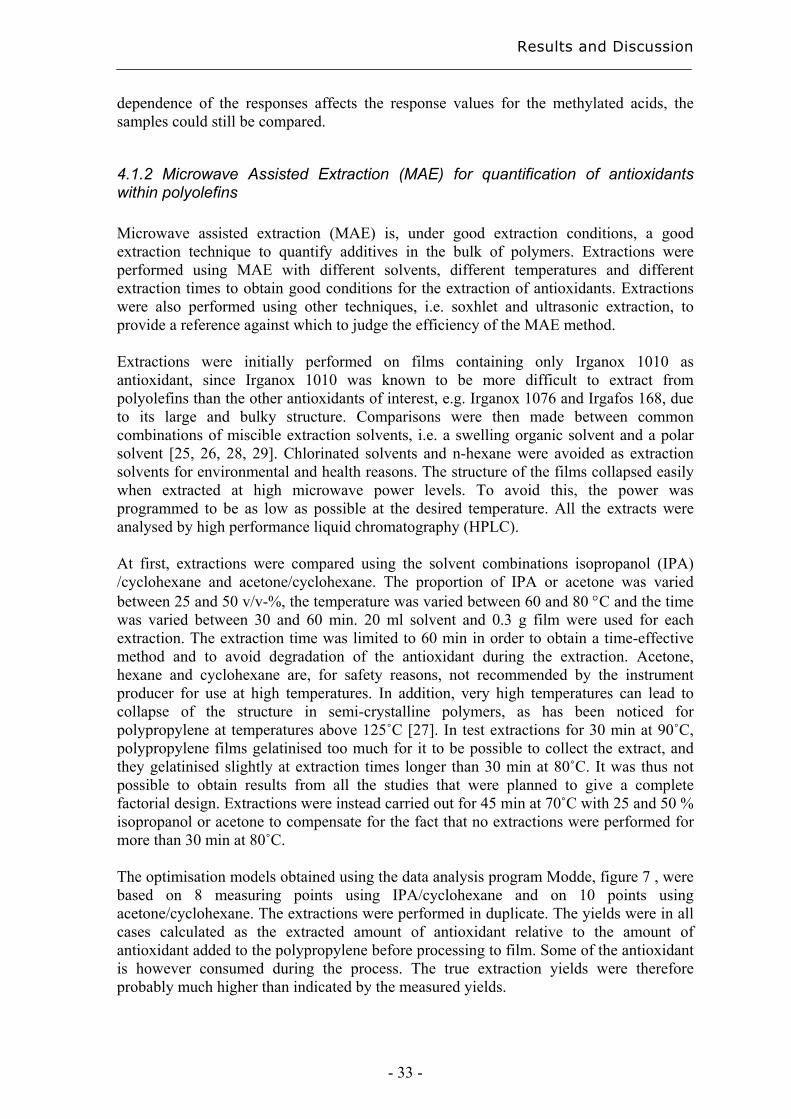
Due to the change of solvent, the degree of evaporation of the acids was calculated by extracting two different aged samples as described in the experimental section, but in this case 100 µl of the extract was taken out before the evaporation of the acidified methanol. Chromatograms of methanol and hexanol extracts can be seen in figure 6. The responses of the acid peaks relative to one of the internal standards and three large acids were compared with the corresponding values in the final extract, and this gave the percentage decrease. The three large acids used for the calculations and the internal mono-acid standards are marked in the chromatograms in figure 6. Number 1 and 2 are the methylated internal standards 5-phenylvaleric acid and 4-phenylbutyric acid, m18 is methylated octadecanoic acid and di17 and di18 are methylated heptadecanedioic acid and octadecanedioic acid respectively. Only the first of the internal standards was used in the calculations due to the poor resolution of the second in the chromatograms of the methanol extract. Each analysis was made in duplicate. a)
b)
Figure 6 Comparison between a) extraction using acidified methanol and b) exchange to hexane.
The smallest monocarboxylic acids evaporated considerably, but the degree of evaporation decreased rapidly with increasing number of carbons in the molecules. The evaporation was lower for the dicarboxylic acids and decreased more slowly with increasing number of carbons in theses molecules. Although additional evaporation during the degradation, methylation and analysis steps occur and the molecular-size-
1 2
m18 di17
di18
2
m18
di17 di18
1
Results and Discussion
- 33 -
dependence of the responses affects the response values for the methylated acids, the samples could still be compared.
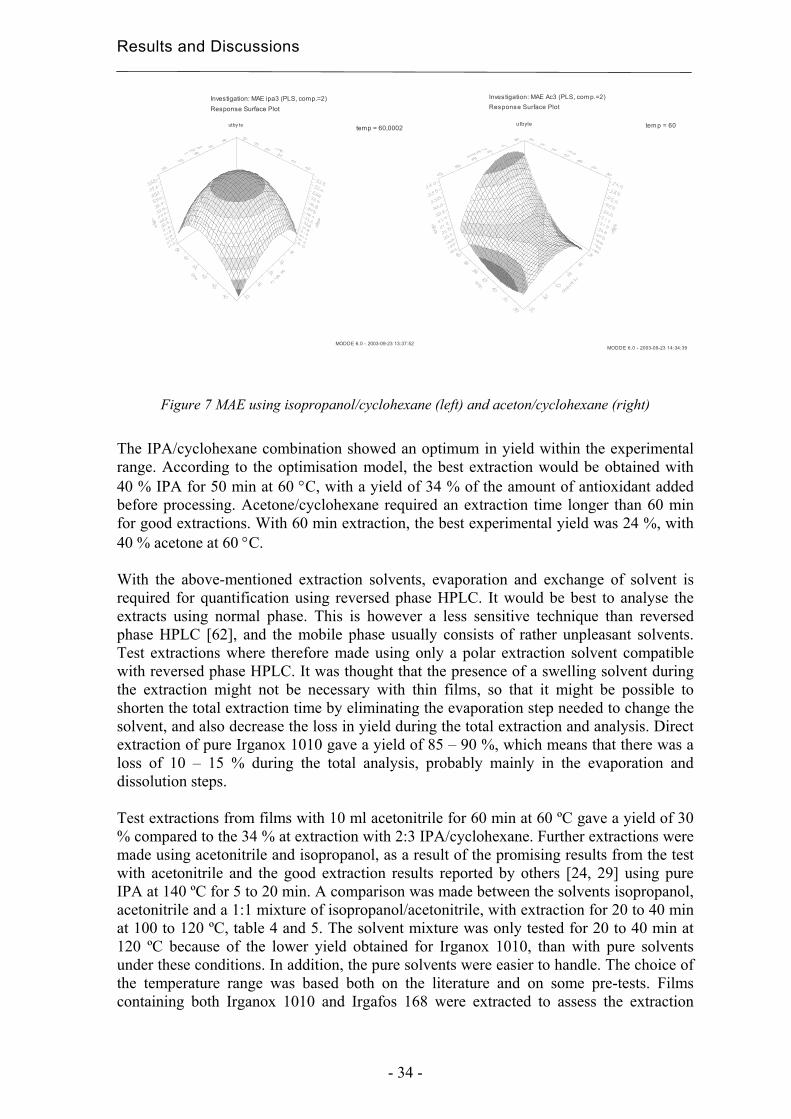
4.1.2 Microwave Assisted Extraction (MAE) for quantification of antioxidants within polyolefins Microwave assisted extraction (MAE) is, under good extraction conditions, a good extraction technique to quantify additives in the bulk of polymers. Extractions were performed using MAE with different solvents, different temperatures and different extraction times to obtain good conditions for the extraction of antioxidants. Extractions were also performed using other techniques, i.e. soxhlet and ultrasonic extraction, to provide a reference against which to judge the efficiency of the MAE method. Extractions were initially performed on films containing only Irganox 1010 as antioxidant, since Irganox 1010 was known to be more difficult to extract from polyolefins than the other antioxidants of interest, e.g. Irganox 1076 and Irgafos 168, due to its large and bulky structure. Comparisons were then made between common combinations of miscible extraction solvents, i.e. a swelling organic solvent and a polar solvent [25, 26, 28, 29]. Chlorinated solvents and n-hexane were avoided as extraction solvents for environmental and health reasons. The structure of the films collapsed easily when extracted at high microwave power levels. To avoid this, the power was programmed to be as low as possible at the desired temperature. All the extracts were analysed by high performance liquid chromatography (HPLC). At first, extractions were compared using the solvent combinations isopropanol (IPA) /cyclohexane and acetone/cyclohexane. The proportion of IPA or acetone was varied between 25 and 50 v/v-%, the temperature was varied between 60 and 80 °C and the time was varied between 30 and 60 min. 20 ml solvent and 0.3 g film were used for each extraction. The extraction time was limited to 60 min in order to obtain a time-effective method and to avoid degradation of the antioxidant during the extraction. Acetone, hexane and cyclohexane are, for safety reasons, not recommended by the instrument producer for use at high temperatures. In addition, very high temperatures can lead to collapse of the structure in semi-crystalline polymers, as has been noticed for polypropylene at temperatures above 125˚C [27]. In test extractions for 30 min at 90˚C, polypropylene films gelatinised too much for it to be possible to collect the extract, and they gelatinised slightly at extraction times longer than 30 min at 80˚C. It was thus not possible to obtain results from all the studies that were planned to give a complete factorial design. Extractions were instead carried out for 45 min at 70˚C with 25 and 50 % isopropanol or acetone to compensate for the fact that no extractions were performed for more than 30 min at 80˚C. The optimisation models obtained using the data analysis program Modde, figure 7 , were based on 8 measuring points using IPA/cyclohexane and on 10 points using acetone/cyclohexane. The extractions were performed in duplicate. The yields were in all cases calculated as the extracted amount of antioxidant relative to the amount of antioxidant added to the polypropylene before processing to film. Some of the antioxidant is however consumed during the process. The true extraction yields were therefore probably much higher than indicated by the measured yields.
Results and Discussions
- 34 -
Figure 7 MAE using isopropanol/cyclohexane (left) and aceton/cyclohexane (right)
The IPA/cyclohexane combination showed an optimum in yield within the experimental range. According to the optimisation model, the best extraction would be obtained with 40 % IPA for 50 min at 60 °C, with a yield of 34 % of the amount of antioxidant added before processing. Acetone/cyclohexane required an extraction time longer than 60 min for good extractions. With 60 min extraction, the best experimental yield was 24 %, with 40 % acetone at 60 °C. With the above-mentioned extraction solvents, evaporation and exchange of solvent is required for quantification using reversed phase HPLC. It would be best to analyse the extracts using normal phase. This is however a less sensitive technique than reversed phase HPLC [62], and the mobile phase usually consists of rather unpleasant solvents. Test extractions where therefore made using only a polar extraction solvent compatible with reversed phase HPLC. It was thought that the presence of a swelling solvent during the extraction might not be necessary with thin films, so that it might be possible to shorten the total extraction time by eliminating the evaporation step needed to change the solvent, and also decrease the loss in yield during the total extraction and analysis. Direct extraction of pure Irganox 1010 gave a yield of 85 – 90 %, which means that there was a loss of 10 – 15 % during the total analysis, probably mainly in the evaporation and dissolution steps. Test extractions from films with 10 ml acetonitrile for 60 min at 60 ºC gave a yield of 30 % compared to the 34 % at extraction with 2:3 IPA/cyclohexane. Further extractions were made using acetonitrile and isopropanol, as a result of the promising results from the test with acetonitrile and the good extraction results reported by others [24, 29] using pure IPA at 140 ºC for 5 to 20 min. A comparison was made between the solvents isopropanol, acetonitrile and a 1:1 mixture of isopropanol/acetonitrile, with extraction for 20 to 40 min at 100 to 120 ºC, table 4 and 5. The solvent mixture was only tested for 20 to 40 min at 120 ºC because of the lower yield obtained for Irganox 1010, than with pure solvents under these conditions. In addition, the pure solvents were easier to handle. The choice of the temperature range was based both on the literature and on some pre-tests. Films containing both Irganox 1010 and Irgafos 168 were extracted to assess the extraction
MODDE 6.0 - 2003-09-23 13:37:52
utby te
Investigation: MAE ipa3 (PLS, comp.=2)Response Surface Plot
temp = 60,0002
MODDE 6.0 - 2003-09-23 14:34:39
utbyte
Investigation: MAE Ac3 (PLS, comp.=2)Response Surface Plot
temp = 60
Results and Discussion
- 35 -
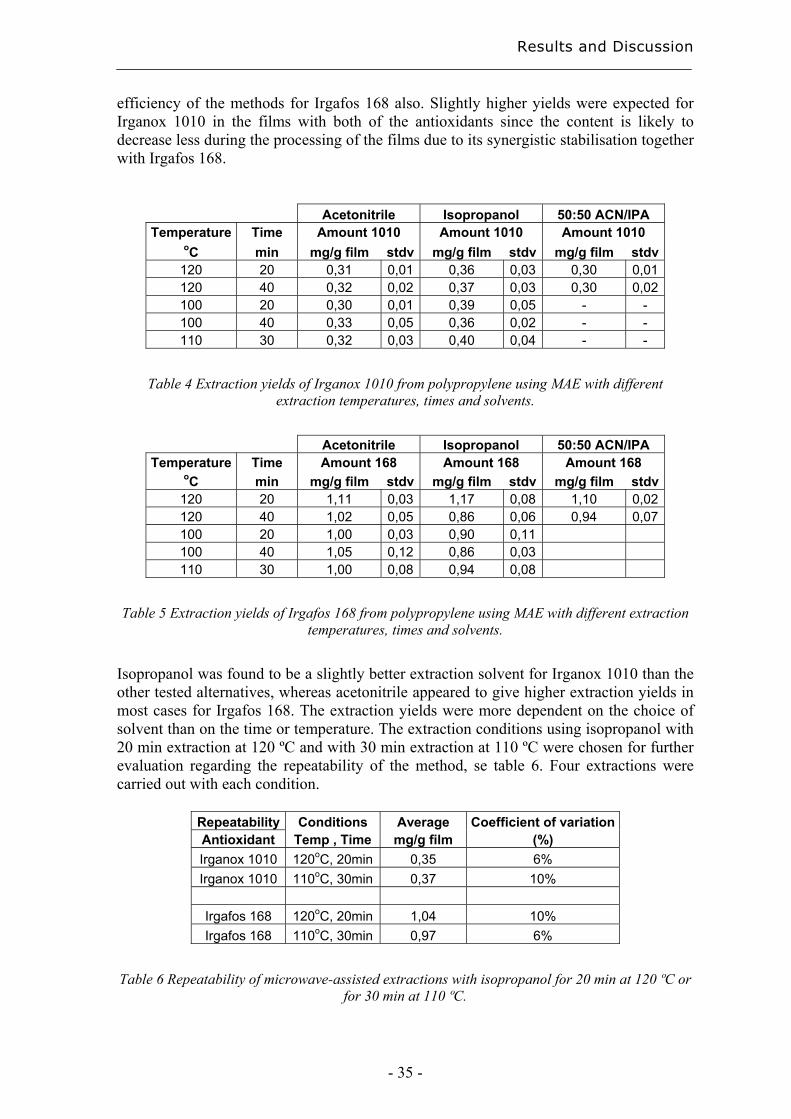
efficiency of the methods for Irgafos 168 also. Slightly higher yields were expected for Irganox 1010 in the films with both of the antioxidants since the content is likely to decrease less during the processing of the films due to its synergistic stabilisation together with Irgafos 168.
Acetonitrile Isopropanol 50:50 ACN/IPA Temperature Time Amount 1010 Amount 1010 Amount 1010
oC min mg/g film stdv mg/g film stdv mg/g film stdv120 20 0,31 0,01 0,36 0,03 0,30 0,01120 40 0,32 0,02 0,37 0,03 0,30 0,02100 20 0,30 0,01 0,39 0,05 - - 100 40 0,33 0,05 0,36 0,02 - - 110 30 0,32 0,03 0,40 0,04 - -
Table 4 Extraction yields of Irganox 1010 from polypropylene using MAE with different
extraction temperatures, times and solvents.
Acetonitrile Isopropanol 50:50 ACN/IPA
Temperature Time Amount 168 Amount 168 Amount 168 oC min mg/g film stdv mg/g film stdv mg/g film stdv120 20 1,11 0,03 1,17 0,08 1,10 0,02120 40 1,02 0,05 0,86 0,06 0,94 0,07100 20 1,00 0,03 0,90 0,11 100 40 1,05 0,12 0,86 0,03 110 30 1,00 0,08 0,94 0,08
Table 5 Extraction yields of Irgafos 168 from polypropylene using MAE with different extraction
temperatures, times and solvents.
Isopropanol was found to be a slightly better extraction solvent for Irganox 1010 than the other tested alternatives, whereas acetonitrile appeared to give higher extraction yields in most cases for Irgafos 168. The extraction yields were more dependent on the choice of solvent than on the time or temperature. The extraction conditions using isopropanol with 20 min extraction at 120 ºC and with 30 min extraction at 110 ºC were chosen for further evaluation regarding the repeatability of the method, se table 6. Four extractions were carried out with each condition.
Repeatability Conditions Average Coefficient of variation Antioxidant Temp , Time mg/g film (%) Irganox 1010 120oC, 20min 0,35 6% Irganox 1010 110oC, 30min 0,37 10%
Irgafos 168 120oC, 20min 1,04 10% Irgafos 168 110oC, 30min 0,97 6%
Table 6 Repeatability of microwave-assisted extractions with isopropanol for 20 min at 120 ºC or
for 30 min at 110 ºC.
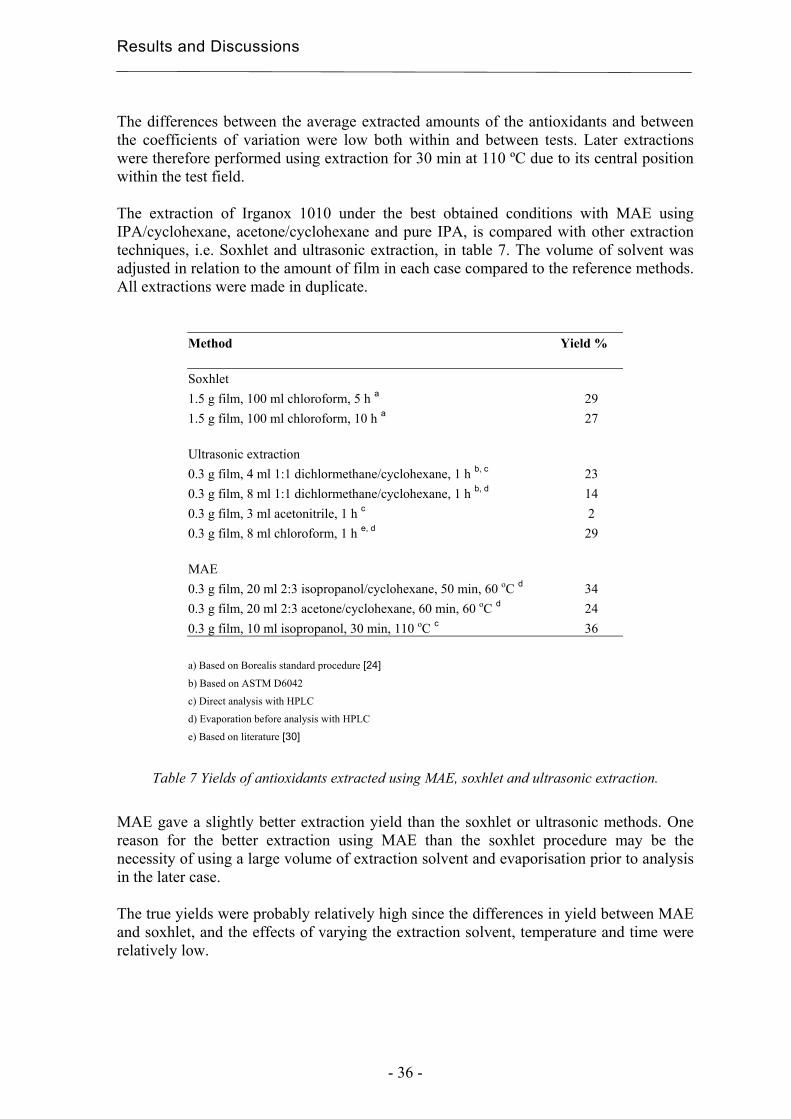
Results and Discussions
- 36 -
The differences between the average extracted amounts of the antioxidants and between the coefficients of variation were low both within and between tests. Later extractions were therefore performed using extraction for 30 min at 110 ºC due to its central position within the test field. The extraction of Irganox 1010 under the best obtained conditions with MAE using IPA/cyclohexane, acetone/cyclohexane and pure IPA, is compared with other extraction techniques, i.e. Soxhlet and ultrasonic extraction, in table 7. The volume of solvent was adjusted in relation to the amount of film in each case compared to the reference methods. All extractions were made in duplicate.
Method Yield % Soxhlet 1.5 g film, 100 ml chloroform, 5 h a 29 1.5 g film, 100 ml chloroform, 10 h a 27 Ultrasonic extraction 0.3 g film, 4 ml 1:1 dichlormethane/cyclohexane, 1 h b, c 23 0.3 g film, 8 ml 1:1 dichlormethane/cyclohexane, 1 h b, d 14 0.3 g film, 3 ml acetonitrile, 1 h c 2 0.3 g film, 8 ml chloroform, 1 h e, d 29 MAE 0.3 g film, 20 ml 2:3 isopropanol/cyclohexane, 50 min, 60 oC d 34 0.3 g film, 20 ml 2:3 acetone/cyclohexane, 60 min, 60 oC d 24 0.3 g film, 10 ml isopropanol, 30 min, 110 oC c 36 a) Based on Borealis standard procedure [24]
b) Based on ASTM D6042 c) Direct analysis with HPLC d) Evaporation before analysis with HPLC e) Based on literature [30]
Table 7 Yields of antioxidants extracted using MAE, soxhlet and ultrasonic extraction.
MAE gave a slightly better extraction yield than the soxhlet or ultrasonic methods. One reason for the better extraction using MAE than the soxhlet procedure may be the necessity of using a large volume of extraction solvent and evaporisation prior to analysis in the later case. The true yields were probably relatively high since the differences in yield between MAE and soxhlet, and the effects of varying the extraction solvent, temperature and time were relatively low.
Results and Discussion
- 37 -
4.1.3 Solid-Phase Microextraction of volatile and semi-volatile degradation products of antioxidants in an organic aqueous solution Solid-Phase Micoextraction (SPME) was investigated regarding its ability to identify and quantify very low concentrations of volatile and semi-volatile degradation products of antioxidants that migrated from polypropylene into a simulated food and pharmaceutical solution consisting of 10 % ethanol in water. The objective was also to investigate the possibility of developing a method that can be used for the simultaneous analysis of different kinds of analyte despite differences in their chemical structures. The main problems to be encountered are the differences in the chemical structures of the analytes and the presence of a polar organic solvent, which may affect the extraction efficiency of the fibre. The antioxidants used today, especially in pharmaceutical packages, are well documented and do not give any toxic effects. New antioxidants are however continuously being introduced onto the market and, since these antioxidants and their deterioration products may be toxic, it is important to have them identified and quantified [63]. Two of the most common antioxidants, Irganox 1010 and Irgafos 168, were used as model substances. They are both approved for food and pharmaceutical applications and were chosen as model substances since their degradation products are well documented and have chemical structures similar to those of many other common antioxidants. The pH of the samples were initially adjusted to 2, with a 0.5 M HCl-solution, and they were saturated with salt as previous studies have indicated that these conditions may yield the most effective extraction [20, 21, 36, 39, 64-66]. The choice of polarity of the coating of the SPME fibre depends on the chemical properties of the analytes. The PDMS/DVB fibre was chosen for further evaluation based on a comparison between the capabilities of five different fibres in extracting analytes from real sample solutions in which polypropylene films have been stored. Although the polyacrylate fibre exhibited slightly higher responses than the PDMS/DVB fibre for most of the identified peaks and higher responses for two unidentified peaks, the PDMS/DVB fibre demonstrated a more diverse spectrum and almost twice the response of dtb-bq, and thus showed a potentially sufficient versatility for the application. The CW/DVB fibre underwent severe swelling during the extraction in the EtOH/H2O solution and it was not analysed in the GC in order to avoid contamination of the instrument. In a comparison between HS-SPME and direct SPME using a PDMS/DVB fibre, rather varying results were obtained in the extraction efficiency of the different analytes, as indicated in figure 8. The responses from the direct SPME are mean values of duplicate extractions whereas the responses from the HS-SPME instead are from single extractions at two different temperatures.
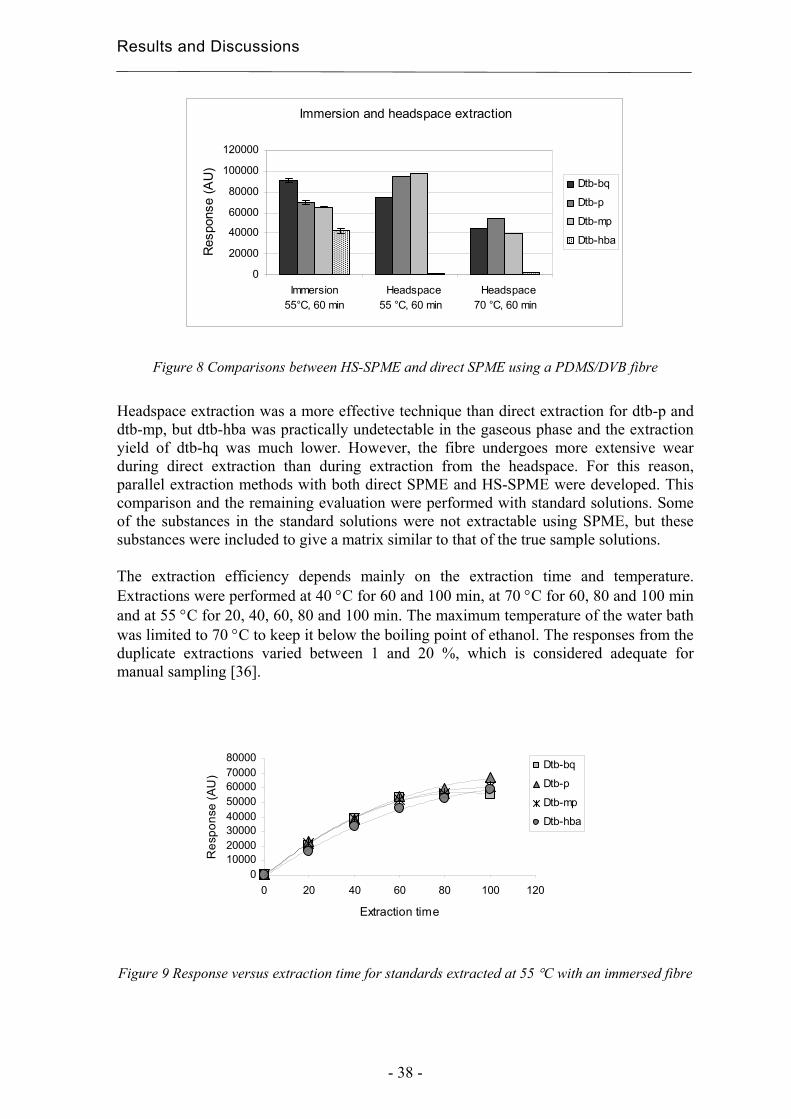
Results and Discussions
- 38 -
Immersion and headspace extraction
0
20000
40000
60000
80000
100000
120000
Immersion 55°C, 60 min
Headspace 55 °C, 60 min
Headspace 70 °C, 60 min
Res
pons
e (A
U)
Dtb-bq
Dtb-p
Dtb-mp
Dtb-hba
Figure 8 Comparisons between HS-SPME and direct SPME using a PDMS/DVB fibre
Headspace extraction was a more effective technique than direct extraction for dtb-p and dtb-mp, but dtb-hba was practically undetectable in the gaseous phase and the extraction yield of dtb-hq was much lower. However, the fibre undergoes more extensive wear during direct extraction than during extraction from the headspace. For this reason, parallel extraction methods with both direct SPME and HS-SPME were developed. This comparison and the remaining evaluation were performed with standard solutions. Some of the substances in the standard solutions were not extractable using SPME, but these substances were included to give a matrix similar to that of the true sample solutions. The extraction efficiency depends mainly on the extraction time and temperature. Extractions were performed at 40 °C for 60 and 100 min, at 70 °C for 60, 80 and 100 min and at 55 °C for 20, 40, 60, 80 and 100 min. The maximum temperature of the water bath was limited to 70 °C to keep it below the boiling point of ethanol. The responses from the duplicate extractions varied between 1 and 20 %, which is considered adequate for manual sampling [36].
01000020000300004000050000600007000080000
0 20 40 60 80 100 120
Extraction time
Res
pons
e (A
U)
Dtb-bq
Dtb-p
Dtb-mp
Dtb-hba
Figure 9 Response versus extraction time for standards extracted at 55 °C with an immersed fibre
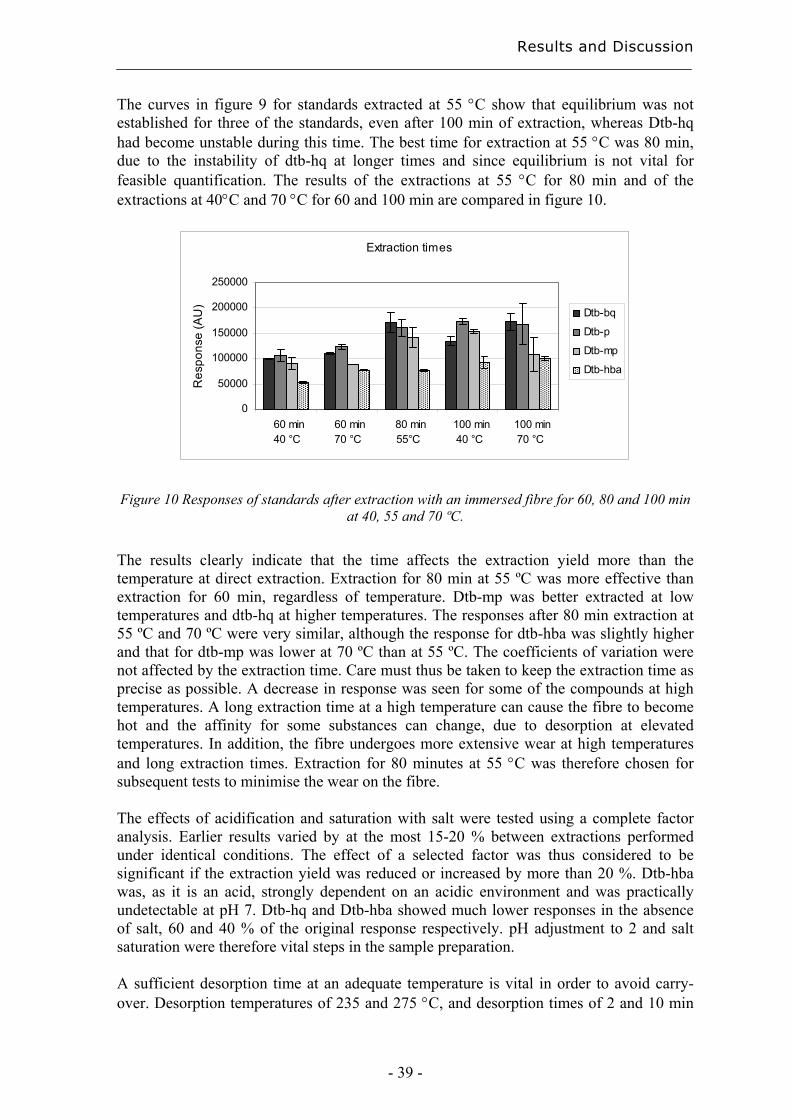
Results and Discussion
- 39 -
The curves in figure 9 for standards extracted at 55 °C show that equilibrium was not established for three of the standards, even after 100 min of extraction, whereas Dtb-hq had become unstable during this time. The best time for extraction at 55 °C was 80 min, due to the instability of dtb-hq at longer times and since equilibrium is not vital for feasible quantification. The results of the extractions at 55 °C for 80 min and of the extractions at 40°C and 70 °C for 60 and 100 min are compared in figure 10.
Extraction times
0
50000
100000
150000
200000
250000
60 min 40 °C
60 min 70 °C
80 min 55°C
100 min 40 °C
100 min 70 °C
Res
pons
e (A
U)
Dtb-bq
Dtb-p
Dtb-mp
Dtb-hba
Figure 10 Responses of standards after extraction with an immersed fibre for 60, 80 and 100 min
at 40, 55 and 70 ºC.
The results clearly indicate that the time affects the extraction yield more than the temperature at direct extraction. Extraction for 80 min at 55 ºC was more effective than extraction for 60 min, regardless of temperature. Dtb-mp was better extracted at low temperatures and dtb-hq at higher temperatures. The responses after 80 min extraction at 55 ºC and 70 ºC were very similar, although the response for dtb-hba was slightly higher and that for dtb-mp was lower at 70 ºC than at 55 ºC. The coefficients of variation were not affected by the extraction time. Care must thus be taken to keep the extraction time as precise as possible. A decrease in response was seen for some of the compounds at high temperatures. A long extraction time at a high temperature can cause the fibre to become hot and the affinity for some substances can change, due to desorption at elevated temperatures. In addition, the fibre undergoes more extensive wear at high temperatures and long extraction times. Extraction for 80 minutes at 55 °C was therefore chosen for subsequent tests to minimise the wear on the fibre. The effects of acidification and saturation with salt were tested using a complete factor analysis. Earlier results varied by at the most 15-20 % between extractions performed under identical conditions. The effect of a selected factor was thus considered to be significant if the extraction yield was reduced or increased by more than 20 %. Dtb-hba was, as it is an acid, strongly dependent on an acidic environment and was practically undetectable at pH 7. Dtb-hq and Dtb-hba showed much lower responses in the absence of salt, 60 and 40 % of the original response respectively. pH adjustment to 2 and salt saturation were therefore vital steps in the sample preparation. A sufficient desorption time at an adequate temperature is vital in order to avoid carry-over. Desorption temperatures of 235 and 275 °C, and desorption times of 2 and 10 min
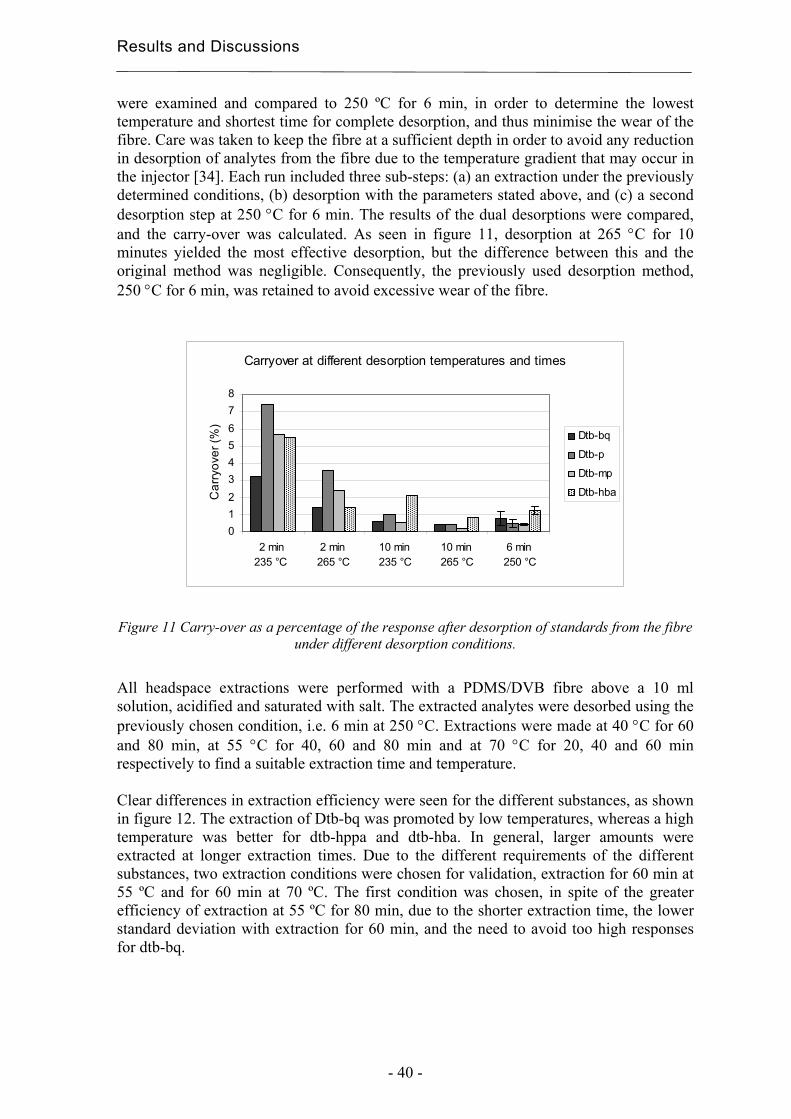
Results and Discussions
- 40 -
were examined and compared to 250 ºC for 6 min, in order to determine the lowest temperature and shortest time for complete desorption, and thus minimise the wear of the fibre. Care was taken to keep the fibre at a sufficient depth in order to avoid any reduction in desorption of analytes from the fibre due to the temperature gradient that may occur in the injector [34]. Each run included three sub-steps: (a) an extraction under the previously determined conditions, (b) desorption with the parameters stated above, and (c) a second desorption step at 250 °C for 6 min. The results of the dual desorptions were compared, and the carry-over was calculated. As seen in figure 11, desorption at 265 °C for 10 minutes yielded the most effective desorption, but the difference between this and the original method was negligible. Consequently, the previously used desorption method, 250 °C for 6 min, was retained to avoid excessive wear of the fibre.
Figure 11 Carry-over as a percentage of the response after desorption of standards from the fibre
under different desorption conditions.
All headspace extractions were performed with a PDMS/DVB fibre above a 10 ml solution, acidified and saturated with salt. The extracted analytes were desorbed using the previously chosen condition, i.e. 6 min at 250 °C. Extractions were made at 40 °C for 60 and 80 min, at 55 °C for 40, 60 and 80 min and at 70 °C for 20, 40 and 60 min respectively to find a suitable extraction time and temperature. Clear differences in extraction efficiency were seen for the different substances, as shown in figure 12. The extraction of Dtb-bq was promoted by low temperatures, whereas a high temperature was better for dtb-hppa and dtb-hba. In general, larger amounts were extracted at longer extraction times. Due to the different requirements of the different substances, two extraction conditions were chosen for validation, extraction for 60 min at 55 ºC and for 60 min at 70 ºC. The first condition was chosen, in spite of the greater efficiency of extraction at 55 ºC for 80 min, due to the shorter extraction time, the lower standard deviation with extraction for 60 min, and the need to avoid too high responses for dtb-bq.
Carryover at different desorption temperatures and times
012345678
2 min 235 °C
2 min 265 °C
10 min 235 °C
10 min 265 °C
6 min 250 °C
Car
ryov
er (%
)
Dtb-bq
Dtb-p
Dtb-mp
Dtb-hba
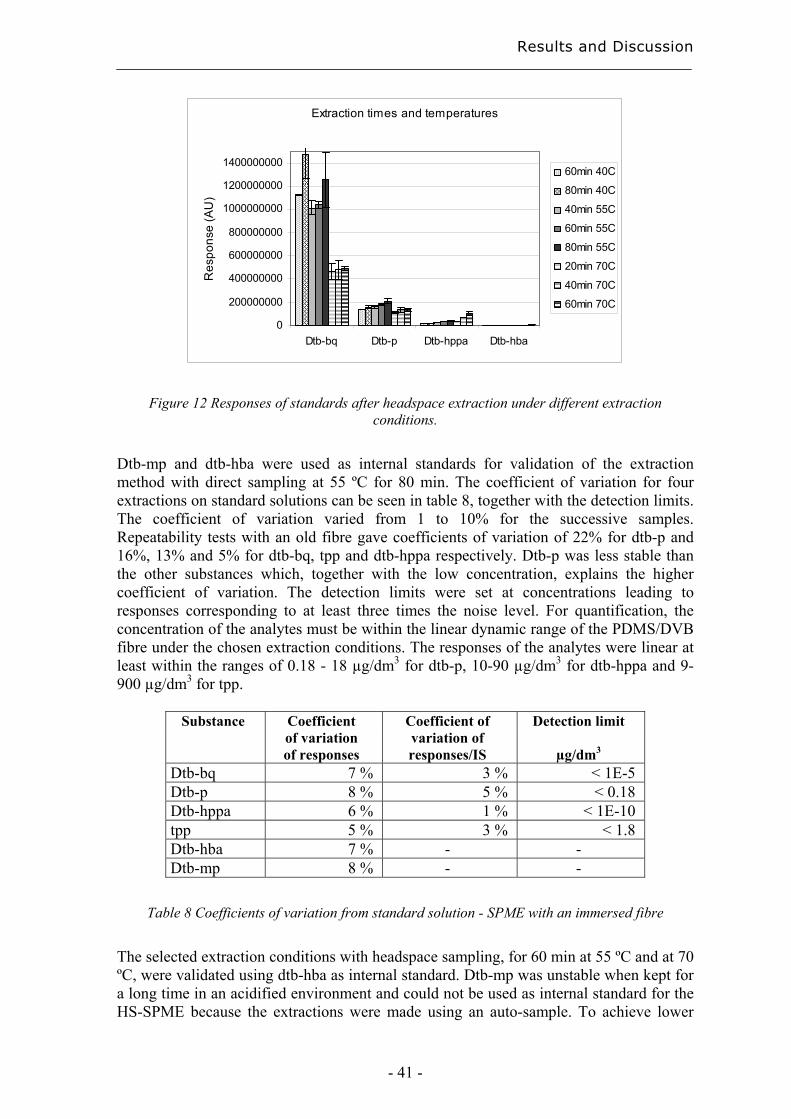
Results and Discussion
- 41 -
Extraction times and temperatures
0
200000000
400000000
600000000
800000000
1000000000
1200000000
1400000000
Dtb-bq Dtb-p Dtb-hppa Dtb-hba
Res
pons
e (A
U)
60min 40C
80min 40C
40min 55C
60min 55C
80min 55C
20min 70C
40min 70C
60min 70C
Figure 12 Responses of standards after headspace extraction under different extraction conditions.
Dtb-mp and dtb-hba were used as internal standards for validation of the extraction method with direct sampling at 55 ºC for 80 min. The coefficient of variation for four extractions on standard solutions can be seen in table 8, together with the detection limits. The coefficient of variation varied from 1 to 10% for the successive samples. Repeatability tests with an old fibre gave coefficients of variation of 22% for dtb-p and 16%, 13% and 5% for dtb-bq, tpp and dtb-hppa respectively. Dtb-p was less stable than the other substances which, together with the low concentration, explains the higher coefficient of variation. The detection limits were set at concentrations leading to responses corresponding to at least three times the noise level. For quantification, the concentration of the analytes must be within the linear dynamic range of the PDMS/DVB fibre under the chosen extraction conditions. The responses of the analytes were linear at least within the ranges of 0.18 - 18 µg/dm3 for dtb-p, 10-90 µg/dm3 for dtb-hppa and 9-900 µg/dm3 for tpp.
Substance Coefficient Coefficient of Detection limit
of variation of responses
variation of responses/IS µg/dm3
Dtb-bq 7 % 3 % < 1E-5 Dtb-p 8 % 5 % < 0.18 Dtb-hppa 6 % 1 % < 1E-10 tpp 5 % 3 % < 1.8 Dtb-hba 7 % - - Dtb-mp 8 % - -
Table 8 Coefficients of variation from standard solution - SPME with an immersed fibre
The selected extraction conditions with headspace sampling, for 60 min at 55 ºC and at 70 ºC, were validated using dtb-hba as internal standard. Dtb-mp was unstable when kept for a long time in an acidified environment and could not be used as internal standard for the HS-SPME because the extractions were made using an auto-sample. To achieve lower
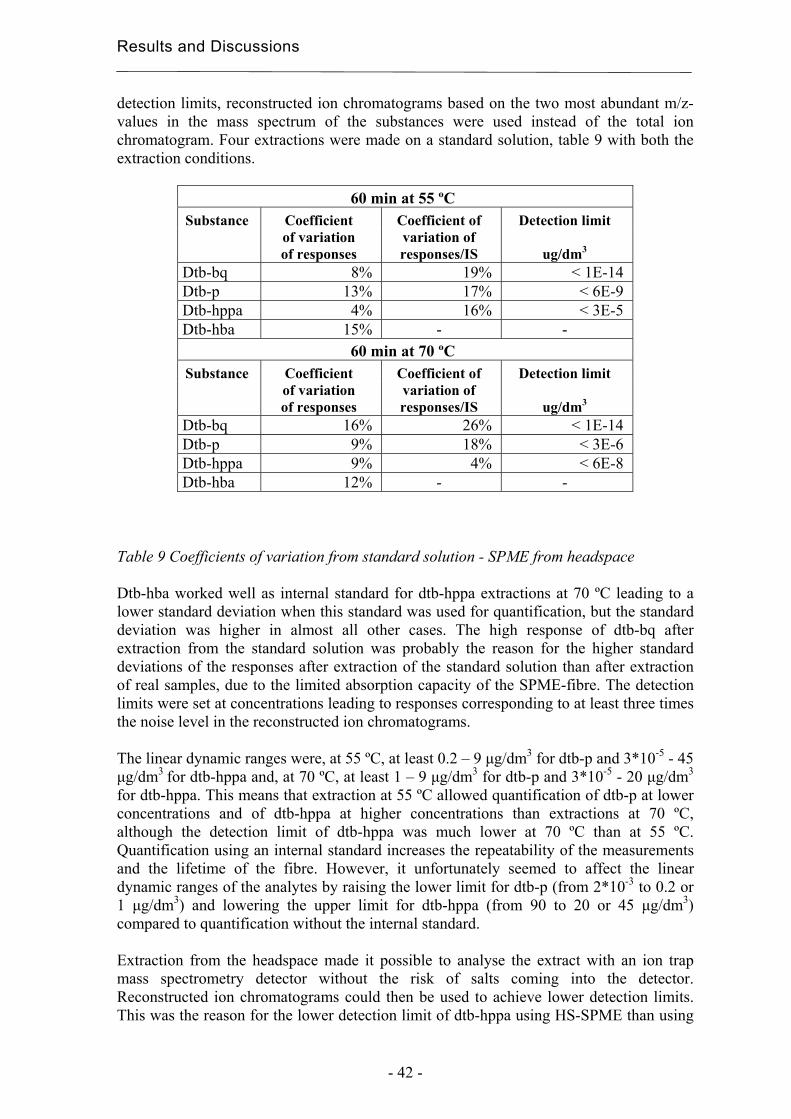
Results and Discussions
- 42 -
detection limits, reconstructed ion chromatograms based on the two most abundant m/z-values in the mass spectrum of the substances were used instead of the total ion chromatogram. Four extractions were made on a standard solution, table 9 with both the extraction conditions.
60 min at 55 ºC Substance Coefficient Coefficient of Detection limit
of variation of responses
variation of responses/IS ug/dm3
Dtb-bq 8% 19% < 1E-14 Dtb-p 13% 17% < 6E-9 Dtb-hppa 4% 16% < 3E-5 Dtb-hba 15% - -
60 min at 70 ºC Substance Coefficient Coefficient of Detection limit
of variation of responses
variation of responses/IS ug/dm3
Dtb-bq 16% 26% < 1E-14 Dtb-p 9% 18% < 3E-6 Dtb-hppa 9% 4% < 6E-8 Dtb-hba 12% - -
Table 9 Coefficients of variation from standard solution - SPME from headspace Dtb-hba worked well as internal standard for dtb-hppa extractions at 70 ºC leading to a lower standard deviation when this standard was used for quantification, but the standard deviation was higher in almost all other cases. The high response of dtb-bq after extraction from the standard solution was probably the reason for the higher standard deviations of the responses after extraction of the standard solution than after extraction of real samples, due to the limited absorption capacity of the SPME-fibre. The detection limits were set at concentrations leading to responses corresponding to at least three times the noise level in the reconstructed ion chromatograms. The linear dynamic ranges were, at 55 ºC, at least 0.2 – 9 µg/dm3 for dtb-p and 3*10-5 - 45 µg/dm3 for dtb-hppa and, at 70 ºC, at least 1 – 9 µg/dm3 for dtb-p and 3*10-5 - 20 µg/dm3
for dtb-hppa. This means that extraction at 55 ºC allowed quantification of dtb-p at lower concentrations and of dtb-hppa at higher concentrations than extractions at 70 ºC, although the detection limit of dtb-hppa was much lower at 70 ºC than at 55 ºC. Quantification using an internal standard increases the repeatability of the measurements and the lifetime of the fibre. However, it unfortunately seemed to affect the linear dynamic ranges of the analytes by raising the lower limit for dtb-p (from 2*10-3 to 0.2 or 1 µg/dm3) and lowering the upper limit for dtb-hppa (from 90 to 20 or 45 µg/dm3) compared to quantification without the internal standard. Extraction from the headspace made it possible to analyse the extract with an ion trap mass spectrometry detector without the risk of salts coming into the detector. Reconstructed ion chromatograms could then be used to achieve lower detection limits. This was the reason for the lower detection limit of dtb-hppa using HS-SPME than using
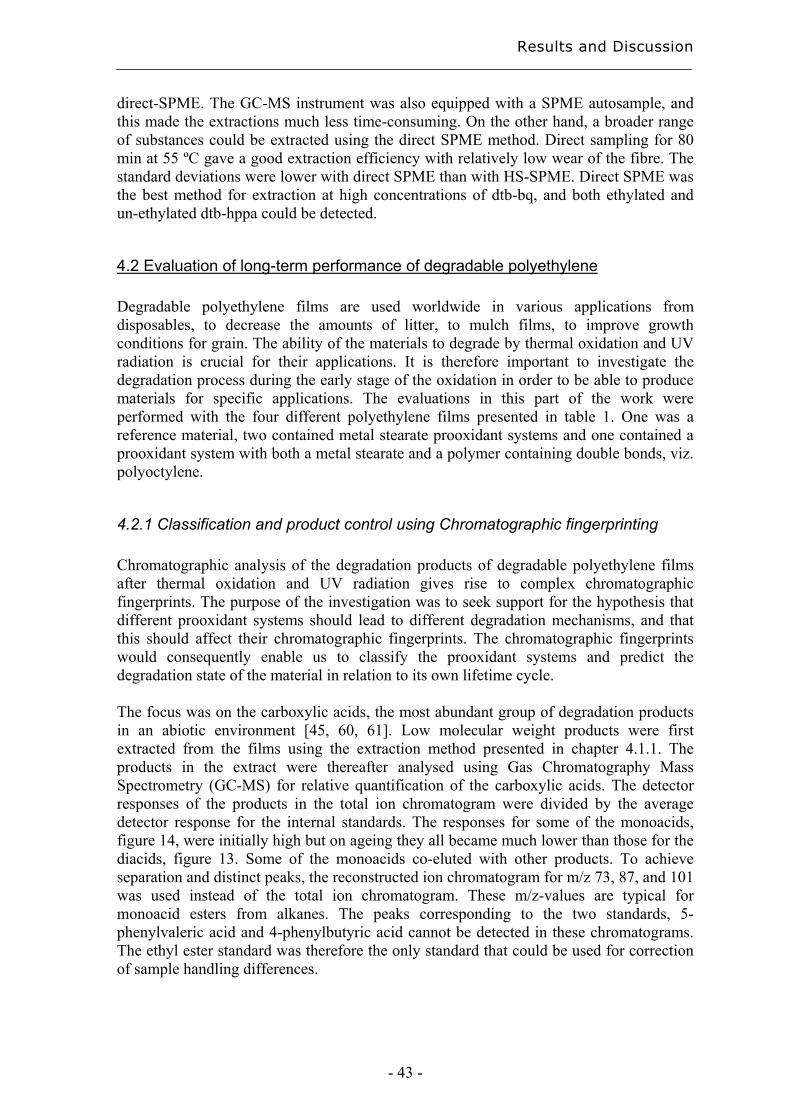
Results and Discussion
- 43 -
direct-SPME. The GC-MS instrument was also equipped with a SPME autosample, and this made the extractions much less time-consuming. On the other hand, a broader range of substances could be extracted using the direct SPME method. Direct sampling for 80 min at 55 ºC gave a good extraction efficiency with relatively low wear of the fibre. The standard deviations were lower with direct SPME than with HS-SPME. Direct SPME was the best method for extraction at high concentrations of dtb-bq, and both ethylated and un-ethylated dtb-hppa could be detected.
4.2 Evaluation of long-term performance of degradable polyethylene Degradable polyethylene films are used worldwide in various applications from disposables, to decrease the amounts of litter, to mulch films, to improve growth conditions for grain. The ability of the materials to degrade by thermal oxidation and UV radiation is crucial for their applications. It is therefore important to investigate the degradation process during the early stage of the oxidation in order to be able to produce materials for specific applications. The evaluations in this part of the work were performed with the four different polyethylene films presented in table 1. One was a reference material, two contained metal stearate prooxidant systems and one contained a prooxidant system with both a metal stearate and a polymer containing double bonds, viz. polyoctylene.
4.2.1 Classification and product control using Chromatographic fingerprinting Chromatographic analysis of the degradation products of degradable polyethylene films after thermal oxidation and UV radiation gives rise to complex chromatographic fingerprints. The purpose of the investigation was to seek support for the hypothesis that different prooxidant systems should lead to different degradation mechanisms, and that this should affect their chromatographic fingerprints. The chromatographic fingerprints would consequently enable us to classify the prooxidant systems and predict the degradation state of the material in relation to its own lifetime cycle. The focus was on the carboxylic acids, the most abundant group of degradation products in an abiotic environment [45, 60, 61]. Low molecular weight products were first extracted from the films using the extraction method presented in chapter 4.1.1. The products in the extract were thereafter analysed using Gas Chromatography Mass Spectrometry (GC-MS) for relative quantification of the carboxylic acids. The detector responses of the products in the total ion chromatogram were divided by the average detector response for the internal standards. The responses for some of the monoacids, figure 14, were initially high but on ageing they all became much lower than those for the diacids, figure 13. Some of the monoacids co-eluted with other products. To achieve separation and distinct peaks, the reconstructed ion chromatogram for m/z 73, 87, and 101 was used instead of the total ion chromatogram. These m/z-values are typical for monoacid esters from alkanes. The peaks corresponding to the two standards, 5-phenylvaleric acid and 4-phenylbutyric acid cannot be detected in these chromatograms. The ethyl ester standard was therefore the only standard that could be used for correction of sample handling differences.
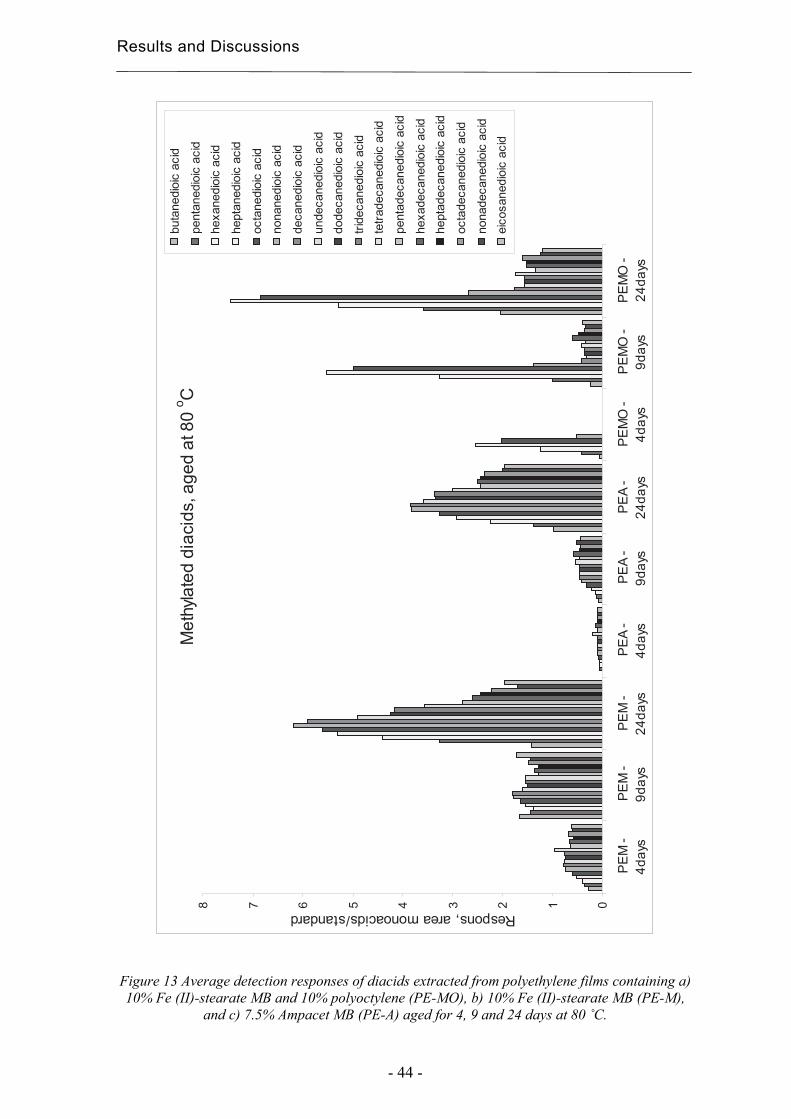
Results and Discussions
- 44 -
Met
hyla
ted
diac
ids,
age
d at
80
o C
012345678
PE
M -
4day
sP
EM
-9d
ays
PE
M -
24da
ysP
EA
-4d
ays
PE
A -
9day
sP
EA
-24
days
PE
MO
-4d
ays
PE
MO
-9d
ays
PE
MO
-24
days
Respons, area monoacids/standard
buta
nedi
oic
acid
pent
aned
ioic
aci
dhe
xane
dioi
c ac
id
hept
aned
ioic
aci
d
octa
nedi
oic
acid
nona
nedi
oic
acid
deca
nedi
oic
acid
unde
cane
dioi
c ac
iddo
deca
nedi
oic
acid
tride
cane
dioi
c ac
idte
trade
cane
dioi
c ac
id
pent
adec
aned
ioic
aci
d
hexa
deca
nedi
oic
acid
hept
adec
aned
ioic
aci
d
octa
deca
nedi
oic
acid
nona
deca
nedi
oic
acid
eico
sane
dioi
c ac
id
Figure 13 Average detection responses of diacids extracted from polyethylene films containing a) 10% Fe (II)-stearate MB and 10% polyoctylene (PE-MO), b) 10% Fe (II)-stearate MB (PE-M),
and c) 7.5% Ampacet MB (PE-A) aged for 4, 9 and 24 days at 80 ˚C.
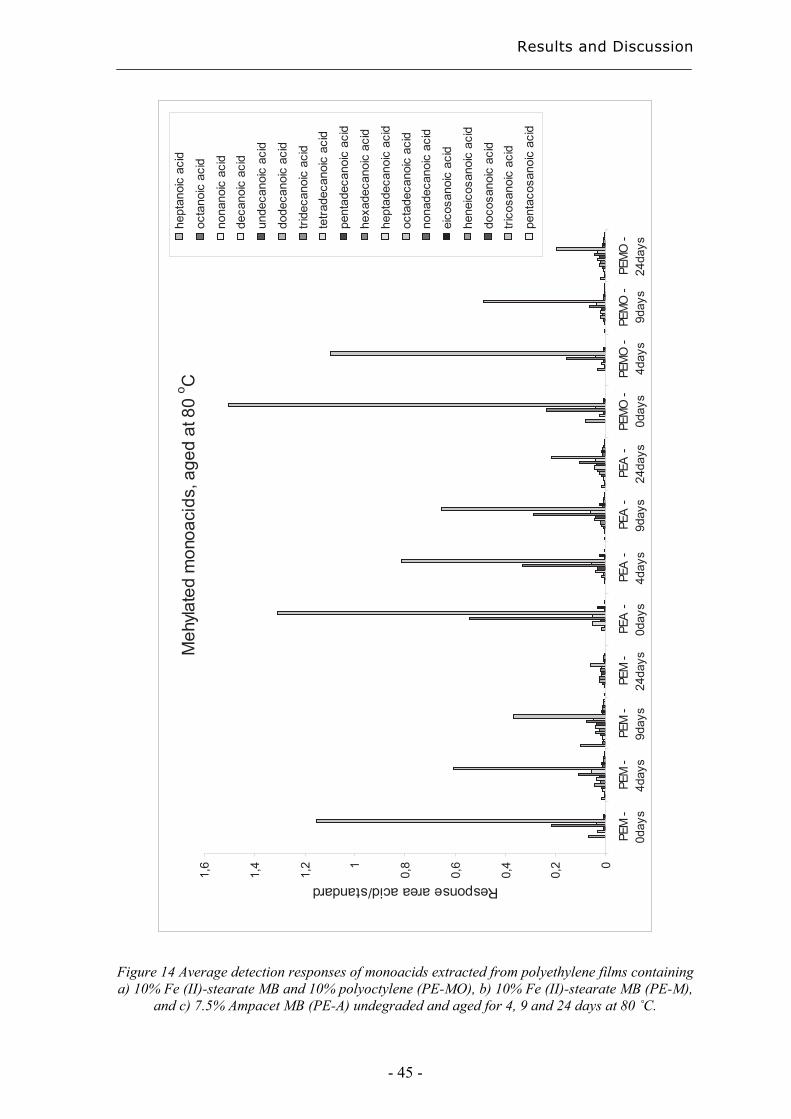
Results and Discussion
- 45 -
Meh
ylate
d m
onoa
cids
, age
d at
80
o C
0
0,2
0,4
0,6
0,81
1,2
1,4
1,6
PEM
-0d
ays
PEM
-4d
ays
PEM
-9d
ays
PEM
-24
days
PEA
-0d
ays
PEA
-4d
ays
PEA
-9d
ays
PEA
-24
days
PEM
O -
0day
sPE
MO
-4d
ays
PEM
O -
9day
sPE
MO
-24
days
Response area acid/standard
hept
anoi
c ac
id
octa
noic
aci
d
nona
noic
aci
dde
cano
ic a
cid
unde
cano
ic a
cid
dode
cano
ic a
cid
tride
cano
ic a
cid
tetra
deca
noic
aci
d
pent
adec
anoi
c ac
id
hexa
deca
noic
aci
d
hept
adec
anoi
c ac
id
octa
deca
noic
aci
dno
nade
cano
ic a
cid
eico
sano
ic a
cid
hene
icos
anoi
c ac
id
doco
sano
ic a
cid
trico
sano
ic a
cid
pent
acos
anoi
c ac
id
Figure 14 Average detection responses of monoacids extracted from polyethylene films containing a) 10% Fe (II)-stearate MB and 10% polyoctylene (PE-MO), b) 10% Fe (II)-stearate MB (PE-M),
and c) 7.5% Ampacet MB (PE-A) undegraded and aged for 4, 9 and 24 days at 80 ˚C.
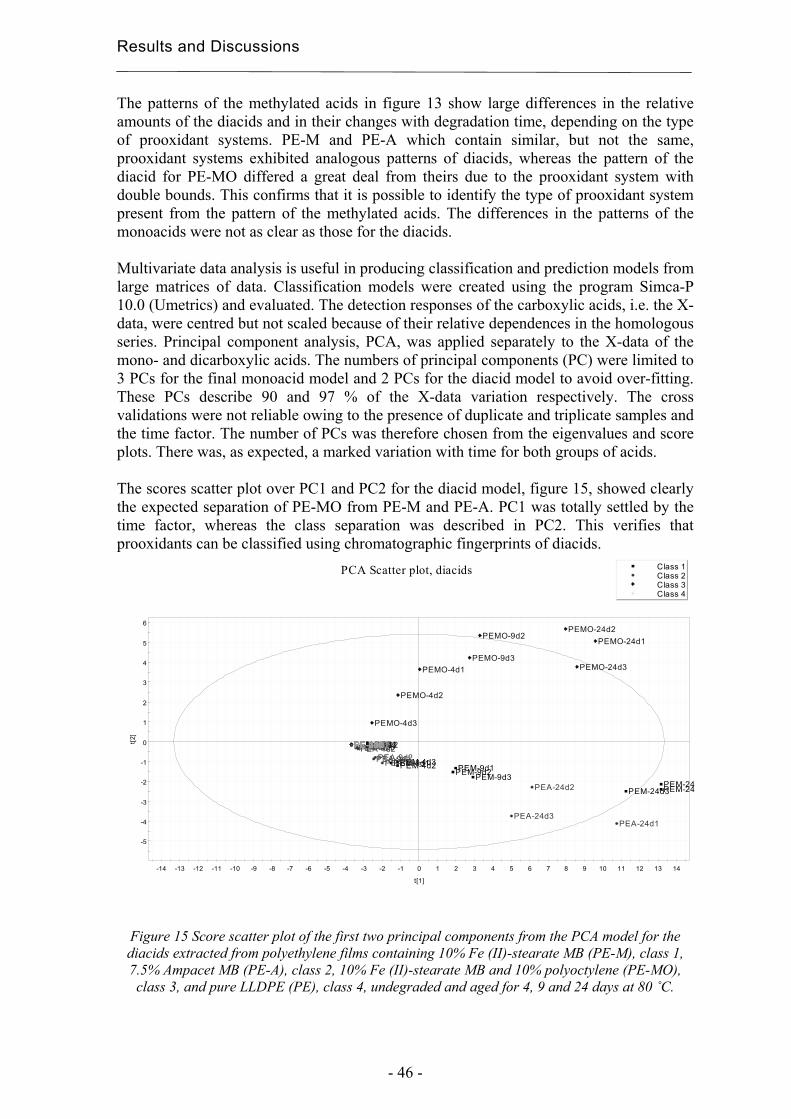
Results and Discussions
- 46 -
The patterns of the methylated acids in figure 13 show large differences in the relative amounts of the diacids and in their changes with degradation time, depending on the type of prooxidant systems. PE-M and PE-A which contain similar, but not the same, prooxidant systems exhibited analogous patterns of diacids, whereas the pattern of the diacid for PE-MO differed a great deal from theirs due to the prooxidant system with double bounds. This confirms that it is possible to identify the type of prooxidant system present from the pattern of the methylated acids. The differences in the patterns of the monoacids were not as clear as those for the diacids. Multivariate data analysis is useful in producing classification and prediction models from large matrices of data. Classification models were created using the program Simca-P 10.0 (Umetrics) and evaluated. The detection responses of the carboxylic acids, i.e. the X-data, were centred but not scaled because of their relative dependences in the homologous series. Principal component analysis, PCA, was applied separately to the X-data of the mono- and dicarboxylic acids. The numbers of principal components (PC) were limited to 3 PCs for the final monoacid model and 2 PCs for the diacid model to avoid over-fitting. These PCs describe 90 and 97 % of the X-data variation respectively. The cross validations were not reliable owing to the presence of duplicate and triplicate samples and the time factor. The number of PCs was therefore chosen from the eigenvalues and score plots. There was, as expected, a marked variation with time for both groups of acids. The scores scatter plot over PC1 and PC2 for the diacid model, figure 15, showed clearly the expected separation of PE-MO from PE-M and PE-A. PC1 was totally settled by the time factor, whereas the class separation was described in PC2. This verifies that prooxidants can be classified using chromatographic fingerprints of diacids.
-5
-4
-3
-2
-1
0
1
2
3
4
5
6
-14 -13 -12 -11 -10 -9 -8 -7 -6 -5 -4 -3 -2 -1 0 1 2 3 4 5 6 7 8 9 10 11 12 13 14
t[2]
t[1]
PCA Scatter plot, diacids
Class 1Class 2Class 3Class 4
PEM-0d1PEM-0D2PEM-0d3
PEM-4d1PEM-4d2PEM-4d3PEM-9d1PEM-9d2PEM-9d3
PEM-24PEM-24PEM-24d3
PEA-0D1PEA-0d2PEA-0d3PEA-4d1PEA-4d2PEA-4d3PEA-9d1PEA-9d2
PEA-9d3
PEA-24d1
PEA-24d2
PEA-24d3
PEMO-0d1PEMO-0D2PEMO-0d3
PEMO-4d1
PEMO-4d2
PEMO-4d3
PEMO-9d2
PEMO-9d3
PEMO-24d1PEMO-24d2
PEMO-24d3
PE-0d1PE-0D2PE-0D3PE-4d1PE-4d2PE-4d3PE-9d1PE-9d2PE-24D1PE-24D2PE-24d3
Figure 15 Score scatter plot of the first two principal components from the PCA model for the diacids extracted from polyethylene films containing 10% Fe (II)-stearate MB (PE-M), class 1, 7.5% Ampacet MB (PE-A), class 2, 10% Fe (II)-stearate MB and 10% polyoctylene (PE-MO), class 3, and pure LLDPE (PE), class 4, undegraded and aged for 4, 9 and 24 days at 80 ˚C.
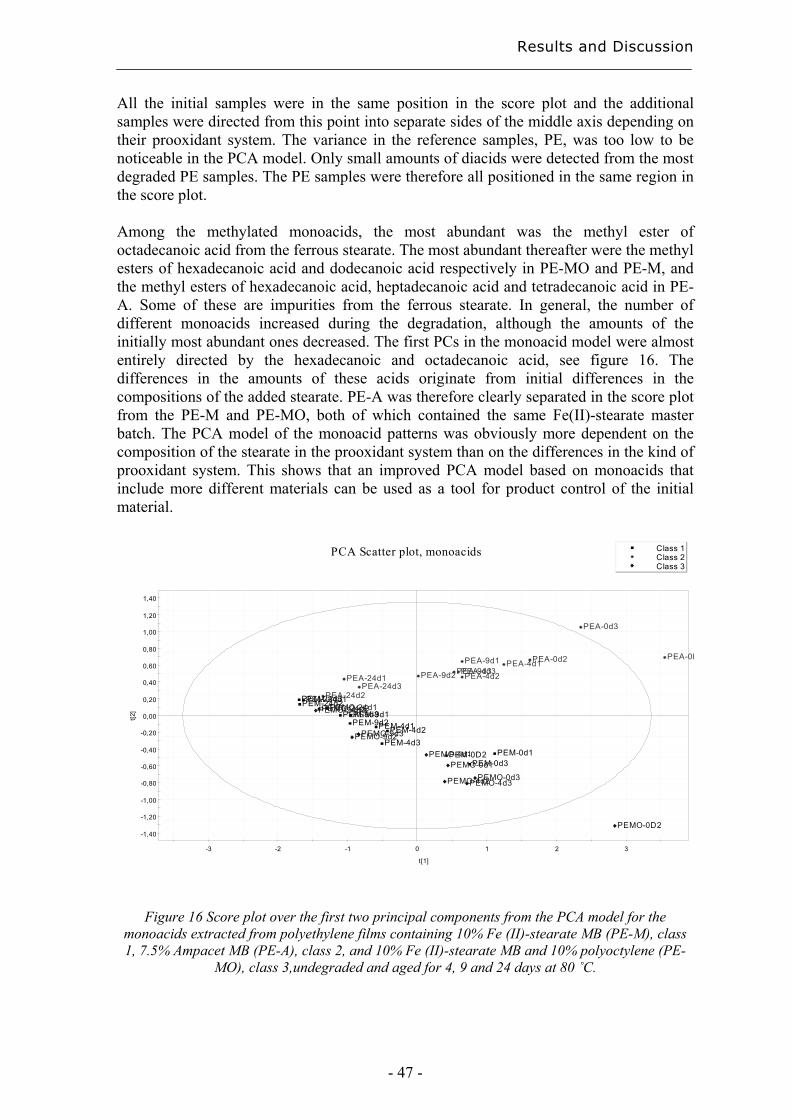
Results and Discussion
- 47 -
All the initial samples were in the same position in the score plot and the additional samples were directed from this point into separate sides of the middle axis depending on their prooxidant system. The variance in the reference samples, PE, was too low to be noticeable in the PCA model. Only small amounts of diacids were detected from the most degraded PE samples. The PE samples were therefore all positioned in the same region in the score plot. Among the methylated monoacids, the most abundant was the methyl ester of octadecanoic acid from the ferrous stearate. The most abundant thereafter were the methyl esters of hexadecanoic acid and dodecanoic acid respectively in PE-MO and PE-M, and the methyl esters of hexadecanoic acid, heptadecanoic acid and tetradecanoic acid in PE-A. Some of these are impurities from the ferrous stearate. In general, the number of different monoacids increased during the degradation, although the amounts of the initially most abundant ones decreased. The first PCs in the monoacid model were almost entirely directed by the hexadecanoic and octadecanoic acid, see figure 16. The differences in the amounts of these acids originate from initial differences in the compositions of the added stearate. PE-A was therefore clearly separated in the score plot from the PE-M and PE-MO, both of which contained the same Fe(II)-stearate master batch. The PCA model of the monoacid patterns was obviously more dependent on the composition of the stearate in the prooxidant system than on the differences in the kind of prooxidant system. This shows that an improved PCA model based on monoacids that include more different materials can be used as a tool for product control of the initial material.
-1,40
-1,20
-1,00
-0,80
-0,60
-0,40
-0,20
0,00
0,20
0,40
0,60
0,80
1,00
1,20
1,40
-3 -2 -1 0 1 2 3
t[2]
t[1]
PCA Scatter plot, monoacids
Class 1Class 2Class 3
PEM-0d1PEM-0D2PEM-0d3
PEM-4d1PEM-4d2PEM-4d3
PEM-9d1PEM-9d2
PEM-9d3
PEM-24d1PEM-24d2PEM-24d3
PEA-0DPEA-0d2
PEA-0d3
PEA-4d1PEA-4d2PEA-4d3PEA-9d1
PEA-9d2PEA-9d3PEA-24d1
PEA-24d2PEA-24d3
PEMO-0d1
PEMO-0D2
PEMO-0d3
PEMO-4d1
PEMO-4d2PEMO-4d3
PEMO-9d2PEMO-9d3
PEMO-24d1PEMO-24d2PEMO-24d3
Figure 16 Score plot over the first two principal components from the PCA model for the
monoacids extracted from polyethylene films containing 10% Fe (II)-stearate MB (PE-M), class 1, 7.5% Ampacet MB (PE-A), class 2, and 10% Fe (II)-stearate MB and 10% polyoctylene (PE-
MO), class 3,undegraded and aged for 4, 9 and 24 days at 80 ˚C.
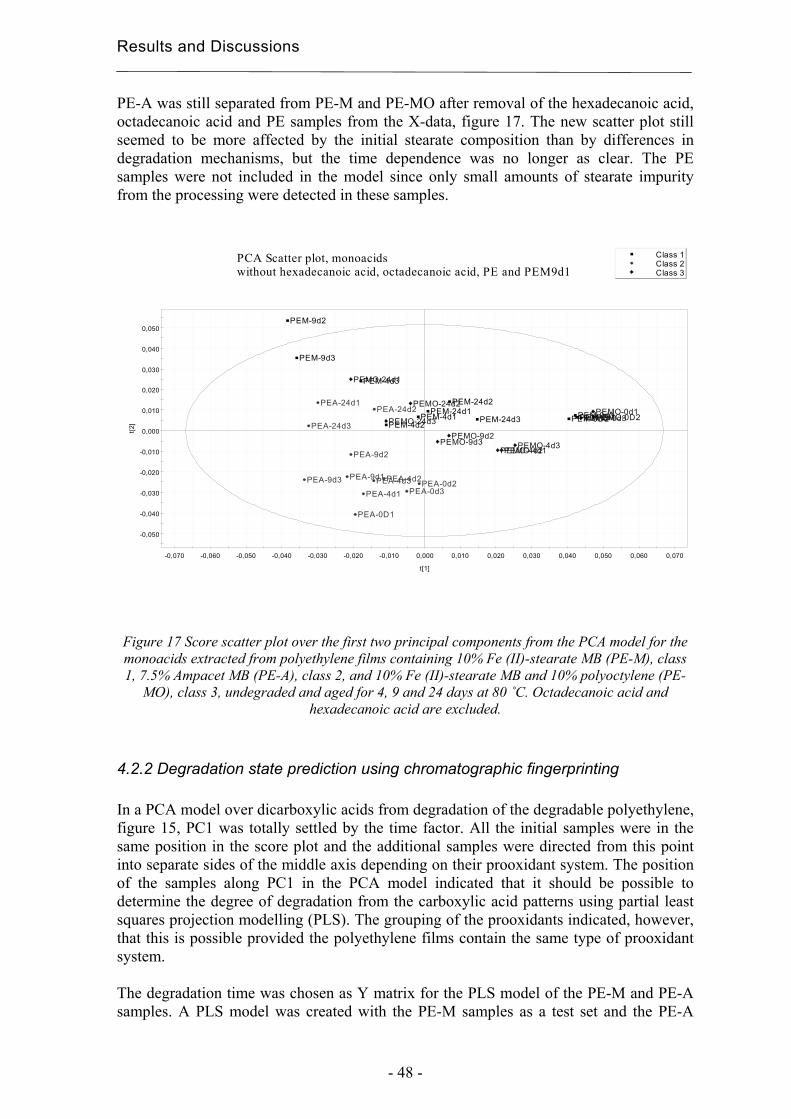
Results and Discussions
- 48 -
PE-A was still separated from PE-M and PE-MO after removal of the hexadecanoic acid, octadecanoic acid and PE samples from the X-data, figure 17. The new scatter plot still seemed to be more affected by the initial stearate composition than by differences in degradation mechanisms, but the time dependence was no longer as clear. The PE samples were not included in the model since only small amounts of stearate impurity from the processing were detected in these samples.
Figure 17 Score scatter plot over the first two principal components from the PCA model for the monoacids extracted from polyethylene films containing 10% Fe (II)-stearate MB (PE-M), class 1, 7.5% Ampacet MB (PE-A), class 2, and 10% Fe (II)-stearate MB and 10% polyoctylene (PE-
MO), class 3, undegraded and aged for 4, 9 and 24 days at 80 ˚C. Octadecanoic acid and hexadecanoic acid are excluded.
4.2.2 Degradation state prediction using chromatographic fingerprinting In a PCA model over dicarboxylic acids from degradation of the degradable polyethylene, figure 15, PC1 was totally settled by the time factor. All the initial samples were in the same position in the score plot and the additional samples were directed from this point into separate sides of the middle axis depending on their prooxidant system. The position of the samples along PC1 in the PCA model indicated that it should be possible to determine the degree of degradation from the carboxylic acid patterns using partial least squares projection modelling (PLS). The grouping of the prooxidants indicated, however, that this is possible provided the polyethylene films contain the same type of prooxidant system.
The degradation time was chosen as Y matrix for the PLS model of the PE-M and PE-A samples. A PLS model was created with the PE-M samples as a test set and the PE-A
-0,050
-0,040
-0,030
-0,020
-0,010
0,000
0,010
0,020
0,030
0,040
0,050
-0,070 -0,060 -0,050 -0,040 -0,030 -0,020 -0,010 0,000 0,010 0,020 0,030 0,040 0,050 0,060 0,070
t[2]
t[1]
PCA Scatter plot, monoacids without hexadecanoic acid, octadecanoic acid, PE and PEM9d1
Class 1Class 2Class 3
PEM-0d1PEM-0D2PEM-0d3PEM-4d1PEM-4d2
PEM-4d3
PEM-9d2
PEM-9d3
PEM-24d1PEM-24d2
PEM-24d3
PEA-0D1
PEA-0d2PEA-0d3PEA-4d1
PEA-4d2PEA-4d3PEA-9d1
PEA-9d2
PEA-9d3
PEA-24d1PEA-24d2
PEA-24d3
PEMO-0d1PEMO-0D2PEMO-0d3
PEMO-4d1PEMO-4d2PEMO-4d3PEMO-9d2
PEMO-9d3
PEMO-24d1
PEMO-24d2
PEMO-24d3
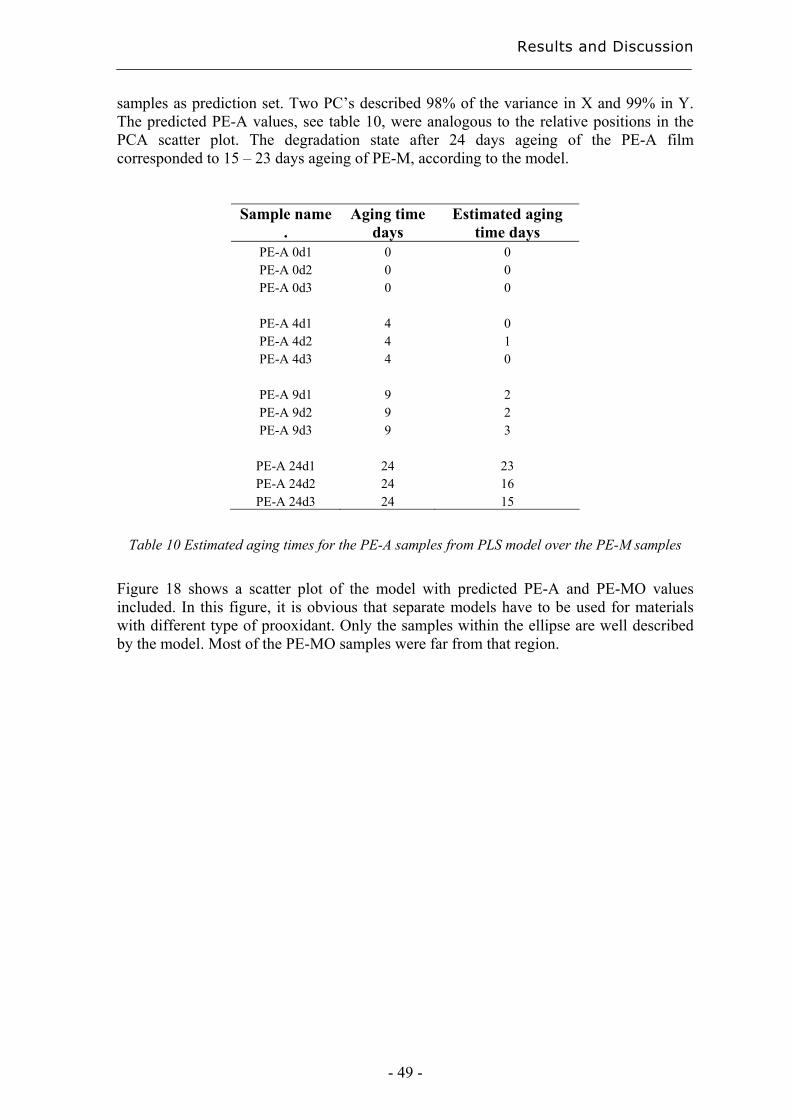
Results and Discussion
- 49 -
samples as prediction set. Two PC’s described 98% of the variance in X and 99% in Y. The predicted PE-A values, see table 10, were analogous to the relative positions in the PCA scatter plot. The degradation state after 24 days ageing of the PE-A film corresponded to 15 – 23 days ageing of PE-M, according to the model.
Sample name .
Aging time days
Estimated aging time days
PE-A 0d1 0 0 PE-A 0d2 0 0 PE-A 0d3 0 0
PE-A 4d1 4 0 PE-A 4d2 4 1 PE-A 4d3 4 0
PE-A 9d1 9 2 PE-A 9d2 9 2 PE-A 9d3 9 3
PE-A 24d1 24 23 PE-A 24d2 24 16 PE-A 24d3 24 15
Table 10 Estimated aging times for the PE-A samples from PLS model over the PE-M samples
Figure 18 shows a scatter plot of the model with predicted PE-A and PE-MO values included. In this figure, it is obvious that separate models have to be used for materials with different type of prooxidant. Only the samples within the ellipse are well described by the model. Most of the PE-MO samples were far from that region.
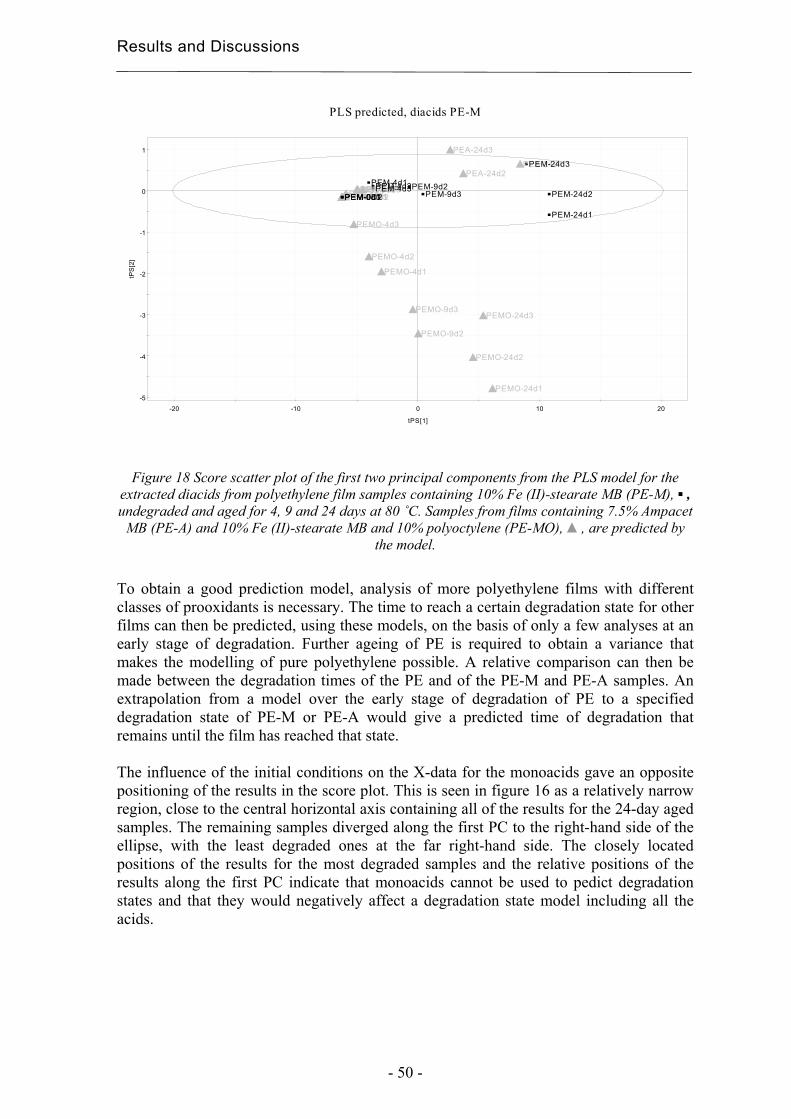
Results and Discussions
- 50 -
Figure 18 Score scatter plot of the first two principal components from the PLS model for the extracted diacids from polyethylene film samples containing 10% Fe (II)-stearate MB (PE-M), ▪ , undegraded and aged for 4, 9 and 24 days at 80 ˚C. Samples from films containing 7.5% Ampacet
MB (PE-A) and 10% Fe (II)-stearate MB and 10% polyoctylene (PE-MO), ▲, are predicted by the model.
To obtain a good prediction model, analysis of more polyethylene films with different classes of prooxidants is necessary. The time to reach a certain degradation state for other films can then be predicted, using these models, on the basis of only a few analyses at an early stage of degradation. Further ageing of PE is required to obtain a variance that makes the modelling of pure polyethylene possible. A relative comparison can then be made between the degradation times of the PE and of the PE-M and PE-A samples. An extrapolation from a model over the early stage of degradation of PE to a specified degradation state of PE-M or PE-A would give a predicted time of degradation that remains until the film has reached that state. The influence of the initial conditions on the X-data for the monoacids gave an opposite positioning of the results in the score plot. This is seen in figure 16 as a relatively narrow region, close to the central horizontal axis containing all of the results for the 24-day aged samples. The remaining samples diverged along the first PC to the right-hand side of the ellipse, with the least degraded ones at the far right-hand side. The closely located positions of the results for the most degraded samples and the relative positions of the results along the first PC indicate that monoacids cannot be used to pedict degradation states and that they would negatively affect a degradation state model including all the acids.
-5
-4
-3
-2
-1
0
1
-20 -10 0 10 20
tPS
[2]
tPS[1]
PLS predicted, diacids PE-M
PEA-0D1PEA-0d2PEA-0d3PEA-4d1PEA-4d2PEA-4d3PEA-9d1PEA-9d2PEA-9d3
PEA-24d1PEA-24d2
PEA-24d3
PEMO-0d1PEMO-0D2PEMO-0d3
PEMO-4d1
PEMO-4d2
PEMO-4d3
PEMO-9d2
PEMO-9d3
PEMO-24d1
PEMO-24d2
PEMO-24d3
PEM-0d1PEM-0D2PEM-0d3
PEM-4d1PEM-4d2PEM-4d3PEM-9d2PEM-9d3
PEM-24d1
PEM-24d2
PEM-24d3
Results and Discussion
- 51 -
4.2.3 Early degradation state prediction using Total Luminescence Intensity measurements TLI measurement using chemiluminescence was evaluated as a tool to monitor early degradation and thereby classify degradable polyethylene films. The photons counted with chemiluminescence instruments are related to the decomposition of hydroperoxides, which are the initial degradation products from polyolefins [3, 67]. These intermediates decompose further by e.g. thermal oxidation or photo-oxidation leading to secondary products such as aldehydes, ketones and carboxylic acids. The possibility to measure the first intermediate degradation products makes chemiluminescence very interesting as a potential technique for early degradation detection. The detection of early degradation and small differences in degradation behaviour between different kinds of degradable polyethylene films under accelerated degradation test conditions requires an analysis technique with a high sensitivity. Comparisons were made with other techniques, i.e. Fourier Transform Infrared Spectroscopy (FTIR), Differential Scanning Calorimetry (DSC) and Size-Exclusion Chromatography (SEC), after thermal oxidation and photo-oxidation of the approximately 15 µm thin films. Compared to e.g. polypropylene, polyethylene is very resistant to oxidation and has a low melting temperature. This leads to a long oxidation induction time and low intensity in isothermal chemiluminescence measurements below the melting temperature. To follow the oxidation of a very thin polyethylene film, it is therefore necessary to study preoxidised samples using a so-called ramp experiment, where the temperature is increased with a constant rate, and thereby increase the efficiency and sensitivity. The sample is heated in nitrogen and the resulting total luminescent intensity, TLI, is measured. It has been shown that the area under the curve of counts per second versus temperature can be related to the total amount of hydroperoxides in the sample after a given aging time [52, 53]. The TLI method also makes it possible to follow changes in degradation activation energies. The plots of total luminescence versus degradation time in figure 19 clearly show that the polyethylene sample containing a prooxidant system with both a metal stearate and a polymer with double bonds (PE-MO) shows much higher chemiluminescence intensities than the polyethylene samples containing only a metal stearate, i.e. PE-M and PE-A. This large difference was probably caused by the added polyoctylene. Curves with a similar shape have been obtained with ferric ion additives using iodometric potentiometric titration [68] and for polyethylene without prooxidants using IR spectroscopy [69].
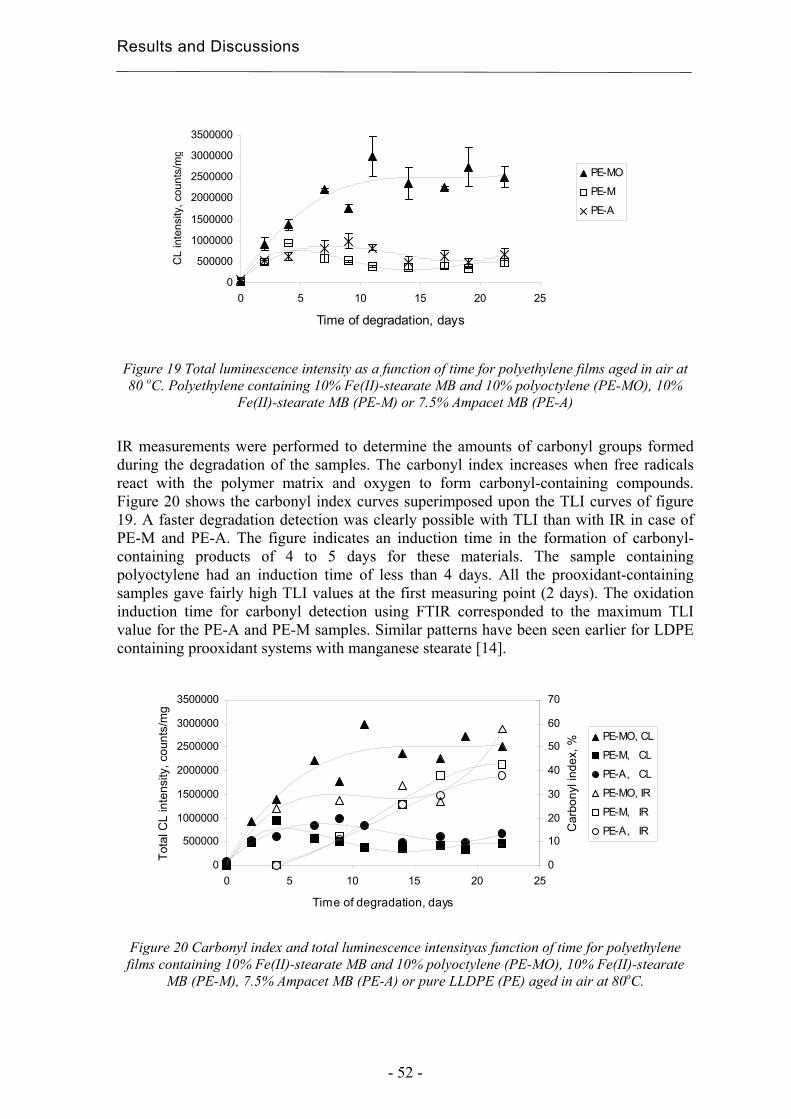
Results and Discussions
- 52 -
0
500000
1000000
1500000
2000000
2500000
3000000
3500000
0 5 10 15 20 25
Time of degradation, days
CL
inte
nsity
, cou
nts/
mg
PE-MO
PE-M
PE-A
Figure 19 Total luminescence intensity as a function of time for polyethylene films aged in air at 80 oC. Polyethylene containing 10% Fe(II)-stearate MB and 10% polyoctylene (PE-MO), 10%
Fe(II)-stearate MB (PE-M) or 7.5% Ampacet MB (PE-A)
IR measurements were performed to determine the amounts of carbonyl groups formed during the degradation of the samples. The carbonyl index increases when free radicals react with the polymer matrix and oxygen to form carbonyl-containing compounds. Figure 20 shows the carbonyl index curves superimposed upon the TLI curves of figure 19. A faster degradation detection was clearly possible with TLI than with IR in case of PE-M and PE-A. The figure indicates an induction time in the formation of carbonyl-containing products of 4 to 5 days for these materials. The sample containing polyoctylene had an induction time of less than 4 days. All the prooxidant-containing samples gave fairly high TLI values at the first measuring point (2 days). The oxidation induction time for carbonyl detection using FTIR corresponded to the maximum TLI value for the PE-A and PE-M samples. Similar patterns have been seen earlier for LDPE containing prooxidant systems with manganese stearate [14].
0
500000
1000000
1500000
2000000
2500000
3000000
3500000
0 5 10 15 20 25
Time of degradation, days
Tota
l CL
inte
nsity
, cou
nts/
mg
0
10
20
30
40
50
60
70
Car
bony
l ind
ex, %
PE-MO, CL
PE-M, CL
PE-A, CL
PE-MO, IR
PE-M, IR
PE-A, IR
Figure 20 Carbonyl index and total luminescence intensityas function of time for polyethylene films containing 10% Fe(II)-stearate MB and 10% polyoctylene (PE-MO), 10% Fe(II)-stearate
MB (PE-M), 7.5% Ampacet MB (PE-A) or pure LLDPE (PE) aged in air at 80oC.
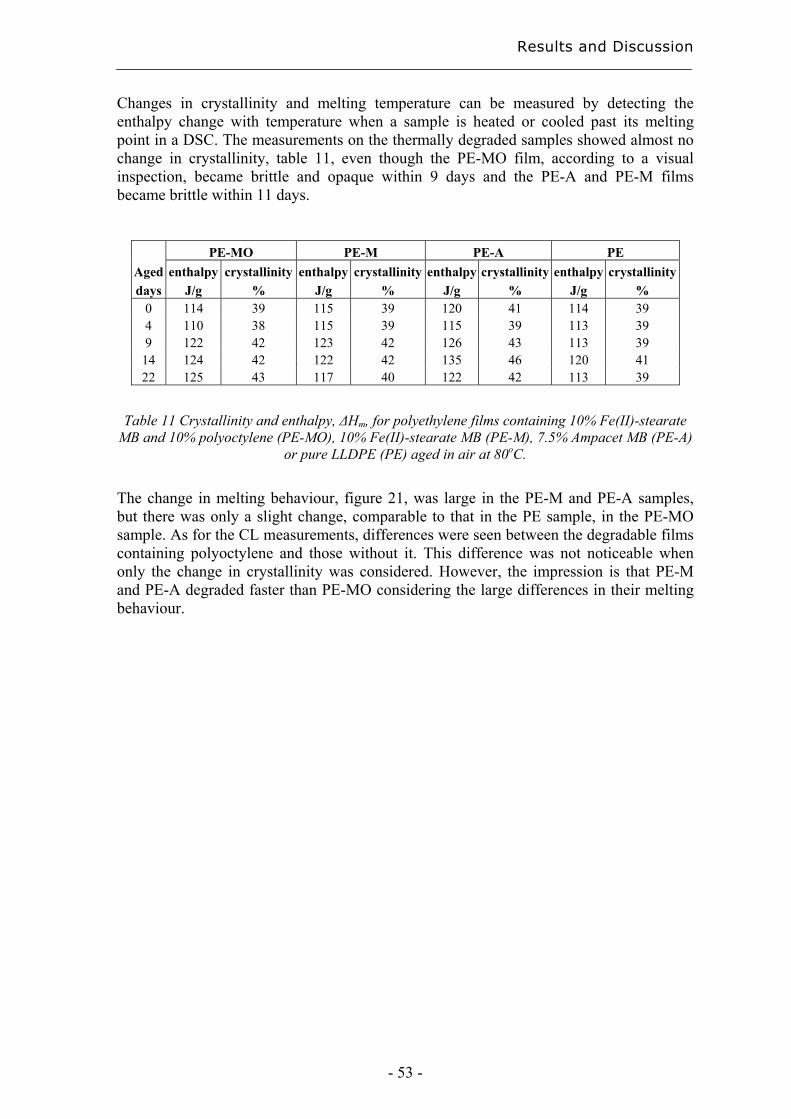
Results and Discussion
- 53 -
Changes in crystallinity and melting temperature can be measured by detecting the enthalpy change with temperature when a sample is heated or cooled past its melting point in a DSC. The measurements on the thermally degraded samples showed almost no change in crystallinity, table 11, even though the PE-MO film, according to a visual inspection, became brittle and opaque within 9 days and the PE-A and PE-M films became brittle within 11 days.
PE-MO PE-M PE-A PE Aged enthalpy crystallinity enthalpy crystallinity enthalpy crystallinity enthalpy crystallinitydays J/g % J/g % J/g % J/g %
0 114 39 115 39 120 41 114 39 4 110 38 115 39 115 39 113 39 9 122 42 123 42 126 43 113 39
14 124 42 122 42 135 46 120 41 22 125 43 117 40 122 42 113 39
Table 11 Crystallinity and enthalpy, ∆Hm, for polyethylene films containing 10% Fe(II)-stearate
MB and 10% polyoctylene (PE-MO), 10% Fe(II)-stearate MB (PE-M), 7.5% Ampacet MB (PE-A) or pure LLDPE (PE) aged in air at 80oC.
The change in melting behaviour, figure 21, was large in the PE-M and PE-A samples, but there was only a slight change, comparable to that in the PE sample, in the PE-MO sample. As for the CL measurements, differences were seen between the degradable films containing polyoctylene and those without it. This difference was not noticeable when only the change in crystallinity was considered. However, the impression is that PE-M and PE-A degraded faster than PE-MO considering the large differences in their melting behaviour.
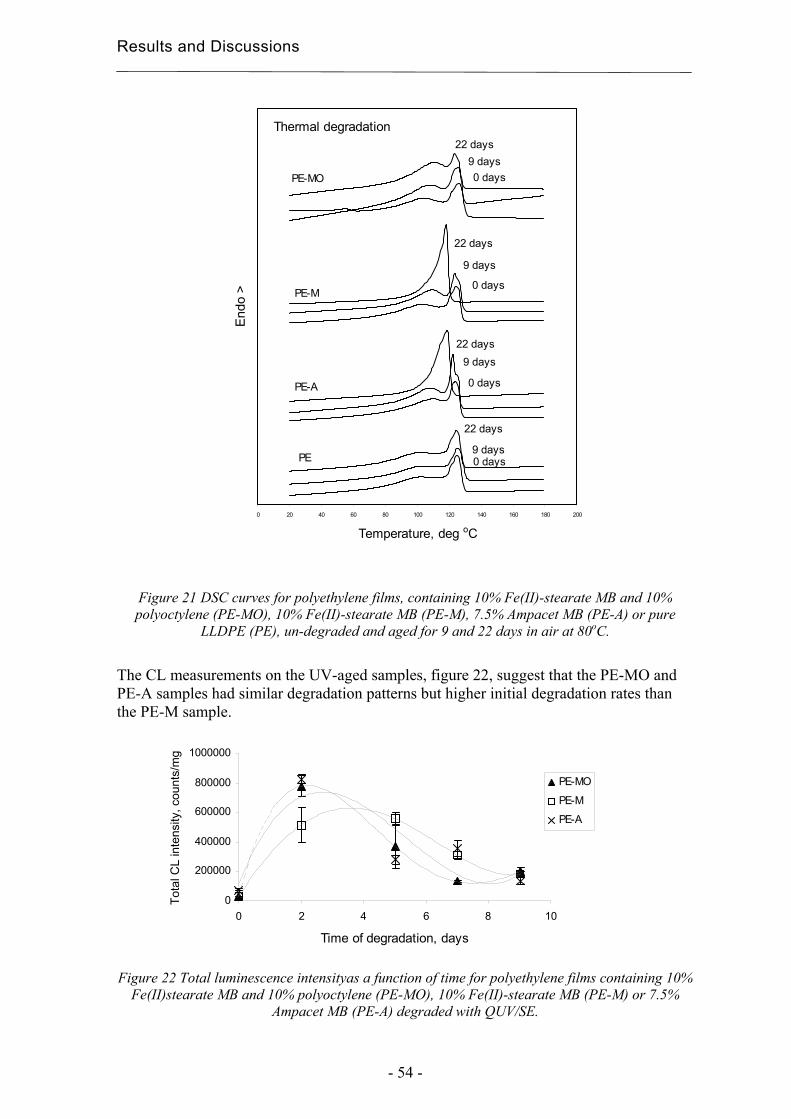
Results and Discussions
- 54 -
Figure 21 DSC curves for polyethylene films, containing 10% Fe(II)-stearate MB and 10% polyoctylene (PE-MO), 10% Fe(II)-stearate MB (PE-M), 7.5% Ampacet MB (PE-A) or pure
LLDPE (PE), un-degraded and aged for 9 and 22 days in air at 80oC.
The CL measurements on the UV-aged samples, figure 22, suggest that the PE-MO and PE-A samples had similar degradation patterns but higher initial degradation rates than the PE-M sample.
0
200000
400000
600000
800000
1000000
0 2 4 6 8 10
Time of degradation, days
Tota
l CL
inte
nsity
, cou
nts/
mg
PE-MO
PE-M
PE-A
Figure 22 Total luminescence intensityas a function of time for polyethylene films containing 10%
Fe(II)stearate MB and 10% polyoctylene (PE-MO), 10% Fe(II)-stearate MB (PE-M) or 7.5% Ampacet MB (PE-A) degraded with QUV/SE.
0 20 40 60 80 100 120 140 160 180 200
Temperature, deg oC
Endo
>
PE
PE-A
PE-M
PE-MO
22 days
22 days
22 days
22 days
9 days
9 days
9 days
9 days
0 days
0 days
0 days
0 days
Thermal degradation
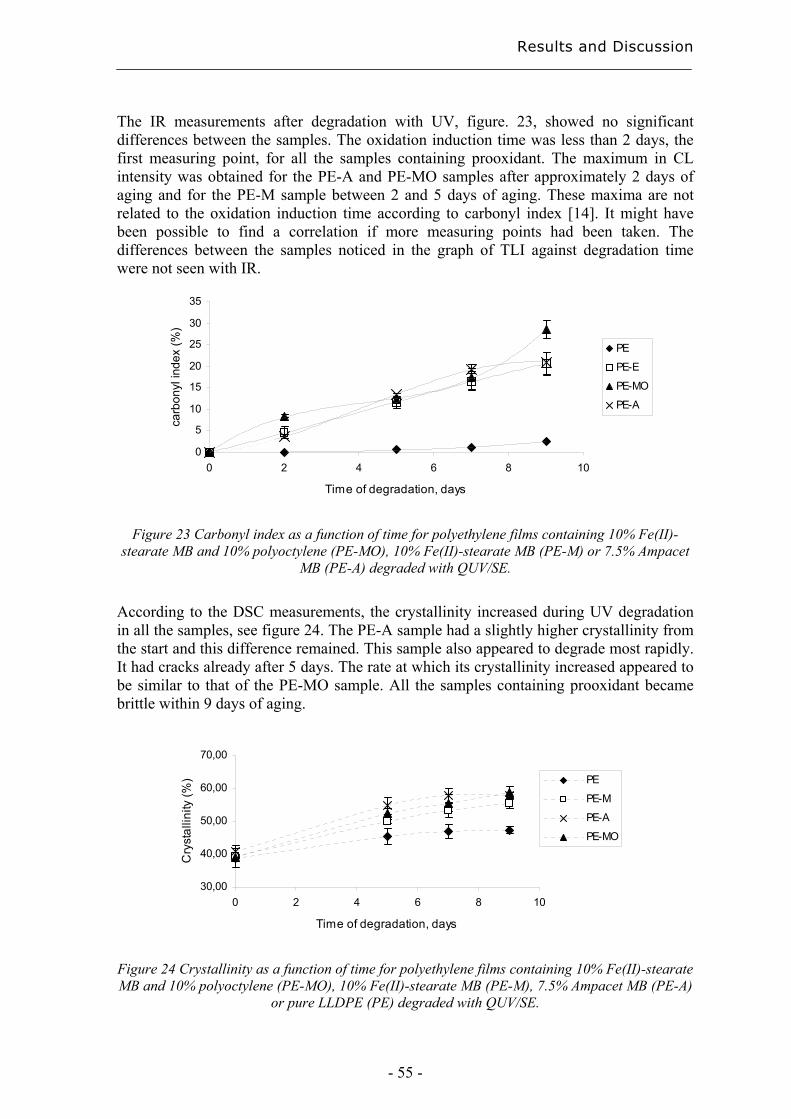
Results and Discussion
- 55 -
The IR measurements after degradation with UV, figure. 23, showed no significant differences between the samples. The oxidation induction time was less than 2 days, the first measuring point, for all the samples containing prooxidant. The maximum in CL intensity was obtained for the PE-A and PE-MO samples after approximately 2 days of aging and for the PE-M sample between 2 and 5 days of aging. These maxima are not related to the oxidation induction time according to carbonyl index [14]. It might have been possible to find a correlation if more measuring points had been taken. The differences between the samples noticed in the graph of TLI against degradation time were not seen with IR.
0
5
10
15
20
25
30
35
0 2 4 6 8 10
Time of degradation, days
carb
onyl
inde
x (%
)
PE
PE-E
PE-MO
PE-A
Figure 23 Carbonyl index as a function of time for polyethylene films containing 10% Fe(II)-
stearate MB and 10% polyoctylene (PE-MO), 10% Fe(II)-stearate MB (PE-M) or 7.5% Ampacet MB (PE-A) degraded with QUV/SE.
According to the DSC measurements, the crystallinity increased during UV degradation in all the samples, see figure 24. The PE-A sample had a slightly higher crystallinity from the start and this difference remained. This sample also appeared to degrade most rapidly. It had cracks already after 5 days. The rate at which its crystallinity increased appeared to be similar to that of the PE-MO sample. All the samples containing prooxidant became brittle within 9 days of aging.
30,00
40,00
50,00
60,00
70,00
0 2 4 6 8 10
Time of degradation, days
Cry
stal
linity
(%) PE
PE-M
PE-A
PE-MO
Figure 24 Crystallinity as a function of time for polyethylene films containing 10% Fe(II)-stearate MB and 10% polyoctylene (PE-MO), 10% Fe(II)-stearate MB (PE-M), 7.5% Ampacet MB (PE-A)
or pure LLDPE (PE) degraded with QUV/SE.
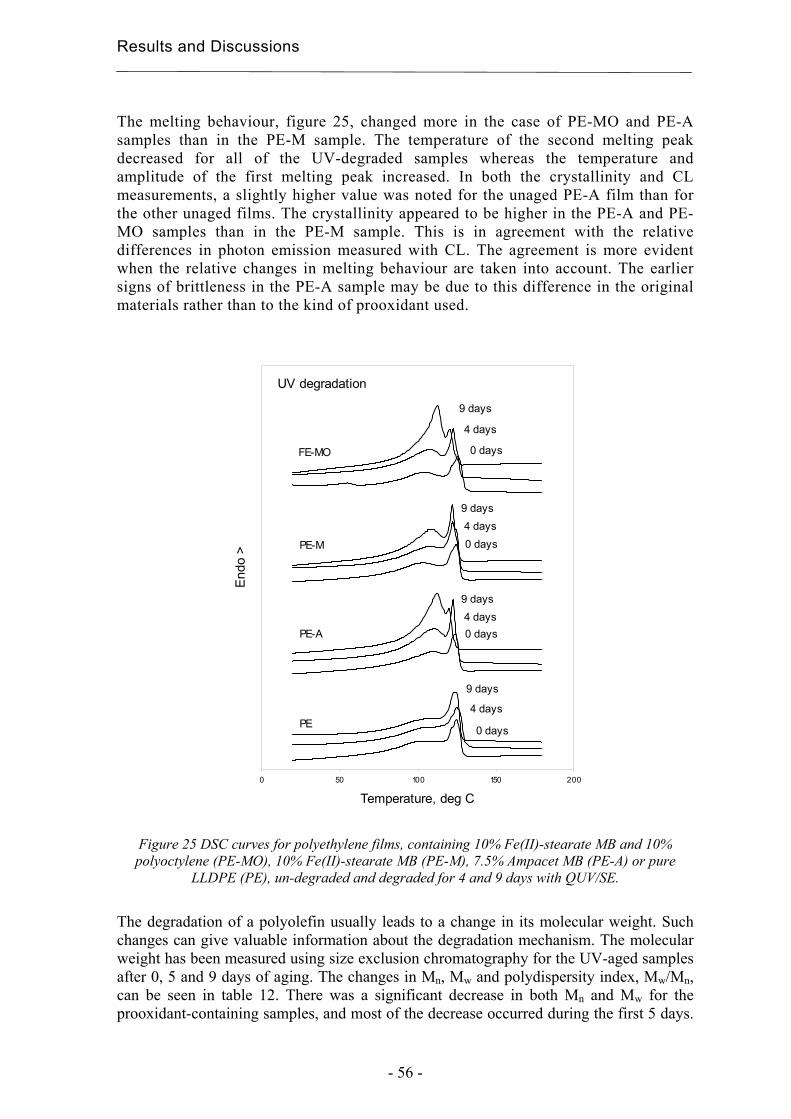
Results and Discussions
- 56 -
The melting behaviour, figure 25, changed more in the case of PE-MO and PE-A samples than in the PE-M sample. The temperature of the second melting peak decreased for all of the UV-degraded samples whereas the temperature and amplitude of the first melting peak increased. In both the crystallinity and CL measurements, a slightly higher value was noted for the unaged PE-A film than for the other unaged films. The crystallinity appeared to be higher in the PE-A and PE-MO samples than in the PE-M sample. This is in agreement with the relative differences in photon emission measured with CL. The agreement is more evident when the relative changes in melting behaviour are taken into account. The earlier signs of brittleness in the PE-A sample may be due to this difference in the original materials rather than to the kind of prooxidant used.
Figure 25 DSC curves for polyethylene films, containing 10% Fe(II)-stearate MB and 10% polyoctylene (PE-MO), 10% Fe(II)-stearate MB (PE-M), 7.5% Ampacet MB (PE-A) or pure
LLDPE (PE), un-degraded and degraded for 4 and 9 days with QUV/SE.
The degradation of a polyolefin usually leads to a change in its molecular weight. Such changes can give valuable information about the degradation mechanism. The molecular weight has been measured using size exclusion chromatography for the UV-aged samples after 0, 5 and 9 days of aging. The changes in Mn, Mw and polydispersity index, Mw/Mn, can be seen in table 12. There was a significant decrease in both Mn and Mw for the prooxidant-containing samples, and most of the decrease occurred during the first 5 days.
0 50 100 150 200
Temperature, deg C
Endo
>
PE
PE-A
PE-M
FE-MO
9 days 4 days0 days
9 days
9 days
4 days
4 days
0 days
0 days
9 days
4 days
0 days
UV degradation
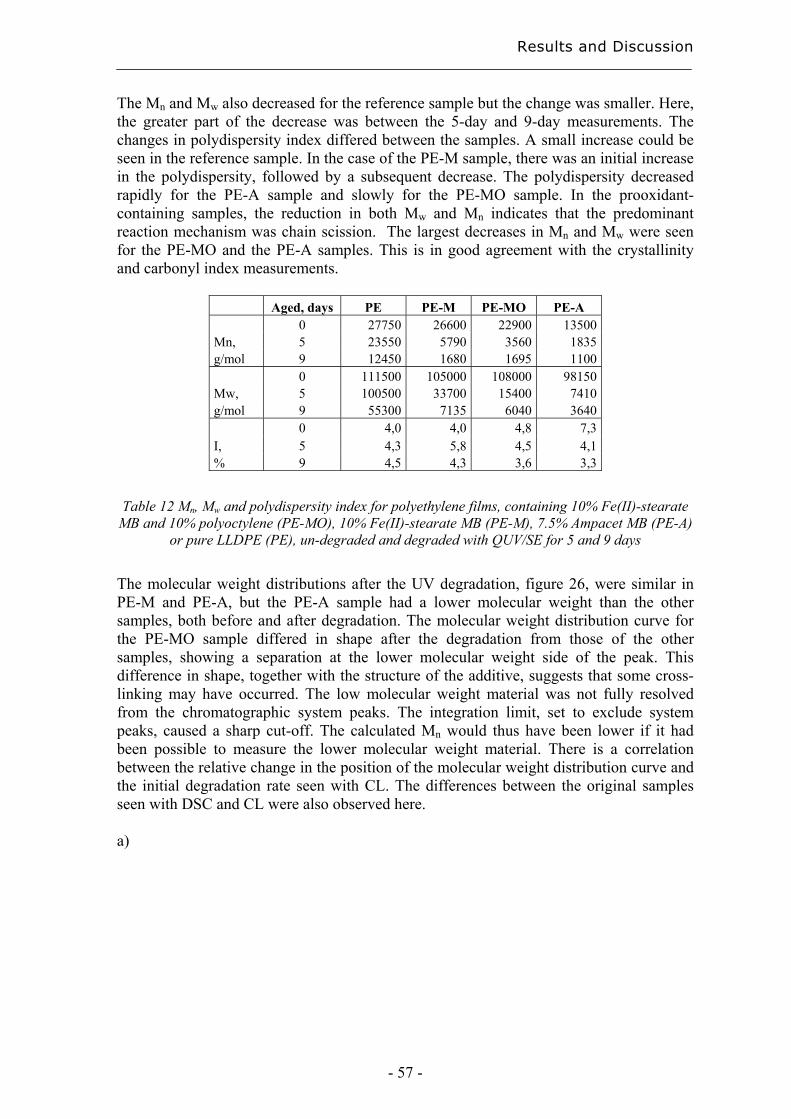
Results and Discussion
- 57 -
The Mn and Mw also decreased for the reference sample but the change was smaller. Here, the greater part of the decrease was between the 5-day and 9-day measurements. The changes in polydispersity index differed between the samples. A small increase could be seen in the reference sample. In the case of the PE-M sample, there was an initial increase in the polydispersity, followed by a subsequent decrease. The polydispersity decreased rapidly for the PE-A sample and slowly for the PE-MO sample. In the prooxidant-containing samples, the reduction in both Mw and Mn indicates that the predominant reaction mechanism was chain scission. The largest decreases in Mn and Mw were seen for the PE-MO and the PE-A samples. This is in good agreement with the crystallinity and carbonyl index measurements.
Aged, days PE PE-M PE-MO PE-A 0 27750 26600 22900 13500 Mn, 5 23550 5790 3560 1835 g/mol 9 12450 1680 1695 1100 0 111500 105000 108000 98150 Mw, 5 100500 33700 15400 7410 g/mol 9 55300 7135 6040 3640 0 4,0 4,0 4,8 7,3 I, 5 4,3 5,8 4,5 4,1 % 9 4,5 4,3 3,6 3,3
Table 12 Mn, Mw and polydispersity index for polyethylene films, containing 10% Fe(II)-stearate
MB and 10% polyoctylene (PE-MO), 10% Fe(II)-stearate MB (PE-M), 7.5% Ampacet MB (PE-A) or pure LLDPE (PE), un-degraded and degraded with QUV/SE for 5 and 9 days
The molecular weight distributions after the UV degradation, figure 26, were similar in PE-M and PE-A, but the PE-A sample had a lower molecular weight than the other samples, both before and after degradation. The molecular weight distribution curve for the PE-MO sample differed in shape after the degradation from those of the other samples, showing a separation at the lower molecular weight side of the peak. This difference in shape, together with the structure of the additive, suggests that some cross-linking may have occurred. The low molecular weight material was not fully resolved from the chromatographic system peaks. The integration limit, set to exclude system peaks, caused a sharp cut-off. The calculated Mn would thus have been lower if it had been possible to measure the lower molecular weight material. There is a correlation between the relative change in the position of the molecular weight distribution curve and the initial degradation rate seen with CL. The differences between the original samples seen with DSC and CL were also observed here. a)
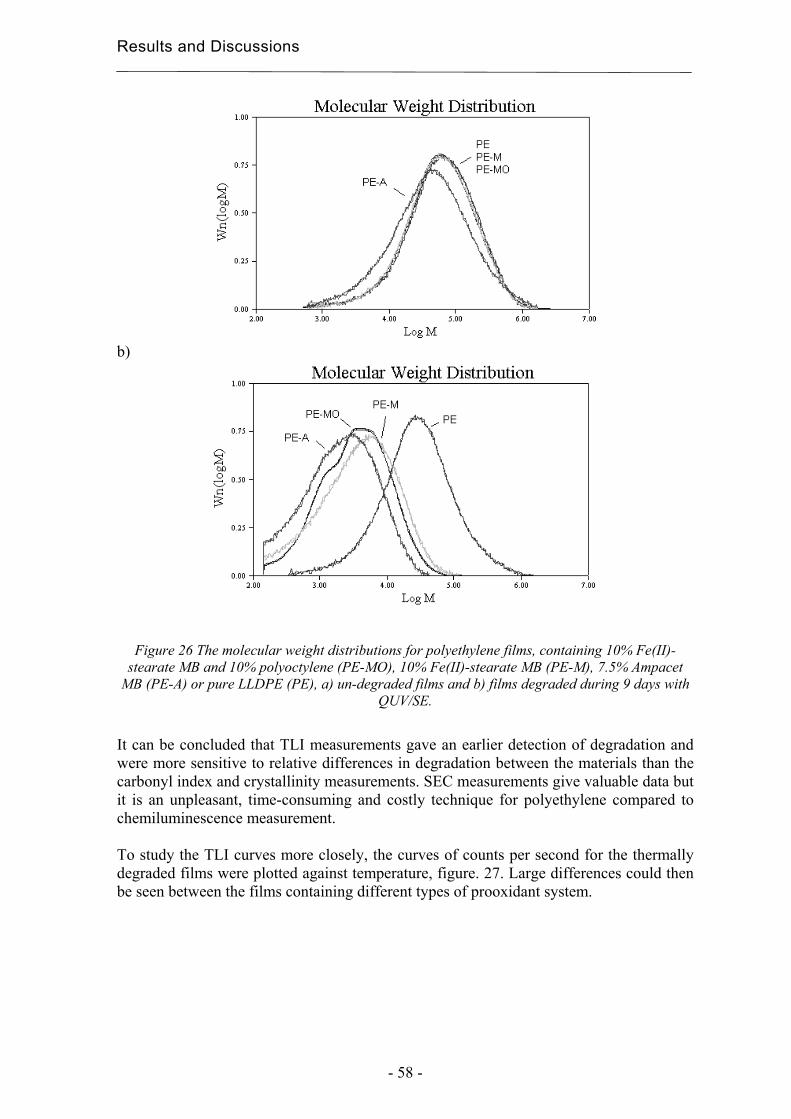
Results and Discussions
- 58 -
b)
Figure 26 The molecular weight distributions for polyethylene films, containing 10% Fe(II)-stearate MB and 10% polyoctylene (PE-MO), 10% Fe(II)-stearate MB (PE-M), 7.5% Ampacet
MB (PE-A) or pure LLDPE (PE), a) un-degraded films and b) films degraded during 9 days with QUV/SE.
It can be concluded that TLI measurements gave an earlier detection of degradation and were more sensitive to relative differences in degradation between the materials than the carbonyl index and crystallinity measurements. SEC measurements give valuable data but it is an unpleasant, time-consuming and costly technique for polyethylene compared to chemiluminescence measurement. To study the TLI curves more closely, the curves of counts per second for the thermally degraded films were plotted against temperature, figure. 27. Large differences could then be seen between the films containing different types of prooxidant system.
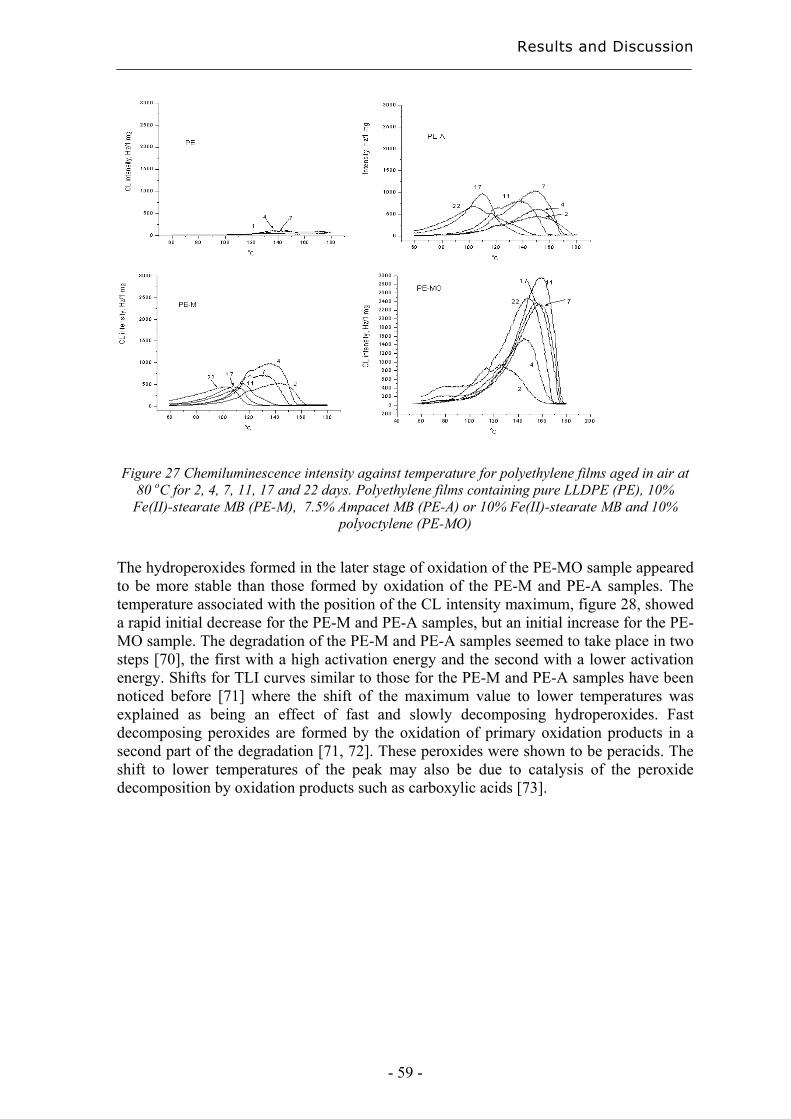
Results and Discussion
- 59 -
Figure 27 Chemiluminescence intensity against temperature for polyethylene films aged in air at
80 oC for 2, 4, 7, 11, 17 and 22 days. Polyethylene films containing pure LLDPE (PE), 10% Fe(II)-stearate MB (PE-M), 7.5% Ampacet MB (PE-A) or 10% Fe(II)-stearate MB and 10%
polyoctylene (PE-MO)
The hydroperoxides formed in the later stage of oxidation of the PE-MO sample appeared to be more stable than those formed by oxidation of the PE-M and PE-A samples. The temperature associated with the position of the CL intensity maximum, figure 28, showed a rapid initial decrease for the PE-M and PE-A samples, but an initial increase for the PE-MO sample. The degradation of the PE-M and PE-A samples seemed to take place in two steps [70], the first with a high activation energy and the second with a lower activation energy. Shifts for TLI curves similar to those for the PE-M and PE-A samples have been noticed before [71] where the shift of the maximum value to lower temperatures was explained as being an effect of fast and slowly decomposing hydroperoxides. Fast decomposing peroxides are formed by the oxidation of primary oxidation products in a second part of the degradation [71, 72]. These peroxides were shown to be peracids. The shift to lower temperatures of the peak may also be due to catalysis of the peroxide decomposition by oxidation products such as carboxylic acids [73].
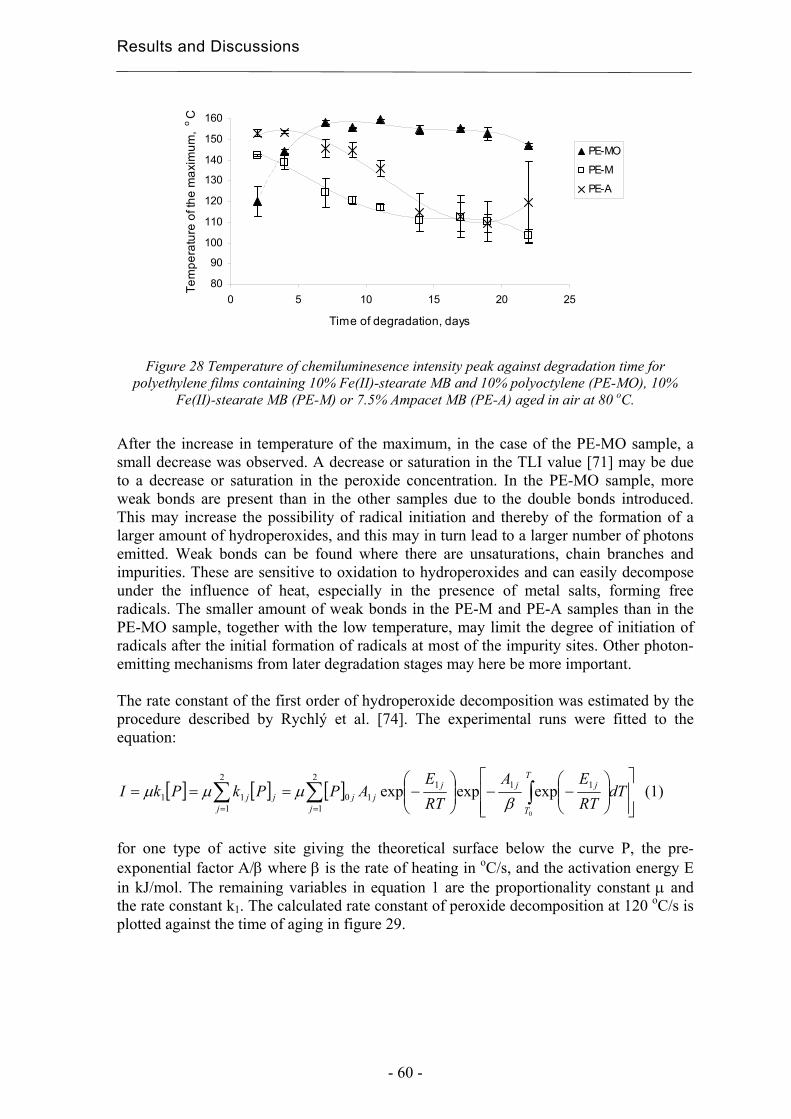
Results and Discussions
- 60 -
Figure 28 Temperature of chemiluminesence intensity peak against degradation time for polyethylene films containing 10% Fe(II)-stearate MB and 10% polyoctylene (PE-MO), 10%
Fe(II)-stearate MB (PE-M) or 7.5% Ampacet MB (PE-A) aged in air at 80 oC.
After the increase in temperature of the maximum, in the case of the PE-MO sample, a small decrease was observed. A decrease or saturation in the TLI value [71] may be due to a decrease or saturation in the peroxide concentration. In the PE-MO sample, more weak bonds are present than in the other samples due to the double bonds introduced. This may increase the possibility of radical initiation and thereby of the formation of a larger amount of hydroperoxides, and this may in turn lead to a larger number of photons emitted. Weak bonds can be found where there are unsaturations, chain branches and impurities. These are sensitive to oxidation to hydroperoxides and can easily decompose under the influence of heat, especially in the presence of metal salts, forming free radicals. The smaller amount of weak bonds in the PE-M and PE-A samples than in the PE-MO sample, together with the low temperature, may limit the degree of initiation of radicals after the initial formation of radicals at most of the impurity sites. Other photon-emitting mechanisms from later degradation stages may here be more important. The rate constant of the first order of hydroperoxide decomposition was estimated by the procedure described by Rychlý et al. [74]. The experimental runs were fitted to the equation:
[ ] [ ] [ ]⎥⎥⎦
⎤
⎢⎢⎣
⎡⎟⎟⎠
⎞⎜⎜⎝
⎛−−⎟⎟
⎠
⎞⎜⎜⎝
⎛−=== ∫∑∑
==
T
T
jj
j
jjj
jjj dT
RTEA
RTE
APPkPkI0
112
1
110
2
111 expexpexp
βµµµ (1)
for one type of active site giving the theoretical surface below the curve P, the pre-exponential factor A/β where β is the rate of heating in oC/s, and the activation energy E in kJ/mol. The remaining variables in equation 1 are the proportionality constant µ and the rate constant k1. The calculated rate constant of peroxide decomposition at 120 oC/s is plotted against the time of aging in figure 29.
80
90
100
110
120
130
140
150
160
0 5 10 15 20 25
Time of degradation, days
Tem
pera
ture
of t
he m
axim
um,
o C
PE-MO
PE-M
PE-A
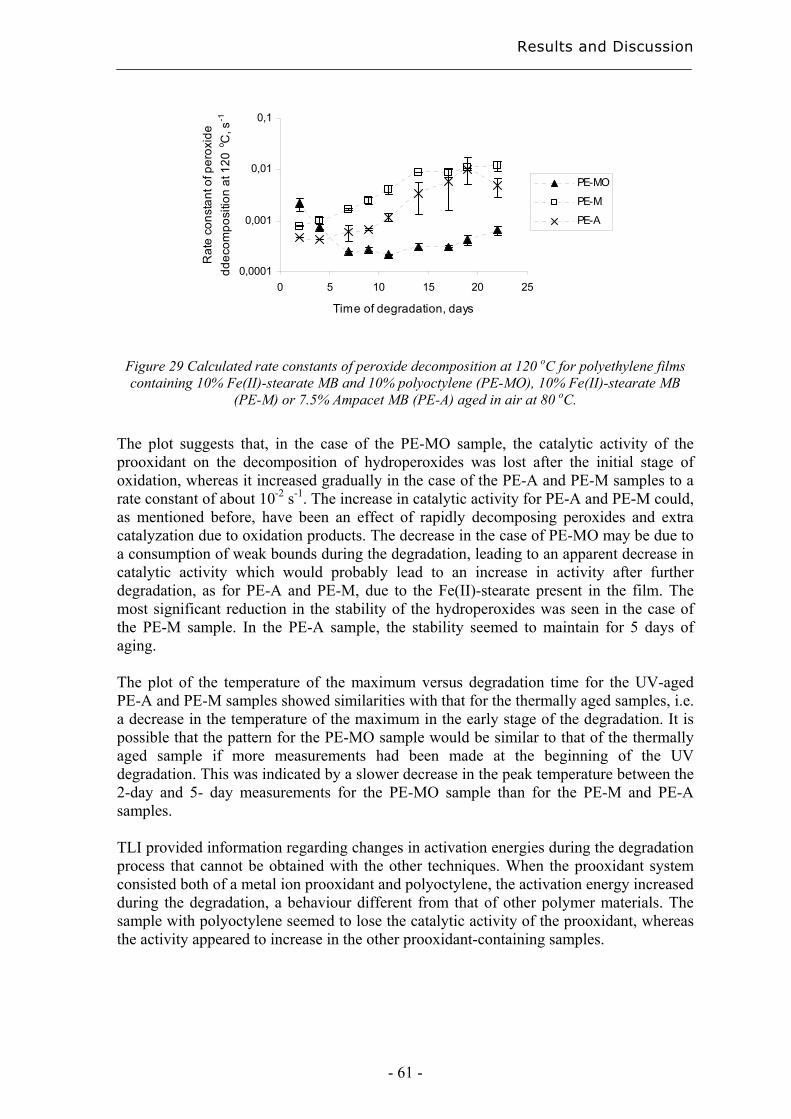
Results and Discussion
- 61 -
0,0001
0,001
0,01
0,1
0 5 10 15 20 25
Time of degradation, days
Rat
e co
nsta
nt o
f per
oxid
e dd
ecom
posi
tion
at 1
20 o C
, s-1
PE-MO
PE-M
PE-A
Figure 29 Calculated rate constants of peroxide decomposition at 120 oC for polyethylene films containing 10% Fe(II)-stearate MB and 10% polyoctylene (PE-MO), 10% Fe(II)-stearate MB
(PE-M) or 7.5% Ampacet MB (PE-A) aged in air at 80 oC.
The plot suggests that, in the case of the PE-MO sample, the catalytic activity of the prooxidant on the decomposition of hydroperoxides was lost after the initial stage of oxidation, whereas it increased gradually in the case of the PE-A and PE-M samples to a rate constant of about 10-2 s-1. The increase in catalytic activity for PE-A and PE-M could, as mentioned before, have been an effect of rapidly decomposing peroxides and extra catalyzation due to oxidation products. The decrease in the case of PE-MO may be due to a consumption of weak bounds during the degradation, leading to an apparent decrease in catalytic activity which would probably lead to an increase in activity after further degradation, as for PE-A and PE-M, due to the Fe(II)-stearate present in the film. The most significant reduction in the stability of the hydroperoxides was seen in the case of the PE-M sample. In the PE-A sample, the stability seemed to maintain for 5 days of aging. The plot of the temperature of the maximum versus degradation time for the UV-aged PE-A and PE-M samples showed similarities with that for the thermally aged samples, i.e. a decrease in the temperature of the maximum in the early stage of the degradation. It is possible that the pattern for the PE-MO sample would be similar to that of the thermally aged sample if more measurements had been made at the beginning of the UV degradation. This was indicated by a slower decrease in the peak temperature between the 2-day and 5- day measurements for the PE-MO sample than for the PE-M and PE-A samples. TLI provided information regarding changes in activation energies during the degradation process that cannot be obtained with the other techniques. When the prooxidant system consisted both of a metal ion prooxidant and polyoctylene, the activation energy increased during the degradation, a behaviour different from that of other polymer materials. The sample with polyoctylene seemed to lose the catalytic activity of the prooxidant, whereas the activity appeared to increase in the other prooxidant-containing samples.
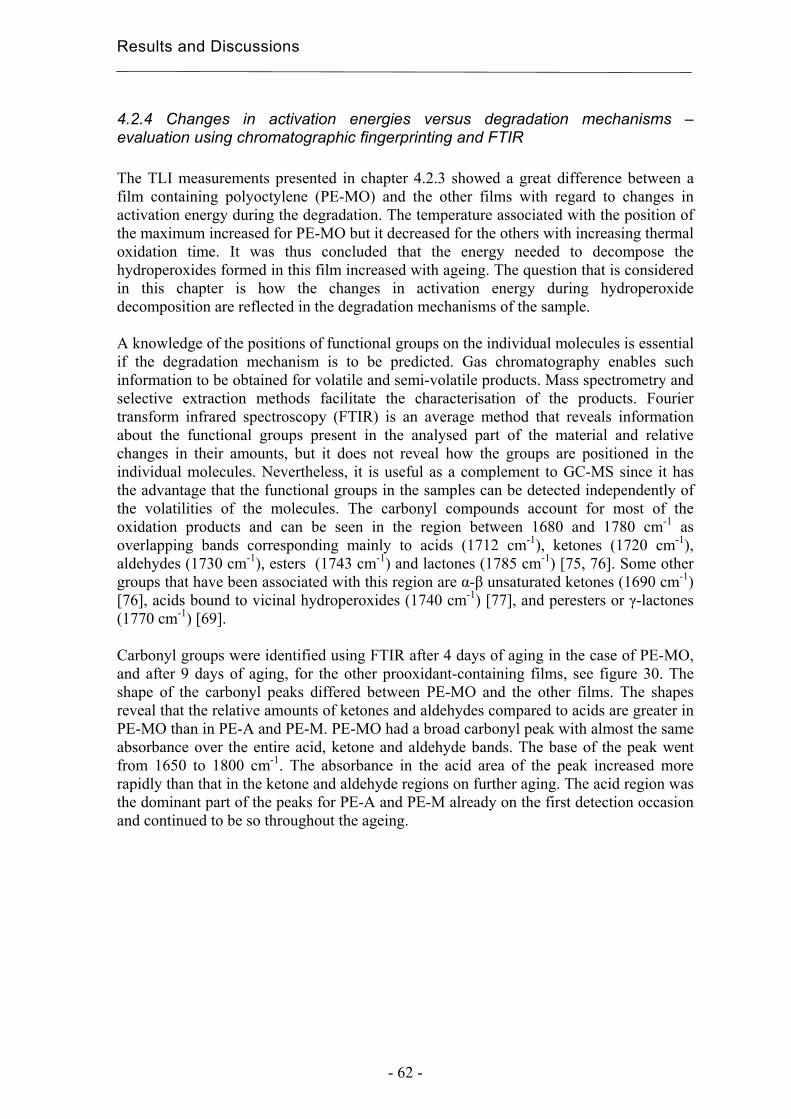
Results and Discussions
- 62 -
4.2.4 Changes in activation energies versus degradation mechanisms – evaluation using chromatographic fingerprinting and FTIR The TLI measurements presented in chapter 4.2.3 showed a great difference between a film containing polyoctylene (PE-MO) and the other films with regard to changes in activation energy during the degradation. The temperature associated with the position of the maximum increased for PE-MO but it decreased for the others with increasing thermal oxidation time. It was thus concluded that the energy needed to decompose the hydroperoxides formed in this film increased with ageing. The question that is considered in this chapter is how the changes in activation energy during hydroperoxide decomposition are reflected in the degradation mechanisms of the sample. A knowledge of the positions of functional groups on the individual molecules is essential if the degradation mechanism is to be predicted. Gas chromatography enables such information to be obtained for volatile and semi-volatile products. Mass spectrometry and selective extraction methods facilitate the characterisation of the products. Fourier transform infrared spectroscopy (FTIR) is an average method that reveals information about the functional groups present in the analysed part of the material and relative changes in their amounts, but it does not reveal how the groups are positioned in the individual molecules. Nevertheless, it is useful as a complement to GC-MS since it has the advantage that the functional groups in the samples can be detected independently of the volatilities of the molecules. The carbonyl compounds account for most of the oxidation products and can be seen in the region between 1680 and 1780 cm-1 as overlapping bands corresponding mainly to acids (1712 cm-1), ketones (1720 cm-1), aldehydes (1730 cm-1), esters (1743 cm-1) and lactones (1785 cm-1) [75, 76]. Some other groups that have been associated with this region are α-β unsaturated ketones (1690 cm-1) [76], acids bound to vicinal hydroperoxides (1740 cm-1) [77], and peresters or γ-lactones (1770 cm-1) [69]. Carbonyl groups were identified using FTIR after 4 days of aging in the case of PE-MO, and after 9 days of aging, for the other prooxidant-containing films, see figure 30. The shape of the carbonyl peaks differed between PE-MO and the other films. The shapes reveal that the relative amounts of ketones and aldehydes compared to acids are greater in PE-MO than in PE-A and PE-M. PE-MO had a broad carbonyl peak with almost the same absorbance over the entire acid, ketone and aldehyde bands. The base of the peak went from 1650 to 1800 cm-1. The absorbance in the acid area of the peak increased more rapidly than that in the ketone and aldehyde regions on further aging. The acid region was the dominant part of the peaks for PE-A and PE-M already on the first detection occasion and continued to be so throughout the ageing.
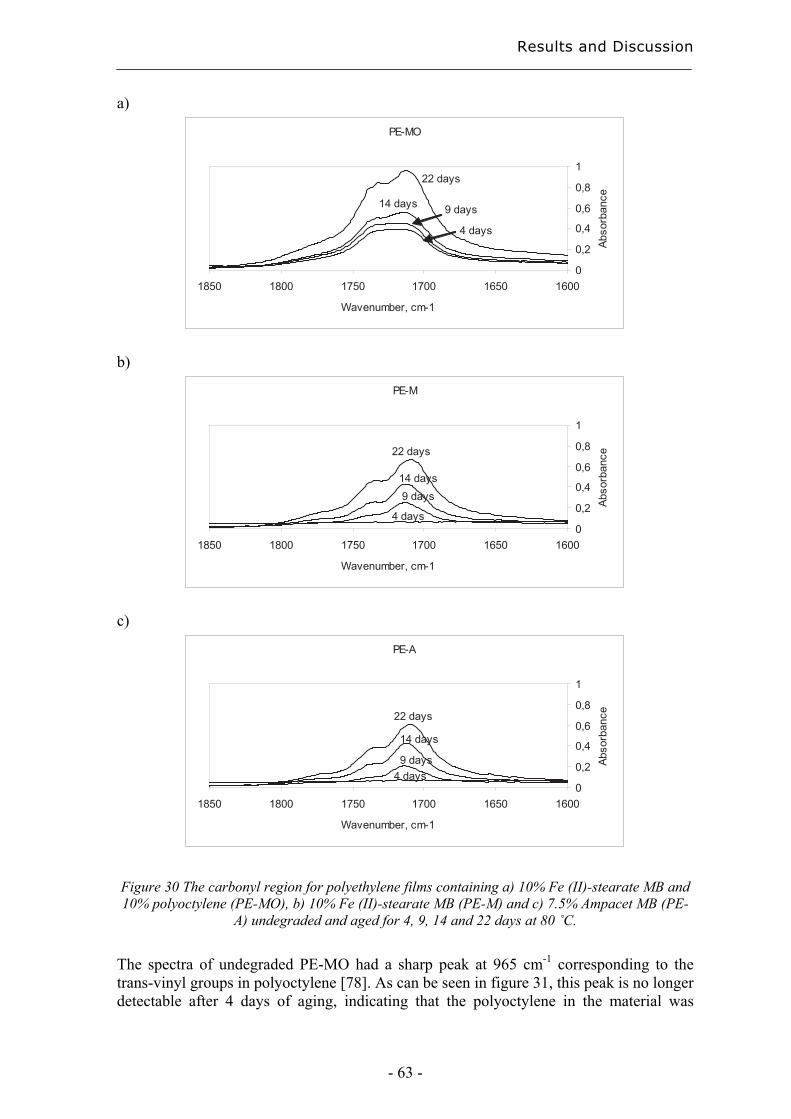
Results and Discussion
- 63 -
a)
PE-MO
0
0,2
0,4
0,6
0,8
1
160016501700175018001850
Wavenumber, cm-1
Abso
rban
ce
22 days
14 days 9 days
4 days
b)
PE-M
0
0,2
0,4
0,6
0,8
1
160016501700175018001850
Wavenumber, cm-1
Abso
rban
ce22 days
14 days9 days
4 days
c)
PE-A
0
0,2
0,4
0,6
0,8
1
160016501700175018001850
Wavenumber, cm-1
Abso
rban
ce22 days
14 days
9 days4 days
Figure 30 The carbonyl region for polyethylene films containing a) 10% Fe (II)-stearate MB and 10% polyoctylene (PE-MO), b) 10% Fe (II)-stearate MB (PE-M) and c) 7.5% Ampacet MB (PE-
A) undegraded and aged for 4, 9, 14 and 22 days at 80 ˚C.
The spectra of undegraded PE-MO had a sharp peak at 965 cm-1 corresponding to the trans-vinyl groups in polyoctylene [78]. As can be seen in figure 31, this peak is no longer detectable after 4 days of aging, indicating that the polyoctylene in the material was
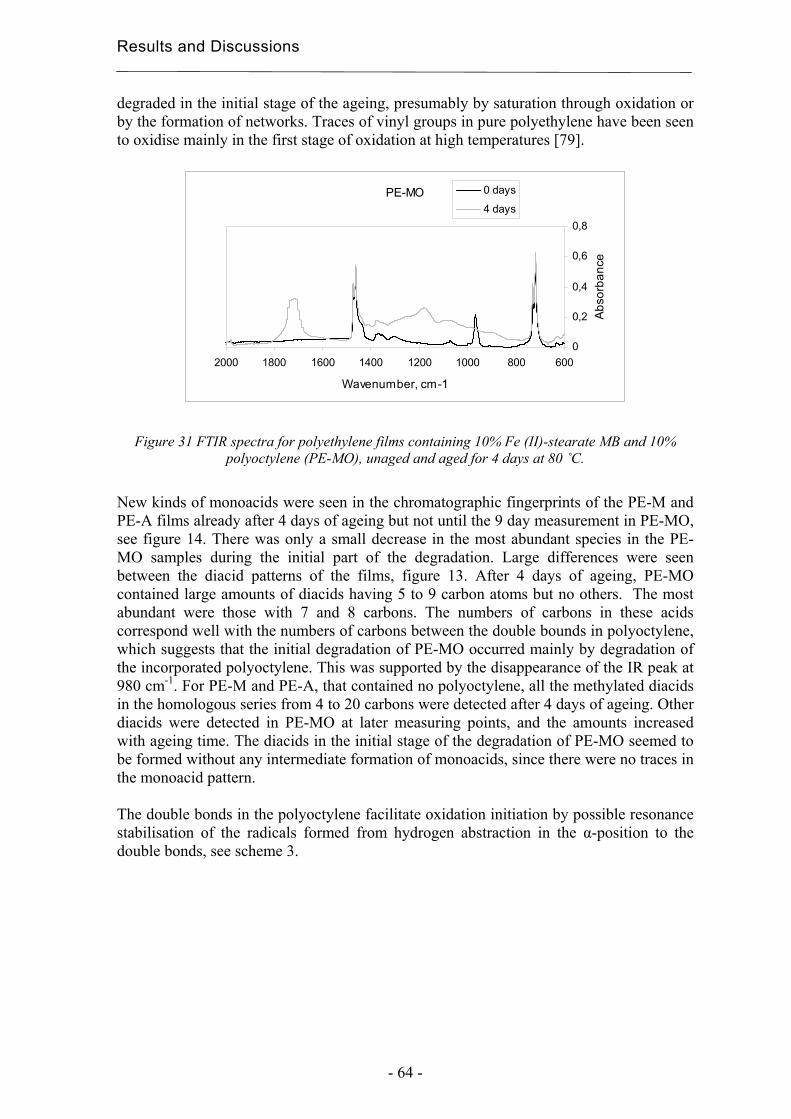
Results and Discussions
- 64 -
degraded in the initial stage of the ageing, presumably by saturation through oxidation or by the formation of networks. Traces of vinyl groups in pure polyethylene have been seen to oxidise mainly in the first stage of oxidation at high temperatures [79].
PE-MO
0
0,2
0,4
0,6
0,8
600800100012001400160018002000
Wavenumber, cm-1
Abs
orba
nce
0 days
4 days
Figure 31 FTIR spectra for polyethylene films containing 10% Fe (II)-stearate MB and 10% polyoctylene (PE-MO), unaged and aged for 4 days at 80 ˚C.
New kinds of monoacids were seen in the chromatographic fingerprints of the PE-M and PE-A films already after 4 days of ageing but not until the 9 day measurement in PE-MO, see figure 14. There was only a small decrease in the most abundant species in the PE-MO samples during the initial part of the degradation. Large differences were seen between the diacid patterns of the films, figure 13. After 4 days of ageing, PE-MO contained large amounts of diacids having 5 to 9 carbon atoms but no others. The most abundant were those with 7 and 8 carbons. The numbers of carbons in these acids correspond well with the numbers of carbons between the double bounds in polyoctylene, which suggests that the initial degradation of PE-MO occurred mainly by degradation of the incorporated polyoctylene. This was supported by the disappearance of the IR peak at 980 cm-1. For PE-M and PE-A, that contained no polyoctylene, all the methylated diacids in the homologous series from 4 to 20 carbons were detected after 4 days of ageing. Other diacids were detected in PE-MO at later measuring points, and the amounts increased with ageing time. The diacids in the initial stage of the degradation of PE-MO seemed to be formed without any intermediate formation of monoacids, since there were no traces in the monoacid pattern. The double bonds in the polyoctylene facilitate oxidation initiation by possible resonance stabilisation of the radicals formed from hydrogen abstraction in the α-position to the double bonds, see scheme 3.
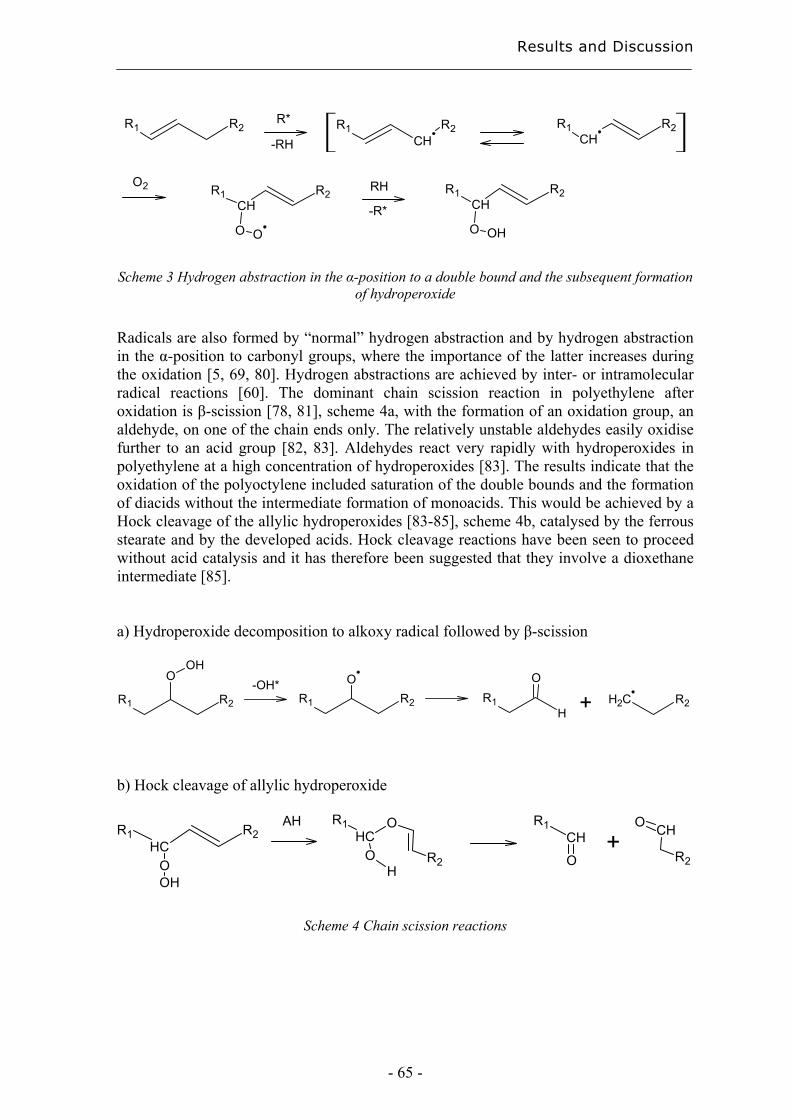
Results and Discussion
- 65 -
R1 R2 R1
CHR2 R1
CHR2
R1CH
R2
O O
O2 R1CH
R2
O OH
RH
-R*
R*
-RH
Scheme 3 Hydrogen abstraction in the α-position to a double bound and the subsequent formation
of hydroperoxide
Radicals are also formed by “normal” hydrogen abstraction and by hydrogen abstraction in the α-position to carbonyl groups, where the importance of the latter increases during the oxidation [5, 69, 80]. Hydrogen abstractions are achieved by inter- or intramolecular radical reactions [60]. The dominant chain scission reaction in polyethylene after oxidation is β-scission [78, 81], scheme 4a, with the formation of an oxidation group, an aldehyde, on one of the chain ends only. The relatively unstable aldehydes easily oxidise further to an acid group [82, 83]. Aldehydes react very rapidly with hydroperoxides in polyethylene at a high concentration of hydroperoxides [83]. The results indicate that the oxidation of the polyoctylene included saturation of the double bounds and the formation of diacids without the intermediate formation of monoacids. This would be achieved by a Hock cleavage of the allylic hydroperoxides [83-85], scheme 4b, catalysed by the ferrous stearate and by the developed acids. Hock cleavage reactions have been seen to proceed without acid catalysis and it has therefore been suggested that they involve a dioxethane intermediate [85]. a) Hydroperoxide decomposition to alkoxy radical followed by β-scission
R1 R2
OR1
H
O
+ CH2 R2R1 R2
OOH
-OH*
b) Hock cleavage of allylic hydroperoxide
R1HC
R2
OOH
H
OR1HC
O R2
AH R1CH
O
O CH
R2+
Scheme 4 Chain scission reactions
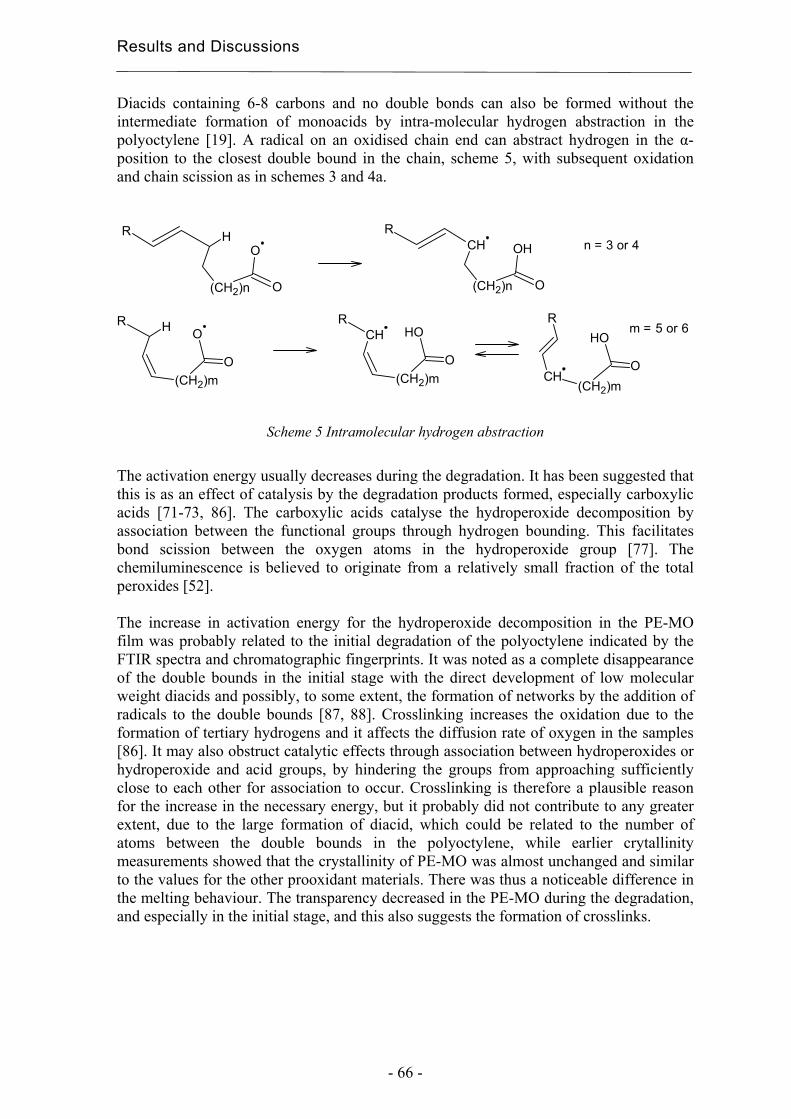
Results and Discussions
- 66 -
Diacids containing 6-8 carbons and no double bonds can also be formed without the intermediate formation of monoacids by intra-molecular hydrogen abstraction in the polyoctylene [19]. A radical on an oxidised chain end can abstract hydrogen in the α-position to the closest double bound in the chain, scheme 5, with subsequent oxidation and chain scission as in schemes 3 and 4a. R H
(CH2)n
O
O
RCH
(CH2)n
OH
O
n = 3 or 4
R H
(CH2)m
O
O
RCH
(CH2)m
HO
O
m = 5 or 6
CH(CH2)m
HO
O
R
Scheme 5 Intramolecular hydrogen abstraction The activation energy usually decreases during the degradation. It has been suggested that this is as an effect of catalysis by the degradation products formed, especially carboxylic acids [71-73, 86]. The carboxylic acids catalyse the hydroperoxide decomposition by association between the functional groups through hydrogen bounding. This facilitates bond scission between the oxygen atoms in the hydroperoxide group [77]. The chemiluminescence is believed to originate from a relatively small fraction of the total peroxides [52]. The increase in activation energy for the hydroperoxide decomposition in the PE-MO film was probably related to the initial degradation of the polyoctylene indicated by the FTIR spectra and chromatographic fingerprints. It was noted as a complete disappearance of the double bounds in the initial stage with the direct development of low molecular weight diacids and possibly, to some extent, the formation of networks by the addition of radicals to the double bounds [87, 88]. Crosslinking increases the oxidation due to the formation of tertiary hydrogens and it affects the diffusion rate of oxygen in the samples [86]. It may also obstruct catalytic effects through association between hydroperoxides or hydroperoxide and acid groups, by hindering the groups from approaching sufficiently close to each other for association to occur. Crosslinking is therefore a plausible reason for the increase in the necessary energy, but it probably did not contribute to any greater extent, due to the large formation of diacid, which could be related to the number of atoms between the double bounds in the polyoctylene, while earlier crytallinity measurements showed that the crystallinity of PE-MO was almost unchanged and similar to the values for the other prooxidant materials. There was thus a noticeable difference in the melting behaviour. The transparency decreased in the PE-MO during the degradation, and especially in the initial stage, and this also suggests the formation of crosslinks.
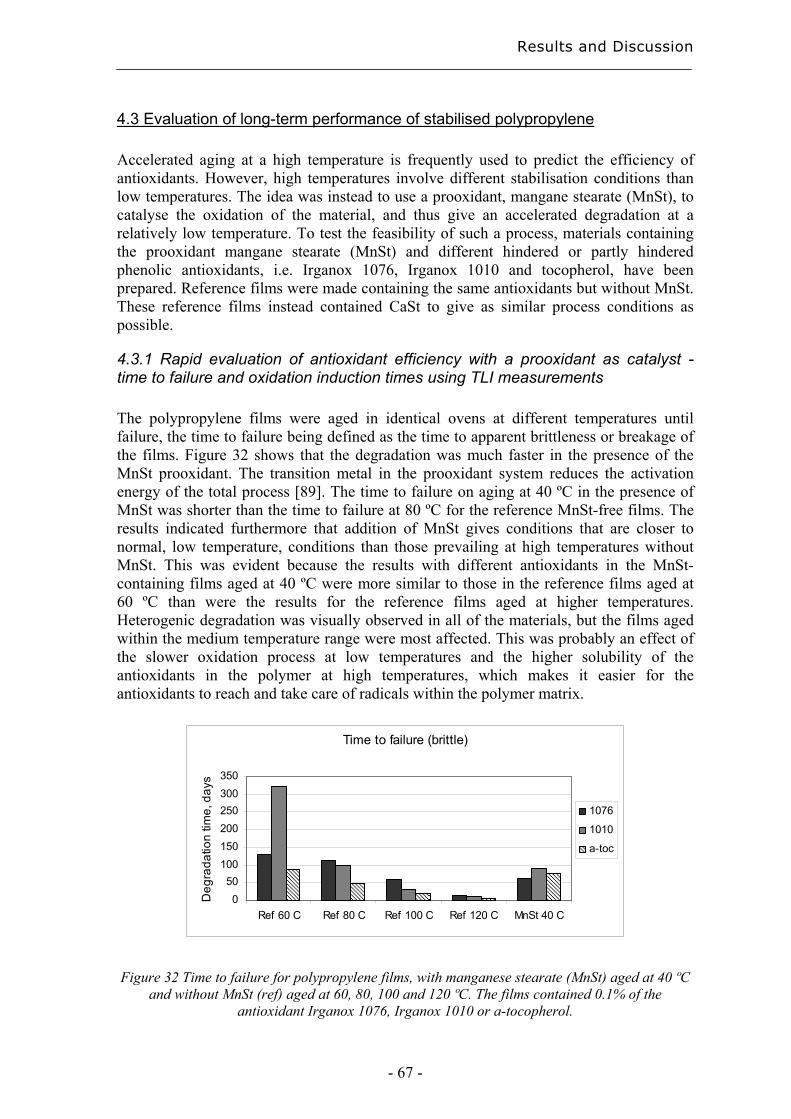
Results and Discussion
- 67 -
4.3 Evaluation of long-term performance of stabilised polypropylene Accelerated aging at a high temperature is frequently used to predict the efficiency of antioxidants. However, high temperatures involve different stabilisation conditions than low temperatures. The idea was instead to use a prooxidant, mangane stearate (MnSt), to catalyse the oxidation of the material, and thus give an accelerated degradation at a relatively low temperature. To test the feasibility of such a process, materials containing the prooxidant mangane stearate (MnSt) and different hindered or partly hindered phenolic antioxidants, i.e. Irganox 1076, Irganox 1010 and tocopherol, have been prepared. Reference films were made containing the same antioxidants but without MnSt. These reference films instead contained CaSt to give as similar process conditions as possible.
4.3.1 Rapid evaluation of antioxidant efficiency with a prooxidant as catalyst - time to failure and oxidation induction times using TLI measurements The polypropylene films were aged in identical ovens at different temperatures until failure, the time to failure being defined as the time to apparent brittleness or breakage of the films. Figure 32 shows that the degradation was much faster in the presence of the MnSt prooxidant. The transition metal in the prooxidant system reduces the activation energy of the total process [89]. The time to failure on aging at 40 ºC in the presence of MnSt was shorter than the time to failure at 80 ºC for the reference MnSt-free films. The results indicated furthermore that addition of MnSt gives conditions that are closer to normal, low temperature, conditions than those prevailing at high temperatures without MnSt. This was evident because the results with different antioxidants in the MnSt-containing films aged at 40 ºC were more similar to those in the reference films aged at 60 ºC than were the results for the reference films aged at higher temperatures. Heterogenic degradation was visually observed in all of the materials, but the films aged within the medium temperature range were most affected. This was probably an effect of the slower oxidation process at low temperatures and the higher solubility of the antioxidants in the polymer at high temperatures, which makes it easier for the antioxidants to reach and take care of radicals within the polymer matrix.
Time to failure (brittle)
050
100150200250300350
Ref 60 C Ref 80 C Ref 100 C Ref 120 C MnSt 40 C
Deg
rada
tion
time,
day
s
1076
1010
a-toc
Figure 32 Time to failure for polypropylene films, with manganese stearate (MnSt) aged at 40 ºC
and without MnSt (ref) aged at 60, 80, 100 and 120 ºC. The films contained 0.1% of the antioxidant Irganox 1076, Irganox 1010 or a-tocopherol.
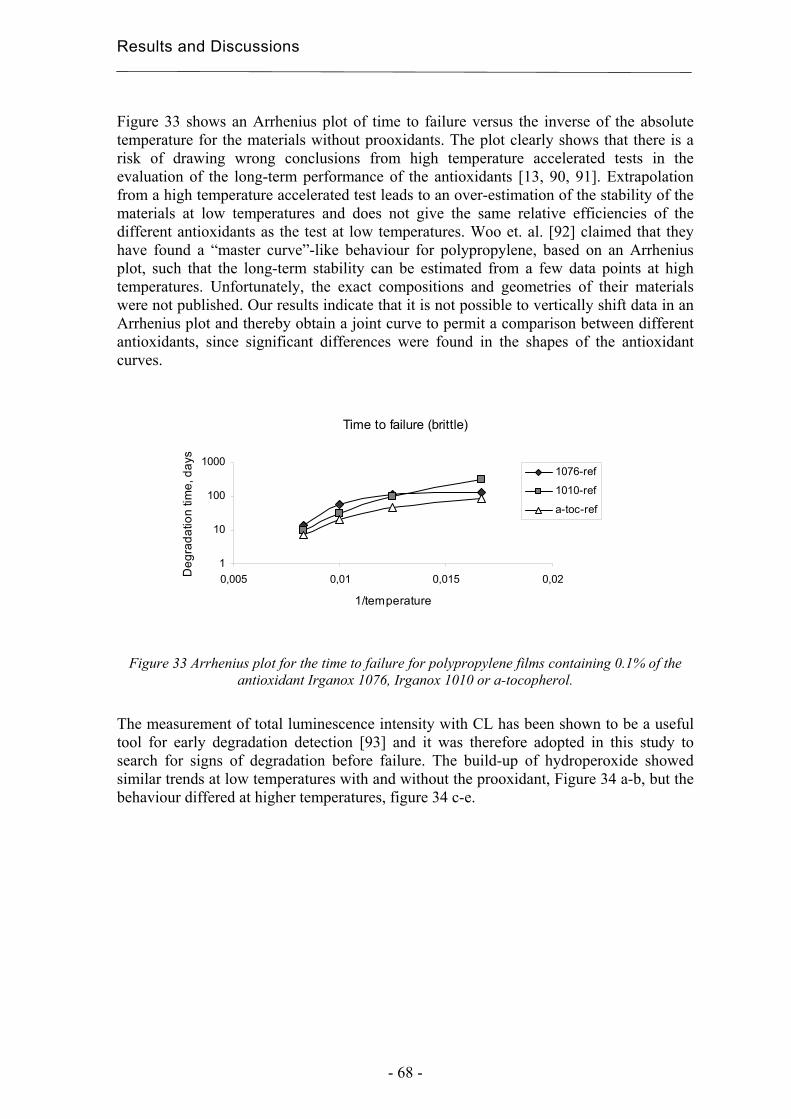
Results and Discussions
- 68 -
Figure 33 shows an Arrhenius plot of time to failure versus the inverse of the absolute temperature for the materials without prooxidants. The plot clearly shows that there is a risk of drawing wrong conclusions from high temperature accelerated tests in the evaluation of the long-term performance of the antioxidants [13, 90, 91]. Extrapolation from a high temperature accelerated test leads to an over-estimation of the stability of the materials at low temperatures and does not give the same relative efficiencies of the different antioxidants as the test at low temperatures. Woo et. al. [92] claimed that they have found a “master curve”-like behaviour for polypropylene, based on an Arrhenius plot, such that the long-term stability can be estimated from a few data points at high temperatures. Unfortunately, the exact compositions and geometries of their materials were not published. Our results indicate that it is not possible to vertically shift data in an Arrhenius plot and thereby obtain a joint curve to permit a comparison between different antioxidants, since significant differences were found in the shapes of the antioxidant curves.
Time to failure (brittle)
1
10
100
1000
0,005 0,01 0,015 0,02
1/temperature
Deg
rada
tion
time,
day
s
1076-ref
1010-ref
a-toc-ref
Figure 33 Arrhenius plot for the time to failure for polypropylene films containing 0.1% of the antioxidant Irganox 1076, Irganox 1010 or a-tocopherol.
The measurement of total luminescence intensity with CL has been shown to be a useful tool for early degradation detection [93] and it was therefore adopted in this study to search for signs of degradation before failure. The build-up of hydroperoxide showed similar trends at low temperatures with and without the prooxidant, Figure 34 a-b, but the behaviour differed at higher temperatures, figure 34 c-e.
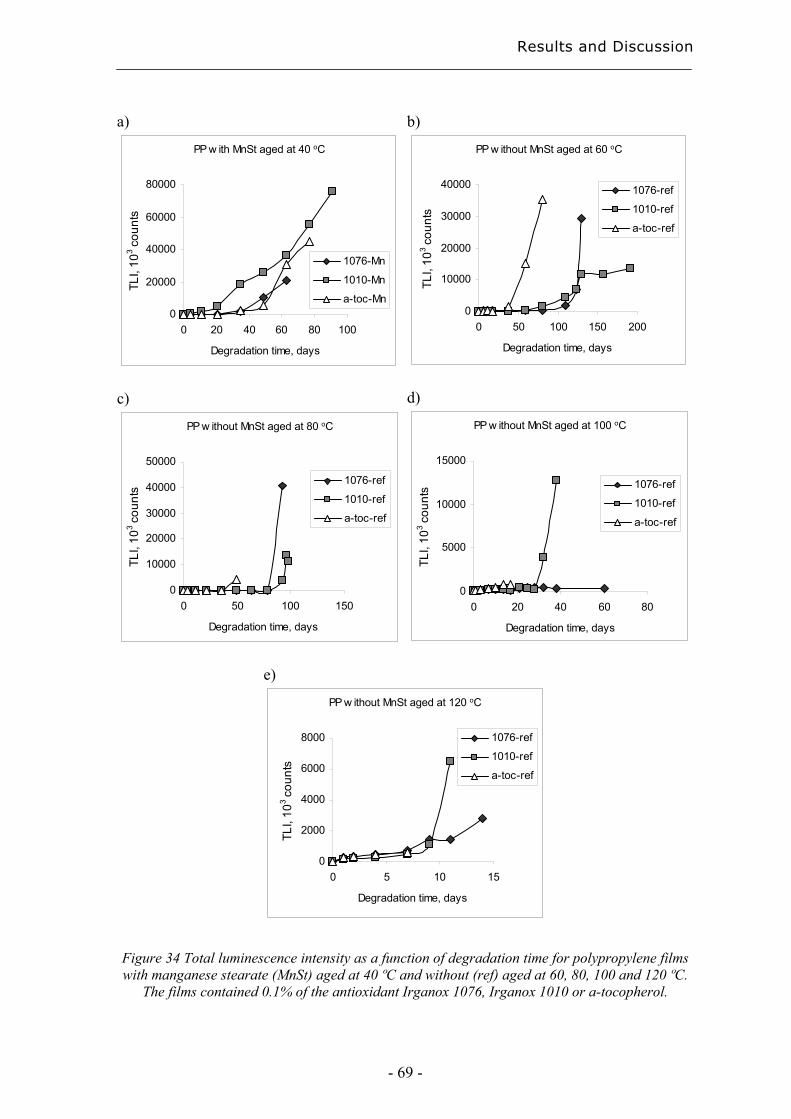
Results and Discussion
- 69 -
a)
PP w ith MnSt aged at 40 oC
0
20000
40000
60000
80000
0 20 40 60 80 100
Degradation time, days
TLI,
103 c
ount
s
1076-Mn
1010-Mn
a-toc-Mn
c)
PP w ithout MnSt aged at 80 oC
0
10000
20000
30000
40000
50000
0 50 100 150
Degradation time, days
TLI,
103 c
ount
s
1076-ref
1010-ref
a-toc-ref
b)
PP w ithout MnSt aged at 60 oC
0
10000
20000
30000
40000
0 50 100 150 200
Degradation time, days
TLI,
103 c
ount
s
1076-ref
1010-ref
a-toc-ref
d)
PP w ithout MnSt aged at 100 oC
0
5000
10000
15000
0 20 40 60 80
Degradation time, days
TLI,
103 c
ount
s 1076-ref
1010-ref
a-toc-ref
e)
PP w ithout MnSt aged at 120 oC
0
2000
4000
6000
8000
0 5 10 15
Degradation time, days
TLI,
103 c
ount
s
1076-ref
1010-ref
a-toc-ref
Figure 34 Total luminescence intensity as a function of degradation time for polypropylene films with manganese stearate (MnSt) aged at 40 ºC and without (ref) aged at 60, 80, 100 and 120 ºC.
The films contained 0.1% of the antioxidant Irganox 1076, Irganox 1010 or a-tocopherol.
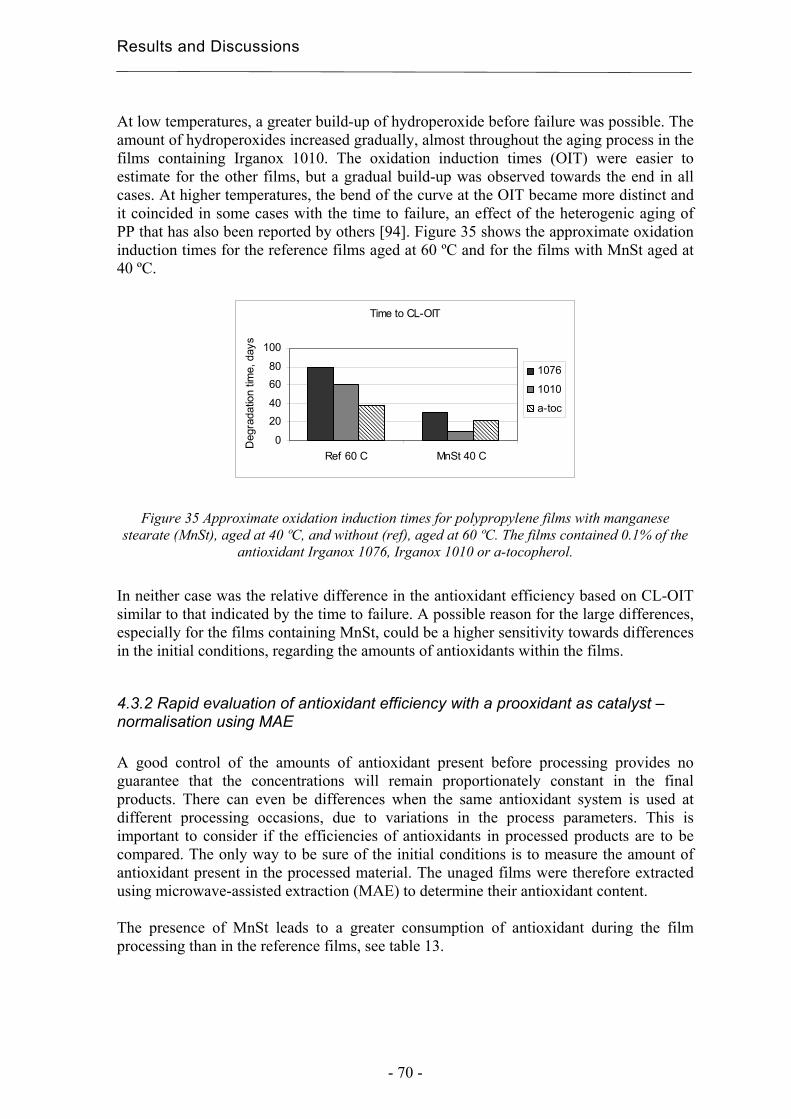
Results and Discussions
- 70 -
At low temperatures, a greater build-up of hydroperoxide before failure was possible. The amount of hydroperoxides increased gradually, almost throughout the aging process in the films containing Irganox 1010. The oxidation induction times (OIT) were easier to estimate for the other films, but a gradual build-up was observed towards the end in all cases. At higher temperatures, the bend of the curve at the OIT became more distinct and it coincided in some cases with the time to failure, an effect of the heterogenic aging of PP that has also been reported by others [94]. Figure 35 shows the approximate oxidation induction times for the reference films aged at 60 ºC and for the films with MnSt aged at 40 ºC.
Time to CL-OIT
0
2040
6080
100
Ref 60 C MnSt 40 C
Deg
rada
tion
time,
day
s
1076
1010
a-toc
Figure 35 Approximate oxidation induction times for polypropylene films with manganese stearate (MnSt), aged at 40 ºC, and without (ref), aged at 60 ºC. The films contained 0.1% of the
antioxidant Irganox 1076, Irganox 1010 or a-tocopherol.
In neither case was the relative difference in the antioxidant efficiency based on CL-OIT similar to that indicated by the time to failure. A possible reason for the large differences, especially for the films containing MnSt, could be a higher sensitivity towards differences in the initial conditions, regarding the amounts of antioxidants within the films.
4.3.2 Rapid evaluation of antioxidant efficiency with a prooxidant as catalyst – normalisation using MAE A good control of the amounts of antioxidant present before processing provides no guarantee that the concentrations will remain proportionately constant in the final products. There can even be differences when the same antioxidant system is used at different processing occasions, due to variations in the process parameters. This is important to consider if the efficiencies of antioxidants in processed products are to be compared. The only way to be sure of the initial conditions is to measure the amount of antioxidant present in the processed material. The unaged films were therefore extracted using microwave-assisted extraction (MAE) to determine their antioxidant content. The presence of MnSt leads to a greater consumption of antioxidant during the film processing than in the reference films, see table 13.
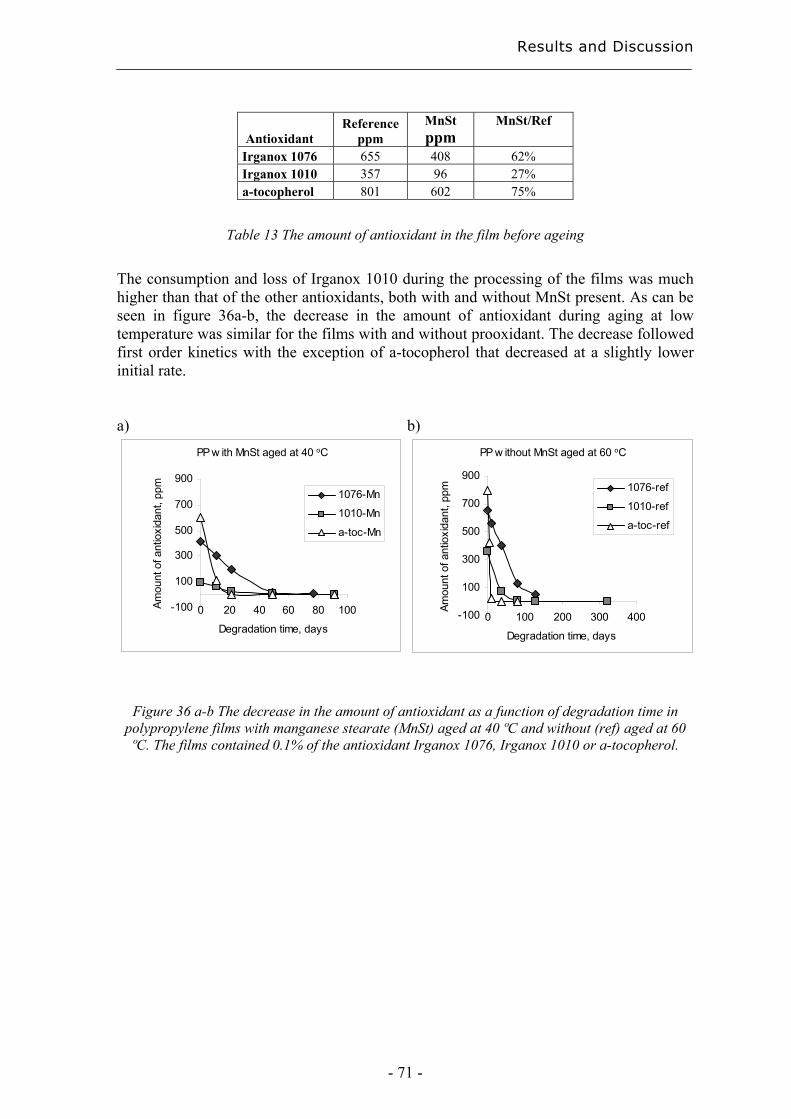
Results and Discussion
- 71 -
Antioxidant Reference
ppm MnSt ppm
MnSt/Ref
Irganox 1076 655 408 62% Irganox 1010 357 96 27% a-tocopherol 801 602 75%
Table 13 The amount of antioxidant in the film before ageing
The consumption and loss of Irganox 1010 during the processing of the films was much higher than that of the other antioxidants, both with and without MnSt present. As can be seen in figure 36a-b, the decrease in the amount of antioxidant during aging at low temperature was similar for the films with and without prooxidant. The decrease followed first order kinetics with the exception of a-tocopherol that decreased at a slightly lower initial rate. a)
PP w ith MnSt aged at 40 oC
-100
100
300
500
700
900
0 20 40 60 80 100
Degradation time, days
Amou
nt o
f ant
ioxi
dant
, ppm
1076-Mn
1010-Mn
a-toc-Mn
b) PP w ithout MnSt aged at 60 oC
-100
100
300
500
700
900
0 100 200 300 400
Degradation time, days
Amou
nt o
f ant
ioxi
dant
, ppm 1076-ref
1010-ref
a-toc-ref
Figure 36 a-b The decrease in the amount of antioxidant as a function of degradation time in
polypropylene films with manganese stearate (MnSt) aged at 40 ºC and without (ref) aged at 60 ºC. The films contained 0.1% of the antioxidant Irganox 1076, Irganox 1010 or a-tocopherol.
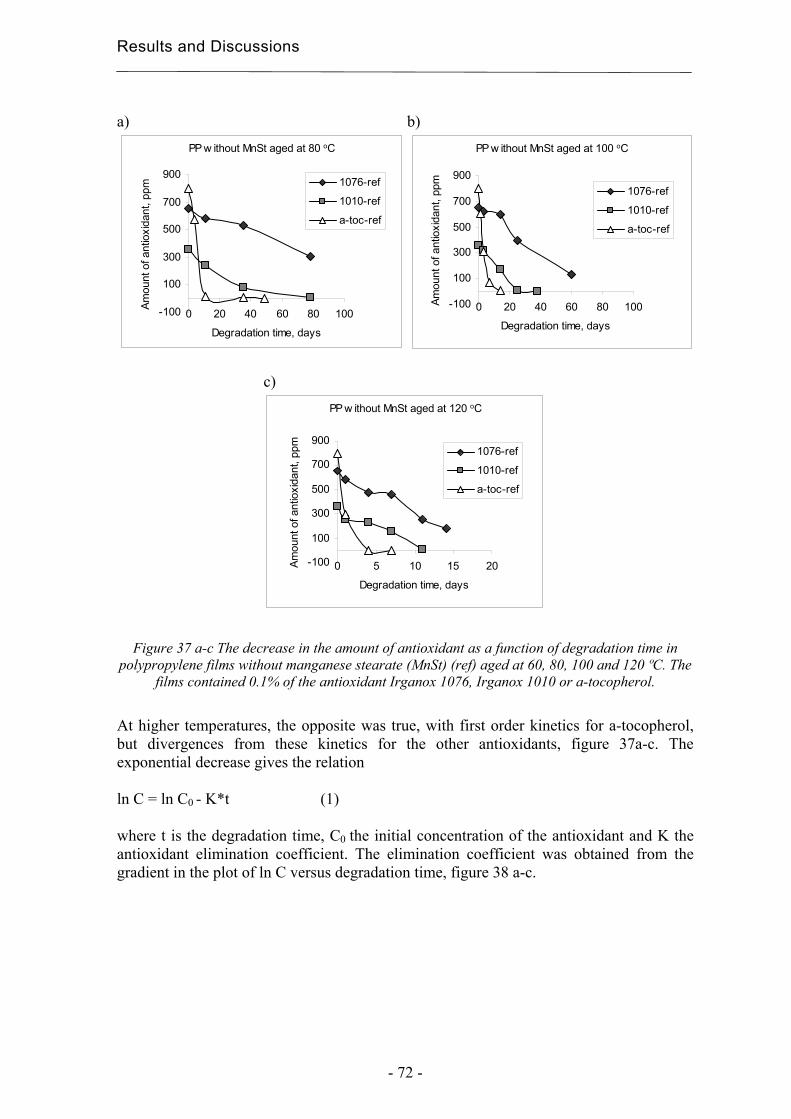
Results and Discussions
- 72 -
a) PP w ithout MnSt aged at 80 oC
-100
100
300
500
700
900
0 20 40 60 80 100
Degradation time, days
Amou
nt o
f ant
ioxi
dant
, ppm
1076-ref
1010-ref
a-toc-ref
b) PP w ithout MnSt aged at 100 oC
-100
100
300
500
700
900
0 20 40 60 80 100
Degradation time, days
Amou
nt o
f ant
ioxi
dant
, ppm 1076-ref
1010-ref
a-toc-ref
c)
PP w ithout MnSt aged at 120 oC
-100
100
300
500
700
900
0 5 10 15 20
Degradation time, days
Amou
nt o
f ant
ioxi
dant
, ppm 1076-ref
1010-ref
a-toc-ref
Figure 37 a-c The decrease in the amount of antioxidant as a function of degradation time in polypropylene films without manganese stearate (MnSt) (ref) aged at 60, 80, 100 and 120 ºC. The
films contained 0.1% of the antioxidant Irganox 1076, Irganox 1010 or a-tocopherol.
At higher temperatures, the opposite was true, with first order kinetics for a-tocopherol, but divergences from these kinetics for the other antioxidants, figure 37a-c. The exponential decrease gives the relation ln C = ln C0 - K*t (1) where t is the degradation time, C0 the initial concentration of the antioxidant and K the antioxidant elimination coefficient. The elimination coefficient was obtained from the gradient in the plot of ln C versus degradation time, figure 38 a-c.
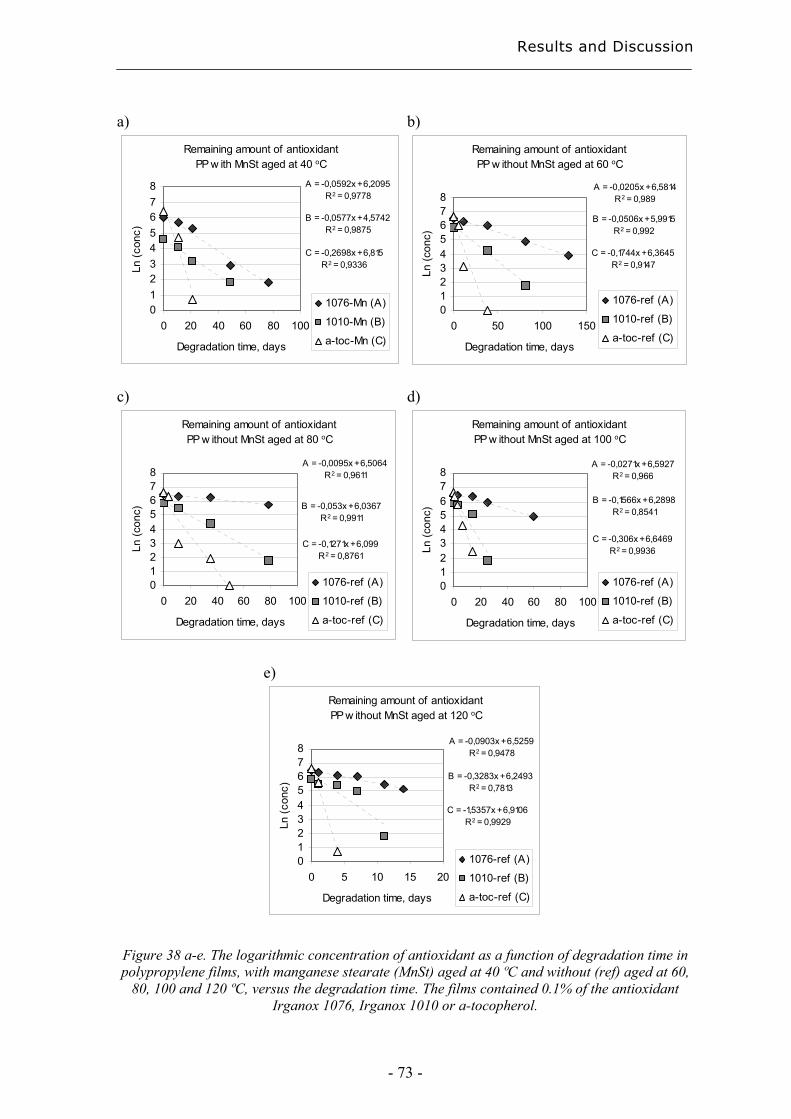
Results and Discussion
- 73 -
a)
Remaining amount of antioxidantPP w ith MnSt aged at 40 oC
C = -0,2698x + 6,815R2 = 0,9336
B = -0,0577x + 4,5742R2 = 0,9875
A = -0,0592x + 6,2095R2 = 0,9778
012345678
0 20 40 60 80 100
Degradation time, days
Ln (c
onc)
1076-Mn (A)
1010-Mn (B)
a-toc-Mn (C)
c)
Remaining amount of antioxidantPP w ithout MnSt aged at 80 oC
C = -0,1271x + 6,099R2 = 0,8761
B = -0,053x + 6,0367R2 = 0,9911
A = -0,0095x + 6,5064R2 = 0,9611
012345678
0 20 40 60 80 100
Degradation time, days
Ln (c
onc)
1076-ref (A)
1010-ref (B)
a-toc-ref (C)
b)
Remaining amount of antioxidantPP w ithout MnSt aged at 60 oC
C = -0,1744x + 6,3645R2 = 0,9147
B = -0,0506x + 5,9915R2 = 0,992
A = -0,0205x + 6,5814R2 = 0,989
012345678
0 50 100 150
Degradation time, days
Ln (c
onc)
1076-ref (A)
1010-ref (B)
a-toc-ref (C)
d)
Remaining amount of antioxidantPP w ithout MnSt aged at 100 oC
C = -0,306x + 6,6469R2 = 0,9936
B = -0,1566x + 6,2898R2 = 0,8541
A = -0,0271x + 6,5927R2 = 0,966
012345678
0 20 40 60 80 100
Degradation time, days
Ln (c
onc)
1076-ref (A)
1010-ref (B)
a-toc-ref (C)
e)
Remaining amount of antioxidantPP w ithout MnSt aged at 120 oC
C = -1,5357x + 6,9106R2 = 0,9929
B = -0,3283x + 6,2493R2 = 0,7813
A = -0,0903x + 6,5259R2 = 0,9478
012345678
0 5 10 15 20
Degradation time, days
Ln (c
onc)
1076-ref (A)
1010-ref (B)
a-toc-ref (C)
Figure 38 a-e. The logarithmic concentration of antioxidant as a function of degradation time in polypropylene films, with manganese stearate (MnSt) aged at 40 ºC and without (ref) aged at 60,
80, 100 and 120 ºC, versus the degradation time. The films contained 0.1% of the antioxidant Irganox 1076, Irganox 1010 or a-tocopherol.
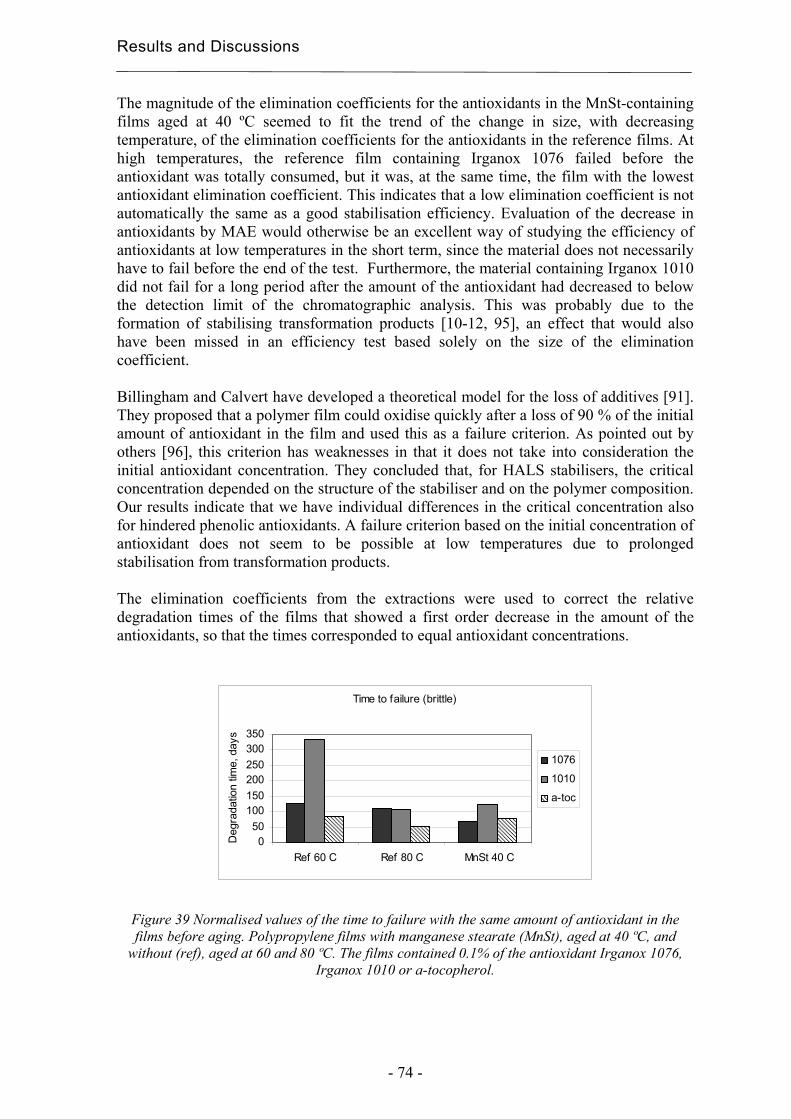
Results and Discussions
- 74 -
The magnitude of the elimination coefficients for the antioxidants in the MnSt-containing films aged at 40 ºC seemed to fit the trend of the change in size, with decreasing temperature, of the elimination coefficients for the antioxidants in the reference films. At high temperatures, the reference film containing Irganox 1076 failed before the antioxidant was totally consumed, but it was, at the same time, the film with the lowest antioxidant elimination coefficient. This indicates that a low elimination coefficient is not automatically the same as a good stabilisation efficiency. Evaluation of the decrease in antioxidants by MAE would otherwise be an excellent way of studying the efficiency of antioxidants at low temperatures in the short term, since the material does not necessarily have to fail before the end of the test. Furthermore, the material containing Irganox 1010 did not fail for a long period after the amount of the antioxidant had decreased to below the detection limit of the chromatographic analysis. This was probably due to the formation of stabilising transformation products [10-12, 95], an effect that would also have been missed in an efficiency test based solely on the size of the elimination coefficient. Billingham and Calvert have developed a theoretical model for the loss of additives [91]. They proposed that a polymer film could oxidise quickly after a loss of 90 % of the initial amount of antioxidant in the film and used this as a failure criterion. As pointed out by others [96], this criterion has weaknesses in that it does not take into consideration the initial antioxidant concentration. They concluded that, for HALS stabilisers, the critical concentration depended on the structure of the stabiliser and on the polymer composition. Our results indicate that we have individual differences in the critical concentration also for hindered phenolic antioxidants. A failure criterion based on the initial concentration of antioxidant does not seem to be possible at low temperatures due to prolonged stabilisation from transformation products. The elimination coefficients from the extractions were used to correct the relative degradation times of the films that showed a first order decrease in the amount of the antioxidants, so that the times corresponded to equal antioxidant concentrations.
Time to failure (brittle)
050
100150200250300350
Ref 60 C Ref 80 C MnSt 40 C
Deg
rada
tion
time,
day
s
1076
1010
a-toc
Figure 39 Normalised values of the time to failure with the same amount of antioxidant in the films before aging. Polypropylene films with manganese stearate (MnSt), aged at 40 ºC, and
without (ref), aged at 60 and 80 ºC. The films contained 0.1% of the antioxidant Irganox 1076, Irganox 1010 or a-tocopherol.
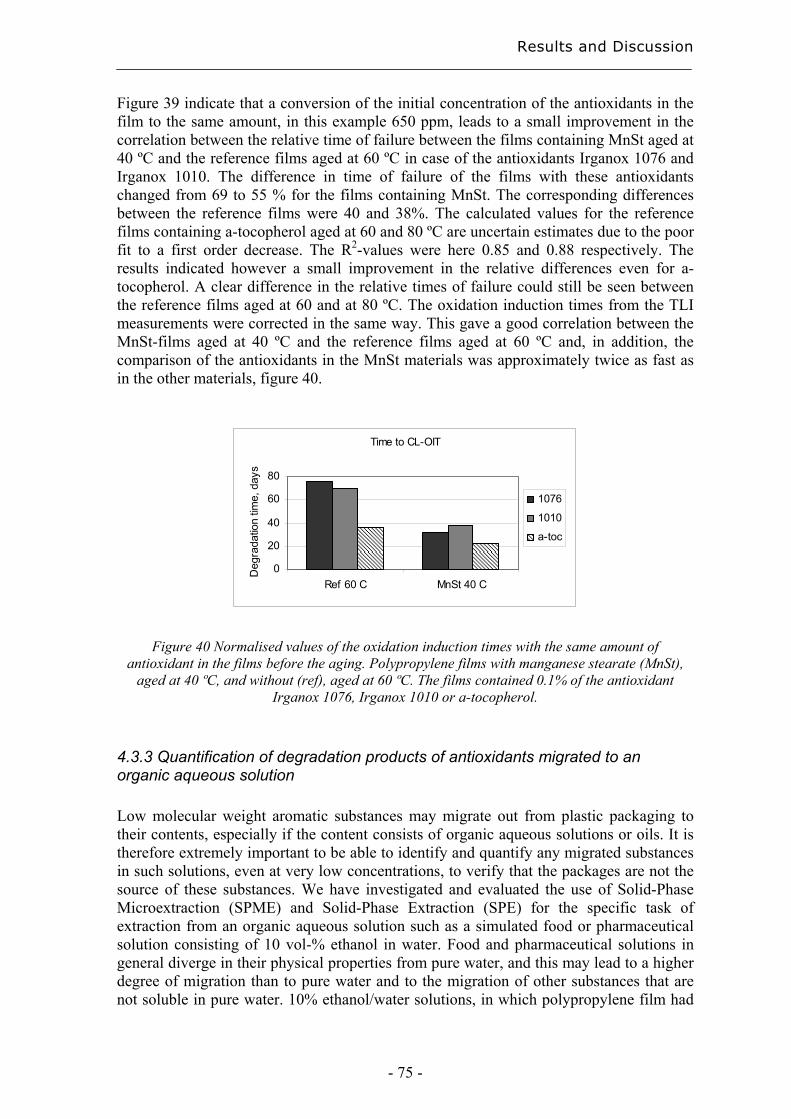
Results and Discussion
- 75 -
Figure 39 indicate that a conversion of the initial concentration of the antioxidants in the film to the same amount, in this example 650 ppm, leads to a small improvement in the correlation between the relative time of failure between the films containing MnSt aged at 40 ºC and the reference films aged at 60 ºC in case of the antioxidants Irganox 1076 and Irganox 1010. The difference in time of failure of the films with these antioxidants changed from 69 to 55 % for the films containing MnSt. The corresponding differences between the reference films were 40 and 38%. The calculated values for the reference films containing a-tocopherol aged at 60 and 80 ºC are uncertain estimates due to the poor fit to a first order decrease. The R2-values were here 0.85 and 0.88 respectively. The results indicated however a small improvement in the relative differences even for a-tocopherol. A clear difference in the relative times of failure could still be seen between the reference films aged at 60 and at 80 ºC. The oxidation induction times from the TLI measurements were corrected in the same way. This gave a good correlation between the MnSt-films aged at 40 ºC and the reference films aged at 60 ºC and, in addition, the comparison of the antioxidants in the MnSt materials was approximately twice as fast as in the other materials, figure 40.
Time to CL-OIT
0
20
40
60
80
Ref 60 C MnSt 40 C
Deg
rada
tion
time,
day
s
1076
1010
a-toc
Figure 40 Normalised values of the oxidation induction times with the same amount of antioxidant in the films before the aging. Polypropylene films with manganese stearate (MnSt),
aged at 40 ºC, and without (ref), aged at 60 ºC. The films contained 0.1% of the antioxidant Irganox 1076, Irganox 1010 or a-tocopherol.
4.3.3 Quantification of degradation products of antioxidants migrated to an organic aqueous solution Low molecular weight aromatic substances may migrate out from plastic packaging to their contents, especially if the content consists of organic aqueous solutions or oils. It is therefore extremely important to be able to identify and quantify any migrated substances in such solutions, even at very low concentrations, to verify that the packages are not the source of these substances. We have investigated and evaluated the use of Solid-Phase Microextraction (SPME) and Solid-Phase Extraction (SPE) for the specific task of extraction from an organic aqueous solution such as a simulated food or pharmaceutical solution consisting of 10 vol-% ethanol in water. Food and pharmaceutical solutions in general diverge in their physical properties from pure water, and this may lead to a higher degree of migration than to pure water and to the migration of other substances that are not soluble in pure water. 10% ethanol/water solutions, in which polypropylene film had
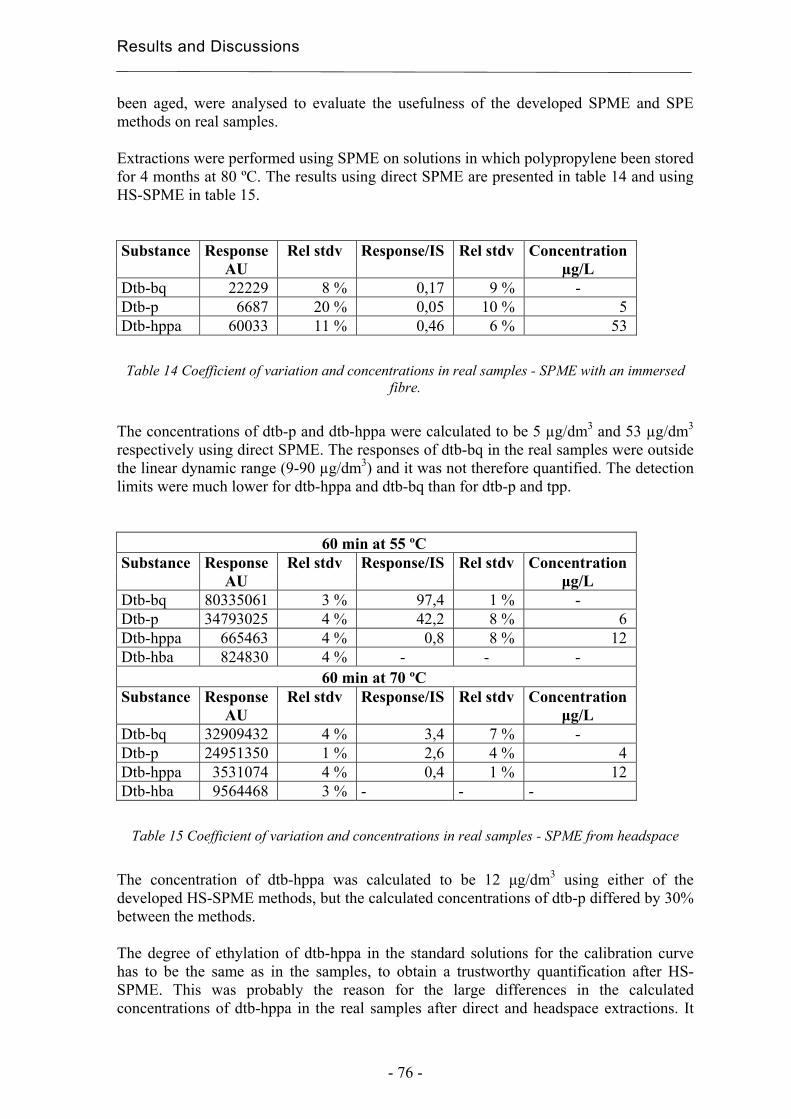
Results and Discussions
- 76 -
been aged, were analysed to evaluate the usefulness of the developed SPME and SPE methods on real samples. Extractions were performed using SPME on solutions in which polypropylene been stored for 4 months at 80 ºC. The results using direct SPME are presented in table 14 and using HS-SPME in table 15. Substance Response Rel stdv Response/IS Rel stdv Concentration AU µg/L Dtb-bq 22229 8 % 0,17 9 % - Dtb-p 6687 20 % 0,05 10 % 5 Dtb-hppa 60033 11 % 0,46 6 % 53
Table 14 Coefficient of variation and concentrations in real samples - SPME with an immersed
fibre.
The concentrations of dtb-p and dtb-hppa were calculated to be 5 µg/dm3 and 53 µg/dm3 respectively using direct SPME. The responses of dtb-bq in the real samples were outside the linear dynamic range (9-90 µg/dm3) and it was not therefore quantified. The detection limits were much lower for dtb-hppa and dtb-bq than for dtb-p and tpp.
60 min at 55 ºC Substance Response Rel stdv Response/IS Rel stdv Concentration
AU µg/L Dtb-bq 80335061 3 % 97,4 1 % - Dtb-p 34793025 4 % 42,2 8 % 6 Dtb-hppa 665463 4 % 0,8 8 % 12 Dtb-hba 824830 4 % - - -
60 min at 70 ºC Substance Response Rel stdv Response/IS Rel stdv Concentration
AU µg/L Dtb-bq 32909432 4 % 3,4 7 % - Dtb-p 24951350 1 % 2,6 4 % 4 Dtb-hppa 3531074 4 % 0,4 1 % 12 Dtb-hba 9564468 3 % - - -
Table 15 Coefficient of variation and concentrations in real samples - SPME from headspace
The concentration of dtb-hppa was calculated to be 12 µg/dm3 using either of the developed HS-SPME methods, but the calculated concentrations of dtb-p differed by 30% between the methods. The degree of ethylation of dtb-hppa in the standard solutions for the calibration curve has to be the same as in the samples, to obtain a trustworthy quantification after HS-SPME. This was probably the reason for the large differences in the calculated concentrations of dtb-hppa in the real samples after direct and headspace extractions. It
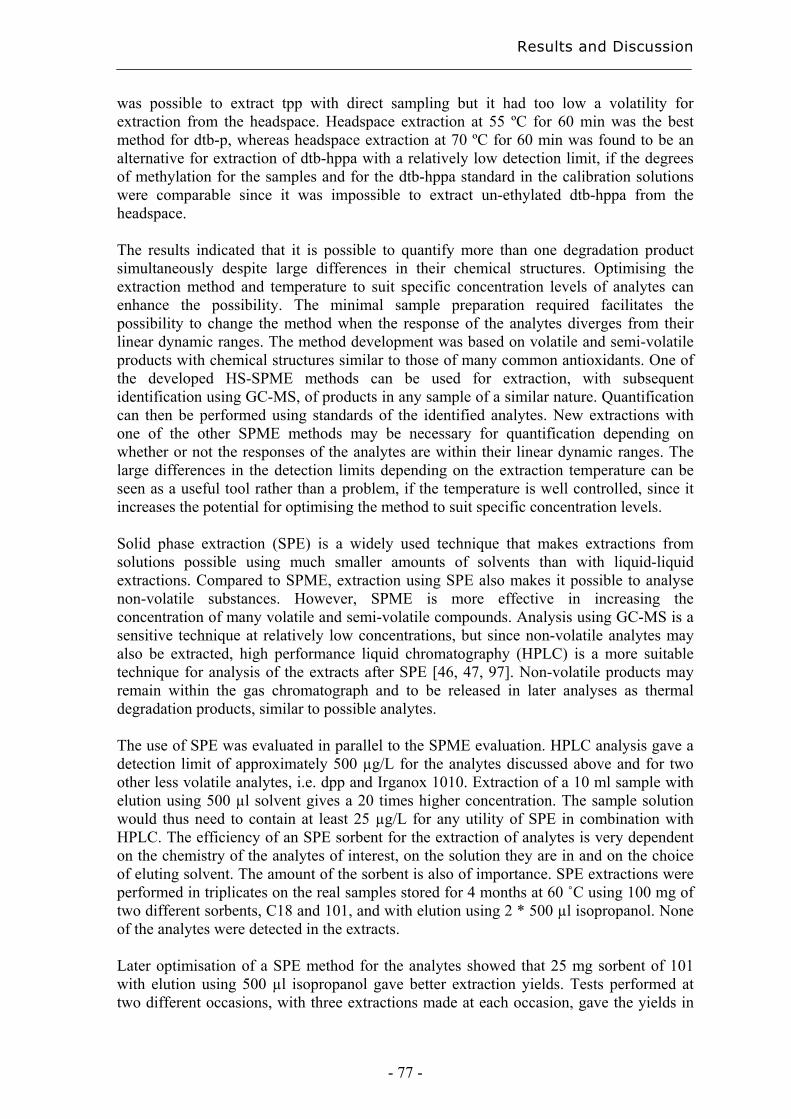
Results and Discussion
- 77 -
was possible to extract tpp with direct sampling but it had too low a volatility for extraction from the headspace. Headspace extraction at 55 ºC for 60 min was the best method for dtb-p, whereas headspace extraction at 70 ºC for 60 min was found to be an alternative for extraction of dtb-hppa with a relatively low detection limit, if the degrees of methylation for the samples and for the dtb-hppa standard in the calibration solutions were comparable since it was impossible to extract un-ethylated dtb-hppa from the headspace. The results indicated that it is possible to quantify more than one degradation product simultaneously despite large differences in their chemical structures. Optimising the extraction method and temperature to suit specific concentration levels of analytes can enhance the possibility. The minimal sample preparation required facilitates the possibility to change the method when the response of the analytes diverges from their linear dynamic ranges. The method development was based on volatile and semi-volatile products with chemical structures similar to those of many common antioxidants. One of the developed HS-SPME methods can be used for extraction, with subsequent identification using GC-MS, of products in any sample of a similar nature. Quantification can then be performed using standards of the identified analytes. New extractions with one of the other SPME methods may be necessary for quantification depending on whether or not the responses of the analytes are within their linear dynamic ranges. The large differences in the detection limits depending on the extraction temperature can be seen as a useful tool rather than a problem, if the temperature is well controlled, since it increases the potential for optimising the method to suit specific concentration levels. Solid phase extraction (SPE) is a widely used technique that makes extractions from solutions possible using much smaller amounts of solvents than with liquid-liquid extractions. Compared to SPME, extraction using SPE also makes it possible to analyse non-volatile substances. However, SPME is more effective in increasing the concentration of many volatile and semi-volatile compounds. Analysis using GC-MS is a sensitive technique at relatively low concentrations, but since non-volatile analytes may also be extracted, high performance liquid chromatography (HPLC) is a more suitable technique for analysis of the extracts after SPE [46, 47, 97]. Non-volatile products may remain within the gas chromatograph and to be released in later analyses as thermal degradation products, similar to possible analytes. The use of SPE was evaluated in parallel to the SPME evaluation. HPLC analysis gave a detection limit of approximately 500 µg/L for the analytes discussed above and for two other less volatile analytes, i.e. dpp and Irganox 1010. Extraction of a 10 ml sample with elution using 500 µl solvent gives a 20 times higher concentration. The sample solution would thus need to contain at least 25 µg/L for any utility of SPE in combination with HPLC. The efficiency of an SPE sorbent for the extraction of analytes is very dependent on the chemistry of the analytes of interest, on the solution they are in and on the choice of eluting solvent. The amount of the sorbent is also of importance. SPE extractions were performed in triplicates on the real samples stored for 4 months at 60 ˚C using 100 mg of two different sorbents, C18 and 101, and with elution using 2 * 500 µl isopropanol. None of the analytes were detected in the extracts. Later optimisation of a SPE method for the analytes showed that 25 mg sorbent of 101 with elution using 500 µl isopropanol gave better extraction yields. Tests performed at two different occasions, with three extractions made at each occasion, gave the yields in
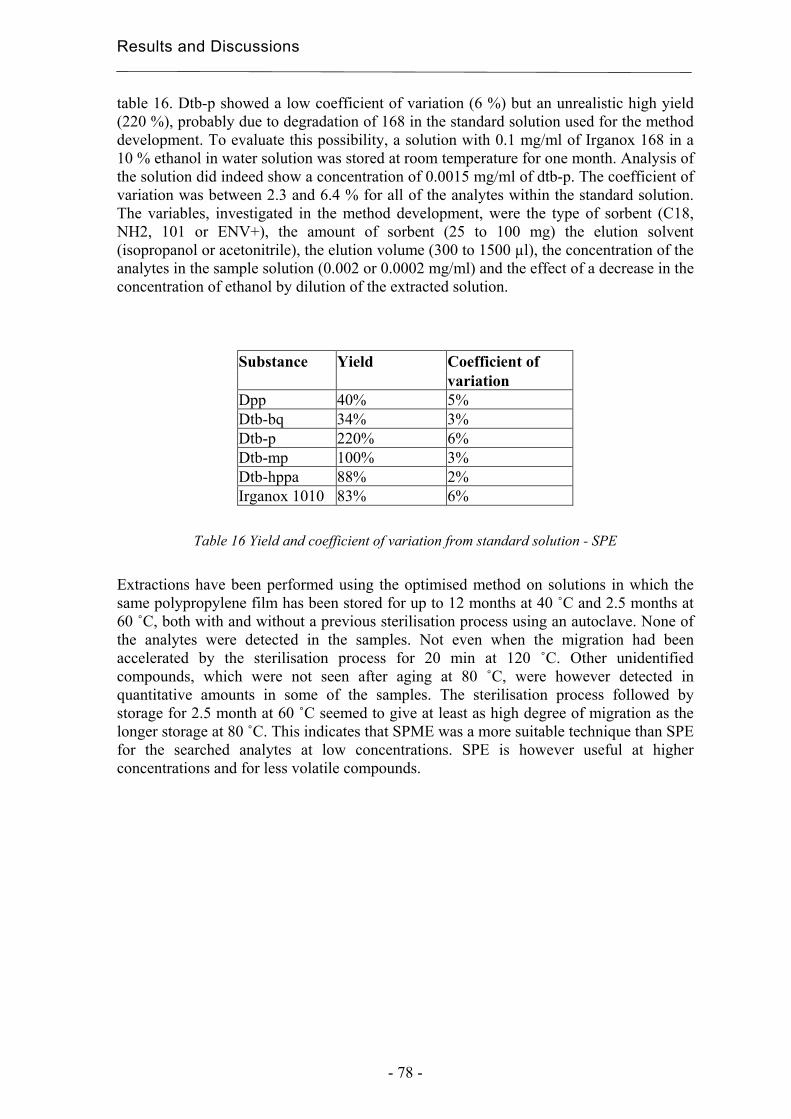
Results and Discussions
- 78 -
table 16. Dtb-p showed a low coefficient of variation (6 %) but an unrealistic high yield (220 %), probably due to degradation of 168 in the standard solution used for the method development. To evaluate this possibility, a solution with 0.1 mg/ml of Irganox 168 in a 10 % ethanol in water solution was stored at room temperature for one month. Analysis of the solution did indeed show a concentration of 0.0015 mg/ml of dtb-p. The coefficient of variation was between 2.3 and 6.4 % for all of the analytes within the standard solution. The variables, investigated in the method development, were the type of sorbent (C18, NH2, 101 or ENV+), the amount of sorbent (25 to 100 mg) the elution solvent (isopropanol or acetonitrile), the elution volume (300 to 1500 µl), the concentration of the analytes in the sample solution (0.002 or 0.0002 mg/ml) and the effect of a decrease in the concentration of ethanol by dilution of the extracted solution.
Substance Yield Coefficient of variation Dpp 40% 5% Dtb-bq 34% 3% Dtb-p 220% 6% Dtb-mp 100% 3% Dtb-hppa 88% 2% Irganox 1010 83% 6%
Table 16 Yield and coefficient of variation from standard solution - SPE
Extractions have been performed using the optimised method on solutions in which the same polypropylene film has been stored for up to 12 months at 40 ˚C and 2.5 months at 60 ˚C, both with and without a previous sterilisation process using an autoclave. None of the analytes were detected in the samples. Not even when the migration had been accelerated by the sterilisation process for 20 min at 120 ˚C. Other unidentified compounds, which were not seen after aging at 80 ˚C, were however detected in quantitative amounts in some of the samples. The sterilisation process followed by storage for 2.5 month at 60 ˚C seemed to give at least as high degree of migration as the longer storage at 80 ˚C. This indicates that SPME was a more suitable technique than SPE for the searched analytes at low concentrations. SPE is however useful at higher concentrations and for less volatile compounds.
Conclusions
- 79 -
5. Conclusions Extraction methods were developed for a broad area of applications within the field of evaluations of polymers long-term properties and environmental interactions. An efficient extraction for comparison of chromatographic fingerprints of degradation products from polyethylene, with a focus on carboxylic acids, was achieved by changing the solvent to n-hexane after extraction and methylation with acidified methanol. This gave rise both to better chromatograms and to the detection of a larger number of carboxylic acids than a direct analysis of the acidified methanol. The simultaneous evaporation of low molecular weight acids during the change of solvent was (could be) compensated for by calculation of the individual degrees of evaporation of the acids. For extraction of antioxidants from polymer matrixes, a microwave-assisted extraction method was developed with a focus on both efficiency and health aspects, by avoiding chlorinated solvents and the carcinogenic solvent n-hexane. Extraction using isopropanol with only 10 ml solvent for 0.3 g polypropylene film gave an efficient and rapid extraction with the possibility of direct analysis of the extract using reverse phase high performance liquid chromatography. The use of solid phase micro-extraction (SPME) and solid phase extraction (SPE) was evaluated for the specific task of identification and quantification of antioxidants and degradation products of antioxidants that have migrated to an organic aqueous solution. The chosen solution was a simulated pharmaceutical solution consisting of 10 % ethanol in water. It was shown that by using SPME it is possible not only to detect but also to quantify very low concentrations of low molecular weight products of antioxidants. It was furthermore shown that the simultaneous quantification of more than one component is possible, if the choice of extraction method and temperature is adapted to suit the concentration levels of the analytes and the differences in their chemical structures. SPE can, except for the detection and quantification of volatile and semi-volatile products, also be used for non-volatile products and the original antioxidants. SPE is therefore useful as a complimentary method to SPME in spite of its much lower sensitivity. Among all the degradation products, we have shown that the carboxylic acids are excellent for the classification both of the type of prooxidant system in the degradable polyethylene films and of the relative state of degradation. The degradation state is predictable from the diacid fingerprints, provided that the polyethylene materials contain the same type of prooxidant system. The monoacids were useful for product control and classification of materials from their initial compositions of stearates. TLI measurements gave an earlier detection of degradation and were more sensitive to relative differences in degradation between the materials than carbonyl index and crystallinity measurements. Besides the degradation rate, it was also possible to follow changes in the activation energy, a tool that may increase the understanding of the degradation process and improve the possibility of classifying materials with regard to their long-term properties. The sample with polyoctylene seemed to lose the catalytic activity of the prooxidant, while the activity appeared to increase in the other prooxidant-containing samples. This change in the required energy was related to the initial degradation of the polyoctylene. It was noted as a complete disappearance of the double
Conclusions
- 80 -
bonds with the development of volatile low molecular weight diacids and the possible formation of networks. The results from the antioxidant efficiency evaluation show clearly that it is possible to use a prooxidant for the rapid prediction of the long-term performance of an antioxidant at a low temperature. Microwave assisted extraction (MAE) is a useful tool for evaluation of the initial properties of the materials before aging and for the rate of consumption of the antioxidants. The decrease in rate coefficients of the antioxidants were useful in normalizing the amounts of the antioxidants in the initial films and thus in estimating and comparing degradation times. Oxidation induction times from total luminescence intensity (TLI) measurements, on films containing MnSt, in combination with a normalization of the degradation times based on MAE evaluations, gave the fastest comparison of the antioxidants efficiency at low temperature. It was possible to identify and quantify a broader range of substances with direct SPME than with HS-SPME. Both ethylated and unethylated phenolic acids were detected with direct SPME, which made reliable quantification easier, whereas only the ethylated acids were detected in the headspace extraction. 2,4-ditertbutyl-phenol in the real sample could be quantified with both methods but preferably at a relatively low temperature. The detection levels of the quinone and 2,4-ditertbutyl-phenol were much lower after headspace extraction than with direct extraction. The quinone was detectable with both methods, but with very large differences in sensitivity. The amount in the real samples was too low for quantification with direct SPME and too high for headspace extraction without decreasing the amount of the sample or the extraction temperature, which also would affect the extraction efficiency of the other analytes.

Acknowledgements
- 81 -
6. Acknowledgements I first of all would like to thank my supervisor professor Ann-Christine Albertsson for making this possible. Thanks for accepting me as your student, sharing your valuable scientific knowledge and for all encouragement and support. I will always be indebted to you for all that you have done for me. AstraZeneca AB, the Swedish Research Council for Engineering Science (TFR) 281-98-664 and the Swedish Research Council (VR) 621-2001-2321 are to be thanked for financial support. At AstraZeneca, I specially would like to thank Astrid Arbin for valuable scientific discussions and for her very much appreciated support, but also all other persons that I have been in contact with both during my time as graduate student and as diploma worker. Marie, I still miss the time working with you and the group. Jozef Rychly is greatly acknowledged for scientific discussions. Gerth Jonsson at Tenova is very much thanked for his help with processing of films and for all nice Christmas greetings. The professors and senior scientists at the department are thanked for there valuable contribution in building the high scientific level at the department. Great thanks Ove, Maggan, Maria Q, Maria A, Viktoria, Emma, Barbara and Abha for helping me with all kinds of matter and for nice lunch breaks and chats. All former and present students at the department during these years, are thanked for being wonderful colleges and a joy to work with. A special thank to the students, former students and seniors in the “ACA group” and particularly my nice former and present room mates Farideh, Clara and Martina, the remaining persons in the “characterisation group” Minna and Annika, and the former diploma workers Anna, Anders, Hamid and Pilar. Also a special thank to Marie L and Natalia for always being so kind to everyone. I am grateful to all my friends outside KTH. Thanks Steffi and Åse for, among other things, taking me to strange culture events and David for your help with “spiteful figures”. Anna * 3, Hanan and Kribu, I really appreciate the student years with you. An enormous thank to my two big wonderful families, especially Maud, Gert, Niclas, Tiina, Gunnel, Dan, Sven and the love of my life Per. You mean everything for me. Älskade farmor, tack för allt stöd och alla uppmuntrande ord du gav. Du kommer alltid att finnas kvar i mitt hjärta.

- 82 -
References
- 83 -
7. References 1. Albertsson, A.C. and Banhidi, Z.G., Journal of Applied Polymer Science, 1980. 25(8):
p. 1655. 2. Karlsson, S.B., E.;Banhidi, Z.G.; Albertsson, A. C.;, Accumulation of Malodorous
Amines and Polyamines Due to Clostridial Putrefaction, in Indoor Air 3: Sensoring and Hyperactivity Reactions to Sick Buildings, Berglund, B.L., T.; Sundell, J., Editor. 1984, Liber Tryck AB: Stockholm. p. 287.
3. Allen, N.S., Polymer Stucture and Stability, in Fundamentals of polymer degradation and stabilisation / Norman S. Allen and Michele Edge, Allen, N.S., Editor. 1992, Elsevier Applied Science: London. p. 1.
4. Albertsson, A.C., Journal of Applied Polymer Science, 1978. 22: p. 3419 5. Scott, G., Atmos. Oxid. Antioxid., 1993: p. 83. 6. Rutkowska, M., Krasowska, K., Heimowska, A., and Kowalczuk, M., Macromolecular
Symposia, 2003. 197(7th World Conference on Biodegradable Polymers & Plastics, 2002): p. 421.
7. Griffin, G.J.L., 1977. 8. Scott, G., US Patent 4,121,025. 1978. 9. Griffin, G.J.L., Brittish patent PCT/GB88/00386. 1988. 10. Pospisil, J., Polymer Degradation and Stability, 1993. 39(1): p. 103. 11. Pospisil, J., Polymer Degradation and Stability, 1993. 40(2): p. 217. 12. Al-Malaika, S., Goodwin, C., Issenhuth, S., and Burdick, D., Polymer Degradation
and Stability, 1999. 64(1): p. 145. 13. Nagy, K., Epacher, E., Staniek, P., and Pukanszky, B., Polymer Degradation and
Stability, 2003. 82(2): p. 211. 14. Albertsson, A.C., Barenstedt, C., and Karlsson, S., Polymer Degradation and Stability,
1992. 37(2): p. 163. 15. Hakkarainen, M., Albertsson, A.-C., and Karlsson, S., Journal of Chromatography, A,
1996. 741(2): p. 251. 16. Khabbaz, F. and Albertsson, A.C., Biomacromolecules, 2000. 1: p. 665. 17. Albertsson, A.C., Andersson, S.O., and Karlsson, S., Polymer Degradation and
Stability, 1987. 18(1): p. 73. 18. Albertsson, A.C., Barenstedt, C., and Karlsson, S., Journal of Applied Polymer
Science, 1994. 51(6): p. 1097. 19. Karlsson, S., Hakkarainen, M., and Albertsson, A.-C., Macromolecules, 1997. 30(25):
p. 7721. 20. Groning, M. and Hakkarainen, M., Journal of Chromatography, A, 2001. 932(1-2): p.
1. 21. Hakkarainen, M., Groning, M., and Albertsson, A.-C., Journal of Applied Polymer
Science, 2003. 89(3): p. 867. 22. Groening, M. and Hakkarainen, M., Journal of Chromatography, A, 2004. 1052(1-2):
p. 61. 23. Eskilsson, C.S. and Bjorklund, E., Journal of Chromatography A, 2000. 902(1): p.
227. 24. Molander, P., Haugland, K., Hegna, D.R., Ommundsen, E., Lundanes, E., and
Greibrokk, T., Journal of Chromatography A, 1999. 864(1): p. 103. 25. Nielson, R.C., Journal of Liquid Chromatography, 1991. 14(3): p. 503. 26. Freitag, W. and John, O., Angewandte Makromolekulare Chemie, 1990. 175: p. 181. 27. Marcato, B. and Vianello, M., Journal of Chromatography A, 2000. 869(1-2): p. 285.
References
- 84 -
28. Camacho, W. and Karlsson, S., Polymer Degradation and Stability, 2000. 71(1): p. 123.
29. Vandenburg, H.J., Clifford, A.A., Bartle, K.D., Carroll, J., and Newton, I.D., Analyst (Cambridge, United Kingdom), 1999. 124(3): p. 397.
30. Contat-Rodrigo, L., Haider, N., Ribes-Greus, A., and Karlsson, S., Journal of Applied Polymer Science, 2001. 79(6): p. 1101.
31. Poole, C.F., TrAC, Trends in Analytical Chemistry, 2003. 22(6): p. 362. 32. Ensing, K., Berggren, C., and Majors, R.E., LC-GC Europe, 2002. 15(1): p. 16. 33. Camel, V., Spectrochimica Acta, Part B: Atomic Spectroscopy, 2003. 58B(7): p. 1177. 34. Poole, C.F., Gunatilleka, A.D., and Sethuraman, R., Journal of Chromatography, A,
2000. 885(1+2): p. 17. 35. Arthur, C.L. and Pawliszyn, J., Analytical Chemistry, 1990. 62(19): p. 2145. 36. Baciocchi, R., Attina, M., Lombardi, G., and Boni, M.R., Journal of Chromatography,
A, 2001. 911(1): p. 135. 37. Zhang, Z.Y. and Pawliszyn, J., Analytical Chemistry, 1993. 65(14): p. 1843. 38. Gorecki, T., Yu, X., and Pawliszyn, J., Analyst (Cambridge, United Kingdom), 1999.
124(5): p. 643. 39. Arthur, C.L., Killam, L.M., Buchholz, K.D., Pawliszyn, J., and Berg, J.R., Analytical
Chemistry, 1992. 64(17): p. 1960. 40. Lacoste, J. and Carlsson, D.J., Journal of Polymer Science Part a-Polymer Chemistry,
1992. 30(3): p. 493. 41. Montaudo, G., Montaudo, M.S., and Samperi, F., Mass Spectrometry of Polymers,
2002: p. 419. 42. Puglisi, C., Samperi, F., Alicata, R., and Montaudo, G., Macromolecules, 2002. 35(8):
p. 3000. 43. Adamus, G., Sikorska, W., Kowalczuk, M., Noda, I., and Satkowski, M.M., Rapid
Communications in Mass Spectrometry, 2003. 17(20): p. 2260. 44. Prokai, L., Mass Spectrometry of Polymers, 2002: p. 149. 45. Hakkarainen, M., Albertsson, A.C., and Karlsson, S., Journal of Applied Polymer
Science, 1997. 66(5): p. 959. 46. Vimalasiri, P.A.D.T., Haken, J.K., and Burford, R.P., Journal of Chromatography,
1984. 300(3): p. 303. 47. El Mansouri, H., Yagoubi, N., and Ferrier, D., Chromatographia, 1998. 48(7/8): p.
491. 48. Ashby, G.E., Journal of Polymer Science, 1961. 50: p. 99. 49. Schard, M.P. and Russell, C.A., Journal of Applied Polymer Science, 1964. 8: p. 985. 50. Russell, G.A., Journal of the American Chemical Society, 1957. 79: p. 3871. 51. Reich, L. and Stivala, S.S., Die Makromolekulare Chemie, 1967. 103: p. 74. 52. Billingham, N.C., Then, E.T.H., and Gijsman, P.J., Polymer Degradation and
Stability, 1991. 34(1-3): p. 263. 53. Ahlblad, G., Reitberger, T., Terselius, B., and Stenberg, B., Polymer Degradation and
Stability, 1999. 65(2): p. 179. 54. Wold, S., Pattern Recognition, 1976. 8(3): p. 127. 55. Bro, R., Analytica Chimica Acta, 2003. 500(1-2): p. 185. 56. Bro, R., Håndbog i multivariabel kalibrering. 1996, Copenhagen: Jordbrugsforlaget. 57. Manne, R., Chemometrics and Intelligent Laboratory Systems, 1987. 2(1-3): p. 187. 58. Bro, R. and Smilde, A.K., Journal of Chemometrics, 2003. 17(1): p. 16. 59. Wunderlich, B., Crystal Structure, Morphology, Defects. Macromolecular Physics.
Vol. 1. 1973, New York: Academic Press. chapter 8.
References
- 85 -
60. Hoff, A. and Jacobsson, S., Journal of Applied Polymer Science, 1981. 26(10): p. 3409.
61. Albertsson, A.C., Barenstedt, C., and Karlsson, S., Acta Polymerica, 1994. 45(2): p. 97.
62. Nielson, R.C., Journal of Liquid Chromatography, 1993. 16(7): p. 1625. 63. Foldes, E., Angewandte Makromolekulare Chemie, 1998. 261-262: p. 65. 64. Castells, P., Santos, F.J., and Galceran, M.T., Journal of Chromatography, A, 2003.
984(1): p. 1. 65. Buchholz, K.D. and Pawliszyn, J., Analytical Chemistry, 1994. 66(1): p. 160. 66. Yang, J. and Cheng, M.-L., Analyst (Cambridge, United Kingdom), 2001. 126(6): p.
881. 67. Catalina, F., Peinado, C., Allen, N.S., and Corrales, T., Journal of Polymer Science,
Part A: Polymer Chemistry, 2002. 40(19): p. 3312. 68. Yu, J.G., Li, H.S., Zhang, M.Q., and Zhang, M.L., Journal of Applied Polymer
Science, 2000. 75(4): p. 523. 69. Gugumus, F., Polymer Degradation and Stability, 1995. 49(1): p. 29. 70. Albertsson, A.C. and Karlsson, S., Journal of Applied Polymer Science, 1988. 35(5):
p. 1289. 71. Gijsman, P. and Verdun, F., Polymer Degradation and Stability, 2001. 74(3): p. 533. 72. Gijsman, P., Hennekens, J., and Vincent, J., Polymer Degradation and Stability, 1993.
42(1): p. 95. 73. Broska, R., Rychly, J., and Csomorova, K., Polymer Degradation and Stability, 1999.
63(2): p. 231. 74. Rychlý, J., Strlic, M., Matisová-Rychlá, L., and Kolar, J., Polymer Degradation and
Stability, 2002. 78: p. 357. 75. Carlsson, D.J. and Wiles, D.M., Macromolecules, 1969. 2(6): p. 587. 76. Adams, J.H., Journal of Polymer Science, Polymer Chemistry Edition, 1970. 8(5): p.
1077. 77. Lemaire, J., Gardette, J.-L., Lacoste, J., Delprat, P., and Vaillant, D., Advances in
Chemistry Series, 1996. 249(Polymer Durability): p. 577. 78. Arnaud, R., Moisan, J.Y., and Lemaire, J., Macromolecules, 1984. 17(3): p. 332. 79. Setnescu, R., Jipa, S., and Osawa, Z., Polymer Degradation and Stability, 1998. 60(2-
3): p. 377. 80. Chakraborty, K.B. and Scott, G., European Polymer Journal, 1977. 13(9): p. 731. 81. Stivala, S.S., Kimura, J., and Gabbay, S.M., Degrad. Stab. Polyolefins, 1983: p. 63. 82. Gugumus, F., Polymer Degradation and Stability, 1996. 52(2): p. 131. 83. Gugumus, F., Polymer Degradation and Stability, 2002. 77(1): p. 147. 84. Hock, H. and Kropf, H., Angew. Chem., 1957. 69: p. 313. 85. Plesnicar, B., Chem. Peroxides, 1983: p. 521. 86. Broska, R. and Rychly, J., Polymer Degradation and Stability, 2001. 72(2): p. 271. 87. Al-Malaika, S., Chohan, S., Coker, M., Scott, G., Arnaud, R., Dabin, P., Fauve, A.,
and Lemaire, J., Journal of Macromolecular Science-Pure and Applied Chemistry, 1995. A32(4): p. 709.
88. Gugumus, F., Polymer Degradation and Stability, 2001. 74(2): p. 327. 89. Scott, G., Atmos. Oxid. Antioxid., 1993: p. 141. 90. Chan, M.G., Gilroy, H.M., Heyward, I.P., Johnson, L., and Martin, W.M., Technical
Papers - Society of Plastics Engineers, 1978. 24: p. 381. 91. Billingham, N.C. and Calvert, P.D., Developments in Polymer Stabilisation, 1980. 3:
p. 139.
References
- 86 -
92. Woo, L., Khare, A.R., Sandford, C.L., Ling, M.T.K., and Ding, S.Y., Journal of Thermal Analysis and Calorimetry, 2001. 64(2): p. 539.
93. Ragnarsson, L. and Albertsson, A.-C., Biomacromolecules, 2003. 4(4): p. 900. 94. Fayolle, B., Audouin, L., and Verdu, J., Polymer Degradation and Stability, 2000.
70(3): p. 333. 95. Al-Malaika, S. and Issenhuth, S., Polymer Degradation and Stability, 1999. 65(1): p.
143. 96. Malik, J., Tuan, D.Q., and Spirk, E., Polymer Degradation and Stability, 1995. 47(1):
p. 1. 97. Karovicova, J. and Simko, P., Journal of Chromatography, A, 2000. 882(1+2): p. 271.