Chromatographic Analysis of Drug-Protein Interactions ...
414
University of Nebraska - Lincoln DigitalCommons@University of Nebraska - Lincoln Student Research Projects, Dissertations, and eses - Chemistry Department Chemistry, Department of 5-2015 Chromatographic Analysis of Drug-Protein Interactions During Diabetes and Characterization of Human Serum Albumin rough Multidimensional Mass Spectrometry Ryan E. Matsuda University of Nebraska-Lincoln, [email protected] Follow this and additional works at: hp://digitalcommons.unl.edu/chemistrydiss Part of the Analytical Chemistry Commons is Article is brought to you for free and open access by the Chemistry, Department of at DigitalCommons@University of Nebraska - Lincoln. It has been accepted for inclusion in Student Research Projects, Dissertations, and eses - Chemistry Department by an authorized administrator of DigitalCommons@University of Nebraska - Lincoln. Matsuda, Ryan E., "Chromatographic Analysis of Drug-Protein Interactions During Diabetes and Characterization of Human Serum Albumin rough Multidimensional Mass Spectrometry" (2015). Student Research Projects, Dissertations, and eses - Chemistry Department. 53. hp://digitalcommons.unl.edu/chemistrydiss/53
Transcript of Chromatographic Analysis of Drug-Protein Interactions ...
University of Nebraska - LincolnDigitalCommons@University of Nebraska - LincolnStudent Research Projects, Dissertations, andTheses - Chemistry Department Chemistry, Department of
5-2015
Chromatographic Analysis of Drug-ProteinInteractions During Diabetes and Characterizationof Human Serum Albumin ThroughMultidimensional Mass SpectrometryRyan E. MatsudaUniversity of Nebraska-Lincoln, [email protected]
Follow this and additional works at: http://digitalcommons.unl.edu/chemistrydiss
Part of the Analytical Chemistry Commons
This Article is brought to you for free and open access by the Chemistry, Department of at DigitalCommons@University of Nebraska - Lincoln. It hasbeen accepted for inclusion in Student Research Projects, Dissertations, and Theses - Chemistry Department by an authorized administrator ofDigitalCommons@University of Nebraska - Lincoln.
Matsuda, Ryan E., "Chromatographic Analysis of Drug-Protein Interactions During Diabetes and Characterization of Human SerumAlbumin Through Multidimensional Mass Spectrometry" (2015). Student Research Projects, Dissertations, and Theses - ChemistryDepartment. 53.http://digitalcommons.unl.edu/chemistrydiss/53
CHROMATOGRAPHIC ANALYSIS OF DRUG-PROTEIN INTERACTIONS
DURING DIABETES AND CHARACTERIZATION OF HUMAN SERUM ALBUMIN
THROUGH MULTIDIMENSIONAL MASS SPECTROMETRY
by
Ryan Eiji Matsuda
A DISSERTATION
Presented to the Faculty of
The Graduate College at the University of Nebraska
In Partial Fulfillment of Requirements
For the Degree of Doctor of Philosophy
Major: Chemistry
Under the Supervision of Professor David S. Hage
Lincoln, Nebraska
May, 2015
CHROMATOGRAPHIC ANALYSIS OF DRUG-PROTEIN INTERACTIONS
DURING DIABETES AND CHARACTERIZATION OF HUMAN SERUM ALBUMIN
THROUGH MULTIDIMENSIONAL MASS SPECTROMETRY
Ryan E. Matsuda, Ph.D.
University of Nebraska, 2015
Advisor: David S. Hage
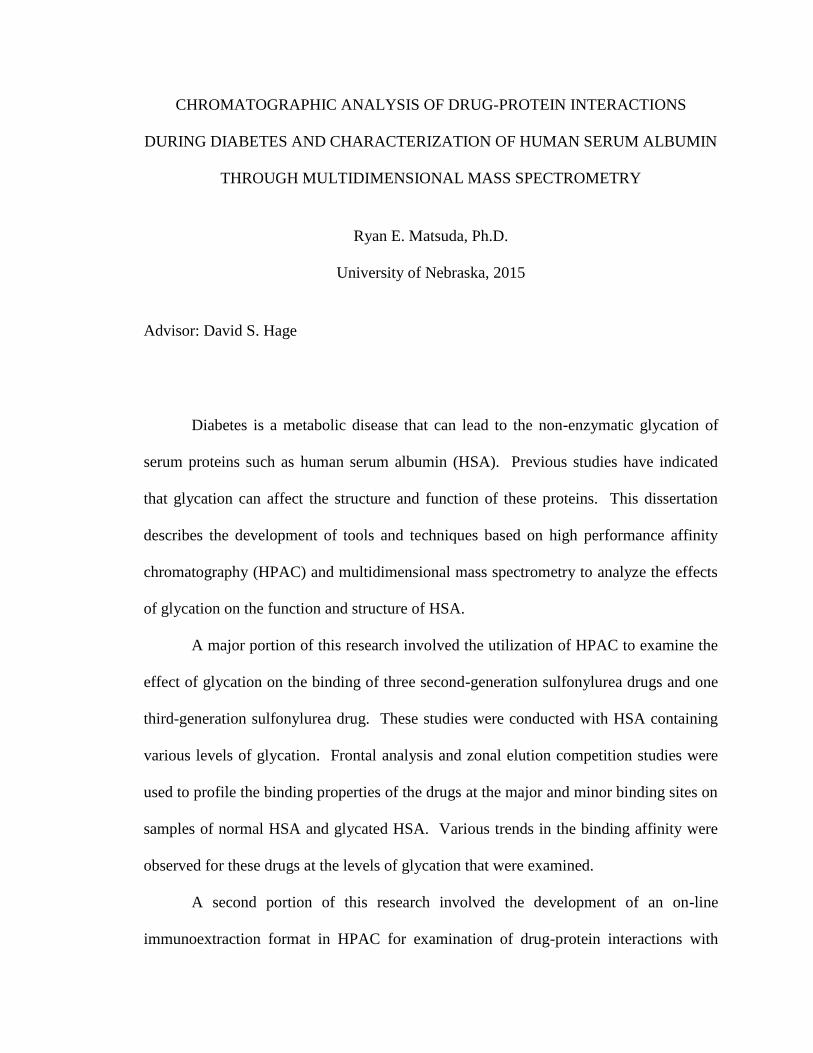
Diabetes is a metabolic disease that can lead to the non-enzymatic glycation of
serum proteins such as human serum albumin (HSA). Previous studies have indicated
that glycation can affect the structure and function of these proteins. This dissertation
describes the development of tools and techniques based on high performance affinity
chromatography (HPAC) and multidimensional mass spectrometry to analyze the effects
of glycation on the function and structure of HSA.
A major portion of this research involved the utilization of HPAC to examine the
effect of glycation on the binding of three second-generation sulfonylurea drugs and one
third-generation sulfonylurea drug. These studies were conducted with HSA containing
various levels of glycation. Frontal analysis and zonal elution competition studies were
used to profile the binding properties of the drugs at the major and minor binding sites on
samples of normal HSA and glycated HSA. Various trends in the binding affinity were
observed for these drugs at the levels of glycation that were examined.
A second portion of this research involved the development of an on-line
immunoextraction format in HPAC for examination of drug-protein interactions with
normal and glycated HSA. This study utilized a polyclonal anti-HSA antibody HPAC
column to extract and bind normal HSA or glycated HSA. The adsorbed HSA or
glycated HSA columns were then tested and used in a number of chromatographic
formats to examine drug-protein interactions.
Finally, a third portion of this research involved the use of multidimensional mass
spectrometry to qualitatively profile the structure of HSA through sequence analysis.
This work obtained sequence analysis results that were comparable to those found in a
previous method involving matrix-assisted laser desorption/ionization time-of-flight mass
spectrometry. In addition, collision-induced dissociation was used to confirm the identity
of several peptide sequences that could be used as internal calibrants for future work
involving glycated HSA.

DEDICATION
This is work is dedicated to my grandparents. I first want to dedicate this work to
my paternal grandfather, Heiji Matsuda, who aspired to be chemist. Although I did not
get the opportunity to meet you, I would have enjoyed the opportunity for you to visit me
in the research lab. I would like to also dedicate this work to my late maternal
grandmother, Kimiko Matsuda, who was my friend and someone who I have always
enjoyed talking too. Lastly, I would like to dedicate this to my maternal grandmother,
Matsuko Asuka, who has always been a proud supporter of me.
ACKNOWLEDGEMENTS
Coming from Hawaii, it is important to remember where you come from and the
many individuals who have helped you along the way. There are many people that I
would like to thank for their support in helping me get through graduate school. First, I
would like to thank Dr. Hage for giving me the opportunity to be part of his research
group and for the many opportunities that he has provided me to expand my knowledge
of chemistry to become a better researcher. I would also like to express my utmost
gratitude to him for his patience, guidance, and mentorship throughout my graduate
career. Secondly, I would like to thank Dr. Dodds for being a co-research mentor of my
Molecular Mechanisms of Disease pre-doctoral training fellowship. I appreciate all of
your guidance and mentorship, which has broadened my knowledge of the field of mass
spectrometry. I would also like to show my appreciation to my supervisory committee
members, Dr. Powers, Dr. Li and Dr. Wehling and thank them for providing me with
their support and guidance throughout my graduate career. Thank you also to the
Molecular Mechanisms of Disease Program and Dr. Simpson for providing me with a
fellowship and allowing me to be part of an esteemed group of scientists.
I would like to acknowledge the many teachers and chemistry professors who
have helped me along the way. I would first like to acknowledge my high school
teachers for inspiring me to pursue a career in science and teaching me the skills to be a
good student. I would like to also acknowledge Pacific University and the chemistry
department’s faculty and staff members and thank them for shaping me into the
researcher that I am today. I would specifically like to thank Dr. Johnson for allowing
me to conduct research in his lab and introducing me to the idea of going to graduate
school. I would especially like to thank Dr. Whiteley for his encouragement to apply and
attend the University of Nebraska for graduate school, which has been one of the best
decisions I have ever made in my life.
I would like to acknowledge the current and past members of the Hage research
group and thank them for their help throughout my graduate career. I would like to thank
Dr. Jeanethe Anguizola for being my mentor and allowing me to work with her on the
glycation projects. I would especially like to thank Xiwei “Emmi” Zheng for her
kindness and willingness to always have conversations with me whether it be about
research or random topics. Sharing an office space with you for the past several years
has always been fun and enjoyable, despite my desk always being messy, and my
graduate school experience would not have been possible without your friendship and
support. I would also like to thank Cong “Penny” Bi and Zhao Li for all of your support
and friendship. Lastly, I would like to acknowledge and thank the undergraduate
students who I have mentored, So-Hwang, Elli, and Megan for all of their hard work.
I have been grateful to have made many friends throughout my life and in
graduate school. I would like to thank Lukasz, Venkata, and Andy for being great friends
and supporters throughout graduate school. Lukasz, I have always been a fan of your
quirkiness and your ability to find food places with “good” portions. I am proud to say
that I know all of the best lunch spots in Lincoln. Venkata, I am thankful for your
assistance with my mass spectrometry project, willingness to help me out in any way
possible and lastly for always being a great human navigator. I think we would be
constantly lost without you. Andy, you and Ashley have always welcomed me into your
home and family and even provided me with rides to school on bad snow days. I hope

that in the future I will make it to Montana to visit you both. I would also like to thank
Abby, Katie, Anita, Thomas, Yuting, and Emma for their support and friendship, as well
as the fun times throughout graduate school. My graduate career would not have been
possible without the support from my college friends, especially, Nish, Harold, Naks,
Laine, and Jordan. I have always looked forward to going home and getting together
with all of you to reminisce about the good times in college. I would like to thank my
childhood friends Travis, Ashley, Sandy, Caitlin, and Jennifer for their support and for
always being available to get together whenever I visited home.
I would like to acknowledge my family for all of their continued support. Thank
you to my many uncles, aunties, cousins, and family friends for your constant
encouragement throughout my graduate career.
Last but not least, I would like to thank my parents. I am very grateful and
fortunate to have wonderful parents who have supported me throughout my entire life
and encouraged me to pursue everything in my life. Dad, I am very appreciative of the
wisdom and knowledge that you have shared with me. Your willingness to always listen
and provide words of support and guidance, while also telling me stories about your golf
game has helped me through the good and tough times in graduate school. Mom, I am
thankful for the encouragement and compassion that you have provided me. Despite
what dad may say, you have taught me the meaning of perseverance and dedication in the
work place. Your work ethic has always been an inspiration to me and has always
motivated me to keep moving forward through any problem or adversity that I have faced
in my life. I would not be the person that I am today without both of you.
Thank you again to all of you for your support!
TABLE OF CONTENTS
CHAPTER 1:
GENERAL INTRODUCTION
1.1 HPAC and the Analysis of Drug-Interactions with Glycated HSA ............... 1
1.2 Approaches for Preparing Normal and Glycated HSA Columns ............... 10
1.2.1 Support Materials ....................................................................................... 10
1.2.2 Protein Isolation and Preparation .............................................................. 13
1.3 Frontal Analysis Studies .................................................................................. 14
1.4. Zonal Elution Competition Studies ................................................................ 25
1.5 Overview of Dissertation ................................................................................. 29
1.6 References ......................................................................................................... 33
CHAPTER 2:
METABOLITE-PROTEIN INTERACTIONS
2.1 Introduction ..................................................................................................... 41
2.2 Techniques for examining metabolite-protein interactions ......................... 43
2.2.1 In vitro methods for studying metabolite-protein interactions ................... 43
2.2.2 In vivo methods for studying metabolite-protein interactions .................... 52
2.2.3 In silico methods for studying metabolite-protein interactions .................. 52
2.3 Interactions of proteins with hormones and related metabolites ................ 53
2.3.1 Thyroid hormones ....................................................................................... 54
2.3.2 Steroid hormones ........................................................................................ 56
2.4 Interactions of proteins with fatty acids and related metabolites ................ 57
2.5 Interactions of proteins with drugs and related metabolites ....................... 58
2.5.1 General effects of metabolites on drug-protein interactions ...................... 59
2.5.2 Effects of chirality on drug metabolite-protein binding ............................. 60
2.5.3. Use of binding data to characterize protein interaction sites for drug
metabolites .................................................................................................. 62
2.6 Interactions of proteins with xenobiotics and related metabolites .............. 65
2.7 Variations in protein structure and binding due to metabolic processes ... 67
2.7.1. Human serum albumin ................................................................................ 67
2.7.2. Alpha1-acid glycoprotein ............................................................................ 72
2.7.3. Lipoproteins ................................................................................................ 73
2.8 Conclusion ......................................................................................................... 74
2.9 References ......................................................................................................... 76
CHAPTER 3:
HIGH-PERFORMANCE AFFINITY CHROMATOGRAPHY AND THE
ANALYSIS OF DRUG INTERACTIONS WITH MODIFIED PROTEINS:
BINDING OF GLICLAZIDE WITH GLYCATED HUMAN SERUM ALBUMIN
3.1 Introduction ...................................................................................................... 99
3.2 Experimental................................................................................................... 106
3.2.1 Chemicals .................................................................................................. 106
3.2.2 Instrumentation ......................................................................................... 106
3.2.3 Methods ..................................................................................................... 106
3.3 Results and Discussion ................................................................................... 109
3.3.1 Frontal analysis studies ............................................................................ 109
3.3.2 Zonal elution studies with gliclazide at Sudlow site I ............................... 118
3.3.3 Zonal elution studies with gliclazide at Sudlow site II ............................. 125
3.4 Conclusion ....................................................................................................... 127
3.5 References ....................................................................................................... 128
CHAPTER 4:
ANALYSIS OF DRUG INTERACTIONS WITH MODIFIED PROTEINS BY 133
HIGH-PERFORMANCE AFFINITY CHROMATOGRAPHY:
BINDING OF GLIBENCLAMIDE TO NORMAL AND GLYCATED HUMAN
SERUM ALBUMIN
4.1 Introduction .................................................................................................... 133
4.2 Experimental................................................................................................... 139
4.2.1 Reagents .................................................................................................... 139
4.2.2 Apparatus .................................................................................................. 139
4.2.3 Methods ..................................................................................................... 140
4.3. Results and Discussion ................................................................................... 144
4.3.1 Frontal analysis studies ............................................................................ 144
4.3.2 Binding of glibenclamide at Sudlow site I ................................................ 156
4.3.3 Binding of glibenclamide at Sudlow site II ............................................... 162
4.3.4 Binding of glibenclamide at the digitoxin site .......................................... 164
4.4 Conclusion ....................................................................................................... 167
4.5 References ....................................................................................................... 170
CHAPTER 5:
ANALYSIS OF GLIPIZIDE BINDING TO NORMAL AND GLYCATED
HUMAN SERUM ALBUMIN BY HIGH-PERFORMANCE AFFINITY
CHROMATOGRAPHY
5.1 Introduction .................................................................................................... 178
5.2 Experimental................................................................................................... 183
5.2.1 Chemicals .................................................................................................. 183
5.2.2 Instrumentation ......................................................................................... 183
5.2.3 In-vitro Glycation of HSA ........................................................................ 184
5.2.4 Preparation of Supports and Columns ..................................................... 184
5.2.5 Chromatographic Studies ......................................................................... 185
5.3 Theory ............................................................................................................. 190
5.3.1 Frontal Analysis ........................................................................................ 190
5.3.2 Zonal Elution Competition Studies ........................................................... 193
5.4 Results and Discussion ................................................................................... 195
5.4.1 Frontal Analysis using Normal HSA......................................................... 195
5.4.2 Frontal Analysis using Glycated HSA ...................................................... 199
5.4.3 Competition Studies at Sudlow Site II ....................................................... 202
5.4.4 Competition Studies at the Digitoxin Site ................................................. 207
5.4.5 Competition Studies at Sudlow Site I ........................................................ 207
5.4.6 Competition Studies at the Tamoxifen Site ............................................... 212
5.5 Conclusion ....................................................................................................... 216
5.6 References ....................................................................................................... 219
5.7 Appendix ......................................................................................................... 226
5.7.1 Analysis of Frontal Analysis Data According to Eq. (5) .......................... 226
5.7.2 Zonal Elution Competition Studies at Sudlow Site I ................................. 227
5.7.3 Reverse Competition Studies using Glipizide and Warfarin .................... 230
5.7.4 Reverse Competition Studies using Glipizide and Tamoxifen .................. 231
CHAPTER 6:
ANALYSIS OF MULTI-SITE DRUG-PROTEIN INTERACTIONS BY HIGH-
PERFORMANCE AFFINITY CHROMATOGRAPHY:
BINDING BY GLIMEPIRIDE TO NORMAL OR GLYCATED HUMAN
SERUM ALBUMIN
6.1 Introduction .................................................................................................... 237
6.2 Experimental................................................................................................... 242
6.2.1 Chemicals .................................................................................................. 242
6.2.2 Apparatus .................................................................................................. 242
6.2.3 In vitro Glycation of HSA ......................................................................... 243
6.2.4 Column preparation .................................................................................. 244
6.2.5 Chromatographic studies .......................................................................... 245
6.3 Results and Discussion .................................................................................. 250
6.3.1 Determination of Overall Binding Model ................................................. 250
6.3.2 Estimation of Overall Binding Constants and Amount of Binding Sites .. 255
6.3.3 Interactions with Sudlow Site II ................................................................ 258
6.3.4 Interactions with the Digitoxin Site .......................................................... 265
6.3.5 Interactions with Sudlow Site I ................................................................. 266
6.3.6 Interactions with the Tamoxifen Site......................................................... 271
6.4 Conclusion ...................................................................................................... 275
6.5 References ....................................................................................................... 278
6.6 Appendix ......................................................................................................... 286
6.6.1 Reverse Competition Studies using Glimepiride and Warfarin ................ 286
6.6.2 Reverse Competition Studies using Glimepiride and Tamoxifen .............. 287
CHAPTER 7:
ANALYSIS OF DRUG-PROTEIN BINDING USING ON-LINE
IMMUNOEXTRACTION AND HIGH-PERFORMANCE AFFINITY
CHROMATOGRAPHY: STUDIES WITH NORMAL AND
GLYCATED HUMAN SERUM ALBUMIN
7.1 Introduction .................................................................................................... 293
7.2 Experimental .................................................................................................. 295
7.2.1 Materials ................................................................................................... 295
7.2.2 Instrumentation ......................................................................................... 298
7.2.3 Antibody purification ................................................................................ 298
7.2.4 Preparation of immunoextraction columns .............................................. 299
7.2.5 Preparation of glycated HSA .................................................................... 300
7.2.6 Evaluation of immunoextraction columns ................................................ 301
7.2.7 Chromatographic binding studies............................................................. 303
7.3 Results and Discussion ................................................................................... 304
7.3.1 Characterization of immunoextraction column ........................................ 304
7.3.2 Frontal analysis drug binding studies ...................................................... 307
7.3.3 Frontal analysis studies with gliclazide .................................................... 314
7.3.4 Zonal elution competition studies ............................................................. 320
7.4 Conclusion ....................................................................................................... 324
7.5 References ....................................................................................................... 326
7.6 Appendix ......................................................................................................... 333
7.6.1 Structures of Representative Sulfonylurea Drugs ..................................... 333
7.6.2 Affinity Purification of Anti-HSA Antibodies ............................................ 333
7.6.3 Immunoextraction Experiments ................................................................ 333
7.6.4 Frontal Analysis Studies ........................................................................... 340
CHAPTER 8:
QUALITATIVE STRUCTURAL ANALYSIS OF HUMAN SERUM ALBUMIN
BY NANO-ELECTROSPRAY IONIZATION QUADRUPOLE TIME-OF-
FLIGHT MASS SPECTROMETRY
8.1 Introduction .................................................................................................... 343
8.2 Experimental................................................................................................... 346
8.2.1 Materials ................................................................................................... 346
8.2.2 Apparatus .................................................................................................. 346
8.2.3 Sample Digest and Purification ................................................................ 347
8.2.4 Mass Spectrometry .................................................................................... 351
8.2.5 MS Calibration and Data Analysis ........................................................... 353
8.3 Results ............................................................................................................. 358
8.3.1 Sample Digestion and Purification ........................................................... 358
8.3.2 Comparison of Sequence Coverages for Various Digests ........................ 359
8.3.3 Use of Multiple Enzyme Digests with nano-ESI-QTOF MS ..................... 367
8.3.4 MS/MS for Internal Calibrants ................................................................. 370
8.4 Conclusion ....................................................................................................... 385
8.5 References ....................................................................................................... 386
CHAPTER 9
SUMMARY AND FUTURE WORK
9.1 Summary ......................................................................................................... 393
9.2 Future work .................................................................................................... 396
9.3 References ....................................................................................................... 397
1
CHAPTER 1
GENERAL INTRODUCTION
Note: Portions of this chapter have appeared in R. Matsuda, J. Anguizola, K.S. Hoy, D.S.
Hage, “Analysis of drug-protein interactions by high-performance affinity: Interactions of
sulfonylurea drugs with normal and glycated human serum albumin”, Methods 1286
(2015) 255-277.
1.1 HPAC and the Analysis of Drug-Interactions with Glycated HSA
Many biological systems involve interactions between small solutes and proteins.
Examples include the binding of low mass antigens to antibodies, enzymes to substrates,
hormones to receptors, and drugs to plasma proteins [1,2]. Various techniques have been
developed to examine and characterize these interactions. These methods have ranged
from fluorescence spectroscopy [3-6], circular dichroism [5], ultrafiltration [6-8] and
equilibrium dialysis [4,9-12] to chromatographic and electrophoretic techniques such as
size exclusion chromatography, capillary electrophoresis, and affinity capillary
electrophoresis [13-24].
One type of chromatography that has been used to examine the binding of
proteins with drugs and small solutes is high-performance affinity chromatography
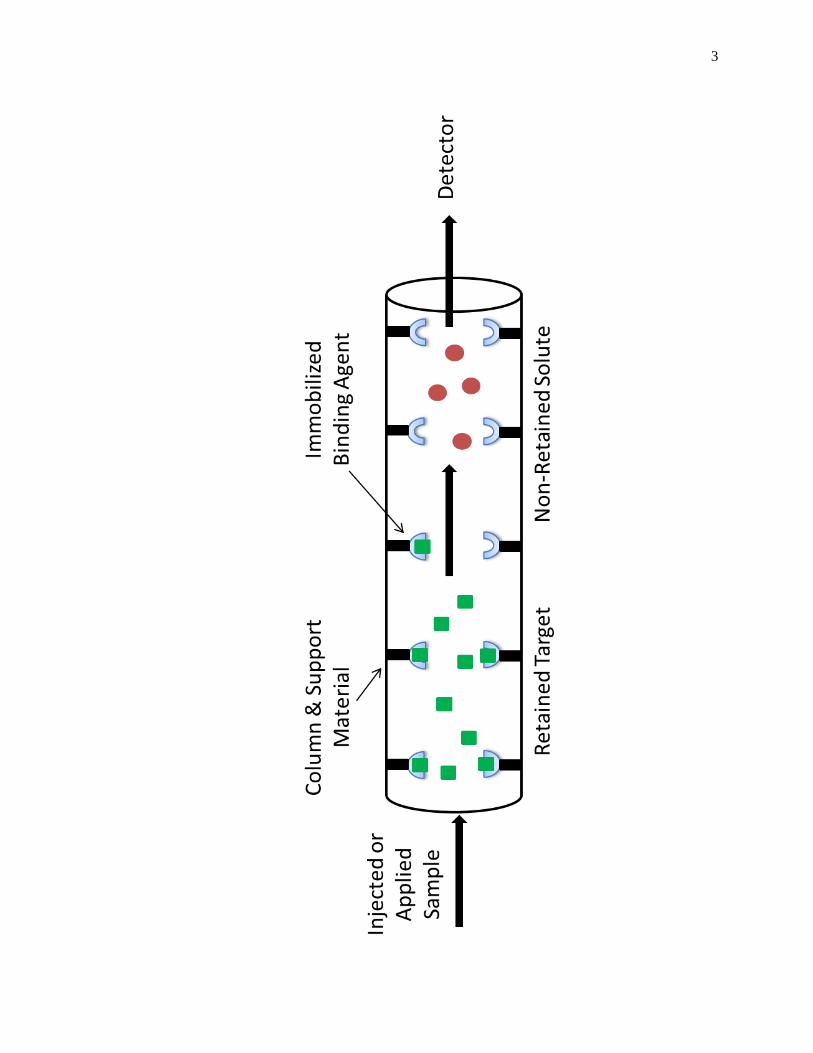
(HPAC). Fig. 1-1 shows a scheme of the basic operations of HPAC. Affinity
chromatography is a type of liquid chromatography that utilizes an immobilized and
biologically-related binding agent (e.g., an antibody, enzyme or transport protein) as the
stationary phase [1]. This method makes use of the specific, reversible interactions that
occur in many biological interactions by immobilizing one of the pairs of interacting
substances onto a support and placing this binding agent within a column. The
2
Figure 1-1. General scheme of an HPAC column system for utilizing an immobilized
binding agent to recognize and separate a target from other non-retained
sample components.
3
4
immobilized binding agent, or affinity ligand, is then allowed to interact with the
corresponding targets and binding partners as these are applied to the column in the
mobile phase or as injected samples [1,25].
In traditional affinity chromatography, large and non-rigid support materials such
as agarose or carbohydrate-based gels are typically used. These materials are
inexpensive and allow for separations to be performed under gravitational force or
through use of a peristaltic pump [1,26,27]. However, these same supports can have poor
mass transfer properties and often require the use of low back pressures or flow rates,
making them most useful for preparative work or sample pretreatment [1]. In HPAC, the
support is instead a more rigid and efficient material such as HPLC-grade silica, a
perfusion support or a monolithic medium. The better mass transfer properties and
improved stability of these materials to high flow rates or high back pressures allows the
use of these supports with HPLC systems [26,27].
Affinity chromatography and HPAC have been frequently used to separate,
purify, or examine specific analytes in biological samples [1,26-36]. It is also possible to
use these methods, and in particular HPAC, to examine drug- or solute-protein
interactions. Information that can be provided by affinity chromatography and HPAC on
these interactions include the number of sites that are involved in a binding process and
the equilibrium constants that describe this binding. It is also possible to determine,
through the use of site-specific probes, the equilibrium constants that are present for a
target at specific sites on a protein, the location of these sites, and the types of
interactions that one solute may have with another at these sites [1,21,37,38]. A major
advantage of using HPAC for these studies is that it is a high-throughput technique that
5
can be easily automated. In addition, HPAC has the capability of using the same
immobilized biological agent and column for up to hundreds of experiments. These same
features provide this method with good precision and allow short analysis times to be
obtained during binding studies [1,21].
The analysis of drug-protein interactions by HPAC has been of interest for some
time because of the information this method can provide on the transport, distribution and
metabolism of drugs [2,39]. It has also been found that HPAC can be used to
characterize changes in drug-protein interactions that can result from metabolic processes
or disease [13-20,40]. Diabetes is one metabolic disease whose effects on drug-protein
binding have been investigated by HPAC [13-20]. Diabetes is characterized by elevated
levels of glucose in the bloodstream, which can result in the glycation of serum proteins
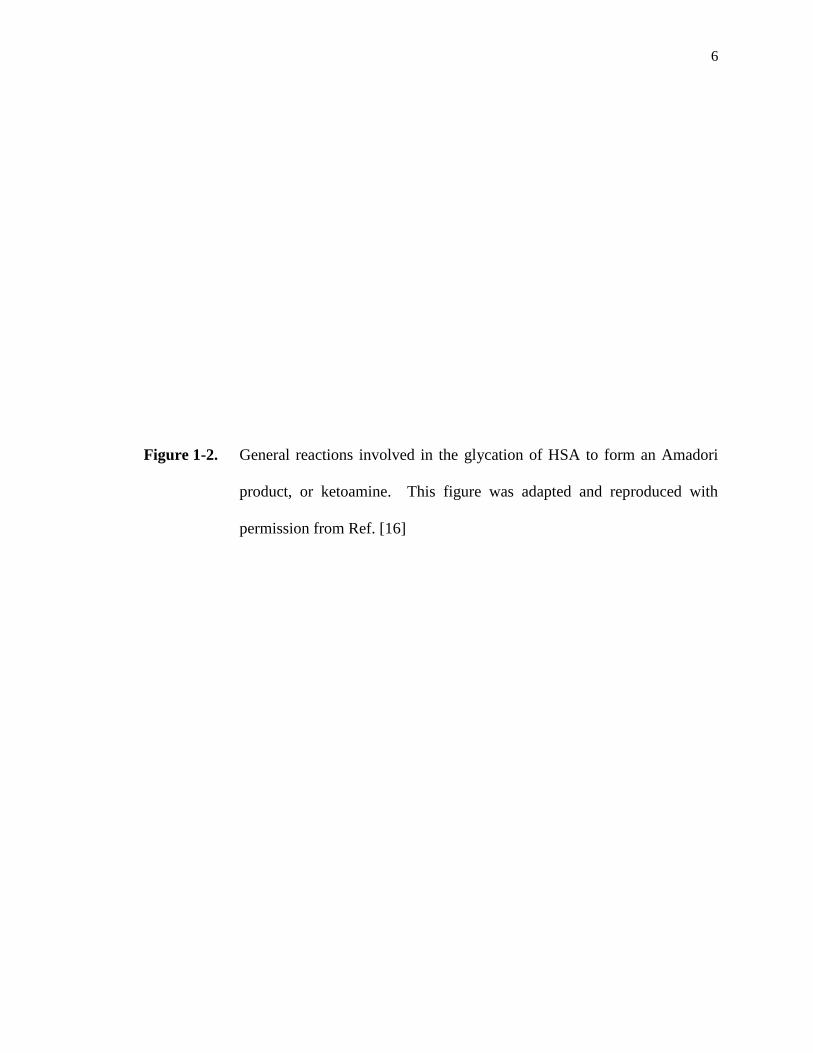
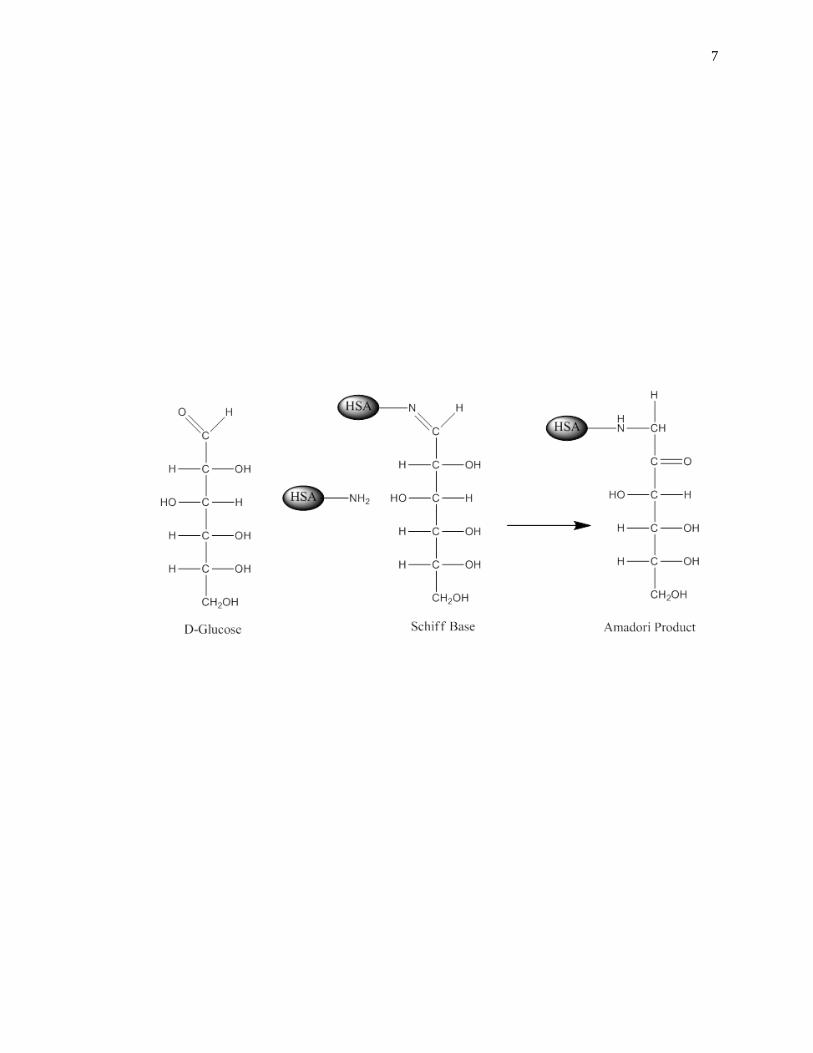
[3,41-44]. Glycation is a non-enzymatic process that occurs through the addition of
reducing sugars to free amine groups on proteins. The initial product of this reaction is a
reversible Schiff base, which can later rearrange to create a stable Amadori product, or
ketoamine, as shown in Fig. 1-2 [45-47]. Additional processes such as oxidation,
dehydration and cross-linking can also occur to form advanced glycation end-products
(AGEs) on proteins [48].
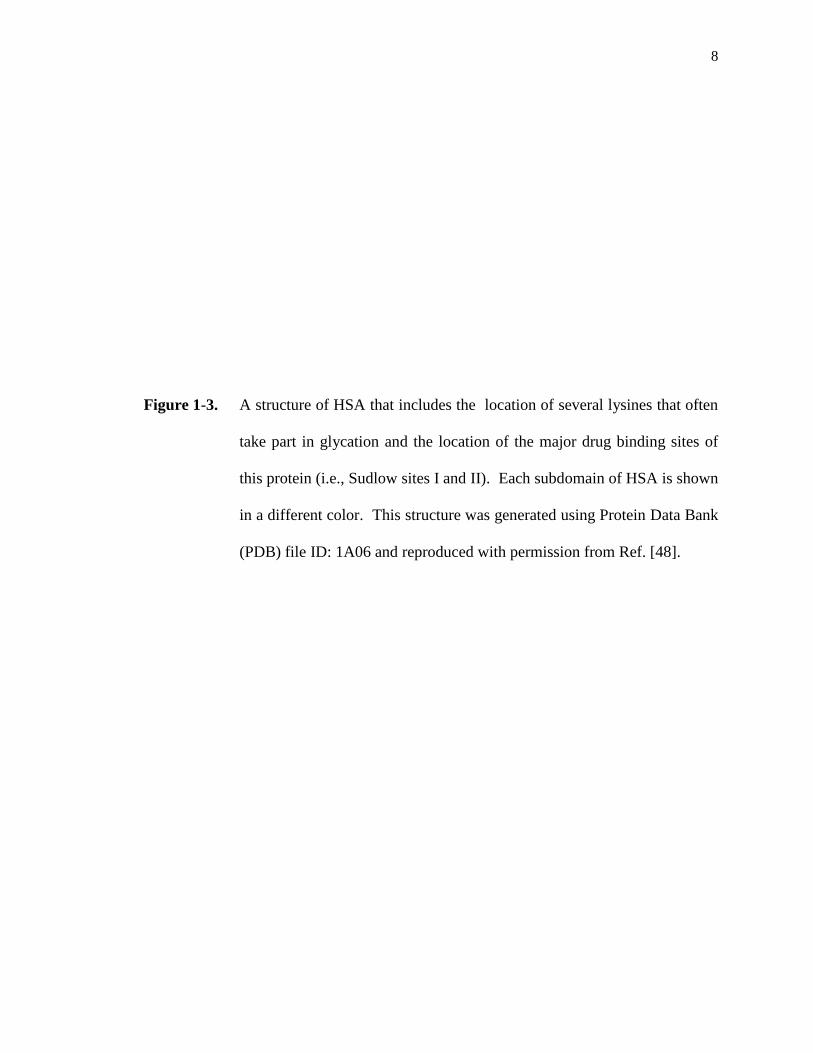
Recent studies have suggested that glycation related-modifications can affect the
structure and function of transport proteins such as human serum albumin (HSA) [13-
20,49,50]. A structure of HSA is shown in Fig. 1-3. HSA is the most abundant protein
in plasma and is responsible for the transportation of many drugs and solutes in blood
[51]. Reports have indicated that there is a 2- to 5-fold increase in the amount of HSA
that is glycated in diabetic patients when compared to non-diabetic individuals [52].
6
Figure 1-2. General reactions involved in the glycation of HSA to form an Amadori
product, or ketoamine. This figure was adapted and reproduced with
permission from Ref. [16]
7
8
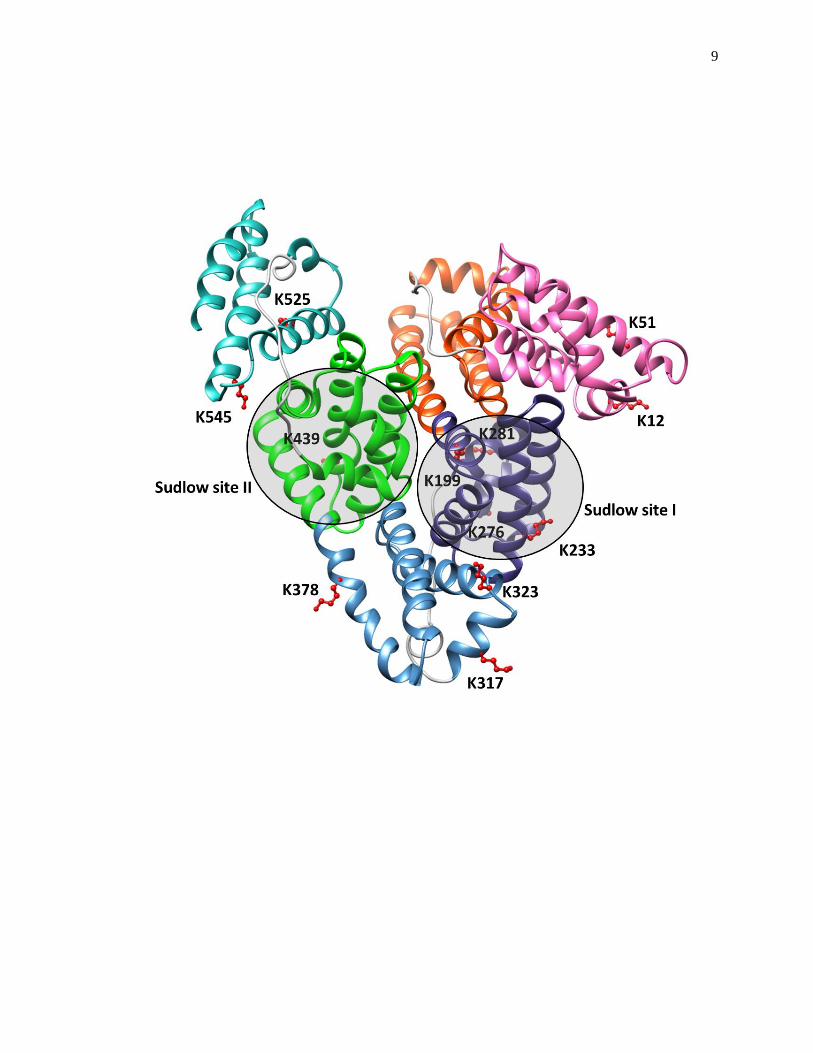
Figure 1-3. A structure of HSA that includes the location of several lysines that often
take part in glycation and the location of the major drug binding sites of
this protein (i.e., Sudlow sites I and II). Each subdomain of HSA is shown
in a different color. This structure was generated using Protein Data Bank
(PDB) file ID: 1A06 and reproduced with permission from Ref. [48].
9
10
Mass spectrometric studies have shown that glycation can occur at or near Sudlow sites I
and II, which are the major drug binding sites on HSA [49,50]. Binding studies using
methods like HPAC have also revealed that glycation-related modifications at these sites
can affect the binding of various drugs and solutes with HSA [3,13-20,42-44]. For
instance, some of these studies have shown that the affinity at Sudlow sites I or II can
change by 0.6- to 6-fold for some drugs in the presence of glycated HSA versus normal
HSA [48].
1.2 Approaches for Preparing Normal and Glycated HSA Columns
1.2.1 Support Materials
HPLC-grade porous silica is commonly used as the starting support material for
many HPAC applications [1,25-27]. However, other HPLC supports that can be
modified for use with immobilized proteins could also have been employed, such as
perfusion supports, polymer-based monoliths, or silica monoliths [53,54]. There are a
variety of techniques that can be used to covalently attach a protein to silica or other
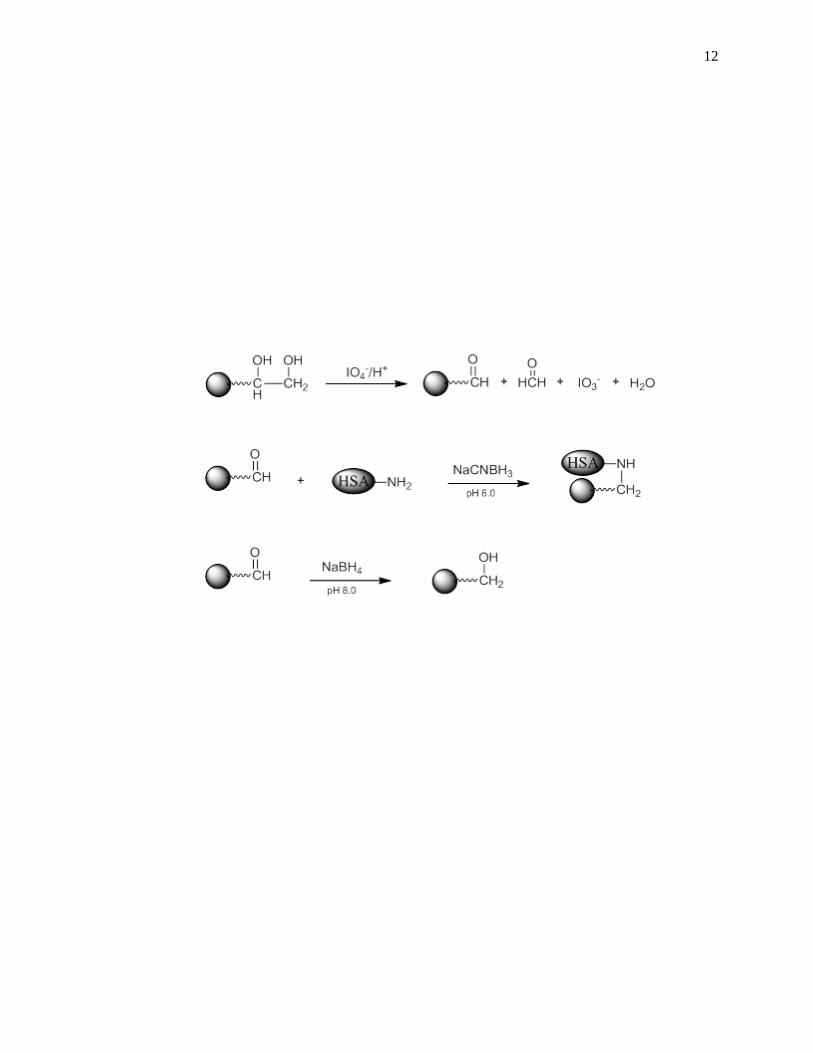
HPLC-grade supports [1,25-27]. One commonly used method is the Schiff base method
(see Fig. 1-4), which first involves conversion of the silica into a diol-bonded form
[55,56]. These diol groups create a support that has low non-specific binding for many
biological agents but can also be easily modified for the immobilization of proteins or
other binding agents [1,25-27]. For instance, in the Schiff base method these diol groups
are oxidized by periodic acid to form aldehyde groups, which can then react with free
amine groups on a protein [55,57]. The resulting Schiff base can then be reduced upon
formation by using a mild reducing agent like sodium cyanoborohydride to form a stable
secondary amine linkage. The remaining aldehyde groups can later be reduced to
11
Figure 1-4. Reactions involved in the immobilization of HSA to diol-bonded silica.
12
13
alcohols by adding a stronger reducing agent, such as sodium borohydride [57]. Studies
have indicated that both the glycation and the Schiff based method involve free amine
groups on HSA, however, studies based on mass spectrometry have shown that different
residues on HSA tend to be utilized for these two processes [49,50,58]. These studies
also indicated that immobilization through the Schiff base method also involves residues
other than those found at the N-terminus or the lysines that are located at Sudlow Site I
and II [45].
1.2.2 Protein Isolation and Preparation
The degree of isolation and preparation that is needed for a protein as a binding
agent will depend on the specific protein that is to be examined by HPAC. Several
reports have utilized both normal HSA, in vitro glycated HSA, and in vivo glycated HSA
samples as immobilized binding agents [1-20]. In one of these studies, various
preparations of glycated HSA that had glycation levels similar to those found in
individuals with pre-diabetes, controlled diabetes, or advanced/poorly controlled diabetes
were prepared in vitro [13]. The in vitro glycated HSA sample with a glycation level
representative of a prediabetic state was prepared under proprietary conditions [13,45].
This method involved a mixture of a fixed concentration of glucose with HSA that was
incubated at 37 °C for a period of time that was less than one week [13,45]. The other in
vitro glycated HSA samples were prepared by using a modified version of previously
published methods [13,59,60]. In this procedure, glucose concentrations typical of those
seen in blood for patients with controlled diabetes or advanced diabetes (15 or 30 mM)
were incubated with a physiological concentration of HSA at 37°C for 4 weeks [13].
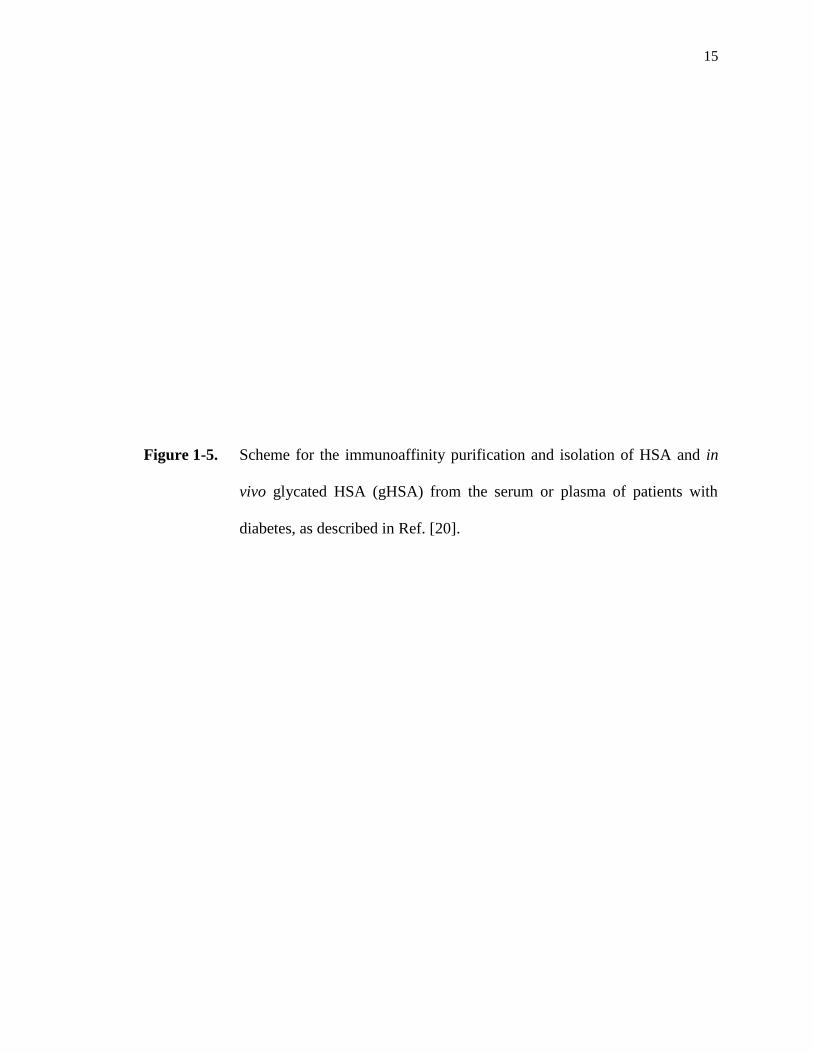
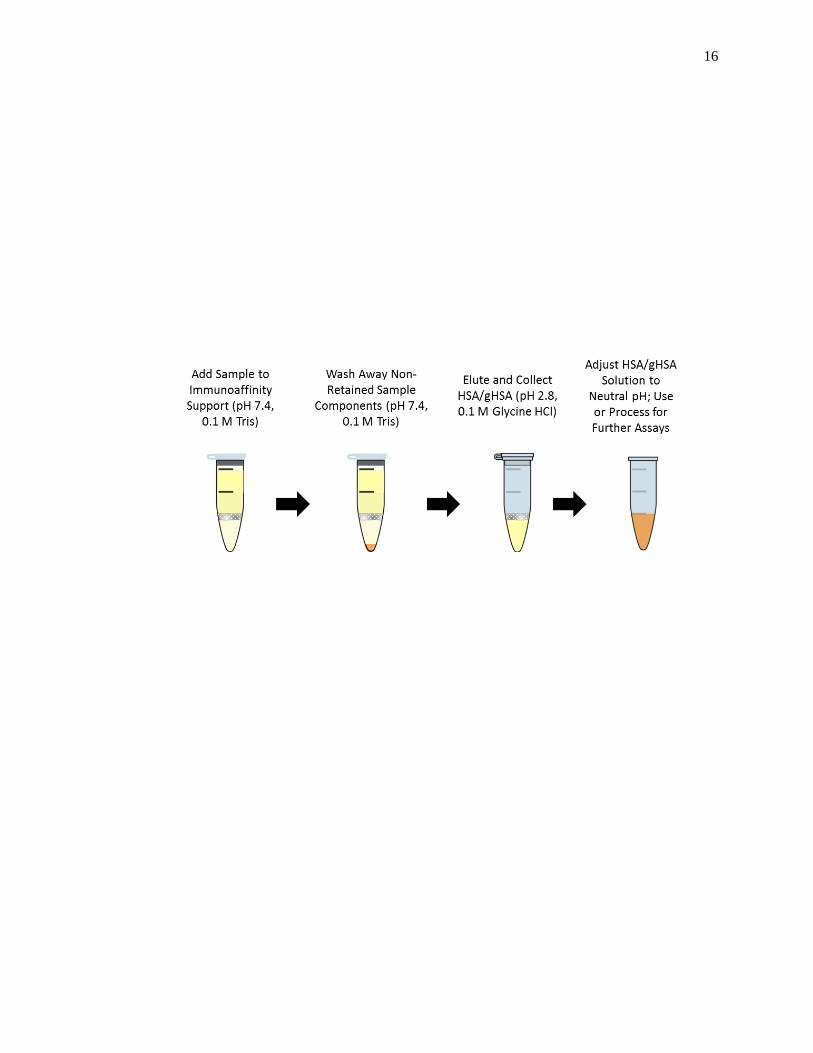
In a study involving in vivo glycated HSA, samples of glycated HSA were

14
isolated from pre-existing plasma or serum samples that had been obtained from patients
known to have diabetes [20]. A polyclonal anti-HSA antibody column was used to
extract HSA and glycated HSA from plasma or serum, according to the scheme shown in
Fig. 1-5 [20]. The extracted HSA and glycated HSA was then dialyzed against water or a
neutral pH buffer, lyophilized, and stored at -80°C until further use.
1.3 Frontal Analysis Studies
Frontal analysis is a commonly used HPAC chromatographic format that can be
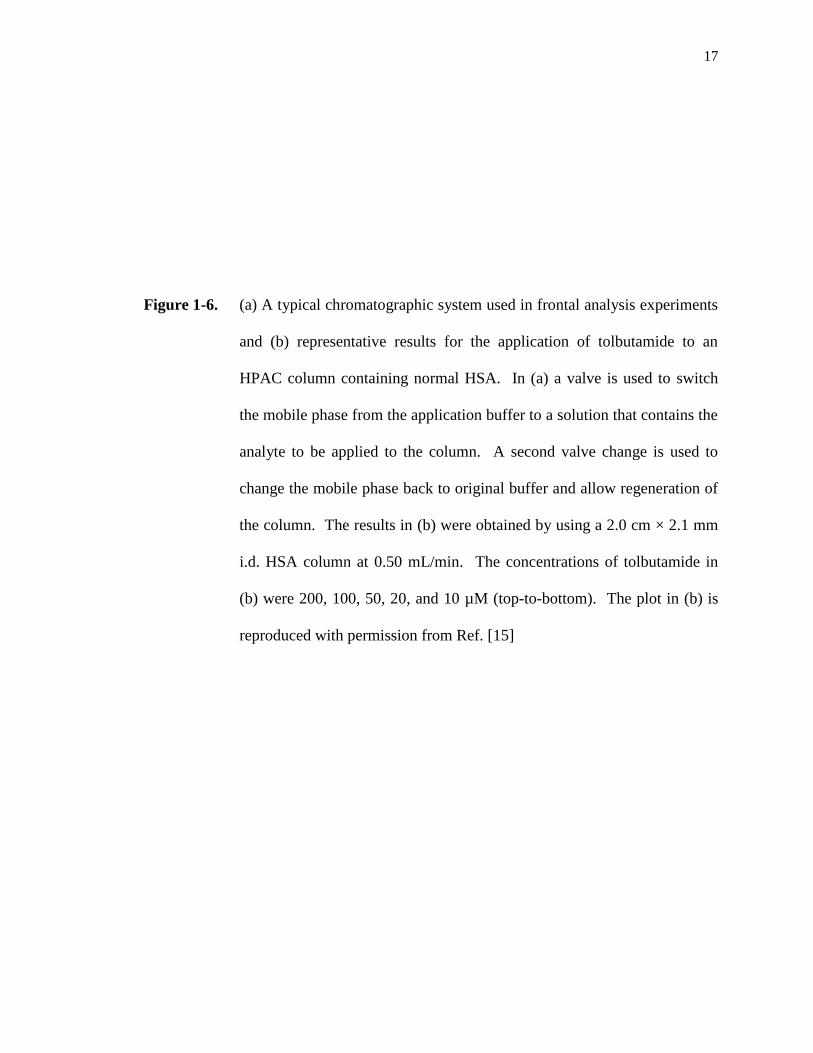
used to obtain drug-binding parameters. A typical chromatographic system for use in a
frontal analysis experiment is shown in Fig. 1-6(a). This type of system and experiment
can be used to obtain information on the binding strength and binding capacity of a
column that contains an immobilized affinity ligand as this ligand interacts with a
solution of the analyte that is applied in the mobile phase [1,25-27]. A typical HPAC
system like the one in Fig. 1-6(a) contains two pumps, a switching valve, a column, and a
detector. This particular system can be used for a situation in which the analyte can be
eluted in the presence of the application buffer under isocratic conditions, as was true for
the various drugs and probes that were examined within the cited examples [13-20]. In
this situation, one of the pumps is used to apply the analyte solution and the other pump
is used to pass only an application buffer through the column. Additional pumps can be
added to the system for experiments that involve more than one analyte or if a buffer with
a different pH or composition is required for analyte elution. The valve in this system
functions to switch between the application of the analyte solution and the buffer, or
eluting solution, to column. An absorbance detector is often used to monitor the analyte
elution in this type of system; however, detection based on fluorescence, near-infrared
15
Figure 1-5. Scheme for the immunoaffinity purification and isolation of HSA and in
vivo glycated HSA (gHSA) from the serum or plasma of patients with
diabetes, as described in Ref. [20].
16
17
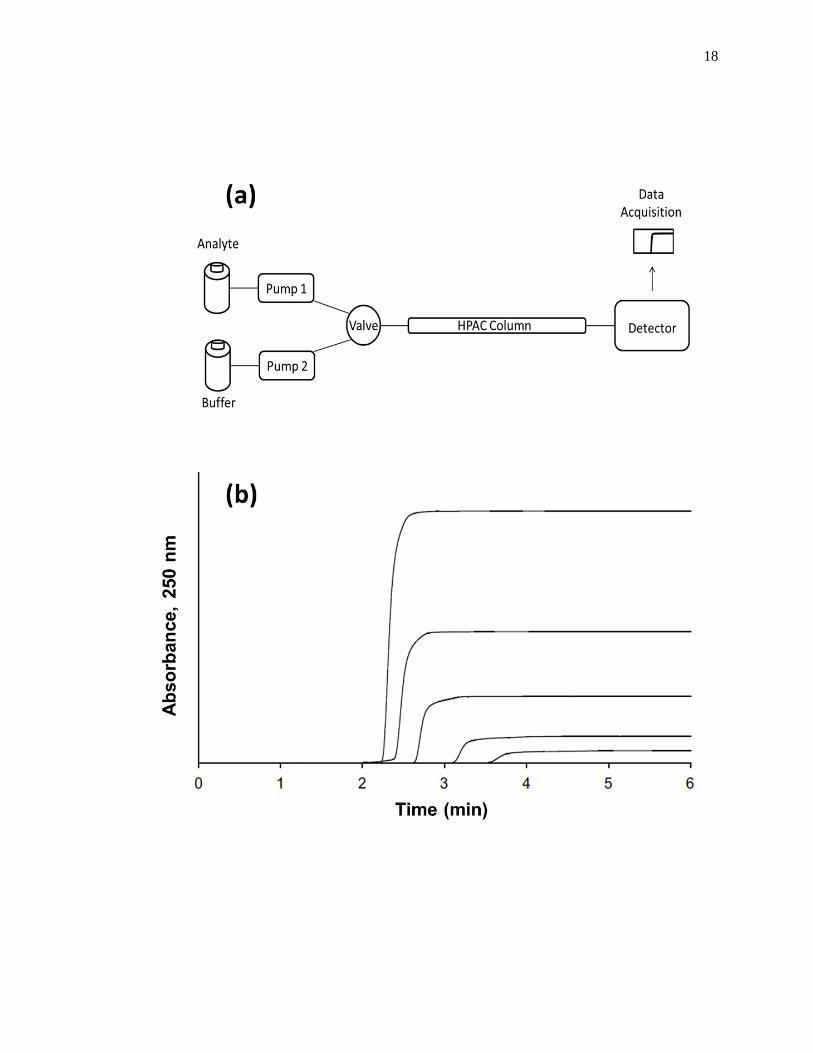
Figure 1-6. (a) A typical chromatographic system used in frontal analysis experiments
and (b) representative results for the application of tolbutamide to an
HPAC column containing normal HSA. In (a) a valve is used to switch
the mobile phase from the application buffer to a solution that contains the
analyte to be applied to the column. A second valve change is used to
change the mobile phase back to original buffer and allow regeneration of
the column. The results in (b) were obtained by using a 2.0 cm × 2.1 mm
i.d. HSA column at 0.50 mL/min. The concentrations of tolbutamide in
(b) were 200, 100, 50, 20, and 10 µM (top-to-bottom). The plot in (b) is
reproduced with permission from Ref. [15]
18
19
fluorescence, chemiluminescence, or mass spectrometry could also be utilized in some
cases [2].
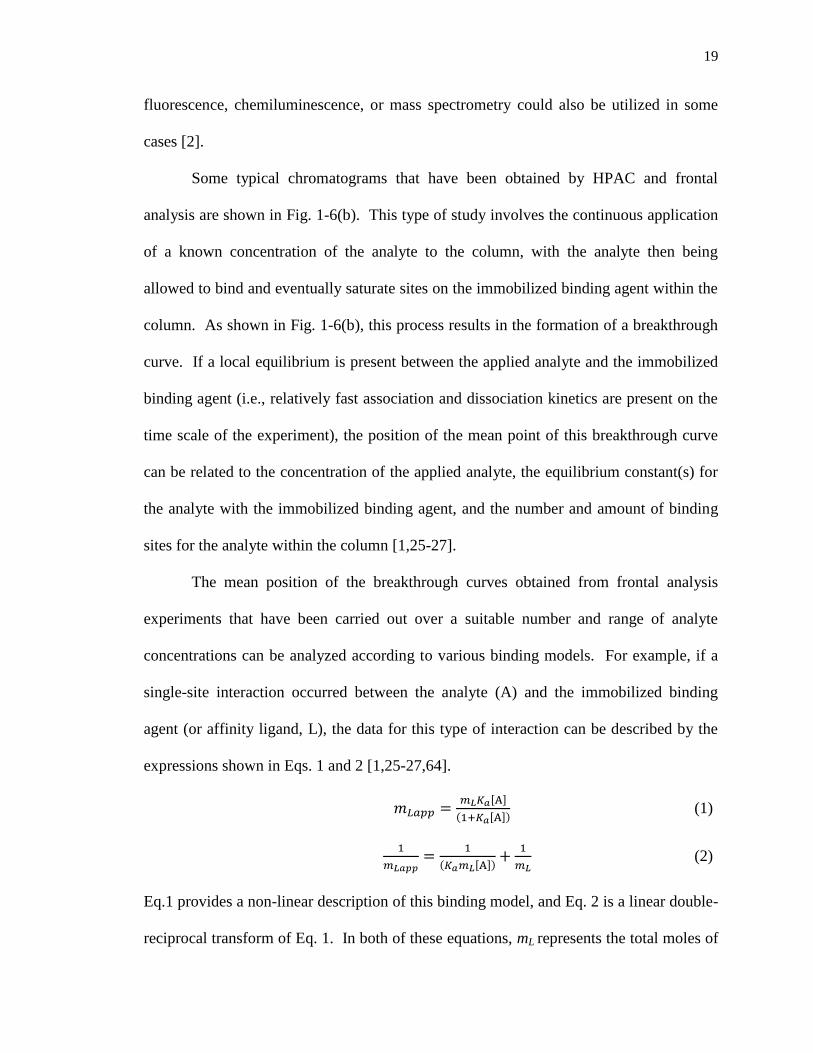
Some typical chromatograms that have been obtained by HPAC and frontal
analysis are shown in Fig. 1-6(b). This type of study involves the continuous application
of a known concentration of the analyte to the column, with the analyte then being
allowed to bind and eventually saturate sites on the immobilized binding agent within the
column. As shown in Fig. 1-6(b), this process results in the formation of a breakthrough
curve. If a local equilibrium is present between the applied analyte and the immobilized
binding agent (i.e., relatively fast association and dissociation kinetics are present on the
time scale of the experiment), the position of the mean point of this breakthrough curve
can be related to the concentration of the applied analyte, the equilibrium constant(s) for
the analyte with the immobilized binding agent, and the number and amount of binding
sites for the analyte within the column [1,25-27].
The mean position of the breakthrough curves obtained from frontal analysis
experiments that have been carried out over a suitable number and range of analyte
concentrations can be analyzed according to various binding models. For example, if a
single-site interaction occurred between the analyte (A) and the immobilized binding
agent (or affinity ligand, L), the data for this type of interaction can be described by the
expressions shown in Eqs. 1 and 2 [1,25-27,64].
𝑚𝐿𝑎𝑝𝑝 =𝑚𝐿𝐾𝑎[A]
(1+𝐾𝑎[A]) (1)
1
𝑚𝐿𝑎𝑝𝑝=
1
(𝐾𝑎𝑚𝐿[A])+
1
𝑚𝐿 (2)
Eq.1 provides a non-linear description of this binding model, and Eq. 2 is a linear double-
reciprocal transform of Eq. 1. In both of these equations, mL represents the total moles of
20
binding sites for the analyte in the column, Ka is the association equilibrium constant for
the analyte at these sites, and mLapp is the moles of applied analyte required to reach the
central point of the breakthrough curve at a given molar concentration of the analyte.
Equivalent expressions can be derived and used for the situation in which the
concentration and volume of the applied analyte are used in place of the moles of the
applied analyte [1,25-27,61].
A fit of either Eqs. 1 or 2 to the data for a single-site system can allow the values
of Ka and mL to be obtained. For instance, a plot of 1/mLapp vs. 1/[A] that is made
according to Eq. 2 should provide a linear relationship for a single-site system, giving a
slope that is equal to (1/Ka mL) and an intercept that is equal to (1/mL). The value of Ka in
this situation can be determined by dividing the intercept by the slope, while mL can be
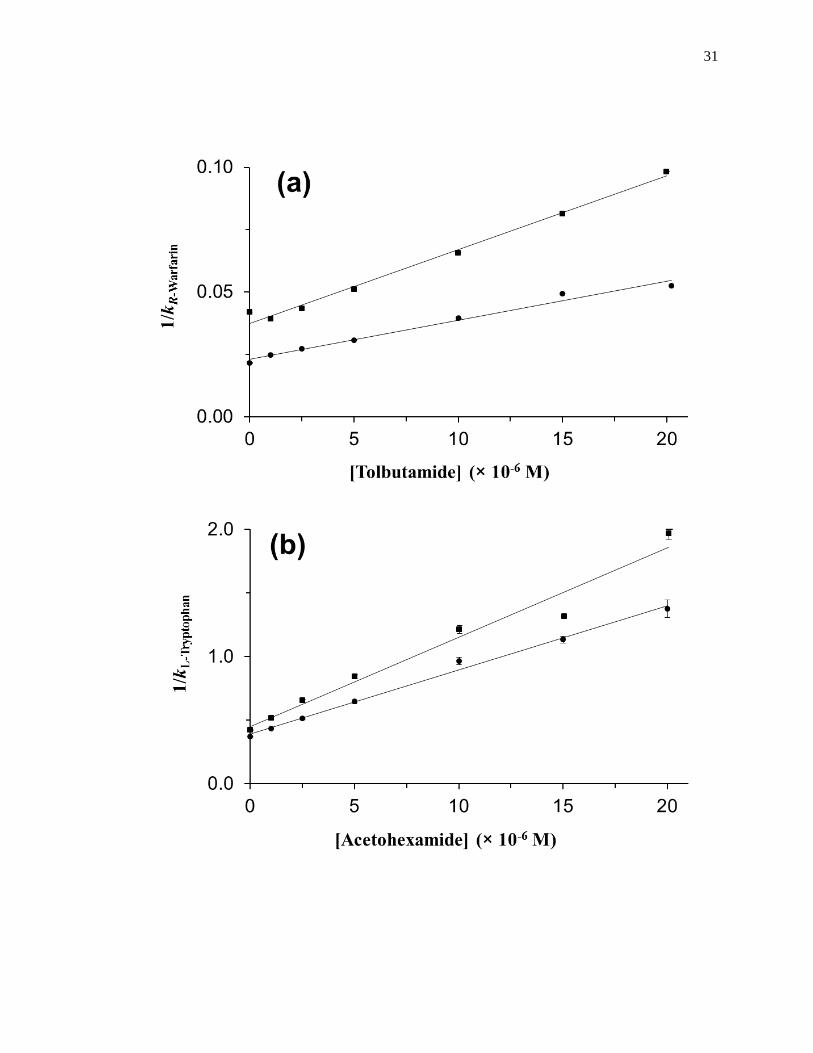
found by taking the inverse of the intercept [1]. Fig. 1-7(a) shows some frontal analysis
data that were examined by using a double-reciprocal plot. A non-linear plot fit to Eq. 1
can also be used to obtain the equilibrium constants and moles of sites that are involved
in a drug-protein interaction, as shown in Fig. 1-8(a).
Similar expressions to those in Eqs. 1 and 2 can be developed for systems that
involve multisite interactions.
𝑚𝐿𝑎𝑝𝑝 =𝑚𝐿1𝐾𝑎1[A]
(1+𝐾𝑎1[A])+
𝑚𝐿2𝐾𝑎2[A]
(1+𝐾𝑎2[A]) (3)
1
𝑚𝐿𝑎𝑝𝑝=
1+𝐾𝑎1[A]+𝛽2𝐾𝑎1[A]+𝛽2𝐾𝑎12[A]2
𝑚𝐿𝑡𝑜𝑡{(𝛼1+𝛽2−𝛼1𝛽2)𝐾𝑎1[A]+𝛽2𝐾𝑎12[A]2}
(4)
Examples for a two-site system are shown in Eqs. 3 and 4 [62,63]. In these equations,
Ka1 and Ka2 represent the association equilibrium constants for the highest and lowest
affinity binding sites for analyte A on the column, respectively, while mL1 and mL2 are the
moles of these two types of binding sites. In Eq. 4, β2 represents the ratio of the
21
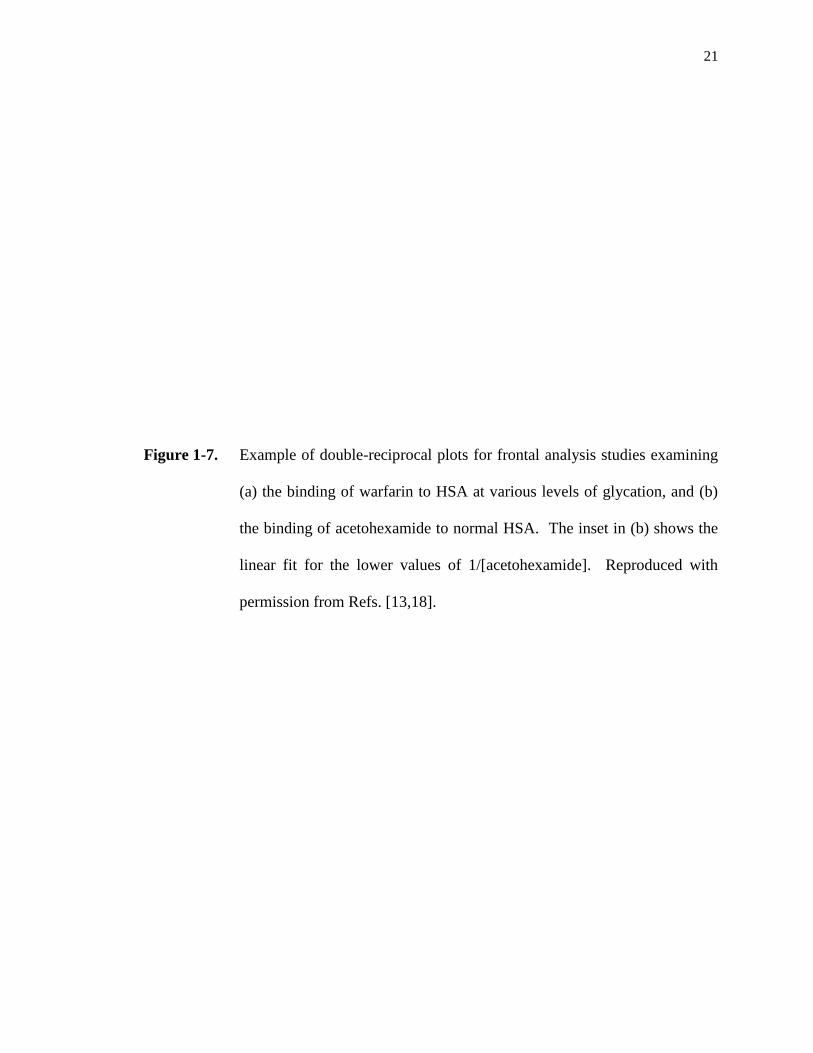
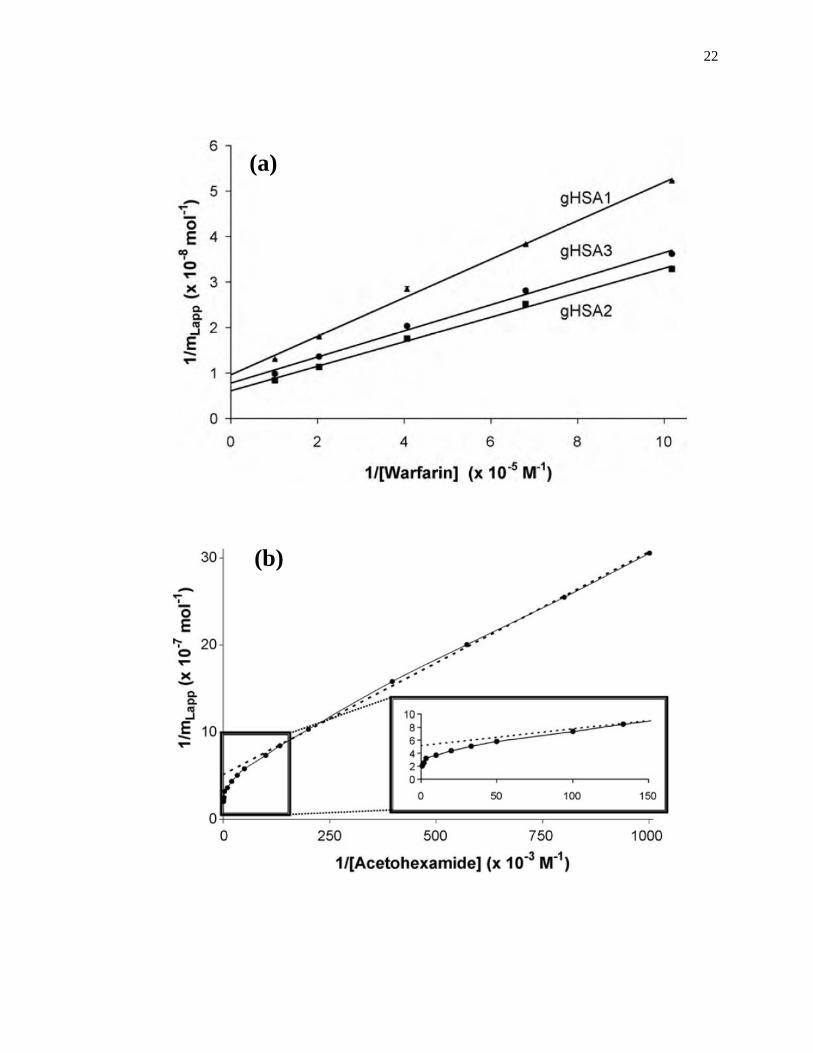
Figure 1-7. Example of double-reciprocal plots for frontal analysis studies examining
(a) the binding of warfarin to HSA at various levels of glycation, and (b)
the binding of acetohexamide to normal HSA. The inset in (b) shows the
linear fit for the lower values of 1/[acetohexamide]. Reproduced with
permission from Refs. [13,18].
22
(a)
(b)

23
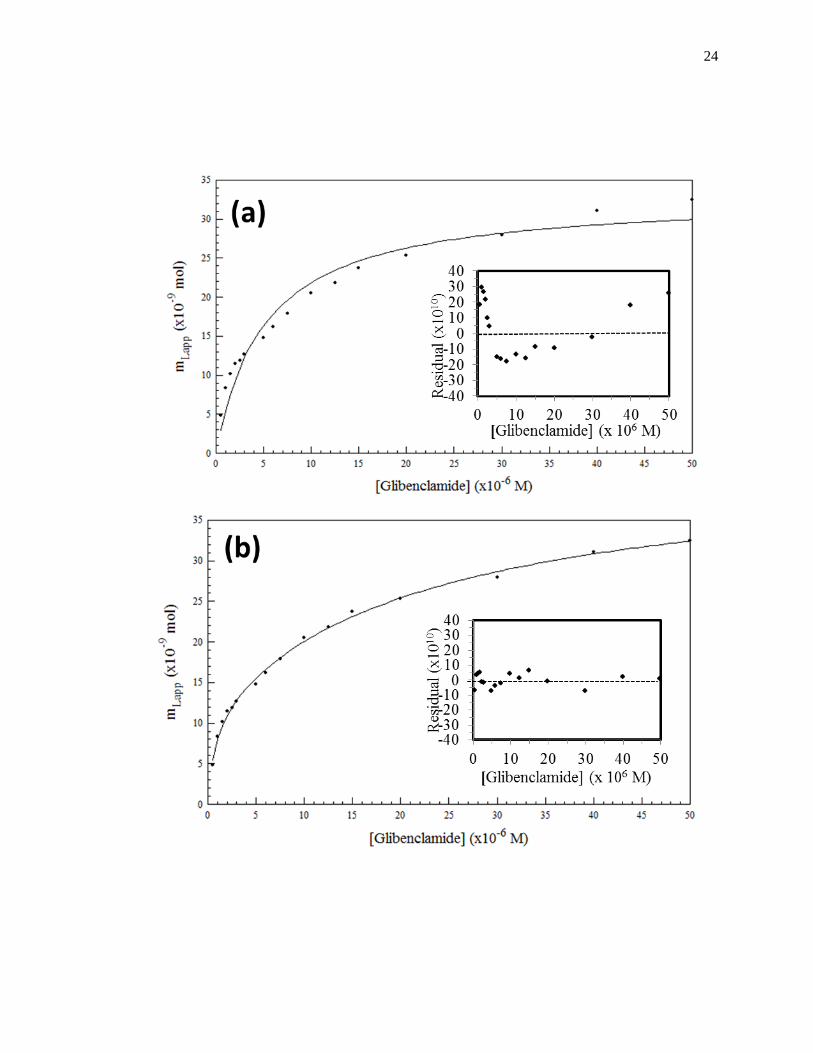
Figure 1-8. Fit of frontal analysis data obtained for glibenclamide on an HPAC
column containing normal HSA when analyzed by (a) a single-site binding
model based on Eq. 1 or (b) a two-site binding model based on Eq. 3. The
insets show the corresponding residual plots, where each point represents
the average of four experiments. Reproduced with permission from Ref.
[19].
24
25
association equilibrium constants for the low vs. high affinity sites, where β2 = Ka2/Ka1.
The fraction of all binding regions that are the high affinity sites is represented by α1,
where α1 = mL1/mLtot [1,25-27,62].
Fig. 1-7(b) shows an example of a double-reciprocal plot that was obtained for a
system with multisite binding [14]. Unlike a single-site system, a multisite interaction
would be expected to have deviations from a linear response at high analyte
concentrations (or low 1/[A] values), as shown in the inset of Fig. 1-7(b). However, at
low analyte concentrations (or high values of 1/[A]), the relationship of 1/mLapp vs. 1/[A]
does approach a linear response, as indicated by Eq. 5 [62,63].
lim[A]→01
𝑚𝐿𝑎𝑝𝑝=
1
𝑚𝐿𝑡𝑜𝑡(𝛼1+𝛽2−𝛼1𝛽2)𝐾𝑎1[A]+
𝛼1+𝛽22−𝛼1𝛽2
2
𝑚𝐿𝑡𝑜𝑡(𝛼1+𝛽2−𝛼1𝛽2)2 (5)
As the concentration of the analyte approaches zero and the value of 1/[A] increases, the
apparent value of Ka that is obtained from the slope and intercept of this linear region has
been shown to provide a good estimate for the association equilibrium constant of the
high affinity site in a multisite binding system [62,63]. A non-linear plot of the data
according to Eq. 3 can be used to provide information on the equilibrium constants and
moles of active binding for the two-sites of interaction, as shown in Fig. 1-8(b).
1.4. Zonal Elution Competition Studies
Another commonly used technique in HPAC is zonal elution competition studies,
which can also be used to examine the interactions between a drug and a protein
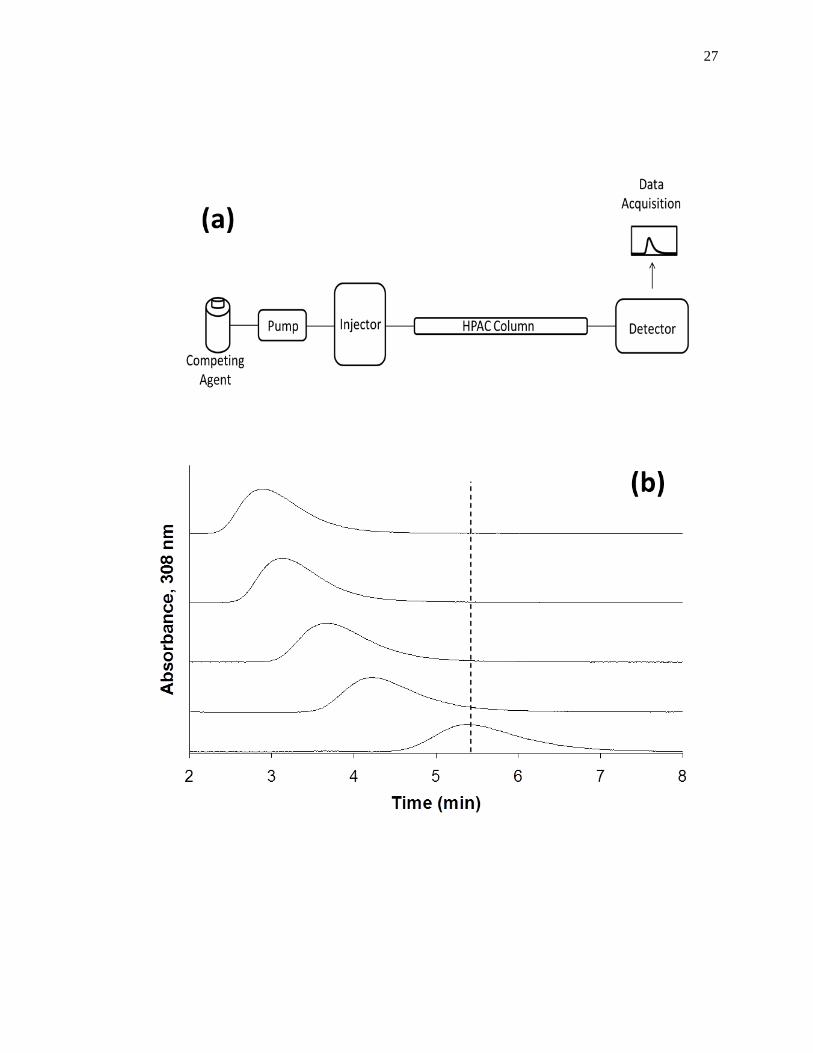
[1,25,61]. A typical chromatographic system that could be used for this type of
experiment is shown in Fig. 1-9(a). This type of system and experiment can be used to
obtain information on the site-specific binding of a drug with a protein or immobilized
agent, and on the type of competition this drug may have for other drugs or solutes at this
26
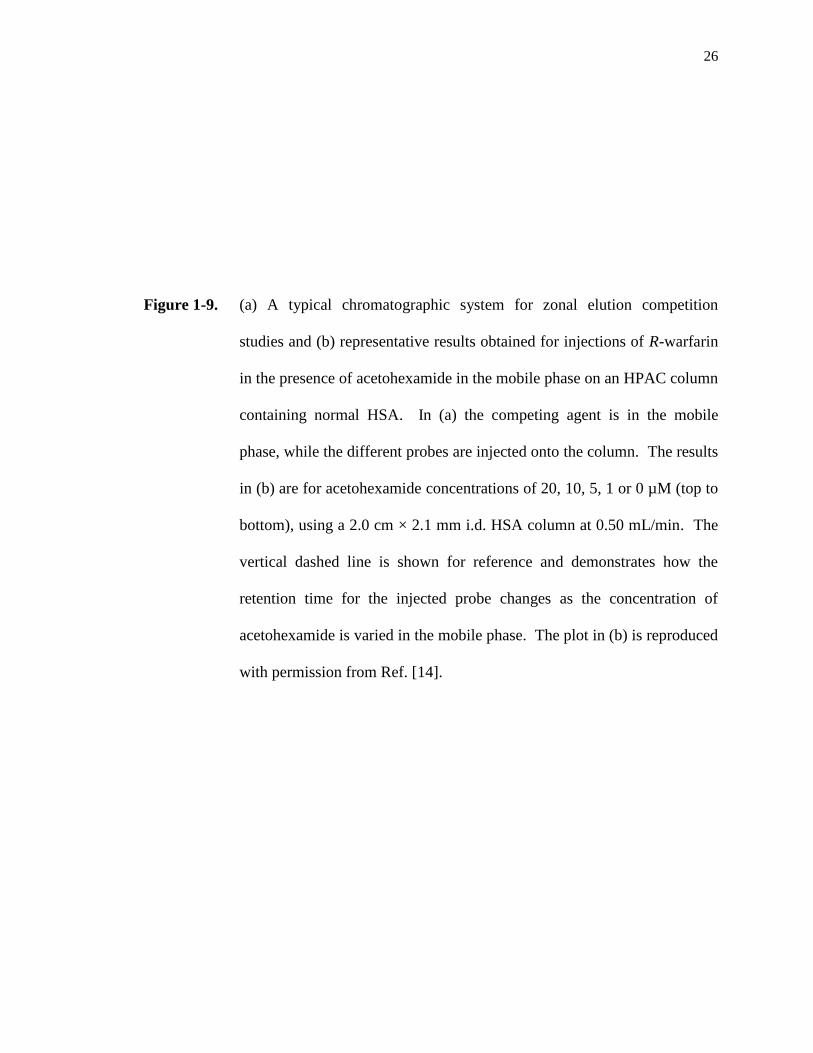
Figure 1-9. (a) A typical chromatographic system for zonal elution competition
studies and (b) representative results obtained for injections of R-warfarin
in the presence of acetohexamide in the mobile phase on an HPAC column
containing normal HSA. In (a) the competing agent is in the mobile
phase, while the different probes are injected onto the column. The results
in (b) are for acetohexamide concentrations of 20, 10, 5, 1 or 0 µM (top to
bottom), using a 2.0 cm × 2.1 mm i.d. HSA column at 0.50 mL/min. The
vertical dashed line is shown for reference and demonstrates how the
retention time for the injected probe changes as the concentration of
acetohexamide is varied in the mobile phase. The plot in (b) is reproduced
with permission from Ref. [14].
27
28
site [1,25-27]. A chromatographic system for zonal elution competition studies usually
contains at least one HPLC pump, an injector, a chromatographic column, and detector.
The pump functions to apply an injected sample of the probe or a mobile phase
containing a competing agent through the column under isocratic conditions. Additional
pumps may be used to allow for the automated application of various concentrations of
the competing agent, the use of more than one competing agent, or the use of gradient
elution for removal of a retained solute from the column. In these latter situations, a
valve can be included to switch between the various mobile phases or competing agent
solutions. Injection of the sample can be carried out with a manual system or by using an
autosampler [13-20]. Various detection modes can be utilized to monitor elution of the
probe, including absorbance, fluorescence, chemiluminescence or mass spectrometry
[61].
In a typical zonal elution competition study, a small plug of a site-specific probe
is injected onto the affinity column in the presence of a known concentration of a
competing agent in the mobile phase. Fig. 1-9(b) shows a typical zonal elution
competition experiment. The retention factor (k) for the injected probe is found by using
Eq. 6, where tR or VR are the measured retention time or retention volume of the probe,
and tM or VM represent the measured void time or void volume of a non-retained solute
[1].
𝑘 =𝑡𝑅−𝑡𝑀
𝑡𝑀=
𝑉𝑅−𝑉𝑀
𝑉𝑀 (6)
As shown in Fig. 1-9(b), as the concentration of the competition agent is
increased, the retention time for the probe decreased. A shift in the retention factor for
the probe as the concentration of the competing agent is varied could be used to
29
determine if direct or allosteric competition is occurring between the probe and the
competing agent at their sites of interaction on the column [45]. For example, if direct
competition is present for these agents at a single site on an immobilized protein, Eq. 7
can be used to describe the interaction of the probe and competing agent at their common
site of interaction.
1
𝑘=
𝐾𝑎I𝑉𝑀[I]
𝐾𝑎A𝑚𝐿+
𝑉𝑀
𝐾𝑎A𝑚𝐿 (7)
According to this equation, such a system should result in a linear relationship between
1/k for the probe and the concentration of the competition agent, [I] [1,25,61]. In this
equation, KaA and KaI represent the association equilibrium constants for the probe and
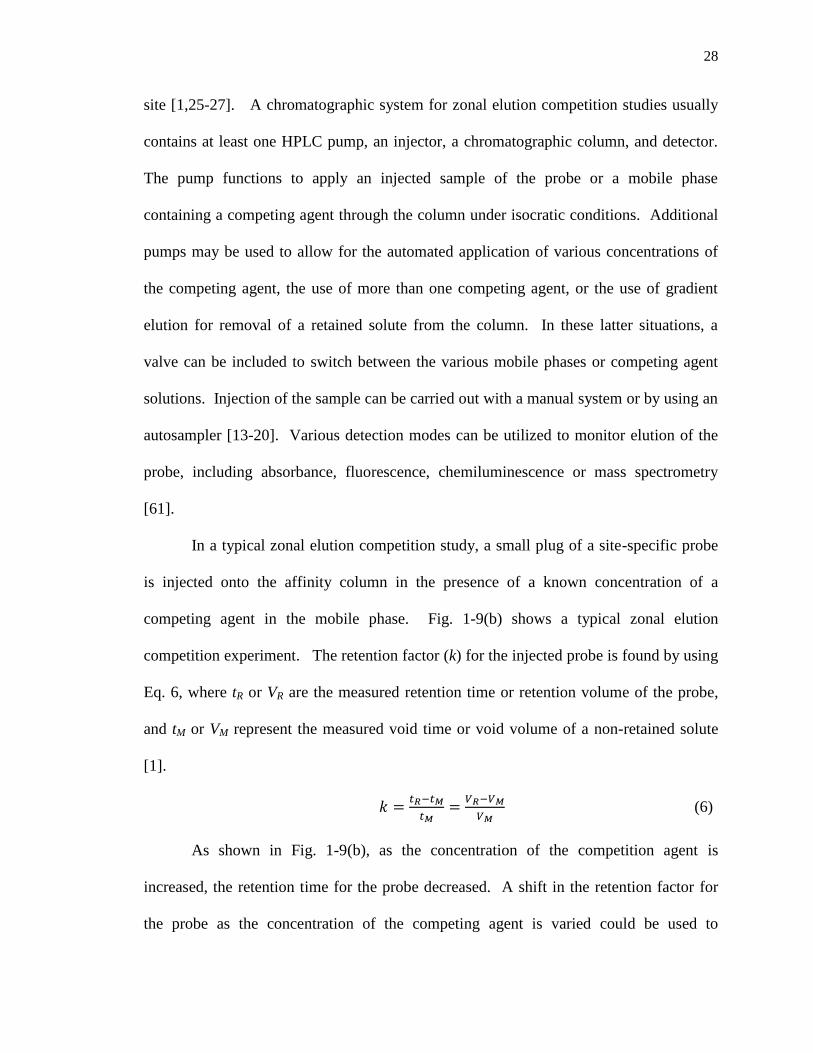
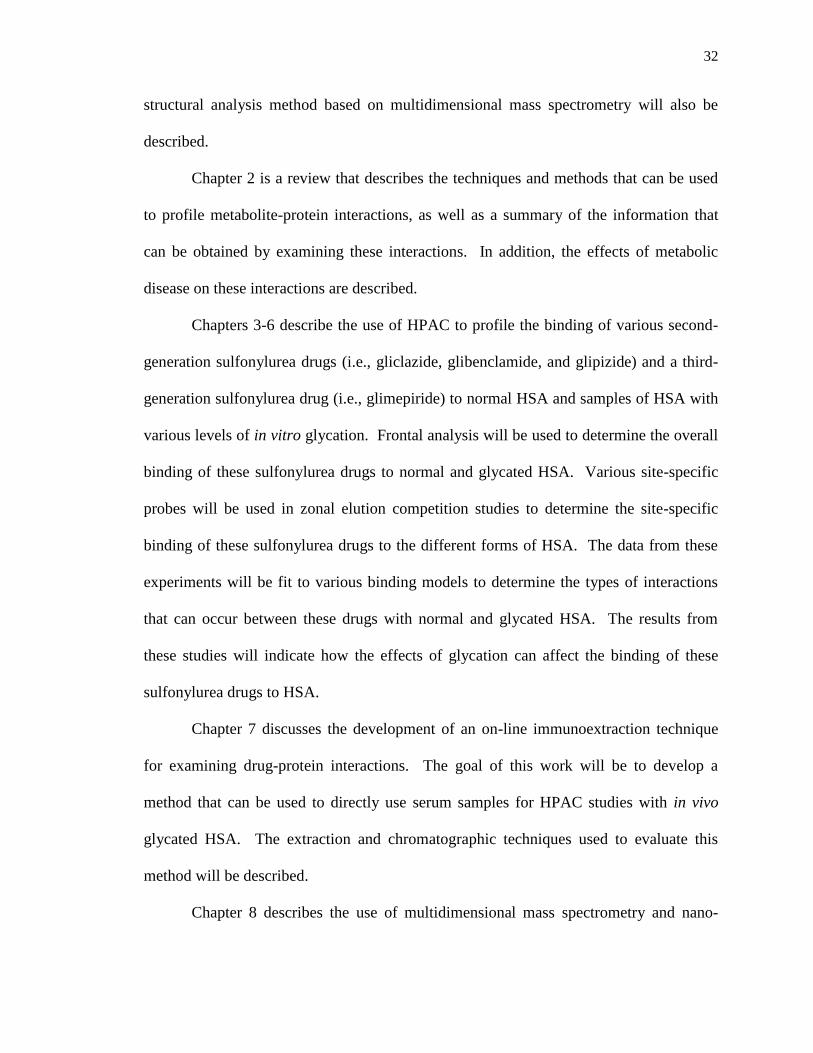
competing agent, respectively, and all other terms are as defined previously. Fig. 1-10
provides examples of plots that were obtained by using Eq. 7 [20]. The ratio of the slope
to the intercept for a linear fit to this plot can be used to determine the association
equilibrium constant for the competing agent at its site of competition with the probe
[1,61].
1.5 Overview of Dissertation
The purpose of this chapter was to provide the reader with an overview of the
methods in HPAC for examining the binding by sulfonylurea drugs and other solutes
with normal HSA and glycated HSA. The methods for preparing the chromatographic
supports and samples were discussed as well as the different chromatographic approaches
for using these columns, were considered. This dissertation will further discuss the
utilization and development of tools based on HPAC for the analysis of drug-protein
interactions with normal and glycated HSA. In addition to these HPAC methods, a
30
Figure 1-10. Analysis of results for zonal elution competition studies between (a)
tolbutamide and R-warfarin and (b) acetohexamide and L-tryptophan on
columns that contained in vivo glycated HSA samples. These results are
for two different in vivo samples of glycated HSA, as represented by (■)
and (●). Reproduced with permission from Ref. [20].
31
32
structural analysis method based on multidimensional mass spectrometry will also be
described.
Chapter 2 is a review that describes the techniques and methods that can be used
to profile metabolite-protein interactions, as well as a summary of the information that
can be obtained by examining these interactions. In addition, the effects of metabolic
disease on these interactions are described.
Chapters 3-6 describe the use of HPAC to profile the binding of various second-
generation sulfonylurea drugs (i.e., gliclazide, glibenclamide, and glipizide) and a third-
generation sulfonylurea drug (i.e., glimepiride) to normal HSA and samples of HSA with
various levels of in vitro glycation. Frontal analysis will be used to determine the overall
binding of these sulfonylurea drugs to normal and glycated HSA. Various site-specific
probes will be used in zonal elution competition studies to determine the site-specific
binding of these sulfonylurea drugs to the different forms of HSA. The data from these
experiments will be fit to various binding models to determine the types of interactions
that can occur between these drugs with normal and glycated HSA. The results from
these studies will indicate how the effects of glycation can affect the binding of these
sulfonylurea drugs to HSA.
Chapter 7 discusses the development of an on-line immunoextraction technique
for examining drug-protein interactions. The goal of this work will be to develop a
method that can be used to directly use serum samples for HPAC studies with in vivo
glycated HSA. The extraction and chromatographic techniques used to evaluate this
method will be described.
Chapter 8 describes the use of multidimensional mass spectrometry and nano-
33
electrospray ionization quadrupole time-of-flight mass spectrometry to qualitatively
examine the structure of HSA. Sequence analysis of the structure of HSA will be
conducted by this method, with the results being compared to those that were obtained in
previous studies involving matrix–assisted laser desorption/ionization time-of-flight mass
spectrometry. In addition to these results, analysis of several peptides on HSA will be
conducted through collision induced dissociation, in which these peptides could be used
for future work with glycated HSA.
1.6 References
1. D.S. Hage, High-performance affinity chromatography: a powerful tool for
studying serum protein binding, J. Chromatogr. B 768 (2002) 3-30.
2. X. Zheng, Z. Li, S.Beeram, M. Podariu, R. Matsuda, E.L. Pfaumiller, C.J. White
II, N. Carter, D.S. Hage, Analysis of biomolecular interactions using affinity
microcolumns: A review, J. Chromatogr. B 968 (2014) 49-63
3. K. Nakajou, H. Watanabe, U. Kragh-Hansen, T. Maruyama, M. Otagiri, The
effect of glycation on the structure, function and biological fate of human serum
albumin as revealed by recombinant mutants, Biochim. Biophys. Acta 1623
(2003) 88-97.
4. A. Barzegar, A.A. Moosavi-Movahedi, N. Sattarahmady, M.A. Hosseinpour-
Faizi, M. Aminbaksh, F. Ahmad, A.A. Saboury, M.R. Ganjali, P. Norouzi,
Spectroscopic studies of the effects of glycation of human serum albumin on L-trp
binding, Prot. Pep. Lett. 14 (2007) 13-18.
5. N. Okabe, N. Hashizume, Drug binding properties of glycosylated human serum
albumin as measured by fluorescence and circular dichroism, Biol. Pharm. Bull.
34
17 (1994) 16-21.
6. J. Baraka-Vidot, A. Guerrin-Dubourg, E. Bourdon, P. Rondeau, Impaired drug-
binding capacities of in vitro and in vivo glycated albumin, Biochimie 94 (2012)
1960-1967.
7. I. Syrovy, Glycation of albumin: reaction with glucose, fructose, galactose, ribose
or glyceraldehydes measured using four methods, J. Biochem. Biophys. Meth. 28
(1994) 115-121.
8. K. Koizumi, C. Ikeda, M. Ito, J. Suzuki, T. Kinoshita, K. Yasukawa, T. Hanai,
Influence of glycosylation on the drug binding of human serum albumin, Biomed.
Chromatogr. 12 (1998) 203-210.
9. G. Fitzpatrick, P.F. Duggan, The effect of non-enzymatic glycation on ligand
binding to human serum albumin, Biochem. Soc. Trans. 15 (1987) 267–268.
10. P.J. McNamara, R.A. Blouin, R.K. Brazzell, The protein binding of phenytoin,
propranolol, diazepam and AL01576 (an aldose reductase inhibitor) in human and
rat diabetic serum, Pharmaceut. Res. 5 (1988) 261-5.
11. J. Doucet, J. Fresel, G. Hue, N. Moore, Protein binding of digitoxin, valproate and
phenytoin in sera from diabetics, Eur. J. Clin. Pharmacol. 45 (1993) 577-579.
12. J.P. Bohney, R.C. Feldhoff, Effects of nonenzymatic glycosylation and fatty acids
on tryptophan binding to human serum albumin, Biochem. Pharmacol. 43 (1992)
1829-1834.
13. K.S. Joseph, D.S. Hage, The effects of glycation on the binding of human serum
albumin to warfarin and L-tryptophan, J. Pharm. Biomed. Anal. 53 (2010) 811-
818.
35
14. K.S. Joseph, J. Anguizola, A.J. Jackson, D.S. Hage, Chromatographic analysis of
acetohexamide binding to glycated human serum albumin, J. Chromatogr. B 878
(2010) 2775–81.
15. K.S. Joseph, J. Anguizola, D.S. Hage. Binding of tolbutamide to glycated human
serum albumin, J. Pharm. Biomed. Anal. 54 (2011) 426–432.
16. R. Matsuda, J. Anguizola, K.S. Joseph, D.S. Hage, High-performance affinity
chromatography and the analysis of drug interactions with modified proteins:
binding of gliclazide with glycated human serum albumin, Anal. Bioanal. Chem.
401 (2011) 2811-2819.
17. A.J. Jackson, J. Anguizola, E.L. Pfaunmiller, D.S. Hage, Use of entrapment and
high-performance affinity chromatography to compare the binding of drugs and
site-specific probes with normal and glycated human serum albumin, Anal.
Bioanal. Chem. 405 (2013) 5833-5841.
18. K.S. Joseph, D.S. Hage, Characterization of the binding of sulfonylurea drugs to
HSA by high-performance affinity chromatography, J. Chromatogr. B 878 (2010)
1590-1598.
19. R. Matsuda, J. Anguizola, K.S. Joseph, D.S. Hage, Analysis of drug interactions
with modified proteins by high-performance affinity chromatography: binding of
glibenclamide to normal and glycated human serum albumin, J. Chromatogr. A
1265 (2012) 114-122.
20. J. Anguizola, K.S. Joseph, O.S. Barnaby, R. Matsuda, G. Alvarado, W. Clarke,
R.L. Cerny, D.S. Hage, Development of affinity microcolumns for drug-protein
binding studies in personalized medicine: interactions of sulfonylurea drugs with
36
in vivo glycated human serum albumin, Anal. Chem. 85 (2013) 4453-4460.
21. D.S. Hage, S.A. Tweed, Recent advances in chromatographic and electrophoretic
methods for the study of drug-protein interactions, J. Chromatogr. B 699 (1997)
499-525.
22. N.H.H. Heegaard, C. Schou, Affinity ligands in capillary electrophoresis, In
Handbook of Affinity Chromatography; D.S. Hage (Ed.), Taylor & Francis, New
York, 2010, Chap. 4.
23. T. Hoffmann, M.M. Martin, CE-ESI-MS/MS as a rapid screening tool for the
comparison of protein-ligand interactions, Electrophoresis 31 (2010) 1248-1255.
24. D.S. Hage, Chromatographic and electrophoretic studies of protein binding to
chiral solutes, J. Chromatogr. B 906 (2001) 459-481.
25. D.S. Hage, J.A. Anguizola, A.J. Jackson, R. Matsuda, E. Papastavros, E.
Pfaunmiller, Z. Tong, J. Vargas-Badilla, MJ. Yoo, X. Zheng, Chromatographic
analysis of drug interactions in the serum proteome, Anal. Methods 3 (2011)
1449-1460.
26. D.S. Hage, Affinity chromatography: a review of clinical applications, Clin.
Chem. 45 (1999) 593-615.
27. D.S. Hage, Affinity chromatography, In Encyclopedia of Analytical Chemistry;
R.A. Meyers (Ed.), Wiley, New York, 2012.
28. J. Turkova, Affinity chromatography, Elsevier, Amsterdam, 1978.
29. W.H. Scouten, Bioselective adsorption on inert matrices, In Affinity
Chromatography Wiley, New York, 1985.
30. H. Schott, Template chromatography of nucleic acids and proteins, In Affinity
37
Chromatoraphy, Dekker, New York, 1985.
31. I. Parikh, P. Cuatrecasas, Affinity chromatography, Chem. Eng. News 63 (1985)
17-29.
32. R.R. Walters, Affinity chromatography, Anal. Chem. 57 (1985) AA1099-
AA1114.
33. P. Mohr, K. Pommerening, Practical and theoretical aspects, In Affinity
Chromatography, Dekker, New York, 1985.
34. K. Jones, Affinity chromatography – an overview, Anal. Proceed. 28 (1991) 143-
144.
35. G.T. Hermanson, A.K. Mallia, P.K. Smith, Immobilized Affinity Ligand
Techniques, Academic Press, San Diego, 1992.
36. T.T. Ngo (Ed.), Molecular Interactions in Bioseparations, Plenum Press, New
York, 1993.
37. D.S. Hage, Affinity Chromatography, In Handbook of HPLC; E. Katz, R.
Eksteen, N. Miller (Eds.), Marcel Dekker, New York, Chap. 13.
38. I.M. Chaiken (Ed.), Analytical Affinity Chromatography, CRC Press, Boca
Raton, 1987.
39. J. E. Schiel, D.S. Hage, Kinetic studies of biological interactions by affinity
chromatography, J. Sep. Sci. 32 (2009) 1507-1522.
40. R. Matsuda, C. Bi, J. Anguizola, M. Sobansky, E. Rodriguez, J. Vargas-Badilla,
X. Zheng, B. Hage, D.S. Hage, Studies of metabolite protein interactions: a
review, J. Chromatogr. B 968 (2014) 49-63
41. D.L. Nelson, M.M. Cox (Eds.), in: Lehninger Principles of Biochemistry, 6th ed.
38
W.H. Freeman Publishers, New York, 2005.
42. G. Colmenarejo, In silico prediction of drug-binding strengths to human serum
albumin, Med. Res. Rev. 23 (2003) 275–301.
43. D.L. Mendez, R.A. Jensen, L.A. McElroy, J.M. Pena, R.M. Esquerra, The effect
of non-enzymatic glycation on the unfolding of human serum albumin, Arch.
Biochem. Biophys. 444 (2005) 92–99.
44. N. Iberg, R. Fluckiger, Nonenzymatic glycosylation of albumin in vivo:
identification of multiple glycosylated sites, J. Biol. Chem. 261 (1986) 13542-
13545.
45. R. Matsuda, S. Kye, J. Anguizola, D.S. Hage, Studies of drug interactions with
glycated human serum albumin by high-performance affinity chromatography,
Rev. Anal. Chem. 33 (2014) 79-94
46. A. Lapolla, D. Fedele, R. Reitano, L. Bonfante, M. Guizzo, R. Seraglia, M
Tubaro, P. Traldi, Mass spectrometric study of in vivo production of advanced
glycation end-products/peptides, J. Mass Spectrom. 40 (2005) 969–972.
47. A. Lapolla, D. Fedele, R. Seraglia, P. Traldi, The role of mass spectrometry in the
study of non-enzymatic protein glycation in diabetes: an update, Mass Spectrom.
Rev. 25 (2006) 775–797.
48. J. Anguizola, R. Matsuda, O.S. Barnaby, K.S. Joseph, C. Wa, E. Debolt, M.
Koke, D.S. Hage, Review: glycation of human serum albumin, Clin. Chim. Acta
425 (2013) 64–76
49. O.S. Barnaby, C. Wa, R.L. Cerny, W. Clarke, D.S. Hage, Quantitative analysis of
glycation sites on human serum labeling using 16
O/18
O labeling and matrix-
39
assisted laser desorption/ionization time-of-flight mass spectrometry, Clin. Chim.
Acta 411 (2010) 1102–1110.
50. O.S. Barnaby, R.L. Cerny, W. Clarke, D.S. Hage. Comparison of modification
sites formed on human serum albumin at various stages of glycation, Clin. Chim.
Acta 412 (2011) 277-285.
51. T. Peters, Jr. All About Albumin: Biochemistry, Genetics, and Medical
Applications. Academic Press, San Diego, 1996.
52. H.V. Roohk, A.R. Zaidi, A review of glycated albumin as an intermediate
glycation index for controlling diabetes. J. Diabetes Sci. Technol. 2 (2008) 1114-
1121.
53. R. Malik, D.S. Hage, Affinity monolith chromatography, J. Sep. Sci. 12 (2006)
1686-1704.
54. E.L. Pfaunmiller, M.L. Paulemond, C.M. Dupper, D.S. Hage, Affinity monolith
chromatography: a review of principles and recent analytical applications, Anal.
Bioanal. Chem. 405 (2013) 2133-2145
55. E. Pfaunmiller, A.C. Moser, D.S. Hage, Biointeraction analysis of immobilized
antibodies and related agents by high-performance immunoaffinity
chromatography, Methods 56 (2012) 130-135.
56. R.R. Walters, High-performance affinity chromatography: pore-size effects, .J.
Chromatogr. A 249 (1982) 19-28.
57. P.O. Larsson, High-performance liquid affinity chromatography, Methods
Enzymol. 104 (1984) 212-223.
58. Wa, C., Cerny, R.L., and Hage, D.S. (2006) Identification and quantitative studies
40
on protein immobilization sites by stable isotope labeling and mass spectrometry.
Anal. Chem. 78, 7967-7977.
59. A. Lapolla, D. Fedele, R. Reitano, N.C. Arico, R. Seraglia, P. Traldi, E. Marotta,
R. Tonani, Enzymatic digestion and mass spectrometry in the study of advance
glycation end products/peptides. J. Am. Soc. Mass Spectrom. 25 (2004) 496-509.
60. K.A. Ney, K.J. Colley, S.V. Pizzo, The standardization of the thiobarbituric acid
assay for nonenzymatic glucosylation of human serum albumin, Anal. Biochem.
118 (1981) 294-300
61. D.S. Hage, J. Chen, Quantitative affinity chromatography: practical aspects, In
Handbook of Affinity Chromatography; D.S. Hage (Ed.), Taylor & Francis, New
York, 2010, Chap. 22.
62. S.A. Tweed, B. Loun, D.S. Hage, Effects of ligand heterogeneity in the
characterization of affinity columns by frontal analysis, Anal. Chem. 69 (1997)
4790-4798.
63. Z. Tong, J.E. Schiel, E Papastavros, C.M. Ohnmacht, Q.R. Smith, D.S. Hage,
Kinetic studies of drug-protein interactions by using peak profiling and high-
performance affinity chromatography: examination of multi-site interactions of
drugs with human serum albumin columns, J. Chromatogr. A 1218 (2011) 2065-
2071.
41
CHAPTER 2:
METABOLITE-PROTEIN INTERACTIONS
Note: Portions of this chapter have appeared in R. Matsuda, C. Bi, J. Anguizola, M.
Sobansky, E. Rodriguez, J. Vargas-Badilla, X. Zheng, B. Hage, D.S. Hage, “Studies of
metabolite protein interactions: A review”, J. Chromatogr. B 968 (2014) 49-63.
2.1 Introduction
Metabolomics is a field that involves the study of low mass compounds (i.e.,
metabolites) that are produced through metabolic processes [1,2]. Metabolites are part
of a collection of chemicals known as the “metabolome”, which can include small
molecules that are found in cells, tissues, organs, or biological fluids. The area of
metabolomics is of interest because the identity and concentration of metabolites can
provide information about cellular activity and can be directly related to processes such
as protein and gene expression [1-3]. This means that metabolomics can provide
information on the phenotypes of individuals at the molecular level [3]. In addition, the
characterization and examination of metabolites could lead to new discoveries in
biomedical research and personalized medicine [1,3].
Research in metabolomics began in the late 1990s and early 2000s, with the
emphasis at that time being on the effects of different metabolites on the gene expression
of bacteria and yeast [1]. The first examples of metabolomic studies utilized two-
dimensional thin-layer chromatography separations to characterize metabolites in
samples. This provided researchers with evidence that variation in the concentrations of
metabolites can affect cellular activity [1,4-6]. Further progress in the area of analytical
methods such as structural characterization and separation methods has resulted in the
42
development of new instruments and techniques that can be used to provide high
resolution information and data from complex samples such as tissues and cells [1,2].
Research in metabolomics can involve either targeted or untargeted approaches
[7]. In a targeted approach, researchers use qualitative techniques such as nuclear
magnetic resonance (NMR) spectroscopy and mass spectrometry (MS) for the
identification, quantification, and structural characterization of specific metabolites. This
information can be used to examine specific classes of metabolites and to provide
information on the biochemical pathways that are involved in metabolism [2]. In an
untargeted approach, scientists use global profiling to analyze the group of chemicals in a
metabolome as a whole. This second approach is less specific and sensitive than the
targeted approach but allows for the highest possible coverage of the metabolites that
may be involved in biochemical pathways [7].
A significant amount of recent research has been devoted to metabolic profiling,
or the identification and measurement of the different metabolites that are present and
produced in the metabolome [8]. However, it is also important to consider the
interactions that occur between metabolites and biological agents, such as the binding of
cofactors to enzymes, hormones to receptors, and drugs or their metabolites to proteins
[8]. Information on these interactions can be combined with the structural data to provide
a better understanding of the regulatory networks and connections in biological pathways.
Such information, in turn, could provide a better understanding of how healthy and
disease states differ at the molecular level and could provide vital data that can be used
for pharmaceutical development [7,9].
This chapter will look at previous studies that have examined biological
43
interactions as related to metabolites and proteins as binding agents. This will include an
overview of the various methods and techniques that have been used in this work to study
metabolite-protein interactions. A summary will also be provided of the different types
of metabolite-protein binding interactions that have been investigated with these
approaches. In addition, the possible effects that metabolic diseases may have on these
interactions will be considered.
2.2 Techniques for examining metabolite-protein interactions
The characterization of metabolite-protein interactions can provide a better
understanding in clinical diagnostics of the cellular activity and the biochemical
pathways that are present in various medical conditions [1-3,9]. There are many methods
that can be used to examine the binding of metabolites with proteins. These methods
may involve the direct examination of binding that occurs between proteins and low mass
drugs, hormones and their metabolites, or may involve an examination of the free
concentrations of these molecules [9-12]. The approaches that are used for this purpose
can be divided into three categories: in vitro, in vivo and in silico techniques [9,11-46].
2.2.1 In vitro methods for studying metabolite-protein interactions
In vitro methods are the most popular techniques used to characterize metabolite-
protein interactions. This approach involves the use of standard, well-controlled
conditions and reagents that are used in the laboratory to mimic conditions seen in
biological systems. To examine metabolite-protein interactions, in vitro methods may
use a binding assay (e.g., one based on ultrafiltration or equilibrium dialysis) to examine
an interaction or to identify the chemicals that are involved in this process [9]. This
44
approach can provide information such as the strength of the interaction, as well as the
thermodynamics and kinetics of binding and possible conformational changes that occur
as a result of the interaction [13-15]. Alternatively, an in vitro study may make use of a
method that directly examines the structure of a protein and a bound metabolite, such as
occurs in X-ray crystallography or NMR spectroscopy [1,16-20]. Other methods may
examine the protein-metabolite complex, as demonstrated with mass spectrometry [24-
29].
There are many in vitro approaches that can be used to examine the binding of
proteins with small molecules and their metabolites. For instance, radiometry and
fluorimetry can be used with a binding assay by employing labeled metabolites that
contain either a radioisotopic label or fluorophore, respectively [10,21-23]. These labeled
metabolites are then incubated with proteins and the signal that is produced from the label
is measured, such as through a displacement assay or a proteome microarray [10,23].
Radioisotopic labeling has been applied to enzymes to determine their activity in
metabolomic reactions [9]. An example involved the screening of potential inhibitors for
an enzyme, in which the substrate was radioactively labeled and the resulting metabolite
profiles were analyzed and measured [21]. Fluorescence labeling can provide similar
results to radiolabeling; however, this method can also be used to identify and determine
the location of a binding site for a metabolite on a protein, such as by observing the
displacement of specific probes that are bound to known locations on a protein [10].
Surface plasmon resonance (SPR) and calorimetry are two other methods that can
provide information on the strength of protein-metabolite binding and the
thermodynamics or kinetics of this interaction [13-15]. Studies based on SPR utilize an
45
immobilized protein on a sensor chip, in which changes in the resonance energy (e.g.,
from binding of the protein with a target) are detected [9]. The change in this signal is
related to the mass of the bound metabolites and can be used to determine the equilibrium
constants for this process or, if examined over time, the association and dissociation
kinetics that occur between the metabolite and protein [9]. The reaction between a
metabolite and protein can result in heat being absorbed or given off [9,13]. Calorimetry
can be used to measure the overall enthalpy of the binding reaction between a metabolite
and a protein [13].
NMR spectroscopy and X-ray crystallography are two tools that have been used
to characterize the structures of metabolite-protein complexes [9,16-20]. NMR
spectroscopy has often been used in recent years for characterizing and identifying
metabolites in biological samples, but this method can also be used to examine
conformational changes that occur during the binding of metabolites with proteins [18-
20]. X-Ray crystallography can also give structural information on such interactions by
providing detailed information on the binding sites and active sites for hormones, drugs
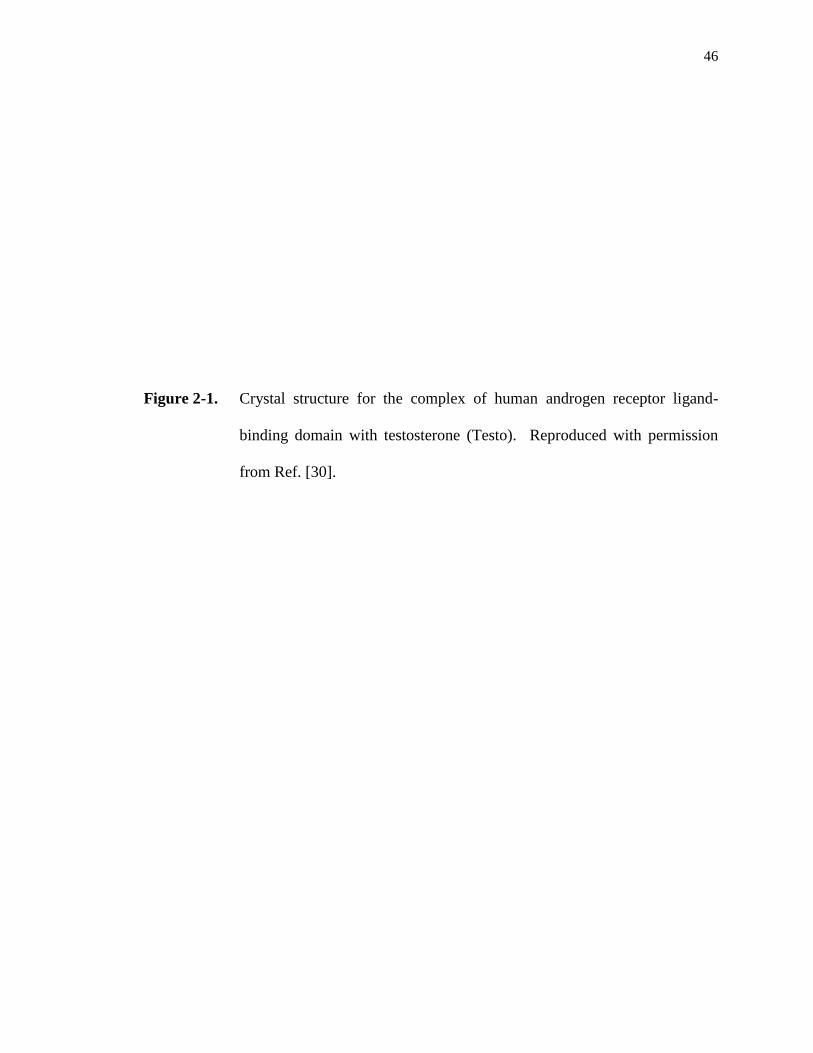
and their metabolites or related compounds on proteins and enzymes [16-17], as is
illustrated in Fig. 2-1 [30].
Mass spectrometry can not only be used as a tool for analyzing the structure and
identity of metabolites, but it can be used to analyze metabolite-protein interactions in
which information about enzymatic processes or binding by small molecules is generated
[9]. Experiments utilizing various types of mass spectrometry, such as quadrupole mass
spectrometry or matrix-assisted laser desorption/ionization time-of-flight mass
spectrometry (MALDI-TOF MS), have allowed for analysis of the reaction kinetics and
46
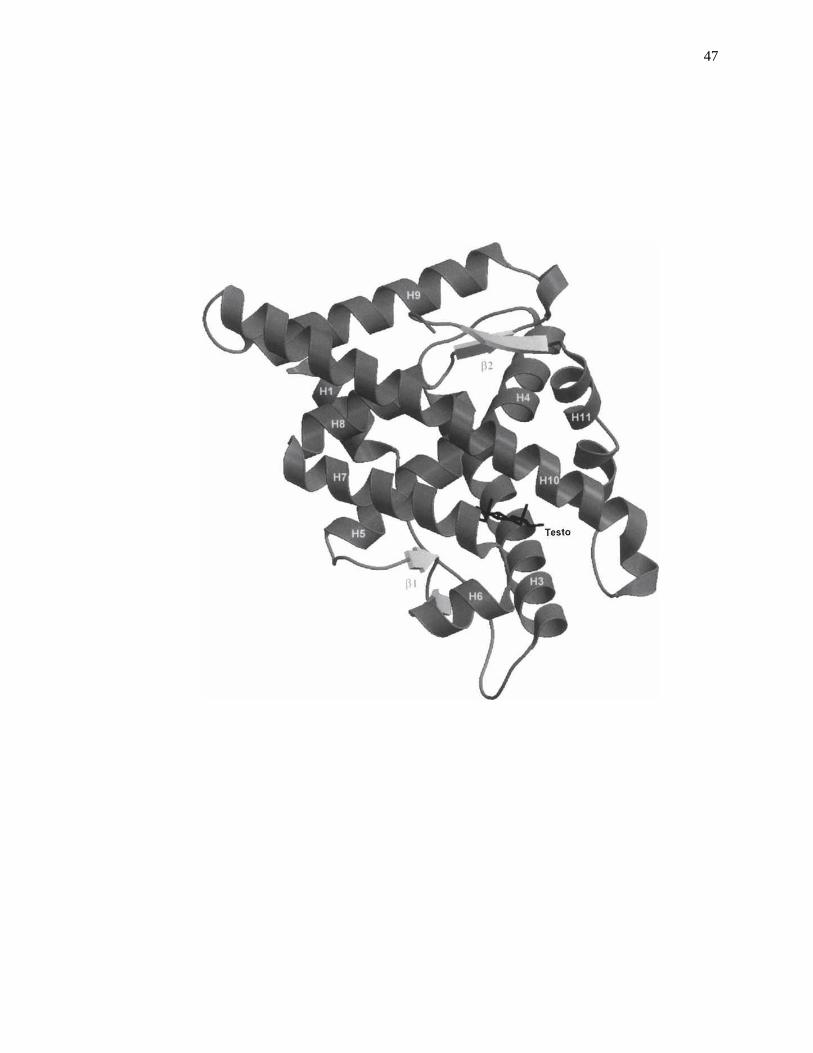
Figure 2-1. Crystal structure for the complex of human androgen receptor ligand-
binding domain with testosterone (Testo). Reproduced with permission
from Ref. [30].
47
48
determination of the products produced from enzyme-substrate reactions [7,24,25].
Further analysis through high resolution mass spectrometers (e.g., an orbitrap or Fourier
transform ion cyclotron resonance mass spectrometry) has resulted in the identification of
intermediate steps in enzymatic reactions from an accurate analysis of enzymatic
activities [26-29].
Various separation techniques can also be used to examine metabolite-protein
interactions. Examples of traditional methods often utilized for this purpose are
equilibrium dialysis, ultrafiltration, and ultracentrifugation [9,31-33]. Equilibrium
dialysis and ultrafiltration can be used to separate protein-bound metabolites from free
metabolites through the use of a semipermeable membrane. These methods are
commonly applied to determine the affinity of proteins with drugs and small solutes, but
can also be employed to examine the interactions of metabolites with proteins [31].
Ultracentrifugation can be used to provide a similar separation of free and protein-bound
forms of a metabolite by utilizing a gravitational field in combination with a density
gradient to separate these fractions [9,32]. However, each of these methods have
limitations, such as difficulties in detecting small free solute fractions, undesirable
adsorption of solutes onto the membrane (e.g., in ultrafiltration or equilibrium dialysis),
or overestimation of the free fraction due to release of the bound solute during the
separation process [33].
Various chromatographic techniques have also been employed to separate free
and protein-bound metabolite fractions [34]. As an example, size exclusion
chromatography (SEC) can be applied to this type of analysis when metabolite-protein
complexes and free metabolites have a sufficiently large difference in size. In this type of
49
study, metabolites or small molecules are incubated with a protein, and SEC can be used
to remove the small molecules from proteins [34]. Such a method can be used for either
the isolation and preparation of metabolite-protein complexes, which can then be
analyzed by other methods, or can be used in binding studies to provide information on
the association equilibrium constant for a metabolite-protein interaction [8,34,35].
Affinity chromatography and high-performance affinity chromatography (HPAC)
have also become popular for analyzing solute-protein interactions [35-38]. These
affinity methods have an immobilized biological molecule, such as a protein, as the
stationary phase. When used in a low-performance setting, affinity chromatography can
be used in a similar way as SEC in that it can be used for preparation and purification.
The use of more rigid and efficient supports in HPAC allows this approach to be used as
a rapid and relatively high-throughput method for providing information about solute-
protein interactions. This information can include data on the affinity, thermodynamics
and kinetics of these processes, as well as information on the types of sites that are
involved in the interaction (see Fig. 2-2) [35-39].
Capillary electrophoresis (CE) is another separation method that can be used to
examine metabolite-protein binding [9,37,40,41]. One way this method can be used is to
separate the free and bound metabolites through the differences in their size-to-charge
ratios. This approach can be utilized to determine the affinity of metabolite-protein
binding or combined with other methods such as mass spectrometry to examine the free
and bound metabolites [41]. One form of CE is affinity capillary electrophoresis (ACE),
in which a biological molecule such as a protein is used as a running buffer additive, thus
making it possible to obtain data on the interactions of solute components with this
50
Figure 2-2. Example of a competition study using high-performance affinity
chromatography to examine the interactions of an injected site-selective
probe with a solute that is present at a known concentration in the mobile
phase. This example shows the change in the retention factor (k) that was
measured for R-warfarin as a probe for Sudlow site I of human serum
albumin (HSA) in the presence of various concentrations of tolbutamide as
a competing agent. These results were obtained for columns that
contained two clinical samples of HSA that had different levels of
modification due to glycation. Adapted with permission from Ref. [39].
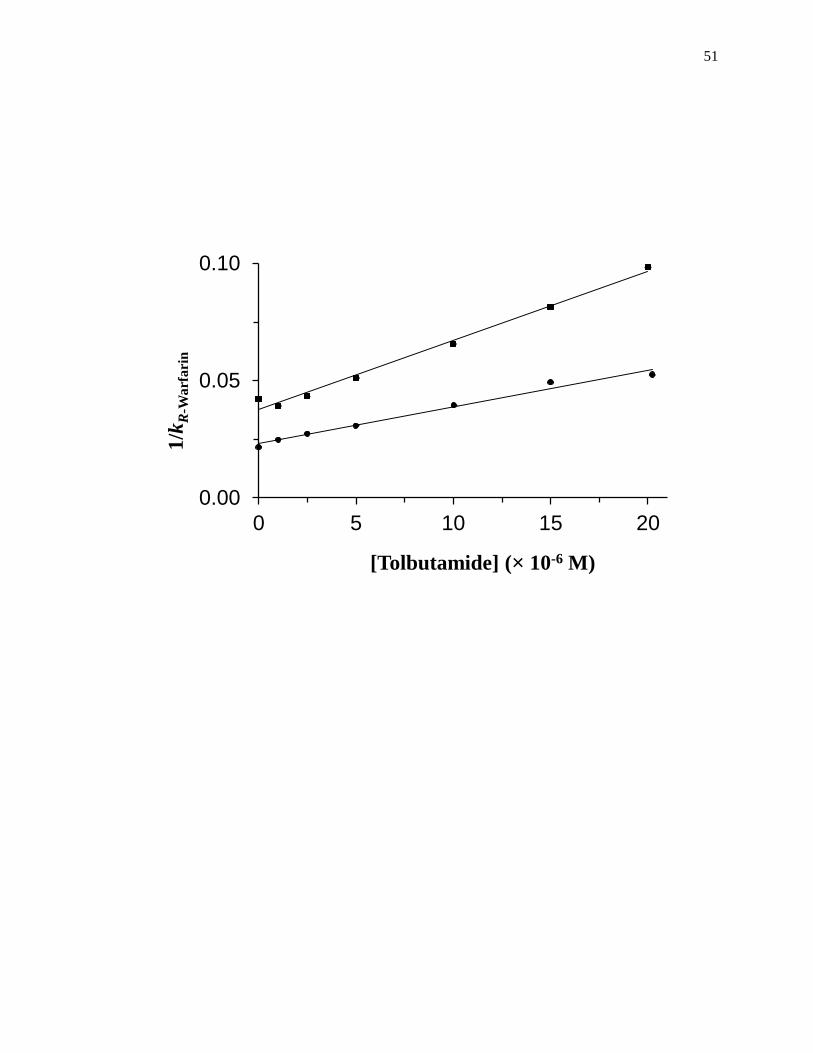
51
0.00
0.05
0.10
0 5 10 15 20
1/k
R-W
arfa
rin
[Tolbutamide] (× 10-6 M)
52
additive [40]. Like HPAC, ACE is a relatively fast method and can be used with small
amounts of sample for the screening or analysis of metabolite-protein interactions
[38,40].
2.2.2 In vivo methods for studying metabolite-protein interactions
Although in vitro methods can provide detailed information about metabolite-
protein interactions, in vivo analysis can provide a better description for the metabolite-
protein interactions that occur within a biological sample [8,9]. This is particularly true
in a situation where a protein may undergo post-translational modifications that result in
changes in the protein’s interactions with solutes such as drugs and their metabolites [9].
In vivo methods are often similar to techniques used for in vitro studies but must be able
to work with complex samples. In many cases, clinical samples from patients can be
obtained and analyzed through approaches such as labeling, NMR or MS structural
characterization, and affinity separation methods. By utilizing in vivo studies, researchers
are better able to understand the effect of disease states on metabolite-protein
interactions, as well as related biochemical pathways and regulatory processes [9,39].
2.2.3 In silico methods for studying metabolite-protein interactions
Another area of examining metabolite-protein interactions is through in silico
tools [9]. These methods utilize computational schemes to determine the docking
configurations of a metabolite’s binding sites on proteins or enzymes, as obtained
through the use of molecular modeling or quantum mechanics [42,43]. This approach
can provide information about the structure of a metabolite-protein complex at a given
binding site through an analysis of the most thermodynamically-favorable configurations.
53
These computational methods can result in docking predictions that have a 1.5 to 2 Å
accuracy with success rates of 70-80% [43]. If the location of a binding site is not known
in advance, a homology method can be used to predict binding sites on a protein through
the use of the protein’s amino acid sequence and chemical structures of the metabolites
[44]. This method can allow for accurate prediction of ligand-binding proteins and
enable the development of a database for these peptide sequences selected for binding to
different metabolites [9,45]. These in silico methods can be combined with in vitro
analysis to optimize the structural characterization of metabolite-protein interactions, as
demonstrated in NMR experiments [46].
2.3 Interactions of proteins with hormones and related metabolites
Hormones are chemicals that are secreted by endocrine glands. Hormones play a
significant role in many regulation pathways, including metabolism, growth and
development [47,48]. Examples of low mass hormones include various types of steroids
(e.g., estrogens and testosterone) or thyroid hormones (e.g., thyroxine) [49-52]. As these
chemicals enter the circulation, they are carried to their target tissue or organ to produce
an effect. Many low mass hormones are transported in the bloodstream through their
binding to serum proteins [51,52]. These transport proteins may bind to a broad range of
hormones and other targets, as occurs for human serum albumin (HSA), or they may be
specific for a given hormone or group of hormones, as is the case for thyroxine-binding
globulin (TBG) [49]. Once it has been delivered to its target tissue or organ, the hormone
can then bind with a receptor to produce an effect. This section will consider interaction
studies that have been reported for several types of hormones or their metabolites with
serum proteins and hormone receptors.
54
2.3.1 Thyroid hormones
Thyroid hormones are a group of iodothyronine compounds that are responsible
for metabolism, growth, development, and the regulation of iodine within the body [47].
Many of these hormones are bound in the bloodstream to both HSA through low-to-
moderate affinity interactions and to transthyretin or TBG through higher affinity
processes [48,49]. An important compound in this group is the hormone L-thyroxine (L-
3,5,3’,5’-tetraiodothyronine, or T4), which can be metabolized to form L-3,5,3’-
triiodothyronine (T3) [53,54]. Both T4 and T3 are actively involved in regulatory
processes and are more than 99% bound to transport proteins in blood [49,53,54].
Several studies have explored the structural differences between thyroid
hormones and related compounds as they bind to serum proteins or cell surface receptors
[53-55]. One report utilized HPAC to characterize the binding of T4, T3 and related
compounds with HSA; the results were used to examine both the affinity constants and
thermodynamic properties of these compounds in their interactions with this protein [54].
Some typical results that were obtained in competition studies and through the use of site-
specific probes are provided in Table 2-1. The results indicated that these thyroid
hormones were interacting with HSA at both of the major drug-binding sites o (i.e.,
Sudlow sites I and II) [53,54]. A comparison of the data obtained for the thyroid
hormones and their metabolites indicated that the number and position of iodines, the
phenol group, and the thyronine backbone were all important during the binding of these
compounds to HSA [54]. Structural studies have also been carried out through the use of
modeling and crystallographic data to examine the binding of thyroxine and related
compounds to a cell surface receptor for thyroid hormones on αvβ3 integrin [55].
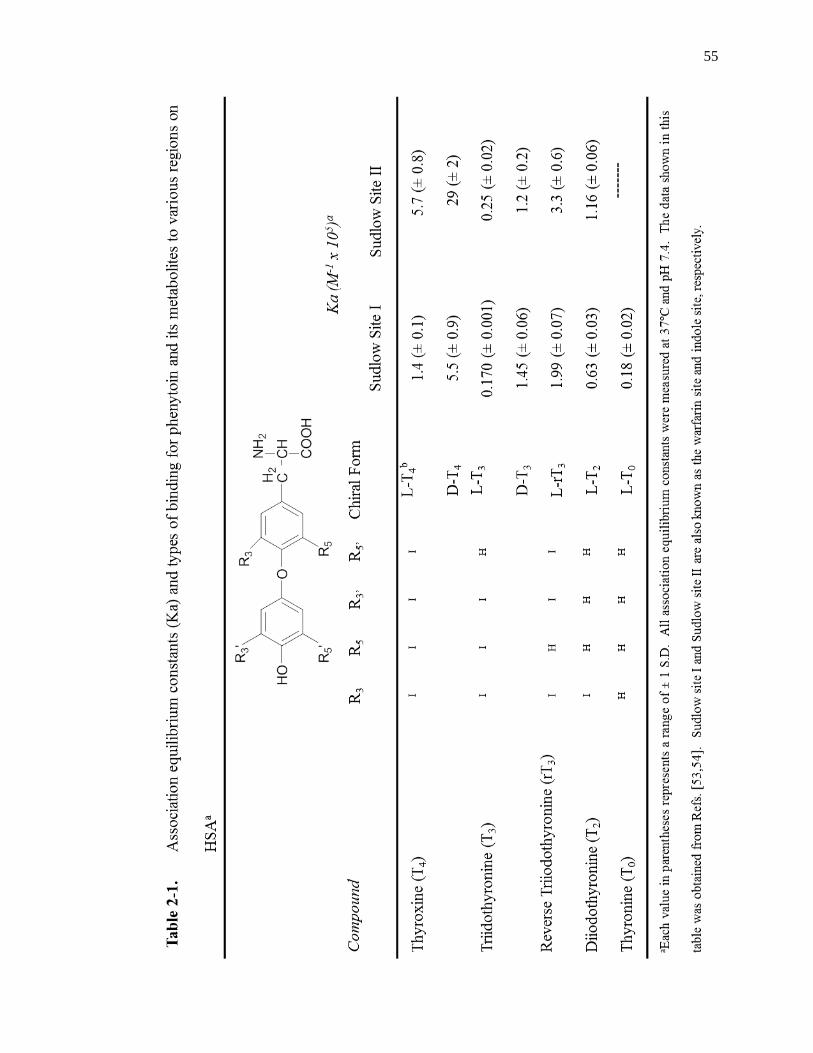
55
56
2.3.2 Steroid hormones
The protein binding of steroid hormones and their metabolites has also been
characterized through a variety of techniques. As an example, the crystal structure of the
serum transport protein sex-hormone binding globulin (SHBG) was determined for a
complex of this protein with 5α-dihydrotestosterone [56]. SHBG is an important binding
agent in blood for many sex hormones and related compounds, including estradiol,
testosterone, androste-5-ene-3β,17β-diol, and 5α-dihydrotestosterone [47,49,56]. The
information that was obtained from the crystal structure for the 5α-
dihydrotestosterone/SHBG complex was compared with the results of previous binding
studies for steroid hormones with SHBG [57,58], and this allowed a model for the
binding sites for these compounds to be developed. This model gave good agreement
with prior data from site-directed mutagenesis [59-61] and photolabeling experiments
[62,63] that have been conducted with SHBG [58].
Another structural study looked at the interactions between the human androgen
receptor (AR) ligand-binding domain and several androgen-related steroid hormones and
metabolites [30]. The compounds that were examined included testosterone,
dihydrotestosterone, and tetrahydrogestrinone. An example of some of the results was
provided earlier in Fig. 2-1. Both the binding affinity and structural characteristics for
the complexes of these agents with AR were explored. Tetrahydrogestrinone was found
to have the highest affinity for the AR ligand-binding domain. This strong binding was
thought to be due to the presence of greater van der Waals interactions for this compound
than for the other steroids that were studied. Dihydrotestosterone had a higher affinity
than testosterone, an effect that was proposed to be due to the stronger electrostatic
57
interactions between the structure of dihydrotestosterone and the AR binding domain
[30].
2.4 Interactions of proteins with fatty acids and related metabolites
Fatty acids can also have significant binding to proteins. These compounds are
carboxylic acids that contain hydrocarbon chains with lengths of 4 to 36 carbons. In
some fatty acids, the hydrocarbon chain is unbranched and fully saturated, such as
myristic acid (C14:0). In others, the chain contains one or more double bonds, as is the
case of linoleic acid (C18:2) [48]. Long chain fatty acids (i.e., fatty acids with chains
containing 16-20 carbons) are particularly critical for a diverse set of cellular and
metabolic functions. For instance, long chain fatty acids act as fuel that can be stored as
triacylglycerols (or triglycerides) and that can be used to generate ATP through -
oxidation in mitochondria and peroxisomes. In addition, fatty acids are the precursors of
phospholipids and glycolipids, which are needed for the construction of membranes [64].
Long chain fatty acids such as oleic (C18:1), palmitic (C16:0), linoleic (C18:2),
stearic (C18:0), arachidonic (C20:4) and palmitoleic (C16:1) are crucial intermediates in
lipid metabolism [65]. They tend to have low solubility in water and are typically bound
in plasma to proteins, with less than 0.1% being present as non-bound, or “free”, fatty
acids. Most of the long chain fatty acids in the blood are transported by HSA [65-68].
HSA carries between 0.1 and 2 mol of fatty acids under normal physiological conditions.
However, this value can rise to as high as 6 mol fatty acid per mol of HSA in the
peripheral vasculature during fasting or exercise or disease states such as diabetes, liver
and cardiovascular disease [67].
Many recent studies have attempted to locate fatty acid binding sites on HSA by
58
using X-ray crystallography or NMR spectroscopy [67,69-73]. In addition, site-directed
mutagenesis has been utilized with these methods to see how specific sequence changes
will affect HSA’s binding properties and structure [67,69]. Such studies have revealed
that five to seven binding sites on HSA may be occupied by medium and long-chain fatty
acids [71]. These binding sites are asymmetrically distributed across the three domains
of HSA, with three of these sites overlapping Sudlow sites I and II [70]. All of these sites
have similar structural interactions with fatty acids, providing a deep hydrophobic pocket
for the methylene tail and containing two or three polar surface residues nearby which
provide a binding location for the carboxylic head group of the fatty acid.
A variety of techniques have also been employed to estimate the binding
constants for fatty acids at their sites on HSA. The strongest of these interactions have
association equilibrium constants that range from 105 and 10
8 M
-1 [66,74-77]. It has been
observed for fatty acids with multiple binding sites on HSA that the value of the
individual association constants for each mole of added fatty acid increased as the length
of the fatty acid chain was raised [71]. It was later found that the association equilibrium
constant for the first bound fatty acid increases with chain length but that this increase
does not necessarily occur in a linear fashion; instead, the affinity is generally dependent
on the hydrophobic portion of the fatty acid and how it interacts with HSA [69]. It has
further been demonstrated that some fatty acids can have direct competition with drugs
on HSA or can lead to allosteric effects during these binding processes [72,74,75,78].
2.5 Interactions of proteins with drugs and related metabolites
Numerous studies have examined the interactions of drugs and their metabolites
with proteins. Like low mass hormones, many drugs and their metabolites are
59
transported throughout the body through the use of serum transport proteins.
Approximately 43% of the 1500 most commonly used pharmaceutics have at least 90%
binding to such binding agents [35,79]. These interactions usually involve proteins that
can bind to a broad range of targets, such as HSA and alpha1-acid glycoprotein (AGP),
and can play a significant role in determining the activity, distribution, rate of excretion
or metabolism, and toxicity of many pharmaceutical agents in the body [80]. In recent
years there has also been interest in how the presence of drug metabolites can affect the
distribution, apparent activity, and protein interactions of the parent drug [81].
2.5.1 General effects of metabolites on drug-protein interactions
Many studies have investigated the difference between drugs and their
metabolites in their overall binding in serum or to specific serum proteins. For instance,
equilibrium dialysis was used to examine the binding of propisomide and its major
metabolite to human serum and isolated serum proteins such as AGP [82] and the binding
of acetohexamide and its metabolite (-)-hydroxyhexamide to HSA [83]. Another study
utilized a similar approach to investigate the binding by tolterodine and its 5-
hydroxymethyl or N-dealkylated metabolites to human serum, HSA and AGP [84].
Equilibrium dialysis was also used to measure the binding of tizoxanide, an active
metabolite of the drug nitazoxanide, with albumin and AGP [85].
A few studies have been conducted to provide a more detailed comparison of the
binding regions and binding constants for drugs and their metabolites on serum proteins.
As an example, HPAC and competition studies have been used to compare the binding
regions on HSA for the drug phenytoin and its two major metabolites: 5-(3-
hydroxyphenyl)-5-phenylhydantoin and 5-(4-hydroxyphenyl)-5-phenylhydantoin (i.e., m-
60
HPPH and p-HPPH, respectively) [81,86]. In an examination of both the major and
minor drug binding regions of HSA, phenytoin was found to have direct binding at
Sudlow site II and the digitoxin site, with association equilibrium constants at these
regions in the range of 0.65-1.04 × 10⁴ M
-1 at 37 ºC and pH 7.4 (see Table 2-2). The
same drug had allosteric effects plus possible direct binding at Sudlow site I and the
tamoxifen site [86]. However, m-HPPH and p-HPPH only had significant interactions
with Sudlow site II, with binding constants of 0.32-0.57 × 10³ M
-1 for this region [81].
Thus, the parent drug and its metabolites not only had different affinities for HSA but
also had differences in the number of interaction sites [81,86].
2.5.2 Effects of chirality on drug metabolite-protein binding
Another factor to consider for drug- and drug metabolite-protein binding is the
effect of chirality on these interactions. Chiral drugs have been estimated to represent
40-50% of all drugs that are currently on the market [87,88]. The separate chiral forms
for some drugs can exhibit a wide variation in their toxicology, pharmacokinetics and
metabolism. In the extreme case, one enantiomer may produce the desired function in
treatment while another may be inactive or even produce undesirable toxic effects. This
is because numerous biomolecules (i.e., enzymes and plasma proteins) work as chiral
selectors, which can produce different binding or metabolic processes to occur for each
chiral form of a drug [89-95].
These differences have made it possible in the past to use protein-based HPLC
columns, such as those containing serum proteins, for separating the various chiral forms
of many drugs [93-95]. The same approach has been utilized to separate and measure
chiral drugs and their metabolites in biological samples. For instance, an AGP column
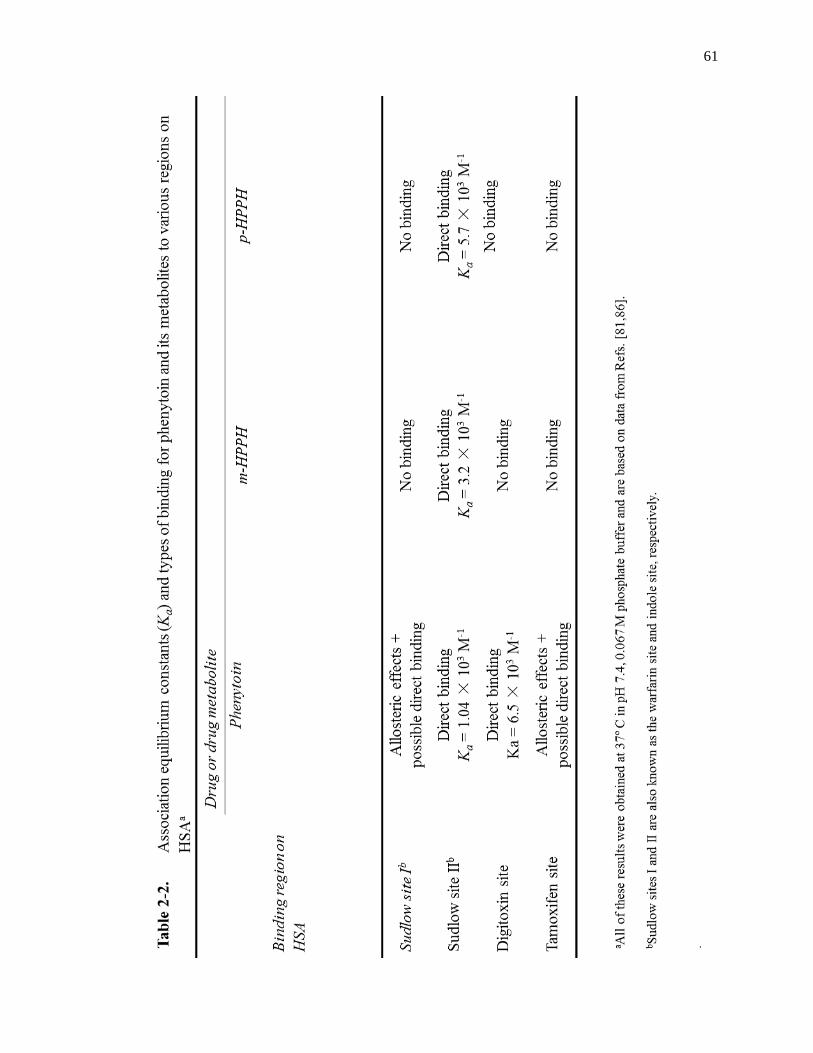
61
62
was recently used with fluorescence detection to measure the enantiomers of tramadol
and its two major metabolites, O-desmethyltramadol and N-desmethyltramadol, in
plasma samples (see Fig. 2-3). This method was then used to examine the
pharmacokinetics for each of these compounds in the body [96]. A similar approach has
been used with LC-MS to examine the chiral forms of methadone and its metabolites 2-
ethylidene-1,5-dimethyl-3,3-diphenylpyrrolidine and 2-ethyl-5-methyl-3,3-diphenyl-1-
pyrroline in hair samples from patients undergoing methadone maintenance therapy 97].
As has been observed for their parent drugs, the different forms of a chiral
metabolite can also differ in how they interact with proteins. One report compared the
chiral forms of oxybutynin and its metabolite, N-desethyloxybutynin, in their binding and
competition on HSA and AGP. The results showed that the affinity of oxybutynin
enantiomers on AGP was much higher than on HSA, and that the enantiomers of N-
desethyloxybutynin and oxybutynin were all bound by the same site on AGP [33].
Another study involving the phenytoin metabolites m-HPPH and p-HPPH compared the
dissociation rates of the chiral forms of these metabolites from an HPLC column
containing immobilized HSA [98]. Dissociation rate constants of 8.2-9.6 s-1
were
obtained at pH 7.4 and 37º C for the enantiomers of m-HPPH, while values of 3.2-4.1 s-1
were obtained for the enantiomers of p-HPPH. These results were then used along with
separate estimates of the association equilibrium constants to also compare the
association rate constants for these metabolites and their enantiomers [98].
2.5.3. Use of binding data to characterize protein interaction sites for drug metabolites
A number of reports have used binding data for drugs, their metabolites and
related analogs to learn about the binding site of these compounds on a protein. Binding
63
Figure 2-3. Chiral separation and analysis of tramadol and its major metabolites using
HPLC and a column containing immobilized APG as stationary phase.
The results in (a) are for a blank human plasma sample. The results in (b)
are for a plasma sample taken from a volunteer 2.5 hours after receiving a
100 mg dose of racemic tramadol. Symbols: enantiomers of tramadol,
+(T) and –(T); enantiomers of the metabolite O-desmethyltramadol,
+(M1) and –(M1); enantiomers of the metabolite N-desmethyltramadol,
+(M2) and –(M2); and internal standard (fluconazol), IS. Adapted with
permission from Ref. [96].
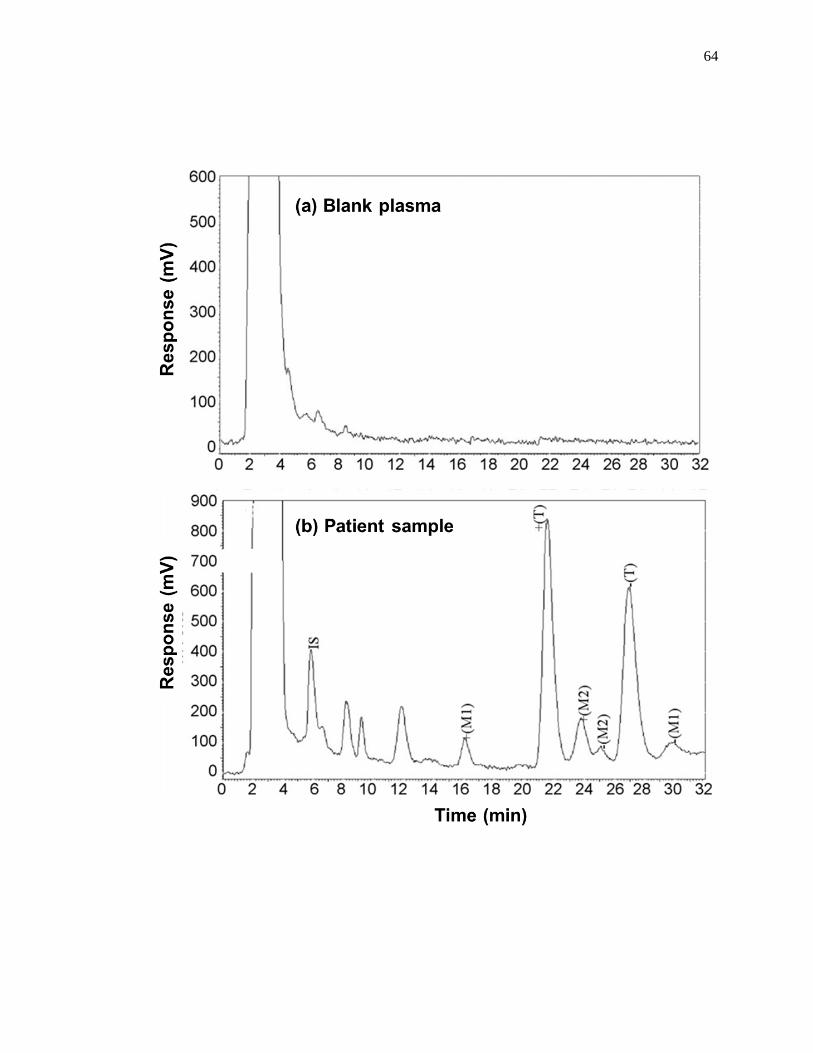
64
65
and retention data that have been acquired by HPAC have been used to examine the
binding of several types of compounds with immobilized serum proteins. This approach
has been used to examine the binding of warfarin and coumarin compounds to HSA [99-
101], as well as the binding of L-tryptophan and various indole compounds to this protein
[102-104]. The same general method has been used to compare the binding of several
sulfonylurea drugs with HSA and various preparations of glycated HSA [39,105-110].
If a relatively large group of compounds is considered in a binding study, the
results can be used to create a quantitative structure-retention (or reactivity) relationship
(QSRR) to describe the site at which these agents are binding to a protein [111-114]. For
instance, binding studies based on HPLC or CE using serum proteins can be used to
mimic biological systems and to quickly study how changes in the structure of an applied
drug or analog will alter these interactions [115,116]. This format has been used to build
models that describe the binding of HSA with benzodiazepines [117-119]. Such an
approach has also been utilized to examine the binding of AGP with beta-adrenolytic
drugs, antihistamines, amino alcohols, cyclic vinca alkaloid analogs, and quinazolone
derivatives [116,120-125].
2.6 Interactions of proteins with xenobiotics and related metabolites
The term “xenobiotics” refers to chemicals that are produced synthetically and
that are not normally found in biological organisms [126]. Drugs represent one type of
xenobiotic, but others include environmental pollutants and food additives [126-128].
When they enter the body, xenobiotics can be metabolized through various enzymatic
processes. The resulting metabolites, in turn, can sometimes interact with proteins and
compete for endogenous compounds for common binding agents [126,129].
66
Several studies have examined the effects that xenobiotics and their metabolites
may have on hormone-protein binding [127,130,131]. For example, the effect of
polybrominated diphenyl ethers (PBDEs) on the binding of thyroid hormones to serum
proteins has been examined [131]. It has been suggested in several studies that
environmental exposure to PBDEs can result in decreased thyroid hormone
concentrations in serum, leading to possible neurotoxicity and behavioral effects [131-
133]. This effect may be linked to the fact that, when metabolized, PBDEs become
hydroxylated and produce a chemical structure similar to that of T4 and its metabolites.
It has been further found that PBDE metabolites are able to bind to T4-binding proteins in
serum, which could result in the displacement of thyroid hormones. One study examined
the binding of transthyretin and TBG with fourteen hydroxylated PBDE compounds
through various methods. A fluorescence displacement assay indicated that hydroxylated
PBDEs could compete with T4 for binding sites on transthyretin, while work with circular
dichroism indicated that hydroxylated PBDEs could bind to the same sites as T4 on TBG
and transthyretin [131]. Binding and competition with T4 has also been noted for some
polychlorinated biphenyls (PCBs), dichlorodiphenyltrichloroethane (DDT), and related
metabolites or compounds with human thyroid receptor, TBG, and transthyretin [130].
Another report examined the effects for a number of xenobiotics and their
metabolites on the binding of 17β-estradiol to the estrogen receptor and on the binding of
5α-dihydrotestosterone to the androgen receptor, androgen-binding protein, and SHBG
[127]. Compounds that were tested included hexachlorocyclohexane, DDT,
methoxychlor, pentachlorophenol, and nonylphenol. It was found that some of these
xenobiotics and metabolites could cause a significant decrease in the binding of 5α-

67
hydrotestosterone or 17β-estradiol to their binding proteins. It was further found that
binding by these xenobiotic agents could be selective for the steroid receptors and
binding proteins that were tested [127].
Polyphenolic compounds are flavonoids that are often used as dietary
supplements [128]. Ultrafiltration and CE were used to examine the binding of these
compounds to the human serum proteins HSA and AGP. Although similar in structure,
these compounds did vary in their affinity towards HSA, with a high level of binding
being observed for those compounds with hydrophobic properties and a carbonyl at a
certain key position in their structure. It was further noted that these hydrophobic
properties did not play a major role in the ability of polyphenolic compounds to bind with
AGP [128].
2.7 Variations in protein structure and binding due to metabolic processes
Another way in which changes in metabolites may affect solute protein
interactions is through changes that are created in the structure of the protein. In some
cases, these changes may be a direct result of the modification of a protein by a
metabolite (e.g., glycation, as discussed in the next section) [39,80,93,134]. In others,
this change may be a response to differences in a protein’s environment that are created
as the metabolic profile is altered (e.g., as might occur through oxidation) [135,136].
This section will discuss both types of effects using changes that have been observed in
serum transport proteins and binding agents as examples.
2.7.1. Human serum albumin
One protein that has been found to be altered by some metabolic disease is HSA.
68
As has been indicated earlier, HSA is a serum protein that plays a fundamental role in the
reversible binding and transport of metabolites, drugs and various endogenous ligands,
such as fatty acids [65,137]. HSA is normally found in blood at concentrations ranging
from 30-50 g/L and accounts for approximately 60% of the total serum protein content
[65]. Binding to HSA is known to greatly influence the pharmacokinetics and activity of
many common drugs [49,138-140]. In addition, HSA can increase the solubility of
lipophilic drugs, sequester toxins, and act as an important antioxidant in plasma [49,65].
Several past studies have noted that the chemical modification of HSA can alter
its binding to drugs, hormones and other solutes. For instance, the reaction of HSA with
p-nitropheny acetate, which is thought to mainly modify Tyr-411 at Sudlow site II, can
change the binding of various solutes with this protein [141]. The modification of Trp-
214 by o-nitrophenylsulphenyl chloride has been demonstrated to change the
stereoselectivity and binding affinity of Sudlow site I of HSA [142]. Similar work has
been presented that has examined the effects of modifying the lone free cysteine group on
HSA by reacting this protein with ethacrynic acid [143,144].
Diabetes is a metabolic disease in which the structure of HSA can be modified.
This disease is actually a group of disorders that are characterized by abnormal high
levels of blood glucose (i.e., hyperglycemia) that result from insulin deficiency and/or
insulin resistance [145]. Many of the long term complications of diabetes, such as heart
disease and nerve damage, are associated with the non-enzymatic glycation of proteins
[145,146]. Glycation starts with the nucleophilic attack of a reducing sugar (e.g.,
glucose) onto some of the primary amine groups on proteins to form a reversible Schiff
base (see Fig. 2-4). This intermediate can then slowly rearrange to form a more stable
69
Figure 2-4. Reactions involved in the early stages of glycation of a protein, using
human serum albumin (HSA) as an example [105,145]. This figure has
been reproduced with permission from Ref. [105].
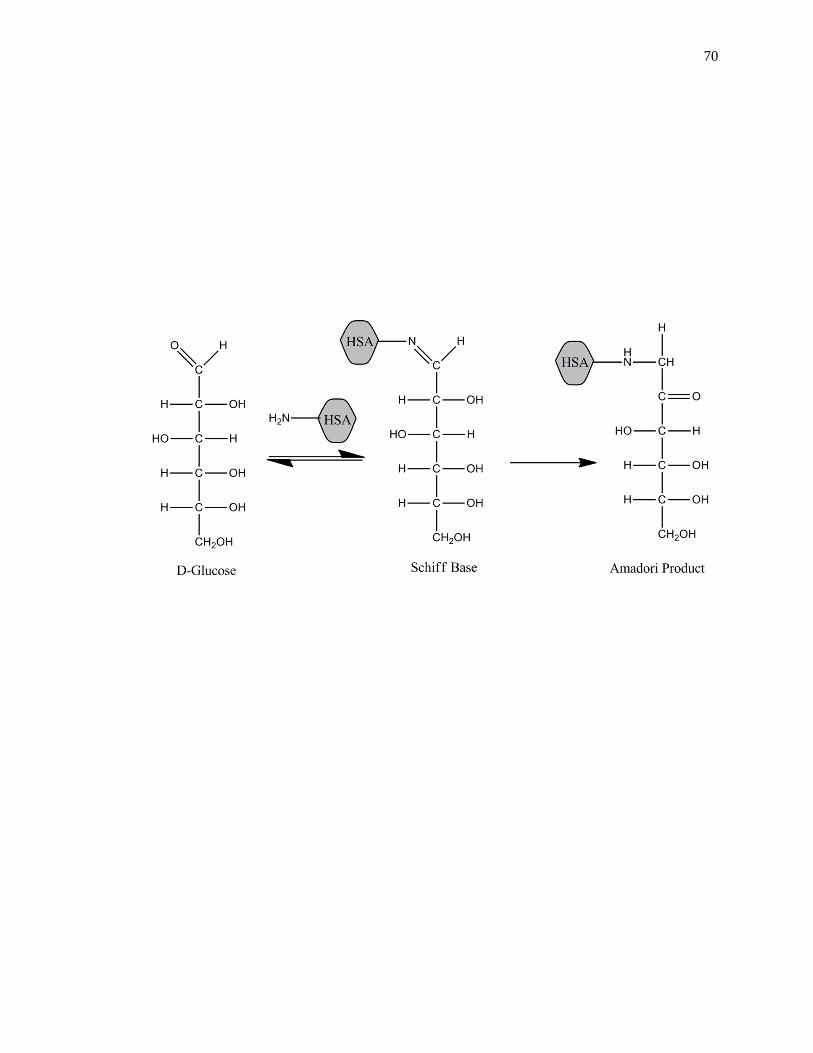
70
71
Amadori product [145-147]. Oxidation of the Amadori products or free sugars can also
generate reactive α-oxaloaldehydes that can react with both lysines and arginines on
proteins to form advanced glycation end-products (AGEs) [147].
In recent years, it has been found that glycation can affect the binding of several
endogenous and exogenous solutes with HSA. For example, L-tryptophan is an essential
amino acid [148] and has been extensively used as a site-selective probe for Sudlow site
II of glycated HSA and normal HSA [105-108,149]. Recent binding studies using
glycated HSA with levels of modification similar to those found in diabetes found an
increase of 4.7- to 5.8-fold in the affinity of L-tryptophan for this protein at 37 °C
[106,149]. Sulfonylurea drugs are a group of anti-diabetic drugs that are used in the
management of type 2 diabetes; these drugs are also highly bound to serum proteins such
as HSA. Binding studies based on HPAC have found that glycation can affect the
binding strength of these drugs to HSA, with both the degree of glycation and the specific
type of drug influencing the size of the change [39,105-110].
As indicated in the last section, fatty acids are the major endogenous ligands of
HSA and are also known to have many binding sites on this protein [75]. Reports that
have examined the combined effect of glycation and the presence of various fatty acids
on the binding of sulfonylurea drugs to HSA have found that glycation increases the
overall affinity of these drugs to HSA, while the addition of increasing amounts of fatty
acids causes a decrease in affinity [74,76]. It has further been noted that glycation could
produce changes of at least 3- to 5-fold in the affinities of some fatty acids at their sites of
competition with sulfonylurea drugs when comparing the binding of these solutes to
normal HSA [76].
72
Methylglyoxal is a highly reactive metabolite of glucose that has been implicated
in several chronic diseases associated with diabetes [150,151]. The elevated
concentrations of methylglyoxal in diabetes patients can also lead to protein modification
and the formation AGEs through the reaction of methylglyoxal with arginine or lysine
residues. A recent report using quantitative MS and multiple reaction monitoring found
that a major site for modification by methylglyoxal on HSA occurs at Arg-257, which is
located in Sudlow site I. Molecular modeling conducted in the same study indicated that
a decrease in binding by warfarin may occur due to these modifications when comparing
glycated HSA and normal HSA [151].
2.7.2. Alpha1-acid glycoprotein
A second type of serum transport protein that can be affected by metabolic
diseases is AGP. AGP is an acute-phase protein that is responsible for binding and
delivering numerous basic and neutral drugs in the bloodstream [121]. The concentration
of AGP in blood can vary over a wide range and is affected by systemic tissue injury,
inflammation and infection. In addition, the glycosylation of AGP can be altered in
some disease states, such as rheumatoid arthritis, systemic lupus erythematosus and
autoimmune thyroid disease [152]. These changes are important because they can also
alter the binding of drugs to AGP. As an example, the affinity of disopyramide for AGP
has been found to be affected by the biantennary glycan structures for this protein
[153,154]. It has also been reported that genetic variants of AGP can have a significant
effect on binding by chiral drugs such as disopyramide and warfarin [153,155].
A number of reports have looked at how changes in AGP binding can affect
parent drugs compared to their metabolites. One study evaluated the effect of AGP on
73
lidocaine and its active metabolites monoethylglycinexylidide and glycinexylidide during
continuous epidural anesthesia in infants and young children. The results indicated the
AGP concentration in plasma could be used as an index to monitor and prevent the
toxicity caused by the accumulation of monoethylglycinexylidide during the continuous
administration of lidocaine [156]. Another report looked at the concentrations of
vecuronium and its metabolite 3-OH desacetylvecuronium in children who were
receiving phenytoin or carbamazepine for chronic anticonvulsant therapy [157]. These
last two drugs were of interest because many anticonvulsant drugs have been shown to
increase the concentration of AGP in plasma, which can then increase protein binding to
cationic drugs and alter their distribution. It was found that the increase in AGP
concentration associated with the anticonvulsant therapy did not significantly contribute
to resistance to vecuronium [158].
2.7.3. Lipoproteins
Lipoproteins are another set of binding agents in serum that can be affected by
metabolic diseases. Lipoproteins are macromolecular complexes of proteins and lipids
that transport hydrophobic lipids and related compounds, such as cholesterol and
triglycerides, throughout the body [158-161]. Lipoproteins are also known to interact
with several basic and neutral hydrophobic drugs in blood [99,162-172]. Examples of
drugs that bind to lipoproteins are propranolol and verapamil [37,162-169,173-175].
Lipoprotein concentrations in blood can vary with different disease states. For
example, the levels of low-density lipoprotein (LDL) in plasma can increase in diseases
such as atherosclerosis and hyperlipidemia [176]. In addition to changes in the levels of
lipoproteins in the circulation, metabolic diseases often result in modifications in
74
lipoprotein structures. For instance, increased amounts of LDL that have been modified
by AGEs are found in diabetics and non-diabetics with renal failure. Glycation of LDL
may lead to the formation of foam cells and an increase in atherosclerosis. In addition,
glycated LDL is more susceptible to further modifications due to oxidation [135].
The oxidation of lipoproteins occurs through free radicals, such as peroxyl
radicals, which are released from cells and chemical reactions [136]. These radicals can
react with lipoproteins, depleting the particle’s antioxidant defense and initiating
oxidation of the lipid core. In the later stages of this process, the surface protein also
becomes modified. The oxidation of lipoproteins, specifically LDL, leads to
atherosclerosis [136]. In addition to the increased risk of atherosclerosis, oxidized
lipoproteins may also impact the ability of the complexes to bind and carry basic and
neutral drugs throughout the body [176].
The effects of LDL oxidation on drug binding have been evaluated by using CE
and using verapamil and nilvadipine as models for basic and neutral drugs, respectively
[176]. It was found that the affinity of these drugs increased with the amount of LDL
oxidation. In addition, the binding of verapamil was increased more than it was for
nilvadipine, suggesting that basic drugs were more sensitive to oxidation effects. No
stereoselective binding was detected between LDL and these model drugs at any
oxidation state [176]. However, other studies based on HPAC have noted different
binding for the chiral forms of some drugs to LDL [174,175].
2.8 Conclusion
The field of metabolomics has seen great growth in recent years because of the
wealth of information it can provide about biochemical pathways and processes. This
75
review examined previous reports that have looked at the interactions of metabolites with
proteins. The first topic discussed was an overview of techniques that have been used to
characterize and study metabolite-protein binding. These methods have been used in
vitro and in vivo studies to provide information on the structures of metabolite-protein
complexes and to examine the nature of metabolite-protein interactions. Computational
studies using in silico tools have been used to provide additional data on metabolite-
protein complexes and interactions.
This review next described numerous studies that have investigated the binding of
various types of small solutes and their metabolites with proteins. This included work
that has been carried out with hormones, fatty acids, drugs or other xenobiotics, and their
metabolites with transport proteins and receptors. These examples have considered the
structures of the resulting solute-protein complexes, the nature of the binding sites, the
strength of these interactions, the variations in these interactions with solute structure,
and the kinetics of these reactions. Studies that have examined the effects of various
metabolic processes on the structure and activities of proteins, and on the corresponding
interactions of solutes with these proteins, were also summarized.
Although most past work in metabolomics has been concerned with the structure
and analysis of metabolites, research in metabolite-protein interactions is still a relatively
new area. Based on the research that has already been carried out, it is already clear that
data on metabolite-protein interactions can provide useful information on biological
processes that involve hormones, drugs and other low mass solutes. It is further expected
that this type of research will continue to grow in the future as metabolomics becomes
more widely used in biomedical research, pharmaceutical science, and personalized
76
medicine.
2.9 References
1. R. Kaddurah-Daouk, B.S. Kristal, R.M. Weishiboum, Metabolomics: a global
biochemical approach to drug response and disease, Ann. Rev. Pharmacol.
Toxicol. 48 (2008) 653–683.
2. N.L. Kuehnbaum, P.B. Mckibbin, New advances in separation science for
metabolomics: resolving chemical diversity in post-genomic era, Chem. Rev. 113
(2013) 2437−2468.
3. G.J. Patti, O. Yanes, G. Siuzdak, Metabolomics: the apogee of the omics triology,
Nature Rev. Mol. Cell Biol. 13 (2012) 263-269.
4. H. Tweeddale, L. Notley-McRobb, T. Ferenci, Effect of slow growth on
metabolism of Escherichia coli, as revealed by global metabolite pool
("metabolome") analysis, J. Bacteriol. 180 (1998) 5109-5116.
5. S.G. Oliver, M.K. Winson, D.B. Kell, F. Baganz, Systematic functional analysis
of the yeast genome, Trends Biotechnol. 16 (1998) 373-377.
6. H. Tweeddale, L. Notley-McRobb, T. Ferenci, Assessing the effect of reactive
oxygen species on Escherichia coli using a metabolome approach, Redox Rep. 4
(1999) 237-241.
7. D.Y. Lee, B.P. Bowen, T.R. Northen, Mass spectrometry-based metabolomics,
analysis of metabolite-protein interactions, and imaging, Biotechniques 49 (2010)
557-565.
8. X. Li, T.A. Gianoulis, K.Y. Yip, M. Gerstein, M. Synder, Extensive in vivo
metabolite-protein interactions revealed by large-scale systematic analyses, Cell
77
143 (2010) 639-650.
9. G.X. Yang, X. Li, M. Synder, Investigating metabolite–protein interactions: an
overview of available techniques, Methods 57 (2012) 459-466.
10. G. Sudlow, D.J. Birkett, D.N. Wade, Further characterization of specific drug
binding sites on human serum albumin, Mol. Pharmacol. 12 (1976) 1052–1061.
11. W. Clarke, A.R. Choudhuri, D.S. Hage, Analysis of free drug fractions by ultra-
fast immunoaffinity chromatography, Anal. Chem. 73 (2001) 2157-2164.
12. W. Clarke, J.E. Schiel, A. Moser, D.S. Hage, Analysis of free hormone fractions
by an ultrafast immunoextraction/displacement immunoassay: studies using free
thyroxine as a model system, Anal. Chem. 77 (2005) 1859-1866.
13. A. Daddaoua, T. Krell, C. Alfonso, B. Morel, J.L. Ramos, Compartmentalized
glucose metabolism in Pseudomonas putida is controlled by the PtxS repressor, J.
Bacteriol. 192 (2010) 4357–4366.
14. A. Frostell-Karlsson, A. Remaeus, H. Roos, K. Andersson, P. Borg, M.
Hamalainen, R. Karlsson, Biosensor analysis of the interaction between
immobilized human serum albumin and drug compounds for prediction of human
serum albumin binding levels, J. Med. Chem. 43 (2000) 1986–1992.
15. J.E. Gestwicki, H.V. Hsieh, J.B. Pitner, Using receptor conformational change to
detect low molecular weight analytes by surface plasmon resonance, Anal. Chem.
73 (2001) 5732–5737.
16. R.A. Palmer, H. Niwa, X-ray crystallographic studies of protein–ligand
interactions, Biochem. Soc. Trans. 31 (2003) 973–979.
17. N.A. Larsen, J.M. Turner, J. Stevens, S.J. Rosser, A. Basran, R.A. Lerner, N.C.
78
Bruce, I.A. Wilson, Crystal structure of a bacterial cocaine esterase, Nature
Struct. Biol. 9 (2002) 17–21.
18. M. Vogtherr, K. Saxena, S. Hoelder, S. Grimme, M. Betz, U. Schieborr, B.
Pescatore, M. Robin, L. Delarbre, T. Langer, K.U. Wendt, H. Schwalbe, NMR
characterization of kinase p38 dynamics in free and ligand-bound forms, Angew.
Chem. 45 (2006) 993–997.
19. M. Betz, K. Saxena, H. Schwalbe, Biomolecular NMR: a chaperone to drug
discovery, Curr. Opin. Chem. Biol. 10 (2006) 219–225.
20. L. D’Silva, P. Ozdowy, M. Krajewski, U. Rothweiler, M. Singh, T.A. Holak,
Monitoring the effects of antagonists on protein-protein interactions with NMR
spectroscopy, J. Am. Chem. Soc. 127 (2005) 13220–13226.
21. I. Schuster, H. Egger, D. Bikle, G. Herzig, G.S. Reddy, A. Stuetz, P. Stuetz, G.
Vorisek, Selective inhibition of vitamin D hydroxylases in human keratinocytes,
Steroids 66 (2001) 409–422.
22. M.S. Goncalves, Fluorescent labeling of biomolecules with organic probes,
Chem. Rev. 109 (2009) 190–212.
23. H. Zhu, M. Bilgin, R. Bangham, D. Hall, A. Casamayor, P. Bertone, N. Lan, R.
Jansen, S. Bidlingmaier, T. Houfek, T. Mitchell, P. Miller, R.A. Dean, M.
Gerstein, M. Snyder, Global analysis of protein activities using proteome chips,
Science 293 (2001) 2101–2105.
24. A. Liesener, U. Karst, Monitoring enzymatic conversions by mass spectrometry: a
critical review, Anal. Bioanal. Chem. 382 (2005) 1451–1464.
25. Y. Yu, K.S. Ko, C.J. Zea, N.L. Pohl, Discovery of the chemical function of
79
glycosidases: design, synthesis, and evaluation of mass-differentiated
carbohydrate libraries, Org. Lett. 6 (2004) 2031–2033.
26. M.A. Fischbach, H. Lin, D.R. Liu, C.T. Walsh, In vitro characterization of IroB, a
pathogen-associated C-glycosyltransferase, Proc. Natl. Acad. Sci. USA 102
(2005) 571–576.
27. V.N. Morozov, T.Y. Morozova, K.L. Johnson, S. Naylor, Parallel determination
of multiple protein metabolite interactions using cell extract, protein microarrays
and mass spectrometric detection, Rapid Comm. Mass Spectrom. 17 (2003)
2430–2438.
28. T. Furuya, T. Nishi, D. Shibata, H. Suzuki, D. Ohta, K. Kino, Characterization of
orphan monooxygenases by rapid substrate screening using FT-ICR mass
spectrometry, Chem. Biol. 15 (2008) 563–572.
29. D.J. Clarke, A.A. Stokes, P. Langridge-Smith, C.L. Mackay, Online quench-flow
electrospray ionization Fourier transform ion cyclotron resonance mass
spectrometry for elucidating kinetic and chemical enzymatic reaction
mechanisms, Anal. Chem. 82 (2010) 1897–1904.
30. K.P. De Jesus-Tran, P. Cote, L. Cantin, J. Blanchet, F. Labrie, R. Breton,
Comparison of crystal structures of human androgen receptor ligand-binding
domain complexed with various agonist reveals molecular determinants
responsible for binding affinity, Protein Sci. 15 (2006) 987-999.
31. K. Vuignier, J. Schappler, J.L. Veuthey, P.A. Carrupt, S. Martel, Drug-protein
binding: a critical review of analytical tools, Anal. Bioanal. Chem. 398 (2010)
53–66.
80
32. K.M. Comess, M.E. Schurdak, M.J. Voorbach, M. Coen, J.D. Trumbull, H. Yang,
L. Gao, H. Tang, X. Cheng, C.G. Lerner, O. McCall, D.J. Burns, B.A. Beutel, An
ultraefficient affinity-based high-throughout screening process: application to
bacterial cell wall biosynthesis enzyme MurF, J. Biomol. Screen. 11 (2006) 743–
754.
33. A. Shibukawa, Y. Yoshikawa, T. Kimura, Y. Kuroda, T. Nakagawa, I.W. Wainer,
Binding study of desethyloxybutynin using high-performance frontal analysis
method, J. Chromatogr. B 768 (2002) 189-197.
34. I. Muckenschnabel, R. Falchetto, L.M. Mayr, I. Filipuzzi, SpeedScreen: label-free
liquid chromatography-mass spectrometry-based high-throughput screening for
the discovery of orphan protein ligands, Anal. Biochem. 324 (2004) 241–249.
35. D.S. Hage, J.A. Anguizola, A.J. Jackson, R. Matsuda, E. Papastavros, E.
Pfaunmiller, Z. Tong, J. Vargas-Badilla, M.J. Yoo, X. Zheng, Chromatographic
analysis of drug interactions in the serum proteome, Anal. Methods 3 (2011)
1449-1460.
36. D.S. Hage, Affinity chromatography: a review of clinical applications, Clin.
Chem. 45 (1999) 593-615.
37. D.S. Hage, High-performance affinity chromatography: a powerful tool for
studying serum protein binding, J. Chromatogr. B 768 (2002) 3–30.
38. D.S. Hage, S.A. Tweed, Recent advances in chromatographic and electrophoretic
methods for the study of drug-protein interactions, J. Chromatogr. B 699 (1997)
499-525.
39. J. Anguizola, K.S. Joseph, O.S. Barnaby, R. Matsuda, G. Alvarado, W. Clarke,
81
R.L. Cerny, D.S. Hage, Development of affinity microcolumns for drug-protein
binding studies in personalized medicine: interactions of sulfonylurea drugs with
in vivo glycated human serum albumin, Anal. Chem. 85 (2013) 4453-4460.
40. N.H.H. Heegard, C. Schou, in: D.S. Hage (Ed.), Handbook of Affinity
Chromatography, 2nd ed., CRC Press, Boca Raton, 2006, Chap. 26.
41. T. Hoffmann, M.M. Martin, CE-ESI-MS/MS as a rapid screening tool for the
comparison of protein-ligand interactions, Electrophoresis 31 (2010) 1248–1255.
42. H. Sun, D.O. Scott, Structure-based drug metabolism predictions for drug design,
Chem. Biol. Drug Des. 75 (2010) 3–17.
43. D.B. Kitchen, H. Decornez, J.R. Furr, J. Bajorath, Docking and scoring in virtual
screening for drug discovery: methods and applications, Nature Rev. Drug
Discov. 3 (2004) 935–949.
44. M.J. de Groot, F. Wakenhut, G. Whitlock, R. Hyland, Understanding CYP2D6
interactions, Drug Discovery Today 14 (2009) 964–972.
45. S. Mandava, L. Makowski, S. Devarapalli, J. Uzubell, D.J. Rodi, RELIC - a
bioinformatics server for combinatorial peptide analysis and identification of
protein-ligand interaction sites, Proteomics 4 (2004) 1439–1460.
46. I. Bertini, M. Fragai, A. Giachetti, C. Luchinat, M. Maletta, G. Parigi, K.J. Yeo,
Combining in silico tools and NMR data to validate protein-ligand structural
models: application to matrix metalloproteinases, J. Med. Chem. 48 (2005) 7544–
7559.
47. T.L. Lemke, D.A. Williams, V.F. Roche, S.W. Zito, Medicinal Chemistry, 6th
ed., Lippincott Williams and Wilkins, Philadelphia, 2008.
82
48. D.L. Nelson, M.M. Cox (Eds.), in: Lehninger Principles of Biochemistry, 6th ed.
W.H. Freeman Publishers, New York, 2005.
49. N.W. Tietz (Ed.), Textbook of Clinical Chemistry, Saunders, Philadelphia, 1986.
50. W. Clarke, (Ed.), Contemporary Practice in Clinical Chemistry, 2nd
ed., AACC
Press, Washington, DC, 2011.
51. A.G. Gornall, (Ed.), Applied Biochemistry of Clinical Disorders, 2nd
ed.,
Lippincott, Philadelphia, 1986.
52. D.C. Anderson, Sex-hormone-binding globulin, Clin. Endocrinol. 3 (1974) 69-96.
53. B. Loun, D.S. Hage, Characterization of thyroxine-albumin binding using high-
performance affinity chromatography I. Interactions at the warfarin and indole
sites of albumin, J. Chromatogr. 579 (1992) 22S-235.
54. B. Loun, D.S. Hage, Characterization of thyroxine-albumin binding using high-
performance-affinity chromatography II. Comparison of the binding of thyroxine,
triiodothyronines and related compounds at the warfarin and indole sites of
human serum albumin, J. Chromatogr. B 665 (1995) 303-311.
55. V. Cody, P.J. Davis, F.B. Davis, Molecular modeling of the thyroid hormone
interaction with αvβ3 integrin, Steroids 72 (2007) 165-170.
56. I. Grishkovskaya, G.V. Avvakumov, G. Sklenar, D. Dales, G.L. Hammond, Y.A.
Muller, Crystal structure of human sex hormone-binding globulin: steroid
transport by laminin G-like domain, EMBO J. 19 (2000) 504-512.
57. J.M. Renoir, C. Mercier-Bodard, E.E. Baulieu, Hormonal and immunological
aspects of the phylogeny of sex steroid binding plasma protein, Proc. Natl. Acad.
Sci. USA 77 (1980) 4578-4582.
83
58. A.J.C. Westphal, Steroid-Protein Interactions II, Springer-Verlag, Berlin,
Germany, 1986.
59. W.P. Bocchinfuso, G.L. Hammond, Steroid-binding and dimerization domains of
human sex hormone-binding globulin partially overlap: steroids and Ca2+
stabilize
dimer formation, Biochemistry 33 (1994) 10622–10629.
60. W.P. Bocchinfuso, S. Warmels Rodenhiser, G.L. Hammond, Structure/function
analyses of human sex hormone-binding globulin by site-directed mutagenesis,
FEBS Lett. 301 (1992) 227–230.
61. L.M. Sui, A.W. Cheung, P.C. Namkung, P.H. Petra, Localization of the steroid-
binding site of the human sex steroid-binding protein of plasma (SBP or SHBG)
by site-directed mutagenesis, FEBS Lett. 310 (1992) 115–118.
62. C. Grenot, A. de Montard, T. Blachere, M.R. de Ravel, E. Mappus, C.Y.
Cuilleron, Characterization of Met-139 as the photolabeled amino acid residue in
the steroid binding site of sex hormone binding globulin using delta 6 derivatives
of either testosterone or estradiol as unsubstituted photoaffinity labeling reagents,
Biochemistry 31 (1992) 7609–7621.
63. D. Kassab, S. Pichat, C. Chambon, T. Blachere, M. Rolland de Ravel, E. Mappus,
C. Grenot, C.Y. Cuilleron, Photoaffinity labeling of homologous Met-133 and
Met-139 amino acids of rabbit and sheep sex hormone-binding globulins with the
unsubstituted Delta 6-testosterone photoreagent, Biochemistry 37 (1998) 14088–
14097.
64. J.E. Schaffer, Fatty acid transport: the roads taken, Am. J. Physiol. Endocrinol.
Metab. 282 (2002) E239-E246.
84
65. T. Peters, Jr., All About Albumin: Biochemistry, Genetics, and Medical
Applications, Academic Press, San Diego, 1996.
66. G.V. Richieri, A.M. Kleinfeld, Unbound free fatty acid levels in human serum, J.
Lipid Res. 36 (1995) 229-240.
67. J.R. Simard, P.A. Zunszain, C.-E. Ha, J.S. Hang, N.V. Bhagavan, I. Petitpas, S.
Curry, J.A. Hamilton, Locating high-affinity fatty acid-binding sites on albumin
by X-ray crystallography and NMR spectroscopy, Proc. Natl. Acad. Sci. USA 102
(2005) 17958-17963.
68. V.T. Chaung, M. Otagiri, How do fatty acids cause allosteric binding of drugs to
human serum albumin? Pharm. Res. 19 (2002) 1458-1464.
69. U. Kragh-Hansen, H. Watanabe, K. Nakajou, Y. Iwao, M. Otagiri, Chain length-
dependent binding of fatty acid anions to human serum albumin studied by site-
directed mutagenesis, J. Mol. Biol. 363 (2006) 702-712.
70. I. Petitpas, T. Grune, A.A. Bhattacharya, S. Curry, Crystal structures of human
serum albumin complexed with monounsaturated and polyunsaturated fatty acids,
J. Mol. Biol. 314 (2001) S955-S960.
71. A.A. Bhattacharya, T. Grüne, S. Curry, Crystallographic analysis reveals common
modes of binding of medium and long-chain fatty acids to human serum albumin,
J. Mol. Biol. 303 (2000) 721-732.
72. J.R. Simard, P.A. Zunszain, J.A. Hamilton, S. Curry, Location of high and low
affinity fatty acid binding sites on human serum albumin revealed by NMR drug-
competition analysis, J. Mol. Biol. 361 (2006) 336-351.
73. S. Curry, H. Mandelkow, P. Brick, N. Franks, Crystal structure of human serum
85
albumin complexed with fatty acid reveals an asymmetric distribution of binding
sites, Nature Struct. Biol. 5 (1998) 827-835.
74. J.A. Anguizola, S.B.G. Basiaga, D.S. Hage, Effects of fatty acids and glycation on
drug interactions with human serum albumin, Curr. Metabolomics 1 (2013) 239-
250.
75. A.A. Spector, Fatty acid binding to plasma albumin, J. Lipids Res. 16 (1976) 165-
179.
76. S.B. Basiaga, D.S. Hage, Chromatographic studies of changes in binding of
sulfonylurea drugs to human serum albumin due to glycation and fatty acids, J.
Chromatogr. B 878 (2010) 3193-3197.
77. E.J. Demant, G.V. Richieri, A.M. Kleinfeld, Stopped-flow kinetic analysis of
long-chain fatty acid dissociation from bovine serum albumin, Biochem. J. 363
(2002) 809-815.
78. T.A.G. Noctor, I.W. Wainer, D.S. Hage, Allosteric and competitive displacement
of drugs from human serum albumin by octanoic acid, as revealed by high-
performance liquid affinity chromatography, on a human serum albumin-based
stationary phase, J. Chromatogr. 577 (1992) 305-315.
79. N.A. Kratochowil, W. Huber, F. Muller, M. Kansy, P.R. Gerber, Predicting
plasma protein binding of drugs: a new approach, Biochem. Pharmacol. 64 (2002)
1355–1374.
80. D.S. Hage, J. Anguizola, O. Barnaby, A. Jackson, M.J. Yoo, E. Papastavros, E.
Pfaunmiller, M. Sobansky, Z. Tong, Characterization of drug interactions with
serum proteins by using high-performance affinity chromatography, Curr. Drug
86
Metab. 12 (2011) 313-328.
81. C.M. Ohnmacht, S. Chen, Z. Tong, D.S. Hage, Studies by biointeraction
chromatography of binding by phenytoin metabolites to human serum albumin, J.
Chromatogr. B 836 (2006) 83-91.
82. R. Zini, J. Barre, G. Defer, J.P. Jeanniot, G. Houin, J.P. Tillement, Protein binding
of propisomide, J. Pharm. Sci. 74 (1985) 530-533.
83. Y. Imamura, Y. Kojima, H. Ichibagase, Effect of simultaneous administration of
drugs on absorption and excretion. XIX. Binding of acetohexamide and its major
metabolite, (-)-hydroxyhexamide, to human serum albumin, Chem. Pharm. Bull.
33 (1985) 1281-1284.
84. I. Påhlman, P. Gozzi, Serum protein binding of tolterodine and its major
metabolites in humans and several animal species, Biopharm. Drug Dispos. 20
(1999) 91-99.
85. Z. Zhao, F. Xue, L. Zhang, K. Zhang, C. Fei, W. Zheng, X. Wang, M. Wang, Z.
Zhao, X. Meng, The pharmacokinetics of nitazoxanide active metabolite
(tizoxanide) in goats and its protein binding ability in vitro, J. Vet. Pharmacol.
Ther. 33 (2009) 147-153.
86. J. Chen, C. Ohnmacht, D.S. Hage, Studies of phenytoin binding to human serum
albumin by high-performance affinity chromatography, J. Chromatogr. B 809
(2004) 137-145.
87. Q. Shen, L. Wang, H. Zhou, H. Jiang, L. Yu, S. Zheng, Stereoselective binding of
chiral drugs to plasma proteins, Acta Pharmacologica Sinica 34 (2013) 998-1006.
88. B.S. Sekhon, Exploiting the power of stereochemistry in drugs: an overview of
87
racemic and enantiopure drugs, J. Mod. Med. Chem. 1 (2013) 10-36.
89. M.F. Landoni, A. Soraci, Pharmacology of chiral compounds: 2-arylpropionic
acid derivatives, Curr. Drug Metab. 2 (2001) 37-51.
90. D.E. Drayer, Clinical pharmacology through the looking glass: reflections on the
racemate vs enantiomer debate, Clin. Pharmacol. Ther. 40 (1986) 125-133.
91. J. Patocka, A. Dvorak, Biomedical aspects of chiral molecules, J. Appl. Med. 2
(2004) 95-100.
92. F. Jamali, R. Mehvar, F.M. Pasutto, Enantioselective aspects of drug action and
disposition: therapeutic pitfalls, J. Pharm. Sci. 78 (1989) 695-715.
93. S. Patel, I.W. Wainer, W.J. Lough, in: D.S. Hage (Ed.), Handbook of Affinity
Chromatography, 2nd ed., CRC Press, Boca Raton, 2006, Chap. 21.
94. S. Patel, I.W. Wainer, W.J. Lough, in: D.S. Hage (Ed.), Handbook of Affinity
Chromatography, 2nd ed., CRC Press, Boca Raton, 2006, Chap. 24.
95. D.S. Hage, Chromatographic and electrophoretic studies of protein binding to
chiral solutes, J. Chromatogr. A 906 (2001) 459-481.
96. Y.H. Ardakani, R. Mehvar, A. Foroumadi, M.-R. Rouini, Development and
validation of a rapid HPLC method for simultaneous determination of tramadol,
and its two main metabolites in human plasma, J. Chromatogr. B 864 (2008) 109-
115.
97. T. Kelly, P. Doble, M. Dawson, Chiral analysis of methadone and its major
metabolites (EDDP and EMDP) by liquid chromatography–mass spectrometry, J.
Chromatogr. B 814 (2005) 315-323.
98. Z. Tong, D.S. Hage, Characterization of interaction kinetics between chiral
88
solutes and human serum albumin by using high-performance affinity
chromatography and peak profiling, J. Chromatogr. A 1218 (2011) 6892-6897.
99. B. Loun, D.S. Hage, Chiral separation mechanisms in protein-based HPLC
columns. I. Thermodynamic studies of (R)- and (S)-warfarin binding to
immobilized human serum albumin, Anal. Chem. 66 (1994) 3814-3822.
100. B. Loun, D.S. Hage, Chiral separation mechanisms in protein-based HPLC
columns. II. Kinetic studies of R- and S-warfarin binding to immobilized human
serum albumin, Anal. Chem. 68 (1996) 1218-1225.
101. K.S. Joseph, A.C. Moser, S. Basiaga, J.E. Schiel, D.S. Hage, Evaluation of
alternatives to warfarin as probes for Sudlow site I of human serum albumin:
characterization by high performance affinity chromatography, J. Chromatogr. A
1216 (2009) 3492-3500.
102. J. Yang, D.S. Hage, Characterization of the binding and chiral separation of D-
and L-tryptophan on a high-performance immobilized human serum albumin
column, J. Chromatogr. 645 (1993) 241-250.
103. J. Yang, D.S. Hage, Effect of mobile phase composition on the binding kinetics of
chiral solutes on a protein-based HPLC column: interactions of D- and L-
tryptophan with immobilized human serum albumin, J. Chromatogr. A 766 (1997)
15-25.
104. M.L. Conrad, A.C. Moser, D.S. Hage, Evaluation of indole-based probes for
studying drug binding to human serum albumin in high-performance affinity
separations, J. Sep. Sci. 32 (2009) 1145-1155.
105. R. Matsuda, J. Anguizola, K.S. Joseph, D.S. Hage, High-performance affinity
89
chromatography and the analysis of drug interactions with modified proteins:
binding of gliclazide with glycated human serum albumin, Anal. Bioanal. Chem.
401 (2011) 2811-2819.
106. A.J. Jackson, J. Anguizola, E.L. Pfaunmiller, D.S. Hage, Use of entrapment and
high-performance affinity chromatography to compare the binding of drugs and
site-specific probes with normal and glycated human serum albumin, Anal.
Bioanal. Chem. 405 (2013) 5833-5841.
107. K.S. Joseph, D.S. Hage, Characterization of the binding of sulfonylurea drugs to
HSA by high-performance affinity chromatography, J. Chromatogr. B 878 (2010)
1590-1598.
108. R. Matsuda, J. Anguizola, K.S. Joseph, D.S. Hage, Analysis of drug interactions
with modified proteins by high-performance affinity chromatography: Binding of
glibenclamide to normal and glycated human serum albumin, J. Chromatogr. A
1265 (2012) 114-122.
109. K.S. Joseph, J. Anguizola, A.J. Jackson, D.S. Hage, Chromatographic analysis of
acetohexamide binding to glycated human serum albumin, J. Chromatogr. B 878
(2010) 2775-2781.
110. K.S. Joseph, J. Anguizola, D.S. Hage, Binding of tolbutamide to glycated human
serum albumin, J. Pharm. Biomed. Anal. 54 (2011) 426-432.
111. R. Kaliszan, Retention data from affinity high-performance liquid
chromatography in view of chemometrics, J. Chromatogr. B 715 (1998) 229-244.
112. M. Markuszewski, R. Kaliszan, Quantitative structure-retention relationships in
affinity high-performance liquid chromatography, J. Chromatogr. B 768 (2002)
90
55-56.
113. I.W. Wainer, Enantioselective high-performance liquid affinity chromatography
as a probe of ligand-biopolymer interactions: an overview of a different use for
high-performance liquid chromatographic chiral stationary phases, J. Chromatogr.
A 666 (1994) 221-234.
114. R. Kaliszan, Quantitative structure-retention relationships, Anal. Chem. 64 (1994)
A619-A627.
115. R. Kaliszan, Chromatography and capillary electrophoresis in modelling the basic
processes of drug action, Trends. Anal. Chem. 18 (1999) 400-410.
116. R. Kaliszan, Chemometric analysis of biochromatographic data - implications for
molecular pharmacology, Chemometr. Intell. Lab. Systems 24 (1994) 89-97.
117. R. Kaliszan, A. Kaliszan, T.A.G. Noctor, W.P. Purcell, I.W. Wainer, Mechanism
of retention of benzodiazepines in affinity, reversed phase and adsorption high
performance liquid chromatography in view of quantitative structure retention
relationships, J. Chromatogr. 609 (1992) 69-81.
118. R. Kaliszan, T.A.G. Noctor, I.W. Wainer, Stereochemical aspects of
benzodiazepine binding to human serum albumin. 2. Quantitative relationships
between structure and enantioselective retention in high-performance liquid
affinity-chromatography, Mol. Pharmacol. 42 (1992) 512-517.
119. R. Kaliszan, T.A.G. Noctor, I.W. Wainer, Quantitative structure-enantioselective
retention relationships for the chromatography of 1,4-benzodiazepines on a
human serum-albumin based HPLC chiral stationary phase - an approach to the
computational prediction of retention and enantioselectivity, Chromatographia 33
91
(1992) 546-550.
120. A. Nasal, A. Radwanska, K. Osmialowsk, A. Bucinski, R. Kaliszan, G.E. Barker,
P. Sun, R.A. Hartwick, Quantitative relationships between structure of β-
adrenolytic and antihistamine drugs and their retention on an α1-acid glycoprotein
HPLC column, Biomed. Chromatogr. 8 (1994) 125-129.
121. R. Kaliszan, A. Nasal, M. Turowski, Quantitative structure-retention relationships
in the examination of the topography of the binding site of antihistamine drugs on
alpha(1)-acid glycoprotein, J. Chromatogr. A 722 (1996) 25-32.
122. A. Karlsson, A. Aspegren, Enantiomeric separation of amino alcohols on protein
phases using statistical experimental design. A comparative study, J. Chromatogr.
A 866 (2000) 15-23.
123. R. Kaliszan, A. Nasal, M. Turowski, Binding site for basic drugs on alpha 1-acid
glycoprotein as revealed by chemometric analysis of biochromatographic data,
Biomed. Chromatogr. 707 (1995) 211-215.
124. I. Fitos, J. Visy, M. Simonyi, J. Hermansson, Chiral high-performance liquid
chromatographic separations of vinca alkaloid analogues on alpha 1-acid
glycoprotein and human serum albumin columns, J. Chromatogr. A 609 (1992)
163-171.
125. K. Gyimesi-Forras, G. Szasz, A. Gergely, M. Szabo, J. Kokosi, Study on the
sorption properties of alpha1-acid glycoprotein (AGP)-based stationary phase
modified by organic solvents, J. Chromatogr. Sci. 38 (2000) 430-434.
126. C.H. Johnson, A.D. Patterson, J.I. Idle, F.L. Gonzalez, Xenobiotic metabolomics:
major impact on the metabolome, Annu. Rev. Pharmacol. Toxicol. 52 (2012) 37-
92
56.
127. B.J. Danzo, Environmental xenobiotics may disrupt normal endocrine function by
interfering with the binding of physiological ligands to steroid receptors and
binding proteins, Environ. Health Perspect. 105 (1997) 294-301.
128. A. Diniz, L. Escuder-Gilabert, N.P. Lopes, R.M. Villanueva-Camanas, S.
Sagrado, M.J. Medina-Hernandez, Characterization of interactions between
polyphenolic compounds and human serum proteins by capillary electrophoresis,
Anal. Bioanal. Chem. 391 (2008) 625-632.
129. C.J. Omiecinski, J.P. Vauden Huevel, G.H. Perdew, J.H. Peters, Xenobiotic
metabolism, disposition, and regulation by receptors: from biochemical
phenomenon to predictors of major toxicities, Toxicol. Sci. 120 (2011) S49-S75.
130. A.O. Cheek, K. Kow, J. Chen, J.A. McLachlan, Potential mechanisms of thyroid
disruption in humans: interaction of organochlorine compounds with thyroid
receptor, transthyretin, and thyroid-binding globulin, Environ. Health Perspect.
107 (1999) 273-278.
131. J. Cao, Y. Lin, L. Guo, A. Zhang, Y. Wei, Y. Yang, Structure-based investigation
on the binding interaction of hydroxylated polybrominated diphenyl ethers with
thyroxine transport proteins, Toxicol. 277 (2010) 20-28.
132. J.R. Fowles, A. Fairbrother, L. Baecher-Steppan, N.I. Kerkvliet, Immunologic
and endocrine effects of the flame-retardant pentabromodiphenyl ether (DE-71) in
C57BL/6J mice, Toxicol. 86 (1994) 49–61.
133. S. Hallgren, T. Sinjari, H. Hakansson, P.O. Darnerud, Effects of polybrominated
diphenyl ethers (PBDEs) and polychlorinated biphenyls (PCBs) on thyroid
93
hormone and vitamin A levels in rats and mice, Arch. Toxicol. 75 (2001) 200–
208.
134. D.S. Hage, J. Austin, High-performance affinity chromatography and
immobilized serum albumin as probes for drug- and hormone-protein binding, J.
Chromatogr. B 739 (2000) 39-54.
135. I. Tabas, Nonoxidative modifications of lipoproteins in atherogenesis, Annu. Rev.
Nutr. 19 (1999) 123-139.
136. C.A. Cobbold, J.A. Sherratt, S.R.J. Maxwell, Lipoprotein oxidation and its
significance for atherosclerosis: a mathematical approach, Bull. Math. Biol. 64
(2002) 65-95.
137. C. Bertucci, E. Domenici, Reversible and covalent binding of drugs to human
serum albumin: methodological approaches and physiological relevance, Curr.
Med. Chem. 9 (2002) 1463-1481.
138. G.A. Ascoli, E. Domenici, C. Bertucci, Drug binding to human serum albumin:
abridged review of results obtained with high-performance liquid chromatography
and circular dichroism, Chirality 18 (2006) 667–679.
139. X.M. He, D.C. Carter, Atomic structure and chemistry of human serum albumin,
Nature 358 (1992) 209-15.
140. G. Fanali, A. di Masi, V. Trezza, M. Marino, M. Fasano, P. Ascenzi, Human
serum albumin: from bench to bedside, Mol. Aspects Med. 33 (2012) 209-290.
141. T.A.G. Noctor, I.W. Wainer, The in situ acetylation of an immobilized human
serum albumin chiral stationary phase for high-performance liquid
chromatography in the examination of drug-protein binding phenomena,
94
Pharmaceut. Res. 9 (1992) 480-484.
142. A. Chattopadhyay, T. Tian, L. Kortum, D.S. Hage, Development of tryptophan-
modified human serum albumin columns for site-specific studies of drug-protein
interactions by high-performance affinity chromatography, J. Chromatogr. B 715
(1998) 183-190.
143. D.S. Hage, J. Chen, in: D.S. Hage (Ed.), Handbook of Affinity Chromatography,
2nd ed., CRC Press, Boca Raton, 2006, Chap. 22.
144. C. Bertucci, B. Nanni, A. Raffaelli, P. Salvadori, Chemical modification of
human albumin at Cys34 by ethacrynic acid: structural characterization and
binding properties, J. Pharm. Biomed. Anal. 18 (1998) 127-136.
145. J. Anguizola, R. Matsuda, O.S. Barnaby, K.S. Hoy, C. Wa, E. DeBolt, M. Koke,
D.S. Hage, Review: glycation of human serum albumin, Clin. Chim. Acta 425
(2013) 64-76.
146. J.W.L. Hartog, A.A. Voors, S.J.L. Bakker, A.J. Smit, D.J.V. Veldhuisen,
Advanced glycation end-products (AGEs) and heart failure: pathophysiology and
clinical implications, Eur. J. Heart Fail. 9 (2007) 1146-1155.
147. P.J. Thornalley, A. Langborg, H.S. Minhas, Formation of glyoxal, methylglyoxal
and 3-deoxyglucosone in the glycation of proteins by glucose, Biochem. J. 344
(1999) 109-116.
148. D.M. Richard, M.A. Dawes, C.W. Mathias, A. Acheson, N. Hill-Kapturczak,
D.M. Dougherty, L-Tryptophan: basic metabolic functions, behavioral research
and therapeutic indications, Int. J. Tryptophan Res. 2 (2009) 45-60.
149. K.S. Joseph, D.S. Hage, The effects of glycation on the binding of human serum
95
albumin to warfarin and L-tryptophan, J. Pharm. Biomed. Anal. 53 (2010) 811-
818.
150. M.J. Kimzey, H.N. Yassine, B.M. Riepel, G. Tsaprailis, T.J. Monks, S.S. Lau,
New site(s) of methylglyoxal-modified human serum albumin, identified by
multiple reaction monitoring, alter warfarin binding and prostaglandin
metabolism, Chem. Biol. Int. 192 (2011) 122-128.
151. D. Tang, J.-X. Zhu, A.-G. Wu, Y.-H. Xu, T.-T. Duan, Z.-G. Zheng, R.-S. Wang,
D. Li, Q. Zhu, Pre-column incubation followed by fast liquid chromatography
analysis for rapid screening of natural methylglyoxal scavengers directly from
herbal medicines: case study of Polygonum cuspidatum, J. Chromatogr. A 1286
(2013) 102-110.
152. F. Ceciliani, V. Pocacqua, The acute phase protein α1-acid glycoprotein: a model
for altered glycosylation during diseases, Curr. Protein Pept. Sci. 8 (2007) 91-108.
153. Y. Kuroda, Y. Kita, A. Shibukawa, T. Nakagawa, Role of biantennary glycans
and genetic variants of human alpha1-acid glycoprotein in enantioselective
binding of basic drugs as studied by high performance frontal analysis/capillary
electrophoresis, Pharm. Res. 18 (2001) 389-393.
154. S. Kishino, A. Nomura, S. Itoh, T. Nakagawa, Y. Takekuma, M. Sugawara, H.
Furukawa, S. Todo, K. Miyazaki, Age- and gender-related differences in
carbohydrate concentrations of alpha1-acid glycoprotein variants and the effects
of glycoforms on their drug-binding capacities, Eur. J. Clin. Pharmacol. 58 (2002)
621-628.
155. T. Nakagawa, S. Kishino, S. Itoh, M. Sugawara, K. Miyazaki, Differential
96
binding of disopyramide and warfarin enantiomers to human alpha(1)-acid
glycoprotein variants, Br. J. Clin. Pharmacol. 56 (2003) 664-669.
156. Y. Kakiuchi, Y. Kohda, M. Miyabe, Y. Momose, Effect of plasma alpha1-acid
glycoprotein concentration on the accumulation of lidocaine metabolites during
continuous epidural anesthesia in infants and children, Int. J. Clin. Pharmacol.
Ther. 37 (1999) 493-498.
157. S.G. Soriano, L.J. Sullivan, K. Venkatakrishnan, D.J. Greenblatt, J.A. Martyn,
Pharmacokinetics and pharmacodynamics of vecuronium in children receiving
phenytoin or carbamazepine for chronic anticonvulsant therapy, Br. J. Anaesth. 86
(2001) 223-229.
158. J.R. McNamara, G.R. Warnick, G.R. Cooper, A brief history of lipid and
lipoprotein measurements and their contribution to clinical chemistry, Clin. Chim.
Acta 369 (2006. 369) 158-167.
159. A. Jonas, in: D.E. Vance, J.E. Vance (Eds.), Biochemistry of Lipids, Lipoproteins,
and Membranes, Elsevier-Science Publishers, Amsterdam, 2002, p. 483.
160. M. Barklay, in: G.J. Nelson (Ed.), Blood Lipids and Lipoproteins Quantitation,
Composition, and Metabolism, Wiley-Interscience, New York, 1972, p. 587.
161. K.M. Wasan, S.M. Cassidy, Role of plasma lipoproteins in modifying the
biological activity of hydrophobic drugs, J. Pharm. Sci. 87 (1998) 411–424.
162. P.N. Durrington, in: P.N. Durrington (Ed.), Lipoproteins and Lipids, Wright,
London, 1989, p. 255.
163. R.J. Havel, J.P. Kane, in: C.R. Scriver, A.L. Beaudet, W.S. Sly, D Valle (Eds.),
The Metabolic and Molecular Basis of Inherited Disease, McGraw-Hill
97
Professional, New York, 1995, p. 1129.
164. V.R. Skipski, in: G.J. Nelson (Ed.), Blood Lipids and Lipoproteins Quantitation,
Composition, and Metabolism, Wiley-Interscience, New York, 1972, p. 587.
165. T.C. Kwong, Free drug measurements: methodology and clinical significance,
Clin. Chim. Acta. 151 (1985) 193–216.
166. S. Glasson, The distribution of bound propranolol between the different human
serum proteins, Mol. Pharmacol. 17 (1980) 187–191.
167. T. Ohnishi, N.A.L. Mohamed, A. Shibukawa, Y. Kuroda, T. Nakagawa, S. El
Gizawy, H.F. Askal, M.E. El Kommos, Frontal analysis of drug–plasma
lipoprotein binding using capillary electrophoresis, J. Pharm. Biomed. Anal. 27
(2002) 607–614.
168. N.A.L. Mohamed, Y. Kuroda, A. Shibukawa, T. Nakagawa, S. El Gizawy, H.F.
Askal, M.E. El Kommos, Enantioselective binding analysis of verapamil to
plasma lipoproteins by capillary electrophoresis-frontal analysis, J. Chromatogr.
A 875 (2000) 447–453.
169. N.A.L. Mohamed, Y. Kuroda, A. Shibukawa, T. Nakagawa, S. El Gizawy, H.F.
Askal, M.E. El Kommos, Binding analysis of nilvadipine to plasma lipoproteins
by capillary electrophoresis-frontal analysis, J. Pharm. Biomed. Anal. 21 (1999)
1037–1043.
170. H.S. Kim, I.W. Wainer, Rapid analysis of the interactions between drugs and
human serum albumin (HSA) using high-performance affinity chromatography
(HPAC), J. Chromatogr. B 870 (2008) 22–26.
171. F. Hollósy, K. Valkó, A. Hersey, S. Nunhuck, G. Kéri, C.J. Bevan, Estimation of
98
volume of distribution in humans from high throughput HPLC-based
measurements of human serum albumin binding and immobilized artificial
membrane partitioning, Med. Chem. 49 (2006) 6958-6971.
172. L. Buchholz, C.H. Cai, L. Andress, A. Cleton, J. Brodfuehrer, L. Cohen,
Evaluation of the human serum albumin column as a discovery screening tool for
plasma protein binding, Eur. J. Pharm. Sci. 15 (2002), 209–215.
173. S. Chen, M.R. Sobansky, D.S. Hage, Analysis of drug interactions with high
density lipoproteins by high-performance affinity chromatography, Anal.
Biochem. 397 (2010) 107-114.
174. M.R. Sobansky, D.S. Hage, Identification and analysis of stereoselective drug
interactions with low density lipoprotein by high-performance affinity
chromatography, Anal. Bioanal. Chem. 403 (2012) 563-571.
175. M.R. Sobansky, D.S. Hage, in: Advances in Medicine and Biology, Vol. 53, L.V.
Berhardt (Ed.), Nova Science, Hauppage, 2012, Chapter 9.
176. Y. Kuroda, B. Cao, A. Shibukawa, T. Nakagawa, Effect of oxidation of low-
density lipoprotein on drug binding affinity studied by high performance frontal
analysis-capillary electrophoresis, Electrophoresis 22 (2001) 3401-3407.
99
CHAPTER 3:
HIGH-PERFORMANCE AFFINITY CHROMATOGRAPHY AND THE
ANALYSIS OF DRUG INTERACTIONS WITH MODIFIED PROTEINS:
BINDING OF GLICLAZIDE WITH GLYCATED HUMAN SERUM ALBUMIN
Note: Portions of this chapter have appeared in R. Matsuda, J. Anguizola, K.S. Joseph,
D.S. Hage, “High-performance affinity chromatography and the analysis of drug
interactions with modified proteins: Binding of gliclazide with glycated human serum
albumin”, Anal. Bioanal. Chem. 401 (2011) 2811-2819.
3.1 Introduction
The American Diabetes Association reports that an estimated 25.8 million
children and adults in the U.S. have diabetes, representing almost 8.3% of the population
[1]. Diabetes is a health condition that is related to insulin deficiency or a resistance to
insulin. This disorder results in an increased level of glucose in blood. There are two
main types of diabetes. Type I diabetes (i.e., juvenile or insulin-dependent diabetes) is
caused when the immune system attacks pancreatic beta cells and results in little or no
production of insulin. These patients require insulin for treatment. Type II diabetes (i.e.,
non-insulin dependent or adult onset diabetes) is the most common type of diabetes and is
created by insulin resistance [1].
Type II diabetes is frequently treated by using sulfonylurea drugs [2].
Sulfonylurea drugs increase the amount of insulin that is released from beta cells in the
pancreas, which helps control the buildup of glucose in blood. Gliclazide (see Fig. 3-1) is
a second generation sulfonylurea drug that is taken orally. Second-generation
sulfonylurea drugs like gliclazide have a better effectiveness than first-generation
100
Figure 3-1. Structure of gliclazide.
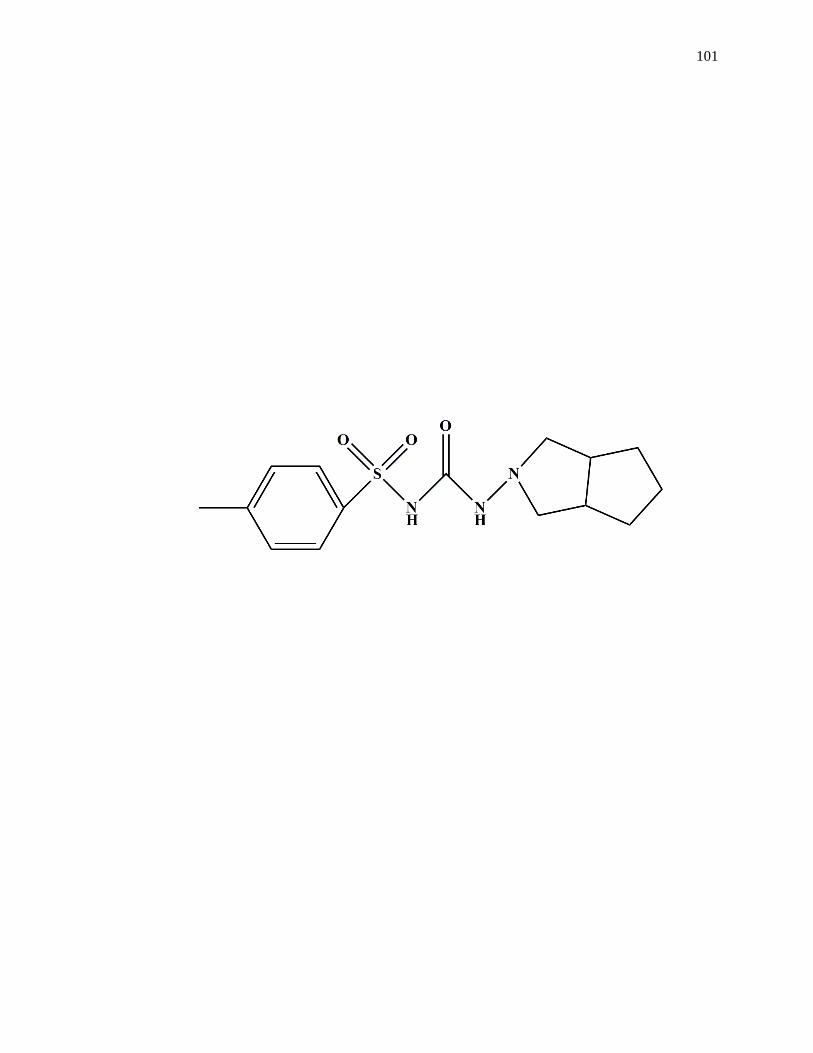
101
102
sulfonylurea drugs (e.g., acetohexamide and tolbutamide) in the treatment of diabetes and
are more easily excreted by the body [3].
Sulfonylureas such as gliclazide are known to be tightly bound to serum proteins
when these drugs are in blood. The most abundant serum protein is human serum
albumin (HSA) [4-10], which is also the main carrier protein for sulfonylurea drugs in the
circulation [4]. HSA has a mass of 66.5 kDa and has two major binding sites for drugs:
Sudlow sites I and II [4]. Sudlow site I is located in subdomain IIA of HSA and is known
to bind a variety of drugs, such as warfarin, azapropazone, phenylbutazone, and salicylate
[5]. Sudlow site II is in subdomain IIIA of HSA and has been shown to bind to
ibuprofen, fenoprofen, ketoprofen, benzodiazepines, and L-tryptophan [5]. Both Sudlow
sites I and II have also been found to bind to the first-generation sulfonylurea drugs
acetohexamide and tolbutamide [6,7].
Glycation is a type of protein modification that is believed to alter the interactions
of some drugs with HSA. Glycation occurs when the presence of glucose in blood leads
to the non-enzymatic addition of glucose with proteins. This process initially occurs
through a reaction between glucose or a reducing sugar and a free amine group on a
protein (see Fig. 3-2) [8-13]. Normal individuals have 6-13% of their HSA in a form that
is glycated in blood [8,9,11]. A person with diabetes has approximately 20-30% or more
of their HSA in a glycated form [8,9,11]. In addition, it is known that both Sudlow sites I
and II can be modified as a result of glycation [8-13] and that this modification can affect
the binding of first-generation sulfonylurea drugs at these sites [6,7]. Although the
pharmacokinetics and overall serum protein binding of gliclazide has been previously
examined for healthy and diabetic subjects [14,15], no detailed information was provided
103
Figure 3-2. General reactions involved in the glycation of HSA.
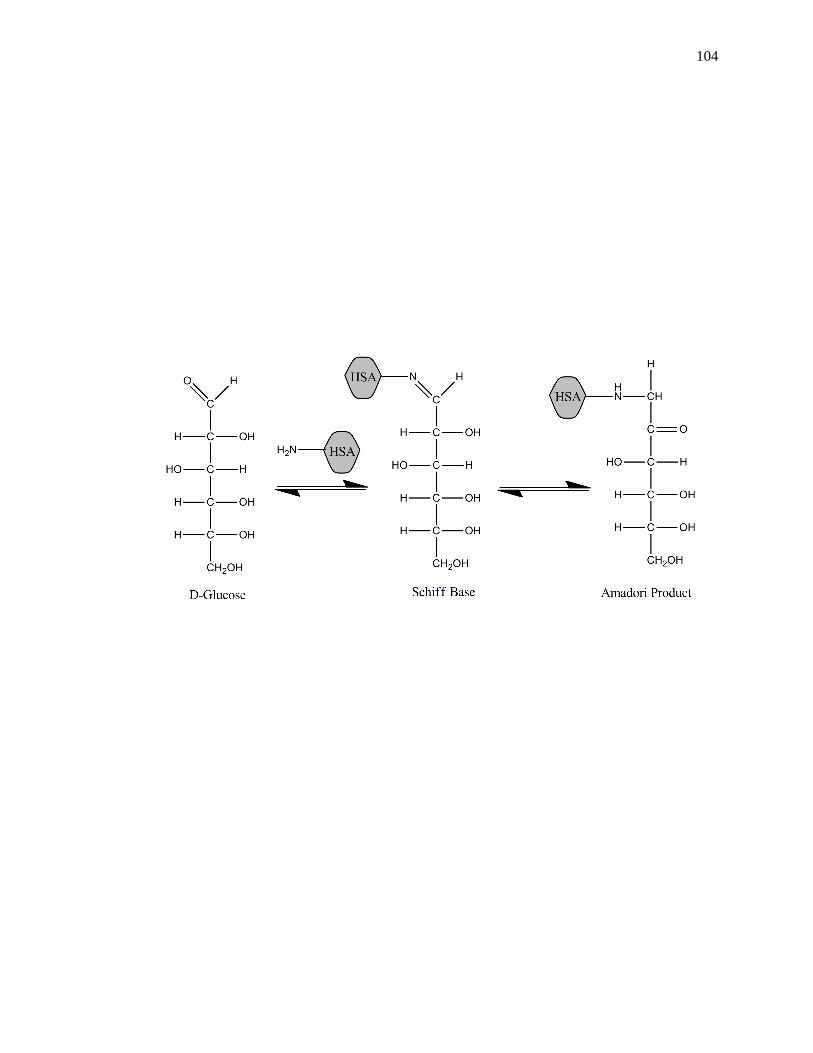
104
105
in this prior work on the strength of this binding with HSA or on the effects of glycation
on gliclazide-HSA interactions.
The purpose of this study will be to use high-performance affinity
chromatography (HPAC) to examine the binding of gliclazide to normal HSA and HSA
that has been modified in vitro to contain various stages of glycation [16-18]. HPAC is a
type of HPLC that uses an immobilized biological molecule (e.g., HSA) as the stationary
phase [16]. It is known from prior work that HPAC can be used with HSA columns to
provide precise and fast measurements of drug-protein interactions with results that give
good agreement with those obtained for soluble HSA [17]. Other advantages of using
HPAC for this type of research are its ease of automation and its ability to use the same
preparation of a protein for hundreds of experiments [16-18]. Recent work with HPAC
as a screening method has indicated that significant changes can occur in the binding of
gliclazide with HSA during glycation, resulting in trends similar to those seen for
acetohexamide and tolbutamide [19]. This chapter will examine these interactions in a
quantitative manner by first using the method of frontal analysis (or frontal affinity
chromatography) to determine the overall equilibrium constants and binding capacities
for gliclazide with normal HSA and glycated HSA. Competition studies will then be
conducted to examine the specific binding of gliclazide at Sudlow sites I and II on HSA
at various stages of glycation. The results should be useful in determining how glycation
can affect the binding of gliclazide, and related drugs, to HSA during diabetes. This
chapter will also illustrate how HPAC can be used as a tool to examine the overall
binding and site-selective interactions of drugs or other solutes with modified proteins.
106
3.2 Experimental
3.2.1 Chemicals
The gliclazide (≥ 99.9% pure), R-warfarin (≥ 97%), L-tryptophan (≥ 98%), D-(+)-
glucose (99.5%), sodium azide (>95%), HSA (essentially fatty acid free, ≥ 96%), and
commercial sample of in vitro glycated HSA (Lot 058K6087) were from Sigma-Aldrich
(St. Louis, MO, USA). Nucleosil Si-300 (7 µm particle diameter, 300 Å pore size) was
obtained from Macherey-Nagel (Düren, Germany). Reagents for the bicinchoninic acid
(BCA) protein assay were from Pierce (Rockford, IL, USA). A fructosamine assay kit,
which was used for measuring glycation levels, was purchased from Diazyme
Laboratories (San Diego, CA, USA). All aqueous solutions were prepared using water
from a Nanopure system (Barnstead, Dubuque, IA, USA) and were filtered through 0.20
µm GNWP nylon membranes from Millipore (Billerica, MA, USA).
3.2.2 Instrumentation
The HPLC system consisted of a DG-2080-53 degasser, two PU-2080 pumps, an
AS-2057 autosampler, a CO-2060 column oven, and a UV-2075 absorbance detector
from Jasco (Tokyo, Japan), plus a Rheodyne Advantage PF six-port valve (Cotati, CA,
USA). Chromatograms were collected using EZChrom Elite v3.2.1 (Scientific Software,
Pleasanton, CA, USA) and Jasco LC Net. Non-linear regression was carried out by using
Data Fit 8.1.69 (Oakdale, PA, USA).
3.2.3 Methods
Nucleosil Si-300 silica was converted into a diol-bonded form, and HSA was
immobilized onto the diol-bonded silica through the Schiff base method, as described
107
previously [20-23]. A control support was prepared in the same manner but with no HSA
being added during the immobilization step (Note: Although free amine groups are
involved in both the Schiff base immobilization method and glycation, these processes
tend to involve different residues on HSA [6,7,21]). All supports were downward slurry
packed into separate 2.0 cm × 2.1 mm I.D. columns at 3500 psi (24 MPa). A pH 7.4,
0.067 M potassium phosphate buffer was used as the packing solution. The columns
were stored at 4 °C and all experiments were performed over the course of less than 500
sample applications, with the columns being routinely washed and used with sterile pH
7.4, 0.067 M phosphate buffer. No significant changes in binding properties were noted
under these conditions during the course of this study [22].
A BCA assay was used to directly determine the immobilized protein content for
each support, using HSA or glycated HSA as the standard and the control support as the
blank. The amount of protein in the normal HSA support was 38 (± 3) mg HSA/g silica.
Three glycated HSA supports, each having different levels of modification, were used.
The first glycated HSA sample (gHSA1) was purchased from Sigma and was prepared
under proprietary conditions. The second and third samples (gHSA2 and gHSA3) were
prepared in vitro as described previously [6,7,21] and using conditions similar to those
found in the serum of patients with controlled or advanced diabetes [24]. The amount of
protein on these glycated HSA supports was 29 (± 4), 47 (± 8), or 40 (± 3) mg HSA/g
silica, respectively; this amount corresponded to 10.9-17.6 nmol protein within a 2.0 cm
× 2.1 mm I.D. column.
The level of glycation for each HSA sample was determined in replicate through
the use of a fructosamine assay [6,7]. The gHSA1 sample was found by this assay to
108
contain 1.31 (± 0.05) mol hexose/mol HSA and represented mildly glycated HSA, as
might be present in pre-diabetes or early stage diabetes. The gHSA2 sample contained
2.34 (± 0.13) mol hexose/mol HSA and was representative of many patients with
controlled diabetes [26]. The gHSA3 sample had 3.35 (± 0.14) mol hexose/mol HSA and
represented a situation found in patients with uncontrolled or advanced diabetes [27].
Solutions of gliclazide, R-warfarin, and L-tryptophan were prepared in pH 7.4,
0.067 M potassium phosphate buffer. The same buffer was used as the application and
elution buffer in the chromatographic studies. The mobile phases were filtered using a
0.2 µM nylon filter and degassed for 10-15 min before use. All experiments were carried
out at 37 °C and 0.5 mL/min, which has been shown in prior work to allow for the
measurement of reproducible retention factors, binding capacities, and association
equilibrium constants during frontal analysis and zonal elution studies for the types of
columns that were used in this report [23,24].
The columns were first equilibrated with pH 7.4, 0.067 M potassium phosphate
buffer. In the frontal analysis experiments, a switch was then made to the same buffer
that contained a known concentration of gliclazide. Once a breakthrough curve had
formed, pH 7.4, 0.067 M potassium phosphate buffer was then passed again through the
column to elute the retained drug. Concentrations of 1-200 µM gliclazide were used in
these experiments and the elution of gliclazide was monitored at 250 nm. Although
gliclazide is a weak acid with a pKa of 5.8 [25], less than a 0.05 unit change in pH
occurred when this drug was added to the pH 7.4 phosphate buffer over the entire tested
range of gliclazide concentrations. Each frontal analysis experiment was performed in
quadruplicate and the central location of each breakthrough curve was determined using
109
the equal area method and PeakFit 4.12 (Jandel Scientific Software, San Rafael, CA,
USA) [16]. Based on the results that were obtained for the control column, a correction
was made for non-specific binding of gliclazide to the support by subtracting the control
results from the data for a column containing normal HSA or glycated HSA. Non-
specific binding to the support made up approximately 39% of the total binding for 1 µM
gliclazide on an HSA column and was easily corrected by this approach, as noted
previously for related drugs on similar columns [6,7].
The zonal elution studies were carried out in quadruplicate using R-warfarin as a
site-specific probe for Sudlow site I and L-tryptophan as a probe for Sudlow site II [5].
During these experiments, 1-20 µM gliclazide was placed into the mobile phase as 20 µL
injections of 5 µM R-warfarin and L-tryptophan were made (i.e., sample conditions found
earlier to represent linear elution conditions on the types of columns that were examined
in this study) [23]. The elution of R-warfarin or L-tryptophan was monitored at 308 nm
or 280 nm, respectively. Sodium nitrate was injected and monitored at 205 nm as a non-
retained solute; this solute has been found in numerous studies to be a good index of the
void volume and void time for similar HSA columns (e.g., see Refs. [17-24]). Data from
the competition studies were fit to exponentially-modified Gaussian curves and analyzed
using PeakFit v4.12.
3.3 Results and Discussion
3.3.1 Frontal analysis studies
The first set of experiments used frontal analysis to examine the overall binding
of gliclazide to samples of either normal or glycated HSA within HPAC columns. This
work was used to provide initial estimates of the association equilibrium constants and
110
moles of binding sites for gliclazide with these protein preparations. Some typical
chromatograms that were generated for normal HSA during these experiments are given
in Fig. 3-3(a). The resulting data were first analyzed by using a one-site binding model,
as represented by Eqs. (1) and (2) [16-18].
One-site model: 𝑚𝐿𝑎𝑝𝑝 =𝑚𝐿𝐾𝑎[A]
(1+𝐾𝑎[A]) (1)
1
𝑚𝐿𝑎𝑝𝑝=
1
(𝐾𝑎𝑚𝐿[A])+
1
𝑚𝐿 (2)
The term mLapp in Eqs. (1) and (2) represents the apparent moles of the applied analyte
(i.e., gliclazide) that were required to reach the central point of a breakthrough curve at a
given concentration of analyte in the mobile phase, [A] [17]. The association equilibrium
constant and total moles of binding sites for the analyte in the column are described in
Eqs. (1) and (2) by Ka and mLtot.
Similar equations can be created for systems with multiple binding sites, as shown
for a two-site model in Eqs. (3) and (4) [16-18].
Two-site model: 𝑚𝐿𝑎𝑝𝑝 =𝑚𝐿1𝐾𝑎1[A]
(1+𝐾𝑎1[A])+
𝑚𝐿2𝐾𝑎2[A]
(1+𝐾𝑎2[A]) (3)
1
𝑚𝐿𝑎𝑝𝑝=
1+𝐾𝑎1[A]+𝛽2𝐾𝑎1[A]+𝛽2𝐾𝑎12[A]2
𝑚𝐿{(𝛼1+𝛽2−𝛼1𝛽2)𝐾𝑎1[A]+𝛽2𝐾𝑎12[A]2}
(4)
These equations now include two association equilibrium constants (Ka1 and Ka2), which
represent the high and lower affinity sites in the column. The amounts of these two types
of sites, in moles, are described by mL1 and mL2. The α1 in Eq. (4) is the ratio of the moles
of active binding sites high affinity site to the all of the active binding sites (i.e., α1 =
mL1/mLtot). The term β2 in Eq. (4) is the ratio of the association equilibrium constants for
the low versus high affinity sites, or β2 = Ka2/Ka1.
Fig. 3-3(b) shows a typical binding isotherm that was obtained when the frontal
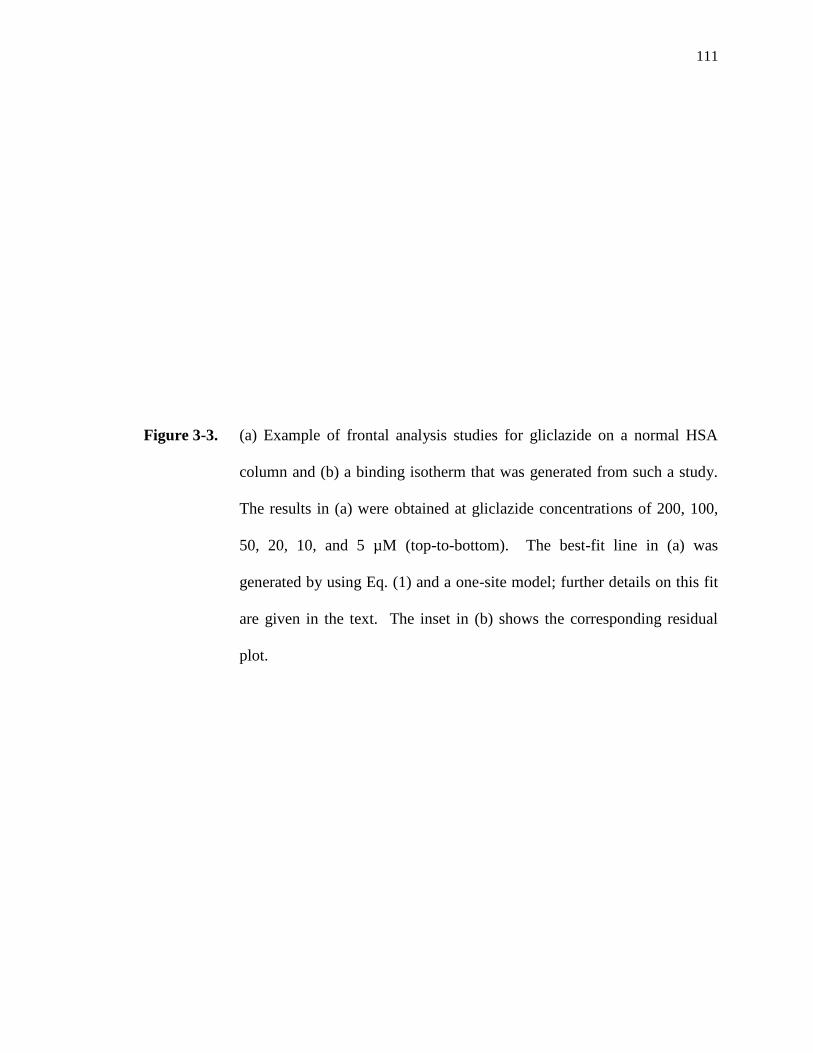
111
Figure 3-3. (a) Example of frontal analysis studies for gliclazide on a normal HSA
column and (b) a binding isotherm that was generated from such a study.
The results in (a) were obtained at gliclazide concentrations of 200, 100,
50, 20, 10, and 5 µM (top-to-bottom). The best-fit line in (a) was
generated by using Eq. (1) and a one-site model; further details on this fit
are given in the text. The inset in (b) shows the corresponding residual
plot.
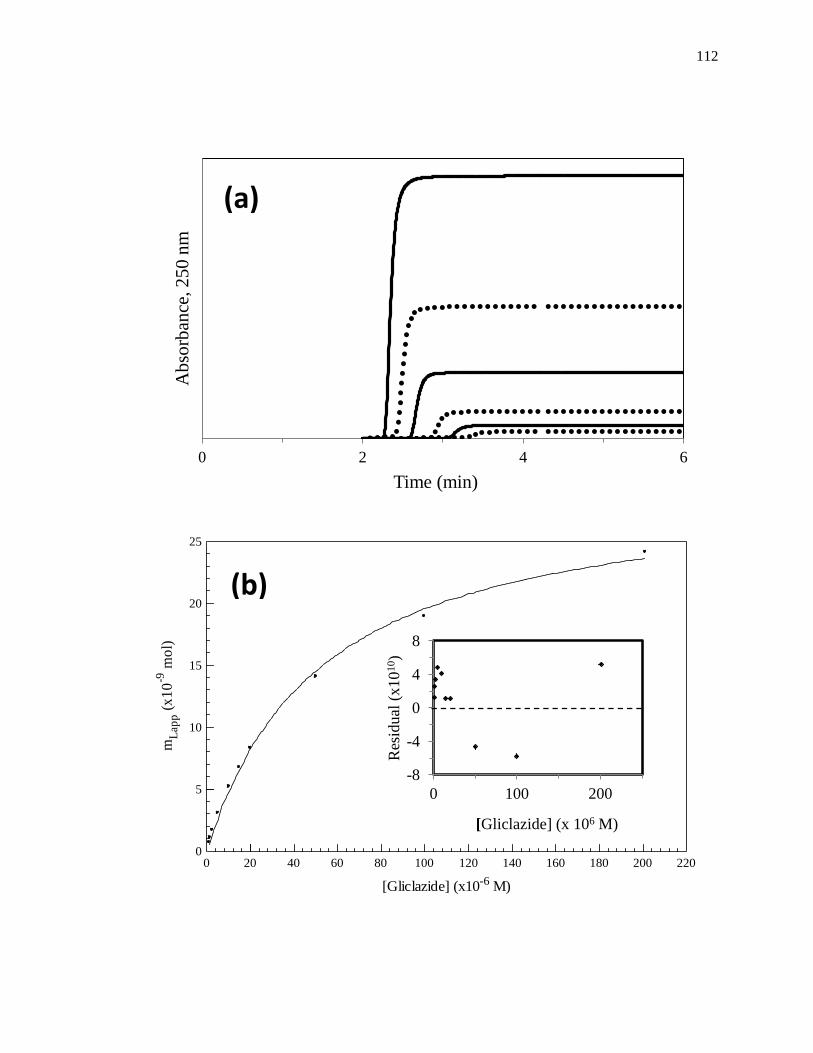
112
mL
ap
p (
x1
0-9
mo
l)
[Gliclazide] (x10-6 M)
0
5
10
15
20
25
0 20 40 60 80 100 120 140 160 180 200 220
0 2 4 6
Ab
sorb
ance
, 2
50
nm
Time (min)
-8
-4
0
4
8
0 100 200
Res
idual
(x
10
10)
[Gliclazide] (x 106 M)
(a)
(b)
113
analysis data for the normal HSA column were examined according to Eq. (1). The use
of non-linear regression gave a best-fit line for Eq. (1) that had a correlation coefficient of
0.998 (n = 10). The best-fit parameters for this line provided a Ka value of 1.9 (± 0.1)
104 M
-1 and a value for mLtot of 3.0 (± 0.1) 10
-8 mol. The binding data were also
examined by using double-reciprocal plots of 1/mLapp vs. 1/[A], as illustrated in Fig. 3-
4(a) for the normal HSA column. According to Eq. (2), this type of plot should result in a
linear relationship if one-site binding is present between the applied analyte and
immobilized binding agent [17]. The plot that was obtained in this case gave a linear
response (correlation coefficient, 0.999 for n = 7) at the lowest analyte concentrations, or
highest values of 1/[A]. However, a small amount of curvature at lower values of 1/[A]
was observed. According to Eq. (4), this curvature indicates that some multi-site
interactions were present.
The linear behavior seen in Fig. 3-4(a) at high values of 1/[A] (or low values of
[A]) is predicted by Eq. (5) [16]. It is known from previous work that this linear range
lim[A]→01
𝑚𝐿𝑎𝑝𝑝=
1
𝑚𝐿(𝛼1+𝛽2−𝛼1𝛽2)𝐾𝑎1[A]+
𝛼1+𝛽22−𝛼1𝛽2
2
𝑚𝐿(𝛼1+𝛽2−𝛼1𝛽2)2 (5)
will be seen for any system with multiple and independent binding sites and can be used
to estimate the association equilibrium constant for the highest affinity sites in the system
[16]. From this linear range, an estimate of 3.4 (± 0.1) × 104 M
-1 was obtained for the
average Ka of gliclazide at its high affinity sites on HSA.
Because the plots in Fig. 3-3(b) and 3-4(a) suggested that multi-site binding was
present for gliclazide with HSA, the frontal analysis data were next examined by using a
two-site model. The resulting fit that was obtained for gliclazide with normal HSA is
shown in Fig.3-4(b). The two-site model provided a slightly better fit than the one-site
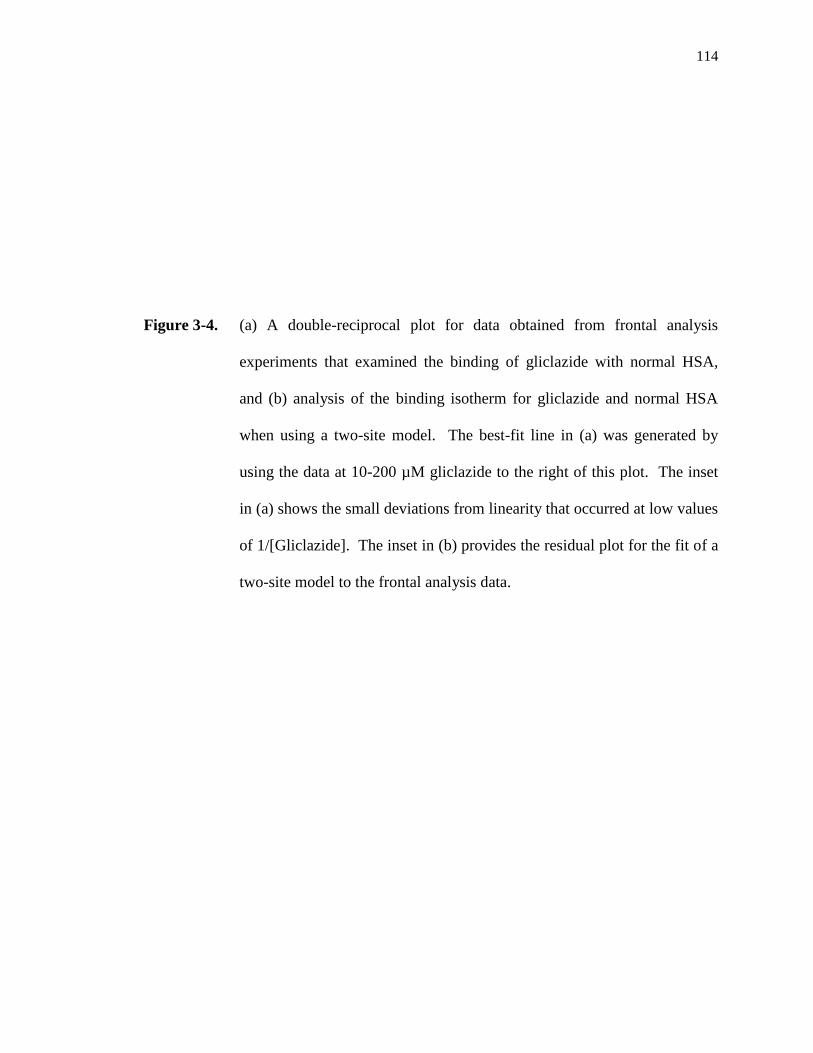
114
Figure 3-4. (a) A double-reciprocal plot for data obtained from frontal analysis
experiments that examined the binding of gliclazide with normal HSA,
and (b) analysis of the binding isotherm for gliclazide and normal HSA
when using a two-site model. The best-fit line in (a) was generated by
using the data at 10-200 µM gliclazide to the right of this plot. The inset
in (a) shows the small deviations from linearity that occurred at low values
of 1/[Gliclazide]. The inset in (b) provides the residual plot for the fit of a
two-site model to the frontal analysis data.
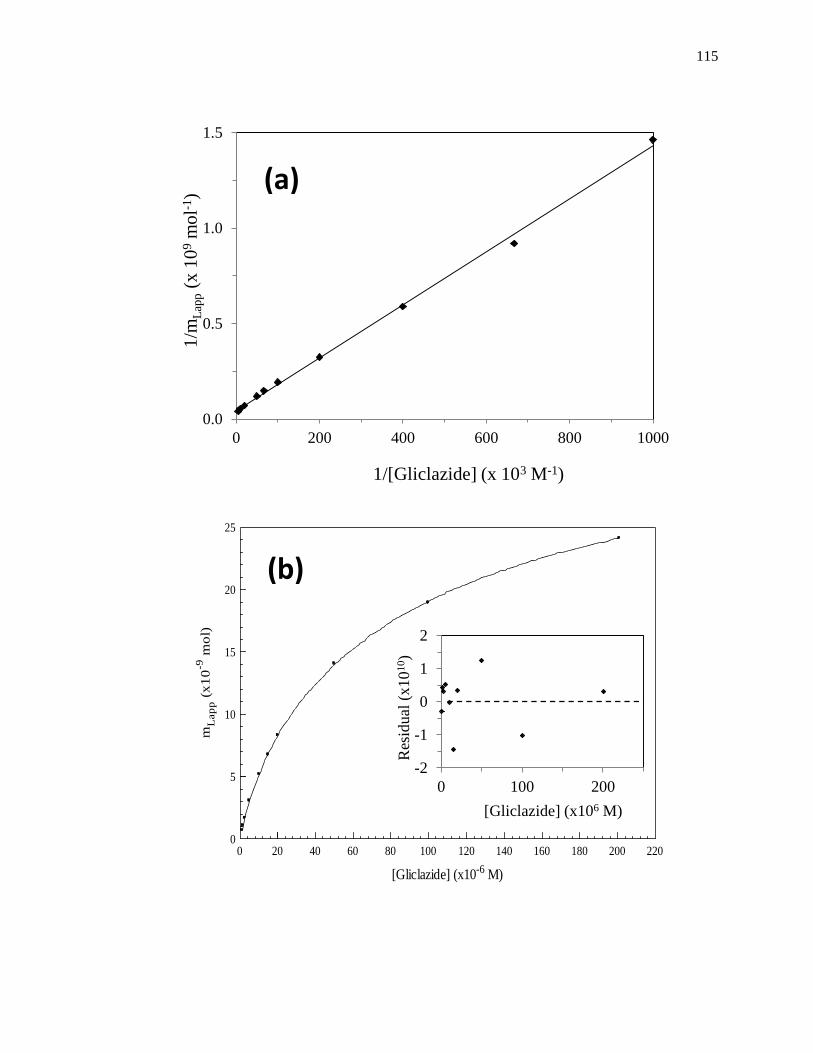
115
mL
ap
p (
x1
0-9
mo
l)
[Gliclazide] (x10-6 M)
0
5
10
15
20
25
0 20 40 60 80 100 120 140 160 180 200 220
0.0
0.5
1.0
1.5
0 200 400 600 800 1000
1/m
Lap
p (
x 1
09 m
ol-1
)
1/[Gliclazide] (x 103 M-1)
-2
-1
0
1
2
0 100 200
Res
idual
(x
10
10)
[Gliclazide] (x106 M)
(a)
(b)
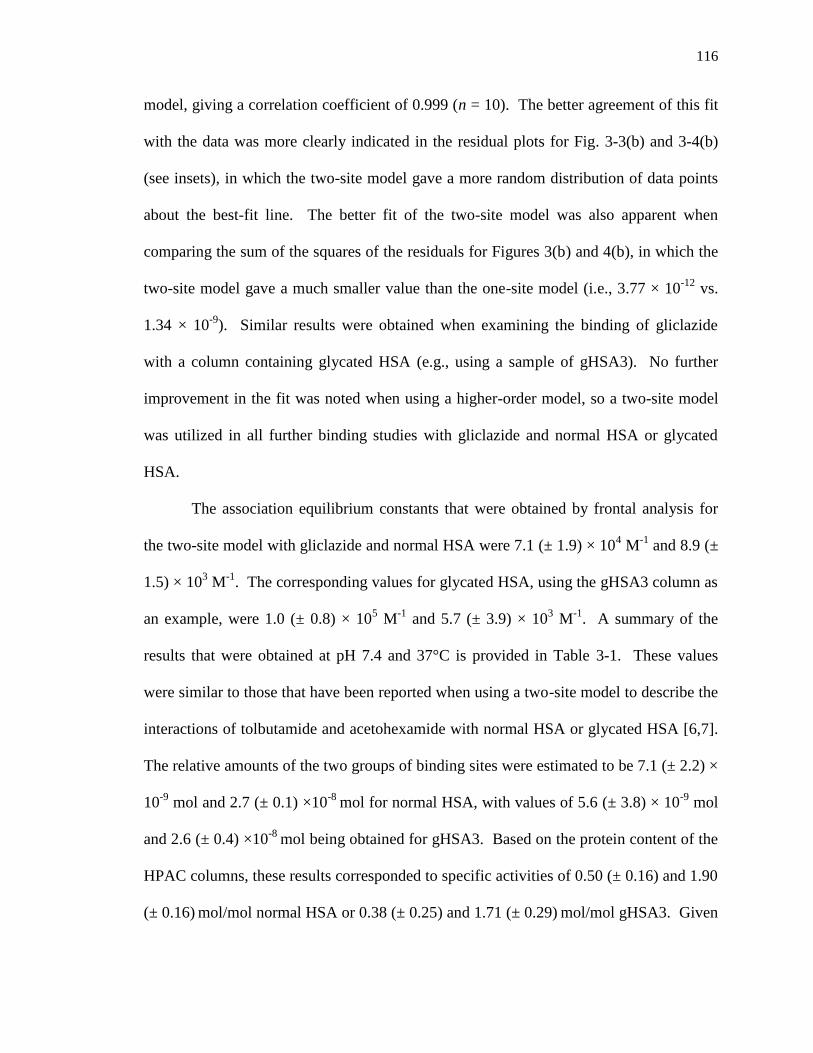
116
model, giving a correlation coefficient of 0.999 (n = 10). The better agreement of this fit
with the data was more clearly indicated in the residual plots for Fig. 3-3(b) and 3-4(b)
(see insets), in which the two-site model gave a more random distribution of data points
about the best-fit line. The better fit of the two-site model was also apparent when
comparing the sum of the squares of the residuals for Figures 3(b) and 4(b), in which the
two-site model gave a much smaller value than the one-site model (i.e., 3.77 × 10⁻¹²
vs.
1.34 × 10⁻⁹
). Similar results were obtained when examining the binding of gliclazide
with a column containing glycated HSA (e.g., using a sample of gHSA3). No further
improvement in the fit was noted when using a higher-order model, so a two-site model
was utilized in all further binding studies with gliclazide and normal HSA or glycated
HSA.
The association equilibrium constants that were obtained by frontal analysis for
the two-site model with gliclazide and normal HSA were 7.1 (± 1.9) × 104 M
-1 and 8.9 (±
1.5) × 103 M
-1. The corresponding values for glycated HSA, using the gHSA3 column as
an example, were 1.0 (± 0.8) × 105 M
-1 and 5.7 (± 3.9) × 10
3 M
-1. A summary of the
results that were obtained at pH 7.4 and 37°C is provided in Table 3-1. These values
were similar to those that have been reported when using a two-site model to describe the
interactions of tolbutamide and acetohexamide with normal HSA or glycated HSA [6,7].
The relative amounts of the two groups of binding sites were estimated to be 7.1 (± 2.2) ×
10-9
mol and 2.7 (± 0.1) ×10-8
mol for normal HSA, with values of 5.6 (± 3.8) × 10-9
mol
and 2.6 (± 0.4) ×10-8
mol being obtained for gHSA3. Based on the protein content of the
HPAC columns, these results corresponded to specific activities of 0.50 (± 0.16) and 1.90
(± 0.16) mol/mol normal HSA or 0.38 (± 0.25) and 1.71 (± 0.29)
mol/mol gHSA3. Given
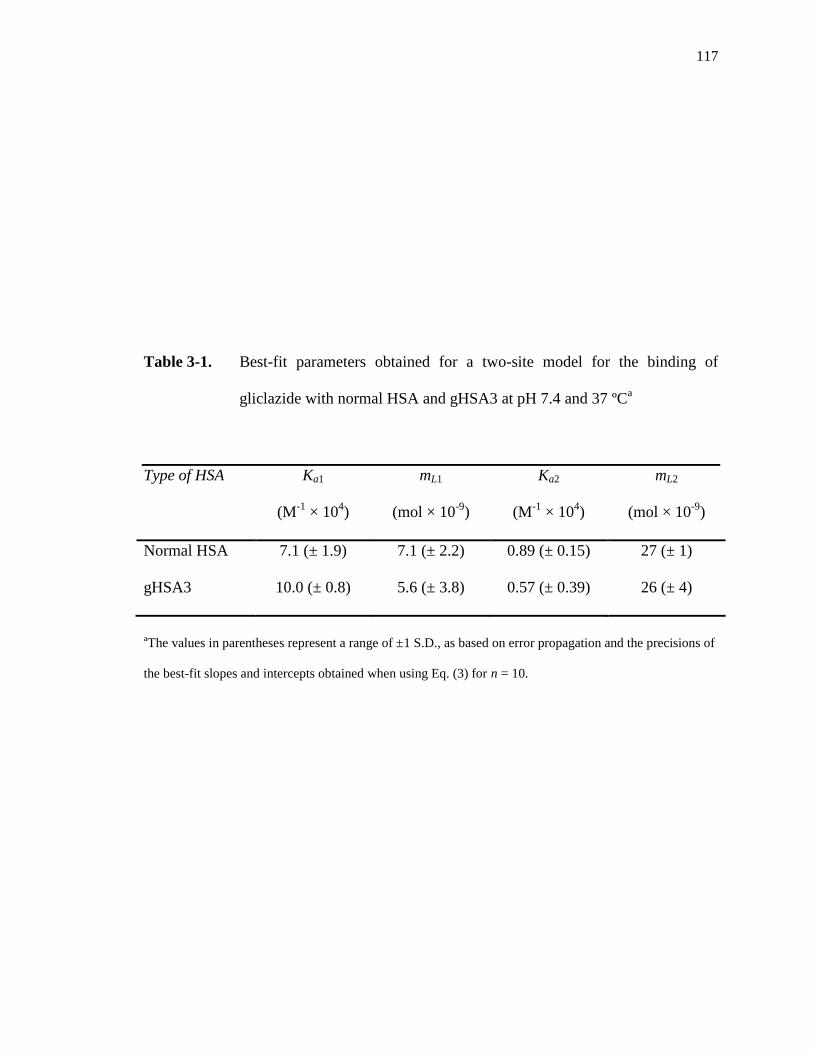
117
Table 3-1. Best-fit parameters obtained for a two-site model for the binding of
gliclazide with normal HSA and gHSA3 at pH 7.4 and 37 ºCa
Type of HSA Ka1
(M-1
× 104)
mL1
(mol × 10-9
)
Ka2
(M-1
× 104)
mL2
(mol × 10-9
)
Normal HSA 7.1 (± 1.9) 7.1 (± 2.2) 0.89 (± 0.15) 27 (± 1)
gHSA3 10.0 (± 0.8) 5.6 (± 3.8) 0.57 (± 0.39) 26 (± 4)
aThe values in parentheses represent a range of ±1 S.D., as based on error propagation and the precisions of
the best-fit slopes and intercepts obtained when using Eq. (3) for n = 10.
118
the fact that HSA which has been immobilized by the Schiff base method is roughly 50-
60% active, these results and those obtained by ultrafiltration indicated that 1-2 major
binding sites and 2-3 or more weaker binding regions were involved in the interactions of
gliclazide with normal HSA or glycated HSA. Similar conclusions have been reached
when examining the interactions of acetohexamide and tolbutamide by this approach with
normal HSA or glycated HSA [6,7].
3.3.2 Zonal elution studies with gliclazide at Sudlow site I
Competition studies based on zonal elution experiments were next used with the
HPAC columns to identify specific sites for gliclazide on normal HSA and glycated
HSA. These experiments were first conducted by using R-warfarin as a site-selective
probe for Sudlow site I. This region was of interest because it has recently been proposed
to be one of high affinity sites on HSA for sulfonyurea drugs such as acetohexamide and
tolbutamide, as determined through zonal elution studies [6,7]. A typical set of
chromatograms for this type of experiment is shown in Fig. 3-5, in which a small amount
of R-warfarin was injected into the presence of mobile phases that contained various
concentrations of gliclazide as a competing agent. Sodium nitrate was also injected as a
non-retained solute to determine the void time, which was then used to calculate the
retention factor (k) for R-warfarin.
Eq. (6) can be used in this type of experiment to describe a system in which direct
competition at a single-site is involved in the binding of the injected probe A and the
competing agent I that has been added to the mobile phase [7].
1
𝑘=
𝐾𝑎I𝑉𝑀[I]
𝐾𝑎A𝑚𝐿+
𝑉𝑀
𝐾𝑎A𝑚𝐿 (6)
The terms KaA and KaI in Eq. (6) represent the association equilibrium constants for the
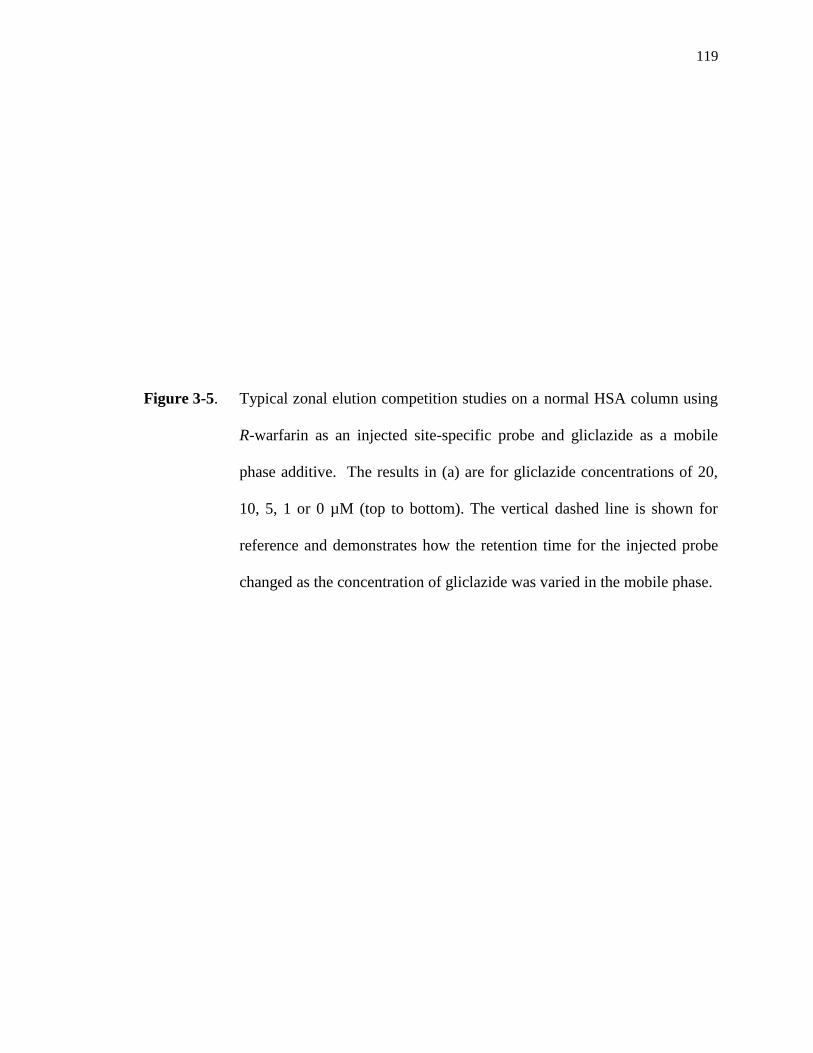
119
Figure 3-5. Typical zonal elution competition studies on a normal HSA column using
R-warfarin as an injected site-specific probe and gliclazide as a mobile
phase additive. The results in (a) are for gliclazide concentrations of 20,
10, 5, 1 or 0 µM (top to bottom). The vertical dashed line is shown for
reference and demonstrates how the retention time for the injected probe
changed as the concentration of gliclazide was varied in the mobile phase.
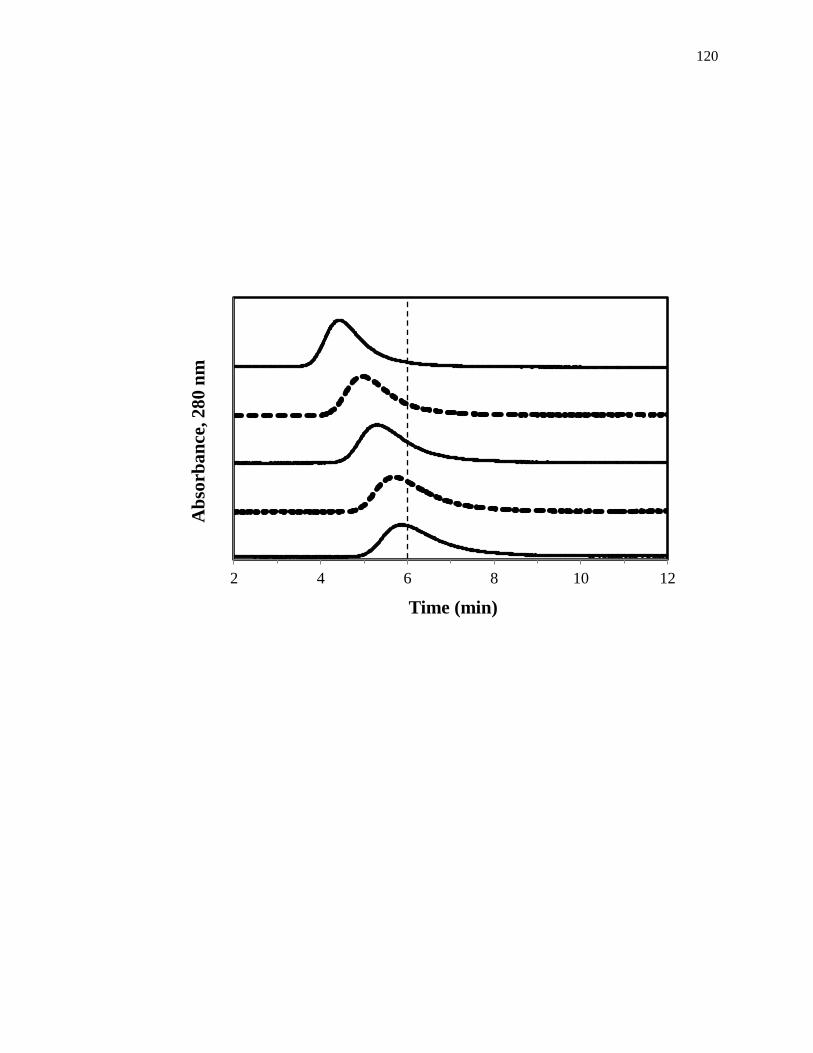
120
2 4 6 8 10 12
Ab
sorb
an
ce, 2
80
nm
Time (min)
121
probe and competing agent, respectively, and VM is the void volume. According to Eq.
(6), a plot of 1/k versus the competing agent concentration [I] should produce a linear
relationship for a system with single-site competition [7]. The value of KaI can be
obtained from this plot by determining the ratio of the slope to the intercept. In this way
it is possible to specifically examine the binding of the mobile phase additive I at its site
of competition with the injected probe.
As shown in Fig. 3-6(a), a linear fit to Eq. (6) was obtained for gliclazide on each
column that contained normal HSA or glycated HSA when R-warfarin was used as an
injected probe for Sudlow site I. The best-fit lines for these plots had correlation
coefficients in the range of 0.960 to 0.998 (n = 5-6). The corresponding residual plots
gave only random variations in the data about the best-fit lines, and the sums of the
squares for the residuals were between 1.0 × 10⁻⁵
and 1.7 × 10⁻³
. All of these results
confirmed that gliclazide and R-warfarin had direct competition at Sudlow site I on both
normal HSA and glycated HSA. Binding at Sudlow site I has also been noted for
acetohexamide and tolbutamide on normal HSA and glycated HSA [6,7].
The association equilibrium constants for gliclazide at Sudlow site I, as
represented in this case by KaI in Eq. (6), where determined on the various HSA columns
from the best-fit lines in Fig. 3-6(a). The results that were obtained at pH 7.4 and 37°C
are summarized in Table 3-2. An association equilibrium constant of 1.9 (± 0.1) × 104 M
-
1 was measured for gliclazide with normal HSA. This result is slightly lower than the Ka
values of 4.2-5.5 × 10⁴ M
-1 that have been reported for tolbutamide and acetohexamide at
the same site on normal HSA [6,7].
A comparison was next made for the association equilibrium constants that were
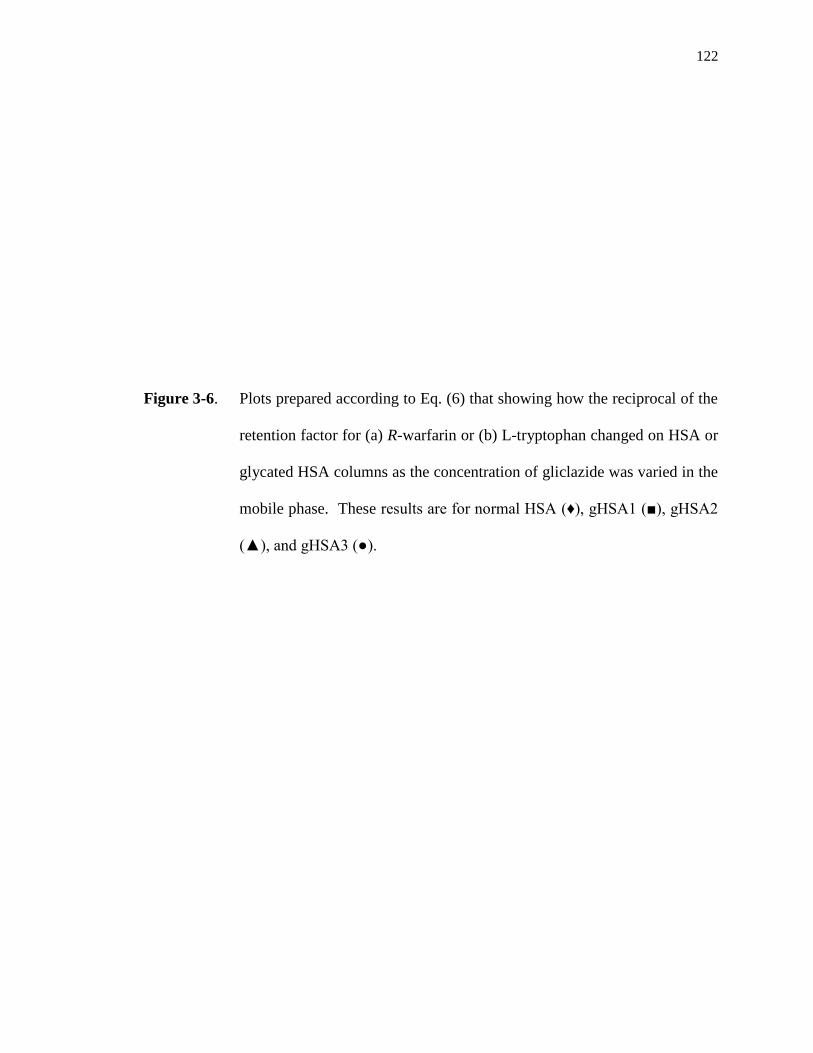
122
Figure 3-6. Plots prepared according to Eq. (6) that showing how the reciprocal of the
retention factor for (a) R-warfarin or (b) L-tryptophan changed on HSA or
glycated HSA columns as the concentration of gliclazide was varied in the
mobile phase. These results are for normal HSA (♦), gHSA1 (■), gHSA2
(▲), and gHSA3 (●).
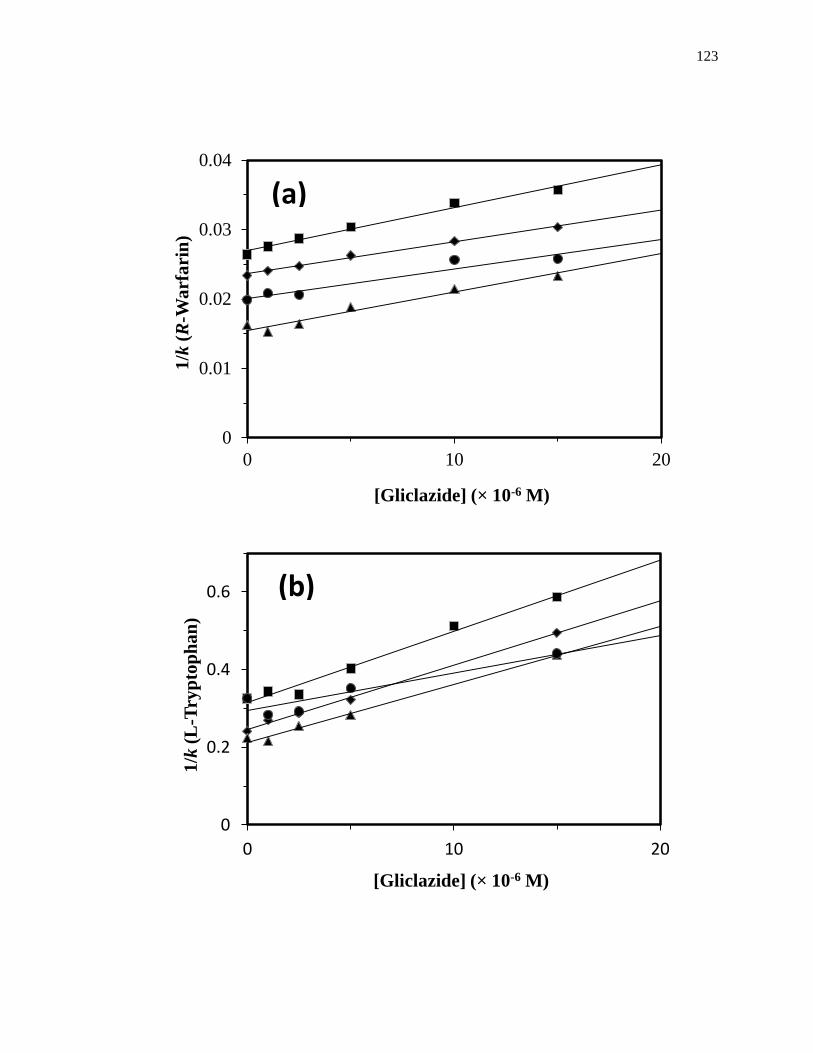
123
0
0.01
0.02
0.03
0.04
0 10 20
1/k
(R
-Wa
rfa
rin
)
[Gliclazide] (× 10-6 M)
0
0.2
0.4
0.6
0 10 20
1/k
(L
-Try
pto
ph
an
)
[Gliclazide] (× 10-6 M)
(a)
(b)
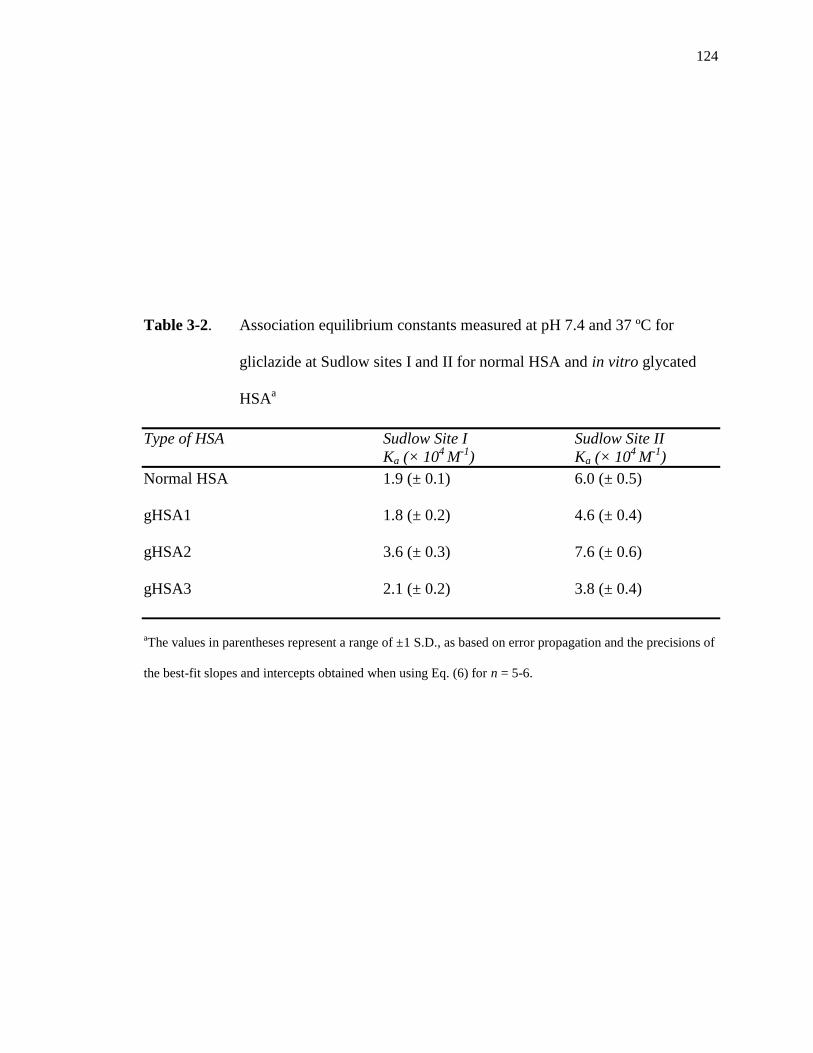
124
Table 3-2. Association equilibrium constants measured at pH 7.4 and 37 ºC for
gliclazide at Sudlow sites I and II for normal HSA and in vitro glycated
HSAa
Type of HSA Sudlow Site I Sudlow Site II
Ka (× 104
M-1
) Ka (× 104
M-1
)
Normal HSA 1.9 (± 0.1) 6.0 (± 0.5)
gHSA1 1.8 (± 0.2) 4.6 (± 0.4)
gHSA2 3.6 (± 0.3) 7.6 (± 0.6)
gHSA3 2.1 (± 0.2) 3.8 (± 0.4)
aThe values in parentheses represent a range of ±1 S.D., as based on error propagation and the precisions of
the best-fit slopes and intercepts obtained when using Eq. (6) for n = 5-6.
125
determined for gliclazide at Sudlow site I in going from normal HSA to the glycated
HSA samples. There was no significant difference in the Ka values for normal HSA and
gHSA1 or gHSA3. However, there was a 1.9- to 2.0-fold increase in the Ka for gliclazide
at Sudlow site I in going from normal HSA or gHSA1 to gHSA2 and a similar decrease
in affinity in going from gHSA2 to gHSA3. These differences were all significant at the
95% confidence level. This change in affinity with the level of glycation for HSA has
also been noted for acetohexamide and tolbutamide, although the degree and direction of
this change does vary from one type of sulfonylurea drug to the next [6,7]. It has been
proposed in earlier work that these alterations in affinity are related to the extent and
types of glycation products that form at or near Sudlow site I as the level of HSA
glycation is altered [6,7,28,29].
3.3.3 Zonal elution studies with gliclazide at Sudlow site II
Competition studies on the HPAC columns were also carried out using L-
tryptophan as a site-selective probe for Sudlow site II. This site was of interest because it
also has been demonstrated to be one of high affinity sites on HSA for acetohexamide
and tolbutamide [6,7]. The results of these experiments were again plotted and analyzed
through the use of Eq. (6). All of the normal HSA or glycated HSA columns gave a
linear response to this equation, as illustrated in Fig. 6(b), with correlation coefficients
that ranged from 0.967 to 0.996 (n = 5-6). The corresponding residual plots all gave a
random distribution of the data points about the best-fit lines and the sum of the squares
of the residuals for these best-fit lines ranged from 4.3 × 10⁻⁴
to 1.7 × 10⁻⁴
. The
agreement of these plots with the behavior predicted by Eq. (6) indicated that gliclazide
and L-tryptophan had direct competition at Sudlow site II. The same conclusion has been

126
reached when the same approach was used to examine the binding of acetohexamide and
tolbutamide at Sudlow site II [6,7].
The results from the plots in Figure 3-6(b) were used to determine the association
equilibrium constants for gliclazide at Sudlow site II on each normal HSA or glycated
HSA column. These results are included in Table 2. The Ka value of 6.0 (± 0.5) × 104 M
-
1 that was determined for gliclazide at Sudlow site II on normal HSA at pH 7.4 and 37 °C
agreed with the average association equilibrium constant that was estimated by frontal
analysis for the high affinity sites of gliclazide on this protein. In addition, the Ka
determined for gliclazide at Sudlow site II on normal HSA was slightly lower than the
affinities of 5.3-13 × 104 M
-1 that have been measured for tolbutamide and acetohexamide
at the same site [6,7].
All of the glycated HSA samples had affinities at Sudlow site II that were in the
range of 104-10
5 M
-1 for gliclazide. However, the size of these values varied with the
extent of glycation. For instance, there was a decrease of 1.3-fold in Ka for gliclazide at
Sudlow site II in going from normal HSA to gHSA1. This change was similar to what
has been seen for acetohexamide with the same samples of normal and glycated HSA, in
which a 1.6-fold decrease in affinity was observed [6]. There was a 1.6-fold increase in
Ka between gHSA1 and gHSA2, or a 1.3-fold increase between normal HSA and gHSA2.
This was followed by a 2-fold decrease in Ka in going from gHSA2 to gHSA3, or a 1.6-
fold decrease between normal HSA and gHSA3. These differences were all significant at
the 95% confidence level. As stated in the previous section, these changes in affinity
with glycation are thought to be due to differences in the glycation products that are
formed at or near specific regions on HSA as the overall level of glycation for this protein
127
is increased [6,7,28,29].
3.4 Conclusion
This chapter utilized HPAC as a tool to examine the binding of gliclazide to
normal HSA and HSA with various levels of glycation. Frontal analysis experiments
indicated that gliclazide was binding with normal HSA and glycated HSA through a two-
site model that involved both high and lower affinity sites. There were one or two high
affinity regions with an average association equilibrium constant of approximately 7.1-10
× 104 M
-1 and two or more low affinity sites with an average association equilibrium
constant of 5.7-8.9 × 10³ M
-1 at pH 7.4 and 37 °C.
Zonal elution studies demonstrated that gliclazide was binding to both Sudlow
sites I and II in normal HSA and glycated HSA. The association equilibrium constants
for these sites were in the range of 104-10
5 M
-1. The binding of gliclazide at Sudlow sites
I and II for normal HSA gave association equilibrium constants of 1.9 × 10⁴ M
-1 and 6.0
× 104 M
-1, respectively. Two of the glycated HSA samples (i.e., gHSA1 and gHSA3) had
similar affinities to normal HSA for gliclazide at Sudlow site I; however, one of the
protein samples (gHSA2) had a 1.9-fold increase in affinity for gliclazide at this site. All
of the glycated HSA samples differed from normal HSA in their affinity for gliclazide at
Sudlow site II. These data indicate that modifications due to glycation can have different
effects on the interactions of gliclazide with HSA at separate binding sites on this protein.
These results are in agreement with previous data that have been obtained with
acetohexamide and tolbutamide [6,7] and with structural studies that have examined the
glycation products that can form at or near Sudlow sites I and II [28,29]. Similar studies
with in vivo glycated HSA are now in progress to further characterize these effects and to
128
determine their possible clinical significance.
The experiments in this chapter illustrated how HPAC could be used to provide
detailed information on the binding of a drug or solute with a modified protein. This
included data on the overall model, equilibrium constants and amount of binding sites for
a drug-protein interaction. It was also demonstrated how HPAC can be used to examine
the changes in interactions that occur at specific regions on a protein (e.g., Sudlow sites I
and II of HSA). The methods used in this study were relatively fast (i.e., taking only
minutes per sample) and were easily automated. The small amounts of protein in the
HPAC columns and the ability to reuse these columns for hundreds of binding
experiments made this approach more attractive than ultrafiltration for work with
valuable or limited samples of modified proteins. The techniques used in this study are
not limited to gliclazide and normal HSA or glycated HSA but could be used with many
other types of biological interactions. These features should result in the further use of
HPAC for biointeraction analysis.
3.5 References
1. National Diabetes Fact Sheet: General Information and National Estimates on
Diabetes in the United States, 2011, US Centers for Disease Control and
Prevention, Atlanta, GA, 2011, pp 1-12.
2. T.G. Skillman, J.M. Feldman, The pharmacology of sulfonylureas, Am. J. Med.
70 (1981) 361-372.
3. M.G. Jakoby, D.F. Covey, D.P. Cistola, Localization of tolbutamide binding sites
on human serum albumin using titration calorimetry, Biochemistry 34 (1995)
8780-8787.
129
4. G. Sudlow, D.J. Birkett, D.N. Wade, Further characterization of specific drug
binding sites on human serum albumin, Mol. Pharmacol. 12 (1976) 1052–1061.
5. G.A. Ascoli, E. Domenic, C. Bertucci, Drug binding to human serum albumin:
abridged review of results obtained with high-performance liquid chromatography
and circular dichroism, Chirality 18 (2006) 667–679.
6. K.S. Joseph, J. Anguizola, A.J. Jackson, D.S. Hage, Chromatographic analysis of
acetohexamide binding to glycated human serum albumin, J. Chromatogr. B 878
(2010) 2775–2781.
7. K.S. Joseph, J. Anguizola, D.S. Hage, Binding of tolbutamide to glycated human
serum albumin, J. Pharm. Biomed. Anal. 54 (2011) 426–432.
8. D.L. Mendez, R.A. Jensen, L.A. McElroy, J.M. Pena, R.M. Esquerra, The effect
of non-enzymatic glycation on the unfolding of human serum albumin, Arch.
Biochem. Biophys. 444 (2005) 92-99.
9. G. Colmenarejo, In silico prediction of drug-binding strengths to human serum
albumin, Med. Res. Rev. 23 (2003) 275-301.
10. H. Koyama, N. Sugioka, A. Uno, S. Mori, K. Nakajima, Effects of glycosylation
of hypoglycemic drug binding to serum albumin, Biopharm. Drug Dispos. 18
(1997) 791-801.
11. R.L. Garlick, J.S. Mazer, The principal site of nonenzymatic glycosylation of
human serum albumin in vivo, J. Biol. Chem. 258 (1983) 6142-6146.
12. N. Iberg, R. Fluckiger, Nonenzymatic glycosylation of albumin in vivo, J. Biol.
Chem. 261 (1986) 13542-13545.
13. K. Nakajou, H. Watanabe, U. Kragh-Hansen, T. Maruyama, M. Otagiri, The
130
effect of glycation on the structure, function and biological fate of human serum
albumin as revealed by recombinant mutants, Biochim. Biophys. Acta 1623
(2003) 88-97.
14. K. Kobayashi, M. Kimura, T. Sakoguchi, Y. Kitani, M. Hata, A. Matsuoka,
Influence of blood proteins on biomedical analysis. III. Pharmacokinetics and
protein binding of gliclazide, J. Pharmacobiodyn. 4 (1981) 436-442.
15. K. Kobayashi, M. Kimura, T. Sakoguchi,. A. Hase, A. Matsuoka, S. Kaneko,
Pharmacokinetics of gliclazide in healthy and diabetic subjects, J. Pharm. Sci. 73
(1984) 1687-1687.
16. J.E. Schiel, K.S. Joseph, D.S. Hage, in: N. Grinsberg, E. Grushka (Eds.), Adv.
Chromatogr., Taylor & Francis, New York, 2010, Chap. 4.
17. D.S. Hage, High-performance affinity chromatography: a powerful tool for
studying serum protein binding, J. Chromatogr. B 768 (2002) 3-30.
18. D.S. Hage, J. Anguizola, O, Barnaby, A. Jackson, M.J. Yoo, E. Papastavros, E.
Pfaunmiller, M. Sobansky, Z. Tong, Characterization of drug interactions with
serum proteins by using high-performance affinity chromatography, Curr. Drug
Metab. 12 (2011) 313-328.
19. S.B.G. Basiaga, D.S. Hage, Chromatographic studies of changes in binding of
sulfonylurea drugs to human serum albumin due to glycation and fatty acids, J.
Chromatogr. B Analyt. Technol. Biomed. Life Sci. 878 (2010) 3193-3197.
20. J. Yang, D.S. Hage, Effect of mobile phase composition on the binding kinetics of
chiral solutes on a protein-based high-performance liquid chromatography
column: interactions of D- and L-tryptophan with immobilized human serum
131
albumin, J. Chromatogr. A. 766 (1997) 15-25.
21. K.S. Joseph, D.S. Hage, The effects of glycation on the binding of human serum
albumin to warfarin and L-tryptophan, J. Pharm. Biomed. Anal. 53 (2010) 811-
818.
22. B. Loun, D.S. Hage, Chiral separation mechanisms in protein-based HPLC
columns. I. Thermodynamic studies of (R)- and (S)-warfarin binding to
immobilized human serum albumin, Anal. Chem. 66 (1994) 3814-3822.
23. J. Yang, D.S. Hage, Characterization of the binding and chiral separation of D-
and L-tryptophan on a high-performance immobilized human serum albumin
column, J. Chromatogr. 645 (1993) 241-250.
24. M.L. Conrad, A.C. Moser, D.S. Hage, Evaluation of idole-based probes for high-
throughput screening of drugs binding to human serum albumin: Analysis by
high-performance affinity chromatography, J. Sep. Sci. 32 (2009) 1145-1155.
25. D.B. Campbell, R. Lavielle, C. Nathan, The mode of action and clinical
pharmacology of gliclazide: a review, Diabetes Res. Clin. Pract. 14 (1991) S21-
S36.
26. A.C. Powers, in: D.L. Kasper, A.S. Fauci, D.L. Longo, E. Braunwald, S.L.
Hauser, J.L. Jameson (Eds.), Harrison’s Principles of Internal Medicine,
McGraw-Hill, New York, 2005, Chap. 323.
27. A. Lapolla, D. Fedele, R. Reitano, N.C. Arico, R. Seraglia, P. Traldi, E. Marotta,
R. Tonani, Enzymatic digestion and mass spectrometry in the study of advance
glycation end products/peptides, J. Am. Soc. Mass Spectrom. 25 (2004) 496-509.
28. O.S. Barnaby, R.L. Cerny, W. Clarke, D.S. Hage, Comparison of modification
132
sites formed on human serum albumin at various stages of glycation, Clin. Chim.
Acta 412 (2011) 277-285.
29. O.S. Barnaby, R.L. Cerny, W. Clarke, D.S. Hage, Quantitative analysis of
glycation patterns in human serum albumin using 16
O/18
O-labeling and MALDI-
TOF MS, Clin. Chim. Acta 412 (2011) 1606-1615.
133
CHAPTER 4:
ANALYSIS OF DRUG INTERACTIONS WITH MODIFIED PROTEINS BY
HIGH-PERFORMANCE AFFINITY CHROMATOGRAPHY:
BINDING OF GLIBENCLAMIDE TO NORMAL AND GLYCATED HUMAN
SERUM ALBUMIN
Note: Portions of this chapter have appeared in R. Matsuda, J. Anguizola, K.S. Joseph,
D.S. Hage, “Analysis of drug interactions with modified proteins by high-performance
affinity chromatography: Binding of glibenclamide to normal and glycated human serum
albumin”, J. Chromatogr. A 1265 (2012) 114-122.
4.1 Introduction
The International Diabetes Federation reported in 2011 that 366.2 million people
in the world are affected by diabetes [1]. A total of 25.8 million are affected by diabetes
in the United States alone [2]. Diabetes is a condition that is caused by high glucose
levels in blood and has two major forms [3]. Type I diabetes (i.e., juvenile onset or
insulin-dependent diabetes) affects 5-10% of diabetic patients and is caused when
pancreatic beta cells (i.e., insulin-producing cells) are attacked by the immune system [2].
Most of the remaining 90-95% of diabetic patients suffer from type II diabetes (i.e., non-
insulin dependent or adult onset diabetes), which is caused by insulin resistance [1,2].
Sulfonylurea drugs are oral medications that are commonly used to treat type II
diabetes. These drugs lower blood glucose levels by increasing the amount of insulin that
is produced by pancreatic beta cells [4]. According to the biopharmaceutical
classification system, sulfonylurea drugs are listed as class II drugs with high
permeability and low solubility [5]. Fig. 4-1 shows the core structure of a sulfonylurea
134
Figure 4-1. Structure of glibenclamide. The region within the dashed box shows the
core structure of a sulfonylurea drug.
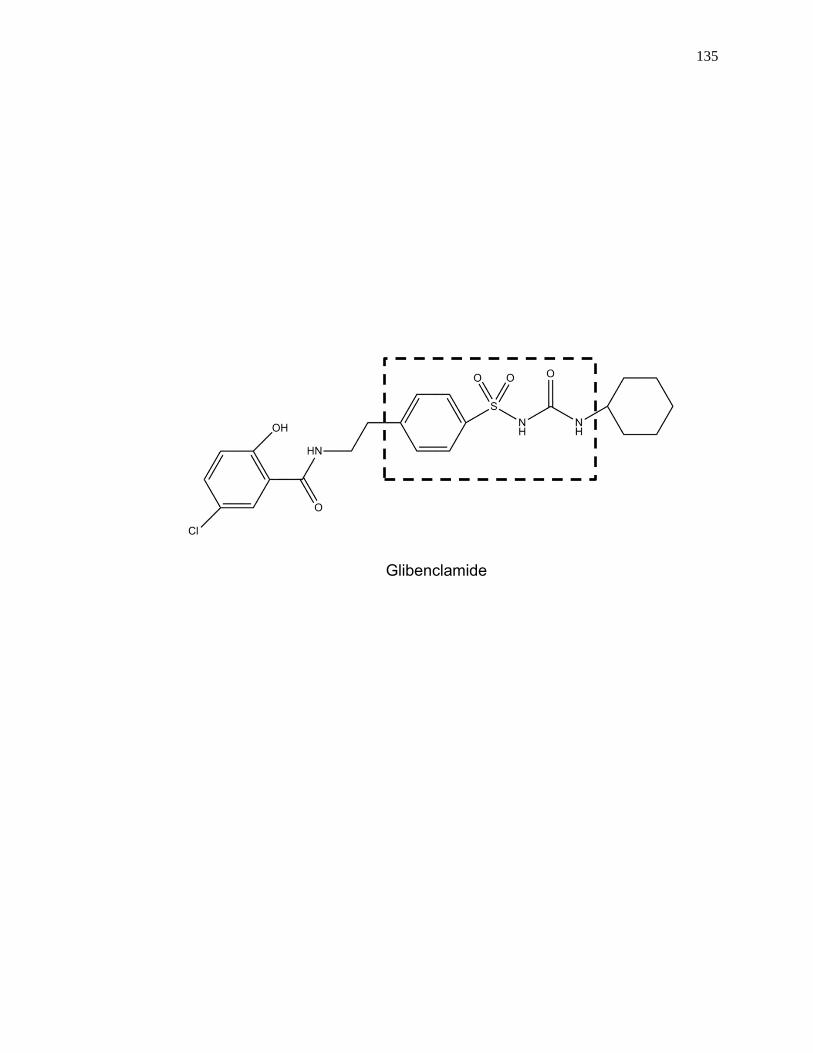
135
Glibenclamide
136
drug, which is composed of phenylsulfonyl and urea groups, both which are hydrophilic
[6,7]. Various non-polar functional groups can be found on either side of this core
structure and contribute to both the effectiveness and metabolism of these drugs [6-8].
Glibenclamide, or glyburide (see Fig. 4-1), is a popular second-generation sulfonylurea
drug. Second-generation sulfonylurea drugs like glibenclamide are more easily excreted
and can be prescribed in lower doses than first-generation sulfonylureas (e.g.,
tolbutamide and acetohexamide) [8]. For instance, glibenclamide has a therapeutic level
in serum of 0.08-0.4 M versus 60-215 or 185-370 M for acetohexamide and
tolbutamide, respectively [9].
Although sulfonylurea drugs are used to lower blood glucose levels,
hypoglycemia is a relatively common side effect if the apparent dose of these drugs is too
high. This situation occurs in 2-20% of patients, depending on the type of sulfonylurea
being used [10]. One factor that will affect the free fractions of these drugs in the
circulation, and their apparent dose, is the level of binding by these drugs with serum
proteins, especially with human serum albumin (HSA) [6,9-12]. HSA (molar mass, 66.5
kDa) is the most abundant protein in plasma and is responsible for transporting various
fatty acids, low mass hormones, and drugs in the circulation [11-19]. There are two main
drug binding sites on HSA: Sudlow sites I and II. Sudlow site I is found in subdomain
IIA and binds to bulky heterocyclic anionic drugs such as warfarin, azapropazone,
phenylbutazone and salicylate [12,13]. Sudlow site II is located in subdomain IIIA and
can bind to ibuprofen, fenoprofen, ketoprofen, benzodiazepine, and L-tryptophan, among
other solutes [12,13]. Recent studies have shown that both of these sites have
interactions with first-generation sulfonylurea drugs, tolbutamide and acetohexamide, and
137
the second-generation drug gliclazide [14-16]. Other studies have found that some drugs
can bind to a separate region on HSA known as the digitoxin site [17-22], but no previous
reports have examined the interactions of sulfonylureas at this site.
The elevated levels of glucose in blood during diabetes can lead to a protein
modification known as glycation [23-28]. Glycation is a non-enzymatic process in which
amine groups can undergo the formation of a reversible Schiff base with the open chain
form of a reducing sugar. The Schiff base can later rearrange to form a more stable
Amadori product. Patients with diabetes are estimated to have 20-30% or more of HSA
in a glycated form, while individuals without diabetes may have 6-13% of HSA glycated
[23,24,26]. Previous work has suggested that glycation can alter the interactions between
HSA and some solutes. For instance, it has been shown in chromatographic studies that
glycation can alter the ability of Sudlow sites I and II on HSA to bind with sulfonylurea
drugs [14-16]. Experiments based on fluorescence spectroscopy, circular dichroism, and
theoretical calculations have also found that glycation and related modifications can
affect intermolecular interactions between drugs and HSA, including possible changes in
the binding of drugs at Sudlow site I of this protein [29,30].
The purpose of this study is to use high-performance affinity chromatography
(HPAC) to examine the binding of glibenclamide to HSA at various stages of glycation.
HPAC is a chromatographic technique that uses an immobilized biological molecule as
the stationary phase [31-33]. Previous studies have shown that columns containing
normal HSA or glycated HSA can provide good precision and fast analysis times for
studies of drug-protein interactions [14-16], while also giving good correlation with
solution-based methods (e.g., equilibrium dialysis, ultrafiltration, or spectroscopic
138
methods) [32,33]. In addition, HPAC is easy to automate and can be used with various
detection schemes, including absorbance, fluorescence or mass spectrometry [31-38].
HPAC has been used previously in detailed studies that have examined the effects of
glycation on the binding of HSA to other sulfonylurea drugs [14-16], as well as the
effects of some specific modifications on drug-protein interactions (e.g., the selective
modification of Tyr-411, Trp-214, or Cys-34 on HSA) [39-41]. However, this approach
has only been used in screening studies with glibenclamide and required a solubilizing
agent for work with this relatively low solubility drug [42]. These conditions and the
lack of more complete binding information have, in turn, made it difficult in prior work
to directly compare the overall interactions of HSA with this drug and with other
sulfonylureas.
This chapter will seek to overcome these prior limitations by examining how
HPAC can be adapted for providing more complete information on the protein binding of
relatively low solubility drugs such as glibenclamide. For instance, this approach will be
modified and explored for use with such a drug in the methods of frontal analysis and
zonal elution to look at both the global and site-specific changes in binding that may
occur for glibenclamide with normal HSA versus in vitro glycated HSA. These
experiments should help indicate how HPAC can then be modified for use with other
non-polar drugs. In addition, this work should provide useful data on how glycation can
alter the binding of glibenclamide or related drugs to HSA and lead to a more complete
understanding of how glycation can alter the binding and transport of such drugs in the
circulation.
139
4.2 Experimental
4.2.1 Reagents
The glibenclamide (≥ 99.9% pure), R-warfarin (≥ 97%), L-tryptophan (≥ 97%),
digitoxin (97% pure), β-cyclodextrin (> 98% pure), D-(+)-glucose (≥ 99.5%), sodium
azide (95%), HSA (essentially fatty acid free, ≥ 96%), and commercial sample of in vitro
glycated HSA (Lot 058K6087) were obtained from Sigma-Aldrich (St. Louis, MO,
USA). The Nucleosil Si-300 (7 µm particle diameter, 300 Å pore size) was purchased
from Macherey-Nagel (Düren, Germany). Reagents for the bicinchoninic acid (BCA)
protein assay were from Pierce (Rockford, IL, USA). For the measurement of glycation
levels, a fructosamine assay kit was obtained from Diazyme Laboratories (San Diego,
CA, USA). All aqueous solutions were prepared with water from a Nanopure system
(Barnstead, Dubuque, IA, USA) and filtered through a 0.2 µm GNWP nylon membrane
from Millipore (Billerica, MA, USA).
4.2.2 Apparatus
The chromatographic system was comprised of a DC-2080 degasser, two PU-
2080 pumps, an AS-2057 autosampler, a CO-2060 column oven, and a UV-2075
absorbance detector from Jasco (Tokyo, Japan), which included a Rheodyne Advantage
PF six-port valve (Cotati, CA, USA). EZ Chrom Elite software v3.21 (Scientific
Software, Pleasanton, CA, USA) and Jasco LC Net were used to control the system.
Chromatograms were analyzed through the use of Peak-Fit 4.12 (Jandel Scientific
Software, San Rafael, CA, USA). Data Fit 8.1.69 (Oakdale, PA, USA) was utilized to
perform non-linear regression.
140
4.2.3 Methods
For the sake of comparison, the in vitro glycated HSA samples used in this work
were the same as employed in previous HPAC studies with other sulfonylurea drugs [14-
16,43]. Although many prior studies have used in vitro glycated HSA for binding studies
like those described in this report [14-16,30,44], it has also been suggested in recent work
with related modifications that in vivo glycated HSA may provide a better model for
representing drug-protein interactions that occur at physiological conditions [44]. To
minimize differences due to the use of in vitro glycated HSA in this study, conditions for
preparation of the glycated HSA samples were selected to closely mimic the glucose and
protein concentrations and reaction conditions that are present in blood. The gHSA1 was
purchased from Sigma and was glycated under proprietary conditions; this support had a
measured glycation level of 1.31 (± 0.05) mol hexose/mol HSA, as might be found in a
patient with prediabetes, and represented mildly glycated HSA [14-16,43]. The gHSA2
and gHSA3 samples were prepared in vitro as described previously [14,15,43] and
represented glycation levels of patients with controlled or advanced diabetes [45,46].
These two preparations contained 2.34 (± 0.13) and 3.35 (± 0.14) mol hexose/mol HSA,
respectively [14,15]. It has been found in separate, ongoing studies based on mass
spectrometry and ultrafiltration and HPAC that these protein preparations have similar
modification patterns and binding properties to samples of in vivo HSA with comparable
levels of glycation [47-51], thus making these preparations reasonable models for the
types of binding studies that are described in this report.
Diol-bonded silica was produced from Nucleosil Si-300 silica according to the
literature [52]. The Schiff base method was used to immobilize HSA or glycated HSA
141
onto the diol-bonded silica, also as reported previously [53-55]. Using the same
procedure, control supports were prepared with no protein being added during the
immobilization step. Although both the Schiff base immobilization method and glycation
involve free amine groups on proteins, these processes tend to involve different residues
on HSA [49-51]. A BCA assay was carried out in triplicate to determine the protein
content of each support, using soluble HSA as the standard and samples containing the
control support as the blanks. The support containing normal HSA was found previously
with this assay to have a protein content of 38 (± 3) mg HSA/g silica. The three types of
glycated HSA supports that were prepared (referred to later in this report as gHSA1,
gHSA2 and gHSA3) were found to have protein contents of 29 (± 4), 47 (± 8), or 40 (± 3)
mg HSA/g silica [14,43].
All of the supports were downward slurry packed into separate 2.0 cm 2.1 mm
I.D. columns at 3500 psi (24 MPa) using pH 7.4, 0.067 M potassium phosphate buffer.
These columns were then stored at 4 °C in the same pH 7.4 phosphate buffer. Each
column was used in fewer than 500 sample applications and was routinely washed with
pH 7.4, 0.067 M phosphate buffer. Throughout the course of this study, no significant
changes in binding properties were noted for any of these columns, as reported previously
for similar systems [53].
The R-warfarin, L-tryptophan, glibenclamide and digitoxin samples were
prepared in pH 7.4, 0.067 M potassium phosphate buffer. The limited solubility of
digitoxin (i.e., roughly 4 mg/L) [56] required the addition of 0.88 mM β-cyclodextrin to
increase the solubility of this drug, as described in prior work [20-22]. The R-warfarin
and digitoxin solutions were used within two weeks of preparation, and the L-tryptophan
142
solutions were used within one day of preparation, respectively [43,57]. Due to the low
solubility of glibenclamide in water, the procedure for preparing solutions containing this
drug were altered from those used in previous studies with other, more soluble
sulfonylurea drugs. Previous HPAC studies with acetohexamide, tolbutamide and
gliclazide could be carried out by preparing overnight, with stirring at room temperature,
solutions that contained up to 200-1000 M of these drugs in a pH 7.4, 0.067 M
phosphate buffer [14-16]. Glibenclamide was much less soluble under the same
conditions and additional steps had to be taken to provide a suitably broad range of
concentrations for use in methods such as frontal analysis. -Cyclodextrin has previously
been employed as a solubilizing agent for glibenclamide in screening studies [42];
however, this approach alters the apparent retention of the applied drug onto the column
and requires relatively complex procedures to correct for this effect and carry out more
detailed binding studies [31-38]. In this current study, solutions of glibenclamide were
instead prepared without the use of any solubilizing agent by utilizing both stirring and
sonication in a covered container that was kept for 5-7 days at 35-50 °C. It was found
that a stable stock solution containing up to 50 µM glibenclamide could be prepared
under these conditions, as confirmed by absorbance measurements and dilution studies.
This stock solution was then used directly or diluted to make working solutions for
frontal analysis and zonal elution experiments involving HPAC.
The mobile phases used in the chromatographic studies were based on pH 7.4,
0.067 M potassium phosphate buffer, which was used to apply the samples and to elute
retained analytes under isocratic conditions. The solutions used in the chromatographic
system were filtered through a 0.2 µm nylon filter and were degassed for 10-15 min
143
before use. All experiments were carried out at a physiological temperature of 37 °C and
using a flow rate of 0.5 mL/min. Prior work on similar columns has shown that frontal
analysis and zonal elution studies performed under these flow rate conditions allow for
the reproducible measurements of retention factors, binding capacities, and association
equilibrium constants [14-16,43,55,57].
In the frontal analysis experiments, the columns were first equilibrated with pH
7.4, 0.067 M potassium phosphate buffer. Using a six-port valve, a switch was made
from this pH 7.4 buffer to a solution containing a known concentration of glibenclamide
in the same buffer. After a breakthrough curve was formed and a stable plateau had been
reached, a switch was made back to the pH 7.4, 0.067 M potassium phosphate buffer to
elute the retained drug. These frontal analysis experiments were carried out using sixteen
sample solutions that contained 1-50 µM glibenclamide, with the elution of
glibenclamide being monitored at 250 nm. All experiments were performed in
quadruplicate and the central point of each breakthrough curve was determined by using
the equal area function of Peak Fit 4.12. A correction for non-specific binding (e.g., 41%
of the total binding seen on the HSA column for 50 µM glibenclamide) was made by
subtracting the results for the control column from the data for each column containing
normal HSA or glycated HSA, according to methods described in Refs. [14,16].
The zonal elution competition studies were carried out by utilizing R-warfarin as a
site-specific probe for Sudlow site I of HSA, L-tryptophan as a probe for Sudlow site II,
and digitoxin as a probe for the digitoxin site [12,13,20-22]. Mobile phases containing 1-
20 µM glibenclamide were used in these experiments. These concentrations were used to
dilute the site-specific probes to a concentration of 5 µM. During these studies, a 20 µL
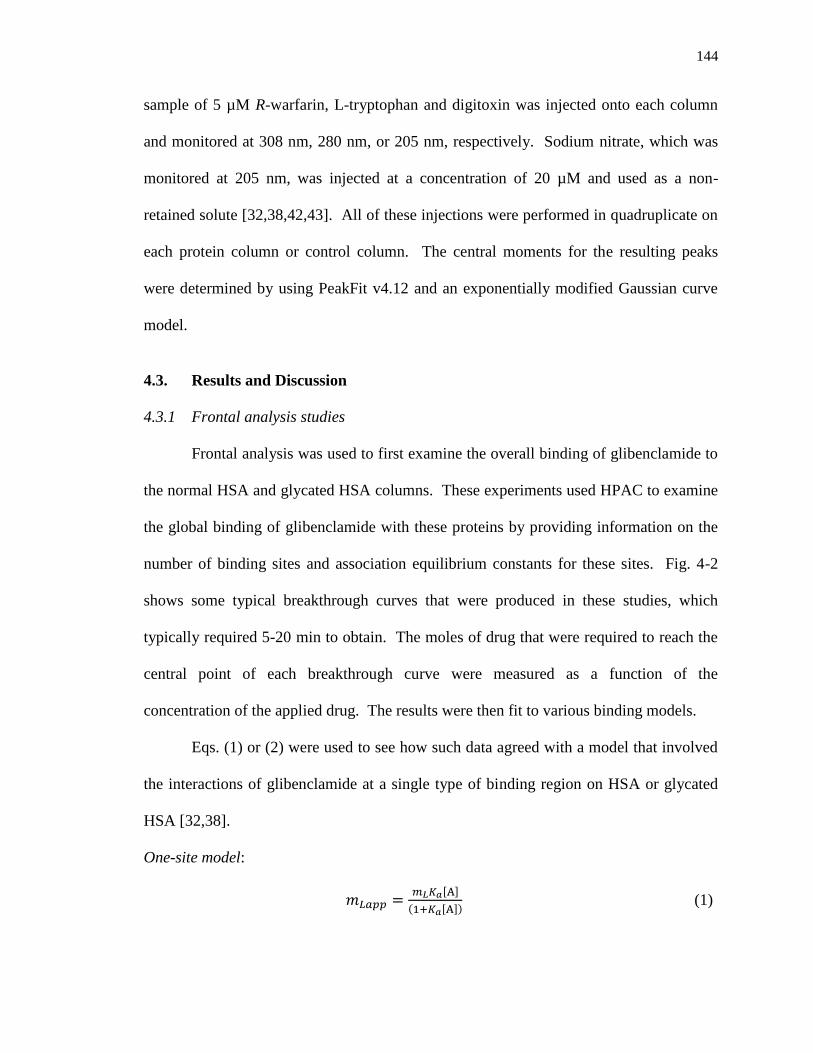
144
sample of 5 µM R-warfarin, L-tryptophan and digitoxin was injected onto each column
and monitored at 308 nm, 280 nm, or 205 nm, respectively. Sodium nitrate, which was
monitored at 205 nm, was injected at a concentration of 20 µM and used as a non-
retained solute [32,38,42,43]. All of these injections were performed in quadruplicate on
each protein column or control column. The central moments for the resulting peaks
were determined by using PeakFit v4.12 and an exponentially modified Gaussian curve
model.
4.3. Results and Discussion
4.3.1 Frontal analysis studies
Frontal analysis was used to first examine the overall binding of glibenclamide to
the normal HSA and glycated HSA columns. These experiments used HPAC to examine
the global binding of glibenclamide with these proteins by providing information on the
number of binding sites and association equilibrium constants for these sites. Fig. 4-2
shows some typical breakthrough curves that were produced in these studies, which
typically required 5-20 min to obtain. The moles of drug that were required to reach the
central point of each breakthrough curve were measured as a function of the
concentration of the applied drug. The results were then fit to various binding models.
Eqs. (1) or (2) were used to see how such data agreed with a model that involved
the interactions of glibenclamide at a single type of binding region on HSA or glycated
HSA [32,38].
One-site model:
𝑚𝐿𝑎𝑝𝑝 =𝑚𝐿𝐾𝑎[A]
(1+𝐾𝑎[A]) (1)
145
Figure 4-2. Example of frontal analysis studies for glibenclamide on a normal HSA
column at pH 7.4 and 37 ºC. These results were obtained at 0.5 mL/min
and using glibenclamide concentrations of 50, 20, 10, and 5 µM (top-to-
bottom). The small initial step changes shown to the left occurred at or
near the column void time and probably represent only a small difference
in composition and background absorbance of each drug solution versus
the application buffer; these small step changes were not included in the
data analysis and integration of the much larger frontal analysis curves
that are shown to the right.
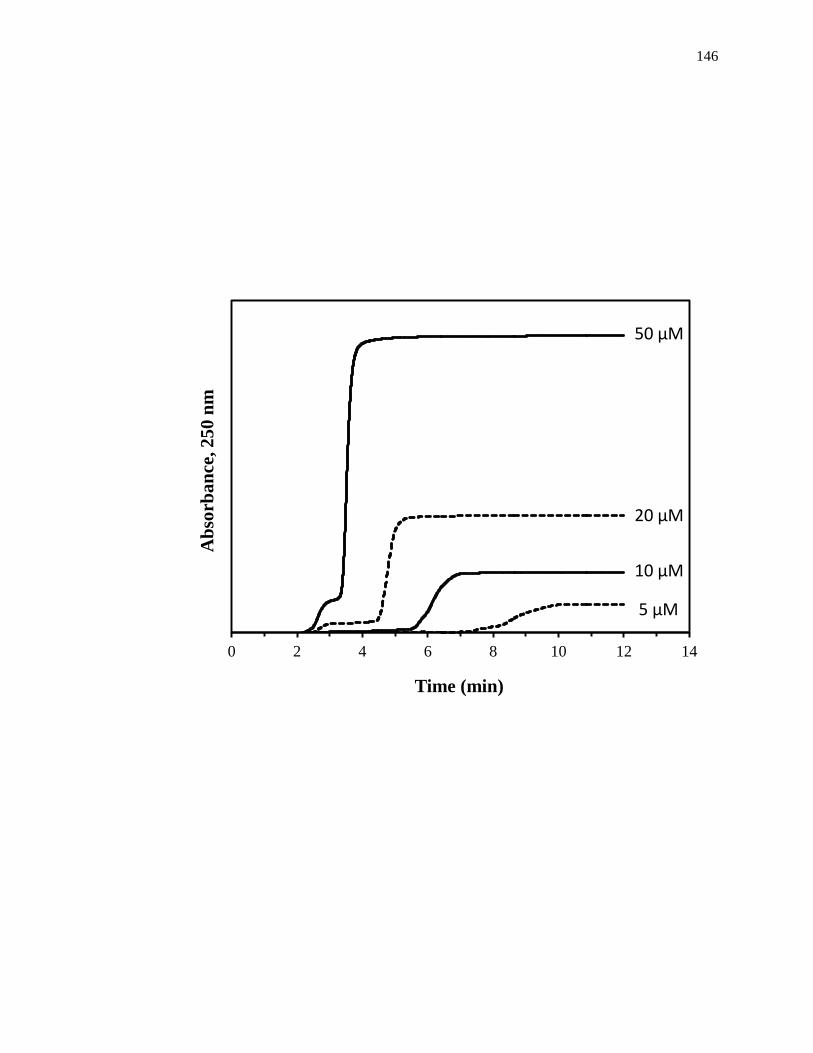
146
0 2 4 6 8 10 12 14
Ab
sorb
an
ce, 2
50
nm
Time (min)
50 µM
20 µM
10 µM 5 µM
147
1
𝑚𝐿𝑎𝑝𝑝=
1
(𝐾𝑎𝑚𝐿[A])+
1
𝑚𝐿 (2)
In these equations, the term mLapp represents the measured moles of applied drug that was
required to reach the central point of the breakthrough curve at a given molar
concentration of the applied drug, [A] [32,38]. The association equilibrium constant and
total moles of binding sites for this interaction are represented by terms Ka and mL,
respectively.
A two-site binding model was also used to examine the data, as described by Eqs.
(3) and (4) [32,38].
Two-site model:
𝑚𝐿𝑎𝑝𝑝 =𝑚𝐿1𝐾𝑎1[A]
(1+𝐾𝑎1[A])+
𝑚𝐿2𝐾𝑎2[A]
(1+𝐾𝑎2[A]) (3)
1
𝑚𝐿𝑎𝑝𝑝=
1+𝐾𝑎1[A]+𝛽2𝐾𝑎1[A]+𝛽2𝐾𝑎12[A]2
𝑚𝐿{(𝛼1+𝛽2−𝛼1𝛽2)𝐾𝑎1[A]+𝛽2𝐾𝑎12[A]2}
(4)
In these equations, Ka1 and Ka2 represent the association equilibrium constants for the two
classes of sites, while the moles of these two groups of sites are described by the terms
mL1 and mL2. Eq. (4) also includes the term α1, which represents the fraction of all
binding sites for the drug that are made up of its highest affinity regions (e.g., α1 =
mL1/mLtot if Ka1 and mL1 are used to refer to the highest affinity sites). In a similar manner,
the ratio of the association equilibrium constants for the low versus high affinity sites is
represented by β2, where β2 = Ka2/Ka1 in the case where Ka1 refers to the highest affinity
sites and Ka2 refers to the lower affinity sites [32,38].
Previous results with other sulfonylurea drugs have indicated that these solutes
tend to follow a two-site binding model during their interactions with both normal HSA
and glycated HSA [14-16,58]. Fig. 4-3 shows the results that were obtained when using
148
Figure 4-3. Data obtained for glibenclamide on a normal HSA column as fit to (a) a
one-site binding model generated by using Eq. (1) or (b) a two-site
binding model generated by using Eq. (3). The insets in (a) and (b) show
the corresponding residual plots. Each point represents the average of four
runs, with typical relative standard deviations that ranged from ±0.02% to
±7.9% (average, ±1.9%).
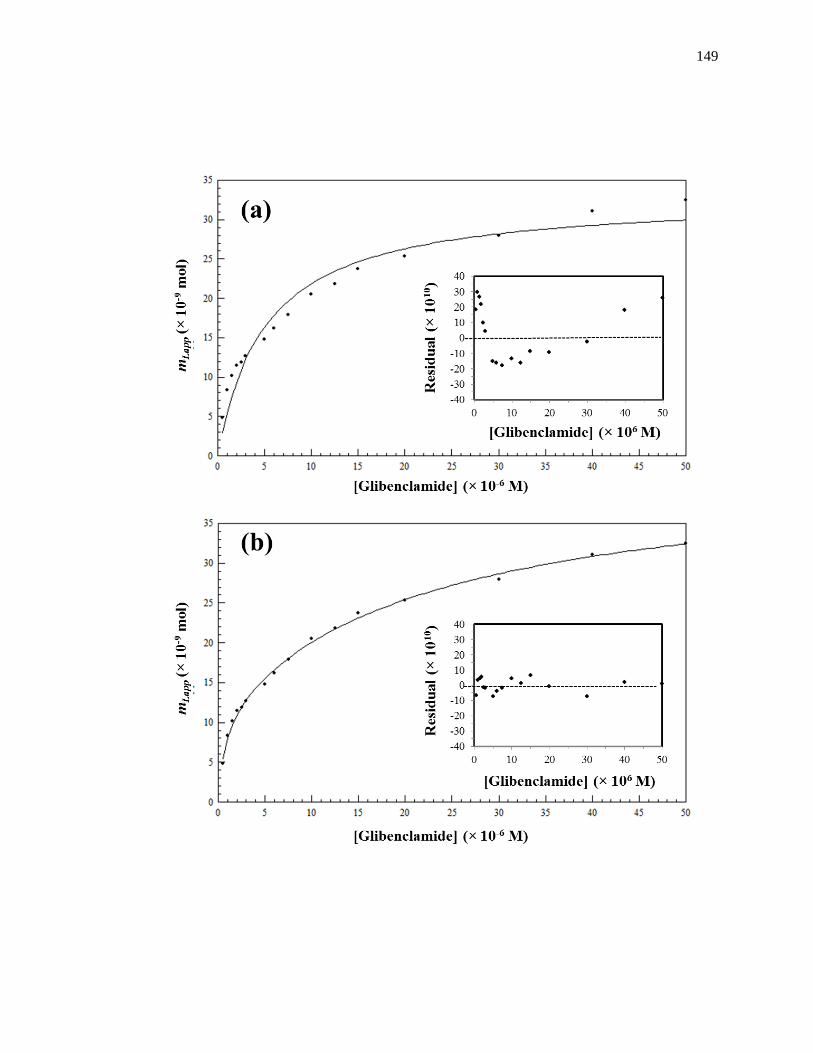
149
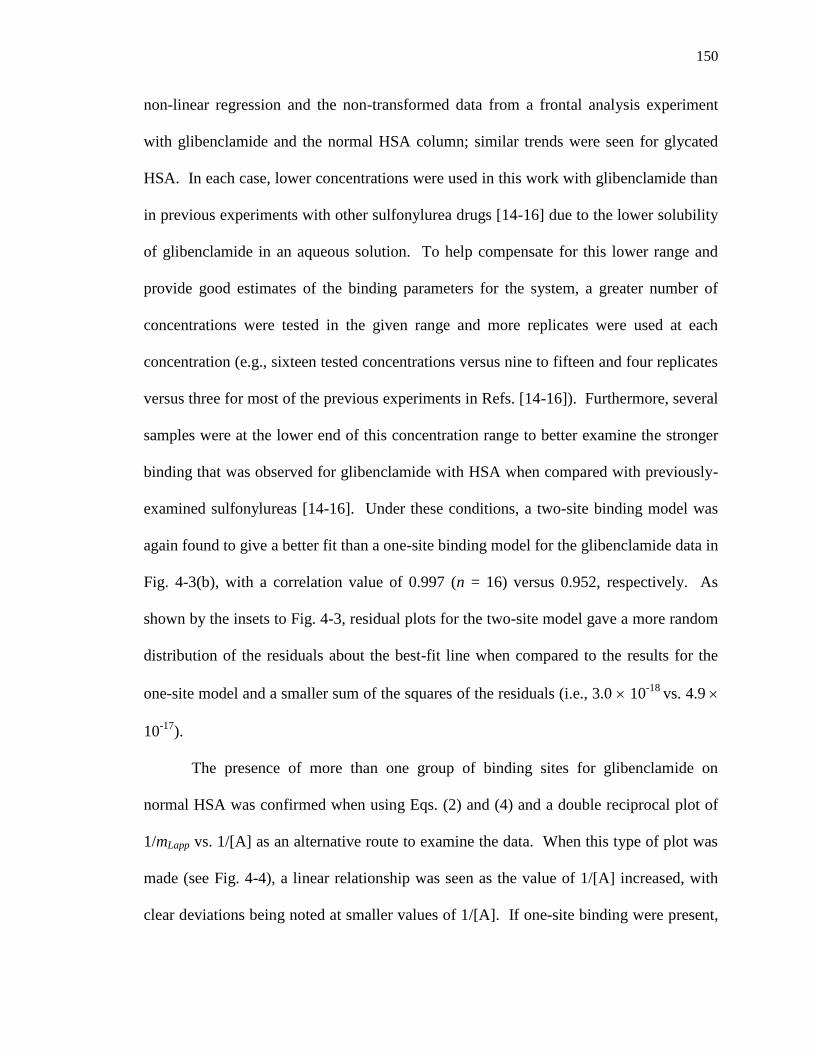
150
non-linear regression and the non-transformed data from a frontal analysis experiment
with glibenclamide and the normal HSA column; similar trends were seen for glycated
HSA. In each case, lower concentrations were used in this work with glibenclamide than
in previous experiments with other sulfonylurea drugs [14-16] due to the lower solubility
of glibenclamide in an aqueous solution. To help compensate for this lower range and
provide good estimates of the binding parameters for the system, a greater number of
concentrations were tested in the given range and more replicates were used at each
concentration (e.g., sixteen tested concentrations versus nine to fifteen and four replicates
versus three for most of the previous experiments in Refs. [14-16]). Furthermore, several
samples were at the lower end of this concentration range to better examine the stronger
binding that was observed for glibenclamide with HSA when compared with previously-
examined sulfonylureas [14-16]. Under these conditions, a two-site binding model was
again found to give a better fit than a one-site binding model for the glibenclamide data in
Fig. 4-3(b), with a correlation value of 0.997 (n = 16) versus 0.952, respectively. As
shown by the insets to Fig. 4-3, residual plots for the two-site model gave a more random
distribution of the residuals about the best-fit line when compared to the results for the
one-site model and a smaller sum of the squares of the residuals (i.e., 3.0 10-18
vs. 4.9
10-17
).
The presence of more than one group of binding sites for glibenclamide on
normal HSA was confirmed when using Eqs. (2) and (4) and a double reciprocal plot of
1/mLapp vs. 1/[A] as an alternative route to examine the data. When this type of plot was
made (see Fig. 4-4), a linear relationship was seen as the value of 1/[A] increased, with
clear deviations being noted at smaller values of 1/[A]. If one-site binding were present,

151
Figure 4-4. A double-reciprocal plot for frontal analysis experiments that examined
the binding of glibenclamide with normal HSA. The data in this plot were
the same as utilized in Fig. 4-3. The best-fit line was generated by using
the data for 0.5-5 µM glibenclamide and gave a correlation coefficient of
0.996 (n = 7).
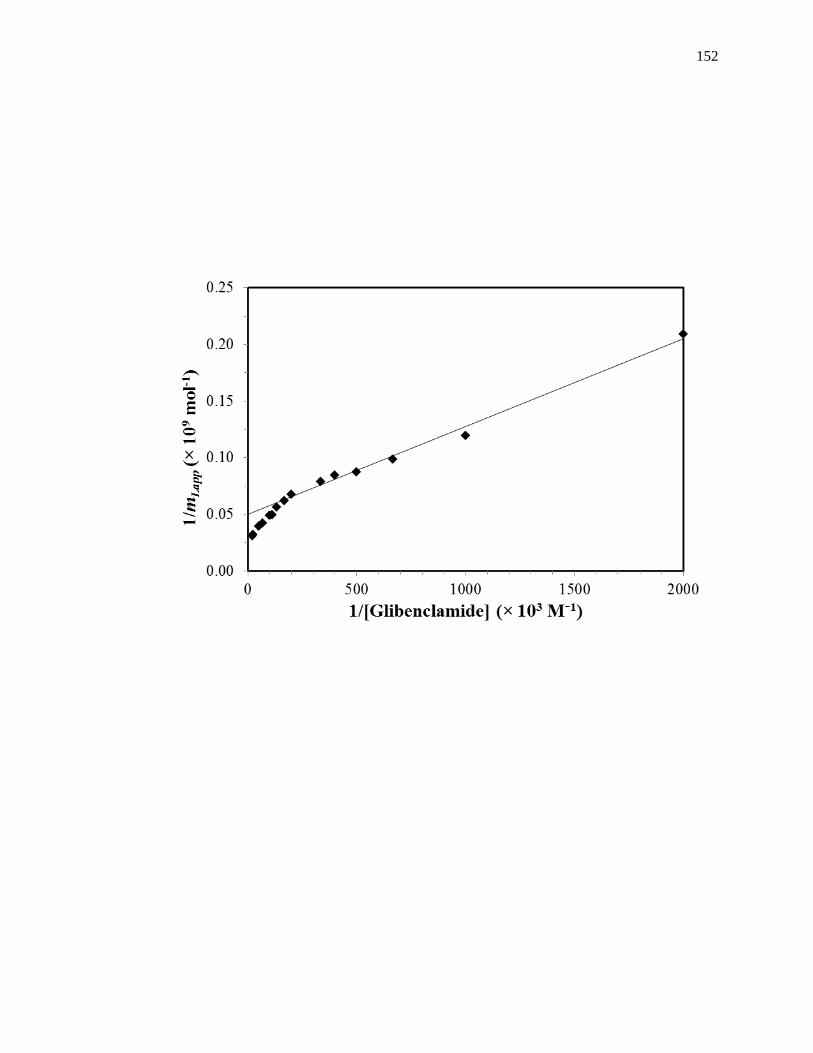
152
153
a linear response at all values of 1/[A] would have been expected in such a plot, as
predicted by Eq. (2). The fact that deviations from linearity were seen at small values for
1/[A] meant that at least two groups of sites were involved in this interaction, as indicated
by Eq. (4) (note: similar deviations from linearity are expected for higher-order binding
models) [32,38]. The linear response that was noted at higher values of 1/[A] in Figure
4-4 is predicted even for models involving multiple binding sites, as shown by Eq. (5)
[59,60].
lim[A]→01
𝑚𝐿𝑎𝑝𝑝=
1
𝑚𝐿(𝛼1+𝛽2−𝛼1𝛽2)𝐾𝑎1[A]+
𝛼1+𝛽22−𝛼1𝛽2
2
𝑚𝐿(𝛼1+𝛽2−𝛼1𝛽2)2 (5)
In addition, it is known from this linear region that an estimate can be made for the
association equilibrium constant of the highest affinity sites in the column [59,60]. Using
the linear region of Fig. 4-4, the value of Ka1 was found to be approximately 6.4 (± 0.5)
105
M-1
for the normal HSA column, where the value in parentheses represents a range of
1 S.D. This value for Ka1 is comparable to a binding constant of 7.6 105
M-1
at 37 °C
and pH 7.4 that has been previously reported for glibenclamide with normal HSA when
using a one-site binding model [61].
Use of the two-site model in Eq. (3) and the non-transformed frontal analysis data
provided association equilibrium constants of 1.4 (± 0.5) 106
M-1
and 4.4 (± 1.0) 104
M-1
for the binding of normal HSA with glibenclamide at pH 7.4 and 37° C (see Table 4-
1). The mL values for these sites were 1.1 (± 0.2) 10-8
mol and 3.1 (± 0.1) 10-8
mol,
respectively, in the column that was used for this experiment. It was noted in this case
that the result for Ka1 was roughly 10-fold higher than the corresponding values for the
high affinity sites that have been measured on an identical column and under the same
mobile phase conditions for other sulfonylurea drugs (i.e., tolbutamide, acetohexamide
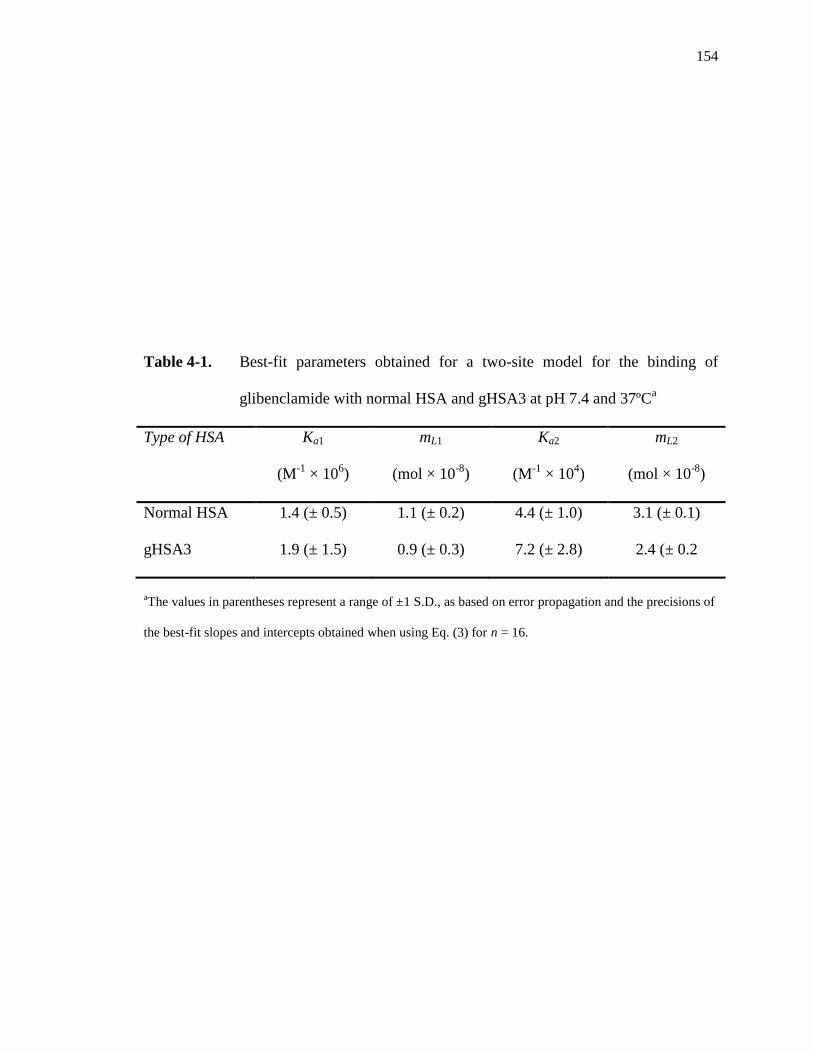
154
Table 4-1. Best-fit parameters obtained for a two-site model for the binding of
glibenclamide with normal HSA and gHSA3 at pH 7.4 and 37ºCa
Type of HSA Ka1
(M-1
× 106)
mL1
(mol × 10-8
)
Ka2
(M-1
× 104)
mL2
(mol × 10-8
)
Normal HSA 1.4 (± 0.5) 1.1 (± 0.2) 4.4 (± 1.0) 3.1 (± 0.1)
gHSA3 1.9 (± 1.5) 0.9 (± 0.3) 7.2 (± 2.8) 2.4 (± 0.2
aThe values in parentheses represent a range of ±1 S.D., as based on error propagation and the precisions of
the best-fit slopes and intercepts obtained when using Eq. (3) for n = 16.
155
and gliclazide) [16,58] (Note: a lower retention for glibenclamide on an HSA column was
noted versus these other drugs in the screening studies described in Ref. [42], but in
thisearlier case the apparent retention for glibenclamide was lowered by the presence of
-cyclodextrin as a solubilizing agent). An increase in affinity for glibenclamide to HSA
when compared to first-generation sulfonylurea drugs has been noted previously and was
expected due to the larger aromatic groups that are present in glibenclamide versus these
other agents [61].
The specific activity based on the protein content for this column at the high and
lower affinity sites were 0.63 (± 0.09) and 1.73 (± 0.07) mol/mol normal HSA,
respectively. This result suggested that one high affinity region existed on HSA with a
binding constant in the range of 106
M-1
, along with several lower affinity regions with
binding constants between 104
and 10
5 M
-1. For comparison, analysis of the same data by
using a one-site model resulted in an intermediate value for Ka1 of 2.0 (± 0.3) 105
M-1
, a
value for mL1 of 3.3 (± 0.1) 10-8
mol, and a relative activity of 1.8 (± 0.1) mol/mol
normal HSA.
Frontal analysis experiments were also performed with glibenclamide and a
highly glycated HSA sample (gHSA3). Plots prepared according to Eqs. (1-4) gave
trends similar to those shown for normal HSA in Fig. 4-3 and 4-4. For each type of plot,
the glycated HSA column again gave the best-fit to a two-site model (see summary in
Table 4-1). The one-site model gave a correlation coefficient of 0.976 (n = 16) in
comparison to a correlation coefficient of 0.994 for a two-site model for this column.
Residual plot analysis for the two different models showed a random distribution for the
two-site model and a smaller sum of the squares of the residuals when compared to the
156
one-site model (i.e., 8.5 10-18
vs. 3.7 10-17
). The association equilibrium constants
obtained for this column when using Eq. (3) and a two-site model were 1.9 (± 1.5) 106
M-1
and 7.2 (± 2.8) 104
M-1
. Based on the measured levels of these sites and the
column’s known protein content, the relative activities for these sites were found to be
0.45 (± 0.16) and 1.20 (± 0.11) mol/mol gHSA3, which were consistent with the results
observed for normal HSA. Analysis of the same data according to a double reciprocal
plot gave deviations from linearity that confirmed at least two groups of binding sites
were present. The linear region of this latter plot was again used with Eq. (5) to estimate
Ka1 for the high affinity sites, giving a value of 6.8 (± 0.4) 105
M-1
. This result was
comparable to the binding constant that was estimated by the same approach for the high
affinity sites of glibenclamide with normal HSA.
4.3.2 Binding of glibenclamide at Sudlow site I
Competition studies and zonal elution were next used to test for any changes that
may have occurred in the binding of glibenclamide at specific binding sites on normal
HSA or glycated HSA. These experiments used site-specific probes to examine the
competition between the injected probe and a competing agent, such as a drug that was
placed at a known concentration in the mobile phase. R-Warfarin was employed as a
site-specific probe for Sudlow site I in these studies, while the mobile phase contained
glibenclamide as a competing agent. Sudlow site I was of interest in this work because
previous studies with other sulfonylurea drugs have shown that this region has a
relatively high affinity for these solutes on both normal HSA and glycated HSA [14-
16,58]. Examples of some results that were obtained in this report with glibenclamide are
given in Fig. 4-5(a). In both these zonal elution studies and those described in the
157
following sections, the same range in concentrations for glibenclamide as a competing
agent was used as in prior work with other sulfonylurea drugs [14-16,58] because this
range was well within the solubility limit of glibenclamide. However, the number of
concentrations that were tested in this range was increased (from five-to-six up to seven-
to-eight) and the number of replicates was increased (from three to four) to allow for
more precise estimates to be obtained for the binding parameters of this system.
When analyzing data like that given in Fig. 4-5, direct competition between an
injected site-specific probe and a competing agent for a common binding site on an
immobilized protein should result in a decrease in the retention factor (k) for the probe as
the molar concentration of the competing agent ([I]) is increased [15,32]. The change in
k as a function of [I] for a system with competition at a single type of site is described by
Eq. (6). This equation predicts that a linear relationship will be formed for such a system
when a plot is made of 1/k versus [I].
1
𝑘=
𝐾𝑎I𝑉𝑀[I]
𝐾𝑎A𝑚𝐿+
𝑉𝑀
𝐾𝑎A𝑚𝐿 (6)
In this equation, KaA and KaI are the association equilibrium constants for the injected
probe and competing agent, respectively, at their site of competition. The term VM is the
column void volume, and mL represents the moles of common binding sites in the
column. According to this relationship, the ratio of the slope to the intercept for the best-
fit line can be used to find KaI, which provides information on the association equilibrium
constant for the agent in the mobile phase at its specific site of competition with the
injected probe.
Examination of the specific changes in binding at Sudlow site I for glibenclamide
by this approach gave linear relationships according to Eq. (6) for the columns that
158
Figure 4-5. Plots prepared according to Eq. (6) that show how the reciprocal of the
retention factor for (a) R-warfarin or (b) L-tryptophan changed on normal
HSA or glycated HSA columns as the concentration of glibenclamide was
varied in the mobile phase. These results are for normal HSA (●) and
gHSA2 (▲). Each point in these plots is the mean of four runs, with
relative standard deviations in (a) that ranged from ±0.3% to ±2.6
(average, ±2.1%) and in (b) that ranged from ±2.2% to ±15.4 (average,
±7.1%). The correlation coefficients for the normal HSA and gHSA2
plots in (a) were 0.966 (n = 6) and 0.975 (n = 8), respectively, while the
correlation coefficients in (b) were 0.970 (n = 7) and 0.993 (n = 8).
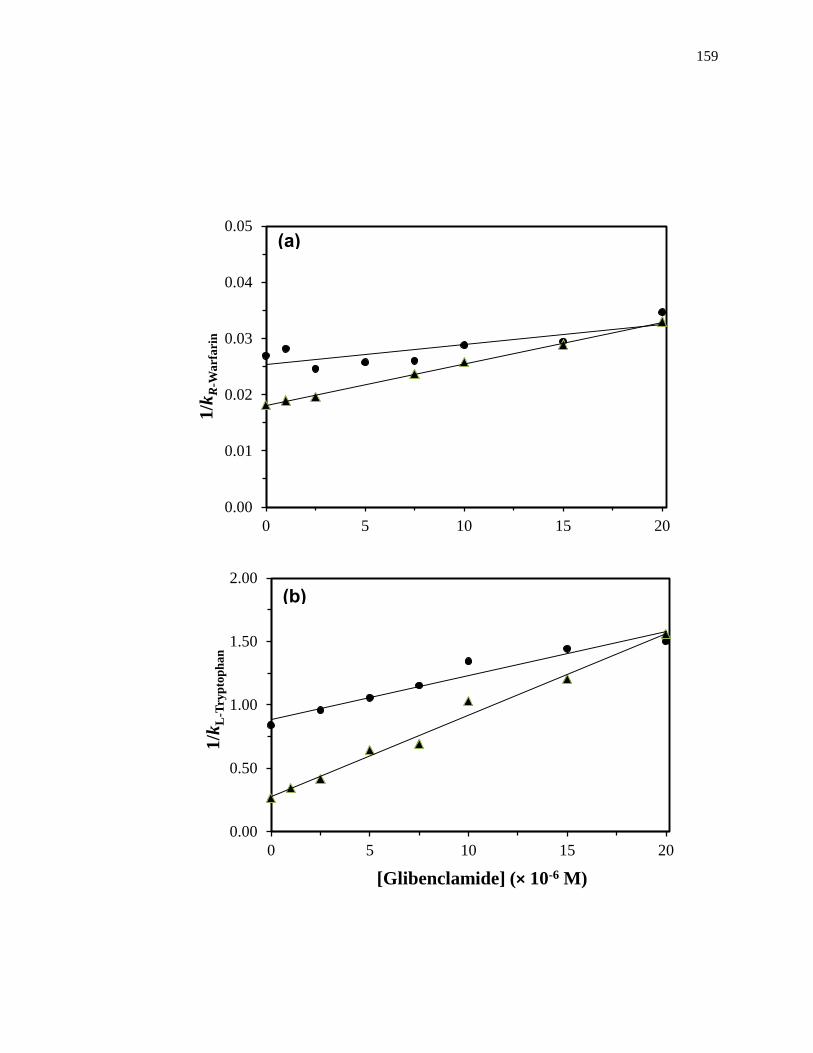
159
0.00
0.50
1.00
1.50
2.00
0 5 10 15 20
1/k
L-T
ryp
top
han
[Glibenclamide] (× 10-6 M)
0.00
0.01
0.02
0.03
0.04
0.05
0 5 10 15 20
1/k
R-W
arfa
rin
(a)
(b)
160
contained either normal HSA or glycated HSA and under the drug concentrations that
could be employed in these studies. These lines had correlation coefficients that ranged
from 0.966 to 0.992 (n = 6-8). Residual plots gave random distributions for the data
about the best-fit lines and sums for the squares of the residuals that ranged from 2.9
10-7
to 2.3 10-5
. The results for all the tested columns were found to fit with a direct
competition model for glibenclamide and R-warfarin at Sudlow site I. Similar previous
experiments have noted that related drugs such as tolbutamide, acetohexamide and
gliclazide also bind to this site on HSA [14-16].
In the next stage of this work, the association equilibrium constants that were
obtained from Eq. (6) were used to see how the binding of glibenclamide at Sudlow site I
was affected as the level of glycation for HSA was varied. The results are summarized in
Table 4-2. The site-specific association equilibrium constant that was measured by this
approach for glibenclamide at Sudlow site I of normal HSA was 2.4 (± 0.3) 104
M-1
at
pH 7.4 and 37 ºC. This value was slightly smaller than association equilibrium constants
of 4.2-5.5 104
M-1
that have been reported for normal HSA with the first-generation
sulfonylurea drugs tolbutamide and acetohexamide but was similar to an association
equilibrium constant of 1.9 104
M-1
that has been measured at this site for gliclazide,
another second-generation sulfonylurea drug [14-16,58] This binding constant is lower
than the values of 0.64-1.4 106
M-1
which were estimated in Section 4.3.1 for the high
affinity sites of glibenclamide with normal HSA, indicating that other regions probably
made up the high affinity sites for this drug. It was further noted that this affinity was in
the same general range as the value of 4.4 (± 1.0) 104
M-1
that was obtained in Section
4.3.1 for the lower affinity sites of glibenclamide with normal HSA.
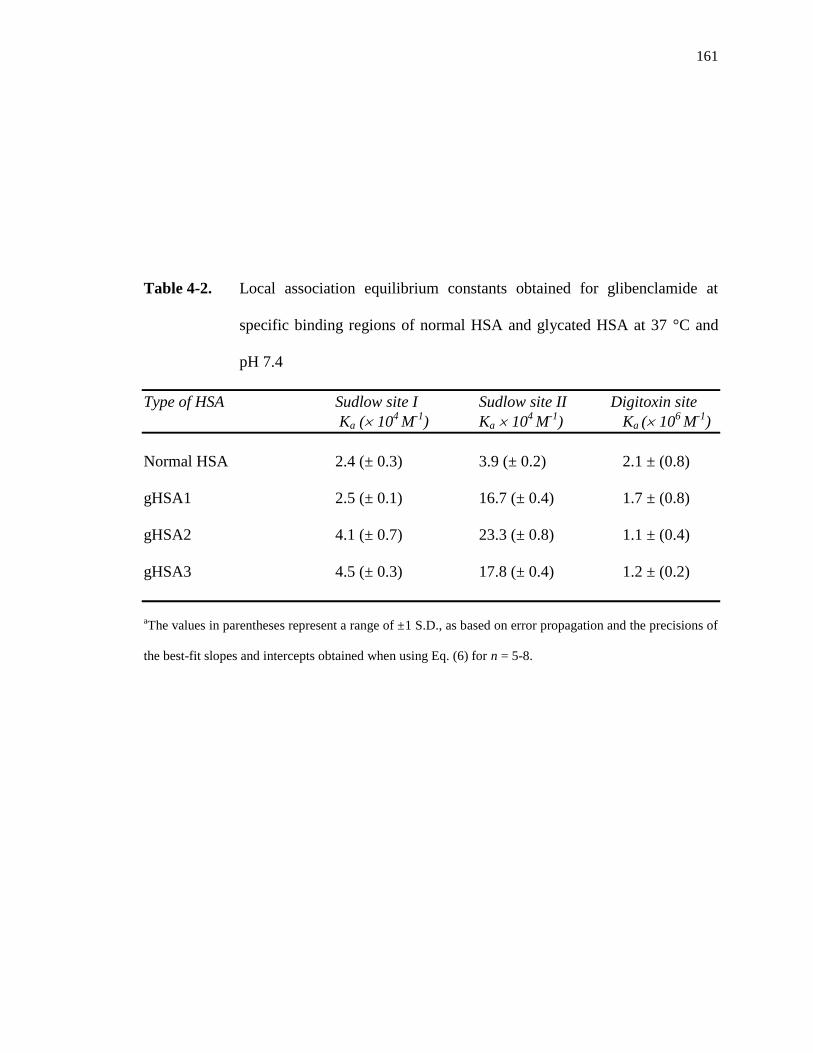
161
Table 4-2. Local association equilibrium constants obtained for glibenclamide at
specific binding regions of normal HSA and glycated HSA at 37 °C and
pH 7.4
Type of HSA Sudlow site I Sudlow site II Digitoxin site
Ka ( 104
M-1
) Ka 104
M-1
) Ka ( 106
M-1
)
Normal HSA 2.4 (± 0.3) 3.9 (± 0.2) 2.1 ± (0.8)
gHSA1 2.5 (± 0.1) 16.7 (± 0.4) 1.7 ± (0.8)
gHSA2 4.1 (± 0.7) 23.3 (± 0.8) 1.1 ± (0.4)
gHSA3 4.5 (± 0.3) 17.8 (± 0.4) 1.2 ± (0.2)
aThe values in parentheses represent a range of ±1 S.D., as based on error propagation and the precisions of
the best-fit slopes and intercepts obtained when using Eq. (6) for n = 5-8.
162
The association equilibrium constant for glibenclamide at Sudlow site I for
normal HSA was next compared to values measured at the same site for each glycated
HSA sample. There was no significant increase in the association equilibrium constant
for glibenclamide at Sudlow site I in going from normal HSA to gHSA1. However, a
1.7- to 1.9-fold increase in the association equilibrium constant was noted between
normal HSA and gHSA2 or gHSA3, which was significant at the 95% confidence level.
A change in affinity with the level of glycation has also been observed at Sudlow site I
for tolbutamide, acetohexamide, and gliclazide [14-16], as well as for other drugs (e.g.,
meloxicam and warfarin) [30]. These changes have been suggested to be due to
variations in the extent and types of modifications that occur at Sudlow site I during the
glycation process [14-16,30,49-51].
4.3.3 Binding of glibenclamide at Sudlow site II
Competition experiments were also performed for glibenclamide using L-
tryptophan as a probe for Sudlow site II of HSA. Previous studies have shown that this
site is another region that has moderately strong binding to other sulfonylurea drugs [14-
16,58]. Fig. 4-5(b) shows some examples of the data that were obtained for normal HSA
and glycated HSA in these experiments. All of the results gave a linear responses when
fit to Eq. (6), with correlation coefficients that ranged from 0.968 to 0.993 (n = 7-8). The
corresponding residual plots gave a random distribution of the points about the best-fit
lines. It was determined from these results that glibenclamide was competing with L-
tryptophan and was binding directly to Sudlow site II on both normal HSA and glycated
HSA.
The site-specific association equilibrium constants that were determined for
163
glibenclamide at Sudlow site II through these competition studies are summarized in
Table 4-2. The affinity for glibenclamide at Sudlow site II of normal HSA was 3.9 (±
0.2) 104
M-1
, which is similar to values of 5.3-13 104
M-1
that have been reported at
this site for acetohexamide, tolbutamide and gliclazide [14-16,58]. However, this result
is still much lower than the high affinity constant of 0.64-1.4 106
M-1
that was estimated
for glibenclamide with HSA in Section 4.3.1. Thus, this indicated that another region on
this protein besides Sudlow sites I or II also had strong interactions with glibenclamide.
The binding constant for glibenclamide to Sudlow site II of normal HSA was instead a
better fit with the value of 4.4 (± 1.0) 104
M-1
that was measured in the frontal analysis
studies for the lower affinity regions of HSA. This similarity, when combined with the
results in Section 4.3.2 and the moles of low affinity regions that were determined in
Section 4.3.1, suggested that both Sudlow sites I and II made up the lower affinity sites
that were detected during the frontal analysis experiments. This model also fits with the
observation that the value for Ka2 in Table 4-1 increased significantly in going from
normal HSA to gHSA3, because a large increase was also seen in Table 4-2 for the
association equilibrium constant of glibenclamide at Sudlow site II between normal HSA
and gHSA3.
Table 4-2 shows how the affinity for glibenclamide with HSA at Sudlow site II,
as determined from the best-fit lines obtained with Eq. (6), changed as the level of
glycation for HSA was increased. The columns containing gHSA1, gHSA2 and gHSA3
had a 4.3-, 6.0- or 4.6-fold increase in affinity for glibenclamide at Sudlow site II versus
normal HSA. All of these differences were significant at the 95% confidence level. This
trend is similar to the large increases in affinity that have been observed for L-tryptophan
164
with the same samples of glycated HSA [62]. Tolbutamide has also been noted to have a
modest increase in affinity at this site during the glycation of HSA [15], while
acetohexamide and gliclazide have been found to have a moderate decrease in affinity or
a mixed change in binding strength as the levels of glycation for HSA are varied [14,16].
4.3.4 Binding of glibenclamide at the digitoxin site
To help locate the high affinity region for glibenclamide on HSA, digitoxin was
also used as a site-specific probe for HSA [17-22]. Fig. 4-6 provides some typical results
that were obtained for normal HSA and glycated HSA. When Eq. (6) was used to
analyze these results, all of the normal and glycated HSA columns gave a linear response.
The best-fit lines had correlation coefficients that ranged from 0.994 to 0.999 (n = 4-5),
and the residual plots gave a random distribution for the data about the best-fit lines.
These results indicated that glibenclamide and digitoxin had direct competition on the
tested columns, confirming that glibenclamide was binding to the digitoxin site of HSA.
This result is supported by a previous observation that glibenclamide and first-generation
drugs such as tolbutamide appear to bind to different numbers of sites and through
different mechanisms with HSA, with non-polar interactions being important for
glibenclamide and ionic forces playing a greater role for tolbutamide [61]. This model
and the observed binding of glibenclamide to the digitoxin site is also consistent with the
fact that this site is known to bind other large, relatively hydrophobic drugs such as
digitoxin and acetyldigitoxin [17-22].
The association equilibrium constants for glibenclamide at the digitoxin site were
next calculated from the best-fit lines of plots like those in Fig. 4-6. The results are
summarized in Table 4-2. In this case, the association equilibrium constant measured for
165
Figure 4-6. Plots prepared according to Eq. (6) that show how the reciprocal of the
retention factor for digitoxin on HSA or glycated HSA columns changed
as the concentration of glibenclamide was varied in the mobile phase.
These results are for normal HSA (●) and gHSA3 (♦). The correlation
coefficients for these plots were 0.998 (n = 5) and 0.999 (n = 5),
respectively. Each point in these plots is the mean of four runs, with
relative standard deviations that ranged from ±0.6% to ±4.6 (average,
±1.8%).
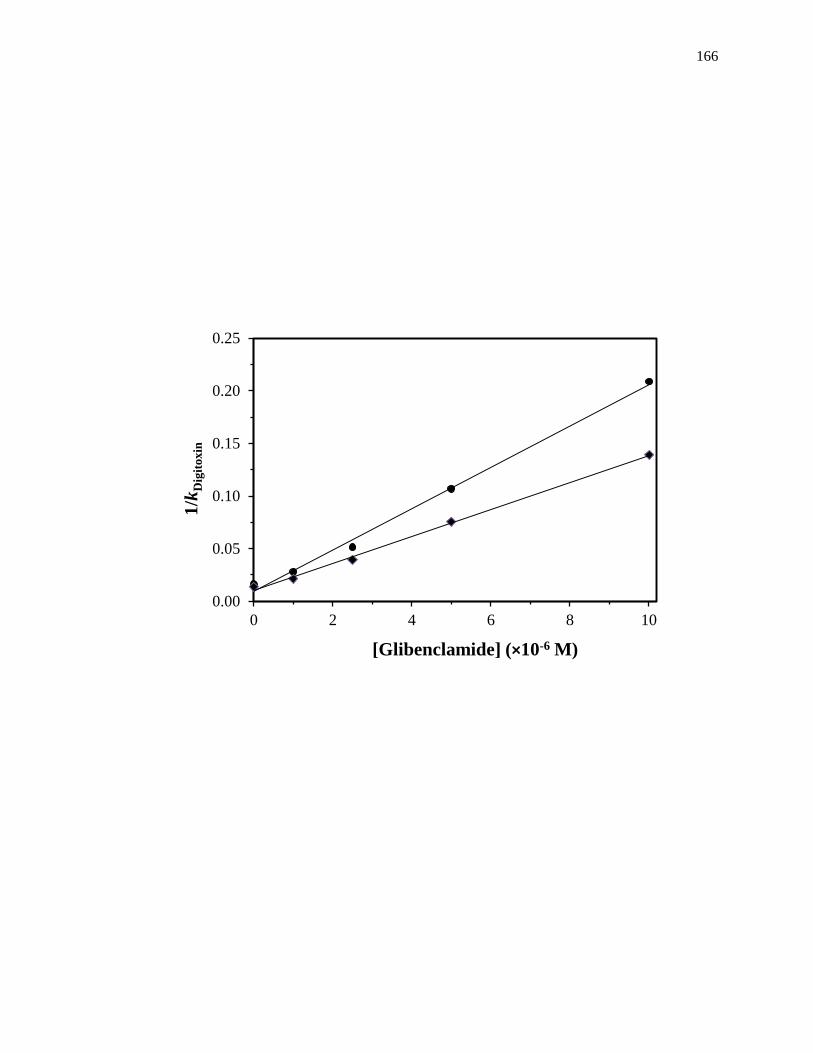
166
0.00
0.05
0.10
0.15
0.20
0.25
0 2 4 6 8 10
1/k
Dig
itoxin
[Glibenclamide] (×10-6 M)
167
glibenclamide at the digitoxin site of normal HSA was 2.1 (± 0.8) 106
M-1
. This value
was now statistically identical to the association equilibrium constant of 1.4 (± 0.5) 106
M-1
that had been previously estimated by frontal analysis for the high affinity sites of
glibenclamide on normal HSA. The same group of experiments suggested that there may
have been a decrease of 1.2- to 1.9-fold in affinity at the digitoxin site for glibenclamide
when going from normal HSA to gHSA1, gHSA2 or gHSA3. None of these individual
differences were significant at the 90% or 95% confidence level; however, the overall
trend of a decrease in affinity with an increase in the level of HSA glycation was
significant at the 90% confidence level when the complete set of samples was considered.
4.4 Conclusion
This report illustrated how HPAC could be modified for use with relatively low
solubility drugs such as glibenclamide and used as a tool to examine variations in drug
interactions with modified proteins, as demonstrated by using this approach to investigate
the changes that occur in the binding of glibenclamide to HSA at various stages of
glycation. Frontal analysis studies were used to estimate the affinity and moles of
binding sites for glibenclamide with HSA. The results showed that binding with normal
HSA and glycated HSA followed a two-site model in which interactions occurred at both
high and lower affinity sites. The association equilibrium constants for the high affinity
regions were in the range of 1.4-1.9 106
M-1
at pH 7.4 and 37ºC for columns containing
normal HSA or glycated HSA. The lower affinity regions had association equilibrium
constants that increased from 4.4 104
M-1
to 7.2 104
M-1
for the same columns.
The binding of glibenclamide to normal HSA and glycated HSA at Sudlow sites I
and II and at the digitoxin site was confirmed through the use of zonal elution
168
competition studies. The affinities for glibenclamide at Sudlow sites I and II of normal
HSA were 2.4 104
M-1
and 3.9 104
M-1
, respectively. These values were consistent
with values that were estimated for the lower affinity sites in the frontal analysis
experiments. As the level of glycation was increased, a 1.7- to 1.9-fold increase in
affinity was seen for glibenclamide at Sudlow site I for HSA with moderate to high levels
of glycation. An even larger change was noted at Sudlow site II, in which an increase in
affinity of 4.3- to 6.0-fold was observed versus normal HSA for all of the tested glycated
HSA samples. The association equilibrium constant for glibenclamide at the digitoxin
site of normal HSA was 2.1 106
M-1
, which fit with the value that was measured for the
high affinity sites by frontal analysis. Further studies indicated that glycation may have
lead to a slight decrease in affinity for glibenclamide at the digitoxin site, but this change
was not significant at the 95% confidence level for any individual sample of glycated
HSA.
The results of this report are of clinical interest for several reasons. First, the
large changes in binding seen for glibenclamide with glycated HSA, especially at Sudlow
site II, are of clinical interest because they would be expected to alter the affective dose
of the drug by changing the drug’s free fraction in the circulation. This is potentially
important for sulfonylurea drugs like glibenclamide because of the high level of plasma
protein binding of this drug, the relatively narrow therapeutic range of this drug in serum,
and the undesirable effects that occur if such the apparent activity of this drug levels fall
below or above this range (i.e., hyperglycemia or hypoglycemica) [9-11]. The fact that
the major binding regions on HSA are affected to different extents by glycation is also of
interest in that it implies that drug-protein interactions at these sites will vary as well for
169
drugs like glibenclamide. Finally, this work confirms that many sulfonylurea drugs can
bind to Sudlow sites I and II but also demonstrates for the first time that the digitoxin site
can play a major role in these interactions in the case of glibenclamide.
These results also illustrate how HPAC can be modified and used for examining
the interactions of relatively non-polar drugs like glibenclamide with modified proteins
and to provide a quantitative analysis of the changes in binding for such drugs that may
occur both globally and at specific interaction sites. These efforts were aided by many of
the potential advantages of HPAC for drug-binding studies. For instance, the ability of
HPAC to be used with detection methods such as UV/visible absorbance spectroscopy
[31-33,35,39-42] made it possible to look at the low-to-moderate concentrations of
glibenclamide that were required for the frontal analysis and zonal elution experiments in
this report. The good precision and fast analysis times of HPAC [31-33], along with the
ability to reuse normal HSA or glycated HSA columns over hundreds of experiments [14-
16], made it convenient to use more replicates and sample concentrations with these
columns without the need for additional protein. Furthermore, this last feature made it
possible to use the same protein preparations as in work with previous sulfonylurea drugs
[14-16,58], allowing a direct comparison to be made in the binding properties of
glibenclamide versus these other drugs. The ability to easily combine this method with
new probes (e.g., digitoxin) for examining newly-identified drug-protein interaction sites
was further illustrated in this report. The approaches used here for such experiments are
not limited to glibenclamide and HSA but could be adapted for use with systems that
involve other drugs or modified proteins. Based on these features, it is expected that
HPAC will continue to grow in applications and as a powerful technique for examining
170
these and additional types of biological interactions.
4.5 References
1. International Diabetes Federation. IDF Diabetes Atlas, 5th edn. Brussels,
Belgium: International Diabetes Federation, 2011, Chap. 2.
2. National Diabetes Fact Sheet: General Information and National Estimates on
Diabetes in the United States, 2011, US Centers for Disease Control and
Prevention, Atlanta, GA, 2011, pp 1-12.
3. D.L. Nelson, M. Cox, Lehninger Principles of Biochemistry, Freeman, New York,
2005, Chap. 23.
4. T.G. Skillman, J.M. Feldman, The pharmacology of sulfonylureas, Am. J. Med.
70 (1981) 361-372.
5. G.L. Amidon, H. Lennernas, V.P. Shah, J.R. Crison, A theoretical basis for
biopharmaceutical drug classification: the correlation of in vitro drug product
dissolution and in vivo bioavailability, Pharm. Res. 12 (1995) 413-420.
6. R.M. Zavod, J.L. Krstenansky, B.L. Currie, in: T.L. Lemke, D.A. Williams
(Eds.), Foye’s of Medicinal Chemistry. Lippincott Williams and Wilkins,
Philadelphia, 2008, Chap. 32.
7. D. W. Foster, in: K.J. Isselbacher, E. Braunwald, J.D. Wilson, J.B. Martin, A.S.
Fauci, D.L. Kasper (Eds.), Harrison’s Principles of Internal Medicine, McGraw-
Hill, New York, 1998, Chap. 29.
8. M.G. Jakoby, D.F. Covey, D.P. Cistola, Localization of tolbutamide binding sites
on human serum albumin using titration calorimetry, Biochemistry 34 (1995)
8780-8787.
171
9. R. Rogenthal, M. Krueger, C. Koeppel, R. Preiss, Drug levels: therapeutic and
toxic/serum/plasma concentrations of common drugs, J. Clin. Monitor.
Computing 15 (1999) 529-544.
10. S.N. Davis, in: L.L. Brunton, J.S. Lazo, K.L. Parker (Eds.),Goodman and
Gilman’s The Pharmacological Basis Of Therapeutics, 11th ed., McGraw-Hill,
New York, 2006, Chap. 60.
11. N.W. Tietz (Ed.), Clinical Guide to Laboratory Tests, 2nd ed., Saunders,
Philadelphia, 1990.
12. G. Sudlow, D.J. Birkett, D.N. Wade, Further characterization of specific drug
binding sites on human serum albumin, Mol. Pharmacol. 12 (1976) 1052–1061.
13. G.A. Ascoli, E. Domenic, C. Bertucci, Drug binding to human serum albumin:
abridged review of results obtained with high-performance liquid chromatography
and circular dichroism, Chirality 18 (2006) 667–679.
14. K.S. Joseph, J. Anguizola, A.J. Jackson, D.S. Hage, Chromatographic analysis of
acetohexamide binding to glycated human serum albumin, J. Chromatogr. B 878
(2010) 2775–2781.
15. K.S. Joseph, J. Anguizola, D.S. Hage, Binding of tolbutamide to glycated human
serum albumin, J. Pharm. Biomed. Anal. 54 (2011) 426–432.
16. R. Matsuda, J. Anguizola, K.S. Joseph, D.S. Hage, High-performance affinity
chromatography and that analysis of drug interactions with modified proteins:
binding of gliclazide with glycated human serum albumin, Anal. Bioanal. Chem.
401 (2011) 2811-2819.
17. O. Bros, D. Fremstad, C. Poulsson, The affinity of human serum albumin for
172
[3H]-digitoxin is dependent on albumin concentration, Pharmacol. Toxicol. 72
(1993) 310-313.
18. I. Sjoholm, in: M. Reidenberg, S. Erill (Eds.) Drug-Protein Binding, Praeger, New
York, 1986, Chap. 4.
19. A. Brock, Binding of digitoxin to human serum proteins: influence of pH on the
binding of digitoxin to human albumin, Acta. Pharmacol. Toxicol. 36 (1975) 13-
24.
20. D.S. Hage, A. Sengupta, Characterization of the binding of digitoxin and
acetyldigitoxin to human serum albumin by high-performance affinity
chromatography, J. Chromatogr. B 725 (1999) 91-100.
21. J. Chen, C. Ohnmacht, D.S. Hage, Studies of phenytoin binding to human serum
albumin by high-performance affinity chromatography. J. Chromatogr. B Analyt.
Technol. Biomed. Life Sci. 809 (2004) 137-145.
22. C.M. Ohnmacht, S. Chen, Z. Tong, D.S. Hage, Studies by biointeraction
chromatography of binding by phenytoin metabolites to human serum albumin, J.
Chromatogr. B Analyt. Technol. Biomed. Life Sci.836 (2006) 83-91.
23. D.L. Mendez, R.A. Jensen, L.A. McElroy, J.M. Pena, R.M. Esquerra, The effect
of non-enzymatic glycation on the unfolding of human serum albumin, Arch.
Biochem. Biophys. 444 (2005) 92-99.
24. G. Colmenarejo, In silico prediction of drug-binding strengths to human serum
albumin, Med. Res. Rev. 23 (2003) 275-301.
25. H. Koyama, N. Sugioka, A. Uno, S. Mori, K. Nakajima, Effects of glycosylation
of hypoglycemic drug binding to serum albumin, Biopharm. Drug Dispos. 18
173
(1997) 791-801.
26. R.L. Garlick, J.S. Mazer, The principal site of nonenzymatic glycosylation of
human serum albumin in vivo, J. Biol. Chem. 258 (1983) 6142-6146.
27. N. Iberg, R. Fluckiger, Nonenzymatic glycosylation of albumin in vivo, J. Biol.
Chem. 261 (1986) 13542-13545.
28. K. Nakajou, H. Watanabe, U. Kragh-Hansen, T. Maruyama, M. Otagiri, The
effect of glycation on the structure, function and biological fate of human serum
albumin as revealed by recombinant mutants, Biochim. Biophys. Acta 1623
(2003) 88-97.
29. R. Khodarahmi, S.A. Karimi, M.R. Ashrafi Kooshk, S.A. Ghadami, S. Ghobadi,
M. Amani, Comparative spectroscopic studies on drug binding characteristics and
protein surface hydrophobicity of native and modified forms of bovine serum
albumin: possible relevance to change in protein structure/function upon non-
enzymatic glycation, Spectrochim, Acta. A Mol. Biomol. Spectrosc. 89 (2012)
177-186/
30. L. Trynda-Lemiesz, K. Wiglusz, Effects of glycation on meloxicam binding to
human serum albumin, J. Mol. Struct. 995 (2011) 35-40.
31. J.E. Schiel, K.S. Joseph, D.S. Hage, in: N. Grinsberg, E. Grushka (Eds.), Adv.
Chromatogr., Taylor & Francis, New York, 2010, Chap. 4.
32. D.S. Hage, High-performance affinity chromatography: a powerful tool for
studying serum protein binding, J. Chromatogr. B 768 (2002) 3-30.
33. S. Patel, I.W. Wainer, W.J. Lough, in: D.S. Hage (Ed.), Handbook of Affinity
Chromatography, 2nd
ed., Taylor & Francis, New York, 2006, Chap. 24.
174
34. D.J. Winzor, in: D.S. Hage (Ed.), Handbook of Affinity Chromatography, 2nd
ed., Taylor & Francis, New York, 2006, Chap. 23.
35. E. Domenici, C. Bertucci, P. Salvadori, I.W. Wainer, Use of a human serum
albumin-based high-performance liquid chromatography chiral stationary phase
for the investigation of protein binding: detection of the allosteric interaction
between warfarin and benzodiazepine binding sites, J. Pharm. Sci. 80 (1991) 164-
166.
36. P. Kovarik, R.J. Hodgson, T. Covey, M.A. Brook, J.D. Brennan, Capillary-scale
frontal affinity chromatography/MALDI tandem mass spectrometry using protein-
doped monolithic silica columns, Anal. Chem. 77 (2005) 3340-3350.
37. D.S. Schriemer, Biosensor alternative: frontal affinity chromatography, Anal.
Chem. 76 (2004) 440A-448A.
38. D.S. Hage, J. Anguizola, O, Barnaby, A. Jackson, M.J. Yoo, E. Papastavros, E.
Pfaunmiller, M. Sobansky, Z. Tong, Characterization of drug interactions with
serum proteins by using high-performance affinity chromatography, Curr. Drug
Metab. 12 (2011) 313-328.
39. T.A.G. Noctor, I.W. Wainer, The in situ acetylation of an immobilized human
serum albumin chiral stationary phase for high-performance liquid
chromatography in the examination of drug-protein binding phenomena,
Pharmaceut. Res. 9 (1992) 480-484.
40. A. Chattopadhyay, T. Tian, L. Kortum, D.S. Hage, Development of tryptophan-
modified human serum albumin columns for site-specific studies of drug-protein
interactions by high-performance affinity chromatography, J. Chromatogr. B 715
175
(1998) 183-190.
41. J. Haginaka, N. Kanasugi, Enantioselectivity of bovine serum albumin-bonded
columns produced with isolated protein fragments. II. Characterization of protein
fragments and chiral binding sites, J. Chromtogr. A. 769 (1997) 215-223.
42. S.B.G. Basiaga, D.S. Hage, Chromatographic studies of changes in binding of
sulfonylurea drugs to human serum albumin due to glycation and fatty acids, J.
Chromatogr. B Analyt. Technol. Biomed. Life Sci. 878 (2010) 3193-3197.
43. K.S. Joseph, D.S. Hage, The effects of glycation on the binding of human serum
albumin to warfarin and L-tryptophan, J. Pharm. Biomed. Anal. 53 (2010) 811-
818.
44. J. Baraka-Vidot, A. Guerrin-Dubourg, E. Bourdon, P. Rondeau, Impaired drug-
binding capacities of in vitro and in vivo glycated albumin, Biochimie 94 (2012)
1960-1967.
45. A.C. Powers, in: D.L. Kasper, A.S. Fauci, D.L. Longo, E. Braunwald, S.L.
Hauser, J.L. Jameson (Eds.), Harrison’s Principles of Internal Medicine,
McGraw-Hill, New York, 2005, Chap. 323.
46. A. Lapolla, D. Fedele, R. Reitano, N.C. Arico, R. Seraglia, P. Traldi, E. Marotta,
R. Tonani, Enzymatic digestion and mass spectrometry in the study of advance
glycation end products/peptides, J. Am. Soc. Mass Spectrom. 25 (2004) 496-509.
47. O. Barnaby, Characterization of Glycation Sites on Human Serum Albumin using
Mass Spectrometry, Ph.D. Dissertation, University of Nebraska, Lincoln, NE,
2010.
48. K.S. Joseph, Chromatographic Studies of Drug-Protein Binding in Diabetes,
176
Ph.D. Dissertation, University of Nebraska, Lincoln, NE, 2010.
49. O.S. Barnaby, R.L. Cerny, W. Clarke, D.S. Hage, Comparison of modification
sites formed on human serum albumin at various stages of glycation, Clin. Chim.
Acta 412 (2011) 277-285.
50. O.S. Barnaby, R.L. Cerny, W. Clarke, D.S. Hage, Quantitative analysis of
glycation patterns in human serum albumin using 16
O/18
O-labeling and MALDI-
TOF MS, Clin. Chim. Acta 412 (2011) 1606-1615.
51. C. Wa, R.L. Cerny, D.S. Hage, Identification and quantitative studies of protein
immobilization sites by stable isotope labeling and mass spectrometry, Anal.
Chem. 78 (2006) 7967-7977.
52. P.F. Ruhn, S. Garver, D.S. Hage, Development of dihydrazide-activated silica
supports for high-performance affinity chromatography, J. Chromatogr. A. 669
(1994) 9-19.
53. J. Yang, D.S. Hage, Effect of mobile phase composition on the binding kinetics of
chiral solutes on a protein-based high-performance liquid chromatography
column: interactions of D- and L-tryptophan with immobilized human serum
albumin, J. Chromatogr. A. 766 (1997) 15-25.
54. B. Loun, D.S. Hage, Chiral separation mechanisms in protein-based HPLC
columns. I. Thermodynamic studies of (R)- and (S)-warfarin binding to
immobilized human serum albumin, Anal. Chem. 66 (1994) 3814-3822.
55. J. Yang, D.S. Hage, Characterization of the binding and chiral separation of D-
and L-tryptophan on a high-performance immobilized human serum albumin
column, J. Chromatogr. 645 (1993) 241-250.
177
56. S.H. Yalkowsky, R.M. Dannenfelser. Aquasol Database of Aqueous Solubility,
Ver. 5, Univ. Ariz., Tucson, 1992.
57. M.L. Conrad, A.C. Moser, D.S. Hage, Evaluation of idole-based probes for high-
throughput screening of drugs binding to human serum albumin: Analysis by
high-performance affinity chromatography, J. Sep. Sci. 32 (2009) 1145-1155.
58. K.S. Joseph, D.S. Hage, Characterization of the binding of sulfonylurea drugs to
HSA by high-performance affinity chromatography, J. Chromatogr. B 878 (2010)
1590-1598.
59. S.A. Tweed, B. Loun, D.S. Hage, Effects of ligand heterogeneity in the
characterization of affinity columns by frontal analysis, Anal. Chem. 69 (1997)
4790-4798.
60. Z. Tong, J.E. Schiel, E Papastavros, C.M. Ohnmacht, Q.R. Smith, D.S. Hage,
Kinetic studies of drug-protein interactions by using peak profiling and high-
performance affinity chromatography: examination of multi-site interactions of
drugs with human serum albumin columns, J.Chromatogr. A. 1218 (2011) 2065-
2071.
61. M.J. Crooks, K.F. Brown, The binding of sulphonylureas to serum albumin. J.
Pharm. Pharmacol. 26 (1974) 304-311.
62. K.S. Joseph, D.S. Hage, The effects of glycation on the binding of human serum
albumin to warfarin and L-tryptophan, J. Pharm. Biomed. Anal. 53 (2010) 811-
818.
178
CHAPTER 5:
ANALYSIS OF GLIPIZIDE BINDING TO NORMAL AND GLYCATED HUMAN
SERUM ALBUMIN BY HIGH-PERFORMANCE AFFINITY
CHROMATOGRAPHY
Note: Portions of this chapter have appeared in R. Matsuda, Z. Li, X. Zheng, D.S. Hage,
“Analysis of Glipizide Binding to Normal and Glycated Human Serum Albumin by
High-Performance Affinity Chromatography”, Anal. Bioanal. Chem. (2015) In press.
5.1 Introduction
An estimated 366 million people in the world and 25.8 million people in the
United States are affected by diabetes [1,2]. Diabetes is a disease that is associated with
elevated levels of glucose in the blood stream, which can result in non-enzymatic protein
glycation [3-8]. Glycation involves the reaction between glucose and free amine groups
on proteins [3-8]. This process initially results in the formation of a Schiff base, which
can undergo further rearrangement to form a stable Amadori product. Glycation has been
a topic of growing interest due to its possible effect on proteins and tissues [9]. One
protein that has been examined in recent years in such work is human serum albumin
(HSA), with diabetic patients having a 2- to 5-fold increase in the amount of glycated
HSA versus persons who do not have diabetes [10].
HSA is the most abundant serum protein [11,12]. This protein has a single chain
of 585 amino acids and a molecular weight of 66.5 kDa [11,12]. HSA is involved in
several physiological processes, including the transportation of low mass substances such
as hormones, fatty acids, and drugs [5,11,13-16]. There are two major binding sites for
drugs on HSA: Sudlow sites I and II [11,17,18]. Drugs that bind to Sudlow site I include
179
bulky heterocyclic anionic drugs such as warfarin, azapropazone, phenylbutazone, and
salicylate [11,13,17,19], while drugs or solutes such as ibuprofen, fenoprofen,
ketoprofen, benzodiazepine, and L-tryptophan bind to Sudlow site II [11,13,17,20].
There are also other regions on HSA that can bind to fatty acids and to drugs like
tamoxifen or digitoxin [13-16,21-23].
Sulfonylurea drugs are orally-administered drugs that are commonly used to treat
type II diabetes [2,24]. The core structure of a sulfonylurea drug is shown in Fig. 5-1.
Sulfonylurea drugs are known to bind tightly to serum proteins, and especially to HSA
[9]. Several studies have recently examined the binding of sulfonylurea drugs to HSA
and glycated forms of this protein [25-33]. Some common first-generation sulfonylurea
drugs (e.g., tolbutamide and acetohexamide) and a number of second-generation drugs
(e.g., gliclazide and glibenclamide) have all been found to bind at both Sudlow sites I and
II on normal HSA and glycated HSA [25-30]. Glibenclamide has also been found to
interact with the digitoxin site of HSA [30].
The purpose of this report is to examine binding by glipizide to normal HSA and
HSA at various stages of in vitro glycation. Glipizide (see Fig. 5-1) is a second-
generation sulfonylurea drug that has a limited solubility in water (approximately 20
mg/L) and is relatively lipophilic (log P, 2.31). These properties have made it difficult to
work with this drug under physiological conditions and when using some traditional
methods for binding studies (e.g., fluorescence spectroscopy) [33-37]. An alternative
approach that will be used in this report for such studies is high-performance affinity
chromatography (HPAC).
HPAC is a type of HPLC that uses an immobilized biologically-related agent
180
Figure 5-1. Structure of glipizide. The section in the dashed box shows the common
core structure of all sulfonylurea drugs.
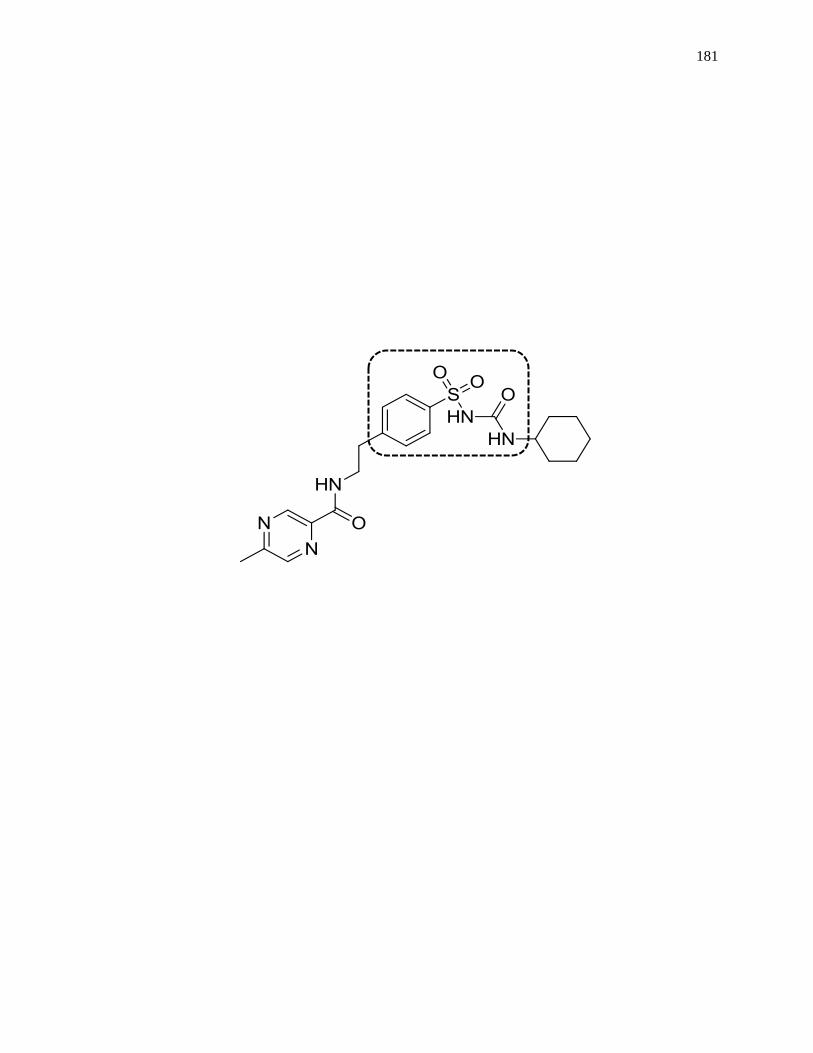
181
182
(e.g., HSA) as a stationary phase to retain specific analytes in applied samples [39,40].
HPAC has frequently been used in the past for the isolation and analysis of specific
targets; however, this technique can also be employed for characterizing biological
interactions [39-41]. This has included the recent use of HPAC in examining the effects
of glycation on the binding of several first- and second-generation sulfonylurea drugs to
HSA [25-32]. Some advantages of HPAC for this type of work are its ability to
determine both the strength of a drug-protein interaction and the number or location of
these binding sites [39-40]. Recent studies have also demonstrated that HPAC can be
used with drugs that have limited solubility in aqueous buffers [30].
This report will use HPAC to examine both the overall binding and site-specific
interactions of glipizide with HSA, based on the methods of frontal analysis and zonal
elution competition studies. These experiments will be conducted with both normal HSA
and with HSA that has been prepared in vitro to have levels of glycation that are
representative of those found in pre-diabetes or diabetes. HPAC will be used to identify
the major binding sites for glipizide on HSA and to characterize the affinities of these
sites for this drug, or the interactions between such sites during the binding of glipizide
with HSA. These experiments should provide a better understanding of how HPAC can
be used to examine binding by drugs that may have relatively complex interactions with a
protein. The results should also help to build a more complete picture of how non-
enzymatic glycation may alter the binding of drugs such as glipizide to HSA and affect
the serum protein binding and transport of such a drug during diabetes.
183
5.2 Experimental
5.2.1 Chemicals
The glipizide (≥ 96% pure), R-warfarin (≥ 97%), racemic warfarin (≥ 99%), L-
tryptophan (≥ 97%), digitoxin (≥ 97%), tamoxifen (≥ 99%), β-cyclodextrin (> 98%), D-
(+)-glucose (≥ 99.5%), sodium azide (95%), and HSA (essentially fatty acid free, (≥
96%) were purchased from Sigma Aldrich (St. Louis, MO, USA). Nucleosil Si-300 (7
µm particle diameter, 300 Å pore size) was obtained from Macherey-Nagel (Düren,
Germany). A fructosamine assay kit was purchased from Diazyme Laboratories (San
Diego, CA, USA) and was used to measure the modification levels of the in vitro
glycated HSA samples. Reagents for the bicinchoninic acid (BCA) protein assay were
obtained from Pierce (Rockford, IL, USA). A Milli-Q-Advantage A 10 system (EMD
Millipore Corporation, Billerica, MA, USA) was used to purify the water that was
utilized to make all aqueous solutions, which were also filtered through 0.20 µm GNWP
nylon membranes from Millipore.
5.2.2 Instrumentation
The chromatographic system was purchased from Jasco (Tokyo, Japan) and
consisted of two PU-2080 pumps, a DG-2080 degasser, an AS-2057 autosampler, a CO-
2060 column oven, and an UV-2075 absorbance detector. A Rheodyne Advantage PF
six-port valve (Cotati, CA, USA) was also included in the system. The system was
controlled by Jasco LCNet through use of ChromNav software. PeakFit 4.12 (Jandel
Scientific Software, San Rafael, CA, USA) was used to analyze the chromatograms.
Non-linear regression analysis was carried out by using Data Fit 8.1.69 (Oakdale, PA,
USA).
184
5.2.3 In-vitro Glycation of HSA
Two samples of glycated HSA (referred to here as gHSA1 and gHSA2) were
prepared in vitro at a physiological concentration and pH, according to previously-
published procedures [28,42,43]. During the preparation of these samples, all materials
used for this procedure (e.g., glassware and spatulas) were first sterilized through
autoclaving to prevent bacterial growth during the glycation process. A sterile pH 7.4,
0.20 M potassium phosphate buffer was also prepared in this manner. Further prevention
of bacterial growth was achieved through the addition of 1 mM sodium azide to this
buffer.
Normal HSA (i.e., 840 mg) was placed into a 20 mL portion of the pH 7.4 buffer
(giving a final concentration of 42 mg/L HSA) along with either a moderate or high
concentration of D-glucose (i.e., 5 or 10 mM). These mixtures were incubated for four
weeks at 37 °C to allow glycation to occur. The samples were then lyophilized and
stored at -80 °C until further use. A fructosamine assay was performed in duplicate
according to a previous procedure [28] and used to determine the glycation level of these
HSA samples. The measured glycation levels for the normal HSA, gHSA1 and gHSA2
were 0.24 (± 0.13), 1.39 (± 0.28) and 3.20 (± 0.13) mol hexose/mol HSA, respectively.
5.2.4 Preparation of Supports and Columns
The chromatographic supports were prepared by first converting Nucleosil Si-300
silica into a diol-bonded form and then immobilizing HSA or glycated HSA to this
material through the Schiff base method [44-47]. Although free amine groups are
involved in both the Schiff base immobilization method and glycation, these processes
tend to involve different residues on HSA, making the resulting protein support a good
185
model for the soluble forms of normal HSA or glycated HSA [25-32,48]. A control
support was prepared in this manner; however, no protein was added during the
immobilization step in this latter case. A BCA assay was performed to determine the
protein content of each final support. This assay was performed in triplicate with soluble
HSA being used as the standard. The control support was used as a blank. The measured
protein content was 97 (± 2), 85 (± 4), and 95 (± 4) mg HSA/g silica for the normal HSA,
gHSA1, and gHSA2 supports, respectively.
A portion of each support was downward slurry packed into a separate 2.0 cm ×
2.1 mm i.d. stainless steel column at 3500 psi (24 MPa) and using a packing solution that
was pH 7.4, 0.067 M potassium phosphate buffer. The packed columns and any
remaining support were stored at 4 °C in pH 7.4, 0.067 M phosphate buffer until further
use. These columns remained stable throughout the course of this entire study (i.e., over
the course of 500 sample applications) and with no significant changes being noted in
their binding properties during the described experiments, as reported in prior work with
similar columns [25-30,49].
5.2.5 Chromatographic Studies
The solutions of glipizide, R-warfarin, racemic warfarin, L-tryptophan, digitoxin,
and tamoxifen were prepared in pH 7.4, 0.067 M phosphate buffer. Digitoxin and
tamoxifen have limited solubility in aqueous solutions (i.e., around 4 mg/L and 0.17
mg/L, respectively), so a solubilizing agent (i.e., β-cyclodextrin) was also placed into
their solutions [50,51]. Digitoxin was prepared in a 0.88 mM β-cyclodextrin solution,
and tamoxifen was prepared in a 2.2 mM β-cyclodextrin, as described previously [21-23].
The racemic warfarin, R-warfarin, digitoxin, and tamoxifen solutions were prepared and
186
used within two weeks of preparation [28,49,52]. Solutions of L-tryptophan in pH 7.4,
0.067 M phosphate buffer are known to be stable for a period of about 2-9 days, so these
particular solutions were used within one day of preparation [28,52,53]. Glipizide
required additional steps to place this drug into an aqueous solution [30]. To do this, a
stock solution containing 50 µM glipizide in pH 7.4, 0.067 M phosphate buffer was first
made by dissolving this drug through the aid of repeated 4 h periods of sonication over 5
days. This stock solution was then used to prepare diluted working solutions of glipizide
for the chromatographic experiments. All of the glipizide solutions were used within 2
weeks of preparation. Although sulfonylurea drugs are weak acids (e.g., the pKa of
glipizide is 5.9), the drug concentrations that were used in these experiments had little or
no effect on the final pH of the buffered solutions [33,54].
The mobile phases used for the chromatographic experiments were prepared in or
diluted with pH 7.4, 0.067 M phosphate buffer. The same buffer was used as the
isocratic application/elution buffer during sample injection or application. All of the
mobile phases were passed through a 0.2 µm filter and degassed for 10-15 min prior to
use. The chromatographic experiments were carried out at a typical flow rate of 0.50
mL/min and at a temperature of 37 °C. As has been demonstrated with similar columns
and systems, these experimental conditions have been shown to provide reproducible
results in the measurement of drug-binding parameters such as retention factors, binding
capacities and association equilibrium constants [25-30].
Prior to all chromatographic studies, the columns were first equilibrated with pH
7.4, 0.067 M phosphate buffer. In the frontal analysis experiments, a six-port valve was
used to switch the mobile phase from the pH 7.4 buffer to a solution that contained a
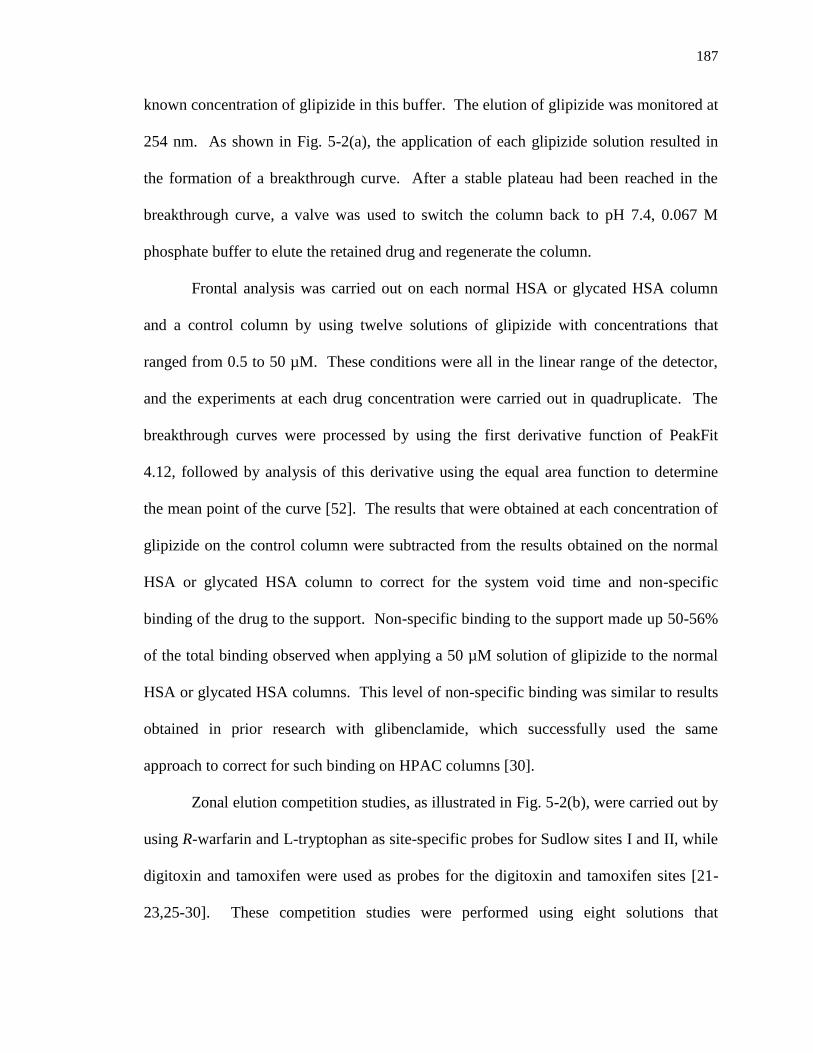
187
known concentration of glipizide in this buffer. The elution of glipizide was monitored at
254 nm. As shown in Fig. 5-2(a), the application of each glipizide solution resulted in
the formation of a breakthrough curve. After a stable plateau had been reached in the
breakthrough curve, a valve was used to switch the column back to pH 7.4, 0.067 M
phosphate buffer to elute the retained drug and regenerate the column.
Frontal analysis was carried out on each normal HSA or glycated HSA column
and a control column by using twelve solutions of glipizide with concentrations that
ranged from 0.5 to 50 µM. These conditions were all in the linear range of the detector,
and the experiments at each drug concentration were carried out in quadruplicate. The
breakthrough curves were processed by using the first derivative function of PeakFit
4.12, followed by analysis of this derivative using the equal area function to determine
the mean point of the curve [52]. The results that were obtained at each concentration of
glipizide on the control column were subtracted from the results obtained on the normal
HSA or glycated HSA column to correct for the system void time and non-specific
binding of the drug to the support. Non-specific binding to the support made up 50-56%
of the total binding observed when applying a 50 µM solution of glipizide to the normal
HSA or glycated HSA columns. This level of non-specific binding was similar to results
obtained in prior research with glibenclamide, which successfully used the same
approach to correct for such binding on HPAC columns [30].
Zonal elution competition studies, as illustrated in Fig. 5-2(b), were carried out by
using R-warfarin and L-tryptophan as site-specific probes for Sudlow sites I and II, while
digitoxin and tamoxifen were used as probes for the digitoxin and tamoxifen sites [21-
23,25-30]. These competition studies were performed using eight solutions that
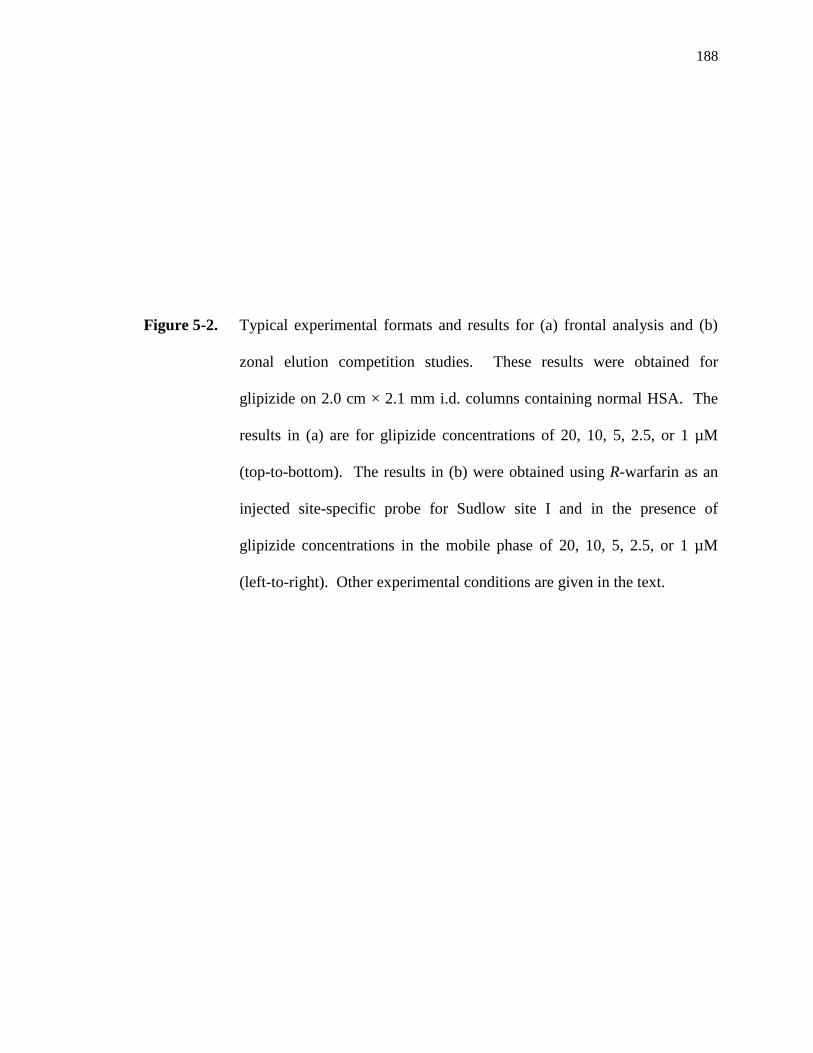
188
Figure 5-2. Typical experimental formats and results for (a) frontal analysis and (b)
zonal elution competition studies. These results were obtained for
glipizide on 2.0 cm × 2.1 mm i.d. columns containing normal HSA. The
results in (a) are for glipizide concentrations of 20, 10, 5, 2.5, or 1 µM
(top-to-bottom). The results in (b) were obtained using R-warfarin as an
injected site-specific probe for Sudlow site I and in the presence of
glipizide concentrations in the mobile phase of 20, 10, 5, 2.5, or 1 µM
(left-to-right). Other experimental conditions are given in the text.
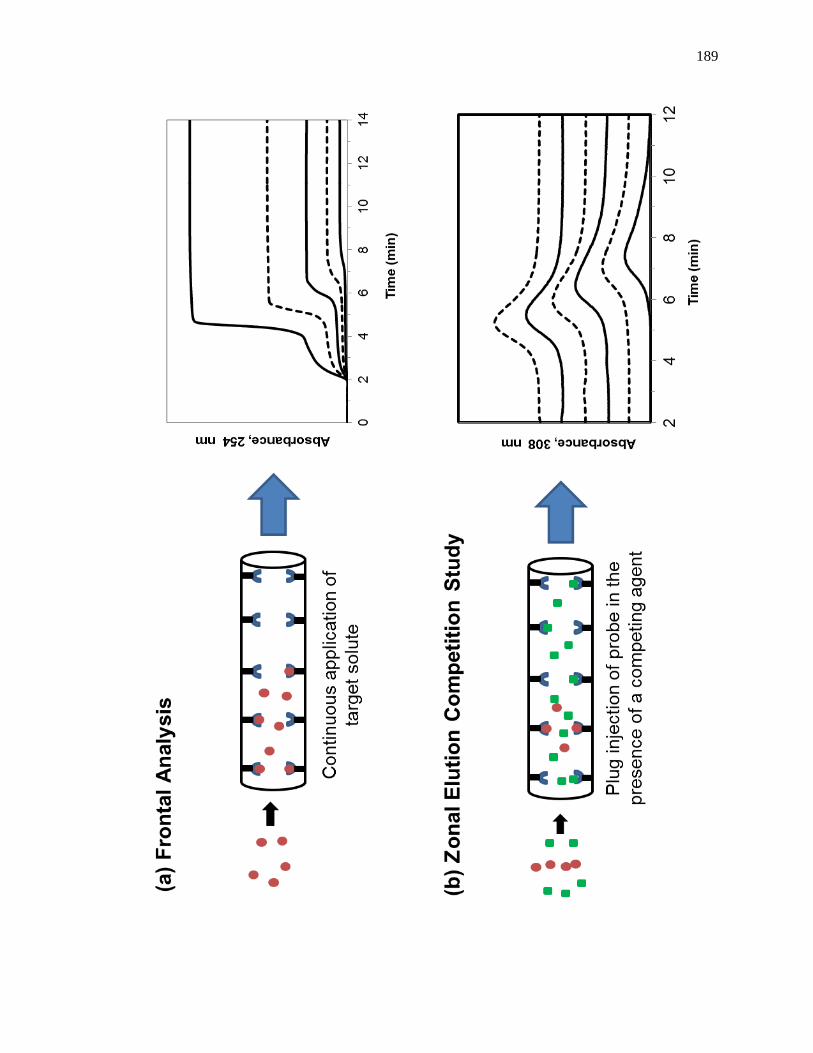
189
190
contained 0.0 to 20.0 µM glipizide in the mobile phase. These solutions were also used
to dilute and prepare 5 µM samples of each probe compound, which were found to
provide linear elution conditions for these compounds. The probe samples were applied
to each column as 20 µL injections and were monitored at 308, 280, 205, or 205 nm for
R-warfarin, L-tryptophan, digitoxin or tamoxifen, respectively. Sodium nitrate was used
as a non-retained solute and was applied at a concentration of 20 µM and using an
injection volume of 20 µL, while being monitored at 205 nm [38-41]. The experiments at
each concentration of glipizide and with each site-specific probe were performed in
quadruplicate for the normal HSA or glycated HSA columns and control column. The
central point of each peak was determined by using the equal area function of PeakFit
4.12 [52].
Similar competition studies were carried out in quadruplicate by using glipizide as
the injected probe and racemic warfarin or tamoxifen as the competing agent. The
mobile phases in these experiments contained one of eight concentrations for racemic
warfarin that ranged from 0.0 to 20.0 µM or one of eight concentrations for tamoxifen
that ranged from 0.0 to 10.0 µM. Samples containing 5 µM glipizide were prepared with
each of these mobile phases and were applied using a 20 µL injection volume, with the
glipizide being monitored at 254 nm. Other conditions and procedures, including the use
of sodium nitrate as a non-retained solute, where the same as described for the other
zonal elution competition studies.
5.3 Theory
5.3.1 Frontal Analysis
The method of frontal analysis was used to provide initial estimates for the
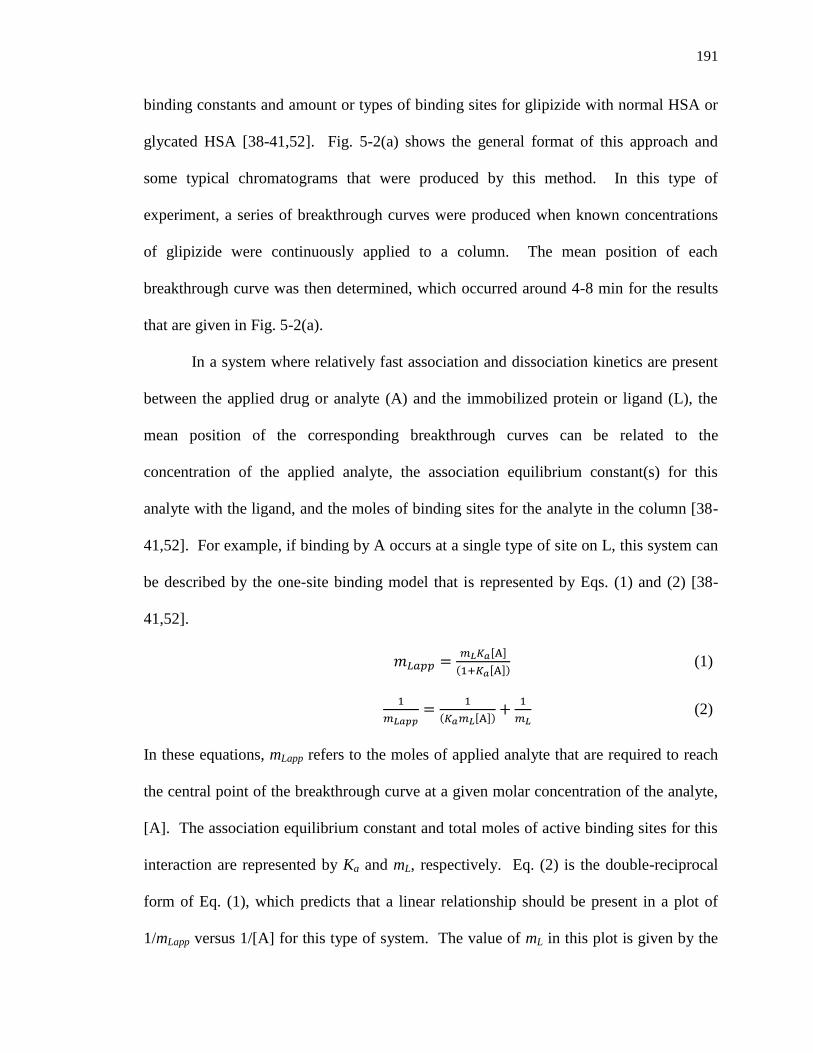
191
binding constants and amount or types of binding sites for glipizide with normal HSA or
glycated HSA [38-41,52]. Fig. 5-2(a) shows the general format of this approach and
some typical chromatograms that were produced by this method. In this type of
experiment, a series of breakthrough curves were produced when known concentrations
of glipizide were continuously applied to a column. The mean position of each
breakthrough curve was then determined, which occurred around 4-8 min for the results
that are given in Fig. 5-2(a).
In a system where relatively fast association and dissociation kinetics are present
between the applied drug or analyte (A) and the immobilized protein or ligand (L), the
mean position of the corresponding breakthrough curves can be related to the
concentration of the applied analyte, the association equilibrium constant(s) for this
analyte with the ligand, and the moles of binding sites for the analyte in the column [38-
41,52]. For example, if binding by A occurs at a single type of site on L, this system can
be described by the one-site binding model that is represented by Eqs. (1) and (2) [38-
41,52].
𝑚𝐿𝑎𝑝𝑝 =𝑚𝐿𝐾𝑎[A]
(1+𝐾𝑎[A]) (1)
1
𝑚𝐿𝑎𝑝𝑝=
1
(𝐾𝑎𝑚𝐿[A])+
1
𝑚𝐿 (2)
In these equations, mLapp refers to the moles of applied analyte that are required to reach
the central point of the breakthrough curve at a given molar concentration of the analyte,
[A]. The association equilibrium constant and total moles of active binding sites for this
interaction are represented by Ka and mL, respectively. Eq. (2) is the double-reciprocal
form of Eq. (1), which predicts that a linear relationship should be present in a plot of
1/mLapp versus 1/[A] for this type of system. The value of mL in this plot is given by the
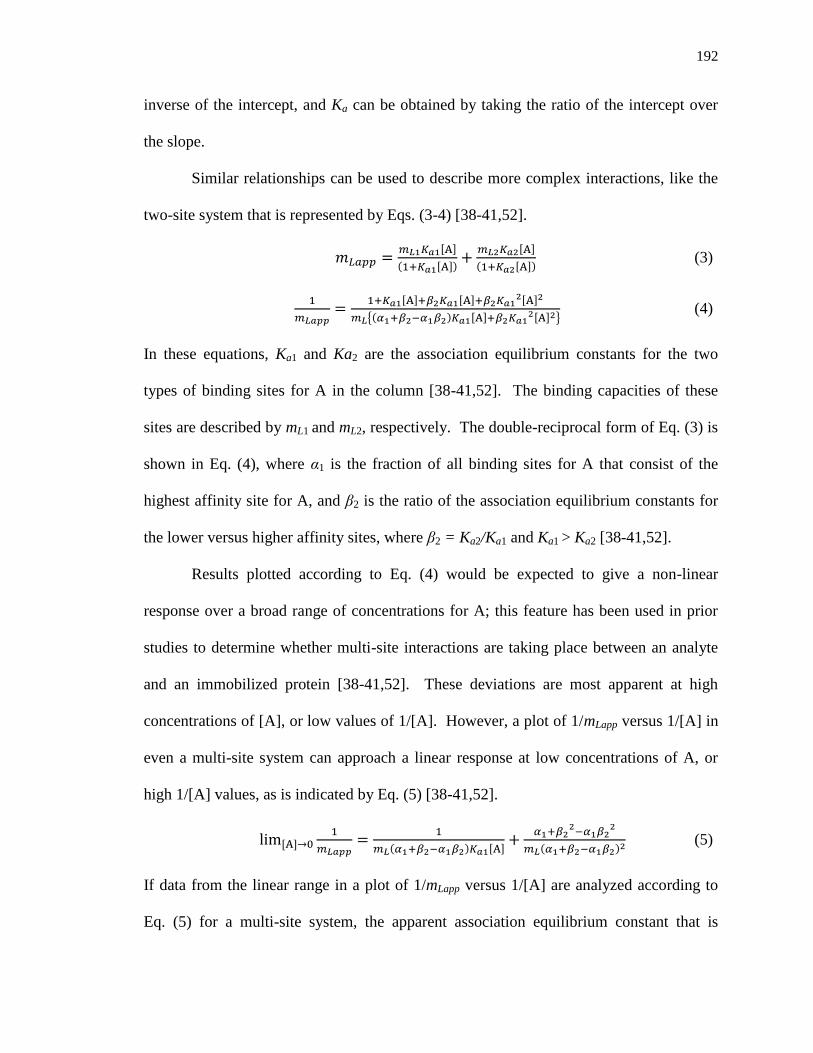
192
inverse of the intercept, and Ka can be obtained by taking the ratio of the intercept over
the slope.
Similar relationships can be used to describe more complex interactions, like the
two-site system that is represented by Eqs. (3-4) [38-41,52].
𝑚𝐿𝑎𝑝𝑝 =𝑚𝐿1𝐾𝑎1[A]
(1+𝐾𝑎1[A])+
𝑚𝐿2𝐾𝑎2[A]
(1+𝐾𝑎2[A]) (3)
1
𝑚𝐿𝑎𝑝𝑝=
1+𝐾𝑎1[A]+𝛽2𝐾𝑎1[A]+𝛽2𝐾𝑎12[A]2
𝑚𝐿{(𝛼1+𝛽2−𝛼1𝛽2)𝐾𝑎1[A]+𝛽2𝐾𝑎12[A]2}
(4)
In these equations, Ka1 and Ka2 are the association equilibrium constants for the two
types of binding sites for A in the column [38-41,52]. The binding capacities of these
sites are described by mL1 and mL2, respectively. The double-reciprocal form of Eq. (3) is
shown in Eq. (4), where α1 is the fraction of all binding sites for A that consist of the
highest affinity site for A, and β2 is the ratio of the association equilibrium constants for
the lower versus higher affinity sites, where β2 = Ka2/Ka1 and Ka1 > Ka2 [38-41,52].
Results plotted according to Eq. (4) would be expected to give a non-linear
response over a broad range of concentrations for A; this feature has been used in prior
studies to determine whether multi-site interactions are taking place between an analyte
and an immobilized protein [38-41,52]. These deviations are most apparent at high
concentrations of [A], or low values of 1/[A]. However, a plot of 1/mLapp versus 1/[A] in
even a multi-site system can approach a linear response at low concentrations of A, or
high 1/[A] values, as is indicated by Eq. (5) [38-41,52].
lim[A]→01
𝑚𝐿𝑎𝑝𝑝=
1
𝑚𝐿(𝛼1+𝛽2−𝛼1𝛽2)𝐾𝑎1[A]+
𝛼1+𝛽22−𝛼1𝛽2
2
𝑚𝐿(𝛼1+𝛽2−𝛼1𝛽2)2 (5)
If data from the linear range in a plot of 1/mLapp versus 1/[A] are analyzed according to
Eq. (5) for a multi-site system, the apparent association equilibrium constant that is
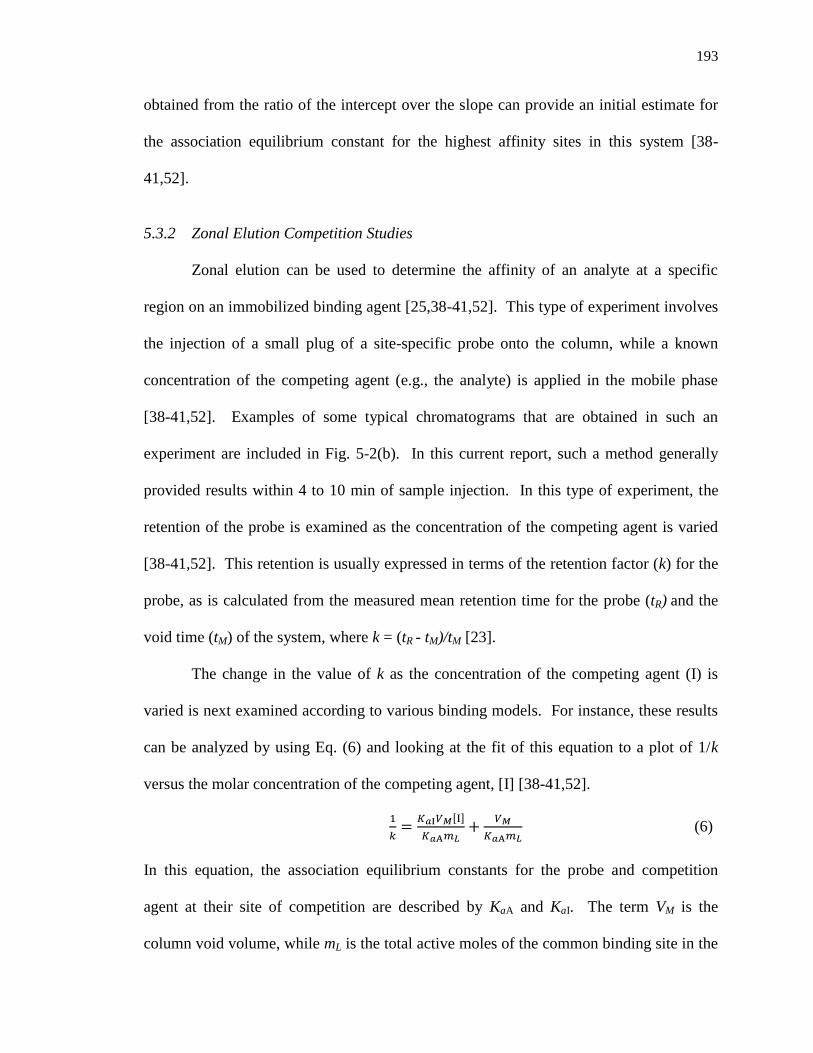
193
obtained from the ratio of the intercept over the slope can provide an initial estimate for
the association equilibrium constant for the highest affinity sites in this system [38-
41,52].
5.3.2 Zonal Elution Competition Studies
Zonal elution can be used to determine the affinity of an analyte at a specific
region on an immobilized binding agent [25,38-41,52]. This type of experiment involves
the injection of a small plug of a site-specific probe onto the column, while a known
concentration of the competing agent (e.g., the analyte) is applied in the mobile phase
[38-41,52]. Examples of some typical chromatograms that are obtained in such an
experiment are included in Fig. 5-2(b). In this current report, such a method generally
provided results within 4 to 10 min of sample injection. In this type of experiment, the
retention of the probe is examined as the concentration of the competing agent is varied
[38-41,52]. This retention is usually expressed in terms of the retention factor (k) for the
probe, as is calculated from the measured mean retention time for the probe (tR) and the
void time (tM) of the system, where k = (tR - tM)/tM [23].
The change in the value of k as the concentration of the competing agent (I) is
varied is next examined according to various binding models. For instance, these results
can be analyzed by using Eq. (6) and looking at the fit of this equation to a plot of 1/k
versus the molar concentration of the competing agent, [I] [38-41,52].
1
𝑘=
𝐾𝑎I𝑉𝑀[I]
𝐾𝑎A𝑚𝐿+
𝑉𝑀
𝐾𝑎A𝑚𝐿 (6)
In this equation, the association equilibrium constants for the probe and competition
agent at their site of competition are described by KaA and KaI. The term VM is the
column void volume, while mL is the total active moles of the common binding site in the
194
column. If a linear response with a positive slope is obtained for a plot that is made
according to Eq. (6), the results can be said to follow a model in which the probe and
competing agent are interacting directly at a single type of site on the immobilized
binding agent. In addition, the ratio of the slope versus the intercept from this plot can be
used to determine the association equilibrium constant for the competing agent at its site
of direct competition with the probe [38-41,52].
Deviations from the linear response that is predicted by Eq. (6) can occur if
binding is occurring at multiple sites or if allosteric effects are present during the binding
of the probe and competing agent [25,38-41,55]. Eq. (7) provides an alternative
relationship that can be used to describe such data when the probe and competing agent
are binding to two separate but allosterically-linked sites [23,25].
𝑘0
𝑘−𝑘0=
1
𝛽I→A−1• (
1
𝐾𝑎IL[I]+ 1) (7)
In this equation, the association equilibrium constant for the competing agent is
represented by KaIL. The term k0 is the retention factor for the probe in the absence of the
competing agent, and k is the retention factor for the probe in the presence of a given
concentration of the competing agent. The term βI
A is the coupling constant for the
allosteric effect of I on the interaction of A to the immobilized binding agent [23]. A plot
of k0/(k - k0) vs. 1/[I] according to Eq. (7) should result in a linear relationship for a
simple allosteric interaction, where the slope and intercept can be used to determine the
coupling constant (βI
A) for this interaction and the association equilibrium constant for
the competing agent at its binding site [23,25]. A value of βI
A that is greater than 1
indicates that a positive allosteric effect is occurring, while 0 < βI
A < 1 indicates that a
negative allosteric effect is present. A value of βI
A that is equal to zero is obtained when
195
direct competition is taking place between A and I, and the presence of no competition is
represented by a value of βI
A that is equal to 1 [23].
Competition studies can also be conducted by injecting a small plug of the analyte
onto the column in the presence of known concentrations of a site-specific probe in the
mobile phase [39]. The retention factor for an analyte that interacts with n independent
sites can be represented by the sum of the retention factors for these individual sites (k1
through kn), as is shown in Eq. (8). This equation can further be expanded into Eq. (9) if
an agent is also present in the mobile phase that can compete at one or more of these sites
[39].
𝑘A = 𝑘1 + … 𝑘𝑛 (8)
𝑘A =𝐾𝑎A1𝑚𝐿1
𝑉𝑀(1+𝐾𝑎I1[I]). . . +
𝐾𝑎A𝑛𝑚𝐿1
𝑉𝑀(1+𝐾𝑎I𝑛[I]) (9)
In Eq. (9), KaA1 through KaAn are the association equilibrium constants for the analyte at
site 1 through n, and KaI1 through KaIn are the association equilibrium constants for the
competing agent at the same sites [39].
5.4 Results and Discussion
5.4.1 Frontal Analysis using Normal HSA
Frontal analysis was first used to examine the overall binding of glipizide to
columns containing either normal HSA or in vitro glycated HSA. Examples of such
experiments are shown in Fig. 5-2(a). Previous studies have found that other
sulfonylurea drugs tend to interact with both normal HSA and glycated HSA at two
general classes of sites: a set of moderate-to-high affinity sites and a larger group of weak
affinity regions [25-27,29,30].
In this report, the results from frontal analysis experiments with glipizide were fit
196
to various binding models. Fig. 5-3(a) shows the best-fit line that was obtained for
glipizide and normal HSA when using a one-site model, as described by Eq. (1). This fit
resulted in a correlation coefficient of 0.9979 (n = 12). The same data were also fit to a
two-site model, as described by Eq. (3) and shown in Fig. 5-3(b). This model gave a
slightly higher correlation coefficient of 0.9998 (n = 12). Residual plots, as provided by
the insets of Fig. 5-3, indicated that the data had a more random distribution about the
best-fit line for the two-site model than for the one-site model. In addition, the sum of
the squares of the residuals was lower for the two-site model vs. the one-site model (i.e.,
3.6 × 10⁻¹⁹
vs. 5.3 × 10⁻¹⁸
). The presence of multi-site binding was confirmed by plotting
the data according to Eq. (2) or Eq. (4), which resulted in deviations from a linear
response at high glipizide concentrations (see Appendix 5.7). All of these results
indicated that the two-site model was a better description than the one-site model for the
binding of glipizide with normal HSA. The use of higher order models (e.g., a three-site
model) did not result in any improved fit to this data.
The two-site model was next used to estimate the average association equilibrium
constants and moles of sites that were involved in the interactions of glipizide with
normal HSA. The results of this fit gave a value for Ka1 of 2.4 (± 0.8) × 105 M
-1 for the
group of relatively high affinity sites and a value for Ka2 of 1.7 (± 0.4) × 104 M
-1 for the
lower affinity sites. A comparable estimate of 1.1 (± 0.1) × 105 M
-1was obtained for Ka1
from the linear region of a plot that was made according to Eq. (5) (see Appendix 5.7).
In addition, these Ka1 values were in the same general range as an overall association
equilibrium constant of 3.7 × 10⁵ M
-1 that has been reported for glipizide with normal
HSA in solution, as determined by fluorescence spectroscopy at 37 °C and in pH 7.4,
197
Figure 5-3. Analysis of frontal analysis data for the binding of glipizide with normal
HSA by using (a) a one-site model or (b) a two-site model. These results
are for twelve solutions of glipizide with concentrations ranging from 0.5
to 50 µM that were applied to a 2.0 cm × 2.1 mm i.d. normal HSA
column. Other experimental conditions are given in the text. The insets in
(a) and (b) show the residual plots for the fits of the data to the given
binding models. Each data point is the average of four values, with
relative standard deviations ranging from ± 0.3-4.6%.
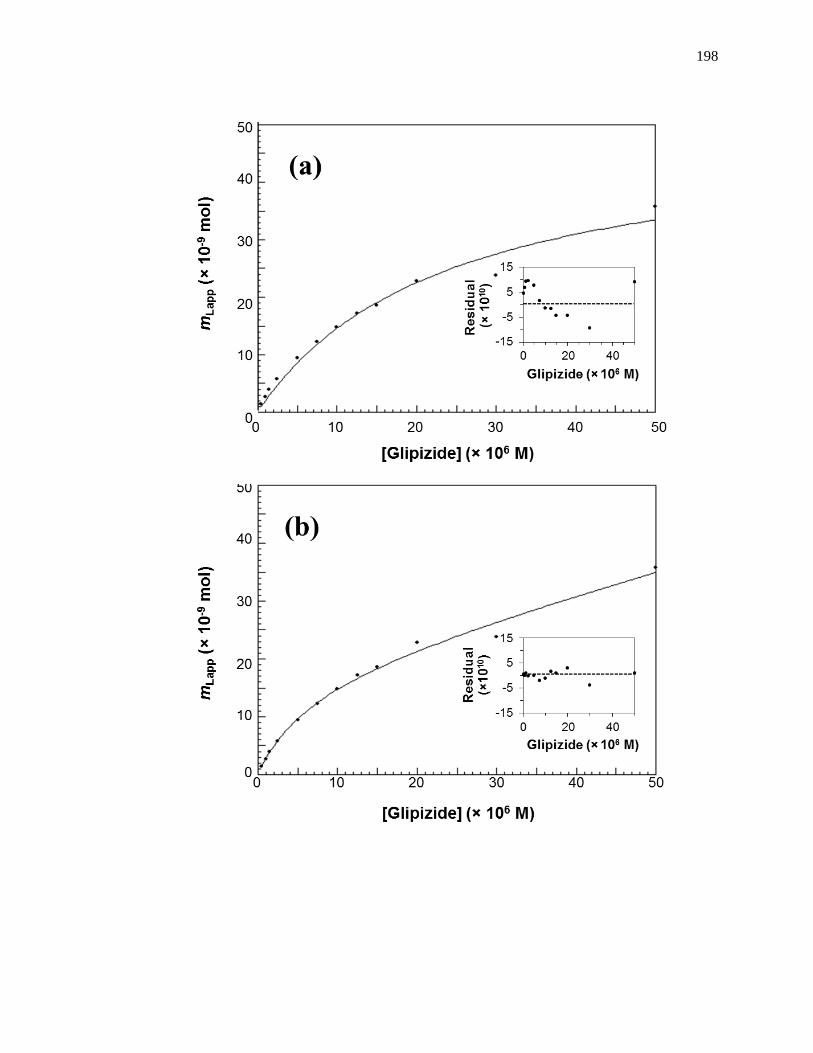
198
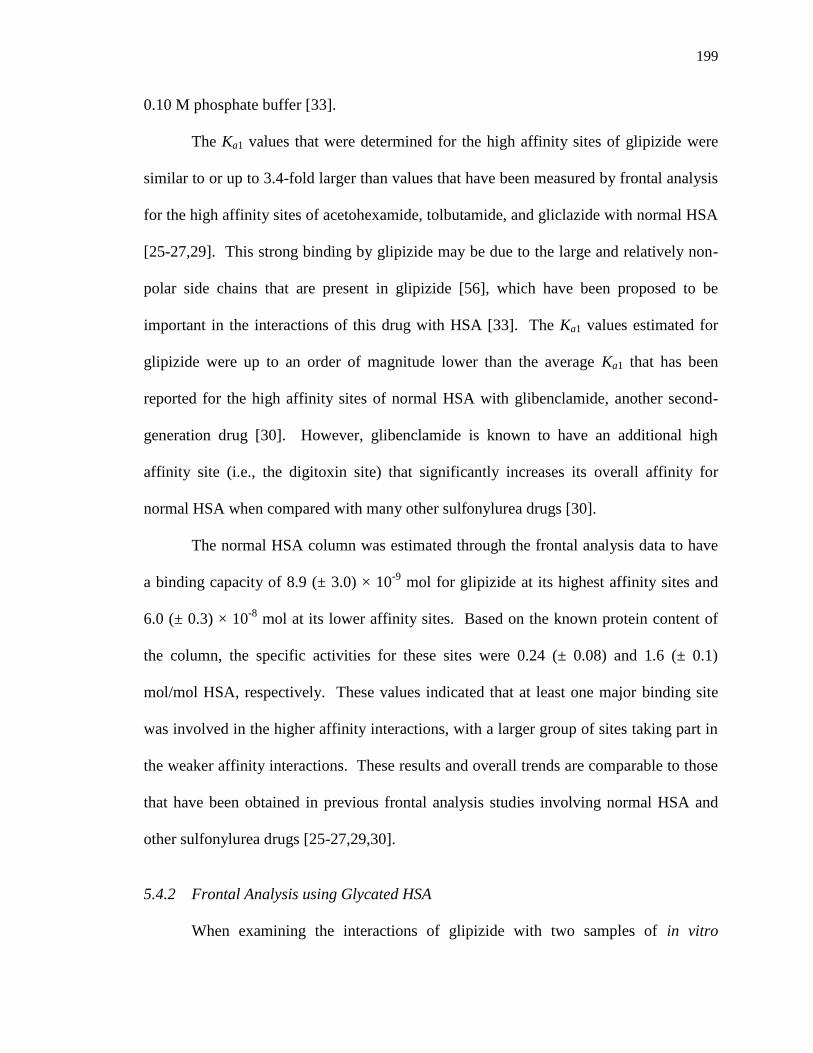
199
0.10 M phosphate buffer [33].
The Ka1 values that were determined for the high affinity sites of glipizide were
similar to or up to 3.4-fold larger than values that have been measured by frontal analysis
for the high affinity sites of acetohexamide, tolbutamide, and gliclazide with normal HSA
[25-27,29]. This strong binding by glipizide may be due to the large and relatively non-
polar side chains that are present in glipizide [56], which have been proposed to be
important in the interactions of this drug with HSA [33]. The Ka1 values estimated for
glipizide were up to an order of magnitude lower than the average Ka1 that has been
reported for the high affinity sites of normal HSA with glibenclamide, another second-
generation drug [30]. However, glibenclamide is known to have an additional high
affinity site (i.e., the digitoxin site) that significantly increases its overall affinity for
normal HSA when compared with many other sulfonylurea drugs [30].
The normal HSA column was estimated through the frontal analysis data to have
a binding capacity of 8.9 (± 3.0) × 10-9
mol for glipizide at its highest affinity sites and
6.0 (± 0.3) × 10-8
mol at its lower affinity sites. Based on the known protein content of
the column, the specific activities for these sites were 0.24 (± 0.08) and 1.6 (± 0.1)
mol/mol HSA, respectively. These values indicated that at least one major binding site
was involved in the higher affinity interactions, with a larger group of sites taking part in
the weaker affinity interactions. These results and overall trends are comparable to those
that have been obtained in previous frontal analysis studies involving normal HSA and
other sulfonylurea drugs [25-27,29,30].
5.4.2 Frontal Analysis using Glycated HSA
When examining the interactions of glipizide with two samples of in vitro
200
glycated HSA (i.e., gHSA1 and gHSA2), the two-site model again gave a better fit for the
frontal analysis data than a one-site model. The correlation coefficients obtained for the
frontal analysis data with glipizide and gHSA1 were 0.9964 (n = 12) for the one-site
model and 0.9997 (n = 12) for the two-site model. Similar results were obtained for
gHSA2, with correlation coefficients of 0.9978 (n = 12) for the one-site model and
0.9999 (n = 12) for the two-site model. The residual plots for both types of glycated
HSA gave a more random distribution of the data about the best-fit line for the two-site
model than for the one-site model. The data for gHSA1 and gHSA2 also had a lower
sum of the squares of the residuals for the two-site model than the one-site model (i.e.,
5.6 × 10⁻¹⁹
vs. 6.9 × 10⁻¹⁸
for gHSA1 and 4.1 × 10⁻¹⁹
vs. 1.9 × 10⁻¹⁸
for gHSA2. These
results confirmed that glipizide also interacted with the glycated HSA samples according
to a two-site model.
Table 5-1 includes the binding parameters that were obtained for glipizide with
the glycated HSA samples when using the two-site model. The average association
equilibrium constants that were measured for glipizide at its higher and lower affinity
sites on gHSA1 were 2.8 (± 1.1) × 105 M
-1 and 2.5 (± 0.5) × 10
4 M
-1, respectively. The
corresponding values for gHSA2 were 6.0 (± 2.2) × 105 M
-1 and 3.7 (± 0.2) × 10
4 M
-1.
The average association equilibrium constants that are shown in Table 5-1 for the highest
affinity sites were 1.2-fold higher for gHSA1 and 2.5-fold higher for gHSA2 than the
value that was measured for normal HSA. The apparent increase in affinity for gHSA1
was not statistically significant at the 95% confidence level; however, the increase seen
for gHSA2 was significant. Previous studies involving other sulfonylurea drugs have
noted an increase in the average Ka at the highest affinity sites for these drugs on glycated
201
Table 5-1. Association equilibrium constants (Ka) and binding capacities (mL)
determined for glipizide with normal HSA or glycated HSA when using a
two-site binding modela
Type of HSA Ka1
(M-1
× 105)
mL1
(mol × 10-9
)
Ka2
(M-1
× 104)
mL2
(mol × 10-8
)
Normal HSA 2.4 (± 0.8) 8.9 (± 3.0) 1.7 (± 0.4) 6.0 (± 0.3)
gHSA1 2.8 (± 1.1) 9.7 (± 3.8) 2.5 (± 0.5) 6.3 (± 0.2)
gHSA2 6.0 (± 2.2) 4.2 (± 1.2) 3.7 (± 0.2) 5.9 (± 0.1)
aThese results were measured at 37 C in the presence of pH 7.4, 0.067 M potassium phosphate buffer. The
values in parentheses represent a range of ±1 S.D., as based on error propagation and the precisions of the
best-fit slopes and intercepts when using Eq. (3) (n = 12). The glycation levels for gHSA1 and gHSA2
were 1.39 (± 0.28) and 3.20 (± 0.13) mol hexose/mol HSA, respectively.
202
HSA versus normal HSA [26,27,29,30]. It has been suggested that such changes in
affinity, if present, may be a result of alterations in the amount or types of glycation
products that are present at or near these binding regions as the level of HSA glycation is
varied [57,58].
The specific activities for the columns containing glycated HSA were determined
from the measured binding capacities and protein contents for these columns. The higher
and lower affinity sites in the gHSA1 column had binding capacities of 9.7 (± 3.8) × 10-9
and 6.3 (± 0.2) × 10-8
mol, respectively, with specific activities of 0.30 (± 0.11) and 2.0
(± 0.1) mol/mol gHSA1. The gHSA2 column had binding capacities for the same sites of
4.2 (± 1.2) × 10-9
and 5.9 (± 0.1) × 10-8
mol, with specific activities of 0.12 (± 0.03) and
1.7 (± 0.1) mol/mol gHSA2. These results were similar to those obtained for the normal
HSA column and in prior work with other sulfonylurea drugs [25-27,29,30]. These
results again indicated that at least one type of site was involved in the higher affinity
interactions and that more sites were involved in the weaker affinity interactions.
5.4.3 Competition Studies at Sudlow Site II
Zonal elution competition studies were used to help identify the binding sites for
glipizide on HSA and to measure the affinity of glipizide at these sites. Sudlow site II
has been found in previous work to be one of the regions that often takes part in the
moderate-to-high affinity interactions of other sulfonylurea drugs with normal HSA and
glycated HSA [25-27,29,30]. It has recently been determined in solution-phase
displacement experiments that glipizide also binds to Sudlow site II on normal HSA [33].
In this current report, interactions at Sudlow site II were examined by using L-tryptophan
as a probe for this site [25-30].
203
Competition studies between L-tryptophan with glipizide were carried out on
columns that contained either normal HSA or glycated HSA. The data were then
analyzed according to Eq. (6), as illustrated in Fig. 5-4(a). A linear response was
observed for glipizide on all of the normal HSA or glycated HSA columns, with
correlation coefficients that ranged from 0.9137 to 0.9643 (n = 8). It was concluded from
these results that L-tryptophan and glipizide had direct competition at Sudlow site II on
both normal HSA and glycated HSA.
Table 5-2 shows the association equilibrium constants for glipizide that were
measured at Sudlow site II on these various columns. The values that were obtained were
1.1 (± 0.1) × 104 M
-1 for normal HSA, 1.2 (± 0.1) × 10
4 M
-1 for gHSA1, and 1.4 (± 0.2) ×
104 M
-1 gHSA2. The change in affinity between normal HSA and gHSA1 (9%) was not
statistically different at either the 95% or 90% confidence level. However, a significant
increase (at both confidence levels) of 27% or 17% was observed in this affinity at
Sudlow site II when going from normal HSA or gHSA1 to gHSA2. In addition, these
affinity values were approximately 3.5- to 12-fold lower than association equilibrium
constants that have been measured for other first- or second-generation sulfonylurea
drugs at Sudlow site II of normal HSA [26,27,29,30].
It has been suggested based on solution-phase displacement studies that Sudlow
site II is the major binding site for glipizide on normal HSA [33]. However, the
association equilibrium constants measured here for glipizide at Sudlow site II of normal
HSA and glycated HSA were an order of magnitude lower than the binding constants that
were estimated for the highest affinity sites, as determined by frontal analysis (see Table
5-1 and Appendix 5.7). This comparison indicated that although Sudlow site II was
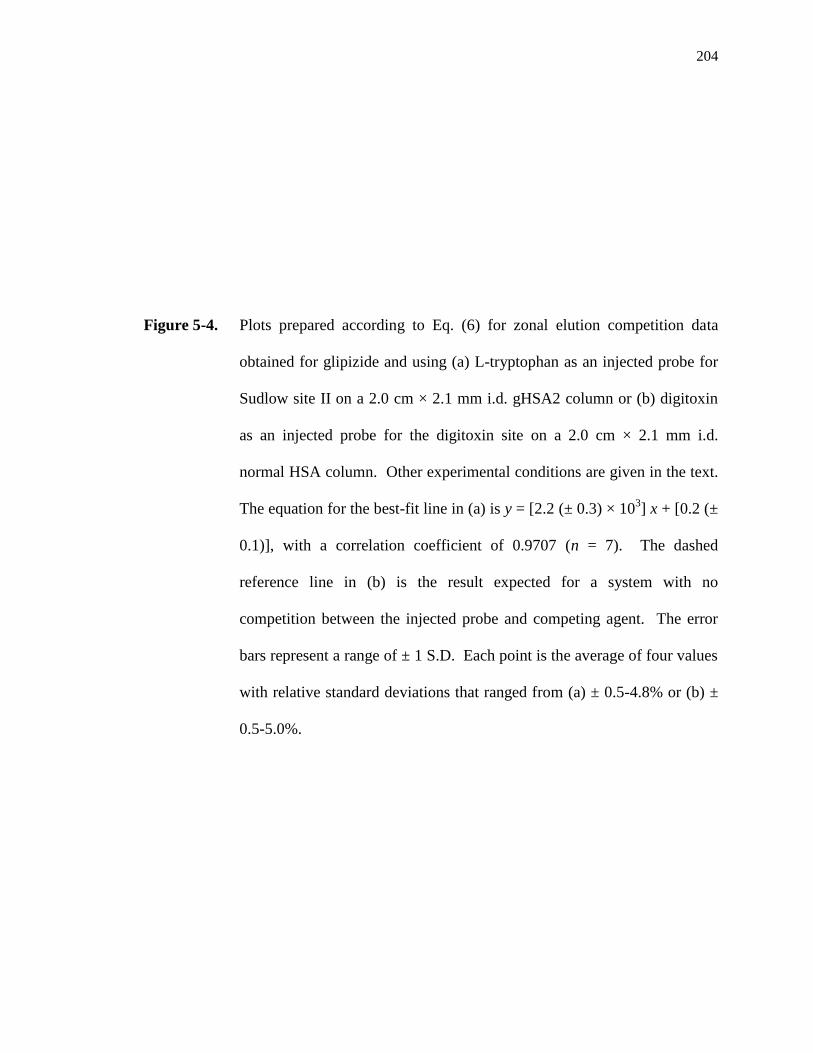
204
Figure 5-4. Plots prepared according to Eq. (6) for zonal elution competition data
obtained for glipizide and using (a) L-tryptophan as an injected probe for
Sudlow site II on a 2.0 cm × 2.1 mm i.d. gHSA2 column or (b) digitoxin
as an injected probe for the digitoxin site on a 2.0 cm × 2.1 mm i.d.
normal HSA column. Other experimental conditions are given in the text.
The equation for the best-fit line in (a) is y = [2.2 (± 0.3) × 103] x + [0.2 (±
0.1)], with a correlation coefficient of 0.9707 (n = 7). The dashed
reference line in (b) is the result expected for a system with no
competition between the injected probe and competing agent. The error
bars represent a range of ± 1 S.D. Each point is the average of four values
with relative standard deviations that ranged from (a) ± 0.5-4.8% or (b) ±
0.5-5.0%.
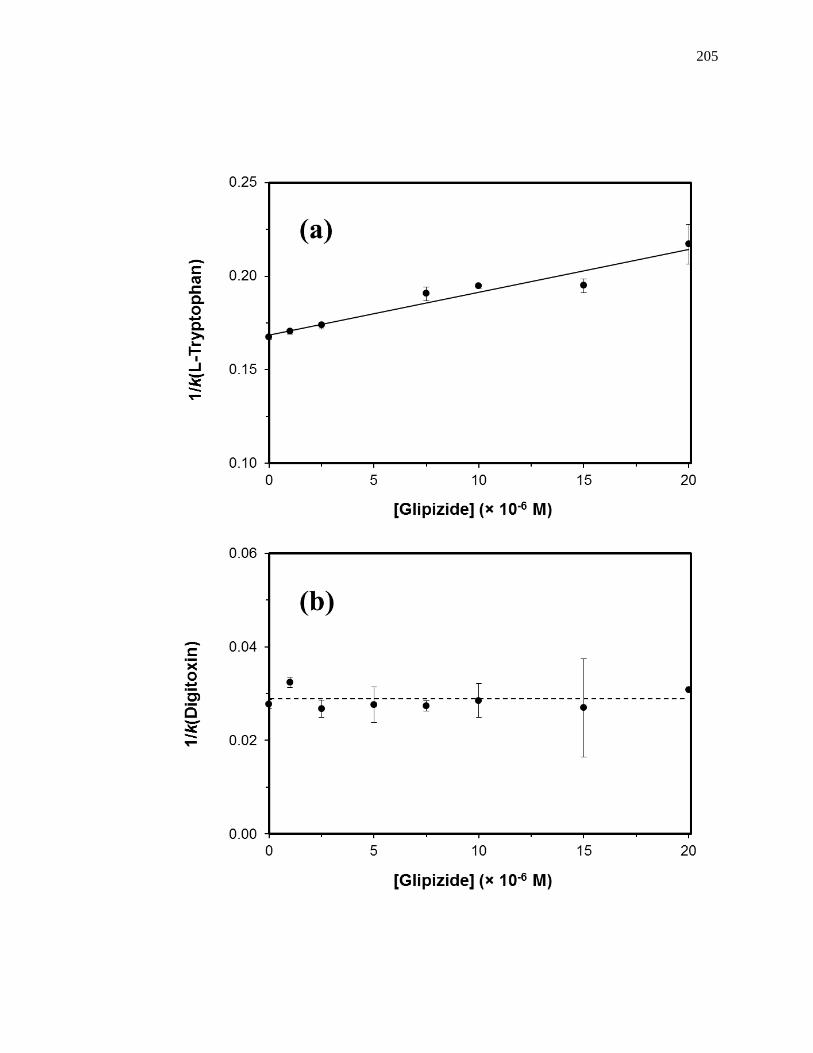
205
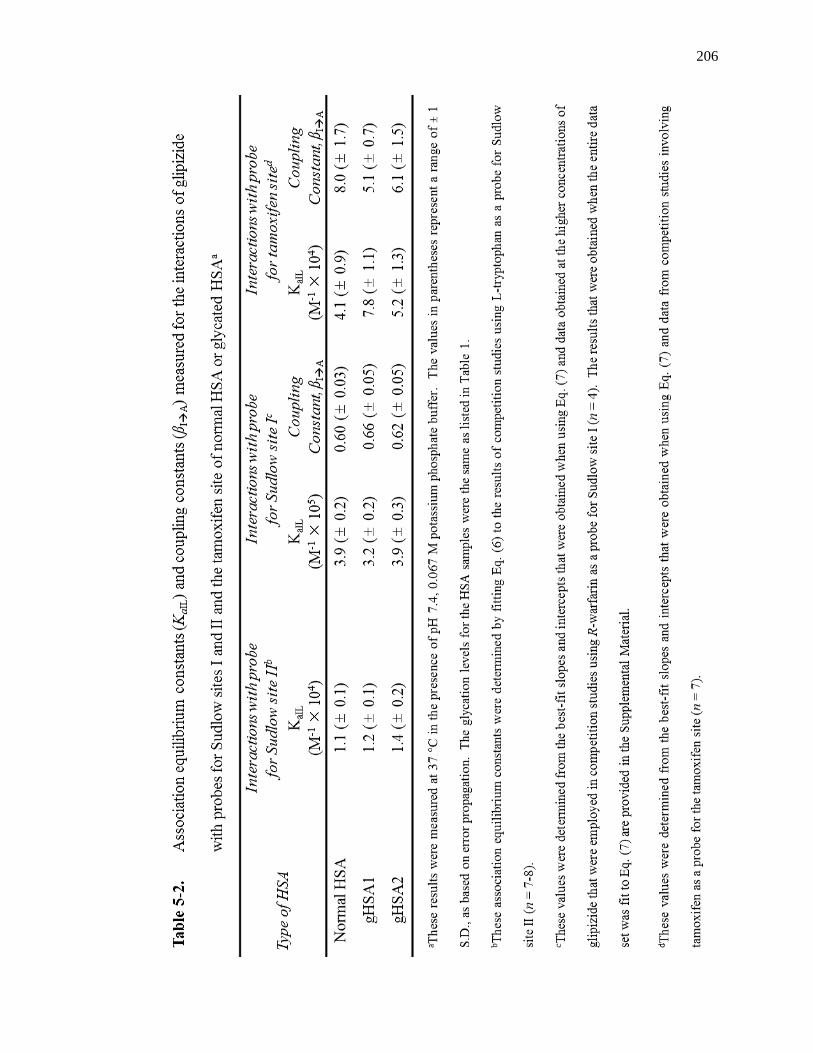
206
207
binding to glipizide, some other region was also present that had an even higher affinity
for this drug. The location of this additional site was explored in the following sections
by using probes for other regions of HSA.
5.4.4 Competition Studies at the Digitoxin Site
The digitoxin site of HSA has been observed in prior work to have strong binding
to the sulfonylurea drug glibenclamide [30]. As a result, competition studies were also
conducted to examine the binding of glipizide at this site and by using digitoxin as a site-
specific probe [21]. Injections of digitoxin onto the normal HSA column and in the
presence of various concentrations of glipizide gave only a random variation in retention
of ± 6.3%, as demonstrated by a plot that was made according to Eq. (6) in Fig. 5-4(b).
Similar results were obtained for the columns containing gHSA1 or gHSA2, which gave
random variations in the retention for digitoxin of ± 4.6% and ± 9.5%, respectively.
These results indicated that glipizide was not interacting with the digitoxin site of either
normal HSA or glycated HSA.
5.4.5 Competition Studies at Sudlow Site I
Competition studies were next carried out at Sudlow site I by using R-warfarin as
a site-specific probe for this binding region [19,23,28]. Previous work involving other
sulfonylurea drugs have consistently noted that these drugs have direct competition for
warfarin at this site and that this region has moderate-to-high affinity interactions for this
class of drugs [25-27,29,30]. This site has further been identified, through solution-phase
displacement studies, as a binding region for glipizide on normal HSA [33].
Data from competition studies using glipizide as a mobile phase additive and R-
208
Figure 5-5. Plots prepared according to (a) Eq. (6) and (b) Eq. (7) for zonal elution
competition studies using glipizide as a competing agent and R-warfarin as
an injected probe for Sudlow site I. These results were obtained on a 2.0
cm × 2.1 mm i.d. column containing normal HSA. Other experimental
conditions are given in the text. The error bars represent a range of ±1
S.D. Each point is the average of four values with relative standard
deviations that ranged from (a) ± 0.3-3.4% or (b) ± 1.7-2.0%. The
equation for the best-fit dashed line in (a) is y = [8.0 (± 0.1) × 102] x + [1.3
(± 0.1) × 10-2
], with a correlation coefficient of 0.9999 (over the four
points on the left side of this plot). The equation for the best-fit dashed
line in (b) is y = [-6.5 (± 0.3) × 10-6
] x + [-2.5 (± 0.1)], with a correlation
coefficient of 0.9978 (over the four points on the left side of this plot).
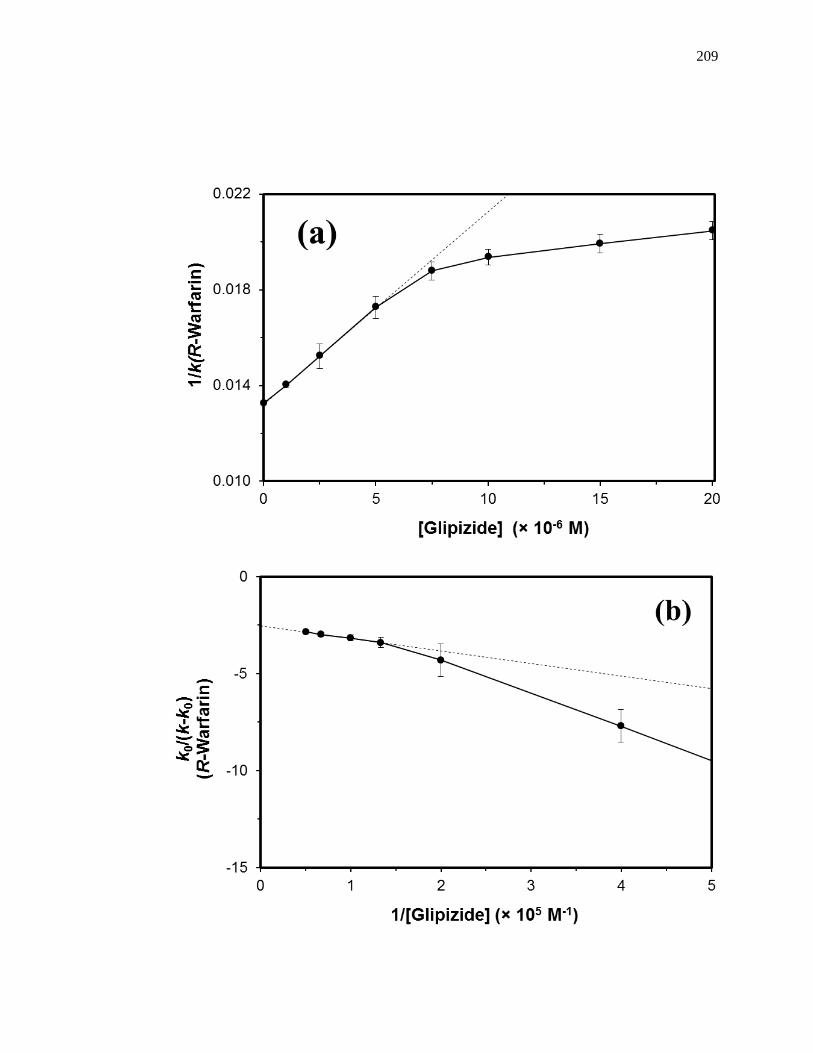
209
210
warfarin as an injected probe compound were plotted according to Eq. (6). An example
of such a plot is shown in Fig. 5-5(a), as generated using the normal HSA column. In
previous studies with other sulfonylurea drugs, linear behavior and a positive slope has
been seen for such plots, indicating that R-warfarin was competing directly with these
drugs [25-27,29,30]. The corresponding plot for glipizide was also linear with a positive
slope at gliclazide concentrations up to about 5 µM, with deviations from linearity
occurring at higher glipizide concentrations. Similar results were obtained for the
glycated HSA columns. These results suggested that glipizide was in direct competition
with R-warfarin at Sudlow site I at low glipizide concentrations. Such behavior agreed
with the results from prior solution-phase displacement studies [33].
The deviations from linearity that were seen in plots like Fig. 5-5(a) could have
been produced by an allosteric interaction between the injected probe and glipizide as the
concentration of this drug was increased [25,55]. This effect may be related to the ability
of glipizide to induce a conformational change as a result of binding by this drug to HSA,
as has been proposed from solution-phase studies [33]. The presence of an allosteric
interaction was tested by plotting the zonal elution data according to Eq. (7). As is shown
in Fig. 5-5(b), the resulting graph of k0/(k - k0) vs. 1/[Glipizide] for the normal HSA
column gave a linear relationship with a negative slope at low values of 1/[Glipizide].
The two glycated HSA columns gave similar linear relationships. Deviations from
linearity were observed at higher high values of 1/[Glipizide], as demonstrated in Fig. 5-
5(b). These deviations occurred at the same glipizide concentrations that were in the
linear range of plots made according to Eq. (6), as based on a direct competition model.
The linear region in plots made according to Eq. (7) gave correlation coefficients that
211
ranged from –0.7452 to -0.9975 (n = 4) for the normal HSA and glycated HSA columns.
The linear fits obtained with Eq. (7) were used to estimate the association
equilibrium constants for glipizide at the site that was taking part in this allosteric
interaction (see Table 5-2). The same fits were used to find the coupling constants for
the allosteric effect of glipizide on the binding of R-warfarin with normal HSA or
glycated HSA. The association equilibrium constant that was measured for glipizide at
its interaction region on normal HSA was 3.9 (± 0.2) × 105 M
-1. This value was similar
to the overall association equilibrium constant that has been reported for the binding of
glipizide with normal HSA in solution [33] and the value obtained in this current report
for the high affinity regions of glipizide with normal HSA. The coupling constant that
was measured for this site with R-warfarin was 0.60 (± 0.03), with the latter value
representing a negative allosteric effect. The association equilibrium constants for
glipizide at the corresponding interaction sites on gHSA1 and gHSA2 were 3.2 (± 0.2) ×
105 M
-1 and 3.9 (± 0.3) × 10
5 M
-1, with coupling constants of 0.66 (± 0.05) and 0.62 (±
0.05), respectively. There was an 18% decrease in affinity for glipizide and this
interaction in going from normal HSA to gHSA1, and a similar increase between gHSA1
and gHSA2. Both of these changes were significant at the 95% confidence interval. No
changes in affinity were observed between normal HSA and gHSA2. In addition, all of
the coupling constants measured between glipizide and warfarin were statistically
equivalent at the 95% confidence interval.
Binding by glipizide at Sudlow site I was confirmed by carrying out a reverse
competition study. This was done by injecting a small amount of glipizide as the probe
and by using racemic warfarin as the competing agent in the mobile phase. The
212
measured retention factor for glipizide was also corrected for the binding of this drug to
Sudlow site II and to its weak affinity regions; this was accomplished by using Eq. (9)
with the results of the competition studies at Sudlow site II and the binding constants in
Table 5-1 for the weak affinity sites that were measured by frontal analysis. The
resulting corrected retention factors gave linear plots when analyzed according to Eq. (6)
(see Appendix 5.7.3), as would be expected if direct competition were occurring between
glipizide and warfarin in the region of Sudlow site I. Furthermore, the association
equilibrium constants that were estimated for glipizide at Sudlow site I from these results
were consistent with the range of values that were obtained when using R-warfarin as the
injected probe and glipizide as the competing agent.
5.4.6 Competition Studies at the Tamoxifen Site
Because some allosteric effects were observed for glipizide at Sudlow site I,
additional experiments were used to explore whether glipizide had similar effects at other
sites on HSA. The tamoxifen site of HSA was of particular interest since previous
studies have shown that Sudlow site I and this site are allosterically-linked [23,59,60].
These studies were originally carried out by using tamoxifen as a site-specific probe [23]
and glipizide as a competing agent. When the results were analyzed according to Eq. (6)
and a direct-competition model, the plot that was obtained for normal HSA gave a non-
linear response with a negative slope, as shown in Fig. 5-6(a). This plot indicated that a
positive allosteric interaction was present between glipizide and tamoxifen [23]. Similar
trends were seen for the glycated HSA columns.
The same competition data were analyzed by using Eq. (7). As shown by the
example in Fig. 5-6(b), a linear fit was noted for a plot of k0/(k-k0) vs. 1/[Glipizide] for
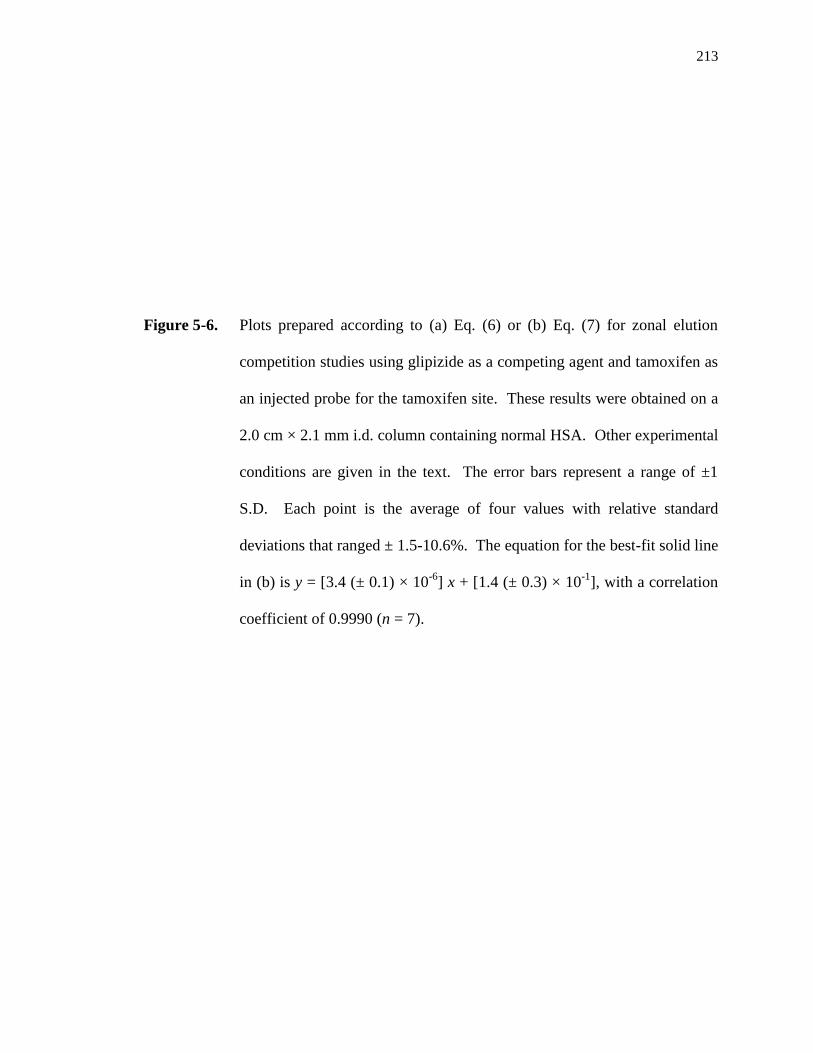
213
Figure 5-6. Plots prepared according to (a) Eq. (6) or (b) Eq. (7) for zonal elution
competition studies using glipizide as a competing agent and tamoxifen as
an injected probe for the tamoxifen site. These results were obtained on a
2.0 cm × 2.1 mm i.d. column containing normal HSA. Other experimental
conditions are given in the text. The error bars represent a range of ±1
S.D. Each point is the average of four values with relative standard
deviations that ranged ± 1.5-10.6%. The equation for the best-fit solid line
in (b) is y = [3.4 (± 0.1) × 10-6
] x + [1.4 (± 0.3) × 10-1
], with a correlation
coefficient of 0.9990 (n = 7).
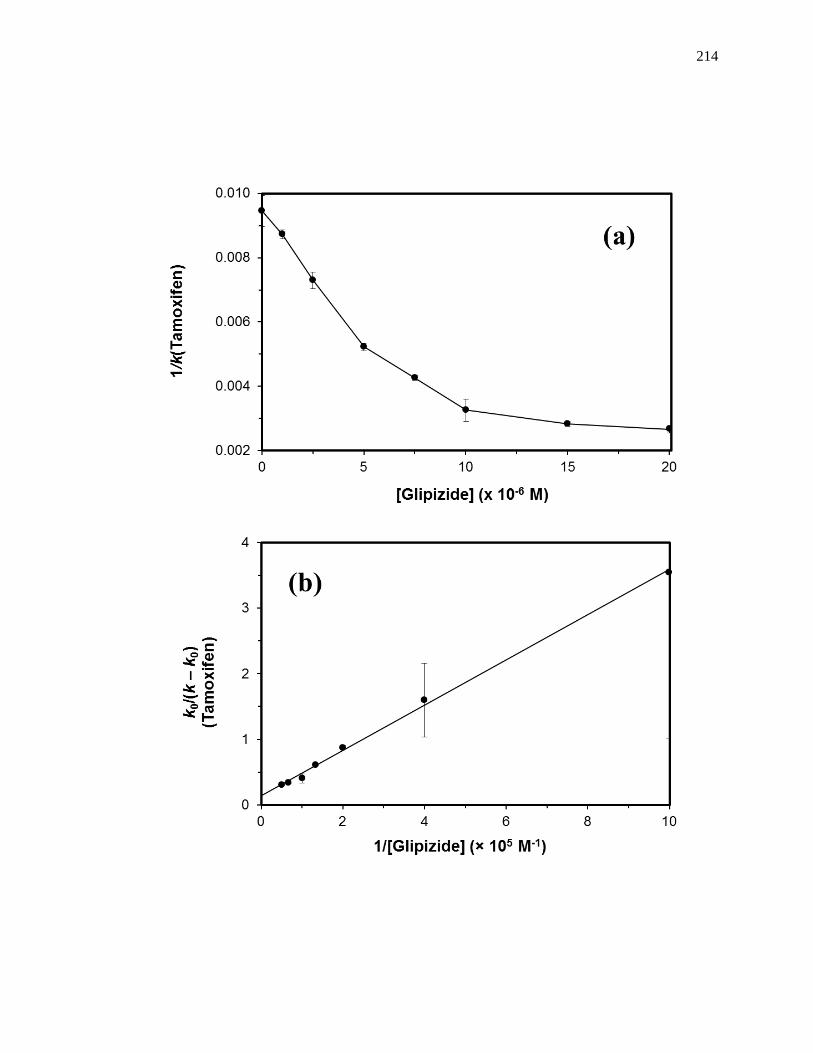
214
215
the normal HSA column, with the same behavior being seen on the glycated HSA
columns. These plots had correlation coefficients ranging from 0.9976 to 0.9988 (n = 7).
These fits were used to find the association equilibrium constant for glipizide at the site
that had an allosteric effect on the tamoxifen site. The results are included in Table 5-2.
The corresponding association equilibrium constant that was measured for glipizide when
using normal HSA was 4.1 (± 0.9) × 104 M
-1. The coupling constant of this region with
the tamoxifen site was 8.0 (± 1.7). gHSA1 and gHSA2 had association equilibrium
constants of 7.8 (± 1.1) × 104 M
-1 and 5.2 (± 1.3) × 10
4 M
-1, respectively, for glipizide
during this allosteric interaction, as well as coupling constants of 5.1 (± 0.7) and 6.1 (±
1.5). The 1.9-fold increase in the affinity between normal HSA and gHSA1 was
significant at the 95% confidence interval. The 1.3-fold increase in affinity between
normal HSA and gHSA2 was not significant at the 95% confidence level but was
significant at the 90% confidence level. Significant differences at the 95% confidence
level were also present in the coupling constants between normal HSA and gHSA1or
gHSA2.
Reverse competition studies were conducted by using glipizide as the injected
probe and tamoxifen as the competing agent. The retention factors for glipizide were
again corrected for the binding of this drug at Sudlow site II and at its weak affinity
regions, as described in the previous section. A plot using these corrected values was
then made according to Eq. (6). This plot resulted in a non-linear relationship (see
Appendix 5.7.4) which further indicated that positive allosteric interactions where
occurring between the binding region for glipizide on HSA and the tamoxifen site.
Similar results were obtained for glycated HSA. The same type of positive allosteric
216
effect on tamoxifen has been noted to occur during the binding of warfarin at Sudlow site
I of HSA [23].
5.5 Conclusion
This report utilized HPAC to examine the binding of glipizide to normal HSA and
HSA with various levels of in vitro glycation. The results of frontal analysis experiments
indicated that glipizide was interacting with both normal HSA and glycated HSA at a
series of relatively high affinity regions that had average association equilibrium
constants in the range of 2.4–6.0 × 10⁵ M
-1 at pH 7.4 and 37 ºC. These values were in
good agreement with a previous estimate that has been made for the overall affinity of
glipizide with normal HSA in solution [33]. This drug was also found to have a large set
of weak affinity regions that had association equilibrium constants in the range of 1.7–3.7
× 104 M
-1.
Zonal elution competition studies were used to provide more detailed information
on the interactions of glipizide with specific sites of normal HSA or glycated HSA. Fig.
7 summarizes the results of these experiments. This drug was found to bind to Sudlow
site II with an affinity of 1.1-1.2 × 10⁴ M
-1 for both normal HSA and glycated HSA. The
same proteins had estimated affinities of 3.2-3.9 × 10⁵ M
-1 for normal HSA and glycated
HSA, which agreed with the values for the high affinity regions that were obtained by
frontal analysis. Up to an 18% decrease in the affinity for glipizide was observed at
Sudlow site I in going from normal HSA to glycated HSA, while up to a 27% increase
was noted at Sudlow site II. Glipizide had no appreciable interactions at the digitoxin site
and was found to have positive allosteric effect for the binding of tamoxifen at its site on
HSA. A negative allosteric effect was also observed between glipizide and the binding of

217
Figure 5-7. Summary of the association equilibrium constants, coupling constants and
binding sites determined in this report for glipizide in its interactions with
HSA. The values and results given in bold are for normal HSA. The
values given in parentheses are for glycated HSA.
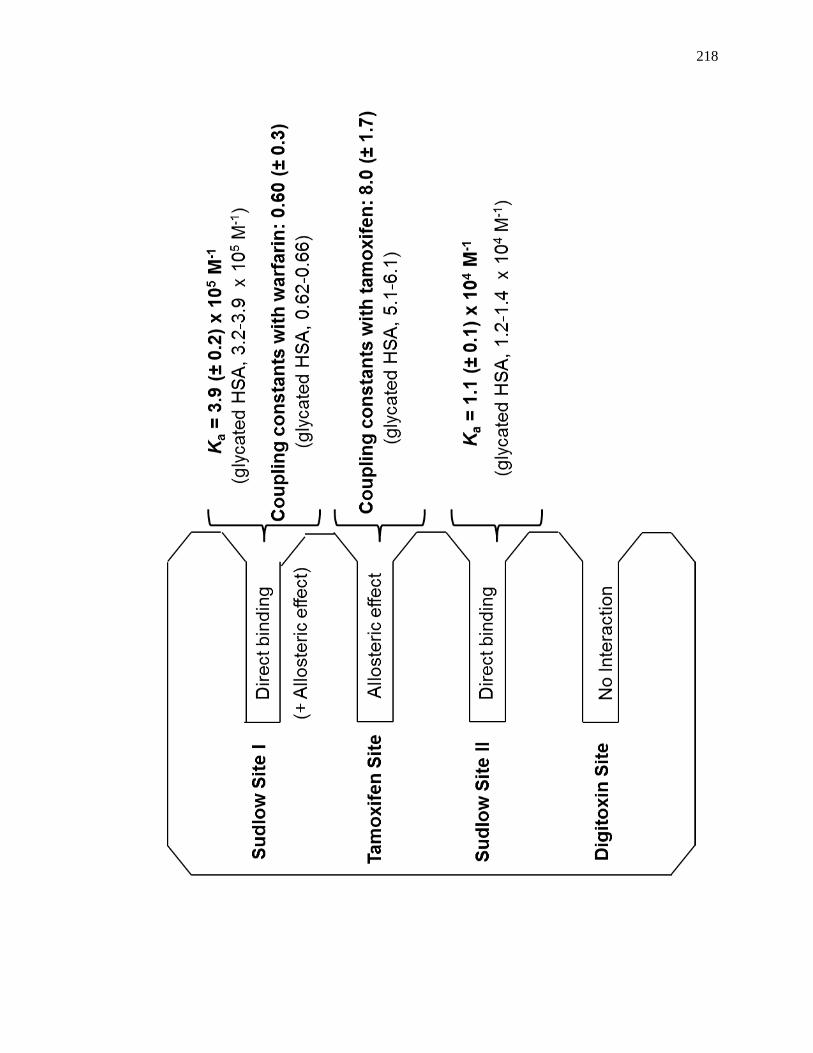
218
219
R-warfarin at Sudlow site I.
The results from this study demonstrate how HPAC can be used to examine the
overall binding affinity and site-specific binding for drugs with relatively complex
interactions with proteins, including modified proteins such as glycated HSA. In
addition, the results from this study show how glycation, at levels comparable to those
present in diabetes, can alter the binding of drugs with HSA. The type of binding data
that was obtained in this report should be useful in future work in determining how the
effective dosage of a drug like glipizide may be affected as the concentration of blood
glucose and levels of protein glycation change in diabetic patients [9,25-31]. In addition,
the methods that were used in this study are not limited to glipizide and normal HSA or
glycated HSA, but could also be applied to other drugs or modified proteins. These
features should make this approach, and the data it can provide, of interest in areas such
as biointeraction studies, the screening of drug candidates, and personalized medicine
[9,31].
5.6 References
1. International Diabetes Federation. IDF Diabetes Atlas, 5th edn. Brussels,
Belgium: International Diabetes Federation, 2011, Chap. 2.
2. National Diabetes Fact Sheet: General Information and National Estimates on
Diabetes in the United States, 2011, US Centers for Disease Control and
Prevention, Atlanta, GA, 2011, 1-12.
3. D.L. Mendez, R.A. Jensen, L.A. McElroy, J.M. Pena, R.M. Esquerra, The effect
of non-enzymatic glycation on the unfolding of human serum albumin, Arch.
Biochem. Biophys. 444 (2005) 92-99.
220
4. G. Colmenarejo, In silico prediction of drug-binding strengths to human serum
albumin, Med. Res. Rev. 23 (2003) 275-301.
5. H. Koyama, N. Sugioka, A. Uno, S. Mori, K. Nakajima, Effects of glycosylation
of hypoglycemic drug binding to serum albumin, Biopharm. Drug Dispos. 18
(1997) 791-801.
6. R.L. Garlick, J.S. Mazer, The principal site of nonenzymatic glycosylation of
human serum albumin in vivo, J. Biol. Chem. 258 (1983) 6142-6146.
7. N. Iberg, R. Fluckiger, Nonenzymatic glycosylation of albumin in vivo, J. Biol.
Chem. 261 (1986) 13542-13545.
8. K. Nakajou, H. Watanabe, U. Kragh-Hansen, T. Maruyama, M. Otagiri, The
effect of glycation on the structure, function and biological fate of human serum
albumin as revealed by recombinant mutants, Biochim. Biophys. Acta 1623
(2003) 88-97.
9. J. Anguizola, R.Matsuda, O.S. Barnaby, K.S. Joseph, C. Wa, E. Debolt, M. Koke,
D.S. Hage, Review: glycation of human serum albumin, Clin. Chim. Acta 425
(2013) 64–76.
10. H.V. Roohk, A.R. Zaidi, A review of glycated albumin as an intermediate
glycation index for controlling diabetes. J. Diabetes Sci. Technol. 2 (2008) 1114-
1121.
11. T. Peters, Jr. All About Albumin: Biochemistry, Genetics, and Medical
Applications. Academic Press, San Diego, 1996.
12. N.W. Tietz (Ed.), Clinical Guide to Laboratory Tests, 2nd ed., Saunders,
Philadelphia, 1990.
221
13. M. Otagiri, A molecular functional study on the interactions of drugs with plasma
proteins, Drug Metab. Pharmacokinet. 20 (2005) 309-323.
14. S. Curry, H. Mandelkow, P. Brick, N. Franks, Crystal structure of human serum
albumin complexed with fatty acid reveals an asymmetric distribution of binding
sites. Nature Struct. Biol. 5(1998) 827-835.
15. G.A. Ascoli, E. Domenici, C. Bertucci, Drug binding to human serum albumin:
abridged review of results obtained with high-performance liquid chromatography
and circular dichroism, Chirality 18 (2006) 667–679.
16. J.R. Simard, P.A. Zunszain, C.E. Ha, J.S. Yang, N.V. Bhagavan, I. Petitpas, S.
Curry, J.A., Locating high-affinity fatty acid-binding sites on albumin by X-ray
crystallography and NMR spectroscopy, Proc. Natl. Acad. Sci. USA 102 (2005)
17958-17963.
17. G. Sudlow, D.J. Birkett, D.N. Wade, Characterization of two specific drug
binding sites on human serum albumin, Mol. Pharmacol. 11(1975) 824–832.
18. G. Sudlow, D.J. Birkett, D.N. Wade, Further characterization of specific drug
binding sites on human serum albumin, Mol. Pharmacol. 12 (1976) 1052–1061.
19. B. Loun, D.S. Hage, Chiral separation mechanisms in protein-based HPLC
columns. I. Thermodynamic studies of (R)- and (S)-warfarin binding to
immobilized human serum albumin, Anal. Chem. 66 (1994) 3814-3822.
20. J. Yang, D.S. Hage, Characterization of the binding and chiral separation of D-
and L-tryptophan on a high-performance immobilized human serum albumin
column, J. Chromatogr. 645 (1993) 241-250.
21. A. Sengupta D.S. Hage, Characterization of the binding of digitoxin and
222
acetyldigitoxin to human serum albumin by high-performance affinity
chromatography, J. Chromatogr. B 725 (1999) 91-100.
22. D.S. Hage, A. Sengupta, Studies of protein binding to non-polar solutes by using
zonal elution and high-performance affinity chromatography: interactions of cis-
and trans-clomiphene with human serum albumin in the presence of β-
cyclodextrin. Anal. Chem. 70 (1998) 4602-4609.
23. J. Chen, D.S. Hage, Quantitiative studies of allosteric effects by biointeraction
chromatography: Analysis of protein binding for low-solubility, Anal. Chem.
2006 78 2672-2683.
24. M.G. Jakoby, D.F. Covey, D.P. Cistola, Localization of tolbutamide binding sites
on human serum albumin using titration calorimetry, Biochemistry 34 (1995)
8780-8787.
25. K.S. Joseph, D.S. Hage, Characterization of the binding of sulfonylurea drugs to
HSA by high-performance affinity chromatography, J. Chromatogr. B 878 (2010)
1590-1598.
26. K.S. Joseph, J. Anguizola, A.J. Jackson, D.S. Hage, Chromatographic analysis of
acetohexamide binding to glycated human serum albumin, J. Chromatogr. B 878
(2010) 2775–2781.
27. K.S. Joseph, J. Anguizola, D.S. Hage, Binding of tolbutamide to glycated human
serum albumin, J. Pharm. Biomed. Anal. 54 (2011) 426–432.
28. K.S. Joseph, D.S. Hage, The effects of glycation on the binding of human serum
albumin to warfarin and L-tryptophan, J. Pharm. Biomed. Anal. 53 (2010) 811-
818.
223
29. R. Matsuda, J. Anguizola, K.S. Joseph, D.S. Hage, High-performance affinity
chromatography and that analysis of drug interactions with modified proteins:
binding of gliclazide with glycated human serum albumin, Anal. Bioanal. Chem.
401 (2011) 2811-2819.
30. R. Matsuda, J. Anguizola, K.S. Joseph, D.S. Hage, Analysis of drug interactions
with modified proteins by high-performance affinity chromatography: binding of
glibenclamide to normal and glycated human serum albumin, J. Chromatogr. A
1265 (2012) 114-122.
31. J. Anguizola, K.S. Joseph, O.S. Barnaby, R. Matsuda, G. Alvarado, W. Clarke,
R.L. Cerny, D.S. Hage, Development of affinity microcolumns for drug-protein
binding studies in personalized medicine: interactions of sulfonylurea drugs with
in vivo glycated human serum albumin, Anal. Chem. 85 (2013) 4453-4460.
32. A.J. Jackson, J. Anguizola, E.L. Pfaunmiller, D.S. Hage, Use of entrapment and
high-performance affinity chromatography to compare the binding of drugs and
site-specific probes with normal and glycated human serum albumin, Anal.
Bioanal. Chem. 405 (2013) 5833-5841.
33. N. Seeder, M. Kanojia, Mechanism of interaction of hypoglycemic agents
glimepiride and glipizide with human serum albumin, Cent. Eur. J. Chem. 7
(2009) 96-1041.
34. A. Melander, Kinetics-effect relations of insulin-releasing drugs in patients with type
2 diabetes, Diabetes 53 (2004) S151-S155.
35. Z. Tan J. Zhang, J. Wu, L. Fang, Z. He, The enhancing effect of ion-pairing on
the skin permeation of glipizide, AAPS PharmSciTech. 10 (2009) 967-976.
36. C. Hansch, A. Leo, D. Hoekman, Exploring QSAR – hydrophobic, electronic, and
224
steric constants, Washington D.C: American Chemical Society, 1995, p23.
37. D.S. Wishart, C. Knox, A. Guo, D. Cheng, S. Shrivastava, D. Tzur, B Gautum, M
Hassanali, Drug bank 3, Nucleic Acids Res. 36 (2008) D901-D906.
38. J.E. Schiel, K.S. Joseph, D.S. Hage, in: N. Grinsberg, E. Grushka (Eds.), Adv.
Chromatogr., Taylor & Francis, New York, 2010, Chap. 4.
39. D.S. Hage, High-performance affinity chromatography: a powerful tool for
studying serum protein binding, J. Chromatogr. B 768 (2002) 3-30.
40. S. Patel, I.W. Wainer, W.J. Lough, in: D.S. Hage (Ed.), Handbook of Affinity
Chromatography, 2nd
ed., Taylor & Francis, New York, 2006, Chap. 24.
41. D.S. Hage, J. Anguizola, O, Barnaby, A. Jackson, M.J. Yoo, E. Papastavros, E.
Pfaunmiller, M. Sobansky, Z. Tong, Characterization of drug interactions with
serum proteins by using high-performance affinity chromatography, Curr. Drug
Metab. 12 (2011) 313-328.
42. A. Lapolla, D. Fedele, R. Reitano, N.C. Arico, R. Seraglia, P. Traldi, E. Marotta,
R. Tonani, Enzymatic digestion and mass spectrometry in the study of advance
glycation end products/peptides, J. Am. Soc. Mass Spectrom. 25 (2004) 496-509.
43. K.A. Ney, K.J. Colley, S.V. Pizzo, The standardization of the thiobarbituric acid
assay for nonenzymatic glucosylation of human serum albumin, Anal. Biochem.
118 (1981) 294-300.
44. E. Pfaunmiller, A.C. Moser, D.S. Hage, Biointeraction analysis of immobilized
antibodies and related agents by high-performance immunoaffinity
chromatography, Methods 56 (2012) 130-135.
45. R.R. Walters, High-performance affinity chromatography: pore-size effects, J.
225
Chromatogr. A 249 (1982) 19-28.
46. P.O. Larsson, High-performance liquid affinity chromatography, Methods
Enzymol. 104 (1984) 212-223.
47. H.S. Kim, D.S. Hage, Immobilization methods for affinity chromatography, In
Handbook of Affinity Chromatography; Hage, D.S. (Ed.), Taylor & Francis, New
York, 2006, Chap. 3.
48. C. Wa, R.L. Cerny, D.S. Hage, Identification and quantitative studies of protein
immobilization sites by stable isotope labeling and mass spectrometry, Anal.
Chem. 78 (2006) 7967-7977.
49. K.S. Joseph, A.C. Moser, S. Basiga, J.E. Schiel, D.S. and Hage, Evaluation of
alternatives to warfarin as probes for Sudlow site I of human serum albumin:
characterization by high-performance affinity chromatography, J. Chromatogr. A
1216 (2009) 3492–3500.
50. S.H. Yalkowsky, R.M. Dannenfelser. Aquasol Database of Aqueous Solubility,
Ver. 5, Univ. Ariz., Tucson, 1992.
51. I.V. Teko, V.Y. Tanchuk, T.N. Kasheva, A.E. Villa, Estimation of aqueous
solubility of chemical compounds using E-state indices, J. Chem. Inf. Comput.
Sci. 41 (2001) 1488-1493.
52. R. Matsuda, J. Anguizola, K.S. Hoy, D.S. Hage, Analysis of drug-interactions by
high-performance affinity chromatography: Interactions of sulfonylurea drugs
with normal and glycated human serum albumin, Methods 1286 (2015) 255-277.
53. M.L. Conrad, A.C. Moser, D.S. Hage, Evaluation of idole-based probes for high-
throughput screening of drugs binding to human serum albumin: Analysis by
226
high-performance affinity chromatography, J. Sep. Sci. 32 (2009) 1145-1155.
54. S. Jamzad, R. Rassihi, Role of surfactant and pH on dissolution properties of
fenofibrate and glipizide – A technical note, AAPS PharmSciTech. 7 (2006) E17-
E22.
55. S.A. Tweed, PhD Dissertation, University of Nebraska, Lincoln, 1997.
56. M.J. Crooks, K.F. Brown, The binding of sulphonylureas to serum albumin. J.
Pharm. Pharmacol. 26 (1974) 304-311.
57. O.S. Barnaby, R.L. Cerny, W. Clarke, D.S. Hage, Comparison of modification
sites formed on human serum albumin at various stages of glycation, Clin. Chim.
Acta 412 (2011) 277-285.
58. O.S. Barnaby, R.L. Cerny, W. Clarke, D.S. Hage, Quantitative analysis of
glycation patterns in human serum albumin using 16
O/18
O-labeling and MALDI-
TOF MS, Clin. Chim. Acta 412 (2011) 1606-1615.
59. I. Sjoholm, In Drug-Protein Binding, M.M. Reidenburg, S. Erill (Eds.) Praeger,
New York, 1986.
60. A. Sengupta, D.S. Hage, Characterization of minor probes for human serum
albumin by high-performance affinity chromatography, Anal. Chem. 17 (1999)
3821-3827.
5.7 Appendix
5.7.1 Analysis of Frontal Analysis Data According to Eq. (5)
Frontal analysis data for the binding of glipizide with normal HSA and glycated
HSA were also examined by using plots produced according to Eqs. (2) or (4). A typical
double-reciprocal plot of 1/mLapp vs. 1/[A] for such as a system is given in Fig. 5-8. As is
227
shown in this figure, a linear response was noted at low concentrations of glipizide, or
high 1/[Glipizide]. However, at higher concentrations, or lower values for 1/[Glipizide],
deviations from the linear response was observed. This deviation confirmed that
glipizide was interacted at more than one type of site on normal HSA or glycated HSA.
The linear region that was noted at the higher values of 1/[Glipizide] were used
with Eq. (5) to provide an estimate for the association equilibrium constant for the high
affinity sites of glipizide on these proteins. In Fig. 5-8, the best-fit line over this linear
region gave a correlation coefficient of 0.9971 (n = 6) and an estimated association
equilibrium constant of 1.1 (± 0.1) × 105 M
-1. Similar linear fits to the lower
concentration data were observed for gHSA1 and gHSA2, which gave correlation
coefficients of 0.9994 (n = 6) and 0.9992 (n = 6), respectively. The corresponding
association equilibrium constants that were estimated for the high affinity sites were 1.1
(± 0.1) × 105 M
-1 for gHSA1 and 1.2 (± 0.1) × 10
5 M
-1 for gHSA2. All of the values were
statistically identical to each other at the same at the 95% confidence interval.
5.7.2 Zonal Elution Competition Studies at Sudlow Site I
The linear region obtained in Fig. 5-5(a) for the normal HSA column at low
glipizide concentrations had a correlation coefficient of 0.9999 (n = 4). The ratio of the
slope and intercept for this linear region gave an association equilibrium constant of 6.1
(± 0.1) × 104 M
-1 for glipizide at Sudlow site I of normal HSA. The binding of glipizide
to Sudlow site I of gHSA1 and gHSA2 also gave linear relationships over a similar
concentration range and when plotted according to Eq. (6). The correlation coefficients
for these linear regions were 0.9854 (n = 5) and 0.9999 (n = 4), respectively. The
228
Figure 5-8. Results of frontal analysis experiments for the binding of glipizide to a 2.0
cm × 2.1 mm i.d. normal HSA column, as analyzed according to a double-
reciprocal plot and Eq. (4). These results are for twelve glipizide
concentrations that ranged from 0.5 to 50 µM. The inset shows the
deviations occurring at low 1/[Glipizide] values from the best-fit line (as
given in the above graph) that was determined from the linear region at
high values of 1/[Glipizide].
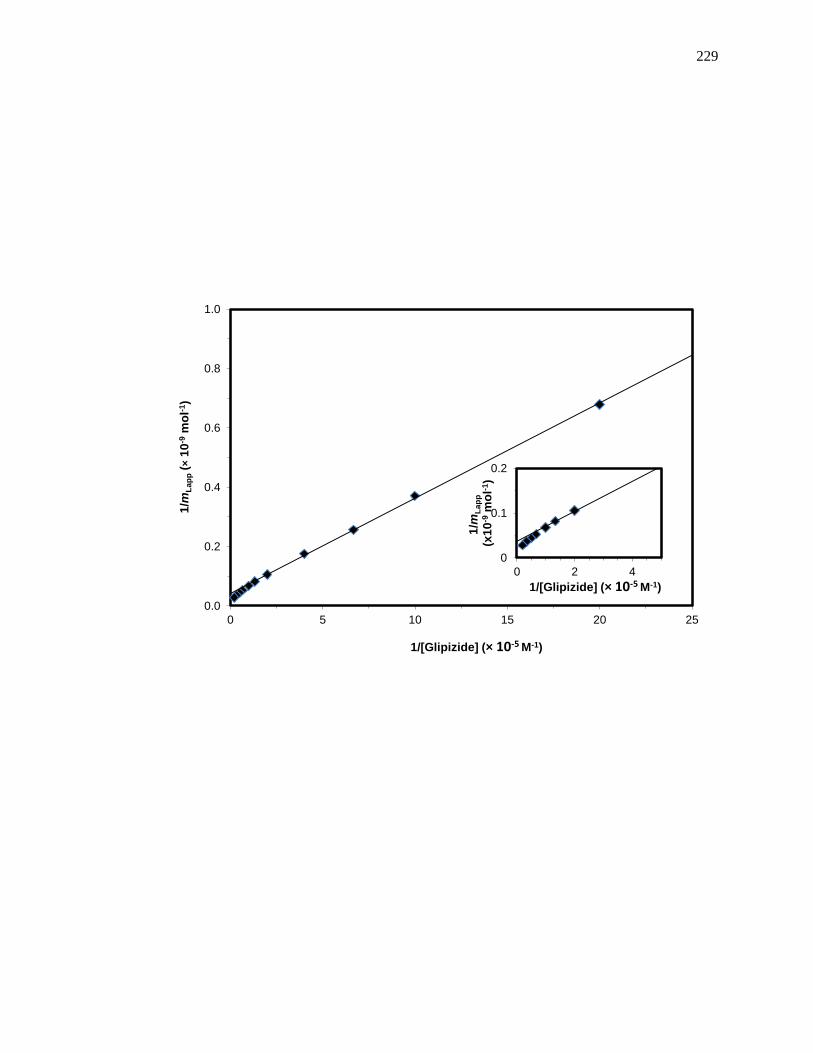
229
0.0
0.2
0.4
0.6
0.8
1.0
0 5 10 15 20 25
1/m
La
pp (
× 1
0-9
mo
l-1)
1/[Glipizide] (× 10-5 M-1)
0
0.1
0.2
0 2 4
1/m
La
pp
(x
10
-9 m
ol-1
)
1/[Glipizide] (× 10-5 M-1)
230
association equilibrium constants that were determined for these regions were 4.4 (± 0.4)
× 104 M
-1 for gHSA1 and 6.7 (± 0.1) × 10
4 M
-1 for gHSA2.
The linear plots that were obtained by fitting Eq. (7) and that are described in
Table 5-2 and the main text for glipizide and R-warfarin were obtained at moderate-to-
high concentrations of glipizide. When similar plots of k0/(k - k0) vs. 1/[Glipizide] were
made over the entire data set, linear relationships were still obtained with negative slopes
and coefficients that ranged from 0.9933 to 0.9980 (n = 7). The association equilibrium
constant and coupling constant that were obtained from the expanded fit for glipizide at
Sudlow Site I on normal HSA was 8.9 (± 1.4) × 104 M
-1 and 0.32 (± 0.05). The
corresponding values for gHSA1 were 20.0 (± 2.9) × 104 M
-1 and 0.62 (± 0.05), while the
values for gHSA2 were 15.2 (± 2.0) × 104 M
-1 and 0.44 (± 0.05).
0.1) × 104 M
-1 for gHSA2.
5.7.3 Reverse Competition Studies using Glipizide and Warfarin
In the reverse zonal elution competition studies that were conducted between
glipizide and warfarin, the part of the retention factor that was due to the interaction of
glipizide at Sudlow Site II was estimated by using Eq. (9) along with the binding
parameters given for glipizide at this site in Table 5-2 and the measured retention of L-
tryptophan in the absence of glipizide. The contribution to the retention due to the weak
affinity sites for glipizide was estimated by using Eq. (9) and the binding parameters in
Table 5-1 that were measured for glipizide at these sites. The interaction at Sudlow Site
II was found from these estimates to make up 11-40% of the total retention seen for
glipizide on the normal HSA column in the presence of the various applied
231
concentrations of warfarin; the weak affinity interactions made up 2-6% of the total
retention under the same conditions.
Plots of the inverse of the corrected retention factor for glipizide, as obtained in
these reverse competition studies, were made versus the concentration of warfarin in the
mobile phase. A typical result is provided in Fig. 5-9, which provided a linear fit for the
normal HSA column with a correlation coefficient of 0.9874 (n = 8). This linear fit
confirmed that glipizide was competing with warfarin at Sudlow site I. Similar results
were obtained for the gHSA1 and gHSA2 columns, which gave correlation coefficients
of 0.9917-0.9930 (n = 8). The association equilibrium constant that was estimated for
warfarin from these plot were in the range of 1.2-1.3 × 10⁵ M
-1, which was comparable to
a previously-reported association equilibrium constant for warfarin at Sudlow site I of 2.4
(± 0.4) × 105 M
-1 [19,49]. The association equilibrium constants that were measured for
glipizide at Sudlow site I from the same plots were 8.4-9.5 × 10⁵ M
-1, which also should
reasonable agreement with the results that had been obtained by normal zonal elution
competition studies.
5.7.4 Reverse Competition Studies using Glipizide and Tamoxifen
Reverse competition studies similar to those described in the previous section
were also conducted in which tamoxifen was used as the competing agent and glipizide
was the injected probe. In this case, the retention factor due to interactions at Sudlow site
II made up 11-42% of the total retention seen for glipizide, while the weak affinity
interactions made up 2-6%. Plots of the inverse of the corrected retention factor for
glipizide versus the concentration of tamoxifen in the mobile phase resulted in non-linear
plots (see Fig. 5-10), as observed for both normal HSA and glycated HSA. This behavior
232
Figure 5-9. A typical plots of 1/(kGlipizide, Corrected) versus concentration of warfarin, as
obtained in reverse competition studies. These results are for eight
warfarin concentrations that ranged from 0 to 20 µM. . The equation for
the best-fit line was y = [2.6 (± 0.2) × 103] x + [0.02 (± 0.01)], with a
correlation coefficient of 0.9874 (n = 8). The error bars represent a range
of ± 1 S.D. Each point is the average of four values with relative standard
deviations that ranged from ± 0.3-6.1%.
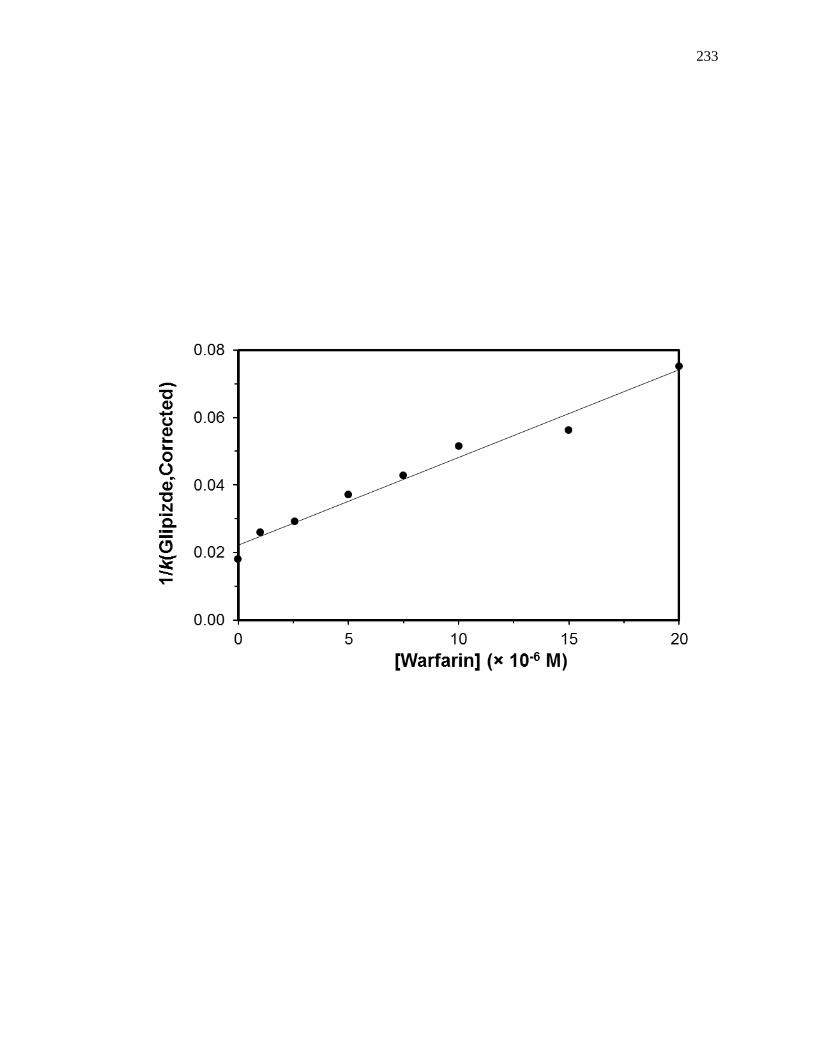
233
234
Figure 5-10. Results of plots of 1/(kGlipizide,Corrected) versus the concentration of
tamoxifen. These results are for eight warfarin concentrations that ranged
from 0 to 10 µM. The error bars represent a range of ± 1 S.D. Each point
is the average of four values with relative standard deviations that ranged
from ± 0.7-3.2%.
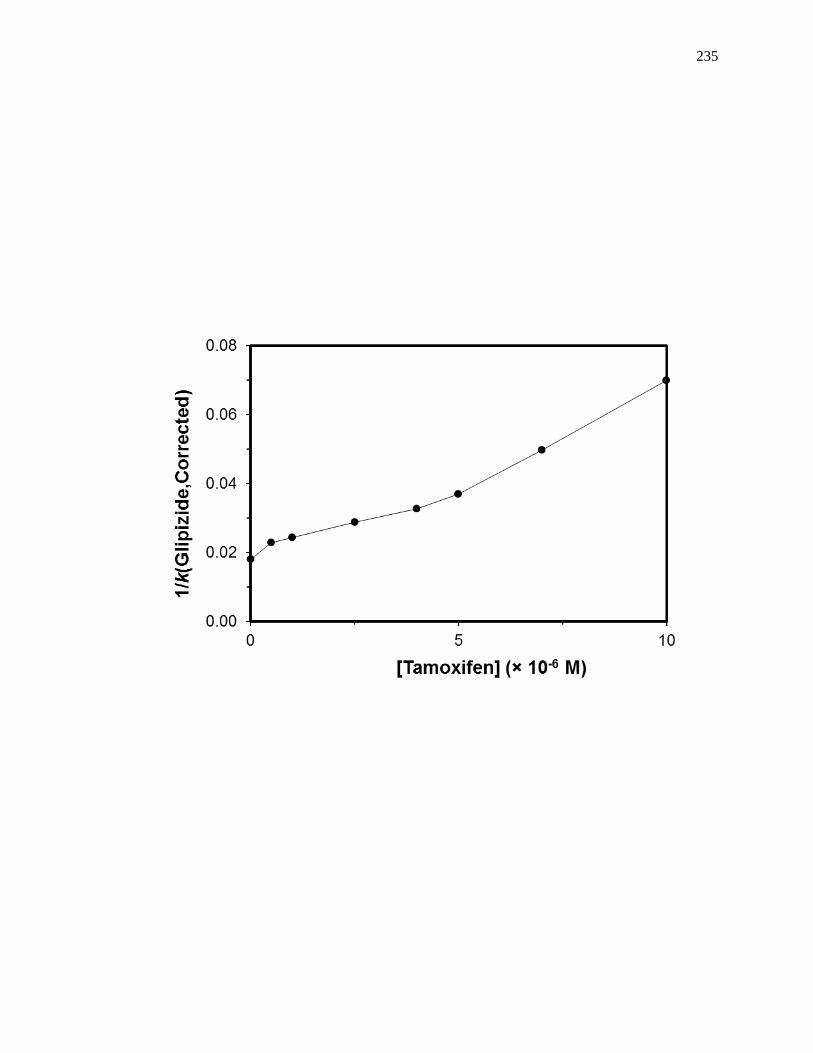
235

236
again suggested that allosteric interactions were present between glipizide and tamoxifen
during their binding to normal HSA and glycated HSA.
237
CHAPTER 6:
ANALYSIS OF MULTI-SITE DRUG-PROTEIN INTERACTIONS BY HIGH-
PERFORMANCE AFFINITY CHROMATOGRAPHY:
BINDING BY GLIMEPIRIDE TO NORMAL OR GLYCATED HUMAN SERUM
ALBUMIN
Note: Portions of this chapter have appeared in R. Matsuda, Z. Li, X. Zheng, D.S. Hage,
“Analysis of multi-site drug-protein interactions by high-performance affinity
chromatography: binding by glimepiride to normal or glycated human serum albumin”, J.
Chromatogr. A (2015) Submitted.
6.1 Introduction
The sulfonylureas are a class of drugs that are commonly used to treat type II
diabetes. These drugs stimulate the secretion of insulin from beta cells in the pancreas to
alleviate elevated levels of glucose in the blood stream [1]. These drugs are often divided
into groups such as “first-generation” and “second-generation”, which differ in their
effectiveness for treatment and their ability to be metabolized by the body [2-4].
Glimepiride (see Fig. 6-1) is a third-generation sulfonylurea drug that can be used at even
lower dosages than second-generation drugs like gliclazide and glibenclamide [1]. The
effectiveness of glimepiride is similar to that of glibenclamide; however, glimepiride can
be taken only once daily, while glibenclamide and other sulfonylurea drugs are
administered 1-2 times per day [1].
First- and second-generation sulfonylurea drugs are known to bind to and be
transported by human serum albumin (HSA), the most abundant protein in blood plasma
[5-13]. Such binding is an important function of HSA, which aids in the transportation of
238
Figure 6-1. Structure of glimepiride. The section in the dashed box shows the core
structure of a sulfonylurea drug.
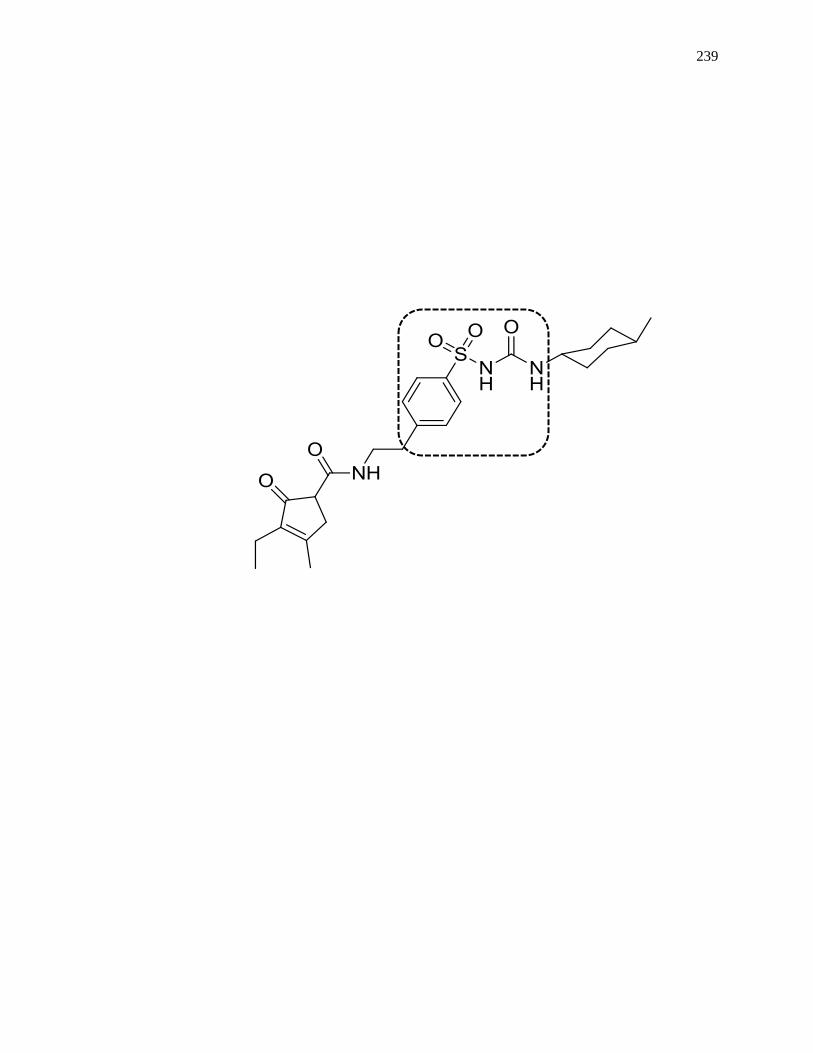
239
240
many endogenous and exogenous substances throughout the body (e.g., drugs, low mass
hormones, and fatty acids)[14-19]. Sudlow sites I and II are the two main binding sites
for drugs on HSA [14,20,21]. Bulky heterocyclic anionic drugs such as warfarin,
azapropazone, phenylbutazone, and salicylate tend to bind at Sudlow site I [14,17,20,22].
Ibuprofen, ketoprofen, benzodiazepines, and L-tryptophan are examples of drugs and
solutes that bind to Sudlow site II [14,17,20,23]. There are some additional sites on HSA
that have been reported for drugs such as tamoxifen and digitoxin (i.e., the tamoxifen and
digitoxin sites) [24-26]. A number of first- and second-generation sulfonylurea drugs
have been reported to bind to Sudlow sites I and II; glibenclamide has also been found to
bind at the digitoxin site [4-7,9-13].
Several recent reports have found that the binding of sulfonylurea drugs to HSA
can be affected by non-enzymatic glycation [6,7,9-13,27,28]. Glycation occurs when
glucose reacts with free amine groups on a protein such as HSA [16,29-33]. A Schiff
base is initially formed by this reaction and can later rearrange to form a more stable
Amadori product, or ketoamine [16,29-33]. There is roughly a 2- to 5-fold increase in the
amount of glycated HSA in patients with diabetes versus normal individuals [34].
Structural studies based on mass spectrometry have shown that some of these glycation-
related modifications can occur at or near Sudlow sites I and II [13,35-37].
The goal of this study is to investigate the possible multi-site binding of
glimepiride to HSA and in vitro glycated HSA through the use of high-performance
affinity chromatography (HPAC). HPAC is a liquid chromatographic technique that
utilizes an immobilized biological molecule (e.g., HSA) as the stationary phase [38].
One application of HPAC is as a tool for studying biological interactions [38-41]. In the
241
use of HPAC to study drug interactions with normal HSA, it has been frequently noted
that the binding parameters that can be obtained are comparable to those of traditional
solution-phase techniques or reference methods (e.g., equilibrium dialysis and
ultrafiltration) [38-44]. It has also been found recently that HPAC can be used to profile
drug interactions with glycated HSA [6-13].
Glimepiride has a limited solubility in an aqueous solution (e.g., < 1 mg/L in
water) [45]. Previous work based on fluorescence spectroscopy has used relatively non-
polar solvents (e.g., 2.5-10% dimethyl sulfoxide) to make it possible to investigate the
interactions of this drug with normal HSA [46-48]. The work described in this chapter
will use HPAC to examine these interactions directly in aqueous solutions and at a
physiological pH, while also expanding such studies to include glycated HSA. Various
HPAC methods (e.g., frontal analysis and zonal elution competition studies) will be used
to examine the overall binding and interactions at specific sites for glimepiride on normal
HSA and glycated HSA. A comparison between the binding by glimepiride with normal
HSA and glycated HSA will be made, as well as with data from previous reports that
have examined the binding of first- and second-generation sulfonylurea drugs to similar
protein preparations [5-7,9-13,27]. These experiments should provide a more complete
picture of how glimepiride and sulfonylurea drugs interact with HSA and of how
glycation may affect these processes. In addition, the results obtained with various
HPAC methods for glimepiride should provide useful information on how similar tools
might be used in examining additional multi-site interactions involving other proteins or
classes of drugs.
242
6.2 Experimental
6.2.1 Chemicals
Glimepiride (≥ 96% pure) was purchased from Santa Cruz Biotechnology (Dallas,
Texas, USA). The racemic warfarin (≥ 99%), R-warfarin (≥ 97%), L-tryptophan (≥
97%), digitoxin (≥ 97%), tamoxifen (≥ 99%), β-cyclodextrin (> 98%), D-(+)-glucose (≥
99.5%), sodium azide (95%), and HSA (essentially fatty acid free, ≥ 96%) were from
Sigma Aldrich (St. Louis, MO, USA). Nucleosil Si-300 (7 µm particle diameter, 300 Å
pore size) was purchased from Macherey-Nagel (Düren, Germany). In vitro glycated
HSA samples were purified through the use of Econo-Pac 10DG desalting columns from
Bio-Rad Laboratories (Hercules, CA, USA) and Slide-A-Lyzer digest 7K dialysis
cassettes (7 kDa MW cutoff; 0.5-3, 3-12 or 12-30 mL sample volumes) from Thermo
Scientific (Rockford, IL, USA). A fructosamine assay kit, obtained from Diazyme
Laboratories (San Diego, CA, USA), was used to measure the modification levels of the
in vitro glycated HSA samples. A bicinchoninic acid (BCA) protein assay was used to
determine the protein content of the chromatographic supports; the reagents for this assay
were obtained from Pierce (Rockford, IL, USA). All aqueous solutions were prepared in
water that was purified by a Milli-Q-Advantage A 10 system (EMD Millipore
Corporation, Billerica, MA, USA). The same solutions were filtered through 0.20 µm
GNWP nylon membranes from EMD Millipore prior to use.
6.2.2 Apparatus
The HPLC system was composed of two PU-2080 pumps, a DG-2080 degasser,
an AS-2057 autosampler, a CO-2060 column oven, and an UV-2075 absorbance detector
from Jasco (Tokyo, Japan). This system also included a Rheodyne Advantage PF six-
243
port valve (Cotati, CA, USA). Jasco LC Net and ChromNav software were used to
control the HPLC system. The chromatograms were analyzed by using Peakfit 4.12
software (Jandel Scientific Software, San Rafael, CA, USA). DataFit 8.1.69 (Oakdale,
PA, USA) was used for data analysis by non-linear regression.
6.2.3 In vitro Glycation of HSA
In vitro glycated HSA was prepared at physiological concentrations of HSA and
glucose, as described previously [8,49,50], to prepare samples that were representative of
glycation levels that are found in patients with prediabetes or confirmed diabetes. These
two samples will be referred to in this study as “gHSA1” and “gHSA2”, respectively. To
prevent bacterial growth during the glycation process, all materials (e.g., glassware and
spatulas) were first sterilized in an autoclave. A pH 7.4, 0.20 M potassium phosphate
buffer, for use in this procedure, was prepared that contained 1 mM sodium azide. This
buffer was also sterilized in an autoclave to prevent bacterial growth.
The in vitro glycated HSA was prepared by adding 840 mg of normal HSA to
either a solution containing 15 mM glucose (for gHSA1) or 30 mM glucose (for gHSA2)
that was prepared in the sterile pH 7.4, 0.20 M phosphate buffer. The final HSA
concentration of the glycated solutions was 42 mg/L of HSA. These mixtures were then
incubated for four weeks at 37 °C. The protein samples were later purified through the
use of size exclusion chromatography by using desalting columns and pH 7.4, 0.067 M
potassium phosphate buffer to remove the excess glucose [8]. The collected samples
were dialyzed against water using a volume that was 200-500 times the volume of sample
to remove any remaining glucose or phosphate salts [8]. The resulting protein solutions
were then lyophilized and stored at -80 °C until further use.
244
A fructosamine assay was conducted in duplicate to determine the glycation level
of the in vitro glycated samples, as described previously [8]. The measured glycation
levels were 1.39 (± 0.28) and 3.20 (± 0.13) mol hexose/mol HSA for gHSA1 and gHSA2,
respectively. The glycation level for the normal HSA was 0.24 (± 0.13) mol hexose/mol
HSA.
6.2.4 Column preparation
The chromatographic supports were made from Nucleosil Si-300 silica that had
been converted into a diol-bonded form [51-53]. Supports containing normal HSA or
glycated HSA were immobilized to this modified support through the Schiff base method
[53]. A previous study that determined which amine groups on HSA are involved in the
Schiff base method has found that these residues tend to be different from those that are
involved in glycation [54]. Control columns were prepared by the same immobilization
procedure but with no protein being added during the immobilization step. The protein
content for the final supports was determined through a BCA assay. This assay was
conducted in triplicate, with soluble and normal HSA being used as the standard and the
control support being used as the blank. The protein content for the individual supports
was 97 (± 2), 85 (± 4), and 95 (± 4) mg HSA/g silica for the normal HSA, gHSA1, and
gHSA2 supports, respectively.
The supports were downward slurry packed using pH 7.4, 0.067 M potassium
phosphate buffer as the packing solution. The supports were placed into separate 2.0 cm
× 2.1 mm i.d. stainless steel columns at 3500 psi (24 MPa). All of the columns and
support materials were stored in pH 7.4, 0.067 M phosphate buffer at 4 °C until further
use. Previous work has found that such columns can be stable over the course of up to
245
500 sample applications without any appreciable changes in their drug-binding properties
[55].
6.2.5 Chromatographic studies
The glimepiride, racemic warfarin, R-warfarin, L-tryptophan, digitoxin and
tamoxifen solutions were each prepared in pH 7.4, 0.067 M phosphate buffer. The
limited solubility of glimepiride in this buffer required similar methods of solution
preparation to those described for a related drug with low solubility, glibenclamide [10].
This procedure involved preparing the solutions of glimepiride in such a buffer by using
repeated 4 h periods of stirring and sonication on a daily basis and in a covered container
held at 35-50 °C for 5 days. This method allowed for the preparation of a stable 50 µM
glimepiride solution, which could then be used in further dilution steps to prepare
working solutions for the chromatographic studies. Although glimepiride is a weak acid
(pKa, 6.3), the pH of the final buffered solutions was not affected by the presence of this
drug at the concentrations of this agent that were employed in this study [46].
Digitoxin and tamoxifen also have limited solubility in aqueous solutions (e.g.,
around 4 mg/L and 0.17 mg/L in water, respectively). These drugs were dissolved by
adding a solubilizing agent (i.e., β-cyclodextrin) [56,57]. A 25 µM stock solution of
digitoxin was prepared in pH 7.4, 0.067 M phosphate buffer that contained 0.88 mM β-
cyclodextrin; a stock solution of 10 µM tamoxifen was prepared by also adding 2.2 mM
β-cyclodextrin to the pH 7.4, 0.67 M phosphate [24-26]. Racemic warfarin and R-
warfarin solutions were prepared in the pH 7.4, 0.067 M phosphate buffer by stirring
overnight. The glimepiride, tamoxifen, digitoxin, racemic warfarin, and R-warfarin
solutions were used within two weeks of preparation [8,55,58]. Previous studies have
246
shown that solutions of L-tryptophan in pH 7.4 phosphate buffer are only stable for a
period of 2-9 days, so these solutions were prepared and used within one day of
preparation [8,58,59].
The pH 7.4, 0.067 M phosphate buffer was also used as the mobile phase in the
chromatographic experiments for both sample application and isocratic elution. Prior to
use, the mobile phases and applied solutions were passed through 0.2 µm filters and
degassed for 10-15 min. All of the chromatographic experiments were carried out at 0.50
mL/min and 37 °C. Previous studies have indicated that reproducible drug binding
parameters (e.g., retention factors, binding capacities and association equilibrium
constants) can be obtained on comparable HSA columns under the same chromatographic
conditions [5-11].
Frontal analysis experiments were conducted by first equilibrating each column
with the pH 7.4, 0.067 M phosphate buffer. A switch was then made, through the use of
a six-port valve, to the same buffer that contained a known concentration of glimepiride
(i.e., one of twelve solutions containing 0.5-50 µM glimepiride). This application step
resulted in the formation of a breakthrough curve as the elution of glimepiride was
monitored at 255 nm, as is shown in Fig. 6-2(a). Following the formation of this
breakthrough curve and a stable plateau, a switch was made back to only pH 7.4, 0.067 M
phosphate buffer; this buffer was passed through the column to allow for elution of the
retained glimepiride and regeneration of the column. The same experiments were
conducted on the control column. Each concentration of glimepiride was run in
quadruplicate for the various HSA columns and the control column.
The first derivative of each breakthrough curve was found through the use of the
247
smoothing function of Peakfit 4.12, and the mean of this derivative was determined by
utilizing the equal area function [58]. A correction for the system void time and non-
specific binding by glimepiride to the support was made by subtracting the breakthrough
time for the control column from the breakthrough times for columns that contained
normal HSA or glycated HSA. Roughly 42-45% of the measured binding for 50 µM
glimepiride was due to non-specific interactions on the normal HSA or glycated HSA
columns. This was similar to levels of non-specific binding that have been noted for
glibenclamide on the same types of column, and for which a correction was successfully
made by also using binding data obtained from control columns [10].
In the zonal elution competition studies, R-warfarin was used as a probe for
Sudlow site I, while L-tryptophan was used as a probe for Sudlow site II [5-11]. Two
other minor sites on HSA are the digitoxin and tamoxifen sites, which were investigated
by using tamoxifen and digitoxin as site-specific probes, respectively [24-26]. These
competition studies were conducted by using eight mobile phases that contained 0.0 to
20.0 µM glimepiride in pH 7.4, 0.067 M phosphate buffer. The probe samples were
made using the same competing agent concentrations as were present in the mobile phase
and were applied in 20 µL injections. The elution of R-warfarin, L-tryptophan, digitoxin
and tamoxifen was monitored at 308, 280, 205, or 205 nm, respectively. The void time
was determined by making a 20 µL injection of 20 µM sodium nitrate, which was used as
a non-retained solute that was monitored at 205 nm. The experiments for each probe
were conducted in quadruplicate in each mobile phase and on all of the columns,
including the control column. Peakfit 4.12 was used to determine the central point of
each peak by using the equal area function [58].
248
Figure 6-2. (a) Example of a frontal analysis experiment and (b) analysis of such data
by using Eq. (2). These results were obtained for glimepiride on a 2.0 cm
× 2.1 mm i.d. column containing normal HSA. Other experimental
conditions are given in the text. The glimepiride concentrations in (a)
were 50, 30, 20, 10, or 5 µM (top-to-bottom). The results in (b) are for
twelve glimepiride concentrations ranging from 0.5 to 50 µM. The inset
in (b) shows the deviations occurring at low 1/[Glimepiride] values from
the best-fit line that was determined from a linear region at high values of
1/[Glimepiride]. The data points in (b) represent an average of four runs
with relative standard deviations that ranged from 0.04-3.2%.
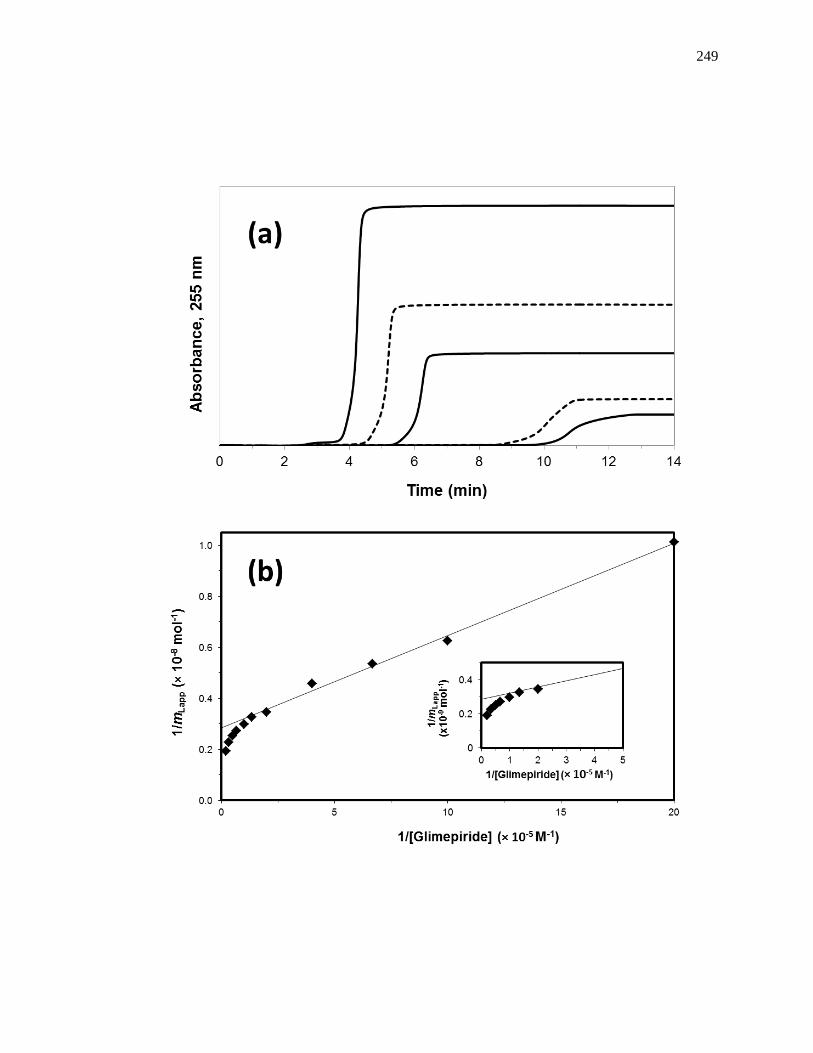
249
250
Similar competition studies were carried out by using racemic warfarin and
tamoxifen as competing agents in the mobile phase while glimepiride was injected as the
probe. Eight mobile phase solutions containing racemic warfarin were made, using
warfarin concentrations ranging from 0.0 to 20.0 µM. Experiments with tamoxifen
acting as the competing agent made use of a set of eight solutions that contained 0.0 to
10.0 µM of this drug in the mobile phase. These warfarin and tamoxifen solutions were
used to prepare 5 µM samples of glimepiride. A 20 µL portion of these glimepiride
samples were then injected into their corresponding mobile phases and onto each column
while the elution of glimepiride was monitored at 255 nm. Sodium nitrate was again
used as a non-retained solute and was injected under the same chromatographic
conditions. These experiments were performed in quadruplicate for all of the mobile
phases and columns. The central point of the peak for glimepiride was determined by
using the equal area function of Peakfit 4.12 [58].
6.3 Results and Discussion
6.3.1 Determination of Overall Binding Model
Frontal analysis was first used to profile the overall interactions between
glimepiride and normal HSA or glycated HSA. This method was used to provide
information about the overall number and general types of binding sites for these
interactions [38-41,58]. Examples of these experiments are shown in Fig. 6-2(a), in
which the mean breakthrough times occurred within 4-12 min after the application of
glimepiride to the normal HSA column. The mean point of each breakthrough curve was
used to determine the moles of applied drug that were required to reach that point at the
given concentration of glimepiride. These results were then fit to various binding models
251
to determine the number of binding sites and equilibrium constants for the system [38-
41,58].
These data were first examined by using a binding model for a one-site reversible
interaction, as represented by the equivalent expressions in Eqs. (1-2) [38-41,58].
𝑚Lapp =𝑚L𝐾a[A]
(1 + 𝐾a[A]) (1)
1
𝑚Lapp=
1
(𝐾a𝑚L[A])+
1
𝑚L (2)
In these equations, mLapp represents the moles of applied analyte or drug that were
required to reach the mean point of the breakthrough curve at a given molar concentration
of the analyte, [A] [38-41,58]. The terms Ka and mL represent the association equilibrium
constant and total moles of active binding sites for this interaction. Eq. (1) can be
rearranged into Eq. (2) by taking the reciprocal of both sides of Eq. (1) [38-41,58].
Similar models can be employed for drug-protein interactions that occur at
multiple binding sites. For instance, Eqs. (3-4) describe a system with interactions that
occur at two types of regions [38-41,58].
𝑚Lapp =𝑚𝐿1𝐾𝑎1[A]
(1+𝐾𝑎1[A])+
𝑚L2𝐾𝑎2[A]
(1+𝐾𝑎2[A]) (3)
1
𝑚Lapp=
1+𝐾𝑎1[A]+𝛽2𝐾𝑎1[A]+𝛽2𝐾𝑎12[A]2
𝑚L{(𝛼1+𝛽2−𝛼1𝛽2)𝐾𝑎1[A]+𝛽2𝐾𝑎12[A]2}
(4)
In these equations, the association equilibrium constants for the two regions are given by
Ka1 and Ka2, and the moles of these regions are described by mL1 and mL2 [38-41,58]. The
alternative terms that appear in Eq. (4) are α1, which is the fraction of all binding sites
that consist of the highest affinity regions, or α1 = mL1/mL, where Ka1 and mL1 are the
binding parameters for the high affinity sites [38-41,58]. Eq. (4) also includes the term
β1, which is the ratio of the association equilibrium constants for the lower versus higher
252
affinity sites, or β2 = Ka2/Ka1 for Ka1 > Ka2 [38-41,58].
Previous studies with both first- and second-sulfonylurea drugs have found that
these drugs interact with both normal and glycated HSA through a two-site model [5-
7,9,10]. The presence of two more groups of binding sites for glimepiride was tested by
first plotting its frontal analysis data according to Eq. (2) [5-7,9,10]. This equation
predicts that a plot of 1/mLapp versus 1/[A] will result in a linear relationship for a system
with a single group of binding sites. However, as is illustrated in Fig. 6-2(b) for normal
HSA, deviations from linearity were noted in these plots at low values of 1/[Glimepiride],
or at high concentrations of this drug [5-7,9,10]. The same type of behavior was seen on
the glycated HSA columns. These deviations indicated that a multisite interaction was
occurring between glimepiride and normal HSA or glycated HSA.
The same data were next examined by using non-linear regression and Eqs. (1) or
(3). The fits that were obtained for glimepiride with normal HSA are shown in Fig. 6-3.
The best-fit line for the two-site model gave a correlation coefficient of 0.9992 (n = 12),
which was higher than the correlation coefficient of 0.9609 that was obtained for the one-
site model. The residual plot for two-site model also resulted in a more random
distribution of the data points about the best-fit line when compared to the fit for the one-
site model (see insets for Fig. 6-3). In addition, the sum of the squares of the residuals
for each fit was much smaller for the two-site model than for the one-site model (i.e.,
2.5× 10⁻¹⁸
vs. 1.3 × 10⁻¹⁶
). The use of higher-order models (e.g., three-site binding) did
not result in any further improvement in the fit of this data set. All of this information
indicated that glimepiride was interacting with normal HSA through two general groups
of sites, as has been noted for other sulfonylurea drugs [5-7,9,10].
253
Figure 6-3. Comparison of frontal analysis data analyzed by (a) a one-site model or
(b) a two-site model for the binding of glimepiride with normal HSA.
These results are for twelve solutions of glimepiride with concentrations
ranging from 0.5 to 50 µM and that were applied to a 2.0 cm × 2.1 mm i.d.
normal HSA column. Other experimental conditions are given in the text.
The residual plots for each fit are provided in the insets. Each data point is
the average of four values, with relative standard deviations that ranged
from ± 0.04-3.2%.
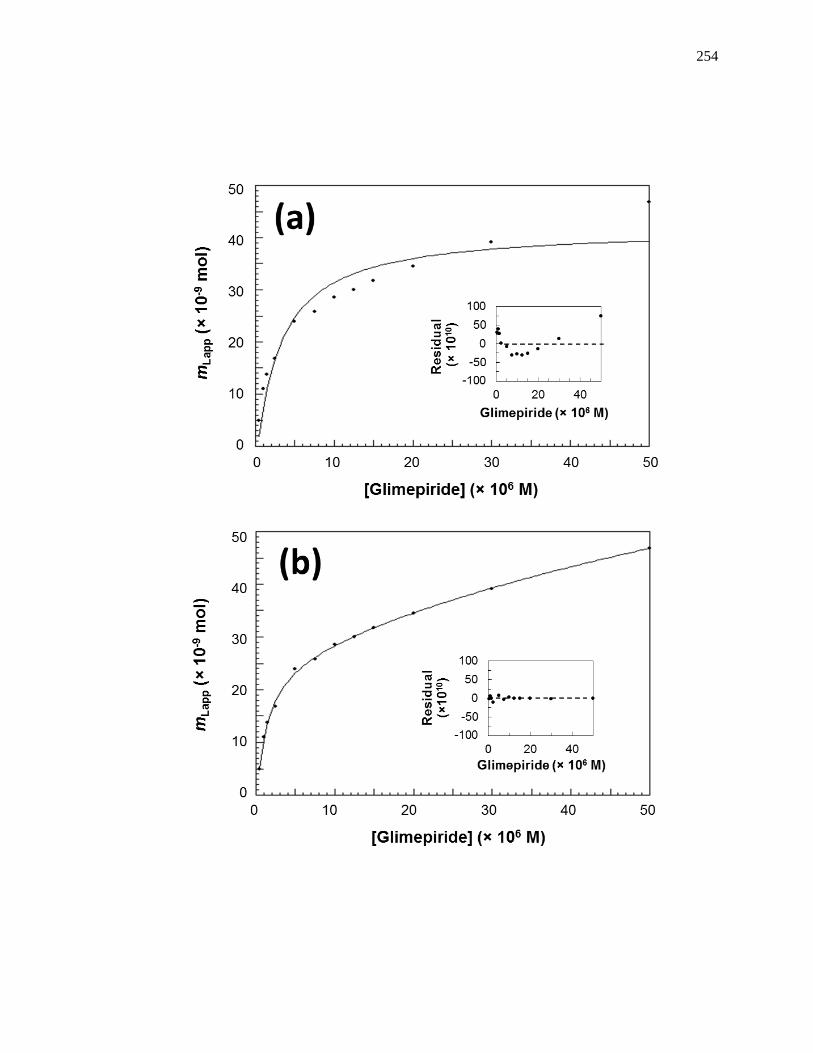
254
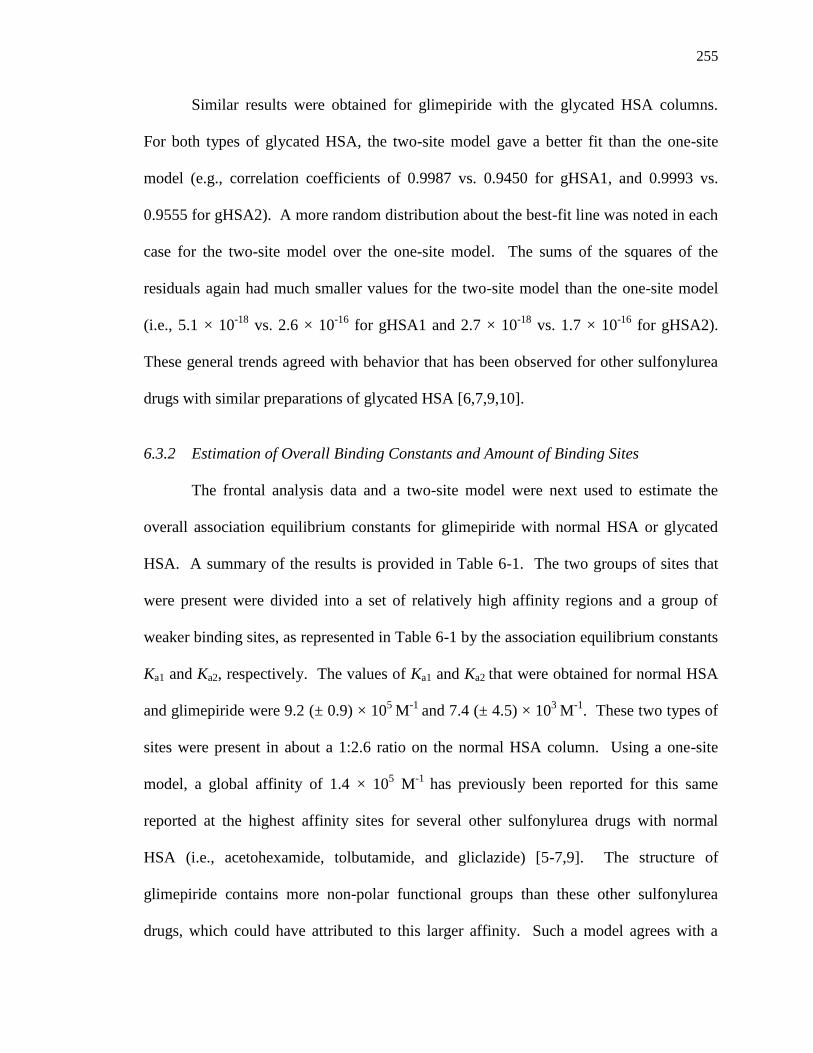
255
Similar results were obtained for glimepiride with the glycated HSA columns.
For both types of glycated HSA, the two-site model gave a better fit than the one-site
model (e.g., correlation coefficients of 0.9987 vs. 0.9450 for gHSA1, and 0.9993 vs.
0.9555 for gHSA2). A more random distribution about the best-fit line was noted in each
case for the two-site model over the one-site model. The sums of the squares of the
residuals again had much smaller values for the two-site model than the one-site model
(i.e., 5.1 × 10⁻¹⁸
vs. 2.6 × 10⁻¹⁶
for gHSA1 and 2.7 × 10⁻¹⁸
vs. 1.7 × 10⁻¹⁶
for gHSA2).
These general trends agreed with behavior that has been observed for other sulfonylurea
drugs with similar preparations of glycated HSA [6,7,9,10].
6.3.2 Estimation of Overall Binding Constants and Amount of Binding Sites
The frontal analysis data and a two-site model were next used to estimate the
overall association equilibrium constants for glimepiride with normal HSA or glycated
HSA. A summary of the results is provided in Table 6-1. The two groups of sites that
were present were divided into a set of relatively high affinity regions and a group of
weaker binding sites, as represented in Table 6-1 by the association equilibrium constants
Ka1 and Ka2, respectively. The values of Ka1 and Ka2 that were obtained for normal HSA
and glimepiride were 9.2 (± 0.9) × 105
M-1
and 7.4 (± 4.5) × 103
M-1
. These two types of
sites were present in about a 1:2.6 ratio on the normal HSA column. Using a one-site
model, a global affinity of 1.4 × 10⁵ M
-1 has previously been reported for this same
reported at the highest affinity sites for several other sulfonylurea drugs with normal
HSA (i.e., acetohexamide, tolbutamide, and gliclazide) [5-7,9]. The structure of
glimepiride contains more non-polar functional groups than these other sulfonylurea
drugs, which could have attributed to this larger affinity. Such a model agrees with a
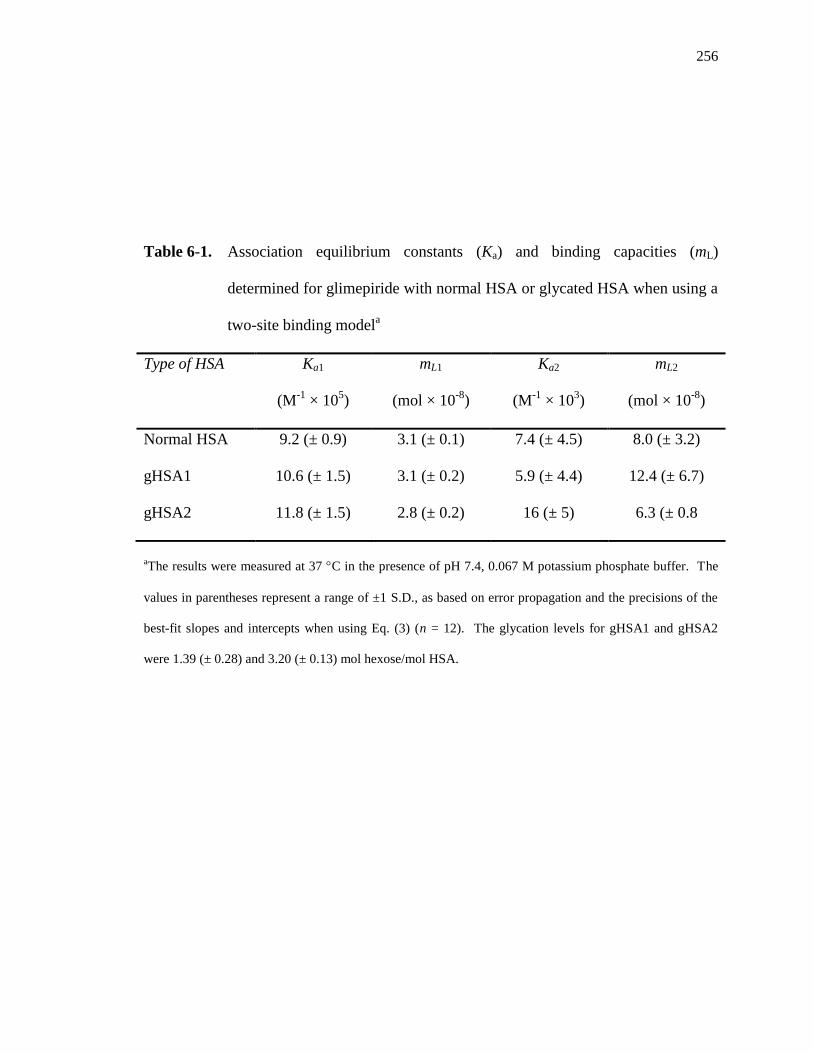
256
Table 6-1. Association equilibrium constants (Ka) and binding capacities (mL)
determined for glimepiride with normal HSA or glycated HSA when using a
two-site binding modela
Type of HSA Ka1
(M-1
× 105)
mL1
(mol × 10-8
)
Ka2
(M-1
× 103)
mL2
(mol × 10-8
)
Normal HSA 9.2 (± 0.9) 3.1 (± 0.1) 7.4 (± 4.5) 8.0 (± 3.2)
gHSA1 10.6 (± 1.5) 3.1 (± 0.2) 5.9 (± 4.4) 12.4 (± 6.7)
gHSA2 11.8 (± 1.5) 2.8 (± 0.2) 16 (± 5) 6.3 (± 0.8
aThe results were measured at 37 C in the presence of pH 7.4, 0.067 M potassium phosphate buffer. The
values in parentheses represent a range of ±1 S.D., as based on error propagation and the precisions of the
best-fit slopes and intercepts when using Eq. (3) (n = 12). The glycation levels for gHSA1 and gHSA2
were 1.39 (± 0.28) and 3.20 (± 0.13) mol hexose/mol HSA.
257
previous report that has suggested hydrophobic interactions play an important role in the
binding of glimepiride with normal HSA [46]. The Ka1 value for glimepiride with normal
HSA was also 1.5-fold lower than the highest affinity interactions of this protein with
glibenclamide, which is another relatively non-polar sulfonylurea drug [10]. This latter
difference may be attributed to the fact that glibenclamide has its strongest binding to the
digitoxin site on HSA, which is separate from the regions that have been found to bind
most sulfonylurea drugs [10].
The values of Ka1 and Ka2 that were measured for glimepiride with gHSA1 were
10.6 (± 1.5) × 105
M-1
and 5.9 (± 4.4) × 103
M-1
, and the values that were obtained for
gHSA2 were 11.8 (± 1.5) × 105
M-1
and 1.6 (± 0.5) × 104
M-1
. When comparing the
values for the highest affinity sites (Ka1), a 15 to 28% increase in affinity was observed
when comparing gHSA1 or gHSA2 to normal HSA. These differences were significant
at the 95% confidence interval. Differences in affinity due the changes in the glycation
level of HSA have been noted with similar protein preparations and other sulfonylurea
drugs; these changes have been suggested to be due to the effects of glycation-related
modifications that occur at or near the drug binding sites of HSA [6,7,9,10,36,37].
The fit of the frontal analysis data to a two-site model was also used to determine
the moles of binding sites that were present for each group of sites on the normal HSA
and glycated HSA columns. These results are included in Table 6-1 and were in the
general range of 30-125 nmol protein, with the higher and lower affinity sites being
present in ratios that ranged from 1:2.3 to 1:4.0. Based on the known protein content of
each column, it was possible to further determine the specific activity for each type of
site. For instance, the specific affinities for the high and low affinity sites in the normal
258
HSA column were 0.67 (± 0.03) and 1.8 (± 0.7) mol/mol HSA. The corresponding
specific activities for the gHSA1 column were 0.78 (± 0.05) and 3.1 (± 1.7) mol/mol
HSA, and the values for gHSA2 column were 0.63 (± 0.04) and 1.3 (± 0.2) mol/mol
HSA. These results were comparable to those acquired in previous work with other
sulfonylurea drugs [6,7,9,10] and indicated that the high affinity interactions involved at
least one major binding site, while the low affinity interactions involved a larger group of
weaker binding sites.
6.3.3 Interactions with Sudlow Site II
The binding of glimepiride at specific sites on HSA was evaluated through the use
of zonal elution competition studies. An example of such a study is shown in Fig. 6-4.
This type of experiment involves the injection of a small plug of a probe compound (A)
in the presence of a known concentration of a potential competing agent (I) in the mobile
phase [38-41,58]. The retention time (tR) for the probe is measured under each set of
conditions and is used along with the column void time (tM, or the elution time of a non-
retained solute such as sodium nitrate) to find the retention factor (k) for the probe, where
k = (tR - tM)/tM [38-41,58]. The change in the retention factor for the probe as the
concentration of the competing agent is varied is then examined to obtain information on
the type of interaction that is taking place between the probe and competing agent as they
both bind to the column [38-42].
If direct competition exists between the probe and competing agent at a single
type of site and the probe has no other binding sites, Eq. (5) can be used to describe the
interaction between these two agents [38-41,58].
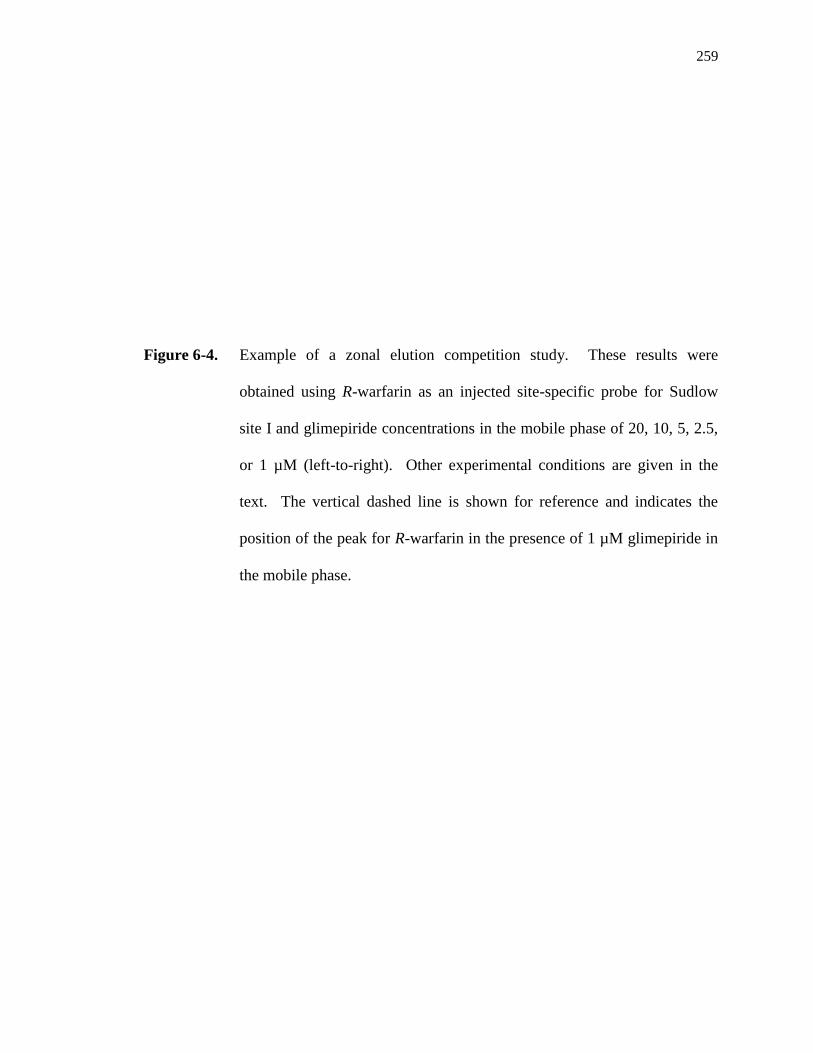
259
Figure 6-4. Example of a zonal elution competition study. These results were
obtained using R-warfarin as an injected site-specific probe for Sudlow
site I and glimepiride concentrations in the mobile phase of 20, 10, 5, 2.5,
or 1 µM (left-to-right). Other experimental conditions are given in the
text. The vertical dashed line is shown for reference and indicates the
position of the peak for R-warfarin in the presence of 1 µM glimepiride in
the mobile phase.
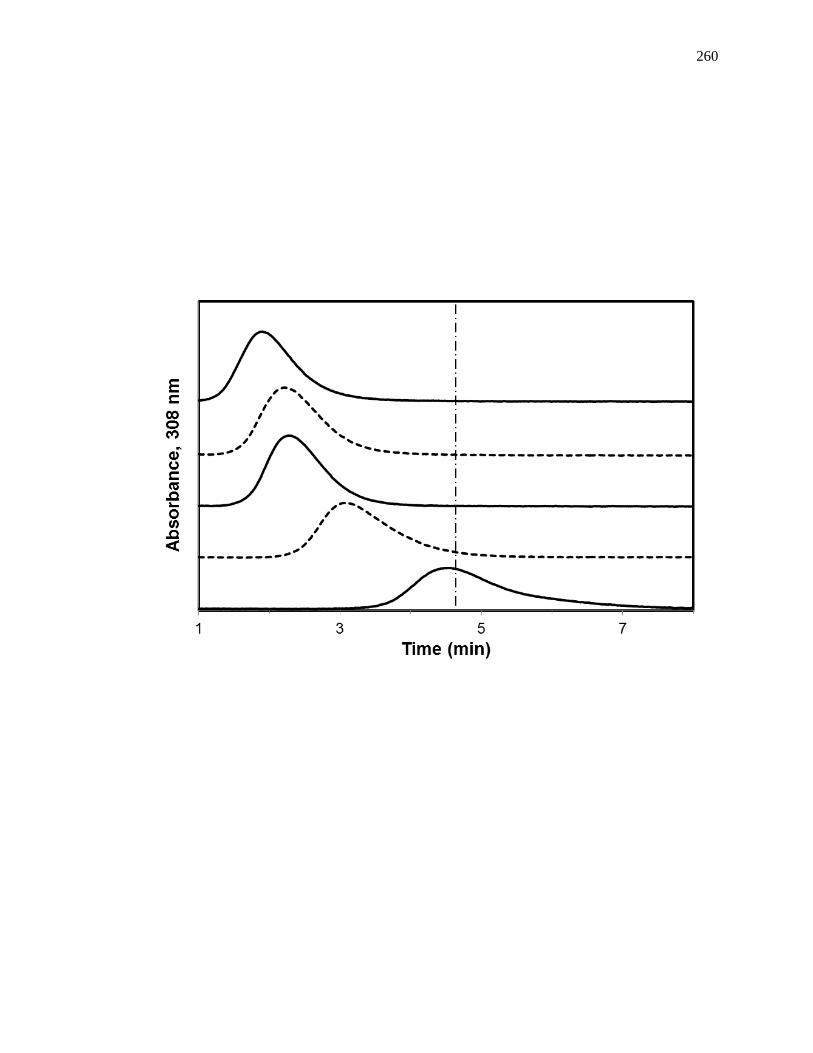
260
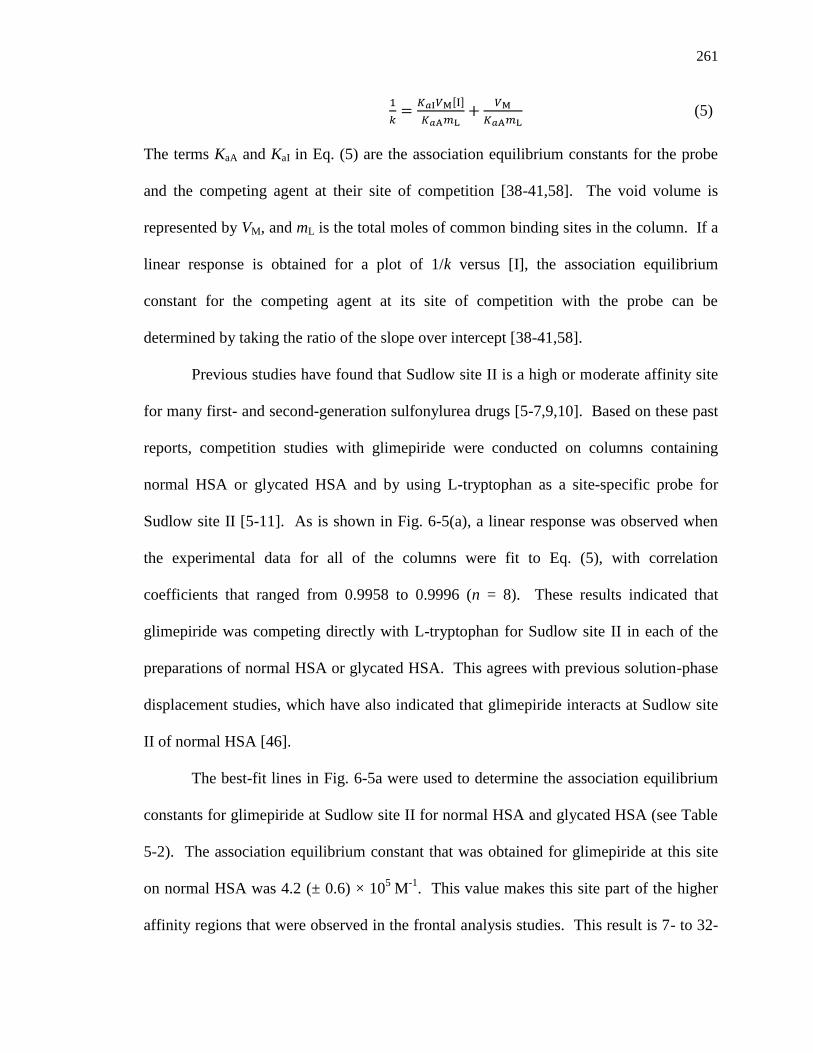
261
1
𝑘=
𝐾𝑎I𝑉M[I]
𝐾𝑎A𝑚L+
𝑉M
𝐾𝑎A𝑚L (5)
The terms KaA and KaI in Eq. (5) are the association equilibrium constants for the probe
and the competing agent at their site of competition [38-41,58]. The void volume is
represented by VM, and mL is the total moles of common binding sites in the column. If a
linear response is obtained for a plot of 1/k versus [I], the association equilibrium
constant for the competing agent at its site of competition with the probe can be
determined by taking the ratio of the slope over intercept [38-41,58].
Previous studies have found that Sudlow site II is a high or moderate affinity site
for many first- and second-generation sulfonylurea drugs [5-7,9,10]. Based on these past
reports, competition studies with glimepiride were conducted on columns containing
normal HSA or glycated HSA and by using L-tryptophan as a site-specific probe for
Sudlow site II [5-11]. As is shown in Fig. 6-5(a), a linear response was observed when
the experimental data for all of the columns were fit to Eq. (5), with correlation
coefficients that ranged from 0.9958 to 0.9996 (n = 8). These results indicated that
glimepiride was competing directly with L-tryptophan for Sudlow site II in each of the
preparations of normal HSA or glycated HSA. This agrees with previous solution-phase
displacement studies, which have also indicated that glimepiride interacts at Sudlow site
II of normal HSA [46].
The best-fit lines in Fig. 6-5a were used to determine the association equilibrium
constants for glimepiride at Sudlow site II for normal HSA and glycated HSA (see Table
5-2). The association equilibrium constant that was obtained for glimepiride at this site
on normal HSA was 4.2 (± 0.6) × 105
M-1
. This value makes this site part of the higher
affinity regions that were observed in the frontal analysis studies. This result is 7- to 32-
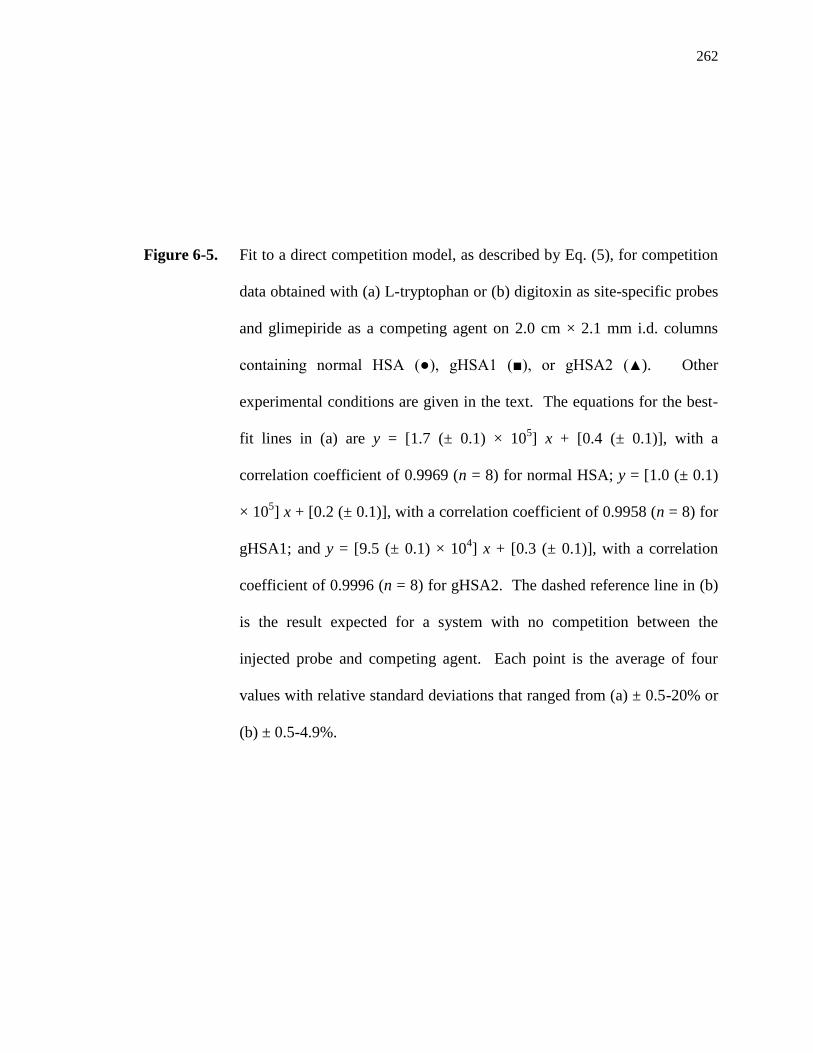
262
Figure 6-5. Fit to a direct competition model, as described by Eq. (5), for competition
data obtained with (a) L-tryptophan or (b) digitoxin as site-specific probes
and glimepiride as a competing agent on 2.0 cm × 2.1 mm i.d. columns
containing normal HSA (●), gHSA1 (■), or gHSA2 (▲). Other
experimental conditions are given in the text. The equations for the best-
fit lines in (a) are y = [1.7 (± 0.1) × 105] x + [0.4 (± 0.1)], with a
correlation coefficient of 0.9969 (n = 8) for normal HSA; y = [1.0 (± 0.1)
× 105] x + [0.2 (± 0.1)], with a correlation coefficient of 0.9958 (n = 8) for
gHSA1; and y = [9.5 (± 0.1) × 104] x + [0.3 (± 0.1)], with a correlation
coefficient of 0.9996 (n = 8) for gHSA2. The dashed reference line in (b)
is the result expected for a system with no competition between the
injected probe and competing agent. Each point is the average of four
values with relative standard deviations that ranged from (a) ± 0.5-20% or
(b) ± 0.5-4.9%.
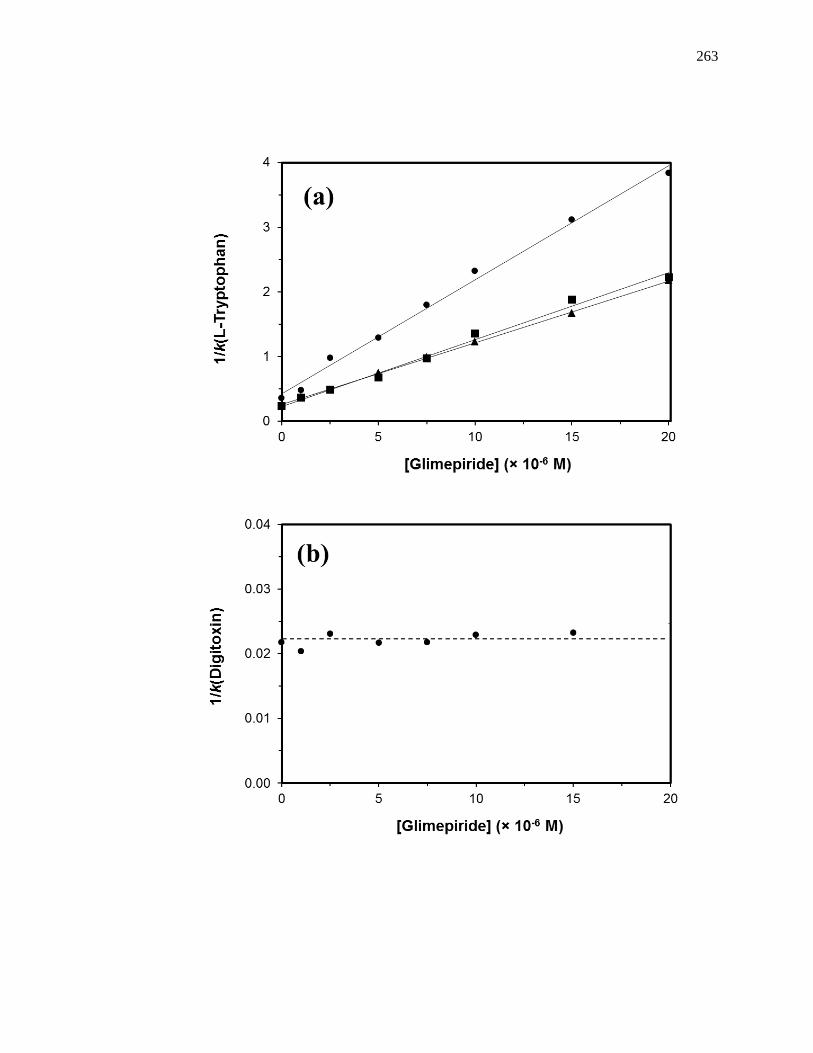
263
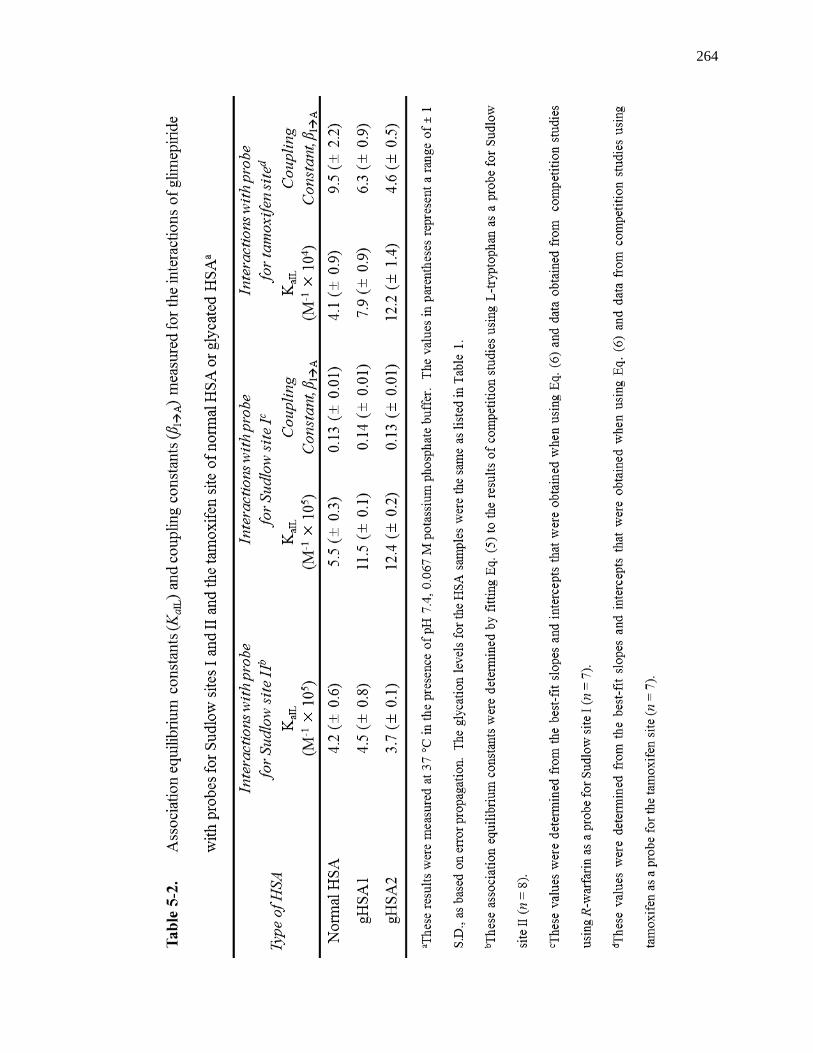
264
265
fold higher than association equilibrium constants that have been reported for first- and
second-generation sulfonylurea drugs at the same site on normal HSA [5-7,9,10]. As
noted earlier, this difference may be due to the relatively non-polar side chains on
glimepiride and their contribution to the interactions of this drug with HSA [46].
Similar association equilibrium constants at Sudlow site II to those found for
normal HSA were obtained for gHSA1 and gHSA2, which gave values of 4.5 (± 0.8) ×
105
M-1
and 3.7 (± 0.1) × 105
M-1
, respectively. No significant differences were observed
at the 95% confidence interval when comparing the values for normal HSA and gHSA1.
However, a 12 to 18% decrease, which was significant at the 95% confidence level, was
observed when comparing gHSA2 with normal HSA or gHSA1. Previous work with
other sulfonylurea drugs have found that either an increase or decrease in affinity can
occur as the level of glycation is increased [6,7,9,10]. These changes have been
attributed to differences in the types of modifications or extent of glycation that occur at
or near Sudlow site II [36,37].
6.3.4 Interactions with the Digitoxin Site
The second-generation sulfonylurea drug glibenclamide has been found in prior
work to interact strongly at the digitoxin site of normal HSA and glycated HSA [10].
Thus, competition studies were next performed with glimepiride and by using digitoxin
as a probe for this binding site [10]. Some typical results are shown in Fig. 6-5(b). The
data indicated that the presence of glimepiride in the mobile phase had no detectable
change on the retention of digitoxin. The retention factor for digitoxin showed only
random variations of ± 8.1% for normal HSA, ± 5.7% for gHSA1, and ± 4.0% for
gHSA2 over the range of glimepiride concentrations that were used in these competition
266
experiments. It was determined from these results that glimepiride was not binding to or
interacting with the digitoxin site on the normal HSA or glycated HSA columns.
6.3.5 Interactions with Sudlow Site I
Sudlow site I is another region of normal HSA and glycated HSA that has been
found to have strong interactions with first- and second-generation sulfonylurea drugs [5-
7,9,10]. Solution-phase displacement studies have also indicated that glimepiride
interacts at Sudlow site I [46]. The binding of glimepiride at this region was first
examined in this chapter by carrying out a competition study that used R-warfarin as a
site-specific probe for Sudlow site I [5-11].
The data from these experiments were plotted according to Eq. (5). Previous
studies have shown that many sulfonylurea drugs compete directly with R-warfarin for
Sudlow site I [5-7,9,10], as would be indicated by a linear fit in a plot made according to
Eq. (5). However, the response that was obtained for glimepiride gave clear deviations
from linearity in such a graph, as is demonstrated for the gHSA1 column in Fig. 6-6(a).
The same behavior was seen for the normal HSA and gHSA2 columns. This result
indicated that a more complex interaction than simple direct competition was occurring
between glimepiride and R-warfarin as they were each binding to these columns. The
type of behavior that is seen in Fig. 6-6(a) could have been caused by a negative
allosteric effect by glimepiride during the binding of R-warfarin to HSA, as has been
noted between some other solutes that bind to this protein [26]. This type of behavior is
also consistent with fluorescence studies which have noted a conformational change that
occurs upon the binding of glimepiride to normal HSA [46].
Eq. (6) was used to further examine this data and to test for the presence of an
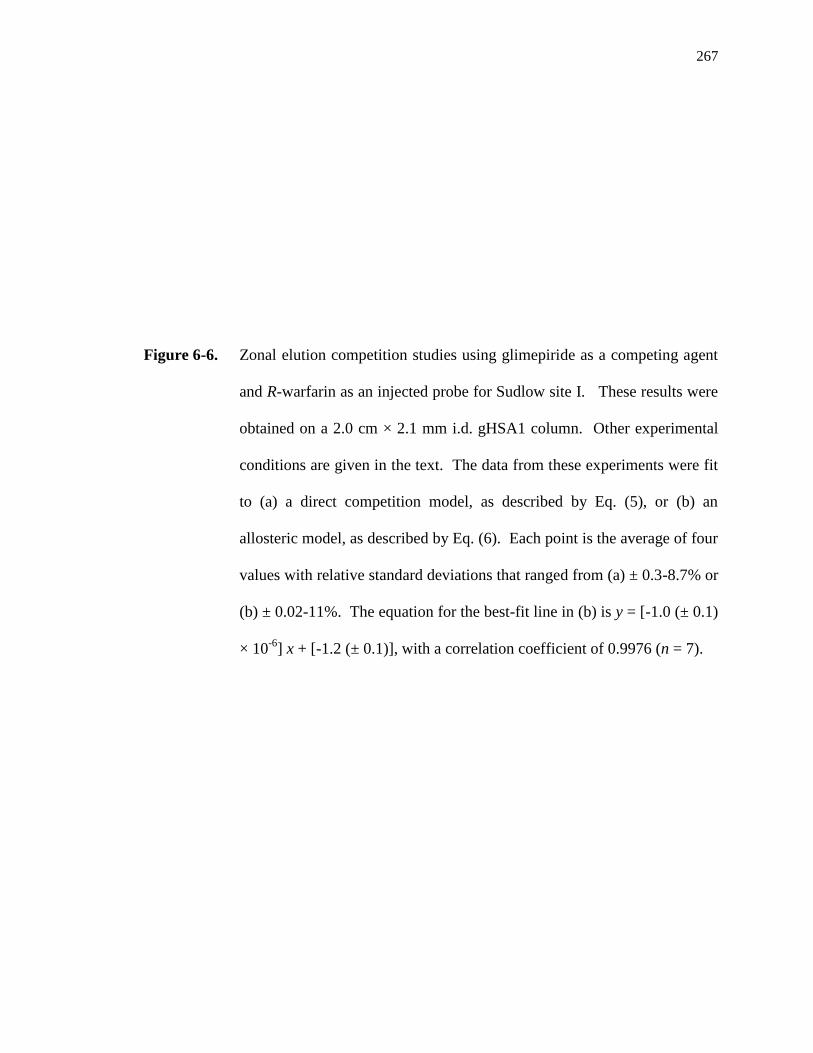
267
Figure 6-6. Zonal elution competition studies using glimepiride as a competing agent
and R-warfarin as an injected probe for Sudlow site I. These results were
obtained on a 2.0 cm × 2.1 mm i.d. gHSA1 column. Other experimental
conditions are given in the text. The data from these experiments were fit
to (a) a direct competition model, as described by Eq. (5), or (b) an
allosteric model, as described by Eq. (6). Each point is the average of four
values with relative standard deviations that ranged from (a) ± 0.3-8.7% or
(b) ± 0.02-11%. The equation for the best-fit line in (b) is y = [-1.0 (± 0.1)
× 10-6
] x + [-1.2 (± 0.1)], with a correlation coefficient of 0.9976 (n = 7).
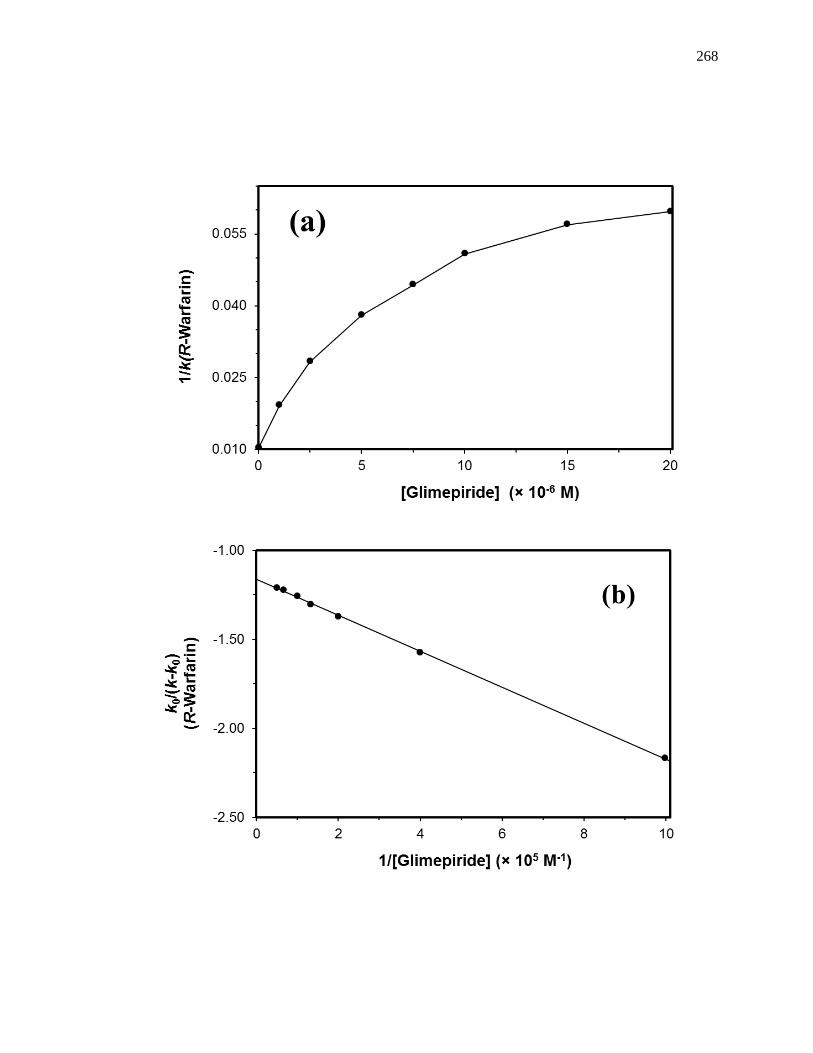
268
269
allosteric interaction between glimepiride and R-warfarin [26].
𝑘0
𝑘 − 𝑘0=
1
𝛽I→A − 1∙ (
1
𝐾aI[I]+ 1) (6)
The term k0 in Eq. (6) is the retention factor for the injected probe (A, which was R-
warfarin in this case) in the presence of no competing agent, and k is the retention factor
for the same probe in the presence of a given mobile phase concentration of the
competing agent (I, which was glimepiride in this experiment). The term KaI is the
association equilibrium constant for the competing agent at the site at which it is binding
during the allosteric interaction. The allosteric effect of this competing agent on binding
by the probe to the immobilized agent is described by the coupling constant βI
A. A
value of βI
A that is greater than zero but less than 1 indicates that a negative allosteric
effect is present between I and A [26]. A positive allosteric effect is present when βI
A is
greater than 1, direct competition between the probe and competing agent is present when
βI
A is equal to 0, and no competition is present when βI
A is equal to 1 [26]. According
to Eq. (6), a linear response should be obtained for any of these systems when a plot is
made of k0/(k - k0) vs. 1/[I]. The slope and intercept from the fit of the data to Eq. (6) can
then be used to determine the value of KaI for the competing agent and the coupling
constant βI
A [26].
Fig. 6-6(b) shows the plot of k0/(k - k0) vs. 1/[Glimepiride] that was obtained
when R-warfarin was injected as a probe onto a normal HSA column. Similar plots were
obtained with the glycated HSA columns. Each of these graphs gave a linear relationship
with correlation coefficients that ranged from -0.9937 to -0.9998 (n = 7). Table 6-2 lists
the association equilibrium constants and coupling constants that were determined from
these plots. The results for normal HSA gave an association equilibrium constant of 5.5
270
(± 0.3) × 105
M-1
for glimepiride and a coupling constant of 0.13 (± 0.01) for its effect on
R-warfarin, which indicated that negative allosteric effects were taking place between
these two solutes. Similar results were obtained for gHSA1 and gHSA2, which gave
association equilibrium constants of 11.5 (± 0.1) × 105
M-1
and 12.4 (± 0.1) × 105
M-1
for
glimepiride, respectively, and coupling constants of 0.14 (± 0.01) and 0.13 (± 0.01).
These KaI values were in the same range as the Ka1 values that were measured for
glimepiride in the frontal analysis studies (see Table 6-1). This similarity indicated that
this interaction site was one of the high affinity regions for glimepiride on normal HSA
and glycated HSA.
A comparison was also made between the results that were obtained according to
Eq. (6) for the normal HSA versus glycated HSA columns. For instance, a 2.1-fold
(110%) increase was observed when comparing the affinity of glimepiride at the site on
normal HSA and gHSA1 that had the allosteric effect on binding by R-warfarin. The
affinity for glimepiride at the same region on gHSA2 was 2.3-fold (125%) higher than it
was for normal HSA. All of these differences were significant at 95% confidence
interval. However, there was no significant difference in the coupling constants between
glimepiride and R-warfarin for these columns.
The next item considered was whether this allosteric effect between glimepiride
and warfarin was occurring at different regions within Sudlow site I or between Sudlow
site I and a separate site on HSA. This was examined by using reverse competition
studies in which glimepiride was now the injected probe and racemic warfarin was used
as the competing agent in the mobile phase. Eqs. (7-8) show how the overall retention
factor (k) for an analyte with more than one possible binding site (e.g., glimepiride) is
271
related to the sum of the retention factors for this analyte at a series of n independent sites
(k1…kn). Eq. (8) is an expanded form of Eq. (7) which also makes it possible to consider
the effects of a competing agent on binding by the analyte at one or more of these sites.
𝑘 = 𝑘1 + … 𝑘𝑛 (7)
𝑘 =𝐾aA1𝑚L1
𝑉M(1+𝐾𝑎I1[I]). . . +
𝐾aA𝑛𝑚L𝑛
𝑉M(1+𝐾𝑎I𝑛[I]) (8)
In these equations, the association equilibrium constants for the analyte at sites 1 through
n are described by KaA1 through KaAn, while KaI1 through KaIn represent the association
equilibrium constants for the competing agent at the same sites.
To examine the interactions of glimepiride at Sudlow site I during these reverse
competition experiments, the measured retention factor for glimepiride was corrected for
the known interactions of this drug at Sudlow site II and at its weak affinity regions.
These corrections were made based on the binding constants that were obtained for these
other regions in Sections 6.3.2 and 6.3.3. The corrected retention factors for glimepiride
were then used along with a plot made according to Eq. (5) to examine the interactions
between warfarin and glimepiride at Sudlow site I. These plots were linear at low
concentrations of warfarin but deviated from linearity at higher concentrations (see
Appendix 6.6). This behavior indicated that warfarin and glimepiride were competing at
Sudlow site I, but that allosteric effects between these two agents were also occurring at
their individual binding regions at this site.
6.3.6 Interactions with the Tamoxifen Site
Previous studies have shown that the binding of warfarin to Sudlow site I is
allosterically-linked to the tamoxifen site of HSA [26,60]. Thus, zonal elution
competition experiments were conducted to see if glimepiride and tamoxifen (i.e., a
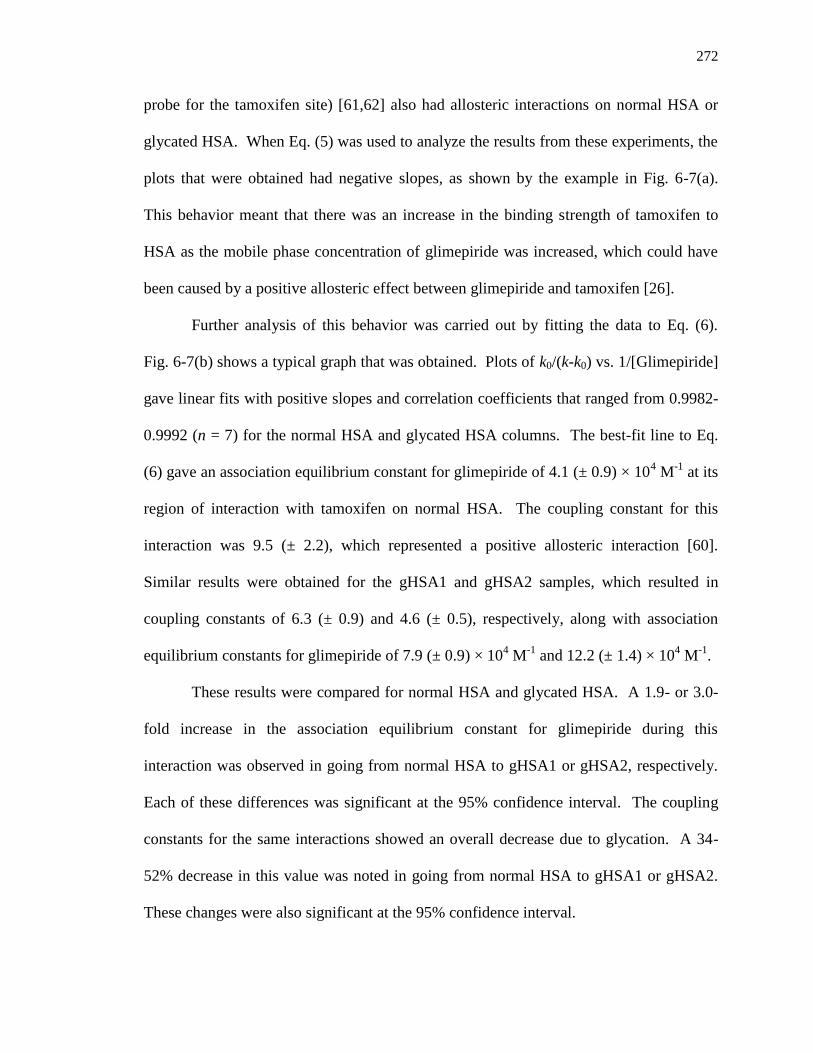
272
probe for the tamoxifen site) [61,62] also had allosteric interactions on normal HSA or
glycated HSA. When Eq. (5) was used to analyze the results from these experiments, the
plots that were obtained had negative slopes, as shown by the example in Fig. 6-7(a).
This behavior meant that there was an increase in the binding strength of tamoxifen to
HSA as the mobile phase concentration of glimepiride was increased, which could have
been caused by a positive allosteric effect between glimepiride and tamoxifen [26].
Further analysis of this behavior was carried out by fitting the data to Eq. (6).
Fig. 6-7(b) shows a typical graph that was obtained. Plots of k0/(k-k0) vs. 1/[Glimepiride]
gave linear fits with positive slopes and correlation coefficients that ranged from 0.9982-
0.9992 (n = 7) for the normal HSA and glycated HSA columns. The best-fit line to Eq.
(6) gave an association equilibrium constant for glimepiride of 4.1 (± 0.9) × 104 M
-1 at its
region of interaction with tamoxifen on normal HSA. The coupling constant for this
interaction was 9.5 (± 2.2), which represented a positive allosteric interaction [60].
Similar results were obtained for the gHSA1 and gHSA2 samples, which resulted in
coupling constants of 6.3 (± 0.9) and 4.6 (± 0.5), respectively, along with association
equilibrium constants for glimepiride of 7.9 (± 0.9) × 104 M
-1 and 12.2 (± 1.4) × 10
4 M
-1.
These results were compared for normal HSA and glycated HSA. A 1.9- or 3.0-
fold increase in the association equilibrium constant for glimepiride during this
interaction was observed in going from normal HSA to gHSA1 or gHSA2, respectively.
Each of these differences was significant at the 95% confidence interval. The coupling
constants for the same interactions showed an overall decrease due to glycation. A 34-
52% decrease in this value was noted in going from normal HSA to gHSA1 or gHSA2.
These changes were also significant at the 95% confidence interval.
273
Figure 6-7. Zonal elution competition studies using glimepiride as a competing agent
and tamoxifen as an injected probe for the tamoxifen site. These results
were obtained on a 2.0 cm × 2.1 mm i.d. column containing normal HSA.
Other experimental conditions are given in the text. The data from these
experiments were fit to (a) a direct competition model, as described by Eq.
(5), or (b) an allosteric model, as described by Eq. (6). Each point is the
average of four values with relative standard deviations that ranged from
(a) ± 0.8-6.8% or (b) ± 1.5-32%. The equation for the best-fit solid line in
(b) is y = [2.9 (± 0.1) × 10-6
] x + [1.2 (± 0.1) × 10-1
], with a correlation
coefficient of 0.9991 (n = 7).
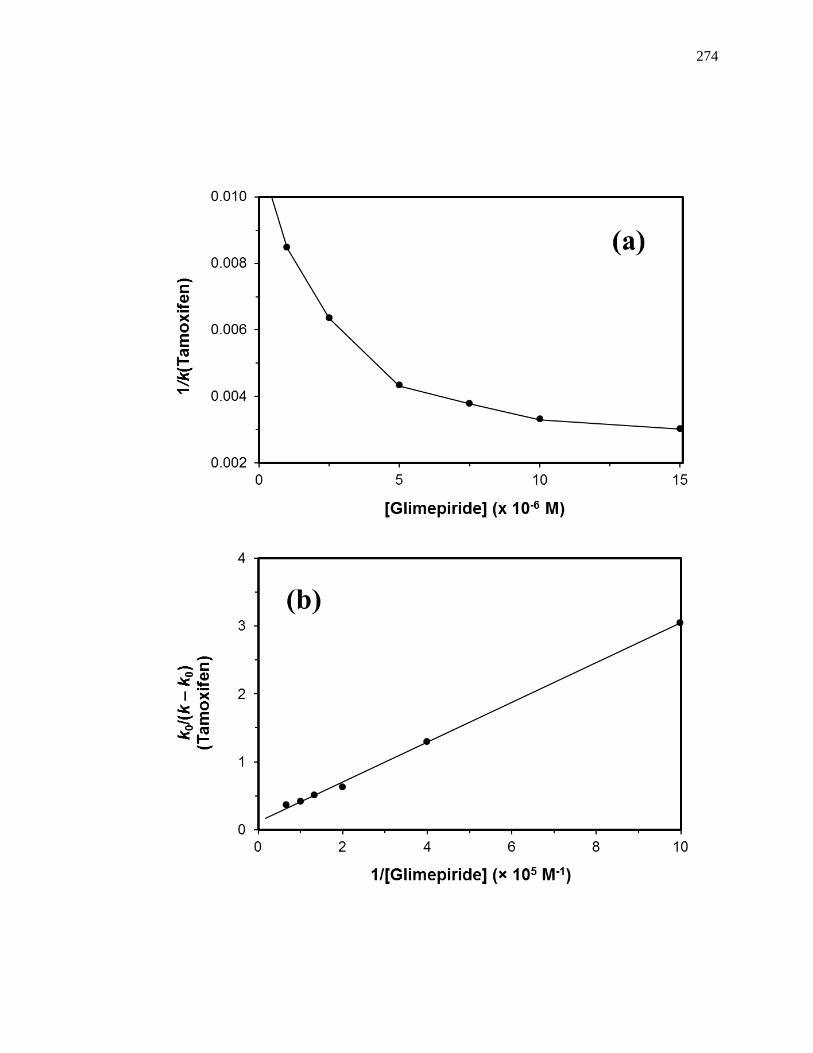
274
275
The interaction between glimepiride and the tamoxifen site on normal HSA and
glycated HSA was further investigated by using reverse competition studies, in which
glimepiride was the injected probe and tamoxifen was the competing agent. Corrections
to the overall retention factor for glimepiride for the interactions of this drug at Sudlow
site II and its weak affinity regions were again made, as described in the previous section,
and plots were prepared according to Eq. (5). These graphs gave non-linear relationships
for all of the normal HSA and glycated HSA columns (see Appendix 6.6), which
confirmed that allosteric interactions were taking place between glimepiride and
tamoxifen during their binding to these columns.
6.4 Conclusion
This chapter explored the use of HPAC to examine the binding of glimepiride, a
third- generation sulfonylurea drug, to normal HSA and HSA with various levels of in
vitro glycation. Previous studies based on fluorescence spectroscopy have suggested that
glimepiride is capable of interacting at both Sudlow sites I and II of normal HSA [46].
The use of HPAC allowed a more detailed analysis of these interactions and for these
studies to be extended to glycated HSA. Frontal analysis, which was used to study the
overall interactions of glimepiride with normal HSA and glycated HSA, indicated that
glimepiride had a set of both high affinity sites (Ka, 9.2-11.8 × 10⁵ M
-1) and lower affinity
regions (Ka, 5.9-16 × 103 M
-1) on these proteins.
Site-specific studies were also conducted through the use of zonal elution
competition experiments. A summary of the results that were obtained is given in Fig. 6-
8. Glimepiride was found to bind to Sudlow site II with an association equilibrium
constant of 4.2 × 10⁵
M-1
for normal HSA. No significant changes in this affinity were
276
Figure 6-8. Summary of the association equilibrium constants, coupling constants and
binding sites for glimepiride in its interactions with HSA. The values for
normal HSA are provided first for reference, followed by the range of
values that were measured for gHSA1 and gHSA2, as given in
parentheses. The Ka values that are provided for Sudlow site I are based
on the best-fit values that were obtained from Eq. (6).
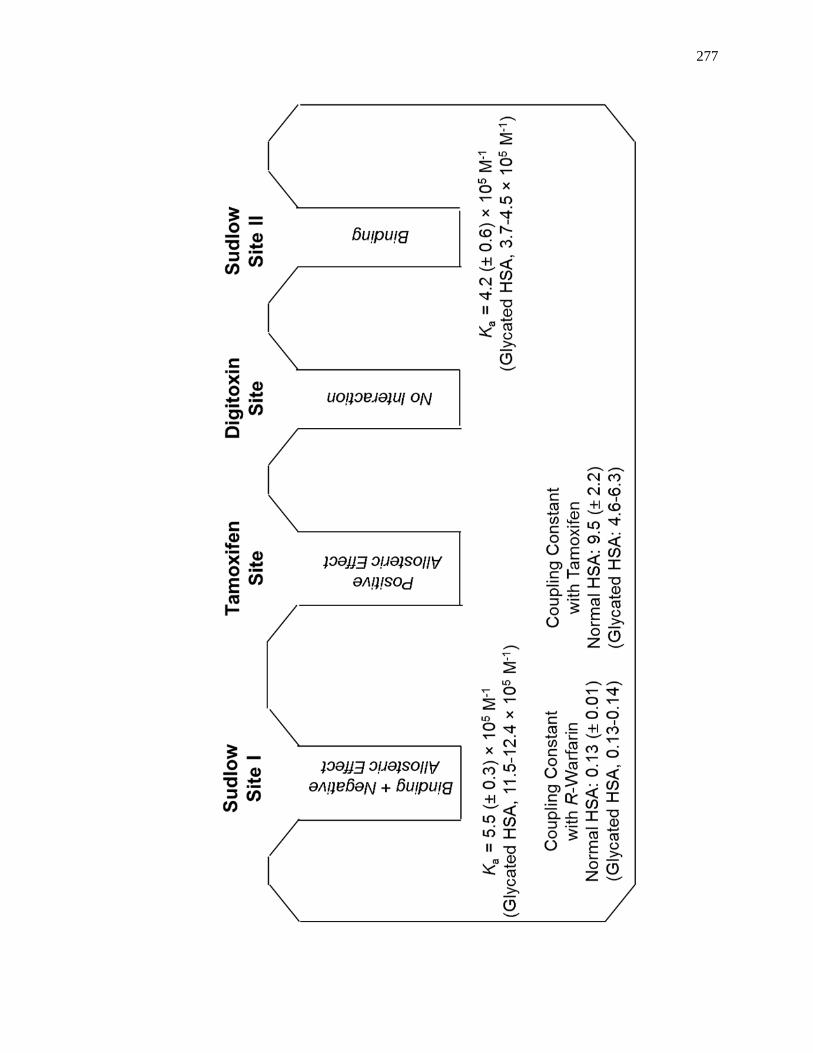
277
278
observed for moderately glycated HSA; however, a small decrease in affinity was
observed for more highly glycated HSA. No interactions were found for glimepiride at
the digitoxin site of normal HSA or glycated HSA. Results from the competition studies
at Sudlow site I indicated that negative allosteric interactions were occurring between
glimepiride and R-warfarin, which was used as a probe for this site. Based on these
competition studies, the association equilibrium constant for glimepiride at Sudlow site I
was estimated to be 5.5 × 10⁵
M-1
for normal HSA, with around a two-fold increase in
affinity being noted for glycated HSA. Glimepiride was also found to have positive
allosteric interactions with the tamoxifen site of HSA.
Changes in these interactions are of interest because they could have an effect on
the free fraction, or effective dose, of such a drug when it is used to treat type II diabetes
[6-13]. The results of this study also demonstrate how HPAC can be used to examine
complex drug-protein interactions. The methods that were used here to profile the
binding of glimepiride with normal HSA and glycated HSA are not limited to this drug or
type of protein but could also be adapted for use with other drugs and types of modified
proteins.
6.5 References
1. E. Gale, Glimepiride. Review of the first available 3rd generation sulphonylurea,
Practical Diabetes International 16 (1999) S1-S3.
2. R.M. Zavod, J.L. Krstenansky, B.L. Currie, in: T.L. Lemke, D.A. Williams
(Eds.), Foye’s of Medicinal Chemistry. Lippincott Williams and Wilkins,
Philadelphia, 2008, Chap. 32.
3. D. W. Foster, in: K.J. Isselbacher, E. Braunwald, J.D. Wilson, J.B. Martin, A.S.
279
Fauci, D.L. Kasper (Eds.), Harrison’s Principles of Internal Medicine, McGraw-
Hill, New York, 1998, Chap. 29.
4. M.G. Jakoby, D.F. Covey, D.P. Cistola, Localization of tolbutamide binding sites
on human serum albumin using titration calorimetry, Biochemistry 34 (1995)
8780-8787.
5. K.S. Joseph, D.S. Hage, Characterization of the binding of sulfonylurea drugs to
HSA by high-performance affinity chromatography, J. Chromatogr. B 878 (2010)
1590-1598.
6. K.S. Joseph, J. Anguizola, A.J. Jackson, D.S. Hage, Chromatographic analysis of
acetohexamide binding to glycated human serum albumin, J. Chromatogr. B 878
(2010) 2775–2781.
7. K.S. Joseph, J. Anguizola, D.S. Hage, Binding of tolbutamide to glycated human
serum albumin, J. Pharm. Biomed. Anal. 54 (2011) 426–432.
8. K.S. Joseph, D.S. Hage, The effects of glycation on the binding of human serum
albumin to warfarin and L-tryptophan, J. Pharm. Biomed. Anal. 53 (2010) 811-
818.
9. R. Matsuda, J. Anguizola, K.S. Joseph, D.S. Hage, High-performance affinity
chromatography and the analysis of drug interactions with modified proteins:
binding of gliclazide with glycated human serum albumin, Anal. Bioanal. Chem.
401 (2011) 2811-2819.
10. R. Matsuda, J. Anguizola, K.S. Joseph, D.S. Hage, Analysis of drug interactions
with modified proteins by high-performance affinity chromatography: binding of
glibenclamide to normal and glycated human serum albumin, J. Chromatogr. A
280
1265 (2012) 114-122.
11. J. Anguizola, K.S. Joseph, O.S. Barnaby, R. Matsuda, G. Alvarado, W. Clarke,
R.L. Cerny, D.S. Hage, Development of affinity microcolumns for drug-protein
binding studies in personalized medicine: interactions of sulfonylurea drugs with
in vivo glycated human serum albumin, Anal. Chem. 85 (2013) 4453-4460.
12. A.J. Jackson, J. Anguizola, E.L. Pfaunmiller, D.S. Hage, Use of entrapment and
high-performance affinity chromatography to compare the binding of drugs and
site-specific probes with normal and glycated human serum albumin, Anal.
Bioanal. Chem. 405 (2013) 5833-5841.
13. J. Anguizola, R. Matsuda, O.S. Barnaby, K.S. Joseph, C. Wa, E. Debolt, M.
Koke, D.S. Hage, Review: glycation of human serum albumin, Clin. Chim. Acta
425 (2013) 64–76.
14. T. Peters, Jr. All About Albumin: Biochemistry, Genetics, and Medical
Applications. Academic Press, San Diego, 1996.
15. N.W. Tietz (Ed.), Clinical Guide to Laboratory Tests, 2nd ed., Saunders,
Philadelphia, 1990.
16. G. Colmenarejo, In silico prediction of drug-binding strengths to human serum
albumin, Med. Res. Rev. 23 (2003) 275-301.
17. M. Otagiri, A molecular functional study on the interactions of drugs with plasma
proteins, Drug Metab. Pharmacokinet. 20 (2005) 309-323.
18. S. Curry, H. Mandelkow, P. Brick, N. Franks, Crystal structure of human serum
albumin complexed with fatty acid reveals an asymmetric distribution of binding
sites. Nature Struct. Biol. 5(1998) 827-835.
281
19. G.A. Ascoli, E. Domenici, C. Bertucci, Drug binding to human serum albumin:
abridged review of results obtained with high-performance liquid chromatography
and circular dichroism, Chirality 18 (2006) 667–679.
20. G. Sudlow, D.J. Birkett, D.N. Wade, Characterization of two specific drug
binding sites on human serum albumin, Mol. Pharmacol. 11(1975) 824–832.
21. G. Sudlow, D.J. Birkett, D.N. Wade, Further characterization of specific drug
binding sites on human serum albumin, Mol. Pharmacol. 12 (1976) 1052–1061.
22. B. Loun, D.S. Hage, Chiral separation mechanisms in protein-based HPLC
columns. I. Thermodynamic studies of (R)- and (S)-warfarin binding to
immobilized human serum albumin, Anal. Chem. 66 (1994) 3814-3822.
23. J. Yang, D.S. Hage, Characterization of the binding and chiral separation of D-
and L-tryptophan on a high-performance immobilized human serum albumin
column, J. Chromatogr. 645 (1993) 241-250.
24. A. Sengupta D.S. Hage, Characterization of the binding of digitoxin and
acetyldigitoxin to human serum albumin by high-performance affinity
chromatography, J. Chromatogr. B 725 (1999) 91-100.
25. D.S. Hage, A. Sengupta, Studies of protein binding to non-polar solutes by using
zonal elution and high-performance affinity chromatography: interactions of cis-
and trans-clomiphene with human serum albumin in the presence of β-
cyclodextrin. Anal. Chem. 70 (1998) 4602-4609.
26. J. Chen, D.S. Hage, Quantitative studies of allosteric effects by biointeraction
chromatography: analysis of protein binding for low-solubility, Anal. Chem. 2006
78 2672-2683.
282
27. R. Matsuda, S. Kye, J. Anguizola, D.S. Hage, Studies of drug interactions with
glycated human serum albumin by high-performance affinity chromatography,
Rev. Anal. Chem. 33 (2014) 79-94.
28. X. Zheng, R. Matsuda, D.S. Hage, Analysis of free drug fractions by ultrafast
affinity extraction: interactions of sulfonylurea drugs with normal or glycated
human serum albumin, J. Chromatogr. A 1371 (2014) 82-89.
29. D.L. Mendez, R.A. Jensen, L.A. McElroy, J.M. Pena, R.M. Esquerra, The effect
of non-enzymatic glycation on the unfolding of human serum albumin, Arch.
Biochem. Biophys. 444 (2005) 92-99.
30. H. Koyama, N. Sugioka, A. Uno, S. Mori, K. Nakajima, Effects of glycosylation
of hypoglycemic drug binding to serum albumin, Biopharm. Drug Dispos. 18
(1997) 791-801.
31. R.L. Garlick, J.S. Mazer, The principal site of nonenzymatic glycosylation of
human serum albumin in vivo, J. Biol. Chem. 258 (1983) 6142-6146.
32. N. Iberg, R. Fluckiger, Nonenzymatic glycosylation of albumin in vivo, J. Biol.
Chem. 261 (1986) 13542-13545.
33. K. Nakajou, H. Watanabe, U. Kragh-Hansen, T. Maruyama, M. Otagiri, The
effect of glycation on the structure, function and biological fate of human serum
albumin as revealed by recombinant mutants, Biochim. Biophys. Acta 1623
(2003) 88-97.
34. H.V. Roohk, A.R. Zaidi, A review of glycated albumin as an intermediate
glycation index for controlling diabetes, J. Diabetes Sci. Technol. 2 (2008) 1114-
1121.
283
35. C.Wa, R. Cerny, D.S. Hage, Obtaining high sequence coverage in matrix-assisted
laser desorption time-of-flight mass spectrometry for studies of protein
modification: analysis of human serum albumin as a model, Anal. Biochem. 349
(2006) 229-241.
36. O.S. Barnaby, R.L. Cerny, W. Clarke, D.S. Hage, Comparison of modification
sites formed on human serum albumin at various stages of glycation, Clin. Chim.
Acta 412 (2011) 277-285.
37. O.S. Barnaby, R.L. Cerny, W. Clarke, D.S. Hage, Quantitative analysis of
glycation patterns in human serum albumin using 16
O/18
O-labeling and MALDI-
TOF MS, Clin. Chim. Acta 412 (2011) 1606-1615.
38. J.E. Schiel, K.S. Joseph, D.S. Hage, in: N. Grinsberg, E. Grushka (Eds.), Adv.
Chromatogr., Taylor & Francis, New York, 2010, Chap. 4.
39. D.S. Hage, High-performance affinity chromatography: a powerful tool for
studying serum protein binding, J. Chromatogr. B 768 (2002) 3-30.
40. S. Patel, I.W. Wainer, W.J. Lough, in: D.S. Hage (Ed.), Handbook of Affinity
Chromatography, 2nd
ed., Taylor & Francis, New York, 2006, Chap. 24.
41. D.S. Hage, J. Anguizola, O, Barnaby, A. Jackson, M.J. Yoo, E. Papastavros, E.
Pfaunmiller, M. Sobansky, Z. Tong, Characterization of drug interactions with
serum proteins by using high-performance affinity chromatography, Curr. Drug
Metab. 12 (2011) 313-328.
42. X. Zheng, Z. Li, S. Beeram, M. Podariu, R. Matsuda, E.L. Pfaumiller, C.J. White
II, N. Carter, D.S. Hage, Analysis of biomolecular interactions using affinity
microcolumns: a review, J. Chromatogr. B 968 (2014) 49-63
284
43. G.X. Yang, X. Li, M. Synder, Investigating metabolite-protein interactions: an
overview of available techniques, Methods 57 (2012) 459-466.
44. R. Matsuda, C. Bi, J. Anguizola, M. Sobansky, E. Rodriguez, J. Vargas-Badilla,
X. Zheng, B.D. Hage, D.S. Hage, Studies of metabolite-protein interactions: a
review, J. Chromatogr. B 966 (2014) 48-58
45. A. Frick, H. Moller, E. Wirbitzki, Biopharmaceutical characterization of oral
immediate release drug products. in vitro/in vivo comparison of
phenoxymethylpenicillin potassium, glimepiride, and levofloxacin, Eur. J. Pharm.
Biopharm. 46 (1998) 305-311/
46. N. Seeder, M. Kanojia, Mechanism of interaction of hypoglycemic agents
glimepiride and glipizide with human serum albumin, Cent. Eur. J. Chem. 7
(2009) 96-1041.
47. K. Inukai, M. Watanabe, Y. Nakashima, N. Takata, A. Isoyama, T. Sawa, S.
Kurihara, T. Awata, S. Katayama, Glimepiride enhances peroxisome proliferator-
activated receptor-gamma activity in 3T3-L1 adipocytes, Biochem. Biophys. Res.
Commun. 328 (2005) 484-490.
48. P. Ma, B. Gu, J. Ma, L. E, X. Wu, J. Cao, H. Liu, Glimepiride induces
proliferation and differentiation of rat osteoblasts via P13-kinease/Akt pathway,
Metabolism 59 (2010) 359-366.
49. A. Lapolla, D. Fedele, R. Reitano, N.C. Arico, R. Seraglia, P. Traldi, E. Marotta,
R. Tonani, Enzymatic digestion and mass spectrometry in the study of advance
glycation end products/peptides, J. Am. Soc. Mass Spectrom. 25 (2004) 496-509.
50. K.A. Ney, K.J. Colley, S.V. Pizzo, The standardization of the thiobarbituric acid
285
assay for nonenzymatic glucosylation of human serum albumin, Anal. Biochem.
118 (1981) 294-300.
51. R.R. Walters, High-performance affinity chromatography: pore-size effects, J.
Chromatogr. A 249 (1982) 19-28.
52. P.O. Larsson, High-performance liquid affinity chromatography, Methods
Enzymol. 104 (1984) 212-223.
53. H.S. Kim, D.S. Hage, Immobilization methods for affinity chromatography, In
Handbook of Affinity Chromatography; 2nd
Ed., Hage, D.S. (Ed.), Taylor &
Francis, New York, 2006, Chap. 3.
54. C. Wa, R.L. Cerny, D.S. Hage, Identification and quantitative studies of protein
immobilization sites by stable isotope labeling and mass spectrometry, Anal.
Chem. 78 (2006) 7967-7977.
55. K.S. Joseph, A.C. Moser, S. Basiaga, J.E. Schiel, D.S. Hage, Evaluation of
alternatives to warfarin as probes for Sudlow site I of human serum albumin:
characterization by high-performance affinity chromatography, J. Chromatogr. A
1216 (2009) 3492–3500.
56. S.H. Yalkowsky, R.M. Dannenfelser. Aquasol Database of Aqueous Solubility,
Ver. 5, Univ. Ariz., Tucson, 1992.
57. I.V. Teko, V.Y. Tanchuk, T.N. Kasheva, A.E. Villa, Estimation of aqueous
solubility of chemical compounds using E-state indices, J. Chem. Inf. Comput.
Sci. 41 (2001) 1488-1493.
58. R. Matsuda, J. Anguizola, K.S. Hoy, D.S. Hage, Analysis of drug-interactions by
high-performance affinity chromatography: interactions of sulfonylurea drugs
286
with normal and glycated human serum albumin, Methods, 1286 (2015) 255-277.
59. M.L. Conrad, A.C. Moser, D.S. Hage, Evaluation of indole-based probes for high-
throughput screening of drugs binding to human serum albumin: analysis by high-
performance affinity chromatography, J. Sep. Sci. 32 (2009) 1145-1155.
60. J. Chen, D.S. Hage, Quantitative analysis of allosteric drug-protein binding by
biointeraction chromatography, Nature Biotech. 22 (2004) 1445-1447.
61. I. Sjoholm, In Drug-Protein Binding, M.M. Reidenburg, S. Erill (Eds.) Praeger,
New York, 1986.
62. A. Sengupta, D.S. Hage, Characterization of minor probes for human serum
albumin by high-performance affinity chromatography, Anal. Chem. 17 (1999)
3821-3827.
6.6 Appendix
6.6.1 Reverse Competition Studies using Glimepiride and Warfarin
The retention factor for glimepiride at Sudlow site II was determined by using the
binding constants found in the competition studies with L-tryptophan, as are provided in
Table 6-2. The retention factor for glimepiride at its weak affinity sites was determined
from the binding parameters and frontal analysis experimental results that are shown in
Table 6-1. Binding at Sudlow site II made up between 6 and 71% of the total retention
factor measured for glimepiride in the presence of the various concentrations of warfarin
that were present in the mobile phase during the reverse competition studies. The
contribution of the weak affinity interactions made up 2 to 20% of the total retention for
glimepiride under the same conditions.
287
An example of a plot of the reciprocal of the corrected retention factor for
glimepiride (1/kGlimepiride,Corrected) versus the concentration of warfarin in the mobile phase
is shown in Fig. 6-9. A linear region was seen in these plots at low warfarin
concentrations, which gave correlation coefficients ranging from 0.9788 to 0.9999 (n = 4)
for the normal and glycated HSA columns. The association equilibrium constants that
were estimated from this region for warfarin were 1.5 (± 0.1) × 105 M
-1 for normal HSA,
1.6 (± 0.1) × 105 M
-1 for gHSA1, and 2.3 (± 0.4) × 10
5 M
-1 for gHSA2. These values
were comparable to previously-reported association equilibrium constants of 2.3-2.7 ×
105 M
-1 for warfarin at Sudlow site I of normal HSA or glycated HSA [8,22]. This
confirmed that both glimepiride and warfarin were binding to and competing at Sudlow
site I under these conditions. However, non-linear behavior was seen at higher warfarin
concentrations, which supported a model in which allosteric interactions were also
occurring between the binding regions for glimepiride and warfarin within Sudlow site I.
6.6.2 Reverse Competition Studies using Glimepiride and Tamoxifen
Reverse competition studies were also conducted with glimepiride and tamoxifen.
The retention factor for glimepiride in the presence of tamoxifen was again corrected by
subtracting the contribution from Sudlow site II, as determined from the binding
parameters in Table 6-2, and the contribution from the weak affinity sites for glimepiride,
as determined by using the binding parameters in Table 6-1. Between 6 and 40% of the
total retention factor for glimepiride during the reverse competition studies was due to
binding by this drug at Sudlow site I, while the weak affinity regions contributed to 1 to
10%. As shown in Fig. 6-10, a plot of 1/kGlimepiride,Corrected versus the concentration of
tamoxifen resulted in a non-linear relationship. This behavior confirmed that allosteric
288
Figure 6-9. Plot of 1/(kGlimepiride,Corrected) versus the concentration of warfarin in the
mobile phase during a reverse competition study. The error bars represent
a range of ± 1 S.D. Each point is the average of four values with relative
standard deviations that ranged from ± 0.4-7.5%.

289
290
Figure 6-10. Plot of 1/(kGlimepiride,Corrected) versus the concentration of tamoxifen in the
mobile phase during a reverse competition study. The error bars represent
a range of ± 1 S.D. Each point is the average of four values with relative
standard deviations that ranged from ± 0.5-10.2%.
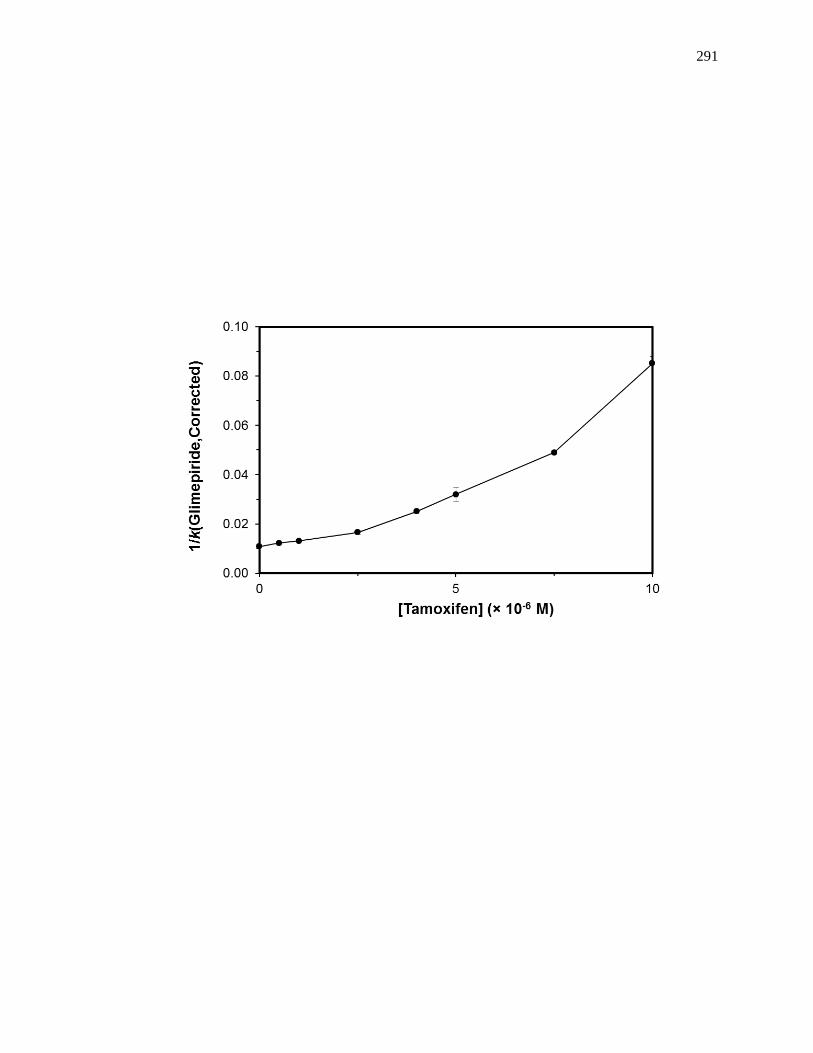
291
292
effects were present during the interactions of tamoxifen and glimepiride with normal
HSA or glycated HSA.
293
CHAPTER 7:
ANALYSIS OF DRUG-PROTEIN BINDING USING ON-LINE
IMMUNOEXTRACTION AND HIGH-PERFORMANCE AFFINITY
CHROMATOGRAPHY: STUDIES WITH NORMAL AND
GLYCATED HUMAN SERUM ALBUMIN
7.1 Introduction
Drugs, low mass hormones, and fatty acids are commonly distributed throughout
the body through their binding to serum transport proteins such as human serum albumin
(HSA) [1]. HSA is the most abundant protein in plasma and accounts for approximately
60% of the total protein content in serum [1,2]. HSA has a molecular weight of 66.5 kDa
and consists of 585 amino acids [3,4]. There are two major binding sites on HSA,
Sudlow sites I and II [1,3-6]. Sudlow site I is found in subdomain IIA of HSA and is
known to bind to anticoagulant drugs such as warfarin and anti-inflammatory drugs such
as azapropazone [1,3,7]. Sudlow site II is found in subdomain IIIA and binds to drugs
such as ibuprofen, as well as the essential amino acid L-tryptophan [1,3,8].
Recent studies have shown that proteins like HSA can be affected by diseases
such as diabetes [9-29]. Diabetes results in elevated levels of glucose in the bloodstream
and can lead to the non-enzymatic glycation of proteins, which is the result of the
addition of reducing sugars to free amine groups on a protein. This reaction initially
forms a reversible Schiff base; this product can later rearrange to form a more stable
Amadori product [11-16,30,31]. Modifications caused by glycation can occur at or near
Sudlow sites I and II [3,27-30]. Patients with diabetes have been shown to have a 2- to
5-fold increase in the amount of HSA that is present in the glycated form when compared
294
to healthy individuals [33]. Recent studies have examined the effects of glycation on the
structure and function of HSA and have found that glycation can have an effect on the
affinity of various sulfonylurea drugs for this protein [18-26].
High-performance affinity chromatography (HPAC) is a liquid chromatographic
technique that utilizes an immobilized biological molecule as a stationary phase [34-36].
HPAC is commonly used for the separation, purification or analysis of specific analytes;
however, HPAC can also be utilized to examine drug-protein interactions [34-36]. These
types of studies have resulted in the determination of drug-binding parameters by HPAC
that are comparable to those obtained by commonly-used reference methods such as
ultrafiltration [34-36]. It has also been found that HPAC can be used with covalently
immobilized samples of HSA and glycated HSA to determine the effects of non-
enzymatic glycation on drug interactions with these proteins [18-26].
Immunoextraction is a method in which immobilized antibodies against a given
target compound are used to isolate this target from a sample [37]. Antibodies are
glycoproteins that have highly selective interactions with their targets (or antigens) and
are part of the normal immunological response to foreign agents [38]. Due to their high
specificity and strong binding, antibodies are often used for the purification and isolation
of biologically-related targets such as proteins, hormones, and enzymes [37,38]. For
instance, antibodies have been used in low-performance supports for the selective
isolation of HSA and glycated HSA from serum or plasma samples, such as those
acquired from patients who suffer from diabetes [23].
The purpose of this study is to develop and examine an automated and on-line
route for examining drug-protein interactions with normal or modified proteins. HSA
295
and glycated HSA will be used as model proteins for this work. Fig. 7-1 shows the
general scheme for the method that will be developed and tested in this chapter. First,
antibodies against the desired proteins (e.g., polyclonal anti-HSA antibodies) will be
immobilized onto a support that is suitable for use in HPAC. Next, this support will be
placed into a column and used for the extraction and isolation of the desired target protein
(e.g., HSA or glycated HSA) from applied samples. The resulting column containing the
extracted and adsorbed protein will then be tested for use in various formats that are often
utilized in examining drug-protein binding by HPAC. For instance, frontal analysis will
be used to examine the overall affinity and binding capacity for each type of adsorbed
protein for some model drugs, while zonal elution competition studies will be used to
examine site-specific changes in the binding of drugs to specific sites (e.g., at Sudlow
sites I and II) on the absorbed protein. Information from these experiments should make
it possible in the future to modify this approach for work with other proteins or modified
binding agents that are of interest in clinical or pharmaceutical studies or biomedical
research.
7.2 Experimental
7.2.1 Materials
The polyclonal anti-HSA antibodies (goat, fractionated antiserum, lyophilized),
Goat IgG (reagent grade, ≥95% (SDS-PAGE), essentially salt-free, lyophilized powder)
protein G Sepharose (recombinant protein expressed in E. coli, support in aqueous
ethanol suspension), HSA (essentially fatty acid free, ≥ 96%), gliclazide (≥ 99.9%),
racemic warfarin (≥ 98%), L-tryptophan (≥ 98%), D(+)-glucose (99.5%), and sodium
azide (> 95%) were purchased from Sigma-Aldrich (St. Louis, MO, USA). Nucleosil Si-
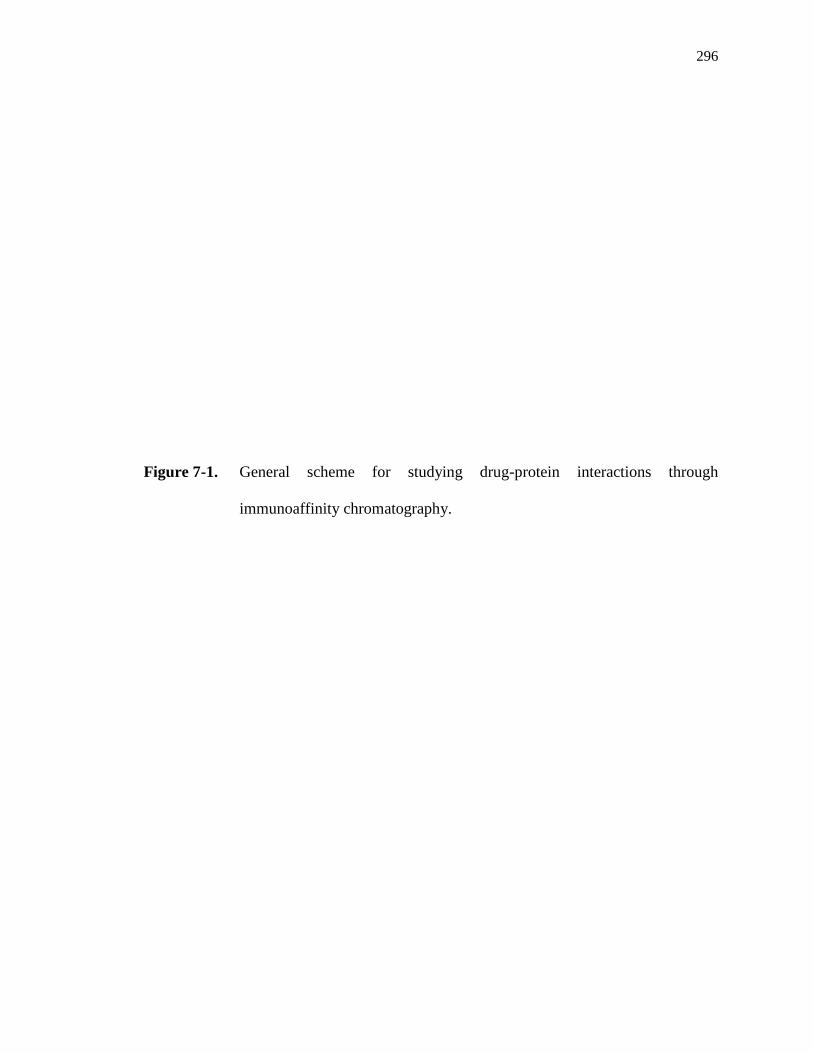
296
Figure 7-1. General scheme for studying drug-protein interactions through
immunoaffinity chromatography.
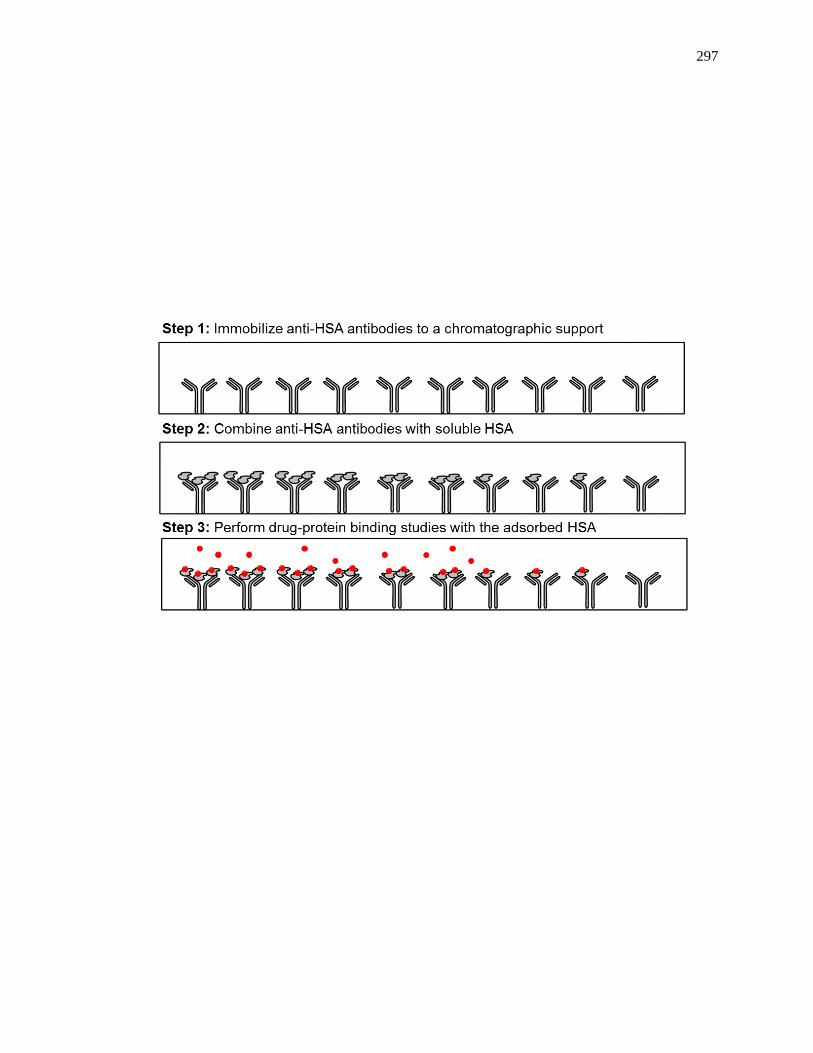
297
298
1000 (7 µm particle diameter, 300 Å particle size) was obtained from Macherey-Nagel
(Duren, Germany). Reagents for the bicinchoninic acid (BCA) protein assay were from
Pierce (Rockford, IL, USA). The fructosamine assay kit was purchased from Diazyme
Laboratories (San Diego, CA, USA). All aqueous solutions were prepared using water
from either a NANOpure system (Barnstead, Dubuque, IA, USA) or a Milli-QAdvantage
A 10 system (EMD Millipore Corporation, Billerica, MA, USA) and filtered through 0.20
µm GNWP nylon membranes from Millipore.
7.2.2 Instrumentation
The chromatographic system consisted of a DC-2080 degasser, two PU-2080
pumps, an AS-2057 autosampler, a CO-2060 column oven, and a UV-2075 absorbance
detector from Jasco (Tokyo, Japan). This system also included a Rheodyne Advantage
PF six-port valve (Cotati, CA, USA). EZ Chrom Elite software v.3.21 (Scientific
Software, Pleasonton, CA, USA) and Jasco Chrom Nav software (Tokyo, Japan) were
used for system control. Chromatographic data were analyzed by using PeakFit 4.12
(Jandel Scientific Software, San Rafael, CA, USA) and Microsoft Excel (Microsoft,
Redmond, WA, USA). Non-linear regression was carried out by using DataFit 8.1.69
(Oakdale, PA, USA).
7.2.3 Antibody purification
The anti-HSA polyclonal antibodies were isolated from goat anti-HSA serum by
using protein G Sepharose (see Appendix 7.6.2 for a schematic of this approach and notes
on the selectivity of this isolation method). Prior to use, the protein G Sepharose was
provided commercially in an aqueous ethanol suspension. This suspension was washed 5
299
times with water and three times with pH 7.4, 0.067 M potassium phosphate buffer, as
described by the manufacturer’s preparation procedure to remove the storage solvent. A
100 mg portion of the lyophilized anti-HSA goat serum was dissolved in 2 mL of pH 7.4,
0.067 M potassium phosphate buffer and added to approximately 2 mg of the prepared
protein G Sepharose support. The sample and support were allowed to mix for 2 h at
room temperature, followed by centrifugation at 7500 rpm for 5 min. The non-retained
serum components that remained in solution were removed by decanting. The support
was washed with 2 mL of pH 7.4, 0.067 M potassium phosphate buffer prior to another
centrifugation and decanting step. This step was repeated twice. Three 1 mL portions of
pH 2.5, 0.10 M potassium phosphate buffer were added to and mixed with this support to
release anti-HSA antibodies that were bound to the protein G Sepharose, with each
addition of this buffer being followed by another centrifugation step and collection of the
supernatant.
The collected supernatants were pooled and adjusted to pH 6.0 by slowly adding a
small amount of pH 8.0, 0.10 M potassium phosphate buffer. After adjusting its pH, the
solution of antibodies was immediately used for immobilization, as described in Section
7.2.4. A BCA assay was used in triplicate with goat IgG as the standard to determine the
amount of antibodies that were obtained from the goat anti-serum by using the protein G
Sepharose for their isolation. The results indicated that 100 mg of the goat serum
resulted in 39.3 (± 0.1) mg of isolated antibodies.
7.2.4 Preparation of immunoextraction columns
Nucleosil Si-1000 was converted into a diol-bonded form according to the
literature [39]. The anti-HSA antibodies that were isolated in Section 7.2.3 were
300
immobilized onto this support by using the Schiff base method, which was conducted
according to previous methods [40-43]. A control support was prepared in the same
manner but with only buffer and no antibody solution being added during the
immobilization step. The final immunoextraction support was stored in pH 7.4, 0.067 M
potassium phosphate buffer at 4 °C until further use.
A BCA assay was performed in triplicate to determine the antibody content of the
final immunoextraction support. The goat anti-serum containing the anti-HSA polyclonal
antibodies was used as the standard in which the actual amount of anti-HSA antibodies
was corrected by using the value determined in from the BCA assay experiment in
section 7.2.2. The control support was used as the blank. For this assay, the
immunoextraction support containing the immobilized anti-HSA antibodies and the
control support were dissolved in pH 7.4, 0.067 M potassium phosphate buffer. The
average protein content for two batches of the immunoextraction support was 28.1 (± 2.1)
mg antibodies/g silica, with a range of 23 to 34 mg antibodies/g silica. This value is a
corrected value based on the actual content of the isolated antibodies.
The immunoextraction and control supports were downward slurry packed into
separate 1.0 cm or 2.0 cm × 2.1 mm I.D. columns at 4000 psi (28 MPa) using pH 7.4,
0.067 M potassium phosphate buffer as the packing solution. The packed columns were
stored at 4 °C in the same pH 7.4 potassium phosphate buffer. Each column was used for
500 sample applications or less and was routinely washed with pH 7.4, 0.067 M
potassium phosphate buffer.
7.2.5 Preparation of glycated HSA
The glycated HSA sample was prepared in vitro by using a previous procedure
301
[22,42,43]. This sample was prepared in sterile pH 7.4, 0.20 M potassium phosphate
buffer that also contained 1 mM sodium azide (i.e., an antibacterial agent) and 10 mM D-
glucose in the presence of 42 g/L (0.63 mM) HSA (i.e., a typical HSA concentration
found in humans under normal physiological conditions). This solution was allowed to
incubate at 37 °C for 4 weeks. After incubation, the protein preparation was lyophilized
and stored at -80 °C until further use. A portion of this preparation was analyzed by a
fructosamine assay to determine the glycation level of the modified HSA [22]. This level
of glycation was 3.20 (± 0.13) mol hexose/mol HSA, which is similar to that obtained in
prior binding studies also involving in vitro glycated HSA [22].
7.2.6 Evaluation of immunoextraction columns
All solutions and samples used in the chromatographic studies described here and
in Section 7.2.7 were prepared in pH 7.4, 0.067 M potassium phosphate buffer. This
buffer was also used as the application buffer. All drug solutions and mobile phases were
filtered using a 0.2 µM nylon filter and degassed for 10-15 min prior to use in
chromatographic studies. The warfarin solutions were used within one week of
preparation [45], the gliclazide solutions were used within two weeks of preparation [20],
and the L-tryptophan solutions were prepared fresh daily [46]. All chromatographic
experiments were performed at 37 °C.
The binding capacity for the immunoextraction columns was determined by
frontal analysis [34,45], using solutions containing 5.0 µM HSA or glycated HSA in pH
7.4, 0.067 M potassium phosphate buffer. The anti-HSA immunoextraction column was
first equilibrated with the pH 7.4 phosphate buffer at 0.10 mL/min. A switch was then
made to apply the HSA or glycated HSA solution at 0.10 mL/min. This resulted in the
302
formation of a breakthrough curve, which was monitored at 280 nm [34,35].
Chromatograms for these studies can be found in the Appendix 7.6.3. These experiments
were performed in quadruplicate, with the central location of each breakthrough curve
being determined by using the equal area method [34,35]. A pH 2.5, 0.10 M potassium
phosphate buffer was used to elute the adsorbed HSA or glycated HSA, and pH 7.4,
0.067 M potassium phosphate buffer was used to regenerate the column prior to
additional studies. Similar experiments were performed on a control column to correct
for the system void time and any non-specific binding of the HSA or glycated HSA to the
system. The non-specific binding of these proteins was found to negligible, giving a
breakthrough time similar to the void time of the system.
The capture efficiency for the immunoextraction columns was measured by
injecting 20 µL of 5.0 µM HSA or glycated HSA (i.e., 6.67 µg) at 0.05 to 0.50 mL/min in
the presence of the pH 7.4 application buffer. This amount of injected protein was
equivalent to the amount of found in 0.13-0.19 µL of undiluted serum containing 35-50
g/L HSA. The elution profiles were monitored at 280 nm. Chromatograms for these
studies can be found in the Appendix 7.6.3. The mobile phase was later switched to a pH
2.5, 0.10 M potassium phosphate buffer to elute the adsorbed HSA or glycated HSA from
the column. The column was then regenerated with the pH 7.4, 0.067 M potassium
phosphate buffer prior to the injection of the next sample. This process was also carried
out on the control column. Injections containing 20 µL of pH 7.4, 0.067 M potassium
phosphate buffer were also performed on the immunoextraction columns and the control
columns at the various flow rates to correct for the background response of the buffer.
The elution profiles for the injected samples and buffer were analyzed and fit to
303
exponentially-modified Gaussian curves [34,35].
7.2.7 Chromatographic binding studies
Prior to the drug-protein binding studies, HSA or glycated HSA was applied to an
immunoextraction column under the same conditions described in Section 7.2.6 for the
binding capacity measurements. In the frontal analysis experiments, the
immunoextraction columns containing adsorbed HSA or glycated HSA were placed into
pH 7.4, 0.067 M potassium phosphate buffer at 0.10 mL/min. A switch was then made to
a solution prepared in the same pH 7.4 buffer but that contained a known concentration of
the drug of interest (e.g., warfarin or gliclazide), which was also applied at a flow rate of
0.10 mL/min. Once a breakthrough curve had been formed and a stable plateau had been
reached, the pH 7.4, 0.067 M phosphate buffer alone was passed through the column at
0.25 mL/min to elute the retained drug. The flow rate was then returned to 0.10 mL/min
prior to application of the next drug solution.
The frontal analysis studies used ten drug solutions containing 0.5-50 µM
warfarin or fourteen solutions containing 0.5-200 µM gliclazide. The elution of warfarin
was monitored at 308 nm, and the elution of gliclazide was detected at 250 nm. All
frontal analysis experiments were carried out in quadruplicate, with the central point of
each breakthrough curve being determined by the equal area method [34,35]. The same
solutions were also applied to a control column to correct for the void time of the system
and any non-specific binding of the drug [18-22]. Non-specific binding made up only
4% of the total binding seen for the 50 µM warfarin solution and 0.7% of the total
binding seen for 200 µM of gliclazide when applied to the immunoextraction columns
containing adsorbed HSA or glycated HSA.
304
Competition studies based on zonal elution experiments were also conducted on
the immunoextraction columns containing adsorbed HSA or glycated HSA. The studies
were performed in quadruplicate using 0-20 µM gliclazide as the competing agent in the
pH 7.4 application buffer. These solutions were applied to the columns at 0.1 mL/min for
warfarin which was used as probe for Sudlow site I of HSA/glycated HSA and 0.05
mL/min for L-tryptophan used as probe for Sudlow site II [5-8]. The mobile phases
containing gliclazide were also used to prepare the 5 µM samples of warfarin or L-
tryptophan that were used for these injections. The injection volume was 20 µL, and the
warfarin or L-tryptophan were monitored at 308 or 280 nm, respectively. Sodium nitrate
was also injected as a non-retained solute and was monitored at 205 nm [34,35]. The
central moment for each peak was found by using a fit to exponentially-modified
Gaussian peaks with the automatic baseline correction function of PeakFit v4.12 [34,35].
Similar chromatographic studies were also carried out using the control column in which
a correction was made for the non-specific binding by subtract the control results from
the results with the immunoextraction columns containing the protein.
7.3 Results and Discussion
7.3.1 Characterization of immunoextraction column
The binding capacity of an anti-HSA immunoextraction column was measured for
both HSA and glycated HSA by using frontal analysis. The estimated binding capacity
for HSA and glycated HSA was 0.34-0.42 nmol, or roughly 23-28 µg. This was the
equivalent to the amount of HSA/glycated HSA that would be found in 0.45-0.80 µL of
undiluted serum sample that contained 35-50 g/L of HSA.
When this binding capacity was combined with the known protein content of the
305
immunoextraction support, it was determined that 13-16% of the immobilized antibodies
were able to bind to the HSA and glycated HSA samples. Some of the remaining
antibodies may have been inactive or not accessible to the HSA/glycated HSA. These
two factors probably accounted for 72% of the non-binding antibodies, as based on prior
work with other antibodies using similar supports using the same immobilization method
[47]. The rest of the non-binding antibodies were probably directed against other target
antigens, as would be obtained along with the anti-HSA antibodies when using protein G
for their isolation from serum. The binding capacity that was obtained in this work was
sufficient for the initial design and testing of the immunoextraction/HPAC system for
drug-protein binding studies.
The extraction efficiency was determined by injecting 0.10 nmol (or ~6.6 µg) of
HSA or glycated HSA onto the immunoextraction column or control column at 0.05 to
0.50 mL/min. Table 7-1 summarizes the extraction efficiencies that were measured. The
time at which all of the non-retained columns were passed and eluted from the column
ranged from 5 min at a flow rate of 0.05 mL/min to 1 min at a flow rate of 0.5 mL/min.
Additionally, the back pressures obtained during the experiments ranged from 14 to 160
psi (0.1 to 1.1 MPa). When using HSA, an extraction efficiency of 90 (± 5)% was seen at
an injection flow rate of 0.05 mL/min, with a decrease in this value to approximately 60
or 70% at 0.50 or 0.25 mL/min. A similar trend was observed for glycated HSA, with a
maximum extraction efficiency of 93 (± 1)% being measured at 0.05 mL/min flow rate,
and with a small decrease in this value to roughly 80 or 90% at 0.50 or 0.25 mL/min.
The results were consistent with those that were predicted by using a second-order
adsorption-limited rate model and a previously measured association rate constant of 4.8
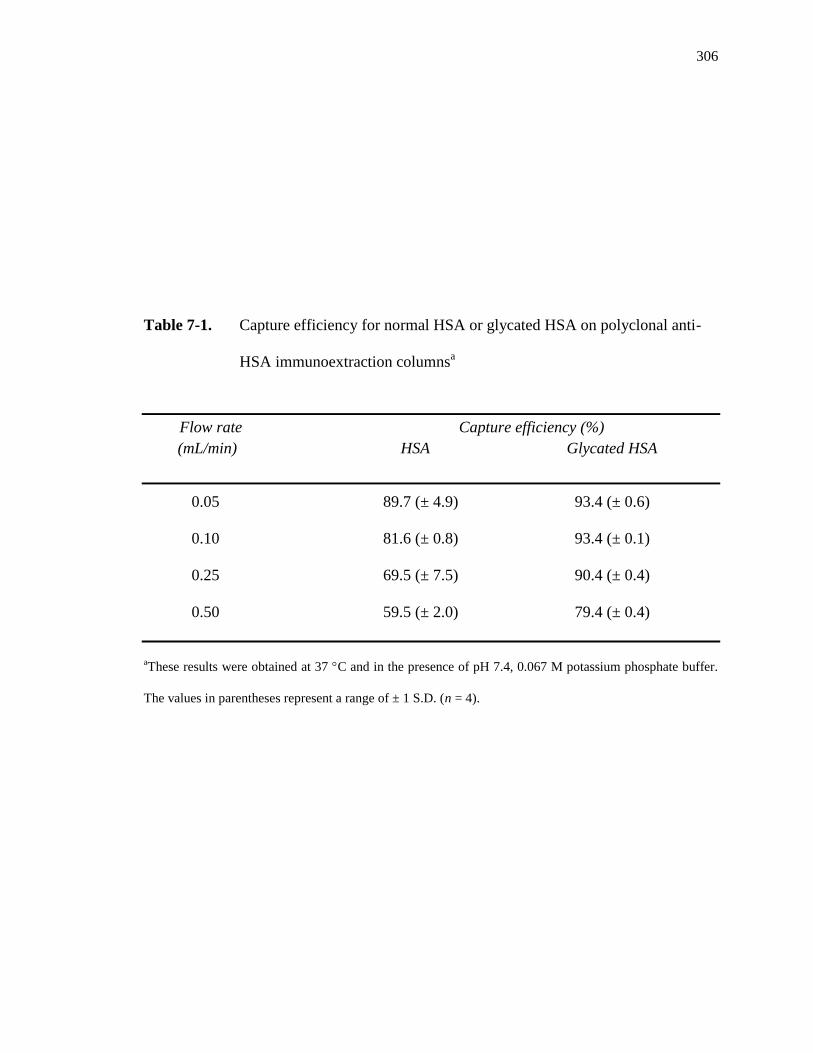
306
Table 7-1. Capture efficiency for normal HSA or glycated HSA on polyclonal anti-
HSA immunoextraction columnsa
Flow rate Capture efficiency (%)
(mL/min) HSA Glycated HSA
0.05 89.7 (± 4.9) 93.4 (± 0.6)
0.10 81.6 (± 0.8) 93.4 (± 0.1)
0.25 69.5 (± 7.5) 90.4 (± 0.4)
0.50 59.5 (± 2.0) 79.4 (± 0.4)
aThese results were obtained at 37 C and in the presence of pH 7.4, 0.067 M potassium phosphate buffer.
The values in parentheses represent a range of ± 1 S.D. (n = 4).
307
× 104 M
-1 s
-1 for HSA with a comparable preparation of immobilized polyclonal
antibodies [48]. Based on the results from the column binding capacity and extraction
efficiency experiments, the drug-binding experiments were performed by saturating the
immunoextraction columns with the HSA or glycated HSA samples through the same
method as the binding capacity experiments.
7.3.2 Frontal analysis drug binding studies
Frontal analysis experiments using some model drugs (i.e., warfarin and
gliclazide) were used to examine the overall binding of these drugs to the
immunoextraction columns containing either adsorbed HSA or glycated HSA. Frontal
analysis has been used in previous work with the same drugs and more traditional
columns containing immobilized HSA or glycated HSA [18-22]. Fig. 7-2(a) shows
frontal analysis results that were obtained when using the immunoextraction/HSA
method for drug-protein binding studies.
As is done with more traditional columns, the data that were obtained were fit to
various binding models to determine the number of interaction sites that were present and
the association equilibrium constants for these sites [34,35]. Traditional columns contain
a uniform distribution of protein throughout the entire column [34,35]. Eq. 1 shows the
binding isotherm that can be used with the frontal analysis data obtained from traditional
columns to describe the binding of an analyte at a single site of interaction.
𝑚𝐿𝑎𝑝𝑝 =𝑚𝐿𝐾𝑎[A]
(1+𝐾𝑎[A]) (1)
In this equation, mLapp represents the apparent moles of applied analyte that are required
to reach the central point of the breakthrough curve at a given concentration of analyte in
the mobile phase, which is represented by [A] [34,35]. The term Ka is the association
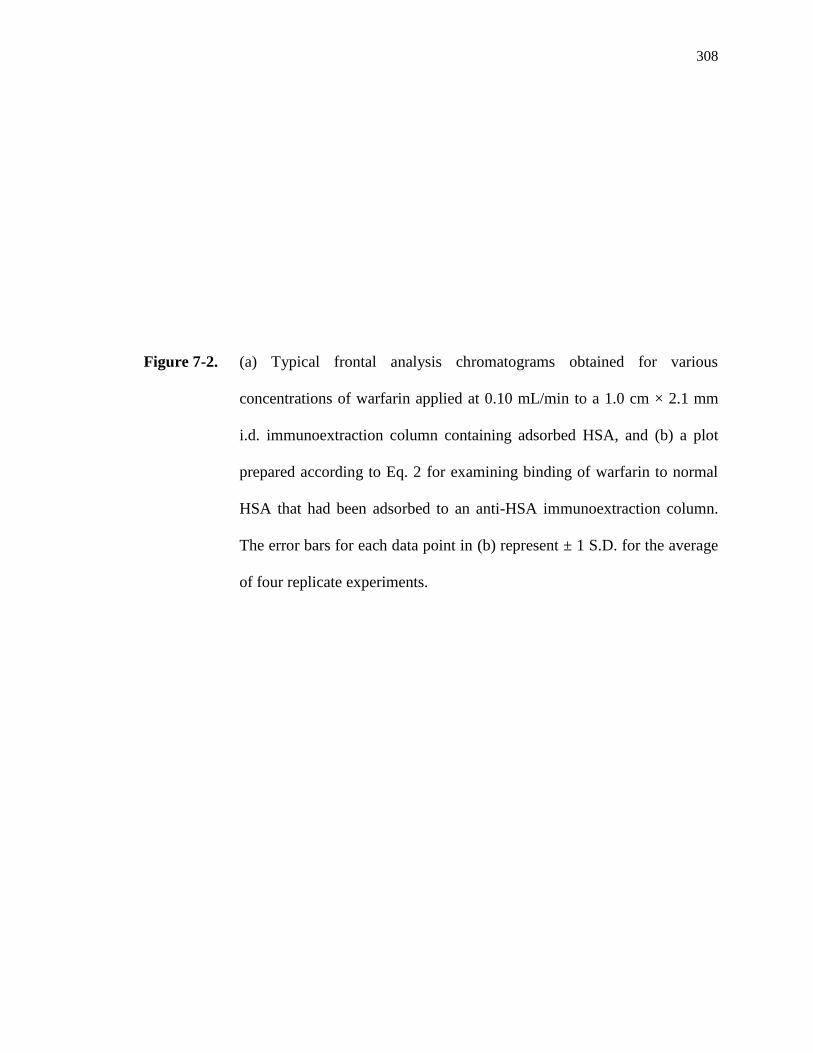
308
Figure 7-2. (a) Typical frontal analysis chromatograms obtained for various
concentrations of warfarin applied at 0.10 mL/min to a 1.0 cm × 2.1 mm
i.d. immunoextraction column containing adsorbed HSA, and (b) a plot
prepared according to Eq. 2 for examining binding of warfarin to normal
HSA that had been adsorbed to an anti-HSA immunoextraction column.
The error bars for each data point in (b) represent ± 1 S.D. for the average
of four replicate experiments.
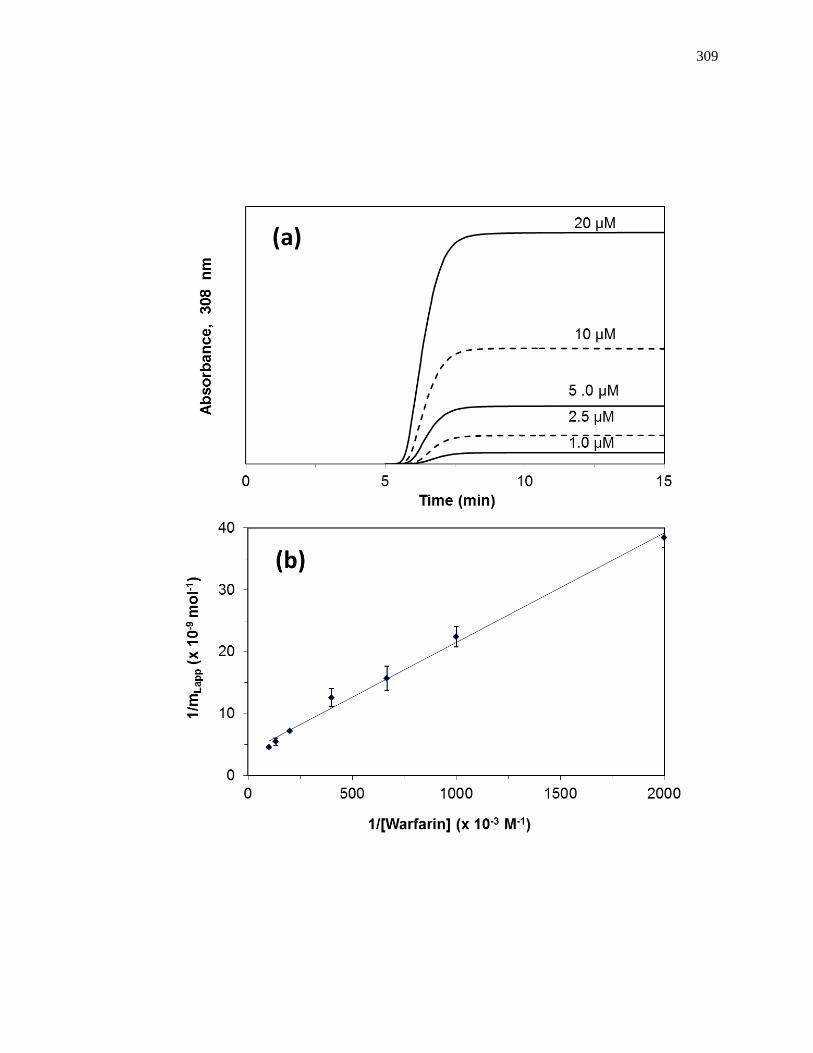
309
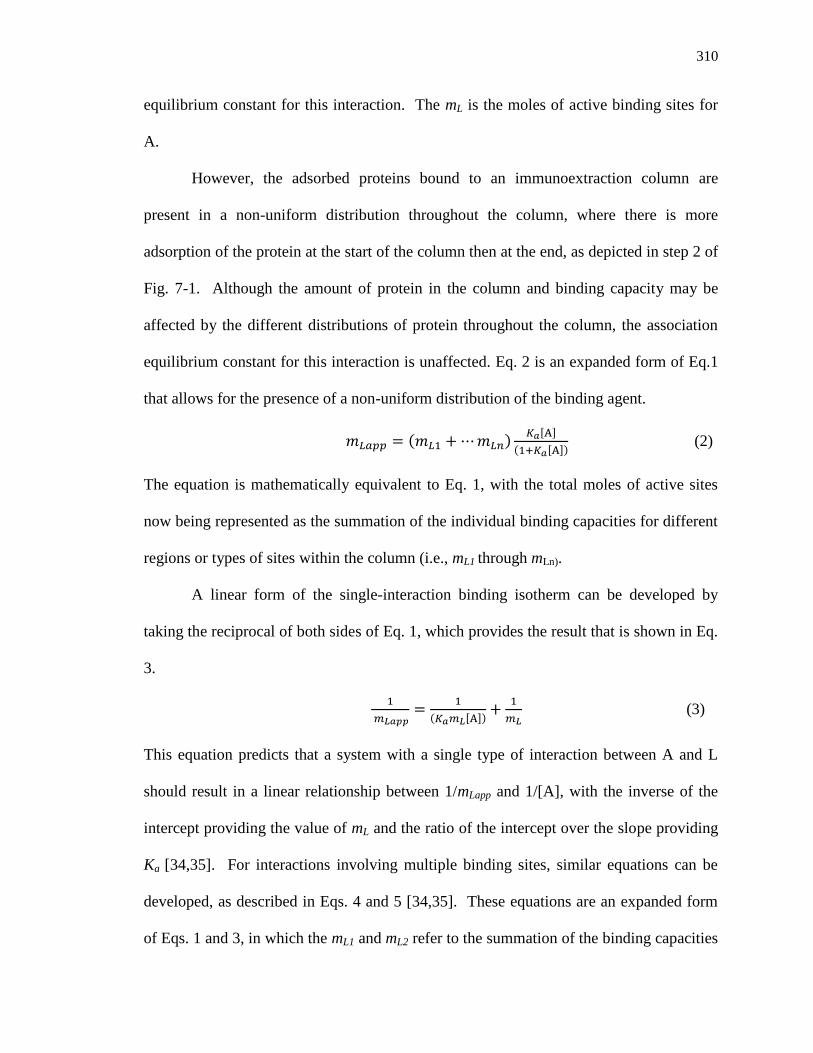
310
equilibrium constant for this interaction. The mL is the moles of active binding sites for
A.
However, the adsorbed proteins bound to an immunoextraction column are
present in a non-uniform distribution throughout the column, where there is more
adsorption of the protein at the start of the column then at the end, as depicted in step 2 of
Fig. 7-1. Although the amount of protein in the column and binding capacity may be
affected by the different distributions of protein throughout the column, the association
equilibrium constant for this interaction is unaffected. Eq. 2 is an expanded form of Eq.1
that allows for the presence of a non-uniform distribution of the binding agent.
𝑚𝐿𝑎𝑝𝑝 = (𝑚𝐿1 + ⋯ 𝑚𝐿𝑛)𝐾𝑎[A]
(1+𝐾𝑎[A]) (2)
The equation is mathematically equivalent to Eq. 1, with the total moles of active sites
now being represented as the summation of the individual binding capacities for different
regions or types of sites within the column (i.e., mL1 through mLn).
A linear form of the single-interaction binding isotherm can be developed by
taking the reciprocal of both sides of Eq. 1, which provides the result that is shown in Eq.
3.
1
𝑚𝐿𝑎𝑝𝑝=
1
(𝐾𝑎𝑚𝐿[A])+
1
𝑚𝐿 (3)
This equation predicts that a system with a single type of interaction between A and L
should result in a linear relationship between 1/mLapp and 1/[A], with the inverse of the
intercept providing the value of mL and the ratio of the intercept over the slope providing
Ka [34,35]. For interactions involving multiple binding sites, similar equations can be
developed, as described in Eqs. 4 and 5 [34,35]. These equations are an expanded form
of Eqs. 1 and 3, in which the mL1 and mL2 refer to the summation of the binding capacities
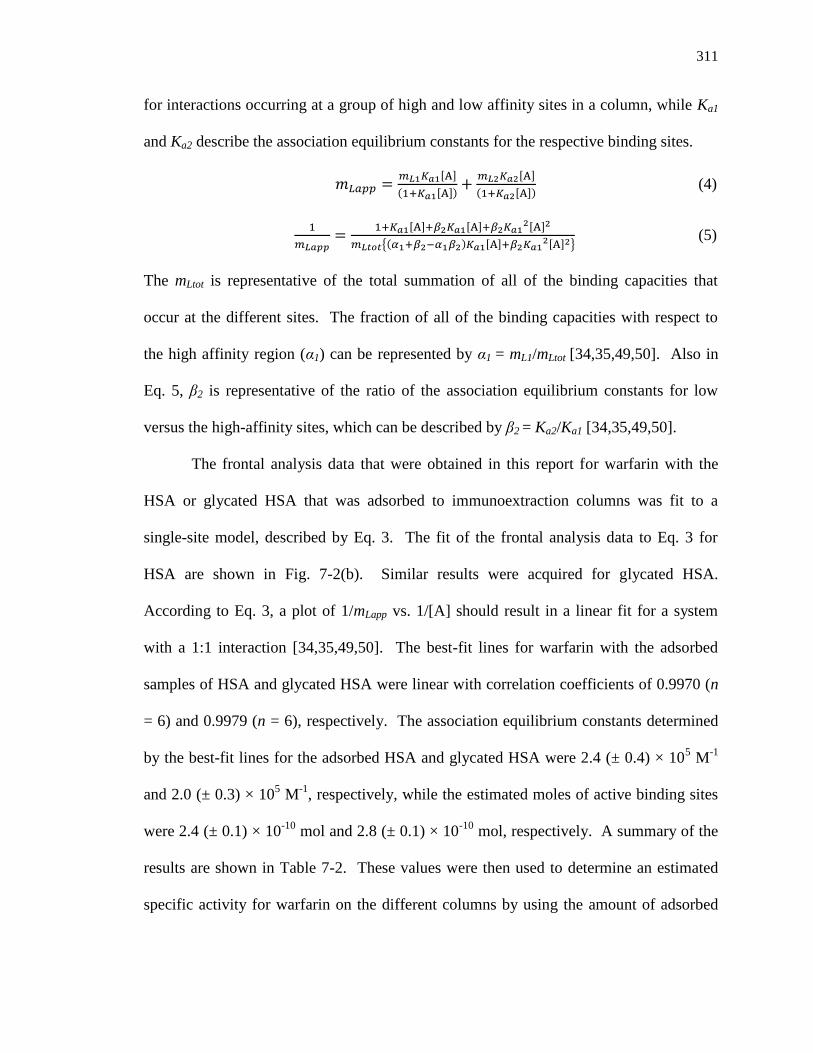
311
for interactions occurring at a group of high and low affinity sites in a column, while Ka1
and Ka2 describe the association equilibrium constants for the respective binding sites.
𝑚𝐿𝑎𝑝𝑝 =𝑚𝐿1𝐾𝑎1[A]
(1+𝐾𝑎1[A])+
𝑚𝐿2𝐾𝑎2[A]
(1+𝐾𝑎2[A]) (4)
1
𝑚𝐿𝑎𝑝𝑝=
1+𝐾𝑎1[A]+𝛽2𝐾𝑎1[A]+𝛽2𝐾𝑎12[A]2
𝑚𝐿𝑡𝑜𝑡{(𝛼1+𝛽2−𝛼1𝛽2)𝐾𝑎1[A]+𝛽2𝐾𝑎12[A]2}
(5)
The mLtot is representative of the total summation of all of the binding capacities that
occur at the different sites. The fraction of all of the binding capacities with respect to
the high affinity region (α1) can be represented by α1 = mL1/mLtot [34,35,49,50]. Also in
Eq. 5, β2 is representative of the ratio of the association equilibrium constants for low
versus the high-affinity sites, which can be described by β2 = Ka2/Ka1 [34,35,49,50].
The frontal analysis data that were obtained in this report for warfarin with the
HSA or glycated HSA that was adsorbed to immunoextraction columns was fit to a
single-site model, described by Eq. 3. The fit of the frontal analysis data to Eq. 3 for
HSA are shown in Fig. 7-2(b). Similar results were acquired for glycated HSA.
According to Eq. 3, a plot of 1/mLapp vs. 1/[A] should result in a linear fit for a system
with a 1:1 interaction [34,35,49,50]. The best-fit lines for warfarin with the adsorbed
samples of HSA and glycated HSA were linear with correlation coefficients of 0.9970 (n
= 6) and 0.9979 (n = 6), respectively. The association equilibrium constants determined
by the best-fit lines for the adsorbed HSA and glycated HSA were 2.4 (± 0.4) × 105 M
-1
and 2.0 (± 0.3) × 105 M
-1, respectively, while the estimated moles of active binding sites
were 2.4 (± 0.1) × 10-10
mol and 2.8 (± 0.1) × 10-10
mol, respectively. A summary of the
results are shown in Table 7-2. These values were then used to determine an estimated
specific activity for warfarin on the different columns by using the amount of adsorbed
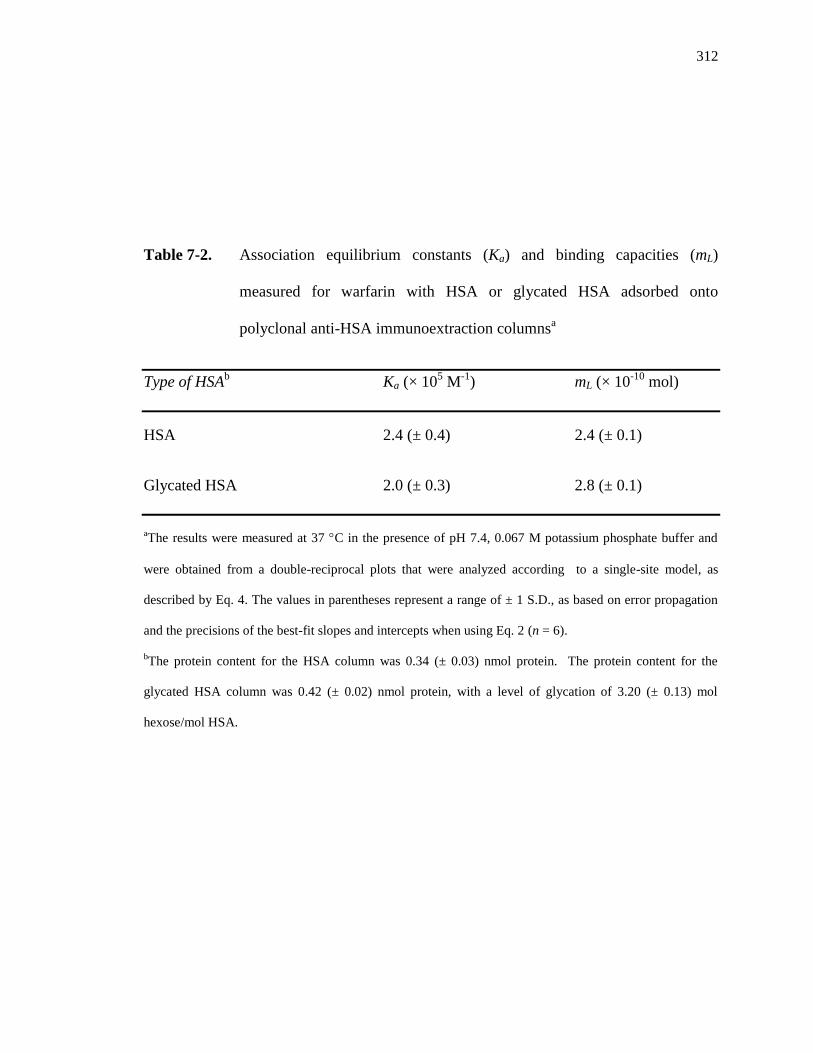
312
Table 7-2. Association equilibrium constants (Ka) and binding capacities (mL)
measured for warfarin with HSA or glycated HSA adsorbed onto
polyclonal anti-HSA immunoextraction columnsa
Type of HSAb Ka (× 10
5 M
-1) mL (× 10
-10 mol)
HSA 2.4 (± 0.4) 2.4 (± 0.1)
Glycated HSA 2.0 (± 0.3) 2.8 (± 0.1)
aThe results were measured at 37 C in the presence of pH 7.4, 0.067 M potassium phosphate buffer and
were obtained from a double-reciprocal plots that were analyzed according to a single-site model, as
described by Eq. 4. The values in parentheses represent a range of ± 1 S.D., as based on error propagation
and the precisions of the best-fit slopes and intercepts when using Eq. 2 (n = 6).
bThe protein content for the HSA column was 0.34 (± 0.03) nmol protein. The protein content for the
glycated HSA column was 0.42 (± 0.02) nmol protein, with a level of glycation of 3.20 (± 0.13) mol
hexose/mol HSA.
313
HSA or glycated HSA. The specific activities ranged from 0.48-0.71 mol/mol of HSA
and glycated HSA, which indicated that a single-site was involved in the interaction
between warfarin and the absorbed HSA and glycated HSA samples.
The Ka values obtained for the fit to the linear region of Eq. 3 were comparable to
the previously reported average association equilibrium constant of 2.4 (± 0.4) × 105 M
-1
for the binding of racemic warfarin to HSA [7,22]. In a previous report with more
traditional HPAC columns it was found that the levels of glycation similar to those used
in this study did not have any appreciable effect on the association equilibrium constants
for warfarin with HSA [22]. The Ka values from this study ranged from 2.3 × 10⁵ to 2.7
× 105 M
-1. The results in this current study also found that association equilibrium
constants determined for warfarin with the adsorbed samples of HSA and glycated HSA
were statistically identical at the 95% confidence interval. Thus, the results for warfarin
indicated that the use of immunoextraction could be used to adsorb a protein such as
HSA for use in frontal analysis studies of drug-protein interactions.
The relative precision for the Ka values determined for warfarin on the adsorbed
HSA and glycated HSA columns was ± 15-17% and was only slightly higher than
relative precisions of ± 8.6-11% that have been reported previously when using more
traditional HPAC columns [7,22]. The binding capacities that were obtained previously
with other HPAC columns had relative precisions of ± 8.7-10.1% [7,22], which compared
well with the relative precisions of ± 3.5-4.2% that were obtained in this study. It was
further found that the columns containing adsorbed samples of HSA or glycated HSA
were stable and had similar lifetimes to those noted for more traditional HPAC columns
[7,22]. However, one major advantage of using immunextracted proteins over
314
covalently-immobilized proteins is that the proteins used in this report could be eluted
periodically from the column and replaced with a fresh or alternative protein sample for
use in further drug-protein binding studies.
7.3.3 Frontal analysis studies with gliclazide
Gliclazide was another drug and model solute that was used to evaluate the
combined immunextraction/HPAC system for biointeraction analysis. This drug and
related sulfonylurea drugs have been shown in previous frontal analysis work to have two
general classes of binding sites with both HSA and glycated forms of HSA: a set of well-
defined moderate-to-high affinity sites and a larger set of weaker affinity interactions [18-
22]. Some typical results that were generated with gliclazide in this study are shown in
Fig. 7-3. These results were fit to both one-site and two-site binding models, as described
by Eqs. 2 and 4 and given in Fig. 7-3(a-b).
The presence of multi-site interactions was confirmed by comparing the fits of
Eqs. 2 and 4 to the gliclazide data. For instance, the correlation coefficient obtained with
Eq. 2 and the single-site model was 0.9939 (n = 12) for HSA, while a fit of the same data
to Eq. 4 and a two-site model gave a correlation coefficient of 0.9999 (n = 12). As shown
in the insets of Fig. 7-3, the residual plot for the two-site model gave a more random
distribution of the data about the best-fit line than was seen for the one-site model. The
sum of the squares of the residuals for the two-site model was also much smaller than the
one-site model (i.e., 1.3 × 10⁻²³
vs. 1.9 × 10⁻²¹
). All of the results confirmed that a model
based on two binding sites was a better description for this interaction than a one-site
model. The same data were also fit to Eq. 3 by using a double-reciprocal plot, as
provided in the Appendix 7.6.4, which also indicated that multi-site interactions were
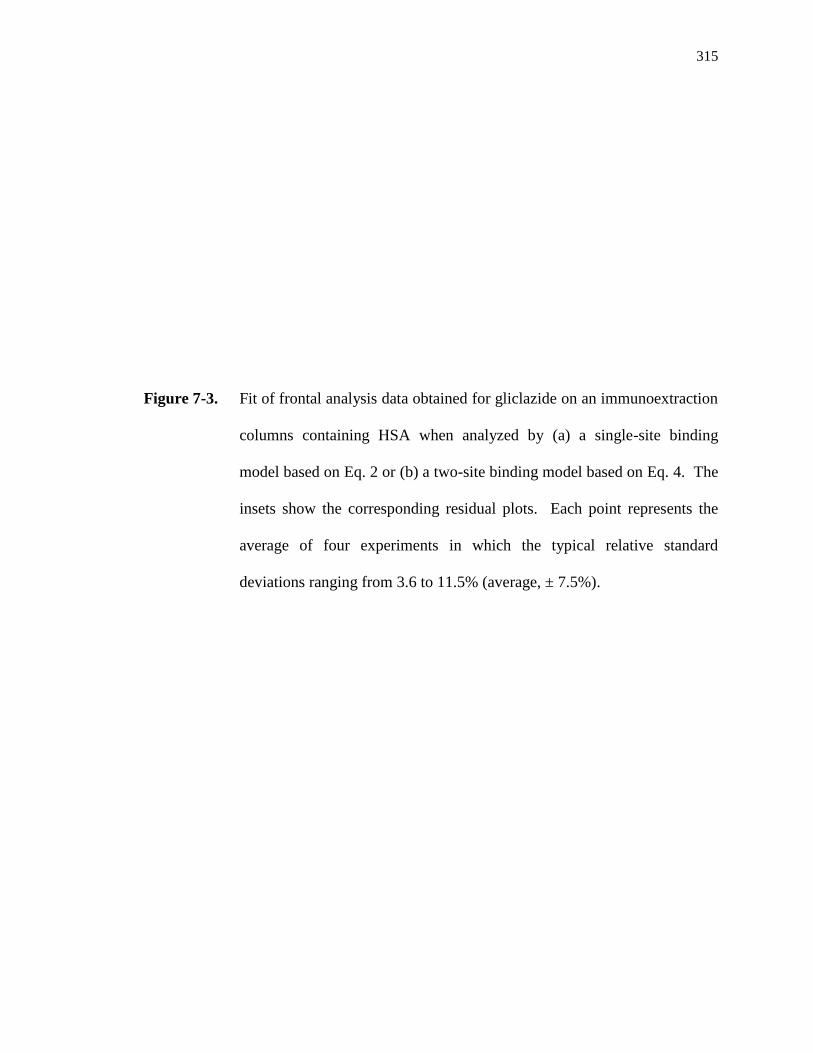
315
Figure 7-3. Fit of frontal analysis data obtained for gliclazide on an immunoextraction
columns containing HSA when analyzed by (a) a single-site binding
model based on Eq. 2 or (b) a two-site binding model based on Eq. 4. The
insets show the corresponding residual plots. Each point represents the
average of four experiments in which the typical relative standard
deviations ranging from 3.6 to 11.5% (average, ± 7.5%).
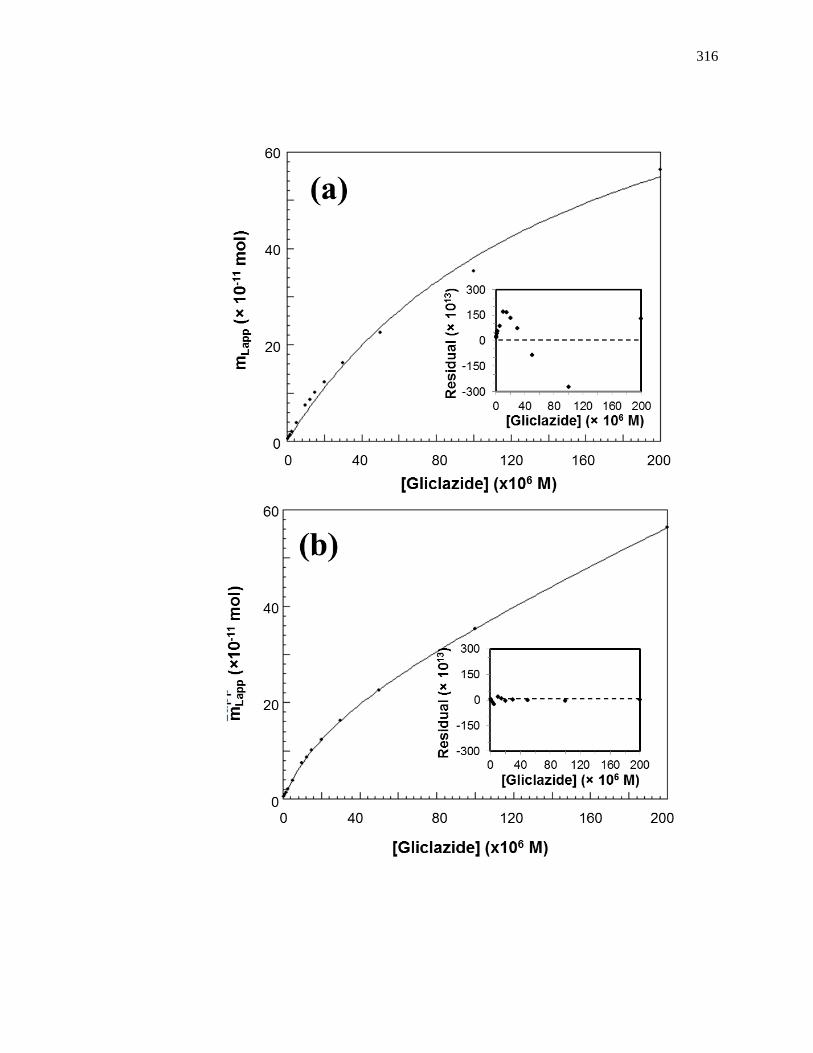
316
317
present.
The values of Ka1 and mL1 for the high affinity sites in this system were first
estimated from the linear portion of a plot made according to Eq. 3, giving values of 4.1
(± 1.4) × 104 M
-1 and 2.4 (± 0.1) × 10
-10 mol, respectively. When using Eq. 4, the
association equilibrium constants for the higher affinity sites and lower affinity sites in
the same system were determined to be 4.1 (± 0.5) × 104 M
-1 and 4.2 (± 2.9) × 10
2 M
-1,
respectively. The moles of active binding sites for the two-site model were found from
this latter fit to be 1.8 (± 0.2) × 10-11
mol and 5.2 (± 3.1) × 10-9
mol, respectively.
The results for the glycated HSA sample followed a similar trend to HSA sample.
A fit of the linear portion of a plot according to Eq. 3 resulted in initial estimates of Ka1
and mL1 for the high affinity sites of 3.9 (± 1.1) × 104 M
-1 and 2.2 (± 0.1) × 10
-10 mol,
respectively. The data were also fit to the two-site model which gave a better fit than a
one-site model, with a higher correlation coefficient of 0.999 (n = 12), a more random
distribution of the results about the best-fit line, and a lower sum of the squares of the
residuals (i.e., 2.4 × 10⁻²³
vs. 5.7 × 10⁻²²
). The fit to the two-site model for glycated HSA
gave association equilibrium constants of 4.9 (± 1.4) × 104 M
-1 and 3.6 (± 0.6) × 10
3 M
-1
for gliclazide at the higher affinity sites and lower affinity binding sites, respectively.
The moles of active sites for these higher and lower affinity sites were 1.1 (± 0.3) × 10-10
mol and 1.0 (± 0.1) × 10-9
mol, respectively. A summary of the results from the two-site
model for gliclazide with both HSA and glycated HSA is provided in Table 7-3.
The results from the immunoextraction/HPAC methods were comparable to those
from a previous study involving more traditional HPAC columns. This prior work
produced an estimate of 3.4–10.0 × 10⁴ M
-1 for the average association equilibrium
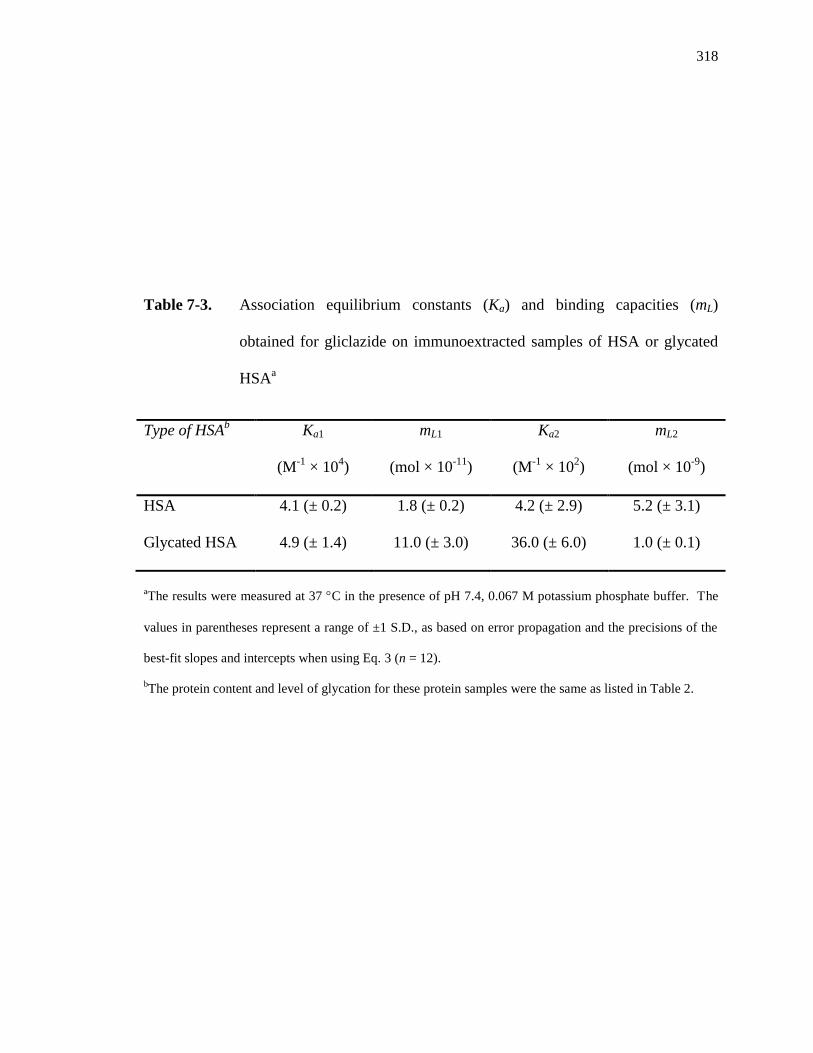
318
Table 7-3. Association equilibrium constants (Ka) and binding capacities (mL)
obtained for gliclazide on immunoextracted samples of HSA or glycated
HSAa
Type of HSAb
Ka1
(M-1
× 104)
mL1
(mol × 10-11
)
Ka2
(M-1
× 102)
mL2
(mol × 10-9
)
HSA 4.1 (± 0.2) 1.8 (± 0.2) 4.2 (± 2.9) 5.2 (± 3.1)
Glycated HSA 4.9 (± 1.4) 11.0 (± 3.0) 36.0 (± 6.0) 1.0 (± 0.1)
aThe results were measured at 37 C in the presence of pH 7.4, 0.067 M potassium phosphate buffer. The
values in parentheses represent a range of ±1 S.D., as based on error propagation and the precisions of the
best-fit slopes and intercepts when using Eq. 3 (n = 12).
bThe protein content and level of glycation for these protein samples were the same as listed in Table 2.
319
constant of the higher affinity binding sites for gliclazide with HSA and highly glycated
HSA [20], which agrees well with the value of 4.1 × 10⁴ M
-1 that was obtained in this
current report when using immunoextraction and HPAC.
The specific activity for each type of immobilized protein was determined from
an estimate of the adsorbed protein and the measured binding capacities of these
columns. In previous work with immobilized HSA, a specific activity of 0.50 (± 0.16)
mol/mol HSA was obtained for the gliclazide high affinity sites [22]. This prior result
was equivalent, at the 95% confidence level, to the value of 0.52 (± 0.06) mol/mol HSA
obtained in this report using immunoextraction and an adsorbed sample of HSA. The
adsorbed sample of glycated HSA gave a specific activity for the high affinity sites of
0.25 (± 0.08) mol/mol HSA, which was similar to a value measured by traditional HPAC
with more highly glycated HSA [20]. As has been noted in previous studies, the results
for both the HSA and glycated HSA followed a model in which these proteins had one or
two major binding sites for gliclazide and two or more weaker binding regions [20]. The
results also indicated that comparable specific activities for these drug-binding studies
were obtained when using immunoextraction versus studies involving covalently
immobilized forms of HSA and glycated HSA.
The relative precisions that were obtained for Ka and mL values for the high and
low affinity binding sites, as measured when using a two site model and
immunoextraction, where also compared to the previous values that have been obtained
in work with the traditional columns using covalent protein immobilization [20]. The
relative precision for association equilibrium constants determined at the high affinity
sites when using immunoextraction was ± 4.9-29%, and the relative precision for values
320
at the low affinity regions was ± 17-69%. These values were similar to relative
precisions of ± 8.0-27% and ± 17-68%, respectively, that have been noted for the same
drug-protein systems when using covalent immobilization [20]. The precisions of the
binding capacities were also similar in these two approaches. The immunoextraction
method gave precisions for these binding capacities of ± 11-27% for the high affinity
sites and ± 10-60% for the low affinity regions, which were comparable to the range of
precisions obtained by covalent immobilization [20]. Furthermore, the similarities in
precision indicate the feasibility of using the online immunoextraction for analysis of
drug-binding interactions.
7.3.4 Zonal elution competition studies
Another method that was tested for use with the immunoextraction/HPAC method
was a zonal elution competition study. This type of experiment has been used with
HPAC columns made through covalent immobilization to examine site-specific changes
in drug-protein interactions, including changes that may occur due to HSA glycation [18-
22]. For instance, previous competition studies using gliclazide and other sulfonylurea
drugs have found that these drugs can bind to both Sudlow sites I and II of HSA and
glycated HSA, by using warfarin as a probe for Sudlow site I and L-tryptophan as a probe
for Sudlow site II [18-22].
In a zonal elution competition study, a small amount of a probe for a given
binding site (e.g., warfarin or L-tryptophan) is injected onto a column that contains the
protein or binding agent of interest. These injections are made in the presence of various
known concentrations of a possible competing agent (e.g., gliclazide) in the mobile
phase. The retention factor (k) of the probe is then measured at each competing agent
321
concentration and used to determine whether the probe and competing agent had a
common binding site on the affinity column [34,35].
If direct competition exists between the competing agent and the probe, then a
decrease in the retention factor for the probe should occur as the concentration of the
competing agent is increased. This change in retention can be described as a function of
the concentration of the competing agent [I], as is illustrated in Eq. 6 for a system in
which I and A have a single site of competition and A has no other types of binding sites
in the column [34,35].
1
𝑘=
𝐾𝑎I𝑉𝑀[I]
𝐾𝑎A𝑚𝐿+
𝑉𝑀
𝐾𝑎A𝑚𝐿 (6)
In Eq. 6, the association equilibrium constants for the probe and the competing agent at
their site of competition are given by the terms KaI and KaA. The term VM represents the
column void time, and mL is the moles of the common binding sites in the column. Eq. 6
predicts that a system with 1:1 competition should give a linear relationship between 1/k
and [I]. In addition, the ratio of the slope over the intercept for the best-fit line in such a
plot can be used to obtain the value of KaI at the site of competition [34,35].
As shown in Fig. 7-4, linear fits were obtained according to Eq. 6 with the
immunoextraction/HPAC system for zonal elution competition studies involving
gliclazide and both HSA and glycated HSA when using warfarin and L-tryptophan as
probes for Sudlow sites I and II. The best-fit lines in the competition studies with
warfarin gave correlation coefficients of 0.977 (n=6) and 0.985 (n=7) for HSA and
glycated HSA. The best-fit lines for the experiments performed with L- tryptophan and
gliclazide gave coefficients of 0.995 and 0.994 (n=7) for HSA and glycated HSA,
respectively. The residual plots for all of these linear fits gave random variations in the

322
Figure 7-4. Results for zonal elution competition studies between gliclazide and (a)
warfarin or (b) L-tryptophan as injected probes on immunoextraction
columns that contained adsorbed HSA (♦) or glycated HSA (■). These
data were fit to the direct competition model in Eq. 6. The error bars for
each data point represent ± 1 S.D. for the average of four replicates for
each experiment.
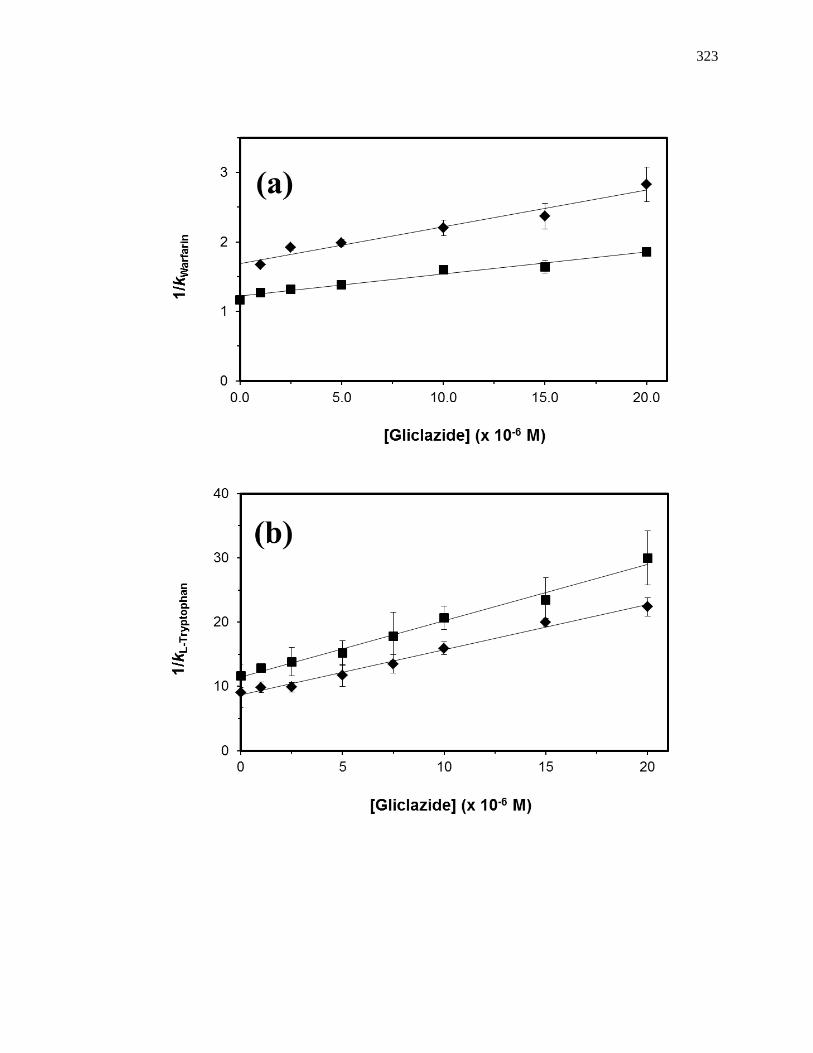
323
324
data about the best-fit lines. In addition, the sums for squares of the residuals that ranged
from 0.010 to 0.114 for the experiments performed with warfarin and from 1.90 to 3.37
for the experiments performed with L-tryptophan. This type of fit and linear behavior
was similar to that seen in prior work with the same probes and gliclazide or other
sulfonylurea drugs on more traditional HPAC columns containing covalently
immobilized samples of HSA or glycated HSA [18-22].
The association equilibrium constants for gliclazide at Sudlow sites I and II of the
adsorbed HSA or in vitro glycated HSA samples were determined from the slopes and
intercepts from the plots. These values are summarized in Table 7-4. The value that was
found for gliclazide with HSA at Sudlow site I was 3.4 (± 0.3) × 104 M
-1, and the
association equilibrium constant at Sudlow site II was 8.1 (± 0.4) × 104 M
-1. The
association equilibrium constant results for Sudlow sites I and II of the glycated HSA
sample were 2.5 (± 0.2) × 104 M
-1 and 7.7 (± 0.4) × 10
4 M
-1, respectively. These results
were similar to the ranges of values that have been obtained in previous work with
covalently immobilized samples of HSA or glycated HSA that had slightly lower or
higher levels of modification (i.e., 2.1-3.6 × 10⁴ M
-1 at Sudlow site I and 3.8-7.6 × 10
4 M
-
1 at Sudlow site II) [20].
7.4 Conclusion
This chapter examined the development and use of on-line immunoextraction
with HPAC for examining drug-protein interactions, using HSA and glycated HSA as
model proteins for this work. Columns containing polyclonal anti-HSA antibodies were
prepared that had extraction efficiencies of 90-93% for samples of HSA and glycated
HSA. The binding capacities for both proteins on the immunoextraction columns ranged
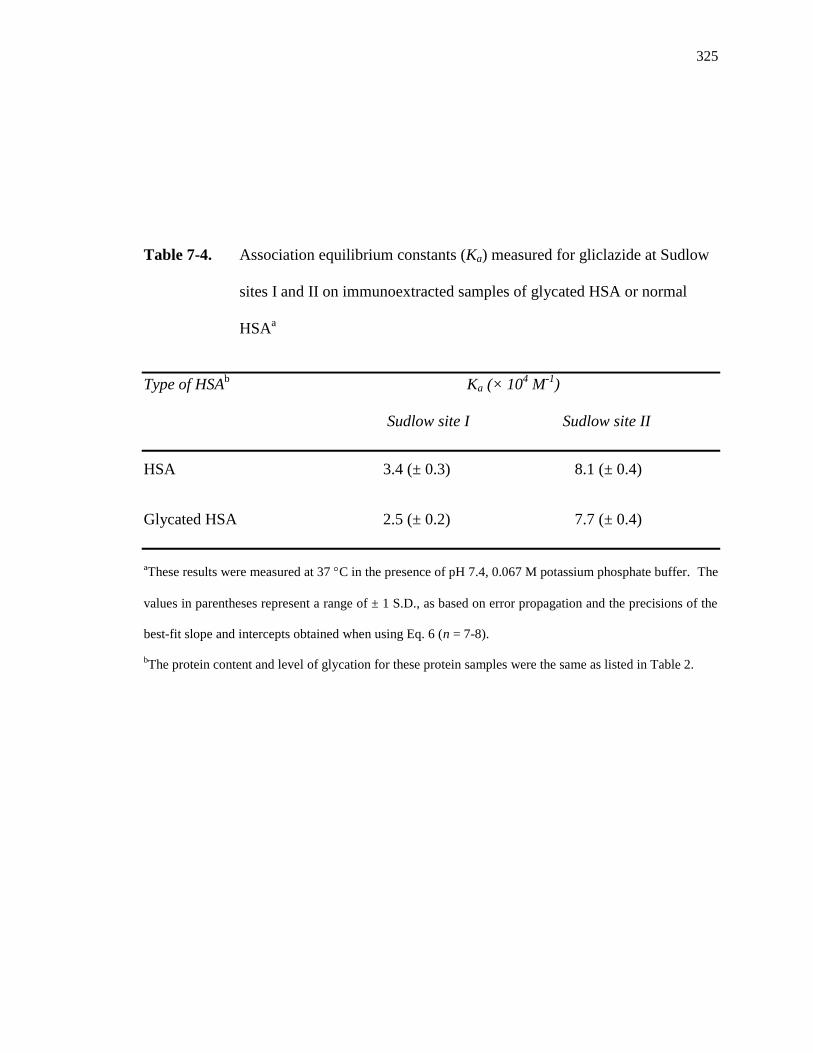
325
Table 7-4. Association equilibrium constants (Ka) measured for gliclazide at Sudlow
sites I and II on immunoextracted samples of glycated HSA or normal
HSAa
Type of HSAb Ka (× 10
4 M
-1)
Sudlow site I Sudlow site II
HSA 3.4 (± 0.3) 8.1 (± 0.4)
Glycated HSA 2.5 (± 0.2) 7.7 (± 0.4)
aThese results were measured at 37 C in the presence of pH 7.4, 0.067 M potassium phosphate buffer. The
values in parentheses represent a range of ± 1 S.D., as based on error propagation and the precisions of the
best-fit slope and intercepts obtained when using Eq. 6 (n = 7-8).
bThe protein content and level of glycation for these protein samples were the same as listed in Table 2.
326
from 0.34-0.42 nmol.
Frontal analysis experiments examined the binding of warfarin and gliclazide
tothe adsorbed samples of HSA or glycated HSA on the immunoextraction columns.
Similar binding behavior and affinities for both types of drugs were seen when
comparing the immunoextracted proteins versus prior data have been obtained with
comparable samples of proteins but using covalent immobilization. Zonal elution
competition studies were also used to examine the site-specific binding of gliclazide with
the adsorbed samples of HSA and glycated HSA at Sudlow sites I and II. The resulting
association equilibrium constants were also in the same range as determined in previous
studies when using covalently immobilized HSA or glycated HSA. The experiments in
this chapter demonstrated how immunoextraction can be combined with HPAC to isolate
proteins such as HSA and then use the adsorbed proteins in drug-binding studies. This
general approach could be extended to other proteins or modified proteins, which could
in turn be used in clinical or pharmaceutical studies or biomedical research in areas such
as personalized medicine.
7.5 References
1. T. Peters, Jr. All About Albumin: Biochemistry, Genetics, and Medical
Applications. Academic Press, San Diego, 1996.
2. N.W. Tietz (Ed.), Clinical Guide to Laboratory Tests, 2nd ed., Saunders,
Philadelphia, 1990.
3. G. Sudlow, D.J. Birkett, D.N. Wade, Characterization of two specific drug
binding sites on human serum albumin, Mol. Pharmacol. 11(1975) 824–832.
4. G. Sudlow, D.J. Birkett, D.N. Wade, Further characterization of specific drug
327
binding sites on human serum albumin, Mol. Pharmacol. 12 (1976) 1052–1061.
5. M. Otagiri, A molecular functional study on the interactions of drugs with plasma
proteins, Drug Metab. Pharmacokinet. 20 (2005) 309-323.
6. G.A. Ascoli, E. Domenic, C. Bertucci, Drug binding to human serum albumin:
abridged review of results obtained with high-performance liquid chromatography
and circular dichroism, Chirality 18 (2006) 667–679.
7. B. Loun, D.S. Hage, Chiral separation mechanisms in protein-based HPLC
columns. I. Thermodynamic studies of (R)- and (S)-warfarin binding to
immobilized human serum albumin, Anal. Chem. 66 (1994) 3814-3822.
8. J. Yang, D.S. Hage, Characterization of the binding and chiral separation of D-
and L-tryptophan on a high-performance immobilized human serum albumin
column, J. Chromatogr. 645 (1993) 241-250.
9. J. Anguizola, R.Matsuda, O.S. Barnaby, K.S. Joseph, C. Wa, E. Debolt, M. Koke,
D.S. Hage, Review: glycation of human serum albumin. Clin. Chim. Acta 425
(2013) 64–76.
10. J.W. Baynes, S.R. Thorpe, M.H. Murtiasha, Nonenzymatic glucosylation of lysine
residues in albumin, Methods Enzymol. 106 (1984) 88–98.
11. D.L. Mendez, R.A. Jensen, L.A. McElroy, J.M. Pena, R.M. Esquerra, The effect
of non-enzymatic glycation on the unfolding of human serum albumin, Arch.
Biochem. Biophys. 444 (2005) 92-99.
12. G. Colmenarejo, In silico prediction of drug-binding strengths to human serum
albumin, Med. Res. Rev. 23 (2003) 275-301.
13. H. Koyama, N. Sugioka, A. Uno, S. Mori, K. Nakajima, Effects of glycosylation
328
of hypoglycemic drug binding to serum albumin, Biopharm. Drug Dispos. 18
(1997) 791-801.
14. R.L. Garlick, J.S. Mazer, The principal site of nonenzymatic glycosylation of
human serum albumin in vivo, J. Biol. Chem. 258 (1983) 6142-6146.
15. N. Iberg, R. Fluckiger, Nonenzymatic glycosylation of albumin in vivo, J. Biol.
Chem. 261 (1986) 13542-13545.
16. K. Nakajou, H. Watanabe, U. Kragh-Hansen, T. Maruyama, M. Otagiri, The
effect of glycation on the structure, function and biological fate of human serum
albumin as revealed by recombinant mutants, Biochim. Biophys. Acta 1623
(2003) 88-97.
17. N. Shaklai, R.L. Garlick, H.F. Bunn, Nonenzymatic glycosylation of human
serum albumin alters its conformation and function, J. Biol. Chem. 259(1984)
3812–3817.
18. K.S. Joseph, J. Anguizola, A.J. Jackson, D.S. Hage, Chromatographic analysis of
acetohexamide binding to glycated human serum albumin, J. Chromatogr. B 878
(2010) 2775–2781.
19. K.S. Joseph, J. Anguizola, D.S. Hage, Binding of tolbutamide to glycated human
serum albumin, J. Pharm. Biomed. Anal. 54 (2011) 426–432.
20. R. Matsuda, J. Anguizola, K.S. Joseph, D.S. Hage, High-performance affinity
chromatography and the analysis of drug interactions with modified proteins:
binding of gliclazide with glycated human serum albumin, Anal. Bioanal. Chem.
401 (2011) 2811-2819.
21. R. Matsuda, J. Anguizola, K.S. Joseph, D.S. Hage, Analysis of drug interactions
329
with modified proteins by high-performance affinity chromatography: binding of
glibenclamide to normal and glycated human serum albumin, J. Chromatogr. A
1265 (2012) 114-122.
22. K.S. Joseph, D.S. Hage, The effects of glycation on the binding of human serum
albumin to warfarin and L-tryptophan, J. Pharm. Biomed. Anal. 53 (2010) 811-
818.
23. J. Anguizola, K.S. Joseph, O.S. Barnaby, R. Matsuda, G. Alvarado, W. Clarke,
R.L. Cerny, D.S. Hage, Development of affinity microcolumns for drug-protein
binding studies in personalized medicine: interactions of sulfonylurea drugs with
in vivo glycated human serum albumin, Anal. Chem. 85 (2013) 4453-4460.
24. A.J. Jackson, J. Anguizola, E.L. Pfaunmiller, D.S. Hage, Use of entrapment and
high-performance affinity chromatography to compare the binding of drugs and
site-specific probes with normal and glycated human serum albumin, Anal.
Bioanal. Chem. 405 (2013) 5833-5841.
25. S.B.G. Basiaga, D.S. Hage, Chromatographic studies of changes in binding of
sulfonylurea drugs to human serum albumin due to glycation and fatty acids, J.
Chromatogr. B Analyt. Technol. Biomed. Life Sci. 878 (2010) 3193-3197.
26. J. Anguizola, S.B.G. Basiaga, D.S., Effects of fatty acids and glycation on drug
interactions with human serum albumin, Curr. Metabolomics 1 (2013) 239-250.
27. O.S. Barnaby, R.L. Cerny, W. Clarke, D.S. Hage, Comparison of modification
sites formed on human serum albumin at various stages of glycation. Clin. Chim.
Acta 412 (2011) 277-285.
28. O.S. Barnaby, R.L. Cerny, W. Clarke, D.S. Hage, Quantitative analysis of
330
glycation patterns in human serum albumin using 16
O/18
O-labeling and MALDI-
TOF MS. Clin. Chim. Acta 412 (2011) 1606-1615.
29. O. S. Barnaby, C. Wa, R.L. Cerny, W. Clarke, D.S. Hage, Quantitative analysis of
glycation sites on human serum albumin using 16
O/18
O-labeling and matrix-
assisted laser desorption/ionization time-of-flight mass spectrometry, Clin. Chim.
Acta. 411 (2010) 1102-1110.
30. C. Wa, R. Cerny, W. Clarke, D.S. Hage, Characterization of glycation adducts on
human serum albumin by matrix-assisted laser desorption ionization time-of-
flight mass spectrometry, Clin. Chim. Acta. 385 (2007) 48-60.
31. International Diabetes Federation. IDF Diabetes Atlas; 5th Ed. International
Diabetes Federation, Brussels, Belgium, 2011.
32. National Diabetes Fact Sheet: General Information and National Estimates on
Diabetes in the United States, 2011, US Centers for Disease Control, U.S. Centers
for Disease Control and Prevention, Atlanta, GA, 2011.
33. H.V. Roohk, A.R. Zaidi, A review of glycated albumin as an intermediate
glycation index for controlling diabetes. J. Diabetes Sci. Technol. 2 (2008) 1114-
1121.
34. D.S. Hage, High-performance affinity chromatography: a powerful tool for
studying serum protein binding, J. Chromatogr. B 768 (2002) 3-30.
35. J.E. Schiel, K.S. Joseph, D.S. Hage, in: N. Grinsberg, E. Grushka (Eds.), Adv.
Chromatogr., Taylor & Francis, New York, 2010, Chap. 4.
36. D.S. Hage, J.A. Anguizola, A.J. Jackson, R. Matsuda, E. Papastavros, E.
Pfaunmiller, Z. Tong, J. Vargas-Badilla, MJ. Yoo, X. Zheng, Chromatographic
331
analysis of drug interactions in the serum proteome, Anal. Methods 3 (2011)
1449-1460.
37. D.S. Hage, T.M. Phillips, In Handbook of Affinity Chromatography; Hage, D.S.
(Ed.), Taylor & Francis, New York, 2006, Chap. 6.
38. P. Ruhn, J.D. Taylor, D.S. Hage, Determination of urinary albumin by high-
performance immunoaffinity chromatography and flow injection analysis, Anal.
Chem. 66 (1994) 4265-4271.
39. P.F. Ruhn, S. Garver, D.S. Hage, Development of dihydrazide-activated silica
supports by high-performance affinity chromatography, J. Chromatogr. A 669
(1994) 9-19.
40. R.R. Walters, High-performance affinity chromatography: pore-size effects, J.
Chromatogr. A 249 (1982) 19-28.
41. P.O. Larsson, High-performance liquid affinity chromatography, Methods
Enzymol. 104 (1984) 212-223.
42. H.S. Kim, D.S. Hage, Immobilization methods for affinity chromatography, In
Handbook of Affinity Chromatography; Hage, D.S. (Ed.), Taylor & Francis, New
York, 2006, Chap. 3.
43. A. Lapolla, D. Fedele, R. Reitano, N.C. Arico, R. Seraglia, P. Traldi, E. Marotta,
R. Tonani, Enzymatic digestion and mass spectrometry in the study of advance
glycation end products/peptides, J. Am. Soc. Mass Spectrom. 25 (2004) 496-509.
44. K.A. Ney, K.J. Colley, S.V. Pizzo, The standardization of the thiobarbituric acid
assay for nonenzymatic glucosylation of human serum albumin, Anal. Biochem.
118 (1981) 294-300.
332
45. K.S. Joseph, A.C. Moser, S. Basiga, J.E. Schiel, D.S. and Hage, Evaluation of
alternatives to warfarin as probes for Sudlow site I of human serum albumin:
characterization by high-performance affinity chromatography, J. Chromatogr. A
1216 (2009) 3492–3500.
46. M.L. Conrad, A.C. Moser, D.S. Hage, Evaluation of idole-based probes for high-
throughput screening of drugs binding to human serum albumin: Analysis by
high-performance affinity chromatography, J. Sep. Sci. 32 (2009) 1145-1155.
47. D.S. Hage, R.R. Walters, Dual-column determination of albumin and
immunoglobulin G in serum by high performance affinity chromatography, J
Chromatogr. 386 (1987) 37-49.
48. D.S. Hage, D.H. Thomas, M.S. Beck, Theory of a sequential addition competitive
binding immunoassay based on high-performance immunoaffinity
chromatography, Anal. Chem. 65 (1993) 1622-1630.
49. S.A. Tweed, B. Loun, D.S. Hage, Effects of ligand heterogeneity in the
characterization of affinity columns by frontal analysis, Anal. Chem. 69 (1997)
4790-4798.
50. Z. Tong, J.E. Schiel, E Papastavros, C.M. Ohnmacht, Q.R. Smith, D.S. Hage,
Kinetic studies of drug-protein interactions by using peak profiling and high-
performance affinity chromatography: examination of multi-site interactions of
drugs with human serum albumin columns, J. Chromatogr. A. 1218 (2011) 2065-
2071.
333
7.6 Appendix
7.6.1 Structures of Representative Sulfonylurea Drugs
The core structure of a sulfonylurea drug is composed of a phenysulfonyl and
urea functional group, in which various non-polar groups can be placed on either side of
the core structure, as is shown in Fig. 7-5. Some examples of first-generation
sulfonylurea drugs (e.g., acetohexamide and tolbutamide) and second-generation
sulfonlylurea drugs (e.g., gliclazide and glibenclamide) are also shown in Fig 7-5.
7.6.2 Affinity Purification of Anti-HSA Antibodies
Fig. 7-6 summarizes the scheme that was used in this work for isolating
polyclonal anti-HSA antibodies from anti-HSA goat antiserum. Other types of antibodies
and immunoglobulins, besides the anti-HSA antibodies were also probably isolated by
using the protein G Sepharose. However, control experiments indicated that the presence
of such non-specific antibodies only affected the final, maximum binding capacity that
could be obtained for HSA on the final immunoextraction column and did not affect the
drug-protein binding studies that were later conducted with these columns.
7.6.3 Immunoextraction Experiments
Fig. 7-7(a) shows some typical breakthrough curves that were for the binding of
normal HSA or glycated HSA to the immunoextraction column or to a control column.
The mean breakthrough points in these curves were used to determine the binding
capacity of the immunoextraction column, as described in the main body of the text. Fig.
7-7(b) shows some typical elution profiles that were obtained during the capture
334
Figure 7-5. Core structure of a sulfonylurea drug and some representative first-
generation and second-generation sulfonylurea drugs.
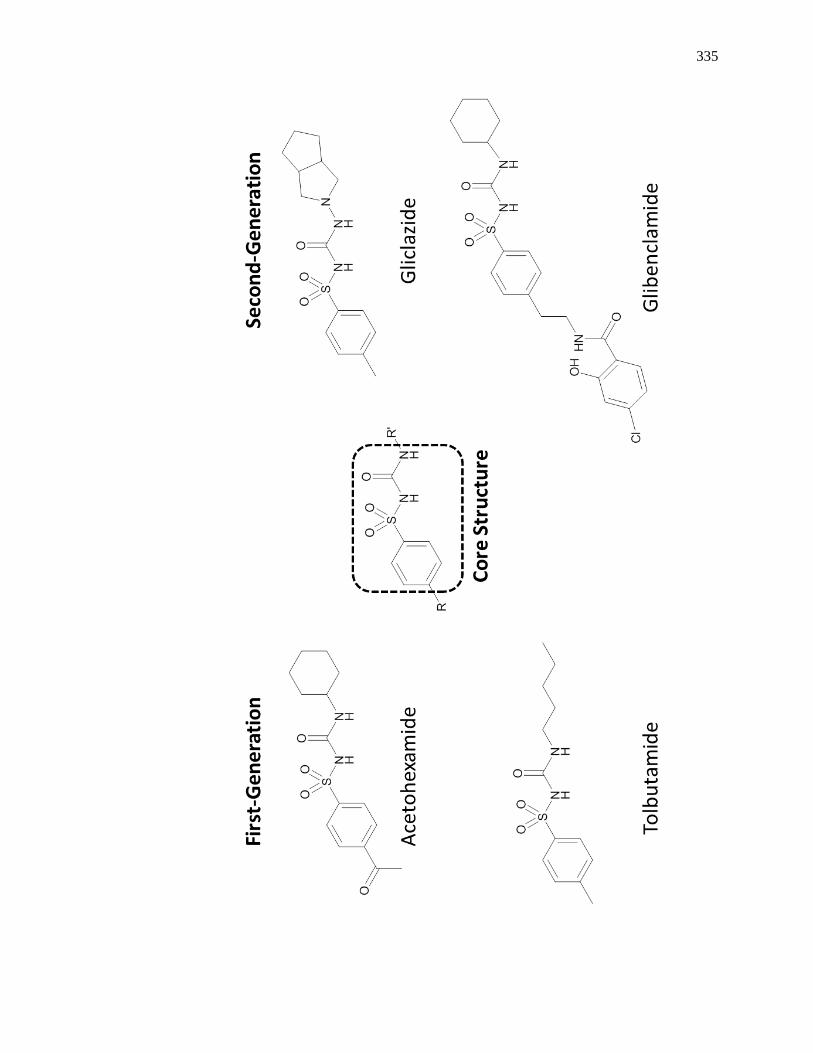
335
336
Figure 7-6. General procedure involved in the extraction of polyclonal anti-HSA
antibodies from goat serum.

337
338
Figure 7-7. Typical chromatograms obtained for (b) frontal analysis studies and (b)
capture efficiency experiments performed on a 1.0 × 2.1 mm i.d.
immunoextraction column containing anti-HSA polyclonal antibodies
(dashed line) or a control column (solid line). The results in (a) were
obtained for a 5 µM solution of HSA that was applied at 0.10 mL/min.
These results in (b) are for 20 µL samples of 5 µM HSA that were injected
at 0.05 mL/min.

339
340
efficiency experiments with normal HSA or glycated HSA on the control column or
immunoextraction column.
7.6.4 Frontal Analysis Studies
The frontal analysis data for gliclazide were analyzed according to both Eqs. (1-2)
and Eq. (4-5). Fig. 7-8 shows the results that were obtained when these data were
examined according to Eq. 2. A system with single-site binding would be expected to
give a linear relationship for this type of plot [20]. A linear region with a correlation
coefficient of 0.9948 (n = 13) was seen at high values for 1/[Gliclazide] in this plot;
however, deviations from linearity were also observed at high concentrations of
Gliclazide, or at low values of 1/[Gliclazide]. This type of behavior indicated that multi-
site interactions were taking place between this drug and its binding protein in the column
[20].
341
Figure 7-8. Fit of frontal analysis data obtained for gliclazide on an immunoextraction
columns containing HSA and when analyzed according to a single-site
binding model, as based on Eq. 2.
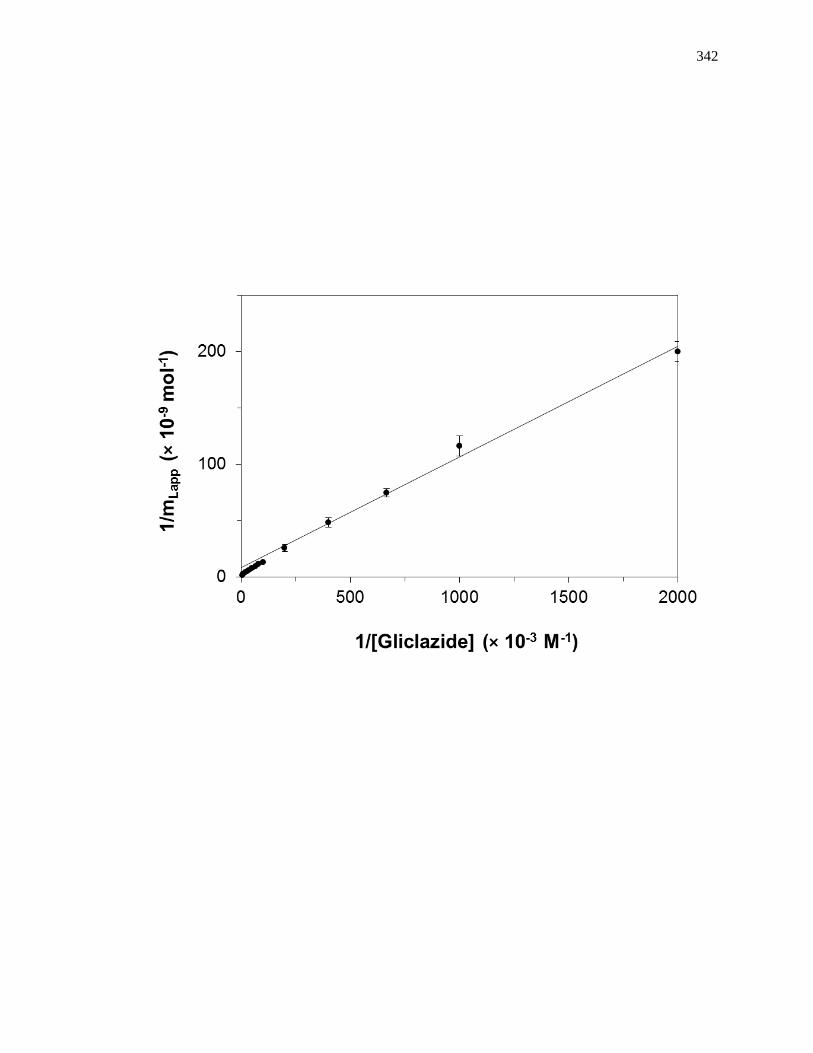
342
343
CHAPTER 8:
QUALITATIVE STRUCTURAL ANALYSIS OF HUMAN SERUM ALBUMIN BY
NANO-ELECTROSPRAY IONIZATION QUADRUPOLE TIME-OF-FLIGHT
MASS SPECTROMETRY
8.1 Introduction
Mass spectrometry (MS) has become an important analytical tool for the
examination of complex protein samples [1]. This is mainly due to the discovery and
development of new tools and techniques in the field of MS that have made it possible to
identify proteins along with providing structural information on a protein’s primary
sequence and post translational modifications (PTMs) [2]. The structure of a protein
plays a major role in gene and cellular regulation, in which PTMs that occur on the
primary sequence can affect a protein’s folding, conformation, stability and function
[1,2].
Human serum albumin (HSA) and related serum proteins have been of growing
interest with regards to PTMs. For instance, non-enzymatic glycation has been shown to
affect the function and structure of such proteins [3-28]. HSA is the most abundant
protein in blood plasma, occurring at concentrations of 35-50 g/L, and accounting for
60% of the total protein content in serum [29,30]. HSA plays a role in processes such as
the regulation of osmotic pressure, the control of pH in blood, and the transportation of
many low mass substances (e.g., hormones, fatty acids, and drugs) [29,30]. HSA has a
molecular weight of 66.5 kDa and is composed of a single peptide chain of 585 amino
acids [29,30]. HSA is a good candidate for structural investigations through MS because
it has a heterogeneous amino acid composition with no repeating sequences [2].
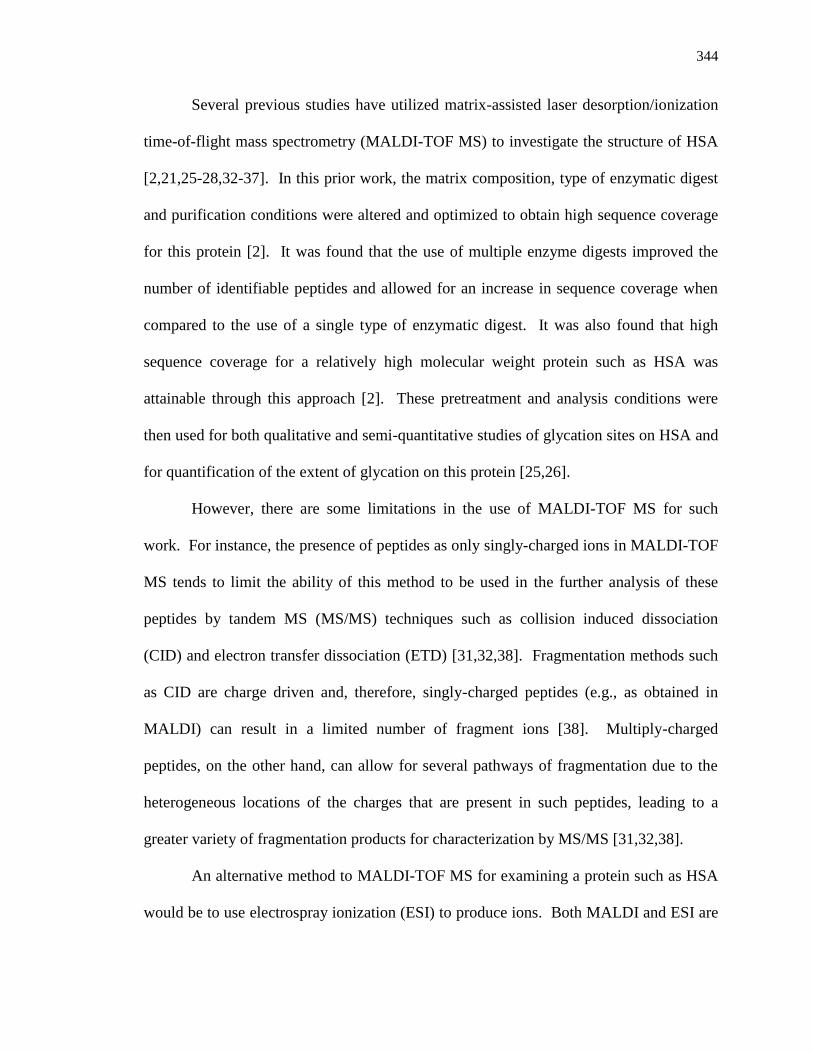
344
Several previous studies have utilized matrix-assisted laser desorption/ionization
time-of-flight mass spectrometry (MALDI-TOF MS) to investigate the structure of HSA
[2,21,25-28,32-37]. In this prior work, the matrix composition, type of enzymatic digest
and purification conditions were altered and optimized to obtain high sequence coverage
for this protein [2]. It was found that the use of multiple enzyme digests improved the
number of identifiable peptides and allowed for an increase in sequence coverage when
compared to the use of a single type of enzymatic digest. It was also found that high
sequence coverage for a relatively high molecular weight protein such as HSA was
attainable through this approach [2]. These pretreatment and analysis conditions were
then used for both qualitative and semi-quantitative studies of glycation sites on HSA and
for quantification of the extent of glycation on this protein [25,26].
However, there are some limitations in the use of MALDI-TOF MS for such
work. For instance, the presence of peptides as only singly-charged ions in MALDI-TOF
MS tends to limit the ability of this method to be used in the further analysis of these
peptides by tandem MS (MS/MS) techniques such as collision induced dissociation
(CID) and electron transfer dissociation (ETD) [31,32,38]. Fragmentation methods such
as CID are charge driven and, therefore, singly-charged peptides (e.g., as obtained in
MALDI) can result in a limited number of fragment ions [38]. Multiply-charged
peptides, on the other hand, can allow for several pathways of fragmentation due to the
heterogeneous locations of the charges that are present in such peptides, leading to a
greater variety of fragmentation products for characterization by MS/MS [31,32,38].
An alternative method to MALDI-TOF MS for examining a protein such as HSA
would be to use electrospray ionization (ESI) to produce ions. Both MALDI and ESI are
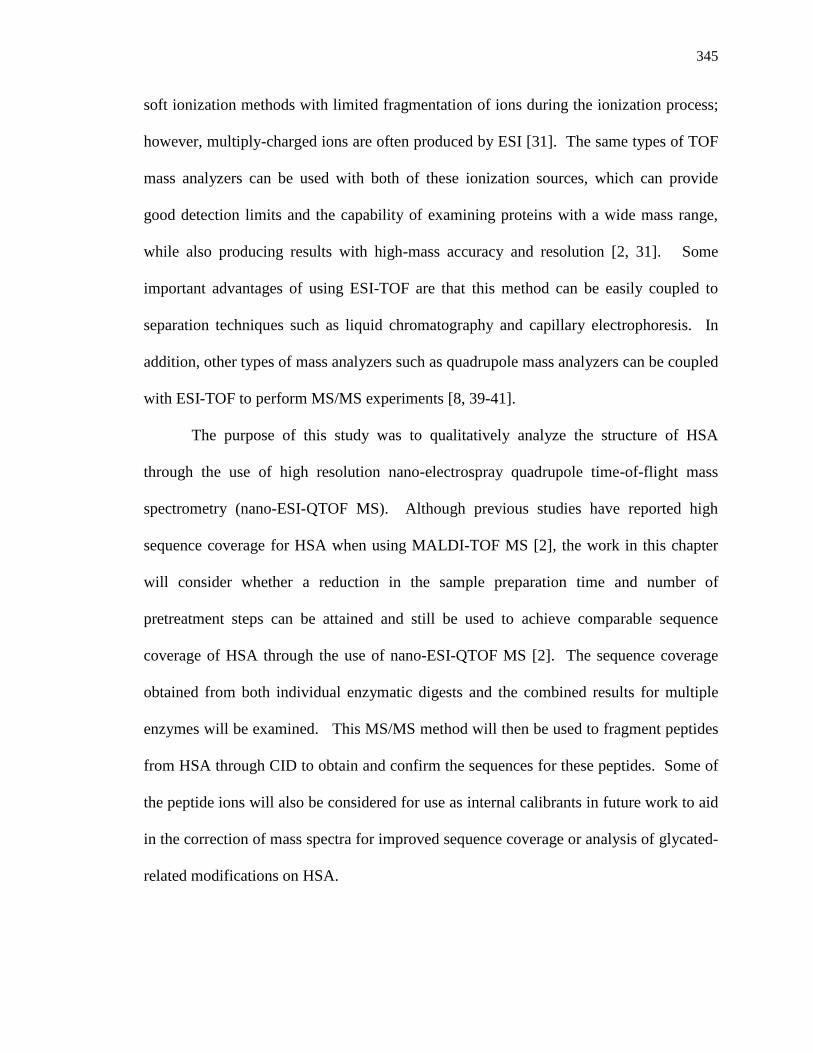
345
soft ionization methods with limited fragmentation of ions during the ionization process;
however, multiply-charged ions are often produced by ESI [31]. The same types of TOF
mass analyzers can be used with both of these ionization sources, which can provide
good detection limits and the capability of examining proteins with a wide mass range,
while also producing results with high-mass accuracy and resolution [2, 31]. Some
important advantages of using ESI-TOF are that this method can be easily coupled to
separation techniques such as liquid chromatography and capillary electrophoresis. In
addition, other types of mass analyzers such as quadrupole mass analyzers can be coupled
with ESI-TOF to perform MS/MS experiments [8, 39-41].
The purpose of this study was to qualitatively analyze the structure of HSA
through the use of high resolution nano-electrospray quadrupole time-of-flight mass
spectrometry (nano-ESI-QTOF MS). Although previous studies have reported high
sequence coverage for HSA when using MALDI-TOF MS [2], the work in this chapter
will consider whether a reduction in the sample preparation time and number of
pretreatment steps can be attained and still be used to achieve comparable sequence
coverage of HSA through the use of nano-ESI-QTOF MS [2]. The sequence coverage
obtained from both individual enzymatic digests and the combined results for multiple
enzymes will be examined. This MS/MS method will then be used to fragment peptides
from HSA through CID to obtain and confirm the sequences for these peptides. Some of
the peptide ions will also be considered for use as internal calibrants in future work to aid
in the correction of mass spectra for improved sequence coverage or analysis of glycated-
related modifications on HSA.
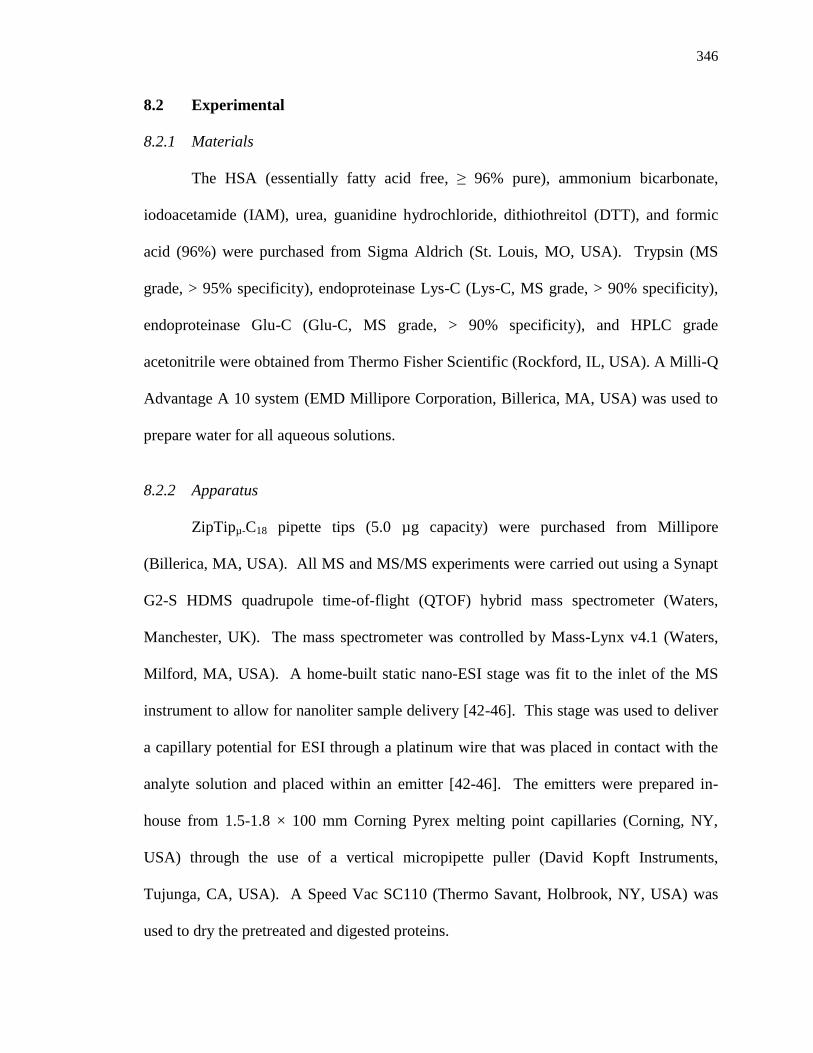
346
8.2 Experimental
8.2.1 Materials
The HSA (essentially fatty acid free, ≥ 96% pure), ammonium bicarbonate,
iodoacetamide (IAM), urea, guanidine hydrochloride, dithiothreitol (DTT), and formic
acid (96%) were purchased from Sigma Aldrich (St. Louis, MO, USA). Trypsin (MS
grade, > 95% specificity), endoproteinase Lys-C (Lys-C, MS grade, > 90% specificity),
endoproteinase Glu-C (Glu-C, MS grade, > 90% specificity), and HPLC grade
acetonitrile were obtained from Thermo Fisher Scientific (Rockford, IL, USA). A Milli-Q
Advantage A 10 system (EMD Millipore Corporation, Billerica, MA, USA) was used to
prepare water for all aqueous solutions.
8.2.2 Apparatus
ZipTipµ-C18 pipette tips (5.0 µg capacity) were purchased from Millipore
(Billerica, MA, USA). All MS and MS/MS experiments were carried out using a Synapt
G2-S HDMS quadrupole time-of-flight (QTOF) hybrid mass spectrometer (Waters,
Manchester, UK). The mass spectrometer was controlled by Mass-Lynx v4.1 (Waters,
Milford, MA, USA). A home-built static nano-ESI stage was fit to the inlet of the MS
instrument to allow for nanoliter sample delivery [42-46]. This stage was used to deliver
a capillary potential for ESI through a platinum wire that was placed in contact with the
analyte solution and placed within an emitter [42-46]. The emitters were prepared in-
house from 1.5-1.8 × 100 mm Corning Pyrex melting point capillaries (Corning, NY,
USA) through the use of a vertical micropipette puller (David Kopft Instruments,
Tujunga, CA, USA). A Speed Vac SC110 (Thermo Savant, Holbrook, NY, USA) was
used to dry the pretreated and digested proteins.
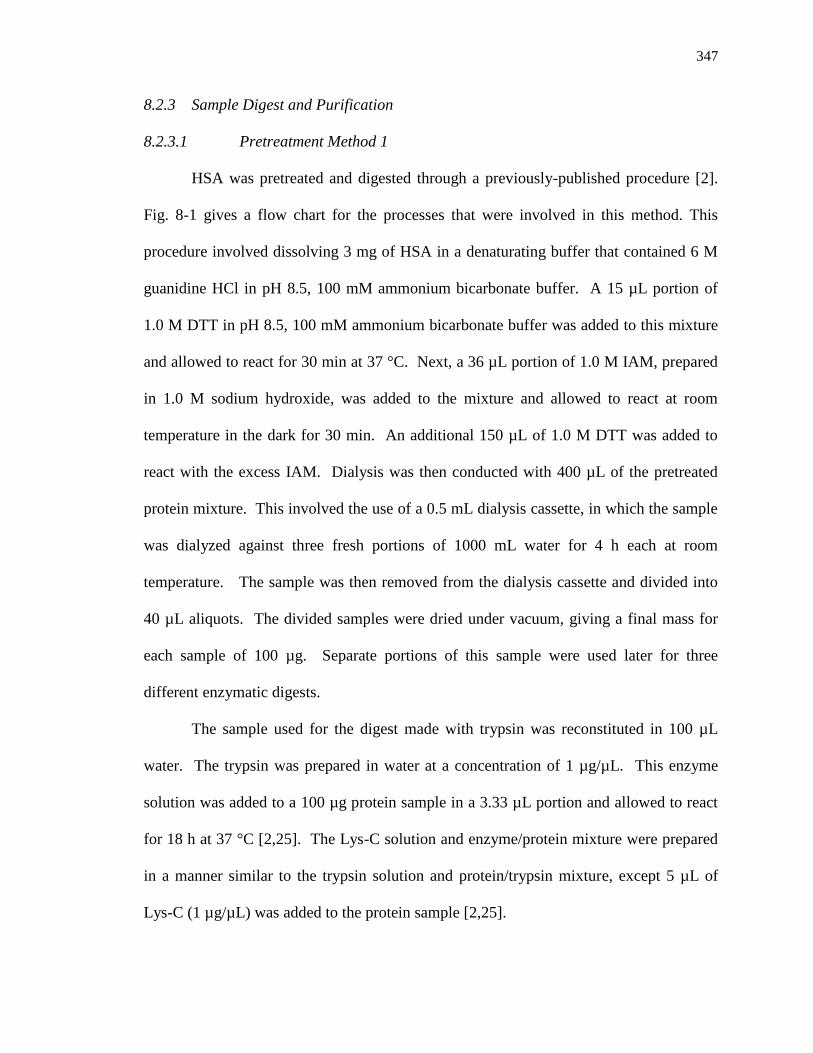
347
8.2.3 Sample Digest and Purification
8.2.3.1 Pretreatment Method 1
HSA was pretreated and digested through a previously-published procedure [2].
Fig. 8-1 gives a flow chart for the processes that were involved in this method. This
procedure involved dissolving 3 mg of HSA in a denaturating buffer that contained 6 M
guanidine HCl in pH 8.5, 100 mM ammonium bicarbonate buffer. A 15 µL portion of
1.0 M DTT in pH 8.5, 100 mM ammonium bicarbonate buffer was added to this mixture
and allowed to react for 30 min at 37 °C. Next, a 36 µL portion of 1.0 M IAM, prepared
in 1.0 M sodium hydroxide, was added to the mixture and allowed to react at room
temperature in the dark for 30 min. An additional 150 µL of 1.0 M DTT was added to
react with the excess IAM. Dialysis was then conducted with 400 µL of the pretreated
protein mixture. This involved the use of a 0.5 mL dialysis cassette, in which the sample
was dialyzed against three fresh portions of 1000 mL water for 4 h each at room
temperature. The sample was then removed from the dialysis cassette and divided into
40 µL aliquots. The divided samples were dried under vacuum, giving a final mass for
each sample of 100 µg. Separate portions of this sample were used later for three
different enzymatic digests.
The sample used for the digest made with trypsin was reconstituted in 100 µL
water. The trypsin was prepared in water at a concentration of 1 µg/µL. This enzyme
solution was added to a 100 µg protein sample in a 3.33 µL portion and allowed to react
for 18 h at 37 °C [2,25]. The Lys-C solution and enzyme/protein mixture were prepared
in a manner similar to the trypsin solution and protein/trypsin mixture, except 5 µL of
Lys-C (1 µg/µL) was added to the protein sample [2,25].
348
Figure 8-1. Comparison of the pretreatment and digestion procedures used in this
study (i.e., “Pretreatment Method 1” and “Pretreatment Method 2”).
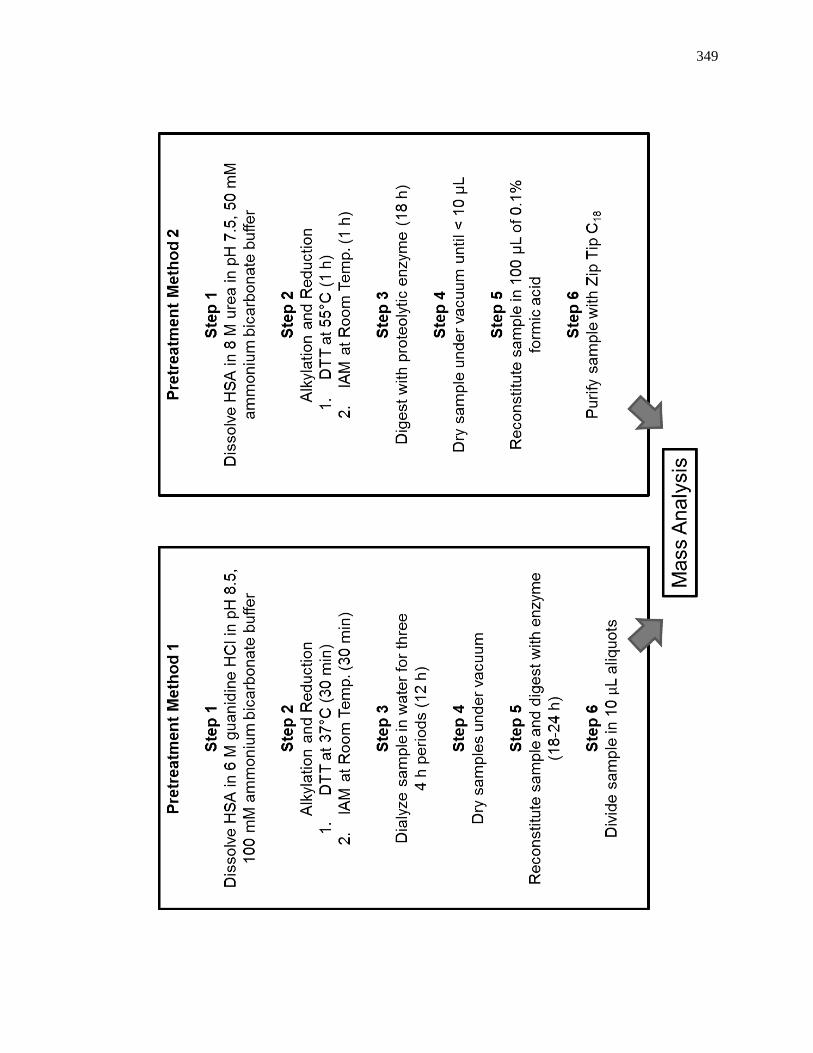
349
350
The Glu-C and Glu-C/protein mixtures were prepared in a similar fashion, with
the protein sample being reconstituted in 100 µL water and the Glu-C being prepared at a
concentration of 1 µg/µL in water [2,25]. However, a 10 µL portion of the enzyme
solution was now added to the protein sample and allowed to react for 8 h at 37 °C
[2,25]. This was followed by the addition of a separate 5 µL portion of the enzyme
solution, after which the digestion mixture was allowed to react for an additional 18 h at
37 °C [2,25].
A 10 µL portion of concentrated formic acid was added to each enzyme/protein
mixture after the given digestion times. Each digested sample was divided into 10 µL
aliquots and stored at -80 °C until further use.
8.2.3.2 Pretreatment Method 2
HSA was also pretreated and prepared according to a second previously-published
procedure for protein digestion [42]. A flow chart for this procedure is also included in
Fig. 8-1. In this case, HSA was pretreated to prepare a sample for three types of digests.
A 1 mg sample of HSA was dissolved in a denaturing buffer that contained 8 M urea in
pH 7.4, 50 mM ammonium bicarbonate buffer. This solution was used to prepare three
pretreated samples. Using separate vials, a 10 µL portion of the denatured protein
solution, containing approximately 100 µg HSA, was combined with 40 µL of 8 M urea
in pH 7.5, 50 mM ammonium bicarbonate buffer and 10 µL of DTT in pH 7.5, 50 mM
ammonium bicarbonate buffer. This mixture was incubated at 55 °C for 1 h. A 10 µL
portion of 500 mM IAM in pH 7.5, 50 mM ammonium bicarbonate buffer was then
added to each mixture, followed by incubation of the new mixtures at room temperature
for 1 h. An additional 175 µL of pH 7.5, 50 mM ammonium bicarbonate buffer was then
351
added to dilute the urea in each mixture [42].
The trypsin, Lys-C and Glu-C solutions were prepared in water at a concentration
of 0.5 µg/µL and added to the pretreated protein samples in 5 µL portions [42]. These
mixtures were incubated at 37 °C for 18 h. Each digest was dried under vacuum to a
final volume of approximately 10 µL. The dried samples were reconstituted in 0.1%
formic acid to a final volume of 100 µL and stored at 0 °C until future use.
ZipTipµ-C18 pipette tips were used to purify these digests prior to their analysis
by MS. The digests were thawed to room temperature prior to being applied to these
pipette tips. The ZipTipµ-C18 pipette tips were first wetted with 10 µL of 100%
acetonitrile and washed with 10 µL of 0.1% formic acid in water. A 10 µL portion of a
reconstituted digest was then loaded onto the tip. The tip was washed using 10 µL of
0.1% formic acid and eluted with 20 µL of an 80:20 acetonitrile:water mixture containing
0.1% formic acid. An alternative to the 80:20 acetonitrile:water mixture elution step
involved splitting this elution step into additional fractions, such as those involving
elution with 10:90, 20:80, 30:70, and 50:50 acetonitrile:water mixtures, as have been
used in a previous study [2].
8.2.4 Mass Spectrometry
A 10 µL portion of a protein digest was placed into an emitter through the use of a
syringe. The emitter was then fit onto the nano-ESI stage. The ESI source was controlled
by MassLynx software and the ionization was carried out by applying a potential of +1.0-
1.4 kV. Other ionization conditions included a sampling cone voltage of +10 V, a source
offset of +10 V, and a source temperature of 80 °C. The samples were sprayed for 10-30
min, with this amount of time being dependent on the type of experiment that was being
352
performed (e.g., MS or MS/MS).
All mass spectra were acquired by using MassLynx and a positive scan mode. A
5 min data acquisition time was used for the MS experiments that involved sequence
analysis. A 2 min data acquisition time was used to perform an initial scan of spectra
when searching for precursor ions for MS/MS analysis; a 5 min data acquisition time was
then used for the MS/MS experiment. The mass range examined for each sample was 50-
2000 m/z. Although some theoretically-predicted masses for peptides from HSA were
higher than 2000 m/z, preliminary studies over a broader mass range of 50-5000 m/z
indicated that the signals for these higher mass peptides were too low to be observed over
the background response under the given experimental conditions used for the MS
measurements.
MS/MS experiments were carried out by using CID. The instrument used in these
experiments was equipped with a trap region comprised of a stacked ring ion guide,
which served as the collision cell for CID. The pressure of this cell was 5.0 × 10⁻³
mbar,
with argon being used as the collision gas. A quadrupole mass analyzer was used to
select precursor ions that were identified from the sequence analysis experiments and that
were selected from an initial MS scan of the protein digest. The selected precursor ions
were then subjected to fragmentation in the collision cell. The collision energy that was
used for the CID experiments ranged from +10-50 V and was dependent on the size and
sequence length of the peptide [47,48]. Previous studies have shown that peptides with
larger masses require a larger collision energy for fragmentation vs. peptides with smaller
masses [47,48].
353
8.2.5 MS Calibration and Data Analysis
Before it was used to carry out a mass analysis for digested samples of HSA, the
MS instrument was calibrated through use of MassLynx and a sample of cesium iodide
(CsI). CsI is commonly used as a calibrant in ESI-MS because of its ability to form
cluster ions in an even manner and over a wide range of m/z values [49]. Cs and I also
are monoisotopic, which allows for the production of symmetrical MS peaks from these
atoms, an ideal property for calibrating an MS instrument for high resolution and high
mass accuracy measurements [49].
For this study, a 50 mg/mL solution of CsI was prepared in a 50:50 mixture of
acetonitrile and water. A 10 µL aliquot of this CsI solution was applied through the ESI
source, which provided CsI cluster ions over the mass range of 200-3000 m/z. The
resulting spectrum was matched to a theoretical database found in the MassLynx
calibrant library. This process allowed for calibration of the instrument to a mass
accuracy of less than 0.001 Da, or less than 5 ppm. The calibrated mass spectrometer
was then used for MS and MS/MS experiments with HSA.
The data obtained from the MS experiments were acquired and analyzed through
the use of MassLynx v4.1 and mMass v5.50 software (Open Source Mass Spectrometry
Tool, M Strohalm, Prague, Czech Republic). MassLynx was used to combine all of the
acquired data and to obtain an average spectrum for a group of samples. Each spectrum
was then processed with the smoothing function of MassLynx, based on a 3 × 3 window
with a 3 cycle smooth in a mean smoothing method.
The resulting spectra were converted into text files and analyzed through the use
of mMass software. The spectra were processed with the peak picking tool found in
354
mMass, with this tool being was used to set the baseline of a spectrum and to allow peaks
to be identified by varying the signal-to–noise ratio or intensity thresholds [50]. The
baseline for all of the spectra that were processed in this study was set by varying the
relative intensity threshold between 1 and 2%. The deisotoping tool of mMass was used
to remove unwanted isotope peaks and to set the peak’s charge, where the maximum
allowed charge was +4. The resulting peaks were then processed with the deconvolution
tool in mMass to group them together according to their m/z values and peak widths. The
parameters for the deconvolution tool were selected for a monoisotopic mass type and a
grouping window of 0.01 m/z [50]. No additional smoothing or baseline corrections were
used in processing the spectra with mMass. Once set, the peak picking function was used
to identify peptide peaks throughout the entire spectrum.
The sequence tool in mMass was used to compare the masses of the identified
peptide peaks to the masses that were obtained for a theoretically predicted digest of HSA
when using a given digestion enzyme. The primary sequence of HSA is shown in Fig. 8-
2 [2,51]. To obtain a theoretically predicted digest, a “new” sequence was selected from
the sequence tab in mMass and the complete sequence of HSA was entered into the
sequence editor. Next, the parameters for possible chemical modifications were selected
from the sequence modification tab. Because alkylation was carried out during sample
pretreatment to cap reactive cysteines on HSA, a fixed iodacetamide modification on
cysteine residues was first added to the list of sequence modifications. The oxidation of
methionines was another modification that was included in the list of possible chemical
modifications; however, this was set as a variable modification.
In the next step, the protein digest tab of mMass was selected and the digest
355
Figure 8-2. Primary sequence of HSA [2,51]
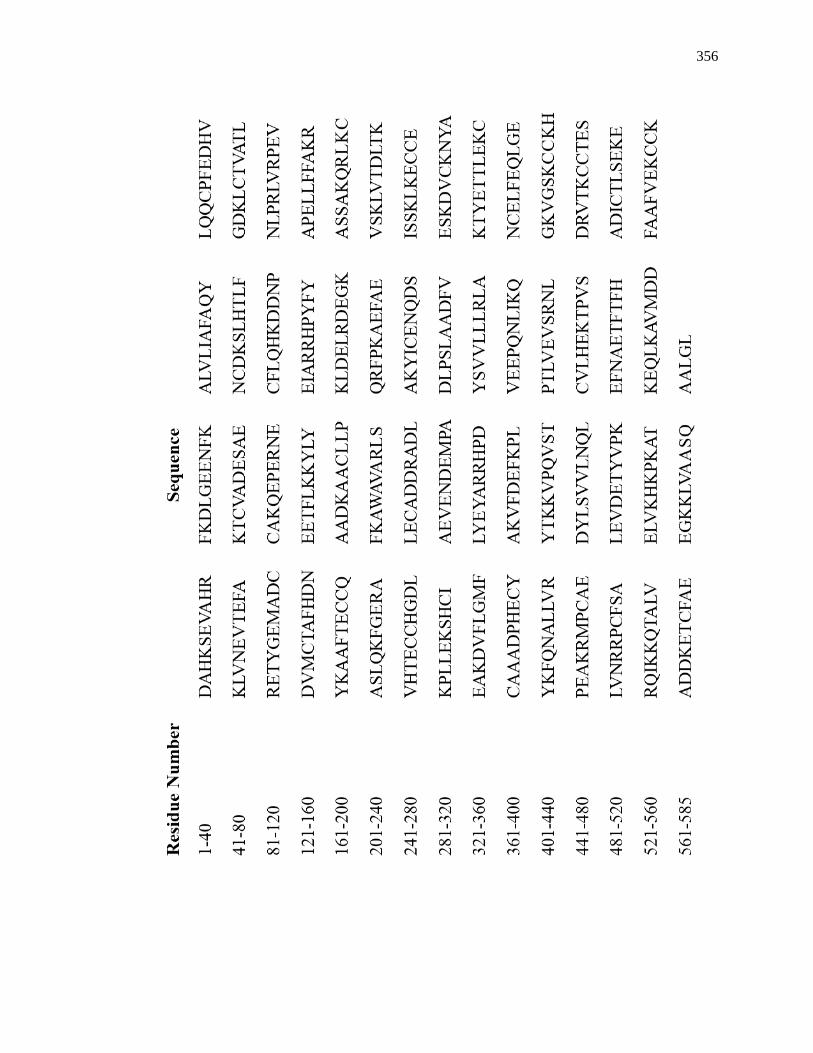
356
357
parameters were set to search for monoisotopic masses with a maximum charge of +4.
The number of allowed missed cleavage sites for the digest was set to three for a mass
range going from 50 to 5000 m/z. The individual enzymes that were used for the
digestion were selected from the mMass database and used to predict the theoretical
digestion pattern of HSA and the peptides that would be formed through digestion with
these enzymes. The predicted peptides were matched with the peak masses that were
obtained in a processed experimental spectrum by using the match peptide function in
mMass. The tolerance for the search parameter was set to 50.0 ppm.
Peptides were selected from an MS spectrum and examined through MS/MS
analysis. The spectra for the fragment ions from MS/MS experiments were processed in
a similar way to that which was already described for an MS spectrum. The spectra for
each experiment were once again combined to produce an average spectrum by using
MassLynx. The data were then smoothed by using the same settings as already described
for the MS spectra. The data were also again converted into a text file and analyzed by
mMass. Following a similar peak picking parameter configuration to what was described
previously, mMass was used to select peaks from a fragment ion spectrum. The peptide
sequence of the selected peptide was then entered into the sequence editor. The expected
or possible modifications to cysteine and methionine were again added for the selected
peptide, using the same parameters as described for the sequence modification tab when
examining MS spectra. Next, rather than generating a theoretical digest, the peptide
fragmentation tab was selected. The parameters under this tab were set to look at
monoisotopic masses with a maximum charge of +4 and with the b ion and y ion options
both being selected. The theoretically predicted fragments were then processed and
358
matched to the experimental spectrum for the fragment ions by using a tolerance of 50.0
ppm.
8.3 Results
8.3.1 Sample Digestion and Purification
The digestion of HSA was first carried out by using “Pretreatment Method 1”, as
described in Section 8.2.3.1 and Fig. 8-1 [2]. This procedure involved the pretreatment
of HSA by means of alkylation and reduction, followed by dialysis to remove the
unreacted and excess pretreatment agents and solvents. The protein samples were then
treated with three types of proteolytic enzymes. The total time for the entire preparation
procedure was 3-4 days. In this method, MS analysis was performed on the digests
without the use of any further purification steps.
Another procedure, “Pretreatment Method 2” (described in Section 8.2.3.2 and
Fig. 8-1), was used to improve the sequence coverage and shorten the time needed to
prepare the digested samples [42]. In this approach, the pretreatment and digestion
processes were carried out sequentially in a single vial. This procedure also used lower
concentrations of the protein and pretreatment reagents than Pretreatment Method 1. The
pretreatment conditions for alkylation and reduction were similar to those in Pretreatment
Method 1; however, the time for the reduction and alkylation steps was increased from 30
min to 1 h. In addition, the reduction of disulfide bonds by dithiothreitol was now carried
out at 55 °C instead of 37 °C. Dialysis was not used to remove the excess pretreatment
reagents and solvents in this case. Three samples consisting of the pretreated protein
were again digested with three types of proteolytic enzymes. One change to the digestion
process was that the sample treated with Glu-C was now digested for the same amount of
359
time as the Lys-C and trypsin treated samples. The pretreatment and digestion time was
reduced to 1-2 days from the total time of 3-4 days that was used in Pretreatment Method
1. Prior to MS analysis, each sample was purified and fractionated by using the ZipTipµ-
C18 pipette tips.
8.3.2 Comparison of Sequence Coverages for Various Digests
MS analysis was conducted through the conditions that were described in Section
8.2.4. Sequence analysis was carried out for the protein digests by using a maximum
50.0 ppm mass difference when comparing the peptide masses found for the sample to
those that were predicted for a theoretical digest. Fig. 8-3(a) shows a MS spectrum for a
tryptic digest of HSA that was pretreated and digested according to Pretreatment Method
1. As shown in this figure, the spectrum of the tryptic digest gave relatively low S/N
ratios for its peaks. As described in Section 8.2.4, the cutoff relative intensity threshold
during the analysis of this MS data was set between 1 and 2%. Most of the peaks in the
spectrum for the tryptic digest fell below this threshold and could not be differentiated
from the background signal under these criteria. Similar results were obtained during the
MS analysis of the Glu-C and Lys-C digests that were prepared according to Pretreatment
Method 1.
Table 8-1 summarizes the MS results for the various digests that were prepared
according to Pretreatment Method 1. This method resulted in the identification of 42
peptides in the tryptic digest, which corresponded to a sequence coverage of 36.9% for
HSA. The Glu-C and Lys-C digests had 43 and 21 identified peptides, respectively,
which corresponded to sequence coverages of 39.1% and 32.1% for HSA.
Similar MS experiments were conducted on digests that were prepared according
360
Figure 8-3. Mass spectrum for a tryptic digest of HSA, as prepared according to (a)
Pretreatment Method 1 and (b) Pretreatment Method 2, as described in
Fig. 8-1.
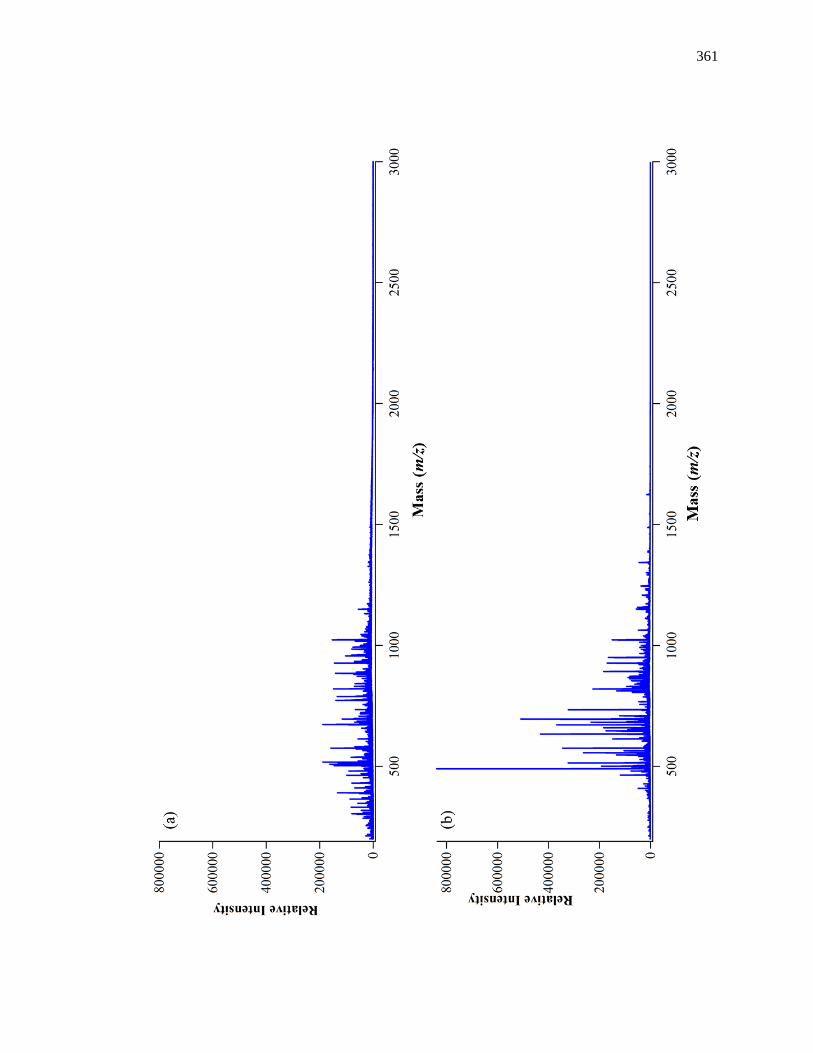
361
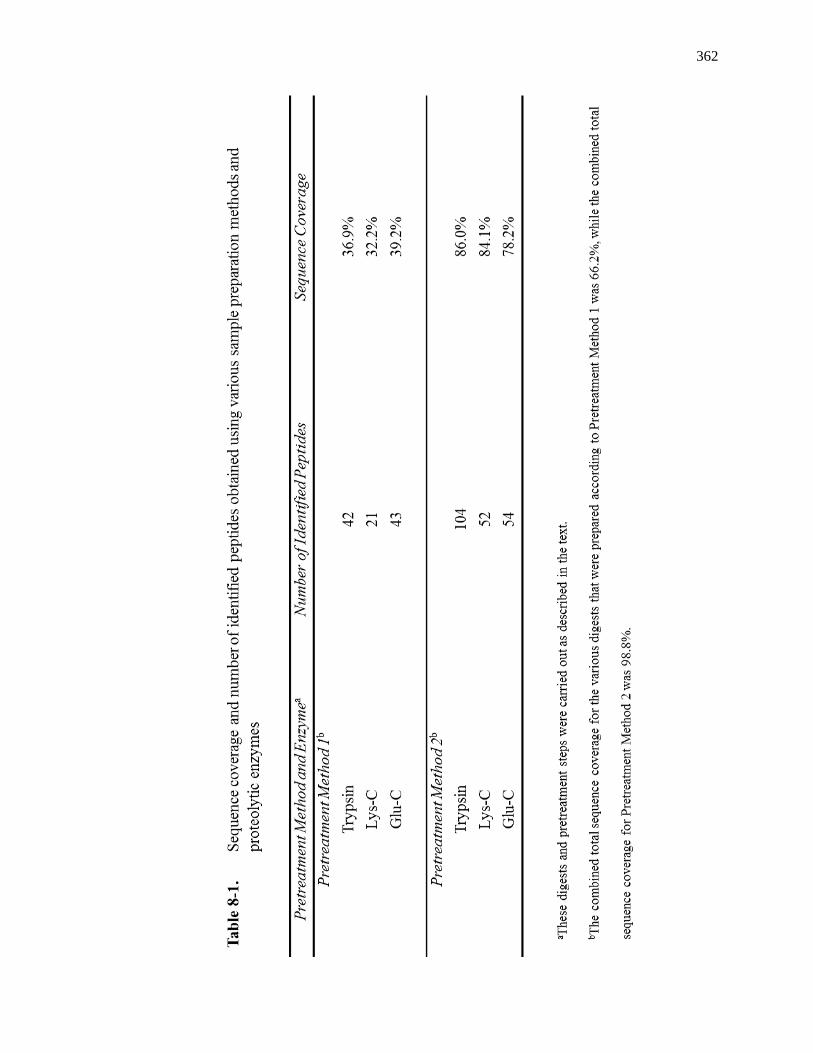
362
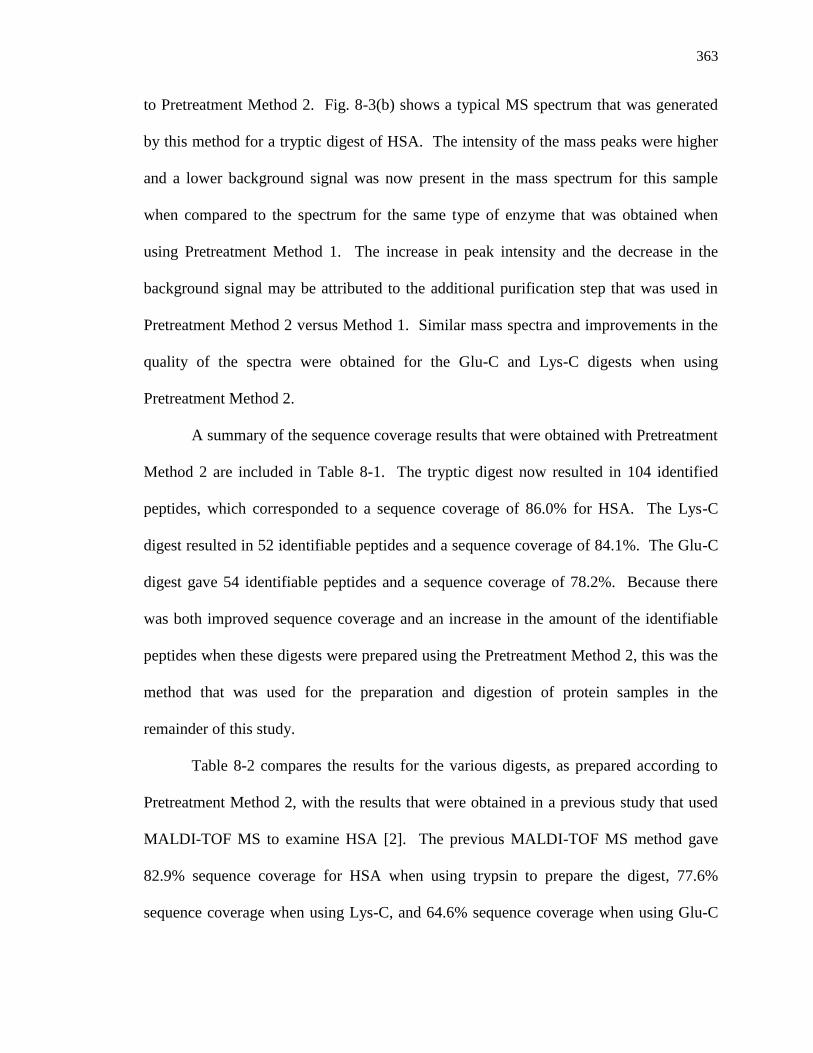
363
to Pretreatment Method 2. Fig. 8-3(b) shows a typical MS spectrum that was generated
by this method for a tryptic digest of HSA. The intensity of the mass peaks were higher
and a lower background signal was now present in the mass spectrum for this sample
when compared to the spectrum for the same type of enzyme that was obtained when
using Pretreatment Method 1. The increase in peak intensity and the decrease in the
background signal may be attributed to the additional purification step that was used in
Pretreatment Method 2 versus Method 1. Similar mass spectra and improvements in the
quality of the spectra were obtained for the Glu-C and Lys-C digests when using
Pretreatment Method 2.
A summary of the sequence coverage results that were obtained with Pretreatment
Method 2 are included in Table 8-1. The tryptic digest now resulted in 104 identified
peptides, which corresponded to a sequence coverage of 86.0% for HSA. The Lys-C
digest resulted in 52 identifiable peptides and a sequence coverage of 84.1%. The Glu-C
digest gave 54 identifiable peptides and a sequence coverage of 78.2%. Because there
was both improved sequence coverage and an increase in the amount of the identifiable
peptides when these digests were prepared using the Pretreatment Method 2, this was the
method that was used for the preparation and digestion of protein samples in the
remainder of this study.
Table 8-2 compares the results for the various digests, as prepared according to
Pretreatment Method 2, with the results that were obtained in a previous study that used
MALDI-TOF MS to examine HSA [2]. The previous MALDI-TOF MS method gave
82.9% sequence coverage for HSA when using trypsin to prepare the digest, 77.6%
sequence coverage when using Lys-C, and 64.6% sequence coverage when using Glu-C
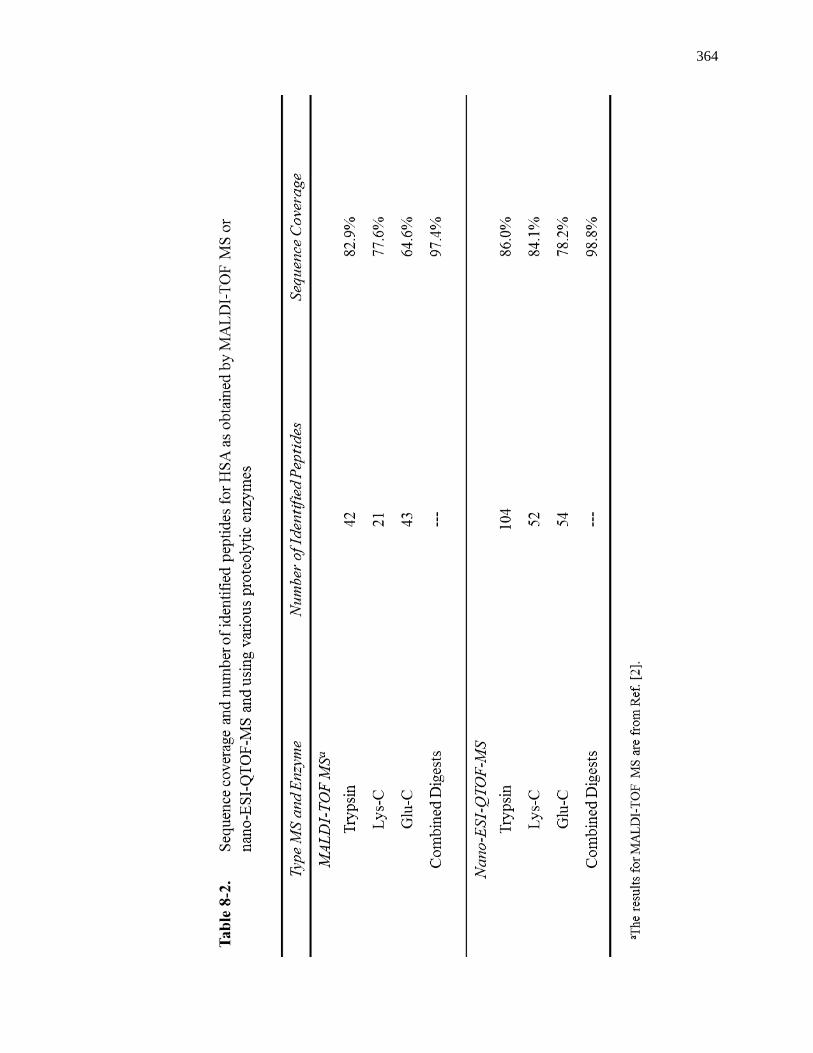
364
365
[2]. The numbers of identified peptides in these digests were 56, 41, and 28, respectively
[2]. When compared to the results obtained here by using nano-ESI-QTOF MS, a greater
number of identifiable peaks were observed for all of the digests in the nano-ESI-QTOF
MS approach. The various digests had similar sequence coverages in the two approaches
except for the tryptic digest, which gave a slightly higher sequence coverage when using
nano-ESI-QTOF MS. Overall, these results showed that nano-ESI-QTOF MS could be
used to obtain similar or higher sequence coverages to MALDI-TOF MS [2].
To further compare the sequence coverage results for the nano-ESI-QTOF MS
and MALDI-TOF MS methods, an additional set of experiments was conducted. Instead
of using a single elution step during the purification process, additional elution steps were
now added to see if further improvements could be made in the sequence coverage. A
similar elution procedure to the previous MALDI-TOF MS study, as described in Section
8.2.3.2, was used to prepare these samples [2]. The collected fractions for the various
digests were analyzed using the same MS conditions as described for the nano-ESI-
QTOF MS method. The combined results for the collected fractions gave sequence
coverages of 83.2% for trypsin, 72.6% for Lys-C, and 91.5% for GluC. These coverage
results were slightly higher than both the single-elution step nano-ESI-QTOF MS method
and MALDI-TOF MS method for the tryptic and Glu-C digests, but were slightly lower
for the Lys-C digest.
Overall, when compared to MALDI-TOF MS, the nano-ESI-QTOF MS method
required a shorter preparation time, fewer pretreatment steps, and could utilize fewer
types of digests to obtain higher sequence coverage. Although previous work showed
that high sequence coverage of HSA could be obtained by MALDI-TOF MS, in this prior
366
research the digested HSA samples were first separated and eluted as multiple fractions,
which were then examined individually to acquire their mass spectra [2]. This procedure
resulted in the production of several elution steps and samples that needed to be analyzed
by MS. Although this type of fractionation can increase the sequence coverage, as was
also demonstrated by the nano-ESI-QTOF MS analysis of the fractionated samples, the
use of a single elution step for purification prior to nano-ESI-QTOF MS also could
provide relatively high sequence coverage for HSA.
In the previous MALDI-TOF MS procedure, 0.5 µL portions of the fractionated
protein digests (at concentrations of ~0.822 µg/µL of tryptic digest, ~0.870 µg/µL of Lys-
C digest, and ~ 1.25 µg/µL of Glu-C) were individually mixed with the MALDI matrix
and spotted onto a plate for MS analysis [2]. The use of multiple fractions increased the
overall amount of sample that was needed for the MS analysis. Although a 20 µL sample
of the purified protein digest (at concentrations of ~ 1 µg/µL for each digest) was
prepared for use in the nano-ESI-QTOF MS method, the sample could be placed directly
into the nano-ESI emitter and sprayed in nanoliter volumes to obtain a mass spectrum. In
addition, the remaining sample from the nano-ESI emitter could be collected and stored
for future experiments.
Another difference in these methods was that the nano-ESI-QTOF MS
experiments produced multiply-charged ions, which could be further analyzed through
MS/MS [8,38]. This made this approach more convenient to use than MALDI-TOF MS
to confirm the sequences of peptides in each digest through the use of MS/MS
experiments.
367
8.3.3 Use of Multiple Enzyme Digests with nano-ESI-QTOF MS
The results for all the enzymatic digests were combined to determine the overall
sequence coverage that could be obtained for HSA by nano-ESI-QTOF MS. Fig. 8-4
shows the total sequence coverage that was obtained when combining the results of the
individual digests, as well as the results for the separate digests. The total sequence
coverage was 98.8% when combining all three types of digests, in which 578 out of the
585 amino acids in HSA were represented. The N-terminus and C-terminus were
included in this sequence coverage. The peptide sequence that was not covered
corresponded to residues 535-541 (HKPKATK). This coverage included 56 out of 59
lysines in HSA and all of the arginine residues, which are of interest because lysine and
arginine are potential sites for glycation [3]. Based on a recent review of the possible
glycation sites on HSA, it was determined that the three missed lysine residues were not
major sites for such modifications [3].
The results for the sequence analysis for the fractionated digested samples were
also combined to determine the overall sequence coverage from the three different
digests. These results gave an overall sequence coverage of 99.7%, in which a total of
583 out of 585 residues in HSA were now covered. The missing residues, however, came
from a different region that was now at 312-313 (SK). Previous reports have shown that
K313 is susceptible to modification by glycation [3].
In the previous MALDI-TOF MS method, 97.4% sequence coverage was
obtained when combining data for the same group of enzymes [2]. In this case, all but 15
out of the 585 amino acids were included, with the missing regions occurring at residues
1-4 (DAHK), 314-317 (DVCK), and 535-541 (HKPKATK) [2]. The N-terminus was not
368
Figure 8-4. Total sequence coverage of HSA that was obtained when combining the
sequence coverages for tryptic (shown in underline), Lys-C (in bold), and
Glu-C (in italics) digests. These results were obtained using a tolerance
level that was equal to a maximum 50.0 ppm mass difference for each
positive match.
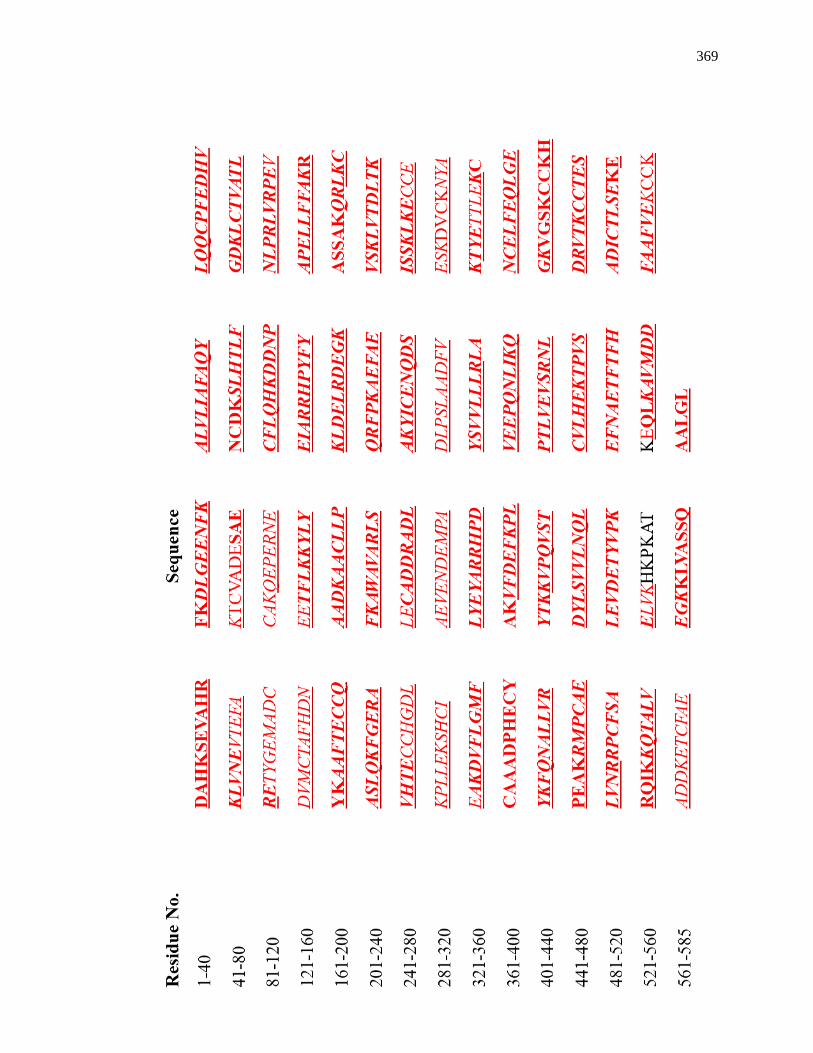
369
370
included in this coverage, but the C-terminal region was included. All but 5 of the 59
lysines and all of the arginines in HSA were included in this sequence coverage. In the
missed regions, K4, K536, K538, and K541 have been previously reported as glycation
modification sites, but are not major sites for this process [3]. However, K317 is
considered one of the major sites of glycation. Neither the MALDI-TOF MS method nor
the nano-ESI-QTOF MS method covered the region 535-541(HKPKATK) [2]. Although
the fractionated nano-ESI-QTOF MS method covered this region, as described
previously, the sequence coverage produced by this method resulted in another
susceptible glycation site being missed.
8.3.4 MS/MS for Internal Calibrants
As mentioned earlier, the ability to perform MS/MS experiments is an important
advantage of using nano-ESI as an ionization source, in which information about the
amino acid sequence can be obtained through the fragmentation of a peptide. CID is one
of the most common MS/MS techniques that is used for fragmentation [8]. In CID, an
accelerated precursor ion is collided with a neutral collision target (e.g., argon). This
results in the partial conversion of kinetic energy to internal energy, resulting in
fragmentation of the peptide [8].
As is shown in Fig. 8-5, fragmentation in this process occurs at the peptide
linkage and results in fragments known as “b ions” and “y ions” [47,48]. The type of ion
that is produced will depend on which part of the peptide fragment retains the charge. If
the fragment containing the amino group retains the charge, then a b ion (or oxazalone
ion) is formed. If the fragment containing the carboxyl group retains the charge, then a y
ion is formed. The masses of the b and y ions can then be matched to a theoretical
371
Figure 8-5. General scheme for fragmentation by CID.
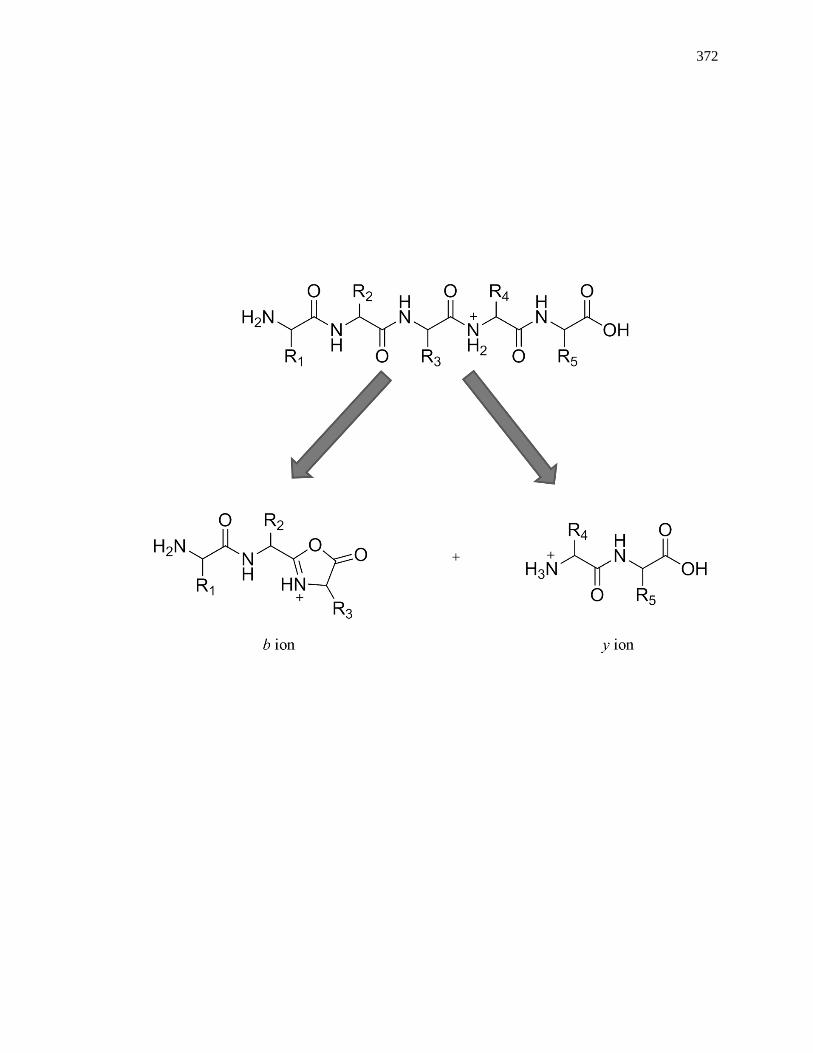
372

373
fragmentation pattern for the peptide of interest to give the sequence [47,48].
MS/MS experiments were performed with several peptides that were identified in
the spectra from the various digests of HSA. These experiments were performed not only
to confirm the identity of the peptides but also to test the use of some of these peptides as
potential internal calibrants. The identification of possible internal calibrants was of
interest because the same peptides could then be used in other spectra for the same
protein to correct the masses of other peptides [52,53]. Internal calibrants can allow for
improved mass accuracy when searching for differences between the masses of modified
peptides and unmodified peptides, such as those that might be observed in glycation-
related modifications [3,25,26]. This improved mass accuracy should then allow for
more accurate measurements of the masses of the modifications, which could be used in
determining the types of PTMs that have occurred [52]. For instance, this improved mass
accuracy would make it easier to differentiate between modifications that may have
similar masses [52].
There were around 6-7 unique peptides that were selected for HSA from each
type of digest for use as possible internal calibrants. One of these peptides, 337-348
(RHPDYSVVLLLR), was selected because it contained no lysine residues; other
peptides were simply selected because they represented masses from different regions of
the mass spectrum. Another important selection criterion was that each of these peptides
had relatively high signal intensity. A high signal intensity was desirable for later use of
these peptides in MS/MS experiments to make it easier to see the mass spectra for their
resulting fragment ions.
An example of peaks that were selected as internal calibrants from the tryptic
374
digest of HSA is shown in Fig. 8-6; this figure is an enlarged version of the spectrum in
Fig. 8-3(b), with the selected peaks now being labeled. Each of the selected peptides was
subjected to collision energies ranging from +10 to +50 V. The collision energy that was
employed was dependent on the degree of fragmentation for the peptide, where some
peptides required more energy to increase the amount of fragment ions [48,49].
Table 8-3 summarizes the peptides, sequences, and peptide masses that were
selected from each of the digests for testing and possible use as internal calibrants. For
the tryptic digest, a total of 6 peptides were selected. An example of a MS/MS spectrum
for a peptide with a mass of 734 m/z from this digest is provided in Fig. 8-7. The b and y
ions in this spectrum were identified by matching the masses of these ions to masses that
were obtained for a theoretical fragmentation pattern for the suspected sequence of the
peptide. This method of analysis provided confirmation of the identity and sequence of
the given peptide. Similar methods of analysis were performed for the other selected
peptides from the tryptic digest. A total of 7 peaks each were similarly selected from the
Lys-C and Glu-C digests of HSA. Analysis of the fragment ion mass spectra for these
digests and peptides was then carried out in the same way as described for the tryptic
digest to confirm the identity and sequences of these selected peptides.
Internal calibration of spectra obtained from future work with HSA or glycated
forms of HSA and similar enzymatic digests could be conducted by entering the peptide
masses for the selected calibrants from the individual digests. The masses of the internal
calibrants could then be matched to masses from the experimental peak list, in which the
correct mass of the calibrant could be entered as the theoretical mass for the selected
peak. The entire mass spectrum could then be adjusted based on these internal calibrants.
375
Figure 8-6. Mass spectrum of a trypsin-digested HSA sample, in which peaks that
were selected for internal calibration are indicated by an asterisk (*).
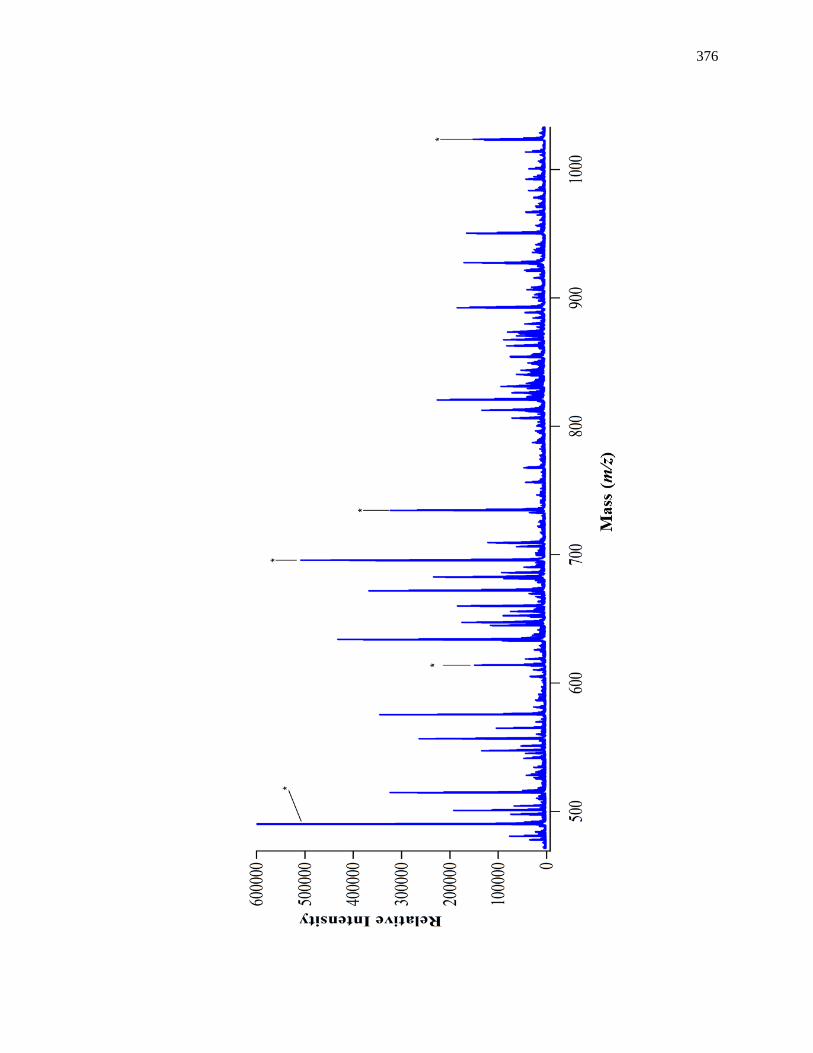
376
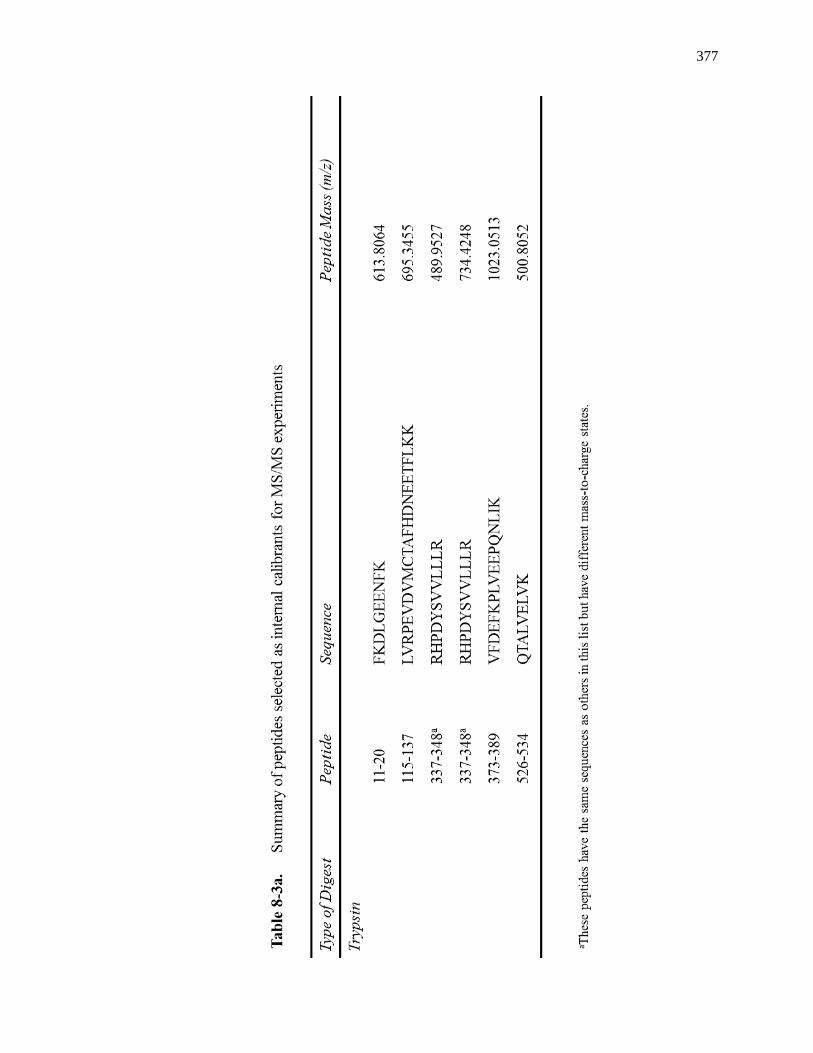
377
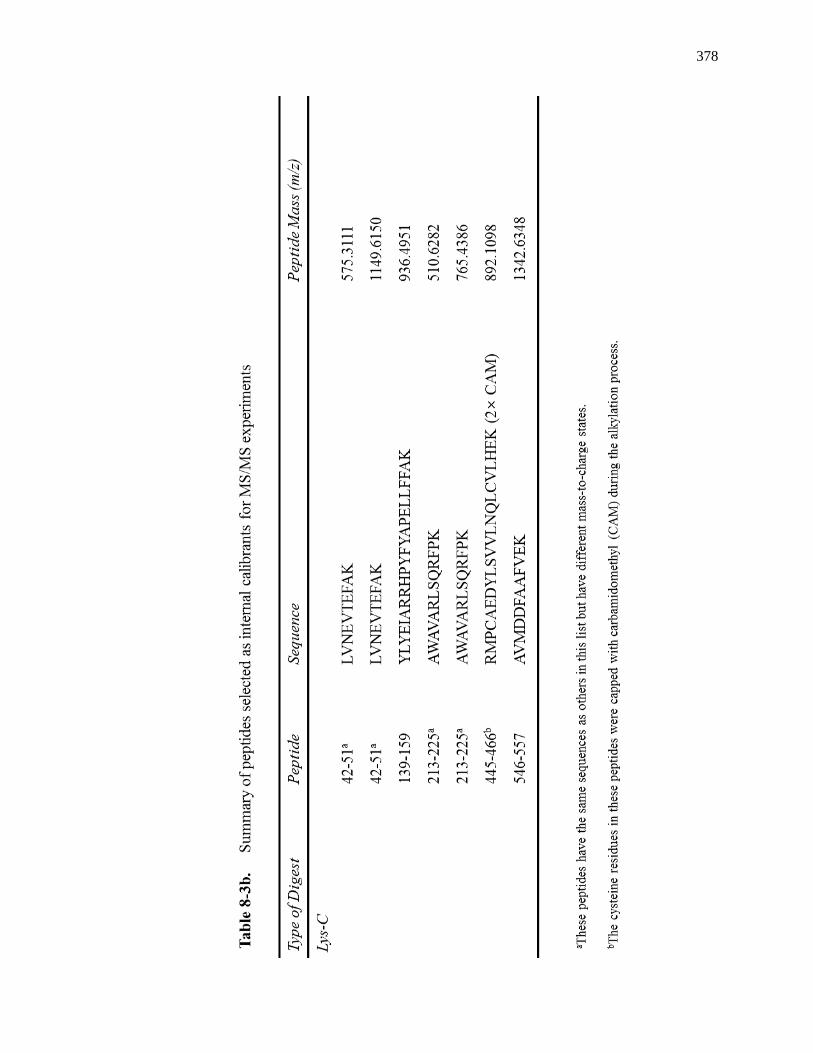
378
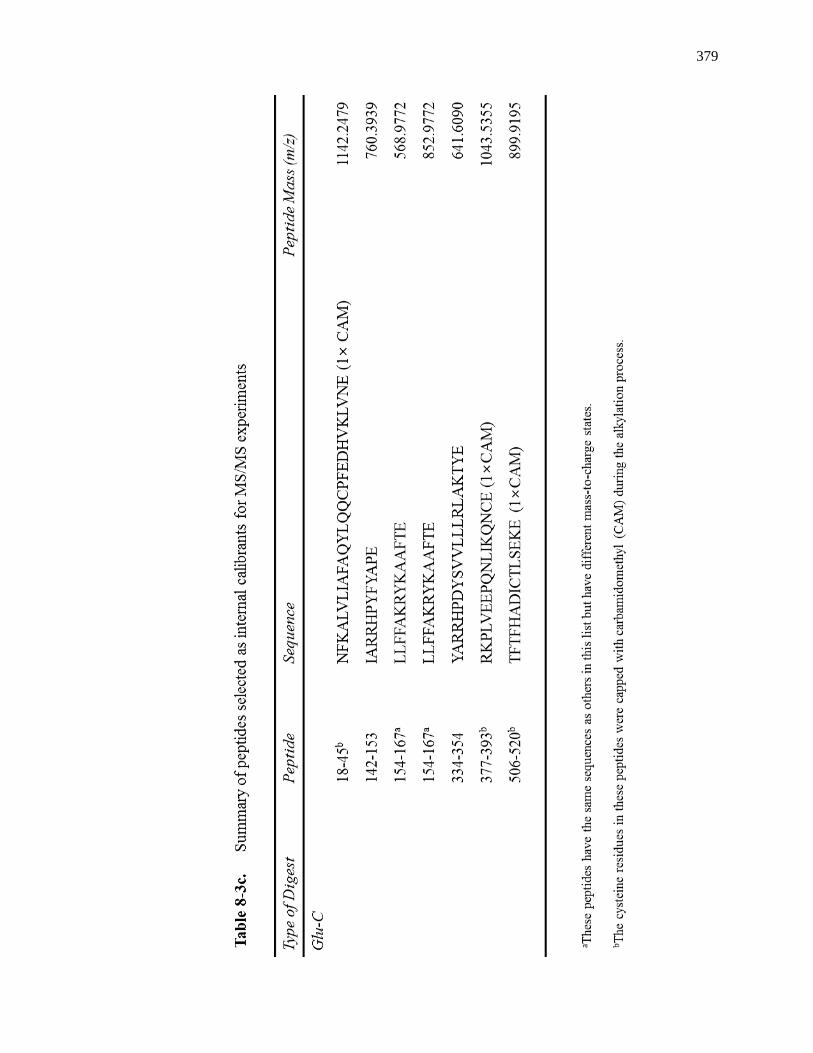
379
380
Figure 8-7. MS/MS spectrum for the fragmentation of a peptide with a mass-to-charge
ratio of 734 m/z. This peptide corresponded to the 373-348 region of
HSA, which has a sequence of RHPDYSVVLLLR.
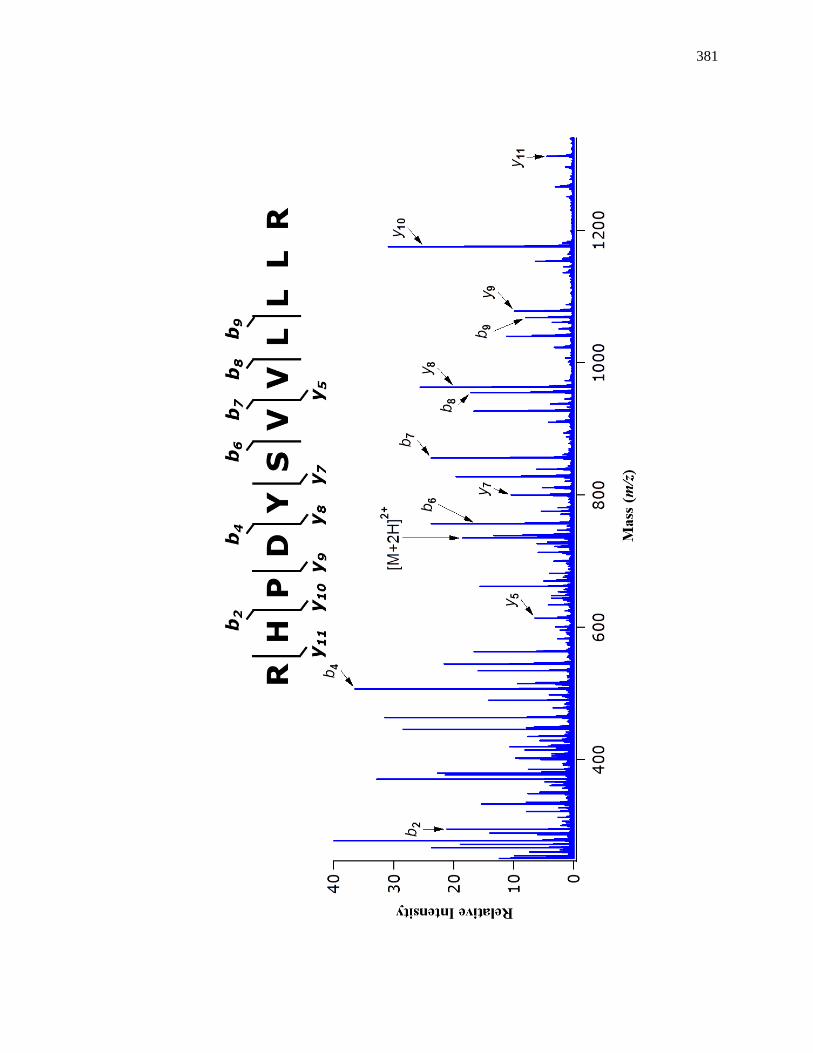
381
382
To illustrate this approach, a preliminary study was carried out in the analysis of
another set of trypsin, LysC, and Glu-C digests of HSA. As demonstrated in the residual
plot in Figure 8-8, there was a large 75 ppm deviation away from the best-fit line for the
residuals that was obtained after performing a sequence analysis match between a mass
spectrum of a Glu-C digest of HSA and theoretically predicted Glu-C digest. Similar
deviations were observed in the analysis of the trypsin and Lys-C digests. If the sequence
analysis was conducted using a 50 ppm mass tolerance, a lower sequence coverage would
be obtained because a majority of the masses would be found outside of the search mass
tolerance range. The sequence coverage could be improved by calibrating and correcting
the mass spectrum with the internal calibrants. As shown in the other set of residuals in
the plot in Fig. 8-8, the residuals in the calibrated data set were now centered about the
best-fit line. A smaller mass difference was also apparent and, therefore, a lower mass
tolerance could have been used during the sequence analysis. Similar results were
obtained when the internal calibrants were implemented in work with the trypsin and
Lys-C digests.
To further illustrate the use of internal calibration and sequence coverage at a
lower mass tolerance, an analysis was conducted on the calibrated mass spectra for the
trypsin, Lys-C and Glu-C digests by using a 25 ppm mass tolerance. The individual
digests had sequence coverages of 79.8% for trypsin, 86.5% for Lys-C and 78.9% for
Glu-C with a 96.1% total sequence coverage when the results were combined. These
results were comparable to previous results with both the MALDI-TOF MS and nano-
ESI-QTOF MS methods that were obtained when using a 50 ppm mass tolerance [2].
383
Figure 8-8. Residual plots mass differences between an experimentally prepared
digests with the masses from a theoretically predicted digest. The plots
are for the uncalibrated (■) and calibrated spectra (♦) mass difference
results.
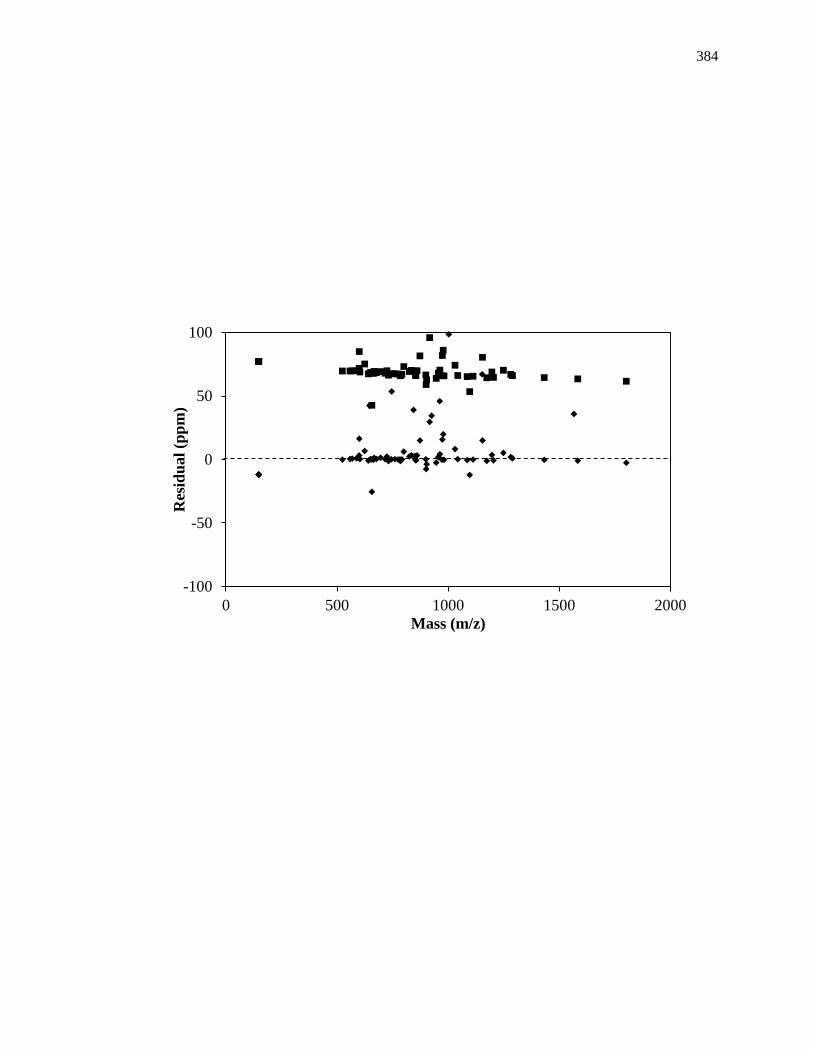
384
-100
-50
0
50
100
0 500 1000 1500 2000
Res
idu
al
(pp
m)
Mass (m/z)
385
8.4 Conclusion
This study examined the use of nano-ESI-QTOF MS to obtain a high sequence
coverage for the analysis of HSA, which was used here as a model for a relatively high
molecular weight protein. The methods used for the pretreatment and digestion of this
protein were varied and optimized to decrease the preparation time and improve the
sequence coverage. The final optimized conditions gave high sequence coverages for
individual digests based on trypsin, Lys-C or Glu-C, which result in sequence coverages
that ranged from 78.2-86.0%. These results were comparable to those obtained in a
previous study that used MALDI-TOF MS for the same protein [2]. A sequence
coverage of 98.8% was obtained when combining the results for all of these digests. This
sequence coverage was slightly higher than the value of 97.4% that has been obtained by
MALDI-TOF MS [2] and slightly lower than the 99.7% sequence coverage that was
obtained when using nano-ESI-QTOF MS with peptide fractionation. These results
indicated that comparable or slightly higher sequence coverages for a high molecular
weight protein such as HSA could be obtained by using nano-ESI-QTOF MS vs.
MALDI-TOF MS.
Nano-ESI-QTOF MS was also found to have several advantages over MALDI-
TOF MS in this type of analysis. One advantage was that nano-ESI-QTOF MS required
fewer samples and fractionation steps than the previous MALDI-TOF MS method [2].
This also created the need for less sample preparation time. Further investigation of the
peptides that were detected in the digests for HSA by nano-ESI-QTOF MS was carried
out by using CID to determine which of these peptides could be used as internal
calibrants for MS/MS experiments. This resulted in 6-7 peptides being selected from
386
each digest for use as internal calibrants in future MS studies. MS/MS studies confirmed
the identities of these peptides by matching the fragment ions for these peptides to a
theoretical list of possible fragment ions. As shown in preliminary work, these peptides
could be used to internally calibrate and correct MS spectra, which could then be used for
the analysis of PTMs. Although this study focused on the use of nano-ESI-QTOF MS
for the structural investigation of HSA, the same methods could also be applied to other
proteins with relatively high molecular weights.
8.5 References
1. R. Aebersold, M. Mann, Mass spectrometry-based proteomics, Nature 422 (2003)
198-207.
2. C. Wa, R. Cerny, D.S. Hage, Obtaining high sequence coverage in matrix-assisted
laser desorption time-of-flight mass spectrometry for studies of protein
modification: analysis of human serum albumin as a model. Anal. Biochem. 349
(2006) 229-241.
3. J. Anguizola, R.Matsuda, O.S. Barnaby, K.S. Joseph, C. Wa, E. Debolt, M. Koke,
D.S. Hage, Review: glycation of human serum albumin. Clin. Chim. Acta 425
(2013) 64–76.
4. P.J. Thornalley, A. Langborg, H.S. Minhas, Formation of glyoxal, methylglyoxal
and 3-deoxyglucosone in the glycation of proteins by glucose, Biochem. J. 344
(1999) 109–116
5. L.C. Maillard, Action des acides amines sur les sucres: formation des
melanoidines par voie methodique, C. R. Acad. Sci. 154 (1912) 66–68.
6. H Nursten, The Maillard reaction, Cambridge, UK: Royal Society of Chemistry
387
(2005).
7. A. Lapolla, D. Fedele, R. Reitano, L. Bonfante, M. Guizzo, R. Seraglia, M.
Tubaro, P. Traldi, Mass spectrometric study of in vivo production of advanced
glycation end-products/peptides, J. Mass Spectrom. 40 (2005) 969-972.
8. A. Lapolla, D. Fedele, R. Seraglia, P. Traldi, The role of mass spectrometry in the
study of non-enzymatic protein glycation in diabetes: an update, Mass Spectrom.
Rev. 25 (2006) 775-797.
9. Q. Zhang, J.M. Ames, R.D. Smith, J.W. Baynes, T.O. Metz, A perspective on the
Maillard reaction and the analysis of protein glycation by mass spectrometry:
probing the pathogenesis of chronic disease, J. Proteome Res. 8 (2009) 754-769.
10. J.W. Baynes, S.R. Thorpe, M.H. Murtiasha, Nonenzymatic glucosylation of lysine
residues in albumin, Methods Enzymol. 106 (1984) 88–98.
11. A.R. Perejda, J. Uitto, Nonenzymatic glycosylation of collagen and other
proteins: relationship to development of diabetic complications, Coll. Relat. Res.
2 (1982) 81–88.
12. S. Rogozinksi, O. Blumenfeld, S. Seifter, The nonenzymatic glycosylation of
collagen. Arch. Biochem. Biophys. 221(1983) 428–37.
13. R.L. Cones, A. Cerami, Nonenzymatic glycosylation of proteins in diabetes
mellitus, Recent Adv. Diabetes 1 (1984) 173–80.
14. N. Shaklai, R.L. Garlick, H.F. Bunn, Nonenzymatic glycosylation of human
serum albumin alters its conformation and function, J. Biol. Chem. 259(1984)
3812–3817.
15. K. Nakajou, H. Watanabe, U. Kragh-Hansen, T. Maruyama, M. Otagiri, The
388
effect of glycation on the structure, function and biological fate of human serum
albumin as revealed by recombinant mutants, Biochim. Biophys. Acta 1623
(2003) 88-97.
16. K.S. Joseph, J. Anguizola, A.J. Jackson, D.S. Hage, Chromatographic analysis of
acetohexamide binding to glycated human serum albumin, J. Chromatogr. B 878
(2010) 2775–2781.
17. K.S. Joseph, J. Anguizola, D.S. Hage, Binding of tolbutamide to glycated human
serum albumin, J. Pharm. Biomed. Anal. 54 (2011) 426–432.
18. R. Matsuda, J. Anguizola, K.S. Joseph, D.S. Hage, High-performance affinity
chromatography and the analysis of drug interactions with modified proteins:
binding of gliclazide with glycated human serum albumin, Anal. Bioanal. Chem.
401 (2011) 2811-2819.
19. R. Matsuda, J. Anguizola, K.S. Joseph, D.S. Hage, Analysis of drug interactions
with modified proteins by high-performance affinity chromatography: binding of
glibenclamide to normal and glycated human serum albumin, J. Chromatogr. A
1265 (2012) 114-122.
20. K.S. Joseph, D.S. Hage, The effects of glycation on the binding of human serum
albumin to warfarin and L-tryptophan, J. Pharm. Biomed. Anal. 53 (2010) 811-
818.
21. J. Anguizola, K.S. Joseph, O.S. Barnaby, R. Matsuda, G. Alvarado, W. Clarke,
R.L. Cerny, D.S. Hage, Development of affinity microcolumns for drug-protein
binding studies in personalized medicine: interactions of sulfonylurea drugs with
in vivo glycated human serum albumin, Anal. Chem. 85 (2013) 4453-4460.
389
22. A.J. Jackson, J. Anguizola, E.L. Pfaunmiller, D.S. Hage, Use of entrapment and
high-performance affinity chromatography to compare the binding of drugs and
site-specific probes with normal and glycated human serum albumin, Anal.
Bioanal. Chem. 405 (2013) 5833-5841.
23. S.B.G. Basiaga, D.S. Hage, Chromatographic studies of changes in binding of
sulfonylurea drugs to human serum albumin due to glycation and fatty acids, J.
Chromatogr. B Analyt. Technol. Biomed. Life Sci. 878 (2010) 3193-3197.
24. J. Anguizola, S.B.G. Basiaga, D.S., Effects of fatty acids and glycation on drug
interactions with human serum albumin, Curr. Metabolomics 1 (2013) 239-250.
25. O.S. Barnaby, R.L. Cerny, W. Clarke, D.S. Hage, Comparison of modification
sites formed on human serum albumin at various stages of glycation. Clin. Chim.
Acta 412 (2011) 277-285.
26. O.S. Barnaby, R.L. Cerny, W. Clarke, D.S. Hage, Quantitative analysis of
glycation patterns in human serum albumin using 16
O/18
O-labeling and MALDI-
TOF MS. Clin. Chim. Acta 412 (2011) 1606-1615.
27. O. S. Barnaby, C. Wa, R.L. Cerny, W. Clarke, D.S. Hage, Quantitative analysis of
glycation sites on human serum albumin using 16
O/18
O-labeling and matrix-
assisted laser desorption/ionization time-of-flight mass spectrometry, Clin. Chim.
Acta. 411 (2010) 1102-1110.
28. C. Wa, R. Cerny, W. Clarke, D.S. Hage, Characterization of glycation adducts on
human serum albumin by matrix-assisted laser desorption ionization time-of-
flight mass spectrometry, Clin. Chim. Acta. 385 (2007) 48-60.
29. T. Peters, Jr., All about albumin: biochemistry, genetics, and medical
390
applications. Academic Press, San Diego, 1996.
30. N.W. Tietz (Ed.), Clinical Guide to Laboratory Tests, 2nd ed., Saunders,
Philadelphia, 1990.
31. J.H. Gross, Mass Spectrometry, A Textbook, 2nd ed., Springer, New York, 2004.
32. A. El-Aneed, A. Cohen, J. Banoub, Mass spectrometry, review of the basics:
electrospray, MALDI, and commonly used mass analyzers. Appl. Spectroscopy
Rev. 44 (2009) 210-230.
33. H. Zoellner, J.Y. Hou, T. Hochgrebe, A. Poljak, M.W. Duncan, J. Golding, T.
Henderson, G. Lynch, Fluorometric and mass spectrometric analysis of
nonenzymatic glycosylated albumin. Biochem.Biophys. Res. Commun. 284
(2001) 83–89.
34. Q. Zhang, M.E. Monroe, A.A. Schepmoes, T.R. Clauss, M.A. Gritsenko, D.
Meng, Va. Petyuk, R.D. Smith, T.O. Metz, Comprehensive identification of
glycated peptides and their glycation motifs in plasma and erythrocytes of control
and diabetic subjects, J. Proteome Res. 10 (2011) 2011 3076–3088.
35. F.L. Brancia, J.Z. Bereszczak, A. Lapolla, D. Fedele, L. Baccarin, R. Seraglia, P.
Traldi, Comprehensive analysis of glycated human serumalbumin tryptic peptides
by off-line liquid chromatography followed by MALDI analysis on a time-of-
flight/curved field reflectron tandem mass spectrometer, J. Mass Spectrom. 41
(2006) 1179–1185.
36. B.S. Lee, S. Krishnanchettiar, S.S. Lateef, S. Gupta, Analyses of the in vitro
nonenzymatic glycation of peptides/proteins by matrix-assisted laser
desorption/ionization mass spectrometry, Int. J. Mass Spectrom. 260 (2007) 67–
391
74.
37. P.J. Thornalley, M. Argirova, N. Ahmed, V.M. Mann, O. Argirov, A. Dawnay.
Mass spectrometric monitoring of albumin in uremia, Kidney Int. 58 (2000)
2228-2234
38. F. Klink, The importance of multiple-charge ion precursors in peptide MS/MS
sequencing, MS Solutions 17.
39. J.B. Fenn, M. Mann, C.K. Meng, S.F. Wong, C.M. Whitehouse, Electrospray
ionization for mass spectrometry of large biomolecules, Science 246 (1989) 64-
71.
40. B. Domon, R. Aebersold, Mass spectrometry and protein analysis, Science 312
(2006) 212-217.
41. I.C. Guerrera, O. Kleiner, Application of mass spectrometry in proteomics,
Biosci. Rep. 25 (2005) 71-93.
42. V. Kolli, E.D. Dodds, Energy-resolved collision induced dissociation pathways of
model N-linked glycopeptidies: implications for capturing glycan connectivity
and peptide sequence in a single experiment. Analyst 139 (2014) 2144-2153.
43. F. Aboufazeli, V. Kolli, E.D. Dodds, A comparison of energy-resolved vibrational
activation/dissociation characteristics of protonated and sodiated high mannose N-
glycopeptidies, J. Am. Soc. Mass Spectrom. (2015) in press.
44. A.S. Gelb, R.E. Jaratt, Y. Huang, E.D. Dodds, A study of calibrant selection in
measurement of carbohydrate and peptide ion-neutral collision cross sections by
traveling wave ion mobility spectrometry, Anal. Chem. 86 (2014) 11396-11402.
45. D. Rathore, E.D. Dodds, Collision induced release, ion-mobility separation, and
392
amino acid sequence analysis of subunits from mass-selected noncovalent protein
complexes, J. Am. Soc. Mass Spectrom. 25 (2014) 1600-1609.
46. Y. Huang, E. D. Dodds, Ion mobility studies of carbohydrates as group I adducts:
isomer specific collisional cross section dependence on metal ion radius, Anal.
Chem. 85 (2013) 9728-9735.
47. B. Paiz, S. Suhai, Fragmentation pathways of protonated peptides, Mass
Spectrom. Rev. 24 (2005) 548-548.
48. V.H. Wysocki, K.A. Resing, Q. Zhange, G. Cheng, Mass spectrometry of
peptides and proteins, Methods 35 (2005) 211-222.
49. X. Lou, J.L.J. van Dongen, E.W. Meijer, Generation of CsI cluster ions for mass
calibration in matrix-assisted laser desorption mass spectrometry. J. Am Soc.
Mass Spectrom. 21 (2010) 1223-1226.
50. M. Strohalm, M. Hassman, B. Kosata, M.Kodicek, mMass data miner: an open
source alternative for mass spectrometry data analysis. Rapid Commun. Mas
Spec. 22 (2008) 905-908.
51. B. Meloun, L. Moravek, V. Kostka, Completed amino acid sequence of human
serum albumin, FEBS Lett. 58 (1975) 134-137.
52. K. Hjerno, P Hojrup, in R. Mattiesen (Ed.), Mass Spectrometry Data Analysis in
Proteomics, Humana Press, Totowa, 2007, Chap. 3.
53. B. Xiang, M. Prado, An accurate and clean calibration method for MALDI-MS, J.
Biomol. Tech. 21 (2010) 116-119.
393
CHAPTER 9
SUMMARY AND FUTURE WORK
9.1 Summary
Metabolic diseases such as diabetes can affect the structure and function of serum
proteins such as human serum albumin (HSA). The work described by this dissertation
included the utilization and development of new tools and techniques based on high-
performance affinity chromatography (HPAC) and multi-dimensional mass spectrometry
to examine the effects of diabetes on the structure and function of HSA. As shown
through various studies, HPAC was used as a tool to see how drug-protein interactions
were affected by glycation. Multi-dimensional mass spectrometry was used as a
technique to qualitatively examine the structure of HSA.
The first chapter provided a general introduction on the use of HPAC for
examinating the effects of glycation on drug-protein interactions. A brief overview of the
glycation process was discussed, which included information on sulfonylurea drugs and
the structure of HSA. This overview was followed by a discussion of the preparation of
the various types of supports that were used to examine drug-protein interactions with
glycated HSA. Lastly, various chromatographic approaches such as frontal analysis and
zonal elution were described and used to illustrate how HPAC could be used as a tool to
determine drug-binding information regarding the effect of glycation on drug-protein
interactions.
Chapter 2 provided an overview of metabolite-protein interactions, which first
included an overview of the techniques used to profile metabolite-protein interactions,
such as in vitro, in vivo, or in silico techniques. A discussion of various metabolite-
394
protein interactions, such as those involving metabolites from hormones, fatty acids,
drugs, and xenobiotics, was included. This chapter also contained a summary of the
effects of metabolic processes on the structures of various proteins, which included HSA,
α1-acid glycoprotein, and lipoproteins. It was also shown how the information obtained
from profiling metabolite-protein interactions could be used in biomedical and
pharmaceutical research, as well as in the development of tools for personalized
medicine.
Glycation of HSA, as occurs in diabetes, has been shown to affect the binding of
various drugs and solutes to this protein. Chapters 3-6 included four studies that involved
the use of HPAC to examine the effects of glycation on the binding of three second-
generation sulfonylurea drugs (i.e., gliclazide, glibenclamide, and glipizide) and a third-
generation sulfonylurea drug (i.e., glimepiride) to HSA and HSA with various levels of in
vitro glycation. The results demonstrated the ability of HPAC to provide a complete
binding profile for these sulfonylurea drugs with HSA and glycated forms of HSA. The
results also showed how HPAC could be used to quantitatively measure changes in
binding affinity for the sulfonylurea drugs as the level of protein glycation was varied. A
0.6- to 6-fold change in affinity was observed for the interactions of the sulfonylurea
drugs at specific sites on glycated HSA when compared to HSA. The extent of the
changes in affinity varied from one drug to the next. The results indicated that glycation
can affect the binding of sulfonylurea drugs to HSA, which in turn could alter the
effective dose or free concentration of such a drug. Additionally, the information
obtained from the studies with these drugs could be used to improve the use of these
drugs in the treatment of diabetes for personalized medicine and illustrate how complex
395
drug-protein interactions with other proteins can be examined by HPAC for
pharmaceutical research.
The development of an on-line immunoextraction approach for examining drug-
protein interactions was discussed in Chapter 7. The purpose of this approach was to
simplify the extraction of HSA from serum samples and to use HPAC to study drug-
protein interactions with the extracted protein. Several extraction methods were
evaluated and tested by using a number of chromatographic approaches for examining
drug-protein interactions. Overall, the results indicated that online immunoextraction
was a feasible technique that could be used to examine drug-protein interactions with
extracted proteins, and could be subsequently applied to work with serum samples.
Finally, Chapter 8 examined the use of multidimensional mass spectrometry as a
method to qualitatively analyze the structure of HSA. The technique of nano-
electrospray ionization time-of-flight mass spectrometry was used to examine and
analyze the sequence of HSA. The results were comparable to a previous method that
used matrix–assisted laser desorption/ionization time-of-flight mass spectrometry to
qualitatively profile the structure of HSA. Experiments were also conducted through the
use of collision induced dissociation to further examine and identify the amino acid
composition of peptides throughout the structure of HSA. These selected peptides could
be used as internal calibrants to correct and calibrate mass spectra to further improve the
mass accuracy of sequence analysis experiments. In addition, the internal calibrants
could be used to accurately identify and locate glycation-related modifications that could
be found throughout the structure of glycated HSA.
396
9.2 Future work
The work provided in this dissertation focused on the development and utilization
of new-tools for examining the structure and function of HSA. Several studies examined
the use of HPAC for studying the binding of various sulfonylurea drugs to in vitro
samples of glycated HSA. Another study involved the development of a format that
could be used to examine in vivo samples from patients with diabetes. This work also
examined the use of multidimensional mass spectrometry for analysis of the structure of
HSA. These tools could be used to further explore the possible applications of HPAC in
personalized medicine, while also providing information on the effects of diabetes on the
structure and function of HSA.
The use of HPAC for examining the drug-protein interactions is not only limited
to sulfonylurea drugs and HSA, but can be expanded to other drugs and solutes that are
capable of binding to HSA. Drugs such as glitazones (i.e., rosiglitazone and
pioglitazone) and meglitanides (i.e, repaglinide and nateglinide) are also used to treat
type II diabetes [1,2]. All of these drugs are tightly bound to HSA (i.e., >98% bound).
Therefore, similar HPAC studies could be conducted to explore the binding of these
drugs with normal HSA and in vitro glycated samples of HSA. In addition to examining
the effects of glycation on HSA, the effects of other metabolic processes on drug-protein
interactions could also be profiled. Examples could include examination of the changes
in the interactions between solutes and variants of α1-acid glycoprotein or the effects of
lipoprotein oxidation on drug-protein binding [3].
The online-immunoextraction method could also be applied in future studies that
use in vivo glycated HSA samples from patients with diabetes to further explore possible
397
applications in the area of personalized medicine. The immunoextraction method could
be used to extract samples of HSA from the serum samples for use in various
chromatographic formats to determine drug-binding information. The ability to use the
antibody/protein complex as an HPAC support should allow for the capability to profile
the binding of various sulfonylurea drugs, in which the information provided by the
experiments would then have the potential to determine the optimum treatment plan for a
patient with diabetes.
Lastly, ongoing work is being conducted with multidimensional mass
spectrometry for the examination of glycation-related modifications on HSA. These
studies are utilizing the internal calibrants that were identified from the mass
spectrometric analysis of HSA to correct and internally calibrate spectra obtained from
experiments with both normal and glycated HSA samples. The corrected spectra can
then be compared to determine unique glycated peptides that would then be further
analyzed through MS/MS methods for identification of the glycation-related
modifications.
9.3 References
1. N Seedher, M Kanojia, Reversible binding of antidiabetic drugs, repaglinide and
gliclazide, with human serum albumin, Chem Biol Drug Des 72 (2008) 290-296.
2. M Rendell, The role of sulphonylureas in the management of type 2 diabetes
mellitus, Drugs 64 (2004) 1339-1358.
3. R. Matsuda, C. Bi, J. Anguizola, M. Sobansky, E. Rodriguez, J. Vargas-Badilla,
X. Zheng, B. Hage, D.S. Hage, Studies of metabolite protein interactions: A
review, J. Chromatogr. B 968 (2014) 49-63.