The Norwegian Ethnic Expression at St. Olaf College Karin ...
Next Generation Energy and Manufacturing Analytics
SQL Server Technical Article
Writers: Melissa Topp, Ioannis Apostolakis, Torsten Grabs
Technical Reviewers: Isaac Kunen, Sreedhar Pelluru, Tim Donaldson, Andre Scherpenzeel
Published: January 2012
Applies to: SQL Server 2008 R2
Summary:
Today, businesses and organizations need to pay more and more attention to energy usage, as customers and the general public are becoming increasingly concerned about a respectful and sustainable use of resources. Organizations therefore need to carefully manage their use of energy and provide better visibility into their energy consumption. In this paper, we discuss how software solutions can help address these challenges.
Besides providing some background on the drivers behind energy management, the paper discusses how organizations manage their use of energy with current product and service offerings from Microsoft and ICONICS. In the main body of the paper, a case study explains in depth how ICONICS Energy AnalytiX™ is using Microsoft data platform components such as SQL Server StreamInsight to deliver market leading energy management solutions.

2
Copyright
The information contained in this document represents the current view of Microsoft Corporation on the issues discussed as of the date of publication. Because Microsoft must respond to changing market conditions, it should not be interpreted to be a commitment on the part of Microsoft, and Microsoft cannot guarantee the accuracy of any information presented after the date of publication.
This white paper is for informational purposes only. MICROSOFT MAKES NO WARRANTIES, EXPRESS, IMPLIED, OR STATUTORY, AS TO THE INFORMATION IN THIS DOCUMENT.
Complying with all applicable copyright laws is the responsibility of the user. Without limiting the rights under copyright, no part of this document may be reproduced, stored in, or introduced into a retrieval system, or transmitted in any form or by any means (electronic, mechanical, photocopying, recording, or otherwise), or for any purpose, without the express written permission of Microsoft Corporation.
Microsoft may have patents, patent applications, trademarks, copyrights, or other intellectual property rights covering subject matter in this document. Except as expressly provided in any written license agreement from Microsoft, the furnishing of this document does not give you any license to these patents, trademarks, copyrights, or other intellectual property.
Unless otherwise noted, the example companies, organizations, products, domain names, e-mail addresses, logos, people, places, and events depicted herein are fictitious, and no association with any real company, organization, product, domain name, e-mail address, logo, person, place, or event is intended or should be inferred.
© 2012 Microsoft Corporation. All rights reserved.
Microsoft, Microsoft SQL Server, Microsoft StreamInsight are trademarks of the Microsoft group of companies.
All other trademarks are property of their respective owners.
3
Contents
1 Introduction ............................................................................................................................ 4
2 Trends and challenges in energy management ..................................................................... 4
2.1 Government and Regulatory Requirements ................................................................... 4
2.2 Precision and Compliance of the Analysis ..................................................................... 5
2.3 Asset-based and Metadata-based Analytics .................................................................. 5
2.3.1 Compelling and Flexible Reporting Capabilities for Time-based Analysis .............. 6
2.3.2 Occasionally Disconnected Data Sources .............................................................. 6
2.3.3 Scalability ................................................................................................................ 7
3 StreamInsight Overview ......................................................................................................... 7
3.1 Defining Event Data ........................................................................................................ 8
3.2 Basic Analytics ............................................................................................................... 9
3.3 Windowing and other Time-based Analytics ................................................................ 10
3.4 User-defined Extensions .............................................................................................. 11
3.5 Connectivity to Data Sources ....................................................................................... 12
3.6 Performance: Incremental and Parallel Processing ..................................................... 13
3.7 Resiliency against Outages .......................................................................................... 13
3.8 Managing StreamInsight Analytics ............................................................................... 13
3.9 Tools for Developers and Administrators ..................................................................... 14
4 StreamInsight Case Study: ICONICS ................................................................................. 15
4.1 ICONICS Company Overview ...................................................................................... 15
4.2 ICONICS Energy AnalytiX ............................................................................................ 16
4.3 ICONICS Use of Microsoft StreamInsight .................................................................... 18
5 Summary and Outlook ......................................................................................................... 23
4
1 IntroductionOrganizations and businesses across the globe have always been consciously managing their resource usage. For energy-intensive businesses, tracking and managing energy costs was essential with bottom lines being sensitive to shifts in energy prices. In today’s business and political climate, however, customers and the general public are more and more concerned about a respectful use of natural resources including energy. Failure to address these concerns will not only impact cost negatively, but also reduce revenue as customers are turning to products and services that offer more efficient resource usage. Today’s trends for green and sustainable products will put those organizations at an advantage that can effectively address their constituencies’ concerns regarding energy use. This places new demands on the ways that organizations account for their use of energy and how they provide visibility into their energy usage for their customers and the concerned public. These trends warrant new perspectives and approaches throughout the “energy chain” and will change how we manage energy generation, transmission, usage and energy related business processes.
For this current paper, we will focus our discussion on the way that software solutions can help organizations manage their energy-related resources. In the following section, we will further delve into the socio-economic background that is driving new requirements for energy management. We will then take a more technology-focused view on how organizations can address these requirements with current product and service offerings from Microsoft and ICONICS. Finally, the main body of the paper illustrates how ICONICS Energy AnalytiX™ is using Microsoft data platform components such as SQL Server StreamInsight to deliver market leading energy management solutions.
2 TrendsandchallengesinenergymanagementEnergy management has various different stakeholders. Government institutions for instance provide the regulatory framework for businesses. Within that framework, organizations define their specific requirements for energy analytics. In the following sections, we discuss these requirements, shifting perspective from regulatory concerns and business requirements to technical considerations for energy analytics.
2.1 GovernmentandRegulatoryRequirementsA sustainable business is an organization that incorporates environmental and social performance with financial results. “Going green” is no longer just for those companies who want to improve their image or nurture good community relations. One of the most economically beneficial factors driving an increased emphasis on sustainability today is the wide variety of government regulations and incentive programs that have been put in place in recent years. Specific programs vary by region and even by industry, but many of those can be traced back to Executive Order (EO) 13423, Strengthening Federal Environmental, Energy, and Transportation Management, from January 24, 2007, or EO 13514, Federal Leadership in Environmental, Energy, and Economic Performance, from October 5, 2009. The United Kingdom first announced its Carbon Reduction Commitment Energy Efficiency Scheme (CRCEES) back in 2007, which went into effect in 2010 as a mandatory emissions trading
5
scheme aimed at reducing CO2 emissions in the UK. The European Union also offers a regional cap-and-trade system under the EU Emissions Trading Scheme (ETS).
Certain programs offer tax credits for investing in energy-efficient buildings or components, manufacturing products from recycled materials, adapting manufacturing or other processes to use alternate energy sources such as solar, wind, geothermal wind, and biomass, and improving processes to capture excess or wasted energy from a manufacturing process.
Such programs have proven to be unique motivators to both corporations and governmental agencies alike to reduce their energy consumption, utilize a greater percentage of renewable energy, and reduce their carbon footprint. But before a company can improve in any of these areas, they first need to be able to measure where they stand. Hence, the demand for systems that help measure, monitor, and manage energy usage has been increasing.
2.2 PrecisionandComplianceoftheAnalysisOne of the most important features of an energy management solution is being able to aggregate and analyze the data on precise time windows that reflect exactly the interval requested by the user. Analysis may be performed on data at any level, and at virtually any granularity, ranging from raw meter data coming in every 15 minutes or less, all the way up to yearly aggregates compared on a month-to-month basis for budgeting and forecasting purposes. In many cases users rely on this data to be accurate for regulatory reporting purposes as well, as mentioned in the previous section.
Users need to have the confidence that the information produced by the system is absolutely accurate and reflects exactly the time range that they requested. It is equally important that the aggregates calculated at each level carry that same precision forward in the form of an accurate total, minimum, maximum and average value for each interval. This ensures that the energy management system provides truly actionable information when comparing similar assets, whether they are individual pieces of equipment or machinery, rooms or floors within a building, lines or processes within a plant, entire buildings or even multiple production sites or campuses.
2.3 Asset‐basedandMetadata‐basedAnalyticsA typical analytics application needs to be capable of achieving a high degree of data fusion, from various data sources and transforming input data into meaningful output streams of information, which can be visibly analyzed and quickly focused on what matters the most. In addition, the produced output data points have to be associated in a clear way to logical or physical entities in order to assist the end user’s decision making process.
Today’s trend in high-end analytics applications is to utilize a hierarchical approach to modeling the logical and physical entities that compose an end user’s organization, building, plant or enterprise. This hierarchical organization is commonly referred to as an asset tree. The asset tree aids the end user in maintaining a unified view of his application or areas of interest. Equally important to the asset tree based application deployment, is the information associated with each node of the tree, often times referred to as metadata. Metadata play a vital role in any analytics application, since their values significantly influence the produced information in terms of Key Performance Indicators (KPIs), and in normalization of data so that comparisons
6
can be made more accurate. As such, an analytics application has to operate on rich payload events that have to be augmented with the related metadata either of the source of data or the assets that they are associated with. A classic example in Energy Management is the normalized consumption per unit of product produced. In this case, the production count is the metadata item that will normalize an asset’s consumption so that meaningful comparisons can be performed among various assets, such as across multiple lines that may be producing the same product.
All in all, an analytics application will process data produced by various data sources, enrich them with the appropriate metadata and then produce meaningful and actionable output results. The key point in the entire process is to have the ability to operate on the incoming streams of input data in a way that allows the fusion of data source data points, associated metadata and application business logic in form of built-in or custom aggregates, filters and grouping semantics.
2.3.1 CompellingandFlexibleReportingCapabilitiesforTime‐basedAnalysisEffective energy management requires flexible reporting capabilities. Energy management objectives today are expressed through key performance indicators (KPIs) that aggregate the raw data from the sensors deployed across the organization, along with data provided by energy suppliers. A key component of the analysis is the ability to work with time. Typical questions are: “How much energy was consumed last year, how much this year to date? What was the energy consumption in the first quarter? And what was the maximum energy usage on a Monday last month?” Note how all these questions relate back to certain periods of time. In addition, they also use various aggregations over the raw data. We denote these kinds of questions as time-based or temporal analysis and the corresponding aggregations as time-based aggregations.
End users typically consume the results of time-based aggregations through dashboards or reports. The first level of reporting allows users to monitor progress towards their organization’s energy objectives with dashboards that continuously track and visualize energy-related KPIs. Time-based aggregations at various granularities such as hourly energy usage per production line are a key requirement for those KPIs. Users can drill into the reports to work with finer resolutions of the data or to compare similar assets within the organization such as specific lines, pieces of equipment or cost centers. This is a key capability to capture opportunities to further improve energy usage or to act on sub-optimal performance in parts of the organization.
2.3.2 OccasionallyDisconnectedDataSourcesThe current advances in energy management are made possible by instrumenting assets and equipment. Meters capture energy consumption and sensors report ambient conditions. Since assets and equipment are often geographically distributed, the meters and sensors need to communicate their data to the place of analysis. Processing and analysis in turn need to account for different communication speeds and even loss of connectivity between the place of analysis and the data source, depending on communication network capabilities.
7
2.3.3 ScalabilityFor large organizations with hundreds or thousands of instrumented assets, data management and analytics need to scale to thousands of meters and sensors. Many sensors today can produce updated readings several times a second. Across the organization, this can produce tens of thousands of data items per second that the system needs to process to keep KPIs up-to-date, to detect equipment inefficiencies or check alarm conditions.
3 StreamInsightOverviewRelational database applications typically acquire data and store it to disk before it can be analyzed. We therefore call analysis with traditional relational database systems query-driven. Query-driven analysis is well-suited for historical data. Data analysis for energy management applications, however, requires timely reaction to continuously arriving sensor data. To reach the necessary performance and scale, these applications need to analyze the data in near real time while it is being acquired from the source. We denote these applications as event-driven applications because new event data arriving at the system triggers the necessary analysis. The high event data rates that we experience in energy management scenarios are perfectly suited for event-driven analysis. In addition, event-driven applications are characterized by continuous analysis and strict latency requirements: continuous analysis is necessary since the data sources are continuously producing new data that needs to be analyzed. Many applications need to identify and react quickly to conditions that only emerge from the analysis of the incoming data. Hence, the need for low latency analysis that produce results in near real time. Both of these requirements make it impractical to store the data in a relational database before performing the analysis. Besides energy management, these requirements are shared by many scenarios in vertical markets such as utilities, manufacturing, oil and gas, transportation, financial services, health care, IT monitoring, and web analytics.
Microsoft StreamInsight is Microsoft’s platform to build high-throughput, low-latency event-driven analytics applications. StreamInsight is available as part of Microsoft SQL Server since Microsoft SQL Server 2008 R2 in April 2010. StreamInsight complements SQL Server with new capabilities to build event-driven solutions and to inject rich expressive time-based analytics into the event processing pipeline. With StreamInsight, business insight is delivered at the speed at which data is produced, as opposed to the speed at which traditional reports are processed or consumed. This enables organizations to be event-driven: analytical results are available for human consumption right away, or systems can react to events independently based on automated workflows. This helps businesses to get a more timely and relevant view into their operations. They can react more quickly to critical situations, opportunities or trends emerging from operational or customer relationship data.
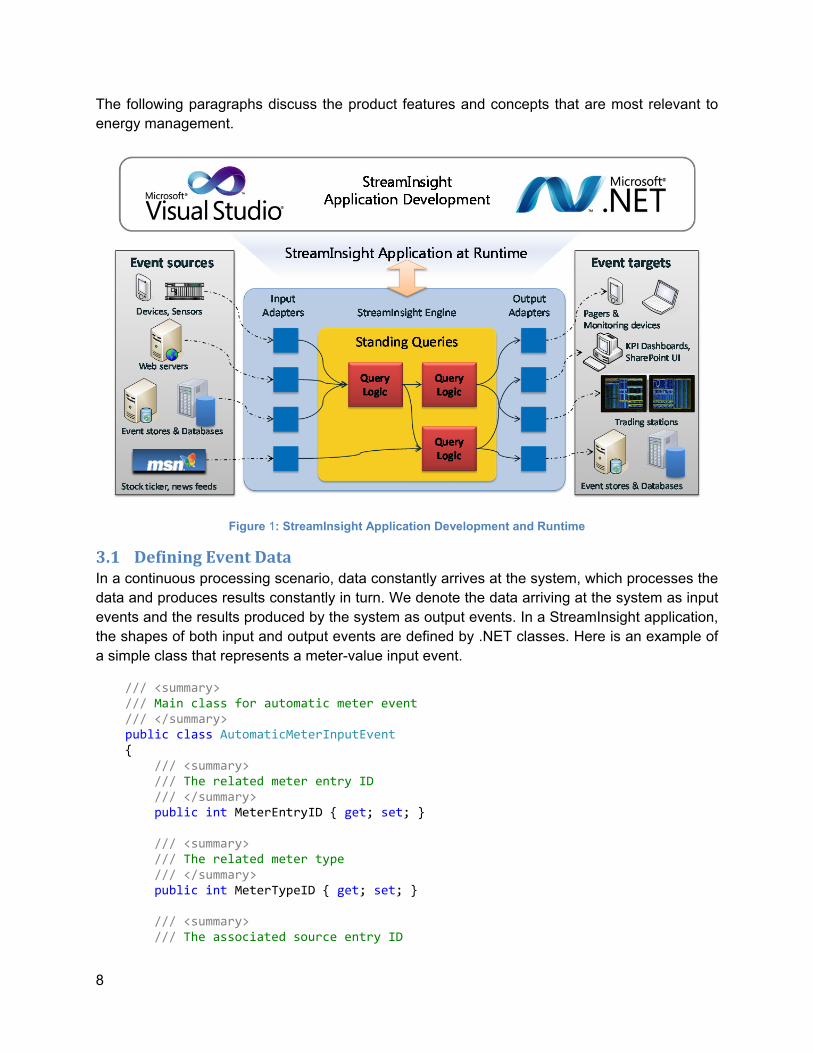
StreamInsight provides application developers with a developer experience tightly integrated into familiar tools such as .NET, LINQ (Language Integrated Query), and Microsoft Visual Studio. StreamInsight’s versatile runtime with small footprint can be tightly integrated with the application that is built on top of the StreamInsight platform. Figure 1 depicts the developer and runtime experience of a StreamInsight application and introduces some of the key concepts.
8
The following paragraphs discuss the product features and concepts that are most relevant to energy management.
Figure 1: StreamInsight Application Development and Runtime
3.1 DefiningEventDataIn a continuous processing scenario, data constantly arrives at the system, which processes the data and produces results constantly in turn. We denote the data arriving at the system as input events and the results produced by the system as output events. In a StreamInsight application, the shapes of both input and output events are defined by .NET classes. Here is an example of a simple class that represents a meter-value input event.
/// <summary> /// Main class for automatic meter event /// </summary> public class AutomaticMeterInputEvent { /// <summary> /// The related meter entry ID /// </summary> public int MeterEntryID { get; set; } /// <summary> /// The related meter type /// </summary> public int MeterTypeID { get; set; } /// <summary> /// The associated source entry ID
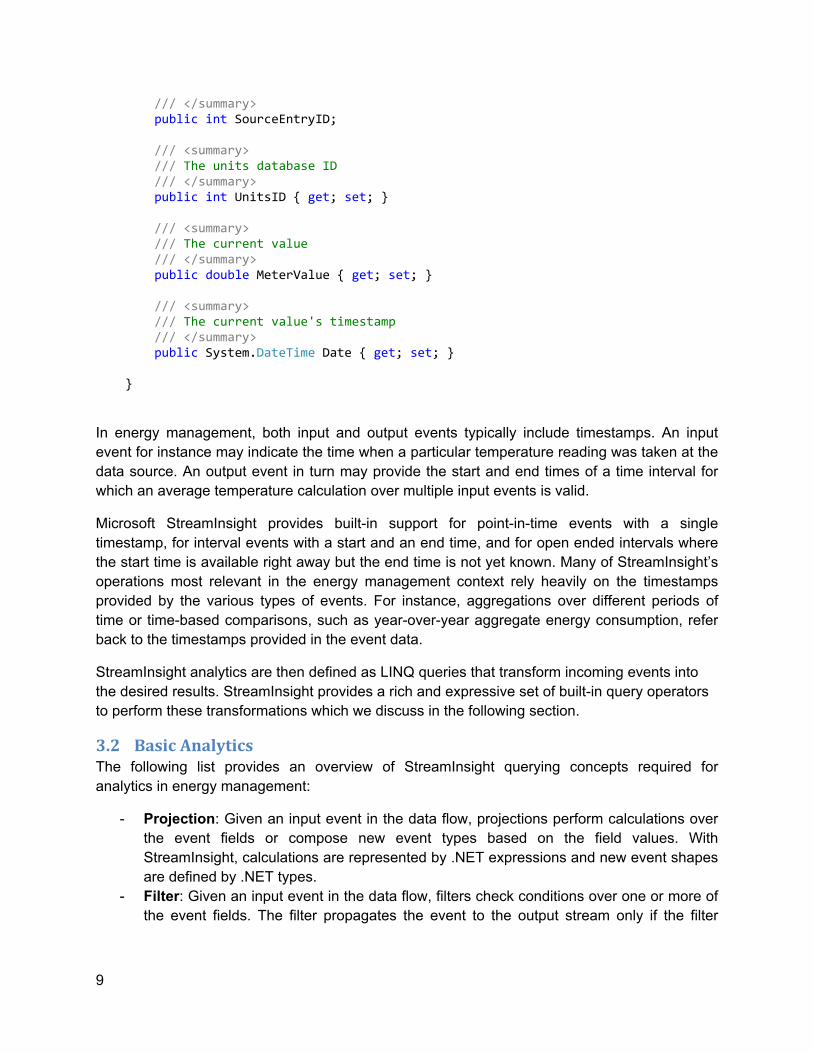
9
/// </summary> public int SourceEntryID; /// <summary> /// The units database ID /// </summary> public int UnitsID { get; set; } /// <summary> /// The current value /// </summary> public double MeterValue { get; set; } /// <summary> /// The current value's timestamp /// </summary> public System.DateTime Date { get; set; } }
In energy management, both input and output events typically include timestamps. An input event for instance may indicate the time when a particular temperature reading was taken at the data source. An output event in turn may provide the start and end times of a time interval for which an average temperature calculation over multiple input events is valid.
Microsoft StreamInsight provides built-in support for point-in-time events with a single timestamp, for interval events with a start and an end time, and for open ended intervals where the start time is available right away but the end time is not yet known. Many of StreamInsight’s operations most relevant in the energy management context rely heavily on the timestamps provided by the various types of events. For instance, aggregations over different periods of time or time-based comparisons, such as year-over-year aggregate energy consumption, refer back to the timestamps provided in the event data.
StreamInsight analytics are then defined as LINQ queries that transform incoming events into the desired results. StreamInsight provides a rich and expressive set of built-in query operators to perform these transformations which we discuss in the following section.
3.2 BasicAnalyticsThe following list provides an overview of StreamInsight querying concepts required for analytics in energy management:
- Projection: Given an input event in the data flow, projections perform calculations over the event fields or compose new event types based on the field values. With StreamInsight, calculations are represented by .NET expressions and new event shapes are defined by .NET types.
- Filter: Given an input event in the data flow, filters check conditions over one or more of the event fields. The filter propagates the event to the output stream only if the filter
10
conditions are satisfied. The event is passed on if the filter conditions are satisfied. With StreamInsight, filter conditions are defined as .NET expressions.
- Grouping: Grouping partitions the incoming data flow into groups. Groups then are processed separately so that individual results can be computed on a per-group basis. Given an input event from the data flow, the grouping applies the partitioning function to the event and then routes the event to its group for further processing.
- Aggregation: Given a set of input events, aggregations compute aggregate functions over the events. StreamInsight supports Sum, Avg, Count, Min and Max as aggregation functions.
- Join: Given input events from two data flows, the join operation matches events from one flow with corresponding events from the other. In temporal systems like StreamInsight, the join operation evaluates two conditions: (1) the traditional join condition over the fields of the events, and (2) an overlap check over the timestamps. If both conditions hold, the events are matched and output. With StreamInsight, only the first condition is defined by the user in a .NET expression. The second condition is always implicitly added by the system.
3.3 WindowingandotherTime‐basedAnalyticsWindowing is an essential concept for time-based querying over event streams. StreamInsight supports the following types of windows:
- Time-driven: Time-driven windows progress based on a schedule defined in the query. There are two types of time-driven windows:
o Hopping: The hopping window accumulates events over a fixed period of time. Once all events have been received over that period of time, the events are passed on for further processing as a set. Hopping windows "hop" forward in time by a fixed period. The window is defined by two time spans: the hop size H and the window size S. For every H time unit, a new window of size S is created.
o Tumbling: Tumbling windows are a special case of hopping windows where the window instances are adjacent to each other on the timeline.
- Event-driven: Event-driven windows produce output if there is activity in the input. Event-driven windows such as the snapshot window typically rely again on a window size and, upon activity, return the set of events that overlap with the window.
- Count-driven: Given a count parameter n, the count-driven windows in StreamInsight return event sequences of length n.
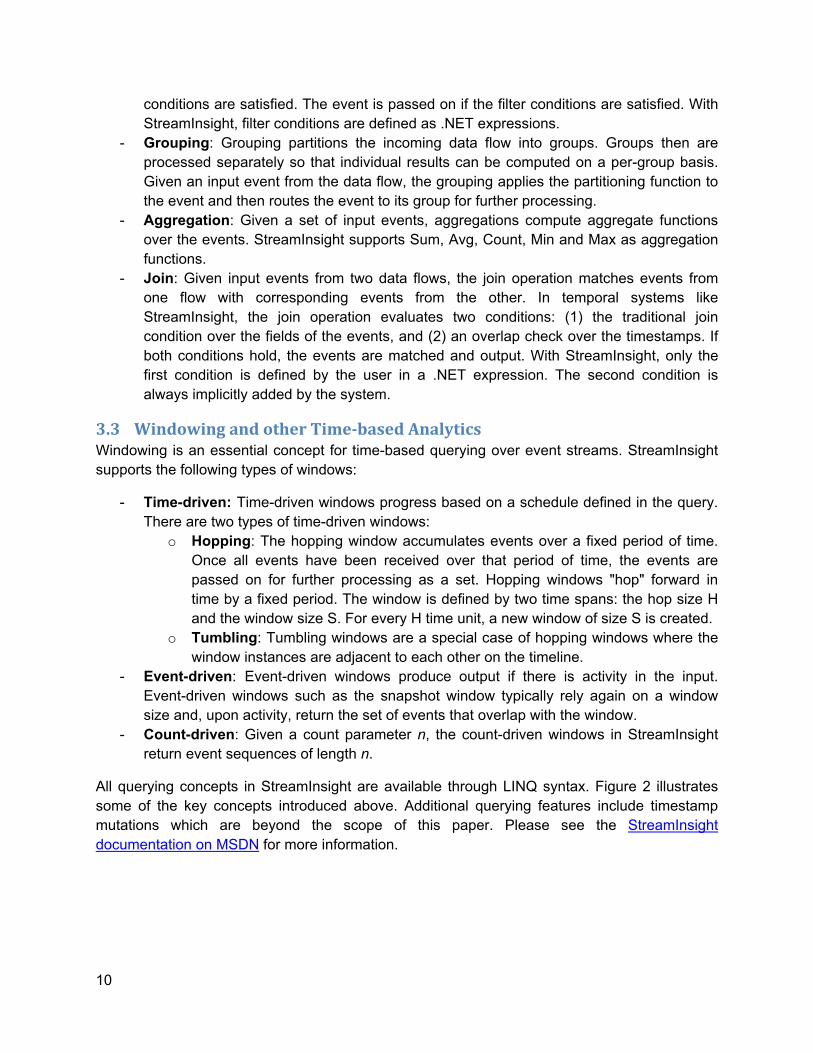
All querying concepts in StreamInsight are available through LINQ syntax. Figure 2 illustrates some of the key concepts introduced above. Additional querying features include timestamp mutations which are beyond the scope of this paper. Please see the StreamInsight documentation on MSDN for more information.
11
Figure 2: Example StreamInsight Queries in LINQ
All temporal processing in StreamInsight relates back to the timestamps provided in the event inputs from the data source. Hence, results only depend on the data provided in the input events. In particular, results do not depend on the time of arrival at the system. This is an important property as it ensures deterministic results. This means that query results are the same irrespective of whether they are calculated over a real-time data feed or over historical data – assuming that the payloads and timestamps are identical in both cases. This is important not only in energy management. For instance, operators working with results from a real-time data feed need to be guaranteed to see the same results as an auditor would see at a later point in time when drawing his results from historical data kept in an operational data store or a process historian.
Queries in StreamInsight are standing queries. Once started, they continuously process the incoming event data, updating their results until stopped by the user. This establishes data flows of the raw data from the sources through input adapters to the queries and of the results from the queries through output adapters to the consumers. Figure 1 illustrates standing continuous queries running in the StreamInsight engine and their corresponding data flows.
3.4 User‐definedExtensionsIn scenarios where the built-in operations of StreamInsight do not cover the required functionality, you can create the following types of user-defined extensions by using the .NET Extensibility SDK of StreamInsight and use them in your queries.
12
User-defined function (UDF): Any static .NET function can serve as a user-defined function in StreamInsight. You can invoke UDFs where .NET expressions are allowed in LINQ queries. Typically, at runtime, UDFs are invoked event by event and a subset of the fields of the event is passed into the UDF. The UDF could use the subset to evaluate custom predicates such as application-specific filter conditions over events in the WHERE clause or to perform custom calculations in a projection to construct new event types on the output using the SELECT clause. Another prominent use case for UDFs are lookup operations, for instance to retrieve additional fields for an event given the event ID.
User-defined aggregate (UDA): The signature for user-defined aggregates is defined by the StreamInsight extensibility APIs. Given a set of input events, a UDA performs a custom calculation over those events and returns a scalar value. A common use case for UDAs is to calculate time-weighted averages. UDAs can only be processed over finite sets of events. StreamInsight therefore allows UDAs only over StreamInsight windows.
User-defined operator (UDO): UDOs are similar to UDAs; however, returns a set of output events as the result from a calculation performed in custom code as opposed to a scalar value that is returned from a UDA. This means that you have to use a UDO as soon as your custom operation needs to produce multiple output events per window instance. For instance, a UDO is required when your custom code needs to generate multiple alarm events from one window instance. As with UDAs, StreamInsight allows UDOs only over StreamInsight windows.
User-defined stream operator (UDSO): User-defined stream operators are the most general extensibility concept in StreamInsight. In contrast to UDAs and UDOs, UDSOs are not limited to the results of window operations. Queries can invoke UDSOs over any stream. Moreover, UDSOs can retain state between different invocations – which is not readily supported with the other concepts. This makes UDSOs perfectly suited to perform more complex calculations over event streams such as exponential smoothing or other statistical or predictive calculations. UDSOs are more flexible than UDOs. But they also require more development work to implement. UDOs are sufficient in most cases unless state retention is required or unless the calculations cannot be performed over a window.
3.5 ConnectivitytoDataSourcesTo help developers establish data flows, StreamInsight tightly integrates into the .NET developer ecosystem. Any .NET sequence can serve as a data source for StreamInsight queries, query results again can be represented as .NET sequence, and any .NET sequence consumer can consume the results. This makes it easy to access static data from relational database systems, for instance. Database access is an important capability to access static or slowly changing metadata. StreamInsight’s temporal join operation also makes it easy to correctly correlate incoming events with corresponding metadata as it changes over time. For proprietary data sources, StreamInsight also offers an SDK to develop custom adapters, which
13
provides the flexibility to integrate StreamInsight into various kinds of data flows in an organization.
In loosely coupled systems with many distributed sensors, like in many of today’s energy management solutions, occasional delays in or even temporary loss of connectivity are unavoidable. Dependable analytics require that the necessary source data has been received from the underlying sensors and is incorporated into the results that the system produces. With StreamInsight, users can configure the time that queries wait for late coming events before they produce final results. This requires the system to buffer events, which is done transparently inside the StreamInsight engine so that developers can instead focus on writing the analytics.
3.6 Performance:IncrementalandParallelProcessingStreamInsight’s runtime performs calculations incrementally whenever possible. This means that the processing only involves the data for the current result and the new event. Unlike in traditional databases, updating a report with aggregates or KPIs with StreamInsight does not require to re-iterate through past data once a new event comes in. Instead, StreamInsight answers continuous queries with a single pass over all the data, which is an important capability for long-running, potentially infinite, standing queries. Incremental processing is one key performance benefit of StreamInsight.
StreamInsight automatically distributes the processing across the available processor cores on the system as well. Thread management and query parallelization are performed automatically by the system. Together with incremental processing, this provides compelling query performance, helps the developer focus on the business logic in the form of queries, provides quicker time to market for scalable and well-performing solutions, and ensures that the solution can scale easily as business or processing needs grow over time.
3.7 ResiliencyagainstOutagesTo protect applications against planned and unplanned downtime, applications can checkpoint the state of a StreamInsight query and recover it from disk after an outage from the last checkpoint. Additional capabilities allow for handshakes with data sources and downstream consumers in case of recovery from a checkpoint to build truly lossless continuous data flows with StreamInsight querying in the middle.
3.8 ManagingStreamInsightAnalyticsStreamInsight provides a server abstraction that makes managing your analytics easy and approachable. Once connected to the StreamInsight server, clients can dynamically add new queries, delete queries or manage and monitor existing queries. Managing queries includes starting and stopping queries, binding queries to new or additional data sources, and finally entails monitoring status and health conditions of the server and the running queries. The server
14
abstraction for StreamInsight is used to implement the various management tools discussed in the next paragraph. It is also the backbone of the deployment option for StreamInsight where StreamInsight is configured as a Windows Service. Besides the manageability advantages of the Windows Service such as automatic startup, for instance, it allows several applications to connect to the same server instance and share the metadata and processing hosted in the service.
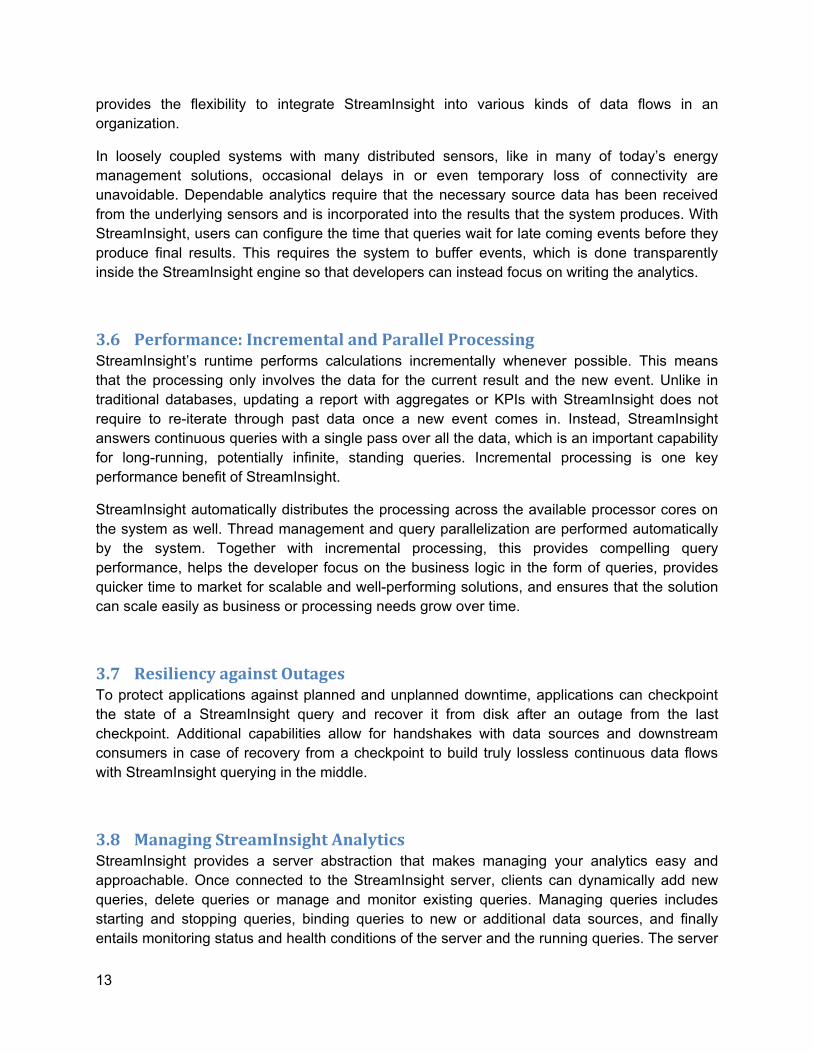
3.9 ToolsforDevelopersandAdministratorsExisting developer tools such as Visual Studio are well-suited for regular .NET applications. For example, developers can easily follow the execution of a C# program step-by-step with the Visual Studio Debugger. StreamInsight queries, however, are expressed as LINQ statements and execute continuously as standing queries in the StreamInsight runtime behind the scenes. The LINQ statements are declarative in nature, i.e., they express the intent of the processing rather than a specific implementation of the query execution. A step-by-step debugging experience from one LINQ expression to the next in the source code – although possible – would not be meaningful. Instead, StreamInsight introduced the Event Flow Debugger that helps developers understand the processing that happens inside the query, record histories (traces), and replay them to step through the query execution in an event-by-event fashion. Note how this is different from the normal way of debugging an application where you execute the program statement by statement. In the Event Flow Debugger, we follow the execution of the StreamInsight query formulated in LINQ event by event. Figure 3 shows the event flow debugger in action. Additional capabilities in the debugger allow the user to connect to a running StreamInsight engine, explore the metadata in the engine, retrieve diagnostic and performance information for running queries, and start and stop queries.
15
Figure 3: The StreamInsight Event Flow Debugger
In addition to the event flow debugger, StreamInsight provides important performance statistics for StreamInsight queries via Windows performance counters. StreamInsight also logs conditions such as the unexpected shutdown of a query in the Windows Event Log.
4 StreamInsightCaseStudy:ICONICS
4.1 ICONICSCompanyOverviewFounded in 1986, ICONICS is an award winning leader in the development of Web-enabled industrial automation and manufacturing intelligence software for Microsoft® Windows® operating systems. ICONICS solutions are certified for the latest Microsoft technologies including Windows 7 and Windows Server 2008. ICONICS has successfully deployed more than 250,000 systems in over 60 countries worldwide. Its solutions meet diverse customer needs in a variety of industries including Automotive, Building Management, Food & Beverage, Oil/Gas/Petrochemical, Machine Builders, Pharmaceutical/Biotech, Security, Water/Wastewater, Utilities, Government Infrastructures and more.
16
ICONICS was an early adopter of Microsoft’s StreamInsight technology for complex event processing and continues to innovate on this platform today. ICONICS participated in the StreamInsight TAP (Technology Adoption Program), software design reviews and deep-dive labs. Throughout the process, the StreamInsight team promptly provided valuable guidance and technical information, especially in the areas of integrating StreamInsight into ICONICS’ Energy AnalytiX solution.
ICONICS next generation 64-bit software is exclusively developed on Visual Studio, .NET, C#, SQL Server, Silverlight and WPF, Entity Data Model (EDM), WCF services and RIA services. So StreamInsight was a natural choice for ICONICS, since they could still utilize all of their development tools, expertise in .NET and knowledge of LINQ based queries.
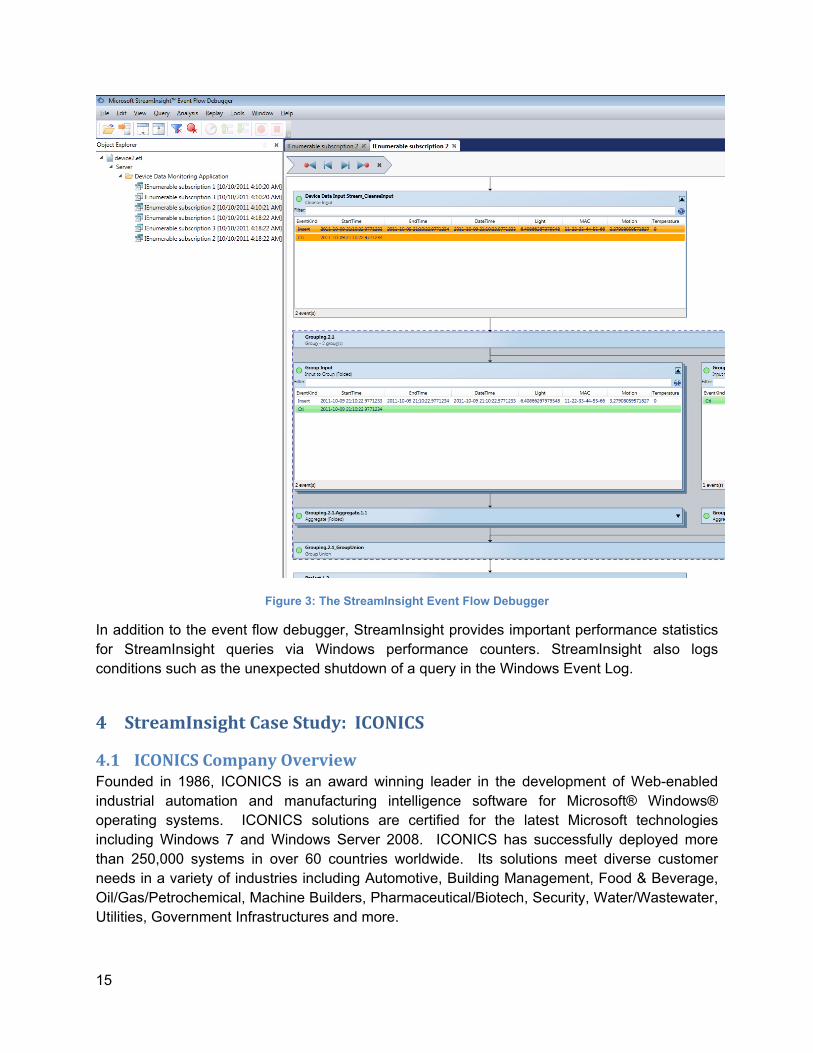
4.2 ICONICSEnergyAnalytiXCurrently StreamInsight is utilized within ICONICS’ Energy AnalytiX solution. Energy AnalytiX is an energy monitoring, energy analysis and energy management system (EMS) that delivers rich platform and browser-independent real-time visualization. It addresses any application from a single building or plant to an entire campus or global enterprise. Energy AnalytiX collects energy meter data through ICONICS’ Universal Connectivity layer, which enables it to acquire data from electric, gas, fuel oil, steam, chilled water or any other meters through any available networking. A sample Energy AnalytiX configuration tree can be seen in Figure 4 below, where under the Manufacturing Facility Energy Asset several meters of various types are displayed.
Figure 4: Sample Asset Tree in Energy AnalytiX
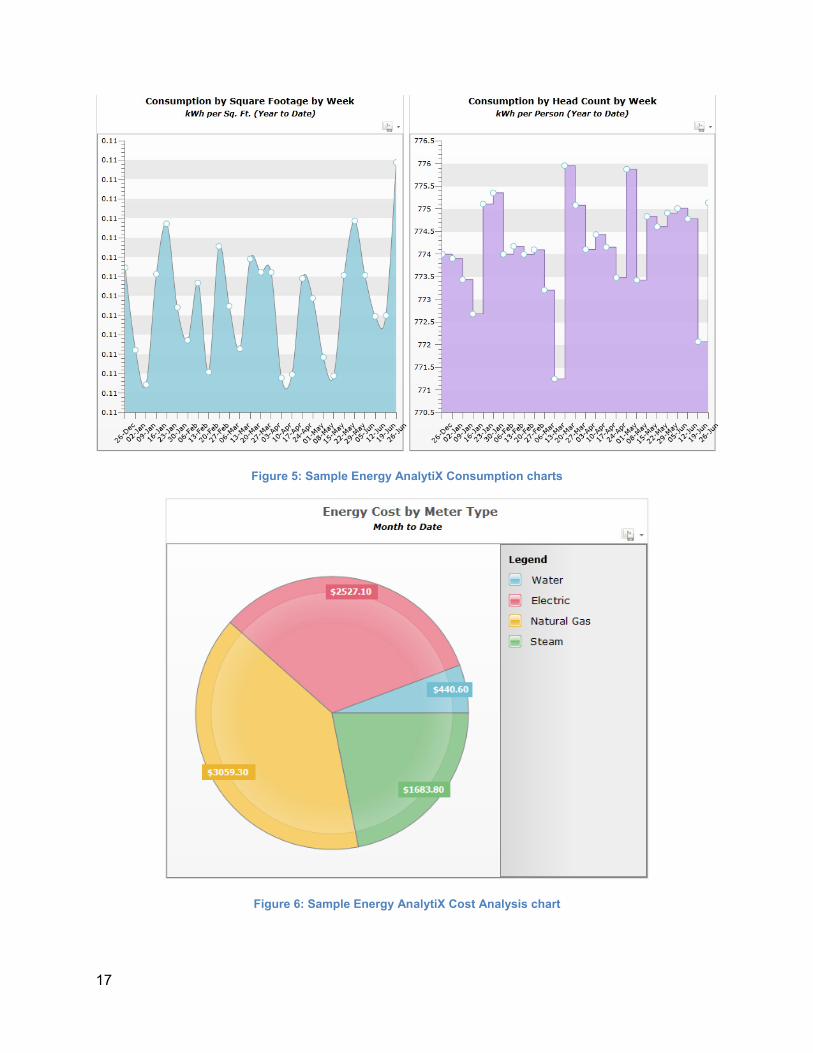
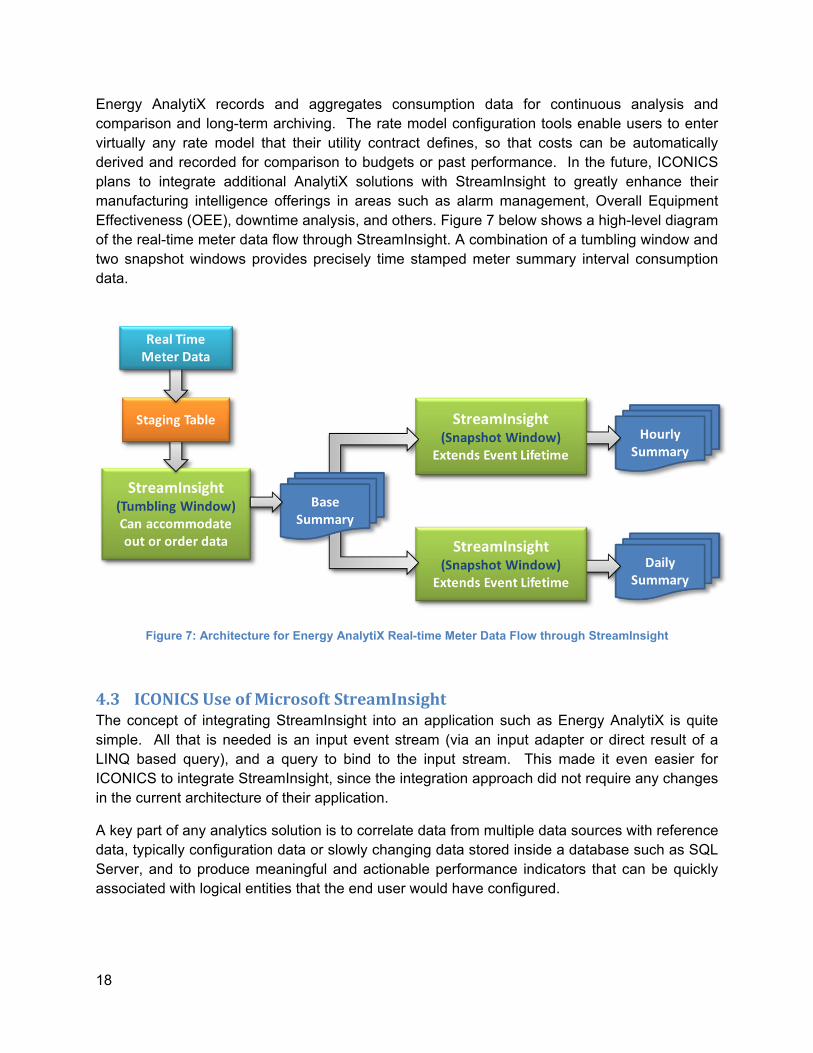
The results of Energy AnalytiX calculations are displayed within Web parts inside SharePoint or standard browsers, as well as portable devices. Figure 5 depicts a normalized consumption data by square footage as well as by occupancy, while Figure 6 shows a chart displaying a cost breakdown by energy source utilized.
17
Figure 5: Sample Energy AnalytiX Consumption charts
Figure 6: Sample Energy AnalytiX Cost Analysis chart
18
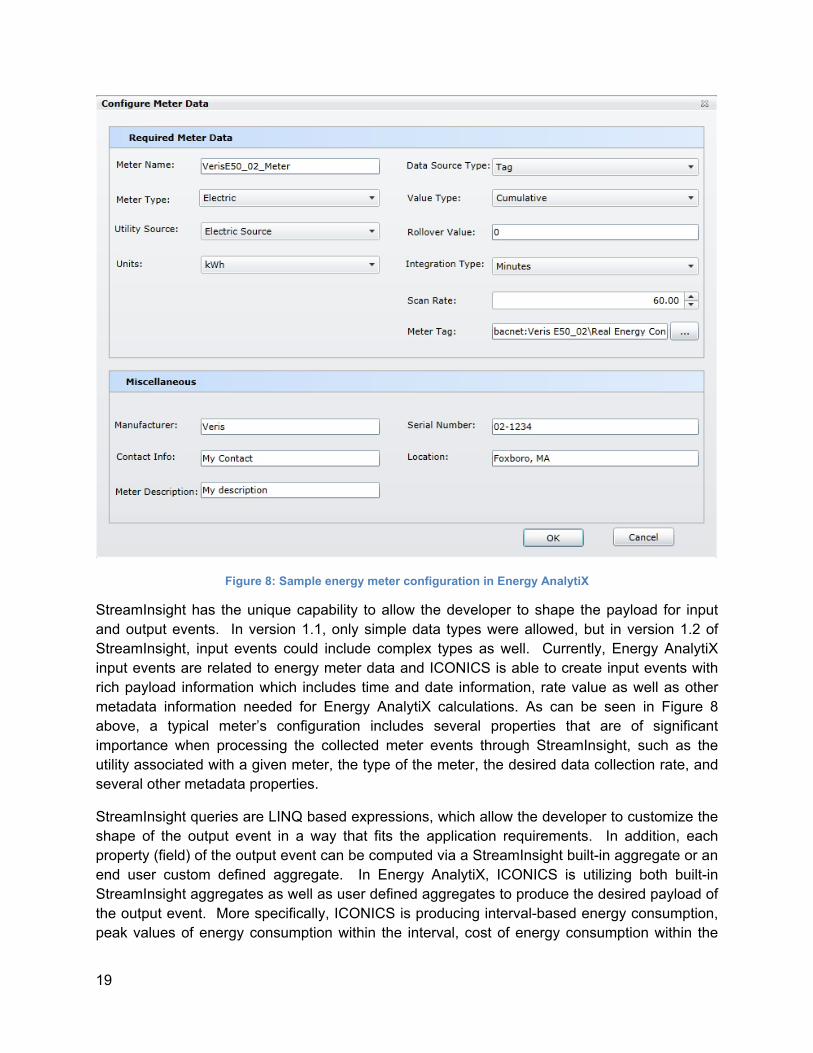
Energy AnalytiX records and aggregates consumption data for continuous analysis and comparison and long-term archiving. The rate model configuration tools enable users to enter virtually any rate model that their utility contract defines, so that costs can be automatically derived and recorded for comparison to budgets or past performance. In the future, ICONICS plans to integrate additional AnalytiX solutions with StreamInsight to greatly enhance their manufacturing intelligence offerings in areas such as alarm management, Overall Equipment Effectiveness (OEE), downtime analysis, and others. Figure 7 below shows a high-level diagram of the real-time meter data flow through StreamInsight. A combination of a tumbling window and two snapshot windows provides precisely time stamped meter summary interval consumption data.
Figure 7: Architecture for Energy AnalytiX Real-time Meter Data Flow through StreamInsight
4.3 ICONICSUseofMicrosoftStreamInsightThe concept of integrating StreamInsight into an application such as Energy AnalytiX is quite simple. All that is needed is an input event stream (via an input adapter or direct result of a LINQ based query), and a query to bind to the input stream. This made it even easier for ICONICS to integrate StreamInsight, since the integration approach did not require any changes in the current architecture of their application.
A key part of any analytics solution is to correlate data from multiple data sources with reference data, typically configuration data or slowly changing data stored inside a database such as SQL Server, and to produce meaningful and actionable performance indicators that can be quickly associated with logical entities that the end user would have configured.
19
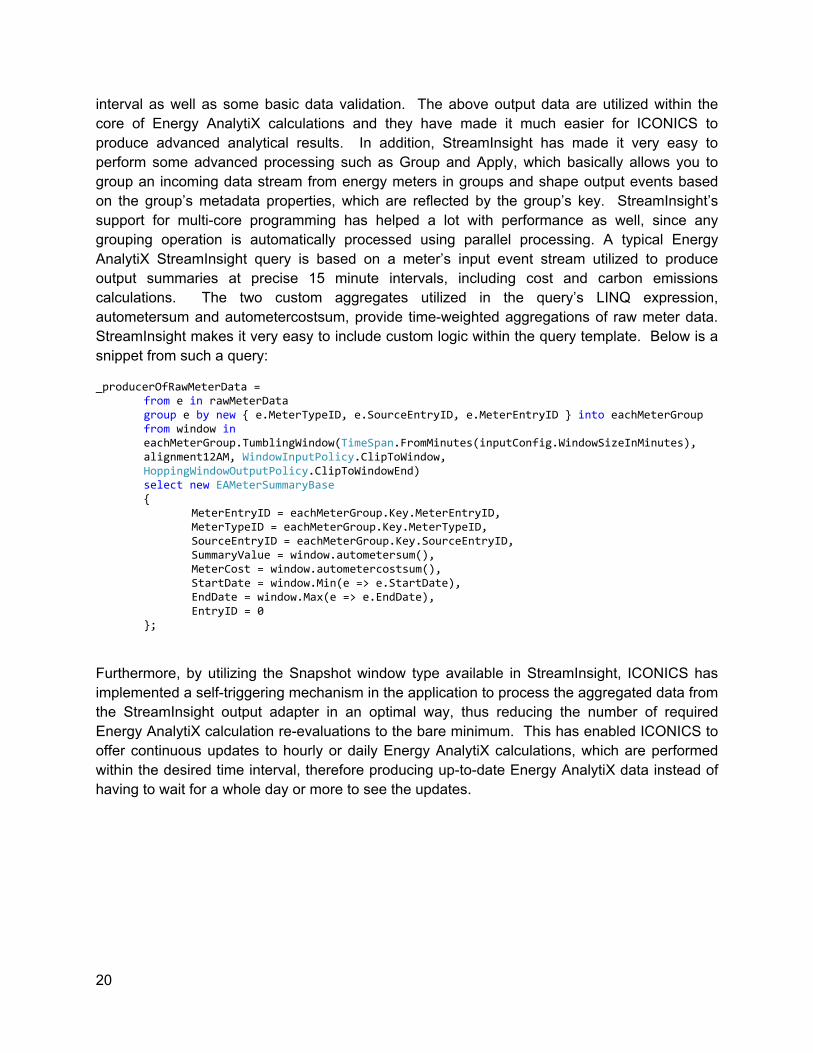
Figure 8: Sample energy meter configuration in Energy AnalytiX
StreamInsight has the unique capability to allow the developer to shape the payload for input and output events. In version 1.1, only simple data types were allowed, but in version 1.2 of StreamInsight, input events could include complex types as well. Currently, Energy AnalytiX input events are related to energy meter data and ICONICS is able to create input events with rich payload information which includes time and date information, rate value as well as other metadata information needed for Energy AnalytiX calculations. As can be seen in Figure 8 above, a typical meter’s configuration includes several properties that are of significant importance when processing the collected meter events through StreamInsight, such as the utility associated with a given meter, the type of the meter, the desired data collection rate, and several other metadata properties.
StreamInsight queries are LINQ based expressions, which allow the developer to customize the shape of the output event in a way that fits the application requirements. In addition, each property (field) of the output event can be computed via a StreamInsight built-in aggregate or an end user custom defined aggregate. In Energy AnalytiX, ICONICS is utilizing both built-in StreamInsight aggregates as well as user defined aggregates to produce the desired payload of the output event. More specifically, ICONICS is producing interval-based energy consumption, peak values of energy consumption within the interval, cost of energy consumption within the
20
interval as well as some basic data validation. The above output data are utilized within the core of Energy AnalytiX calculations and they have made it much easier for ICONICS to produce advanced analytical results. In addition, StreamInsight has made it very easy to perform some advanced processing such as Group and Apply, which basically allows you to group an incoming data stream from energy meters in groups and shape output events based on the group’s metadata properties, which are reflected by the group’s key. StreamInsight’s support for multi-core programming has helped a lot with performance as well, since any grouping operation is automatically processed using parallel processing. A typical Energy AnalytiX StreamInsight query is based on a meter’s input event stream utilized to produce output summaries at precise 15 minute intervals, including cost and carbon emissions calculations. The two custom aggregates utilized in the query’s LINQ expression, autometersum and autometercostsum, provide time-weighted aggregations of raw meter data. StreamInsight makes it very easy to include custom logic within the query template. Below is a snippet from such a query:
_producerOfRawMeterData = from e in rawMeterData group e by new { e.MeterTypeID, e.SourceEntryID, e.MeterEntryID } into eachMeterGroup from window in eachMeterGroup.TumblingWindow(TimeSpan.FromMinutes(inputConfig.WindowSizeInMinutes), alignment12AM, WindowInputPolicy.ClipToWindow, HoppingWindowOutputPolicy.ClipToWindowEnd) select new EAMeterSummaryBase {
MeterEntryID = eachMeterGroup.Key.MeterEntryID, MeterTypeID = eachMeterGroup.Key.MeterTypeID, SourceEntryID = eachMeterGroup.Key.SourceEntryID, SummaryValue = window.autometersum(), MeterCost = window.autometercostsum(), StartDate = window.Min(e => e.StartDate), EndDate = window.Max(e => e.EndDate), EntryID = 0
};
Furthermore, by utilizing the Snapshot window type available in StreamInsight, ICONICS has implemented a self-triggering mechanism in the application to process the aggregated data from the StreamInsight output adapter in an optimal way, thus reducing the number of required Energy AnalytiX calculation re-evaluations to the bare minimum. This has enabled ICONICS to offer continuous updates to hourly or daily Energy AnalytiX calculations, which are performed within the desired time interval, therefore producing up-to-date Energy AnalytiX data instead of having to wait for a whole day or more to see the updates.
21
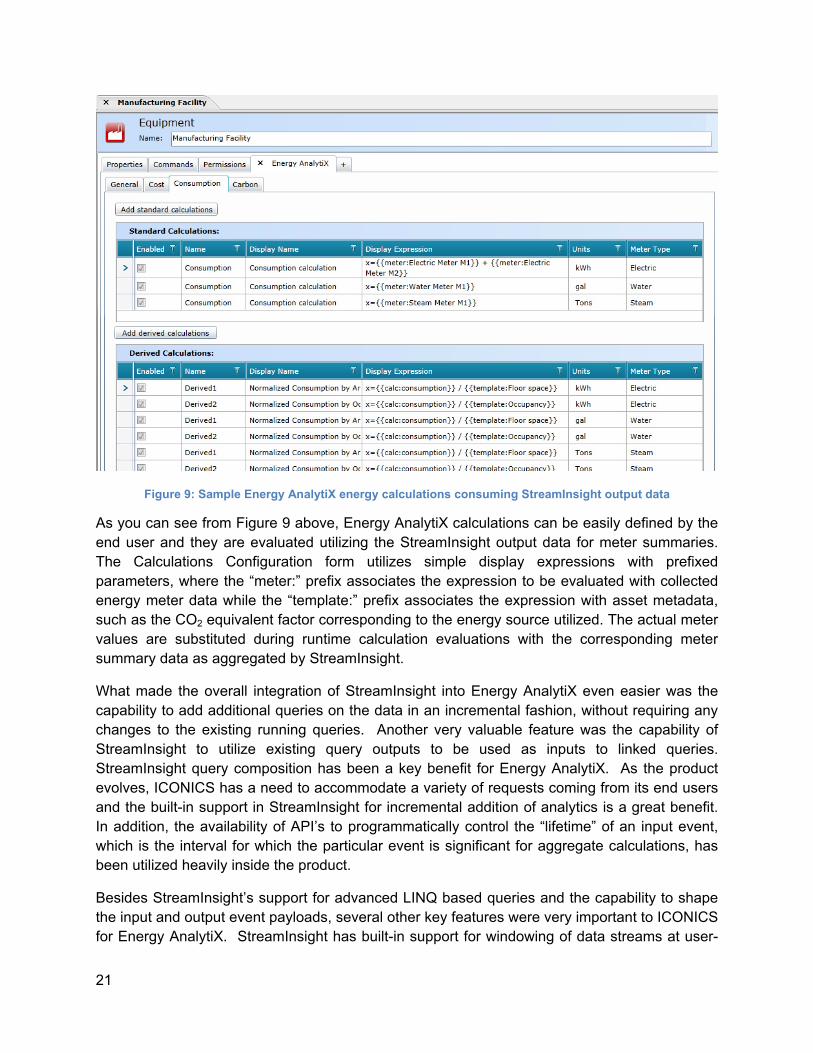
Figure 9: Sample Energy AnalytiX energy calculations consuming StreamInsight output data
As you can see from Figure 9 above, Energy AnalytiX calculations can be easily defined by the end user and they are evaluated utilizing the StreamInsight output data for meter summaries. The Calculations Configuration form utilizes simple display expressions with prefixed parameters, where the “meter:” prefix associates the expression to be evaluated with collected energy meter data while the “template:” prefix associates the expression with asset metadata, such as the CO2 equivalent factor corresponding to the energy source utilized. The actual meter values are substituted during runtime calculation evaluations with the corresponding meter summary data as aggregated by StreamInsight.
What made the overall integration of StreamInsight into Energy AnalytiX even easier was the capability to add additional queries on the data in an incremental fashion, without requiring any changes to the existing running queries. Another very valuable feature was the capability of StreamInsight to utilize existing query outputs to be used as inputs to linked queries. StreamInsight query composition has been a key benefit for Energy AnalytiX. As the product evolves, ICONICS has a need to accommodate a variety of requests coming from its end users and the built-in support in StreamInsight for incremental addition of analytics is a great benefit. In addition, the availability of API’s to programmatically control the “lifetime” of an input event, which is the interval for which the particular event is significant for aggregate calculations, has been utilized heavily inside the product.
Besides StreamInsight’s support for advanced LINQ based queries and the capability to shape the input and output event payloads, several other key features were very important to ICONICS for Energy AnalytiX. StreamInsight has built-in support for windowing of data streams at user-
22
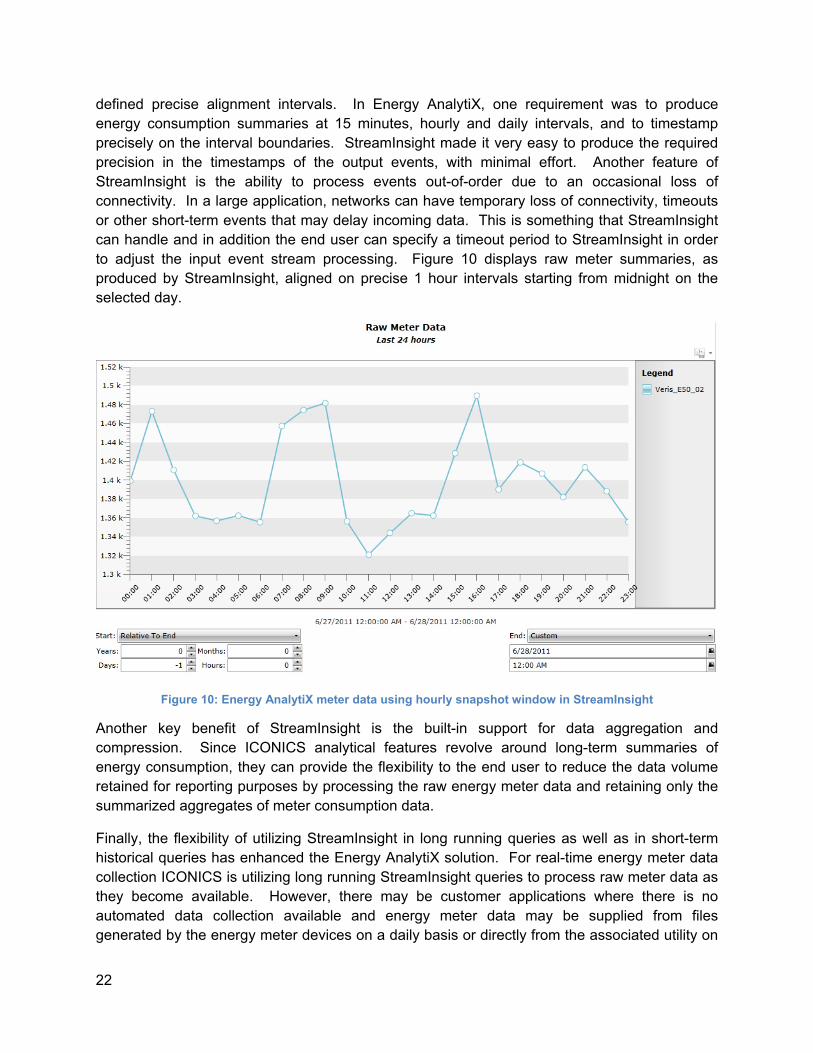
defined precise alignment intervals. In Energy AnalytiX, one requirement was to produce energy consumption summaries at 15 minutes, hourly and daily intervals, and to timestamp precisely on the interval boundaries. StreamInsight made it very easy to produce the required precision in the timestamps of the output events, with minimal effort. Another feature of StreamInsight is the ability to process events out-of-order due to an occasional loss of connectivity. In a large application, networks can have temporary loss of connectivity, timeouts or other short-term events that may delay incoming data. This is something that StreamInsight can handle and in addition the end user can specify a timeout period to StreamInsight in order to adjust the input event stream processing. Figure 10 displays raw meter summaries, as produced by StreamInsight, aligned on precise 1 hour intervals starting from midnight on the selected day.
Figure 10: Energy AnalytiX meter data using hourly snapshot window in StreamInsight
Another key benefit of StreamInsight is the built-in support for data aggregation and compression. Since ICONICS analytical features revolve around long-term summaries of energy consumption, they can provide the flexibility to the end user to reduce the data volume retained for reporting purposes by processing the raw energy meter data and retaining only the summarized aggregates of meter consumption data.
Finally, the flexibility of utilizing StreamInsight in long running queries as well as in short-term historical queries has enhanced the Energy AnalytiX solution. For real-time energy meter data collection ICONICS is utilizing long running StreamInsight queries to process raw meter data as they become available. However, there may be customer applications where there is no automated data collection available and energy meter data may be supplied from files generated by the energy meter devices on a daily basis or directly from the associated utility on
23
a monthly basis. Energy AnalytiX utilizes the same exact query templates of StreamInsight from its long running queries to calculate precise time windowed summaries for externally entered meter data. What made it even easier to process StreamInsight queries on historical data was the integration of StreamInsight with .NET sequences to facilitate access to relational databases like Microsoft SQL Server, which significantly reduced development time.
A distinct product feature of StreamInsight, besides the analytics nature of the technology, is the debugging facilities included within StreamInsight’s Event Flow Debugger. It has been a great tool to utilize during the development process and it is an asset for ICONICS’ Technical Support team as well for resolving customer issues. By utilizing the Event Flow Debugger, end users can get real-time information of the running StreamInsight queries’ status as well as to create output logs which can be loaded within the Event Flow Debugger offline in order to troubleshoot data processing issues.
5 SummaryandOutlookMicrosoft StreamInsight 1.2 adds several new features that are of great interest to ICONICS and Energy AnalytiX. Today’s data produced by analytics applications such as Energy AnalytiX are very valuable to organizations, since they represent the primary source of data for making significant business decisions. As such, the data quality and data reliability aspects of any analytics solution are of primary importance. StreamInsight’s checkpointing capability is a major step towards achieving the goal of a resilient analytics solution. The key benefit of the new checkpointing feature is that it can restore the state of a StreamInsight query, and therefore allow scenarios where data collectors can run in parallel and switch between active and standby (backup) nodes without loss of output data. Another scenario could be the reboot of a server, where an analytics application was feeding a long running StreamInsight query. By using checkpointing, we can recover the state of the query and reach an output equivalency state, where the output would be the same as if no interruption had occurred. This feature applies even to non-redundant scenarios, where for example a server is rebooted or a new server is brought online due to maintenance work on the existing server.
Another new exciting feature in StreamInsight 1.2 that can be applied to virtually any analytics solution is the support for User Defined Stream Operators (USDO). By using this feature, a developer effectively takes control over the sequence of output data from the StreamInsight query and has the opportunity to apply common algorithms such as smoothing, prediction, estimation and others. In many analytics applications the capability to statistically model certain aspects of the application is quite important and often is a key differentiator among vendors. A typical example in Energy AnalytiX would be to predict future consumption based on weather data such as the number of days with highs above a certain temperature.
Finally, certain smaller enhancements to StreamInsight V1.2 such as LINQ language enhancements and the ability to have nested classes as event payloads are also interesting and appealing to Energy AnalytiX. The above enhancements substantially improve any analytics application’s capability to create customized, information-rich payloads for events in order to achieve even more flexible drill-down possibilities.
24
While continuing the support for on-premise enterprise deployments of StreamInsight, cloud computing offers an attractive alternative to on-premise deployments. Complex event processing in the Microsoft cloud (Windows Azure Platform) is particularly beneficial for smaller customers who do not want to own the hardware or maintain the software platform for an on-premise installation. In many energy management scenarios, the data acquisition topology facilitates cloud-based deployments: when assets or equipment are distributed geographically, telemetry data produced by the instrumentation of the assets has to travel to a place for global cross-asset analytics. Why not make the cloud the place where these analytics are performed? StreamInsight simplifies cloud deployments by keeping the development surface between the on-premise and the cloud-based version of the product currently being developed under the codename “Austin” as closely aligned as possible. This will make it easier for customers and partners like ICONICS to take their existing solutions such as Energy AnalytiX to the Microsoft cloud.
For more information:
http://www.microsoft.com/sqlserver/: SQL Server Web site
http://technet.microsoft.com/en-us/sqlserver/: SQL Server TechCenter
http://msdn.microsoft.com/en-us/sqlserver/: SQL Server DevCenter
http://www.iconics.com/: ICONICS Web site
http://www.iconics.com/Home/Products/AnalytiX/Energy-AnalytiX.aspx: ICONICS Energy AnalytiX Product Page
Did this paper help you? Please give us your feedback. Tell us on a scale of 1 (poor) to 5 (excellent), how would you rate this paper and why have you given it this rating? For example:
Are you rating it high due to having good examples, excellent screen shots, clear writing, or another reason?
Are you rating it low due to poor examples, fuzzy screen shots, or unclear writing?
This feedback will help us improve the quality of white papers we release.
Send feedback.