Chris M. Cerino, M.T. - Sultana Projects
67
Transcript of Chris M. Cerino, M.T. - Sultana Projects


Text and graphic design by Chris M. Cerino, M.T. Vice President - Sultana Projects, Inc.
COVER: Photograph of Sultana courtesy of Lucian Niemeyer
Text reviewed by Robert and Alice Jane Lippson,
co-authors of Life in the Chesapeake Bay and Life in the Chesapeake Bay, Second Edition
Second printing of this publication funded by grants from the Chesapeake Bay Trust and Shared Earth Foundation
Special thanks to the artists who donated their work to this publication:
Alice Jane Lippson Marcy Dunn Ramsey Marc Castelli Gibson Anthony
We would also like to acknowledge the teachers who assisted with curriculum development as members of our Educational Advisory Board:
JeJe Watson, Key School Ellen Chamberlin, Chestertown Middle School
Billie Roberts, Worton Elementary School Pam Deringer, Kent School
Gail Anderson, Bayside Elementary School Susan Clark, Garnett Elementary School
Bennett Downs, Church Hill Elementary School Brooke Logan, Caroline County public schools (retired)
Copyright ©2000 by Sultana Projects, Inc.
Any teacher, school, or school district may reproduce this for class use without written permission. This publication may not be sold for profit. The text cannot be reproduced for use in other publications without written consent from Sultana Projects, Inc.
ISBN 0-9707200-1-7
SULTANA PROJECTS, INC. 105 South Cross Street ● P.O. Box 524 ● Chestertown, MD 21620
Phone: (410) 778-5954 Fax: (410) 778-4531 Email: [email protected]

ABOVE: The Chesapeake Bay as it may have appeared to Sultana’s crew members in 1770.
Artwork courtesy of Marcy Dunn Ramsey

Table of Contents
TOPIC PAGE
KWL Chart 3
The Chesapeake Bay Watershed 4 - 6
Exploring the Watershed: The Story of Heidi and Gibson Anthony 7 - 9
Salinity 10 - 11
Making a Line Graph: Annual Freshwater Inflow to the Bay 12 - 14
Plankton: the Base of the Food Web 15 - 16
Crabs 17 - 19
Making a Line Graph: Blue Crab Harvests 20 - 22
Oysters 23 - 25
Rockfish 26 - 27
Making a Line Graph: Rockfish Harvests 28 - 30
Anatomy of a Fish 31 - 32
Bald Eagles 33 - 34
Making a Bar Graph: Bald Eagle Nesting Pairs 35 - 37
SAV’s (submerged aquatic vegetation) 38 - 39
Making a Bar Graph: SAV Acreage 40 - 42
The Grasses in Classes Program 43 - 44
Wetlands: Food, Filter, Habitat 45 - 46
Watermen 47 - 48
The Economics of “Crabbing” 49 - 52
Nutrients: Too Much of a Good Thing 53 - 54
Pollution and the Chesapeake Bay 55 - 56
What One Person Can Do to Help the Bay 57 - 58
Saving the Bay One Schoolyard at a Time 59 - 60
Checklist for a “Bay Friendly” Lifestyle 61
Glossary 62 - 63
Additional Resources for Learning About the Bay 64
Illustration selected from The Changing Chesapeake with permission from The National Aquarium in Baltimore.
Brainstorming: KWL Chart NAME: __________________________________________ DATE: ______________ DIRECTIONS: Fill in the K and W columns of the KWL chart to brainstorm what you know and want to find out about the Chesapeake Bay. After you have completed your Chesapeake Bay unit, fill in the L column to demonstrate what you learned.
K What do I know about
the subject?
W What do I want to
find out?
L What have I learned about
the subject?
3
T he Chesapeake Bay gets its fresh water from thousands of brooks, streams, and rivers which drain 64,000 square miles of land. The enormous piece of land which
drains fresh water to the Bay is known as its watershed. States within the Chesapeake Bay watershed’s boundaries include New York, Pennsylvania, Delaware, Maryland, West Virginia, and Virginia. Since the Chesapeake Bay watershed covers such a large amount of land, the health of its water is affected by human activities which take place hundreds of miles upstream. Soil from tilled farm fields in Pennsylvania, human sewage from treatment
plants in central Virginia, and even chemicals found on the parking lot of the Baseball Hall of Fame in Cooperstown, New York all have the potential to be washed into feeder streams which eventually flow to the Bay. If you live within the watershed’s boundaries, the health of the Bay literally begins with the stream in your own back yard. When fresh water reaches the Chesapeake, it mixes with salt water from the Atlantic Ocean to create brackish water. Ecosystems which contain brackish water are called estuaries. Estuaries are famous for being among the most productive ecosystems in the world. The Chesapeake Bay is the largest estuary in North America. It is also home to over 2,000 species of plants and animals! Some of the most well-known seafood products to come from the Chesapeake include oysters, crabs, striped bass (rockfish), and clams.
In the 1600’s, virtually all of the land which makes up the Chesapeake Bay watershed was covered with dense, old growth forests. The canopies of these trees protected the soil from the impact of heavy rains, while the massive root systems kept erosion under control. As a result, fresh water entering the Bay was exceptionally clean and crystal clear. The water clarity allowed rooted plants to thrive on the bottom of the Bay, providing ideal habitat for fish, crabs, and other organisms. Early explorers of the
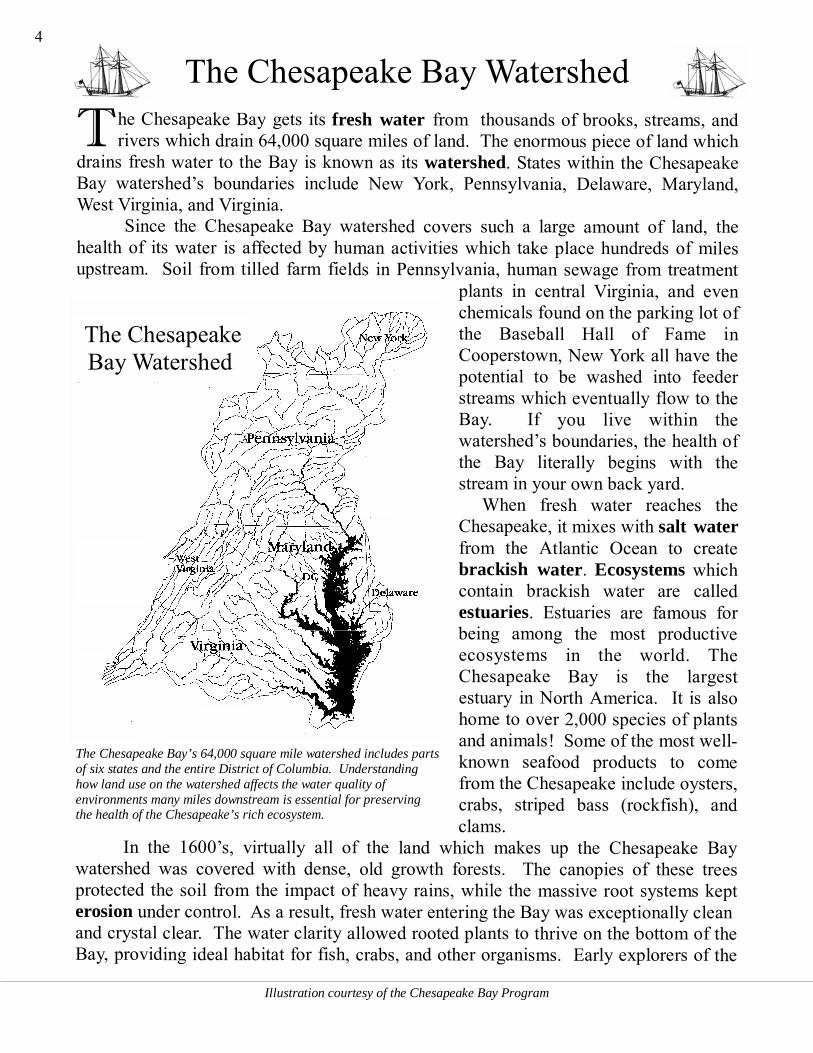
The Chesapeake Bay’s 64,000 square mile watershed includes parts of six states and the entire District of Columbia. Understanding how land use on the watershed affects the water quality of environments many miles downstream is essential for preserving the health of the Chesapeake’s rich ecosystem.
The Chesapeake Bay Watershed
Illustration courtesy of the Chesapeake Bay Program
The Chesapeake Bay Watershed 4
The Chesapeake Bay Watershed Chesapeake were amazed by the amount of marine life that they witnessed in this incredibly productive environment. As 16 million people have crowded onto the watershed in the last 400 years, many forests have been cleared to make room for housing developments, roads, and farm fields. When rain water rushes over these unprotected environments, it transports large amounts of sediments and pollutants to the Bay, lowering the water quality and making it more difficult for plants, fish, crabs, and other animals to survive. Only recently have we begun to fully understand the connection between land use on the watershed and the health of the Chesapeake Bay. If people take care of the land within the watershed’s boundaries, the result is a healthier ecosystem.
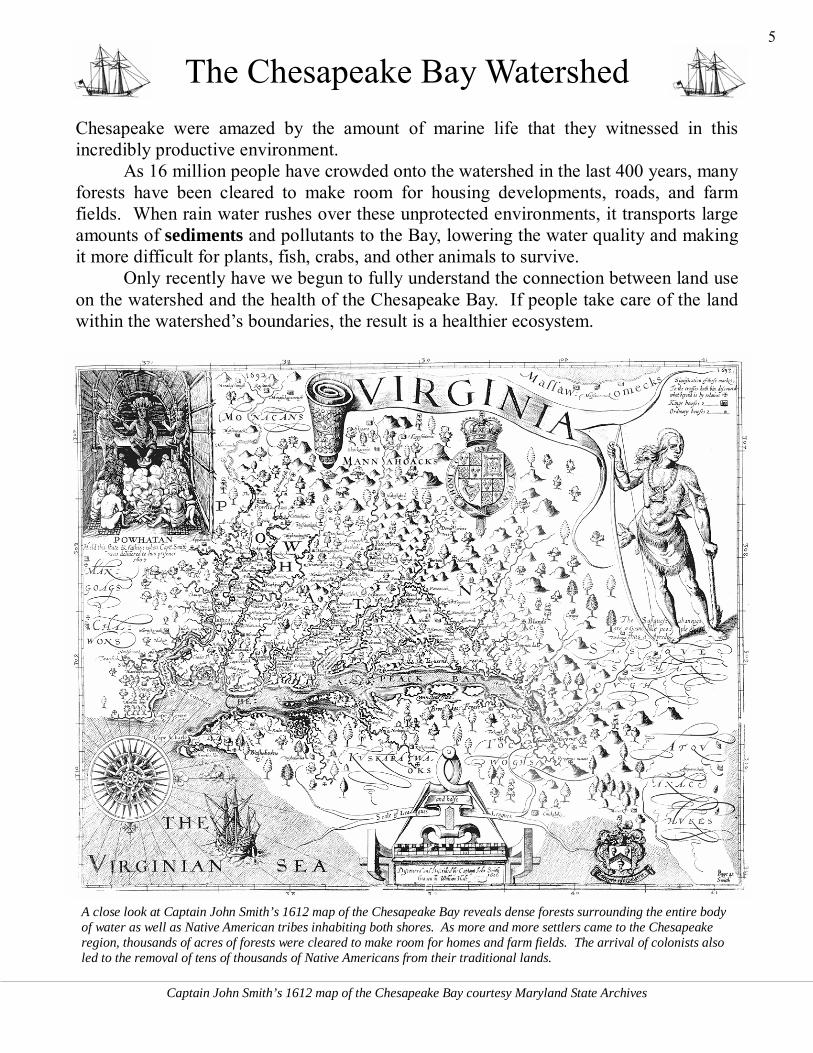
Captain John Smith’s 1612 map of the Chesapeake Bay courtesy Maryland State Archives
A close look at Captain John Smith’s 1612 map of the Chesapeake Bay reveals dense forests surrounding the entire body of water as well as Native American tribes inhabiting both shores. As more and more settlers came to the Chesapeake region, thousands of acres of forests were cleared to make room for homes and farm fields. The arrival of colonists also led to the removal of tens of thousands of Native Americans from their traditional lands.
5
NAME: __________________________________________ DATE: ______________
COMPREHENSION QUESTIONS
DIRECTIONS: Read the text on the previous pages, then answer the following questions in complete sentences. Write your answers on the lines. 1. What is a watershed? 2. What states are included in the Chesapeake Bay watershed? 3. What is brackish water? 4. In the space below, describe how someone’s actions in New York or Pennsylvania
could affect the water quality of the Chesapeake Bay: 5. How has the land within the watershed changed in the last 400 years?
The Chesapeake Bay Watershed 6
Photographs courtesy of Gibson Anthony ©2000
O n June 17, 2000, Heidi and Gibson Anthony of Chestertown, Maryland
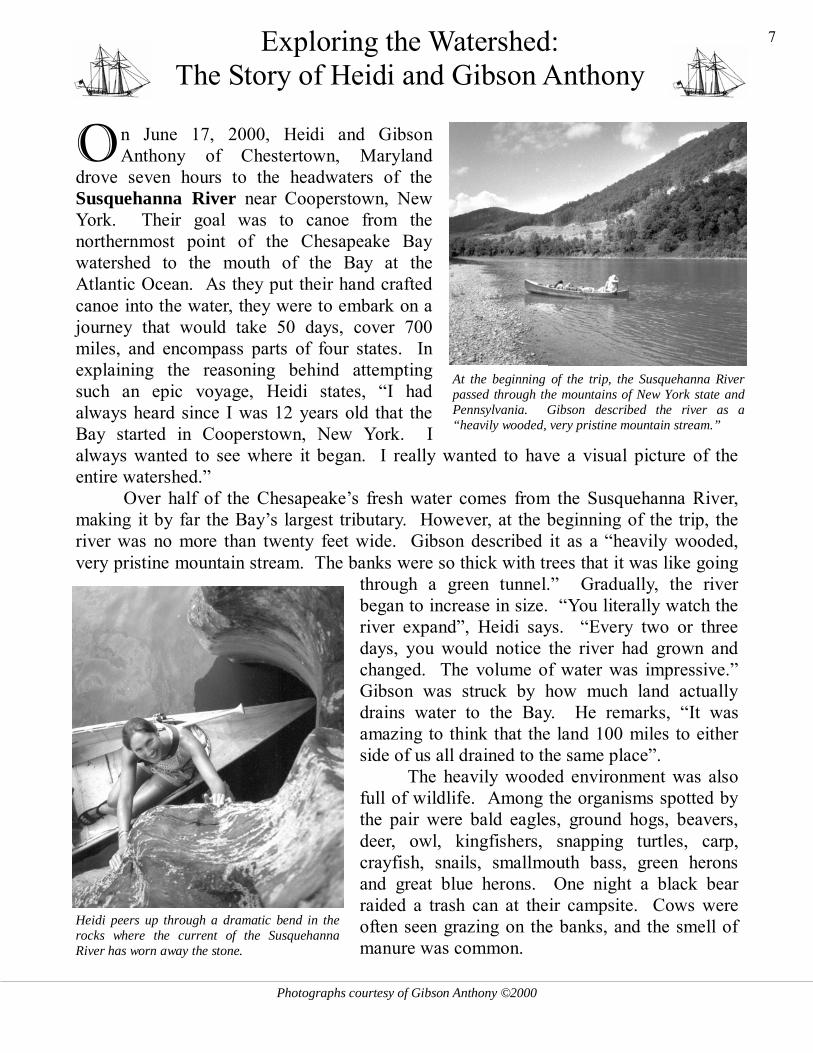
drove seven hours to the headwaters of the Susquehanna River near Cooperstown, New York. Their goal was to canoe from the northernmost point of the Chesapeake Bay watershed to the mouth of the Bay at the Atlantic Ocean. As they put their hand crafted canoe into the water, they were to embark on a journey that would take 50 days, cover 700 miles, and encompass parts of four states. In explaining the reasoning behind attempting such an epic voyage, Heidi states, “I had always heard since I was 12 years old that the Bay started in Cooperstown, New York. I always wanted to see where it began. I really wanted to have a visual picture of the entire watershed.” Over half of the Chesapeake’s fresh water comes from the Susquehanna River, making it by far the Bay’s largest tributary. However, at the beginning of the trip, the river was no more than twenty feet wide. Gibson described it as a “heavily wooded, very pristine mountain stream. The banks were so thick with trees that it was like going
through a green tunnel.” Gradually, the river began to increase in size. “You literally watch the river expand”, Heidi says. “Every two or three days, you would notice the river had grown and changed. The volume of water was impressive.” Gibson was struck by how much land actually drains water to the Bay. He remarks, “It was amazing to think that the land 100 miles to either side of us all drained to the same place”. The heavily wooded environment was also full of wildlife. Among the organisms spotted by the pair were bald eagles, ground hogs, beavers, deer, owl, kingfishers, snapping turtles, carp, crayfish, snails, smallmouth bass, green herons and great blue herons. One night a black bear raided a trash can at their campsite. Cows were often seen grazing on the banks, and the smell of manure was common.
At the beginning of the trip, the Susquehanna River passed through the mountains of New York state and Pennsylvania. Gibson described the river as a “heavily wooded, very pristine mountain stream.”
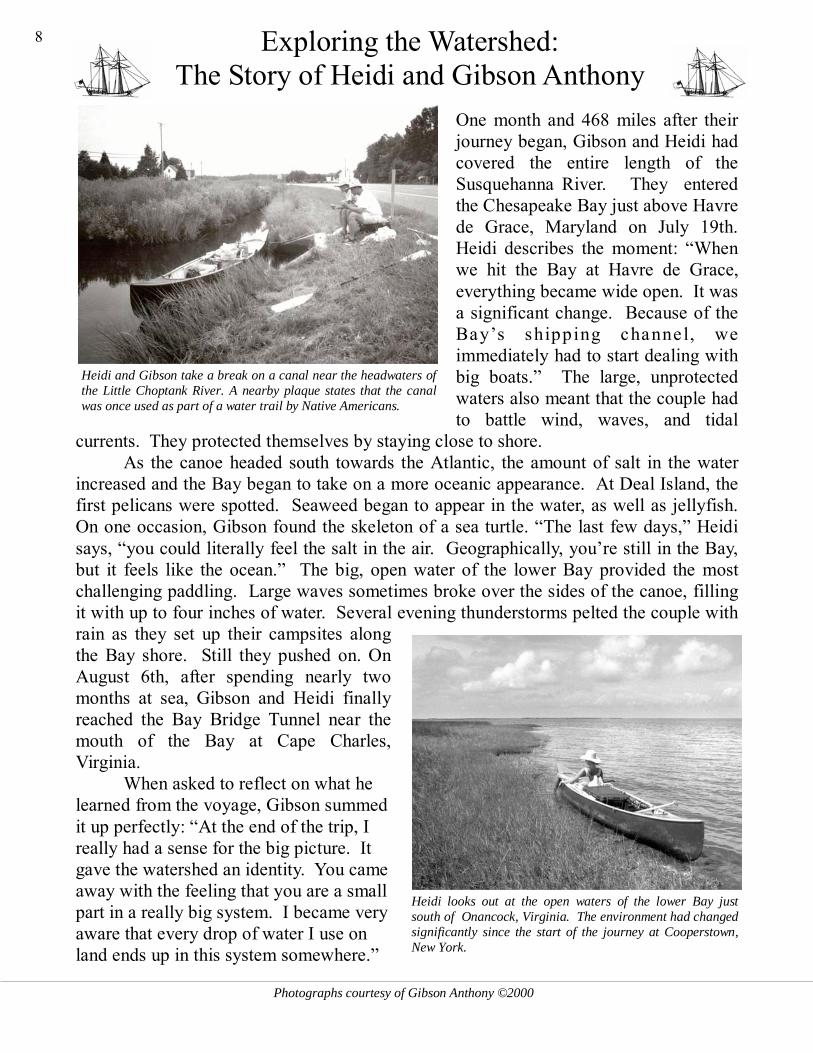
Heidi peers up through a dramatic bend in the rocks where the current of the Susquehanna River has worn away the stone.
Exploring the Watershed: The Story of Heidi and Gibson Anthony
7
Photographs courtesy of Gibson Anthony ©2000
One month and 468 miles after their journey began, Gibson and Heidi had covered the entire length of the Susquehanna River. They entered the Chesapeake Bay just above Havre de Grace, Maryland on July 19th. Heidi describes the moment: “When we hit the Bay at Havre de Grace, everything became wide open. It was a significant change. Because of the Bay’s shipping channel, we immediately had to start dealing with big boats.” The large, unprotected waters also meant that the couple had to battle wind, waves, and tidal
currents. They protected themselves by staying close to shore. As the canoe headed south towards the Atlantic, the amount of salt in the water increased and the Bay began to take on a more oceanic appearance. At Deal Island, the first pelicans were spotted. Seaweed began to appear in the water, as well as jellyfish. On one occasion, Gibson found the skeleton of a sea turtle. “The last few days,” Heidi says, “you could literally feel the salt in the air. Geographically, you’re still in the Bay, but it feels like the ocean.” The big, open water of the lower Bay provided the most challenging paddling. Large waves sometimes broke over the sides of the canoe, filling it with up to four inches of water. Several evening thunderstorms pelted the couple with rain as they set up their campsites along the Bay shore. Still they pushed on. On August 6th, after spending nearly two months at sea, Gibson and Heidi finally reached the Bay Bridge Tunnel near the mouth of the Bay at Cape Charles, Virginia. When asked to reflect on what he learned from the voyage, Gibson summed it up perfectly: “At the end of the trip, I really had a sense for the big picture. It gave the watershed an identity. You came away with the feeling that you are a small part in a really big system. I became very aware that every drop of water I use on land ends up in this system somewhere.”
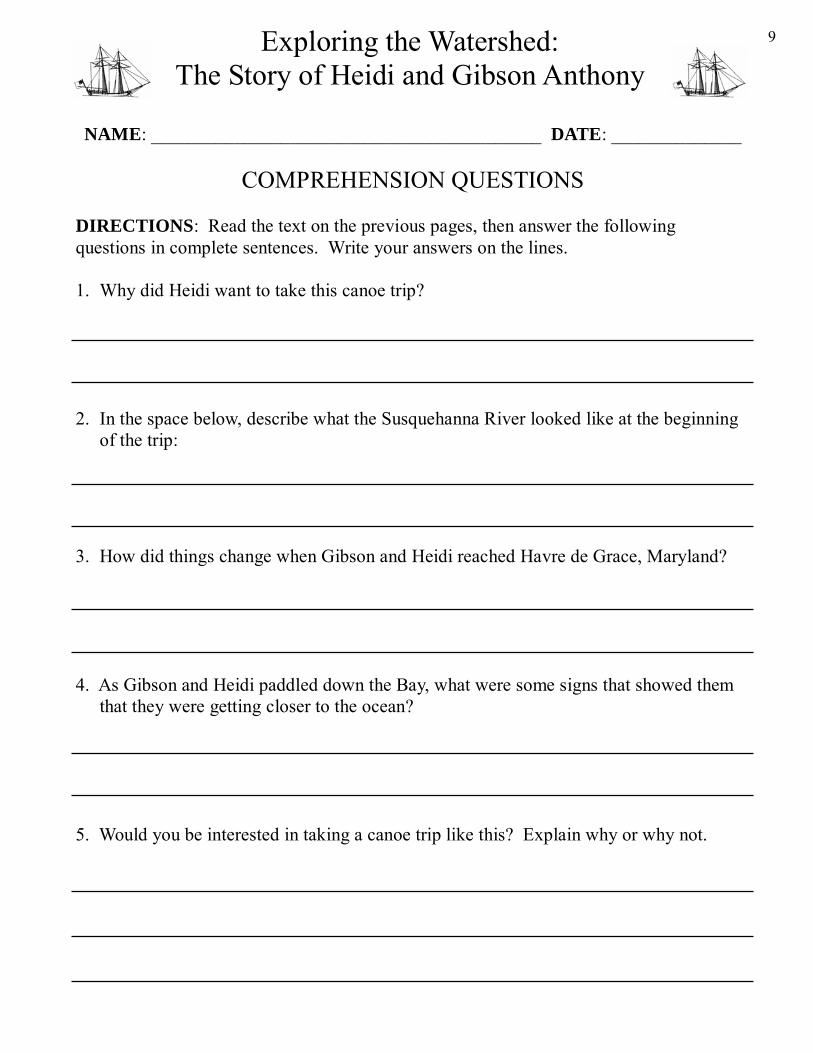
Heidi and Gibson take a break on a canal near the headwaters of the Little Choptank River. A nearby plaque states that the canal was once used as part of a water trail by Native Americans.
Heidi looks out at the open waters of the lower Bay just south of Onancock, Virginia. The environment had changed significantly since the start of the journey at Cooperstown, New York.
Exploring the Watershed: The Story of Heidi and Gibson Anthony
8
NAME: __________________________________________ DATE: ______________
COMPREHENSION QUESTIONS
DIRECTIONS: Read the text on the previous pages, then answer the following questions in complete sentences. Write your answers on the lines. 1. Why did Heidi want to take this canoe trip? 2. In the space below, describe what the Susquehanna River looked like at the beginning
of the trip: 3. How did things change when Gibson and Heidi reached Havre de Grace, Maryland? 4. As Gibson and Heidi paddled down the Bay, what were some signs that showed them
that they were getting closer to the ocean? 5. Would you be interested in taking a canoe trip like this? Explain why or why not.
Exploring the Watershed: The Story of Heidi and Gibson Anthony
9

S alinity refers to the amount of salt contained in a given sample of water. Salinity is measured in parts per thousand, or ppt. Fresh water found in non-tidal rivers and
streams contains less than one ppt. Salt water found in the Atlantic Ocean contains 30 to 35 ppt. When salt and fresh water mix together in the Chesapeake Bay, brackish water is created. The salinity of brackish water can range anywhere from 1 to 29 ppt. The salinity of water found in the Bay depends on many different factors, including location, time of year, and depth of the water. The Bay is saltiest at its mouth, closest to the salt water inflow of the Atlantic Ocean. The Bay contains its lowest salinity levels in the Upper Bay, just below the powerful freshwater inflow of the Susquehanna River. In between exist a wide range of salinities, with the concentration
of salt gradually decreasing as one travels from the mouth of the Chesapeake near the ocean to its no rthernmost po int be low the Susquehanna (see diagram at left). Salinity in the Bay also depends upon the time of year. In the Spring, when freshwater inflow from rivers are at their highest levels due to rainfall, the Bay tends to be less salty. In the Fall, which tends to be the driest time of year, the salinity levels of the Bay increase. The depth of the water plays a role in determining salinity as well. Salt water is heavier than fresh water and flows into the Bay along the bottom. Water at the bottom of the Bay is therefore saltier than water near the surface.
The level of salinity at a given location to a large extent determines what types of species are found there. Species which prefer high levels of salinity such as red drum and sharks can be found near the Bay’s mouth. Species which prefer freshwater such as largemouth bass and catfish are commonly found in the Upper Bay. Some species of fish, such as striped bass and croaker, have tolerance for a wide range of salinities and can be found throughout the Chesapeake. Salinity also determines what type of plant life is found in an area. Eelgrass, for example, is commonly found in the high-salinity waters surrounding Smith and Tangier Islands, while coontail, sago pondweed and wild celery are common to the fresh tidal waters of the Upper Bay. Understanding the role salinity plays in determining what types of plant and animal species are found in various sections of the Bay is essential to understanding the ecology of its ecosystem.
Salinity and the Chesapeake Bay
10
NAME: __________________________________________ DATE: ______________
COMPREHENSION QUESTIONS
DIRECTIONS: Read the text on the previous page, then answer the following questions in complete sentences. Write your answers on the lines. 1. What is the salinity range found in brackish water? 2. Why is the Bay saltiest at its mouth? 3. What are two factors that help determine salinity levels in the Chesapeake Bay? 4. Using examples from the text, describe how salinity levels determine what plants and
animals live in different parts of the Bay.
Salinity and the Chesapeake Bay 11

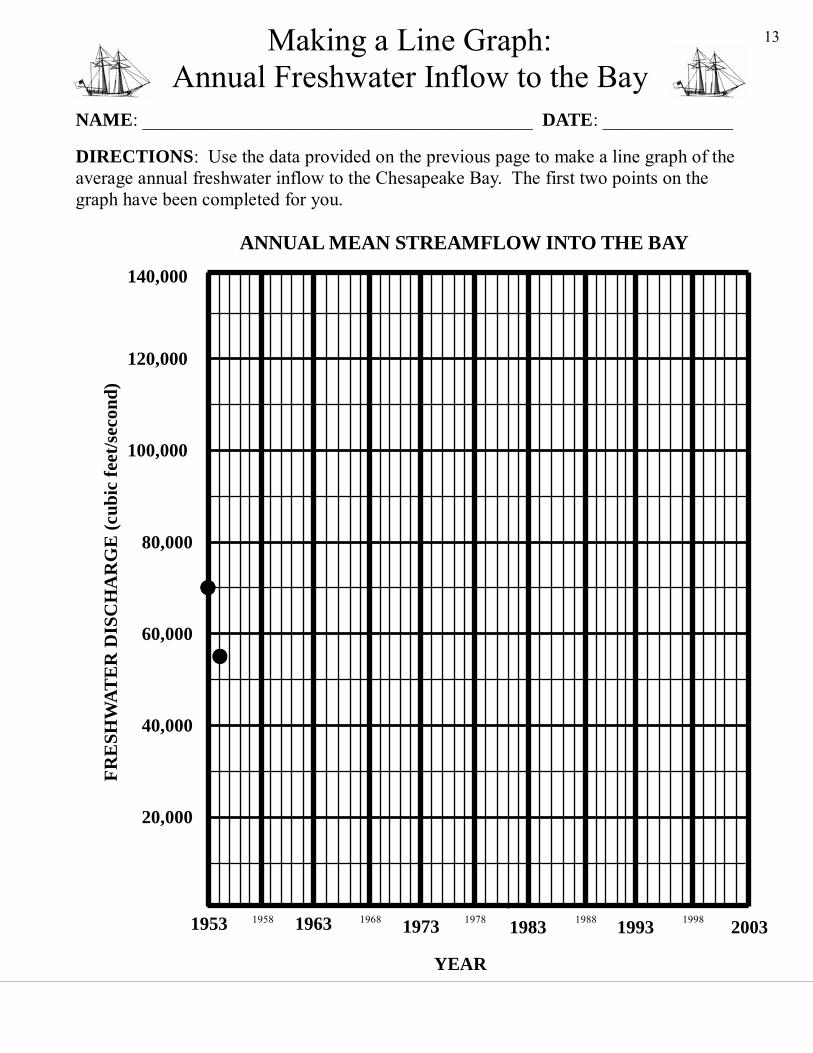
Making a Line Graph: Annual Freshwater Inflow to the Bay
O ne factor which determines the salinity of the Bay’s water is the weather. When there is a lot of rain, the salinity of water in the Bay’s main stem decreases.
During very dry years, salinity levels rise. The amount of rainfall is highly unpredictable, so the salinity of the Chesapeake Bay is constantly changing from year to year, season to season, and even day to day. Below is the Bay’s average freshwater inflow from 1953 through 2003 measured in cubic feet per second. Plot the data on the graph provided to get a picture of the annual variation of the Bay’s freshwater inflow. The first two points are plotted for you.
DATA Annual Freshwater Inflow to the Chesapeake Bay
1953 - 2003 YEAR CU FT/SEC.
1987 74,000 1988 51,000 1989 77,000 1990 89,000 1991 60,000 1992 73,000 1993 100,000 1994 99,000 1995 62,000 1996 135,100 1997 64,300 1998 97,700 1999 53,500 2000 65,300 2001 48,700 2002 57,800 2003 133,692
YEAR CU FT/SEC.
1970 75,500 1971 76,000 1972 130,000 1973 90,000 1974 75,000 1975 105,000 1976 80,000 1977 77,000 1978 89,000 1979 112,000 1980 62,000 1981 51,000 1982 74,000 1983 88,000 1984 100,000 1985 70,000 1986 71,000
YEAR CU FT/SEC.
1953 70,000 1954 55,000 1955 74,000 1956 75,000 1957 62,000 1958 76,000 1959 62,500 1960 75,500 1961 76,000 1962 70,000 1963 50,000 1964 60,000 1965 49,000 1966 51,000 1967 75,500 1968 60,000 1969 51,000
DATA SOURCE: United States Geological Survey - www.usgs.gov
12
Making a Line Graph: Annual Freshwater Inflow to the Bay
NAME: __________________________________________ DATE: ______________ DIRECTIONS: Use the data provided on the previous page to make a line graph of the average annual freshwater inflow to the Chesapeake Bay. The first two points on the graph have been completed for you.
140,000
FRE
SHW
ATE
R D
ISC
HA
RG
E (c
ubic
feet
/sec
ond)
YEAR
120,000
100,000
80,000
60,000
40,000
20,000
ANNUAL MEAN STREAMFLOW INTO THE BAY
1953 1963 1973 1983 1993 2003 1958 1968 1978 1988 1998
13
NAME: __________________________________________ DATE: ______________
COMPREHENSION QUESTIONS
DIRECTIONS: Use the data from your line graph on the previous page/s to answer the following questions in complete sentences. Write your answers on the lines. 1. What are the three “wettest years on record”? How would the large volume of stream
flow entering the Bay have affected its salinity levels? 2. What would the weather have been like during each of those years? 3. Using your data, find two years when the Chesapeake Bay would have had unusually
high salinity levels. Explain why you chose those years. 4. Using your data, predict what type of salinity levels you might have found in the
Upper Bay in the spring of 1975. Give reasons which support your prediction.
Salinity: Interpreting Your Data
14

W hile the Chesapeake Bay is most famous for its rockfish, oysters, and crabs, the most important members of its ecosystem are plant and animal plankton which
are often invisible to the human eye. Although these organisms generally go unnoticed to the casual observer, they serve as the base of the Bay’s extensive food chain. Plankton are defined as organisms whose movements are controlled by the current. Microscopic plants called phytoplankton are by far the most numerous plankton in the estuary. Thousands of these small, single celled plants can be found in a single drop of water! Zooplankton are animals whose movements are controlled by tidal currents. Many zooplankton are copepods which never grow to be bigger
than the tip of a pencil, while some animals such as crabs and rockfish begin their lives as zooplankton and grow out of that phase of their lives when they become big enough to swim against the current. The main difference between estuaries and other aquatic ecosystems is the abundance of phytoplankton found in their waters. Since the Chesapeake Bay is surrounded by land on three sides,
nutrient rich soil is constantly washed into rivers and streams which carry the sediments to the estuary. Phytoplankton use these nutrients, along with sunlight, water, and carbon dioxide, to grow in abundance. The microscopic plants provide a plentiful food source for zooplankton, which are eaten by small fish and filter feeders. Large fish prey on the smaller fish, and are in turn eaten by predators such as ospreys, bald eagles, and human beings. This interconnected system is known as the food web, of which phytoplankton and zooplankton serve as the most important links. Without plankton, larger and more well-known species of animals such as rockfish, oysters, and crabs would cease to exist!
Illustration courtesy of Alice Jane Lippson, selected from Life in the Chesapeake Bay, Second Edition
Plankton: Base of the Food Chain 15
COMMON PLANKTON OF THE CHESAPEAKE BAY
If you could view the waters of the Chesapeake Bay through the lens of a high-powered microscope, you would see a virtual “plankton soup” filled with plants and animals like the ones pictured above.
PHYTOPLANKTON: ZOOPLANKTON: 1. Dinoflagellate 6. Barnacle naupilus larva 11. Crab zoea larva 16. Copepod 2. Dinoflagellate 7. Barnacle cypris larva 12. Herring egg 17. Giant water flea 3. Diatom 8. Polychaete worm larva 13. Striped bass larva 18. Hydromedusa 4. Green alga 9. Snail larva 14. Sea nettle ephyra 5. Green-brown alga 10. Oyster larva 15. Copepod
NAME: __________________________________________ DATE: ______________
COMPREHENSION QUESTIONS
DIRECTIONS: Read the text on the previous page, then answer the following questions in complete sentences. Write your answers on the lines. 1. What are plankton? 2. What are the two different types of plankton? 3. In the space below, explain how phytoplankton is important to bald eagles.
4. In the space below, explain how zooplankton are important to rockfish.
Plankton: Base of the Food Chain 16
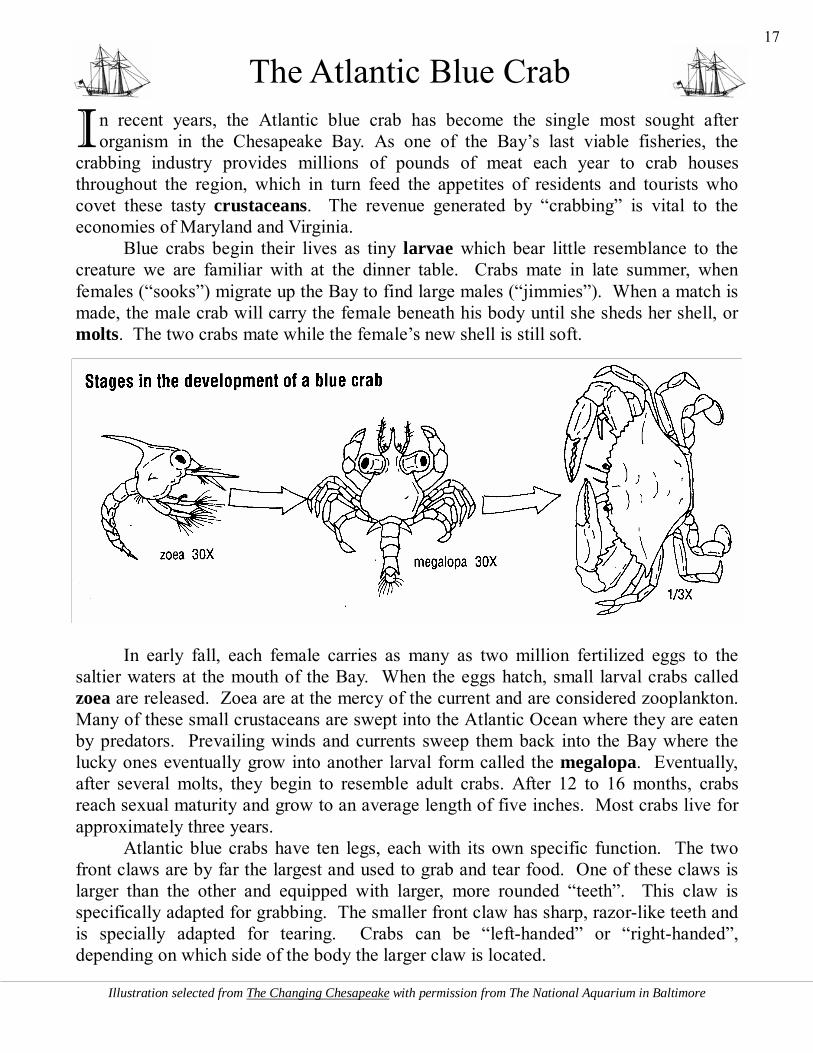
I n recent years, the Atlantic blue crab has become the single most sought after organism in the Chesapeake Bay. As one of the Bay’s last viable fisheries, the
crabbing industry provides millions of pounds of meat each year to crab houses throughout the region, which in turn feed the appetites of residents and tourists who covet these tasty crustaceans. The revenue generated by “crabbing” is vital to the economies of Maryland and Virginia. Blue crabs begin their lives as tiny larvae which bear little resemblance to the creature we are familiar with at the dinner table. Crabs mate in late summer, when females (“sooks”) migrate up the Bay to find large males (“jimmies”). When a match is made, the male crab will carry the female beneath his body until she sheds her shell, or molts. The two crabs mate while the female’s new shell is still soft.
In early fall, each female carries as many as two million fertilized eggs to the saltier waters at the mouth of the Bay. When the eggs hatch, small larval crabs called zoea are released. Zoea are at the mercy of the current and are considered zooplankton. Many of these small crustaceans are swept into the Atlantic Ocean where they are eaten by predators. Prevailing winds and currents sweep them back into the Bay where the lucky ones eventually grow into another larval form called the megalopa. Eventually, after several molts, they begin to resemble adult crabs. After 12 to 16 months, crabs reach sexual maturity and grow to an average length of five inches. Most crabs live for approximately three years. Atlantic blue crabs have ten legs, each with its own specific function. The two front claws are by far the largest and used to grab and tear food. One of these claws is larger than the other and equipped with larger, more rounded “teeth”. This claw is specifically adapted for grabbing. The smaller front claw has sharp, razor-like teeth and is specially adapted for tearing. Crabs can be “left-handed” or “right-handed”, depending on which side of the body the larger claw is located.
Illustration selected from The Changing Chesapeake with permission from The National Aquarium in Baltimore
The Atlantic Blue Crab 17
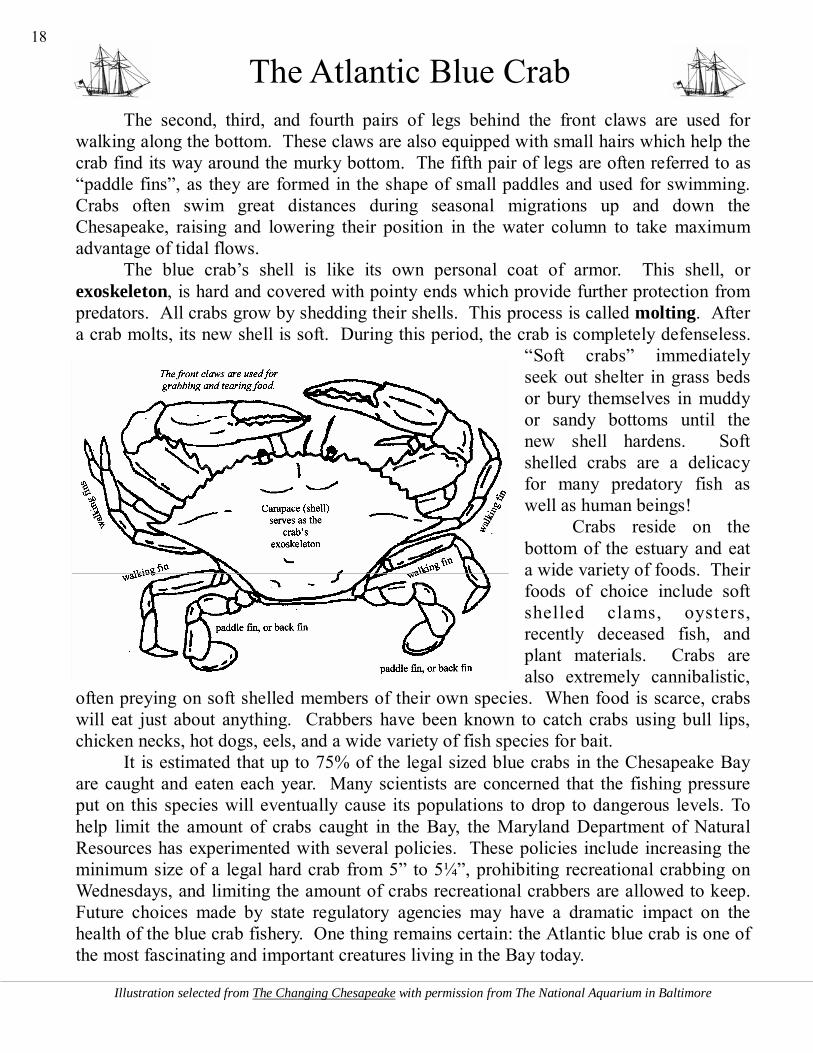
The second, third, and fourth pairs of legs behind the front claws are used for walking along the bottom. These claws are also equipped with small hairs which help the crab find its way around the murky bottom. The fifth pair of legs are often referred to as “paddle fins”, as they are formed in the shape of small paddles and used for swimming. Crabs often swim great distances during seasonal migrations up and down the Chesapeake, raising and lowering their position in the water column to take maximum advantage of tidal flows. The blue crab’s shell is like its own personal coat of armor. This shell, or exoskeleton, is hard and covered with pointy ends which provide further protection from predators. All crabs grow by shedding their shells. This process is called molting. After a crab molts, its new shell is soft. During this period, the crab is completely defenseless.
“Soft crabs” immediately seek out shelter in grass beds or bury themselves in muddy or sandy bottoms until the new shell hardens. Soft shelled crabs are a delicacy for many predatory fish as well as human beings! Crabs reside on the bottom of the estuary and eat a wide variety of foods. Their foods of choice include soft shelled clams, oysters, recently deceased fish, and plant materials. Crabs are also extremely cannibalistic,
often preying on soft shelled members of their own species. When food is scarce, crabs will eat just about anything. Crabbers have been known to catch crabs using bull lips, chicken necks, hot dogs, eels, and a wide variety of fish species for bait. It is estimated that up to 75% of the legal sized blue crabs in the Chesapeake Bay are caught and eaten each year. Many scientists are concerned that the fishing pressure put on this species will eventually cause its populations to drop to dangerous levels. To help limit the amount of crabs caught in the Bay, the Maryland Department of Natural Resources has experimented with several policies. These policies include increasing the minimum size of a legal hard crab from 5” to 5¼”, prohibiting recreational crabbing on Wednesdays, and limiting the amount of crabs recreational crabbers are allowed to keep. Future choices made by state regulatory agencies may have a dramatic impact on the health of the blue crab fishery. One thing remains certain: the Atlantic blue crab is one of the most fascinating and important creatures living in the Bay today.
The Atlantic Blue Crab
Illustration selected from The Changing Chesapeake with permission from The National Aquarium in Baltimore
18

NAME: __________________________________________ DATE: ______________
COMPREHENSION QUESTIONS
DIRECTIONS: Read the text on the previous pages, then answer the following questions in complete sentences. Write your answers on the lines. 1. In the space below, describe the three stages of development in a blue crab’s life. 2. How do blue crabs grow? 3. Where do blue crabs live and what do they eat? 4. Why are many scientists concerned about the well being of blue crabs?
The Atlantic Blue Crab 19

DATA Maryland Crab Harvests in Millions of Pounds
1952 - 2002
YEAR HARVEST
1952 27,499,200 1953 26,367,900 1954 19,073,400 1955 15,231,500 1956 21,207,800 1957 28,369,000 1958 27,095,400 1959 21,187,100 1960 27,068,000 1961 26,658,300 1962 27,661,100 1963 16,933,900 1964 22,540,200 1965 31,998,000 1966 30,372,800 1967 24,587,900 1968 9,345,000
YEAR HARVEST
1969 23,013,900 1970 24,935,400 1971 26,075,000 1972 23,481,700 1973 19,538,600 1974 24,660,300 1975 24,264,000 1976 19,429,500 1977 20,159,300 1978 16,590,100 1979 24,834,700 1980 25,304,000 1981 57,356,900 1982 41,215,200 1983 48,610,000 1984 46,801,800 1985 55,476,400
YEAR HARVEST
1986 48,107,900 1987 44,231,800 1988 44,206,900 1989 45,412,100 1990 50,785,161 1991 49,756,236 1992 29,174,069 1993 59,763,788 1994 44,937,722 1995 42,523,992 1996 37,174,668 1997 43,978,676 1998 29,546,458 1999 33,820,654 2000 21,419,470 2001 24,222,045 2002 25,237,841
DATA SOURCE: National Marine Fisheries Service - www.st.nmfs.gov/stl/commercial/landings/annual_landings.html
Illustration courtesy of Alice Jane Lippson, selected from Life in the Chesapeake Bay, Second Edition.
Making a Line Graph: Maryland Blue Crab Harvests
T he Atlantic blue crab is perhaps the most important seafood product harvested from the Chesapeake Bay each year. Thousands of watermen depend on “crabbing” to
make a living, and demand for blue crabs in local restaurants has steadily risen over the last twenty five years. Below is data from Maryland’s blue crab fishery, with each year’s harvest measured in millions of pounds. Plot the data on the graph provided to get a glimpse of the fishing pressure put on this extremely important species over the last 50 years. The first two points are plotted for you.
20
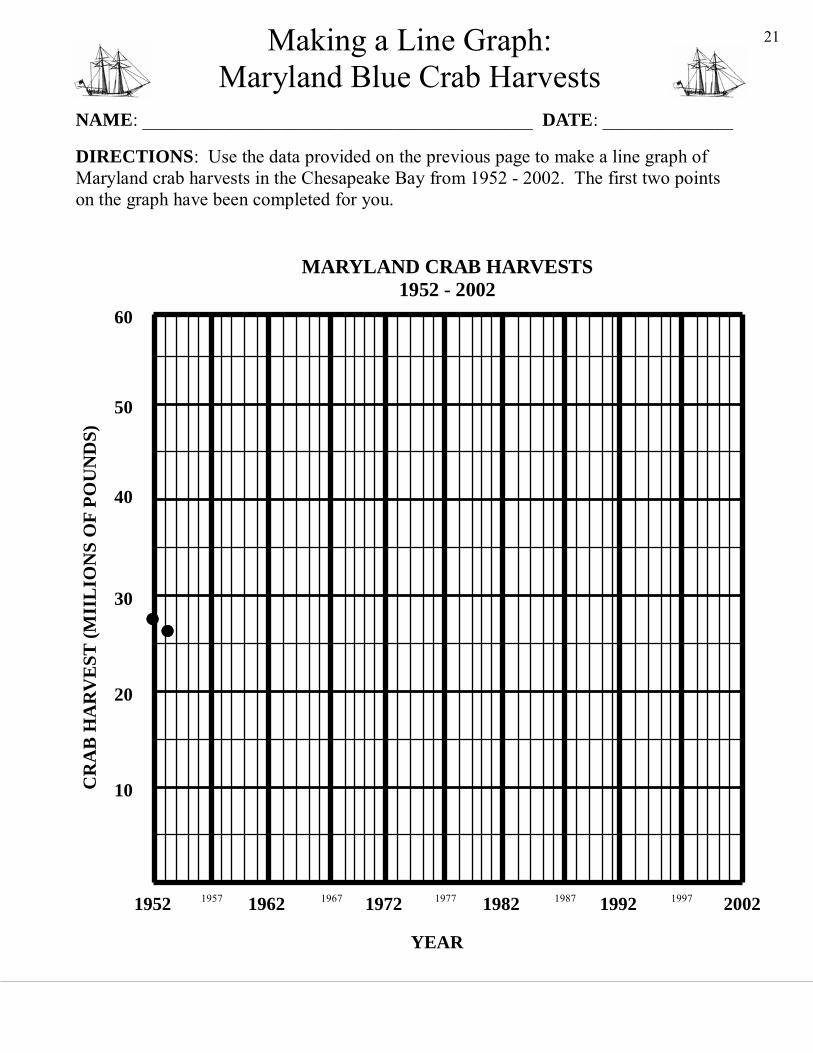
NAME: __________________________________________ DATE: ______________ DIRECTIONS: Use the data provided on the previous page to make a line graph of Maryland crab harvests in the Chesapeake Bay from 1952 - 2002. The first two points on the graph have been completed for you.
Making a Line Graph: Maryland Blue Crab Harvests
MARYLAND CRAB HARVESTS 1952 - 2002
60
CR
AB
HA
RV
EST
(MII
LIO
NS
OF
POU
ND
S)
10
30
20
50
40
1952 1962 1972 1982 1992 2002
YEAR
1957 1967 1977 1987 1997
21

NAME: __________________________________________ DATE: ______________
COMPREHENSION QUESTIONS
DIRECTIONS: Use the data from your line graph on the previous page/s to answer the following questions in complete sentences. Write your answers on the lines. 1. Based on the data provided, what is your assessment of the health of the blue crab
industry? 2. How do catch levels in the last five years (1998 - 2002) compare to historic crab
harvests in the 1950’s? 3. In the 1980’s, the crab harvests in Maryland reached all-time high levels. What are
two possible explanations for this? 4. Based on your data, do you think there need to be new limits placed on crab harvests in
the upcoming years?
Maryland Blue Crab Harvests: Interpreting Your Data
22
“The abundance of oysters is incredible. There are whole banks of them so that the ships must avoid them … They surpass those in England by far in size, indeed, they are four times as large. I often cut them in two, before I could put them into my mouth. “
Swiss explorer Francis Louis Michel, 1701
P erhaps no other living creature in the Chesapeake Bay is more well known than the oyster. Early explorers were amazed by the amount of oysters found in Bay waters,
and they quickly became famous around the world for their unique flavor. Large adult oysters can filter up to sixty gallons of water in a single day while providing habitat for a wide variety of organisms. Unfortunately, the oyster population has been in sharp decline since the late 1800’s due to over-harvesting, disease, and habitat loss. Oysters are among the most prolific reproducers in the world. A single female can produce several hundred million eggs over the course of a lifetime. Oysters spawn near the end of June, when r i s i n g w a t e r temperatures trigger females to release eggs into the water, where they are met by sperm released from males. Fertilized eggs develop into swimming larvae which, after a few days, settle to the bottom and attach themselves to a hard surface. Usually this surface is another oyster shell. Juvenile attached oysters are called spat. As spat grow, their shells increase in size. Once an oyster is three inches long, it can legally be caught and eaten. One unique characteristic common to all oyster species is their ability to change gender. At two to three months old, oysters are bisexual. At the end of their first year, most oysters spawn as males. As they grow older, however, many spawn as females, particularly after their second year. Oysters eat by sucking water into their shells and filtering out small plants called phytoplankton. When this happens, sediments and excess nutrients are also removed from the water. This process greatly improves the water quality of the Bay. According to scientists’ estimates, oysters were once so abundant that they filtered the entire water volume of the Chesapeake Bay in only a few days. Today, with only one percent of the
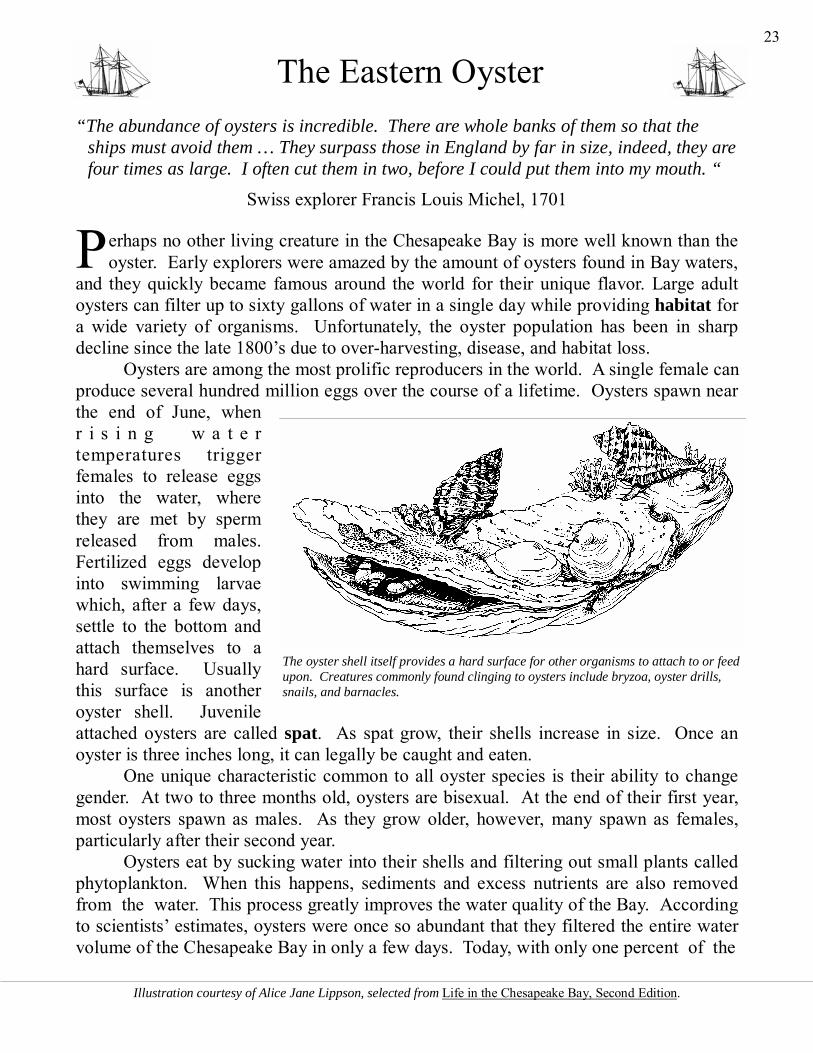
The oyster shell itself provides a hard surface for other organisms to attach to or feed upon. Creatures commonly found clinging to oysters include bryzoa, oyster drills, snails, and barnacles.
Illustration courtesy of Alice Jane Lippson, selected from Life in the Chesapeake Bay, Second Edition.
The Eastern Oyster 23
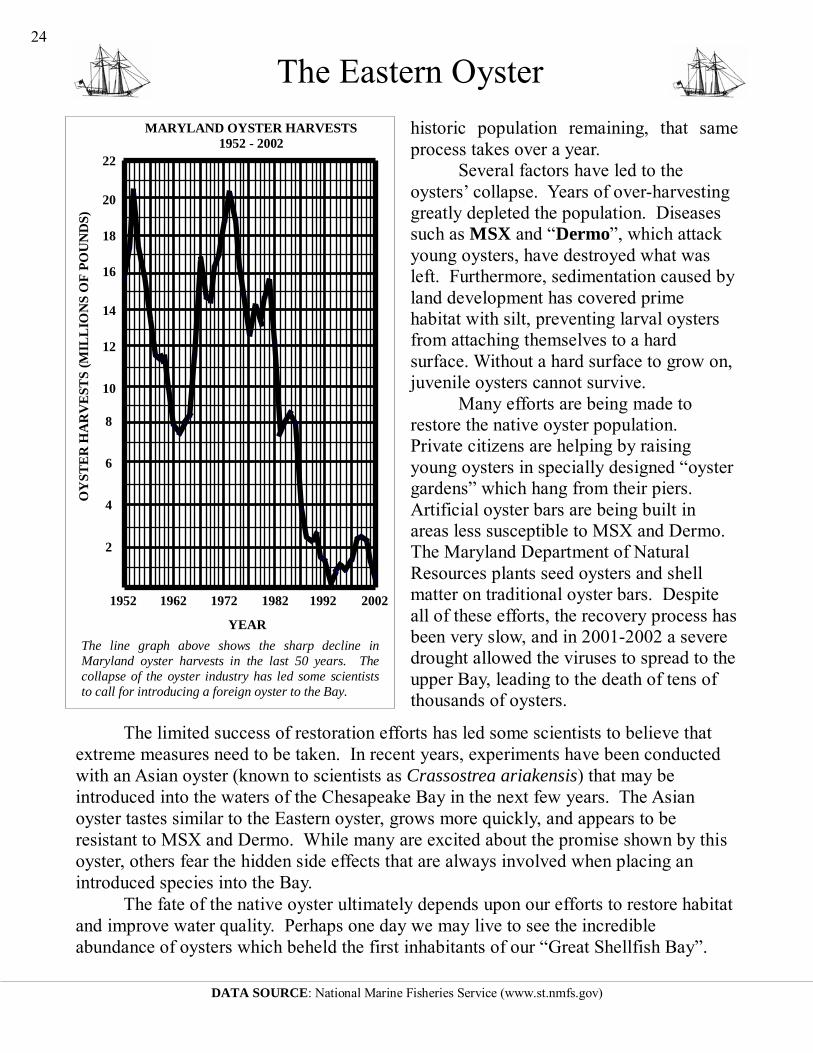
historic population remaining, that same process takes over a year. Several factors have led to the oysters’ collapse. Years of over-harvesting greatly depleted the population. Diseases such as MSX and “Dermo”, which attack young oysters, have destroyed what was left. Furthermore, sedimentation caused by land development has covered prime habitat with silt, preventing larval oysters from attaching themselves to a hard surface. Without a hard surface to grow on, juvenile oysters cannot survive. Many efforts are being made to restore the native oyster population. Private citizens are helping by raising young oysters in specially designed “oyster gardens” which hang from their piers. Artificial oyster bars are being built in areas less susceptible to MSX and Dermo. The Maryland Department of Natural Resources plants seed oysters and shell matter on traditional oyster bars. Despite all of these efforts, the recovery process has been very slow, and in 2001-2002 a severe drought allowed the viruses to spread to the upper Bay, leading to the death of tens of thousands of oysters.
The limited success of restoration efforts has led some scientists to believe that extreme measures need to be taken. In recent years, experiments have been conducted with an Asian oyster (known to scientists as Crassostrea ariakensis) that may be introduced into the waters of the Chesapeake Bay in the next few years. The Asian oyster tastes similar to the Eastern oyster, grows more quickly, and appears to be resistant to MSX and Dermo. While many are excited about the promise shown by this oyster, others fear the hidden side effects that are always involved when placing an introduced species into the Bay. The fate of the native oyster ultimately depends upon our efforts to restore habitat and improve water quality. Perhaps one day we may live to see the incredible abundance of oysters which beheld the first inhabitants of our “Great Shellfish Bay”.
DATA SOURCE: National Marine Fisheries Service (www.st.nmfs.gov)
YEAR
1952
OY
STE
R H
AR
VE
STS
(MIL
LIO
NS
OF
POU
ND
S)
2
4
6
8
10
12
14
16
18
20
22
The line graph above shows the sharp decline in Maryland oyster harvests in the last 50 years. The collapse of the oyster industry has led some scientists to call for introducing a foreign oyster to the Bay.
MARYLAND OYSTER HARVESTS 1952 - 2002
1962 1972 1982 1992 2002
The Eastern Oyster 24
NAME: __________________________________________ DATE: ______________
COMPREHENSION QUESTIONS
DIRECTIONS: Read the text on the previous pages, then answer the following questions in complete sentences. Write your answers on the lines. 1. What is a spat? 2. How do oysters eat? 3. What are some of the factors that have led to the collapse of the oyster industry? 4. In your opinion, should a foreign oyster be introduced to the Chesapeake Bay? Give reasons to support your answer.
The Eastern Oyster 25
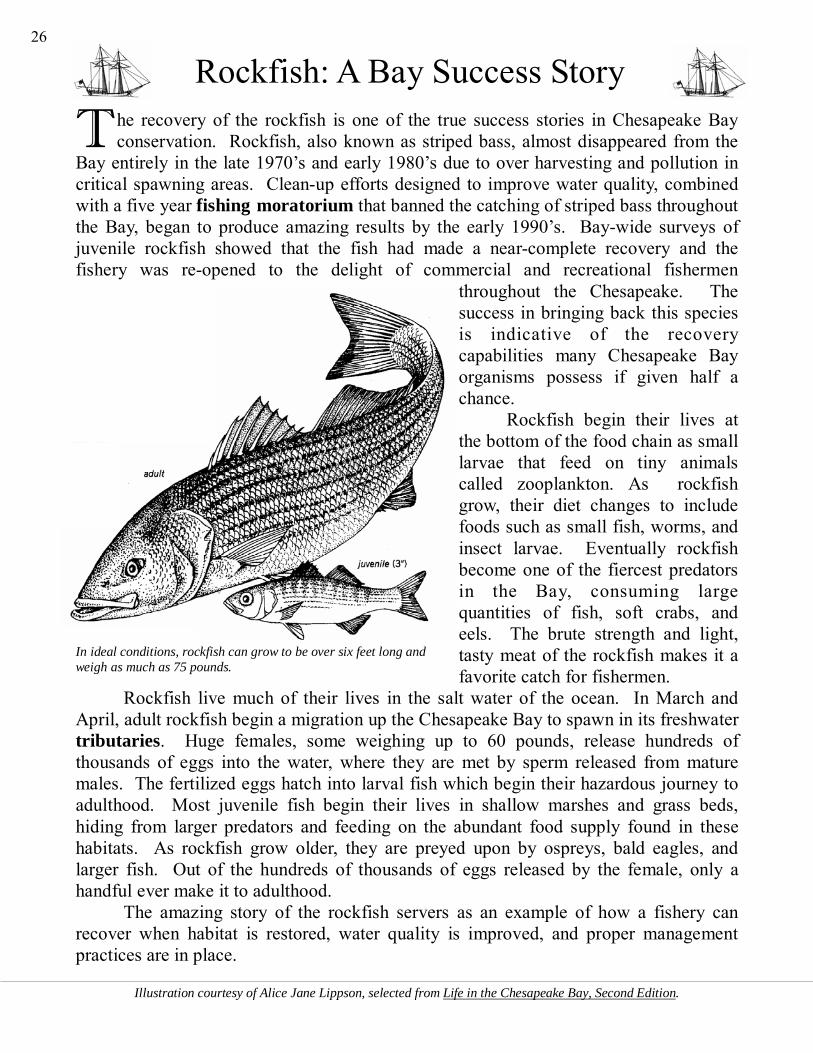
T he recovery of the rockfish is one of the true success stories in Chesapeake Bay conservation. Rockfish, also known as striped bass, almost disappeared from the
Bay entirely in the late 1970’s and early 1980’s due to over harvesting and pollution in critical spawning areas. Clean-up efforts designed to improve water quality, combined with a five year fishing moratorium that banned the catching of striped bass throughout the Bay, began to produce amazing results by the early 1990’s. Bay-wide surveys of juvenile rockfish showed that the fish had made a near-complete recovery and the fishery was re-opened to the delight of commercial and recreational fishermen
throughout the Chesapeake. The success in bringing back this species is indicative of the recovery capabilities many Chesapeake Bay organisms possess if given half a chance. Rockfish begin their lives at the bottom of the food chain as small larvae that feed on tiny animals called zooplankton. As rockfish grow, their diet changes to include foods such as small fish, worms, and insect larvae. Eventually rockfish become one of the fiercest predators in the Bay, consuming large quantities of fish, soft crabs, and eels. The brute strength and light, tasty meat of the rockfish makes it a favorite catch for fishermen.
Rockfish live much of their lives in the salt water of the ocean. In March and April, adult rockfish begin a migration up the Chesapeake Bay to spawn in its freshwater tributaries. Huge females, some weighing up to 60 pounds, release hundreds of thousands of eggs into the water, where they are met by sperm released from mature males. The fertilized eggs hatch into larval fish which begin their hazardous journey to adulthood. Most juvenile fish begin their lives in shallow marshes and grass beds, hiding from larger predators and feeding on the abundant food supply found in these habitats. As rockfish grow older, they are preyed upon by ospreys, bald eagles, and larger fish. Out of the hundreds of thousands of eggs released by the female, only a handful ever make it to adulthood. The amazing story of the rockfish servers as an example of how a fishery can recover when habitat is restored, water quality is improved, and proper management practices are in place.
Illustration courtesy of Alice Jane Lippson, selected from Life in the Chesapeake Bay, Second Edition.
In ideal conditions, rockfish can grow to be over six feet long and weigh as much as 75 pounds.
Rockfish: A Bay Success Story 26
NAME: __________________________________________ DATE: ______________
COMPREHENSION QUESTIONS
DIRECTIONS: Read the text on the previous page, then answer the following questions in complete sentences. Write your answers on the lines. 1. Why did rockfish nearly disappear from the Bay in the 1970’s and early 1980’s? 2. In the space below, describe how the diet of a rockfish changes as it gets larger. 3. What are two reasons that young rockfish live in shallow marshes and grass beds? 4. What are two factors that have contributed to the amazing recovery of rockfish in the
Chesapeake Bay?
Rockfish: A Bay Success Story 27
DATA SOURCE: National Marine Fisheries Service - www.st.nmfs.gov/stl/commercial/landings/annual_landings.html
Illustration courtesy of Alice Jane Lippson, selected from Life in the Chesapeake Bay, Second Edition.
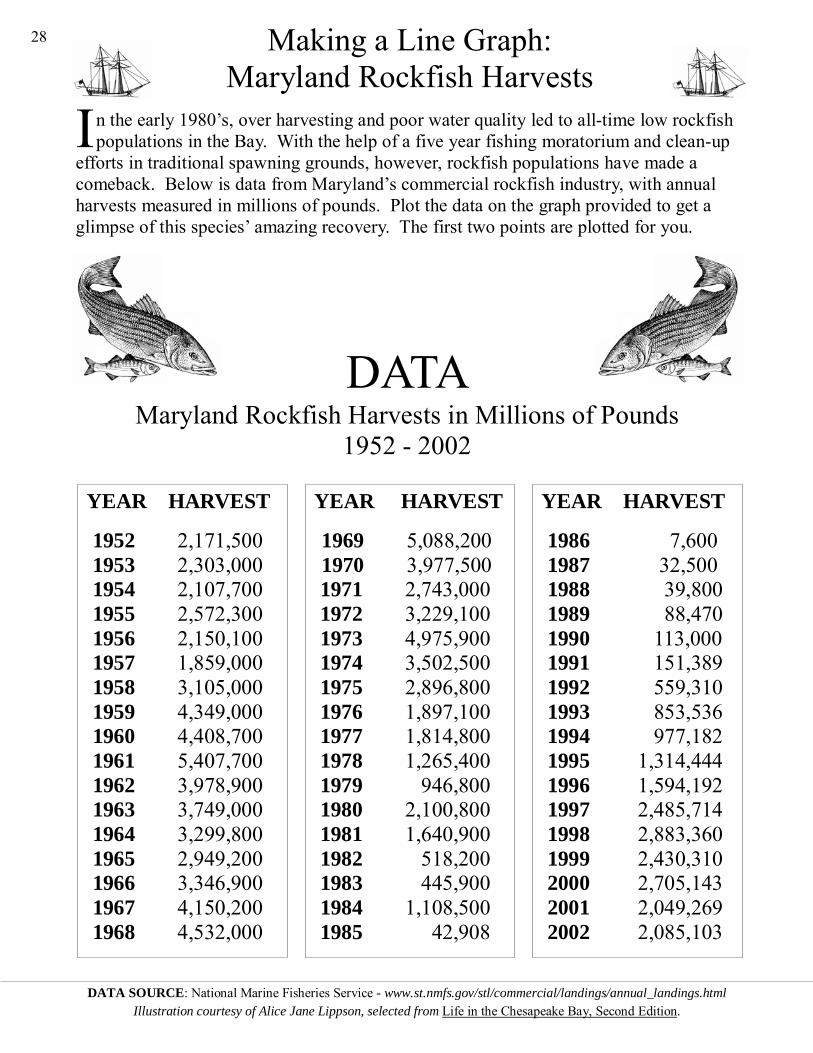
DATA Maryland Rockfish Harvests in Millions of Pounds
1952 - 2002
YEAR HARVEST
1952 2,171,500 1953 2,303,000 1954 2,107,700 1955 2,572,300 1956 2,150,100 1957 1,859,000 1958 3,105,000 1959 4,349,000 1960 4,408,700 1961 5,407,700 1962 3,978,900 1963 3,749,000 1964 3,299,800 1965 2,949,200 1966 3,346,900 1967 4,150,200 1968 4,532,000
YEAR HARVEST
1969 5,088,200 1970 3,977,500
1971 2,743,000 1972 3,229,100 1973 4,975,900 1974 3,502,500 1975 2,896,800 1976 1,897,100 1977 1,814,800 1978 1,265,400 1979 946,800 1980 2,100,800 1981 1,640,900 1982 518,200 1983 445,900 1984 1,108,500 1985 42,908
YEAR HARVEST
1986 7,600 1987 32,500 1988 39,800 1989 88,470 1990 113,000 1991 151,389 1992 559,310 1993 853,536 1994 977,182 1995 1,314,444 1996 1,594,192 1997 2,485,714 1998 2,883,360 1999 2,430,310 2000 2,705,143 2001 2,049,269 2002 2,085,103
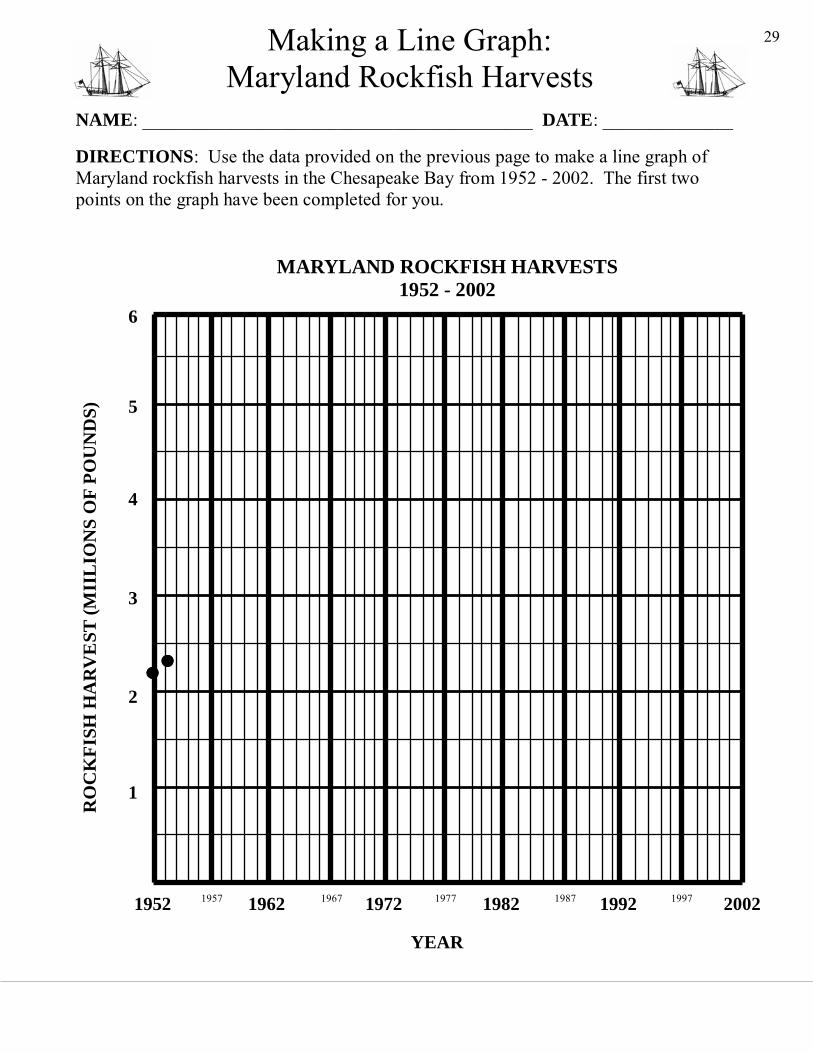
Making a Line Graph: Maryland Rockfish Harvests
I n the early 1980’s, over harvesting and poor water quality led to all-time low rockfish populations in the Bay. With the help of a five year fishing moratorium and clean-up
efforts in traditional spawning grounds, however, rockfish populations have made a comeback. Below is data from Maryland’s commercial rockfish industry, with annual harvests measured in millions of pounds. Plot the data on the graph provided to get a glimpse of this species’ amazing recovery. The first two points are plotted for you.
28
Making a Line Graph: Maryland Rockfish Harvests
NAME: __________________________________________ DATE: ______________ DIRECTIONS: Use the data provided on the previous page to make a line graph of Maryland rockfish harvests in the Chesapeake Bay from 1952 - 2002. The first two points on the graph have been completed for you.
MARYLAND ROCKFISH HARVESTS 1952 - 2002
6
RO
CK
FISH
HA
RV
EST
(MII
LIO
NS
OF
POU
ND
S)
1
3
2
5
4
1952 1962 1972 1982 1992 2002
YEAR
1957 1967 1977 1987 1997
29

NAME: __________________________________________ DATE: ______________
COMPREHENSION QUESTIONS
DIRECTIONS: Use the data from your line graph on the previous page/s to answer the following questions in complete sentences. Write your answers on the lines. 1. Based on your data, when do you think rockfish spawning grounds became
unproductive?
2. When did the rockfish industry begin to show significant signs of recovery? 3. How did the catch in 2002 compare to historic catches in the 1950’s? 4. In your opinion, is this a completely recovered industry? Use data to support your
answer.
Maryland Rockfish Harvests: Interpreting Your Data
30
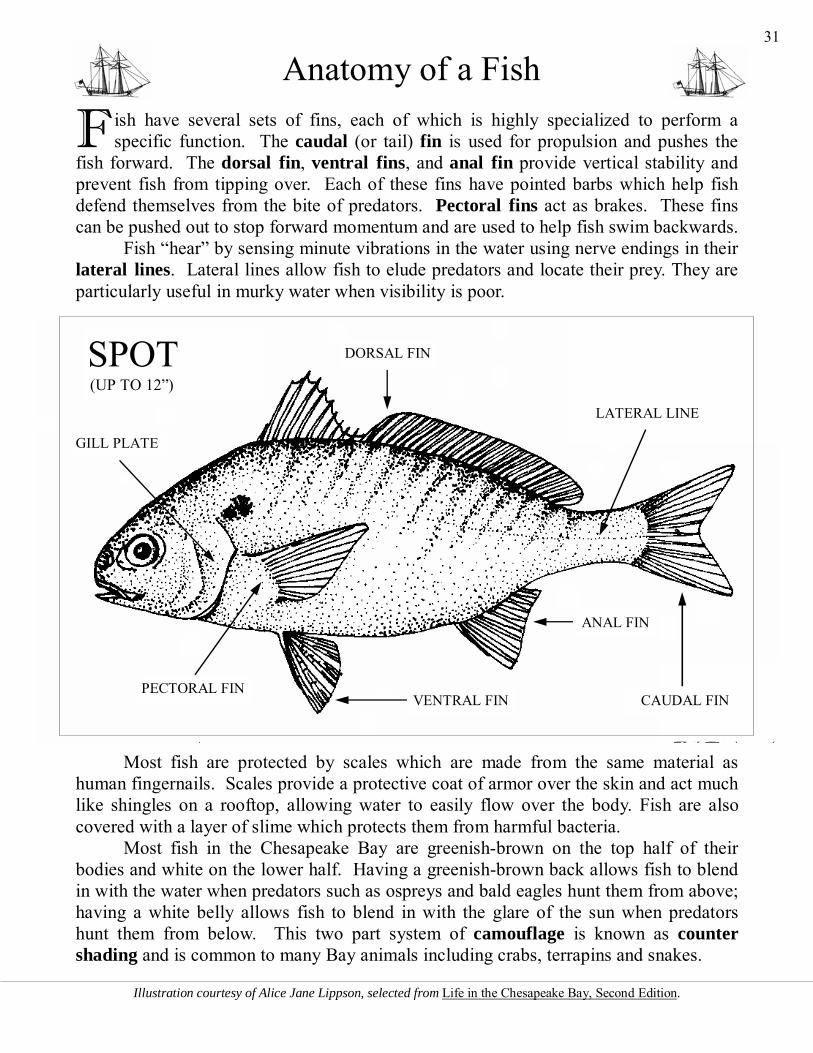
F ish have several sets of fins, each of which is highly specialized to perform a specific function. The caudal (or tail) fin is used for propulsion and pushes the
fish forward. The dorsal fin, ventral fins, and anal fin provide vertical stability and prevent fish from tipping over. Each of these fins have pointed barbs which help fish defend themselves from the bite of predators. Pectoral fins act as brakes. These fins can be pushed out to stop forward momentum and are used to help fish swim backwards. Fish “hear” by sensing minute vibrations in the water using nerve endings in their lateral lines. Lateral lines allow fish to elude predators and locate their prey. They are particularly useful in murky water when visibility is poor.
Most fish are protected by scales which are made from the same material as human fingernails. Scales provide a protective coat of armor over the skin and act much like shingles on a rooftop, allowing water to easily flow over the body. Fish are also covered with a layer of slime which protects them from harmful bacteria. Most fish in the Chesapeake Bay are greenish-brown on the top half of their bodies and white on the lower half. Having a greenish-brown back allows fish to blend in with the water when predators such as ospreys and bald eagles hunt them from above; having a white belly allows fish to blend in with the glare of the sun when predators hunt them from below. This two part system of camouflage is known as counter shading and is common to many Bay animals including crabs, terrapins and snakes.
Anatomy of a Fish
Illustration courtesy of Alice Jane Lippson, selected from Life in the Chesapeake Bay, Second Edition.
31
DORSAL FIN
VENTRAL FIN
ANAL FIN
PECTORAL FIN
GILL PLATE
LATERAL LINE
CAUDAL FIN
SPOT (UP TO 12”)
NAME: __________________________________________ DATE: ______________
COMPREHENSION QUESTIONS
DIRECTIONS: Read the text on the previous page, then answer the following questions in complete sentences. Write your answers on the lines. 1. In the space below, list five types of fins found on a fish and describe each fin’s
function (you do not have to use complete sentences):
A. __________________________________________________________________ B. __________________________________________________________________ C. __________________________________________________________________ D. __________________________________________________________________ E. __________________________________________________________________
2. What is a lateral line? 3. How do scales and slime protect fish? 4. In the space below, describe how most fish in the Chesapeake Bay blend in with their
surroundings.
Anatomy of a Fish 32
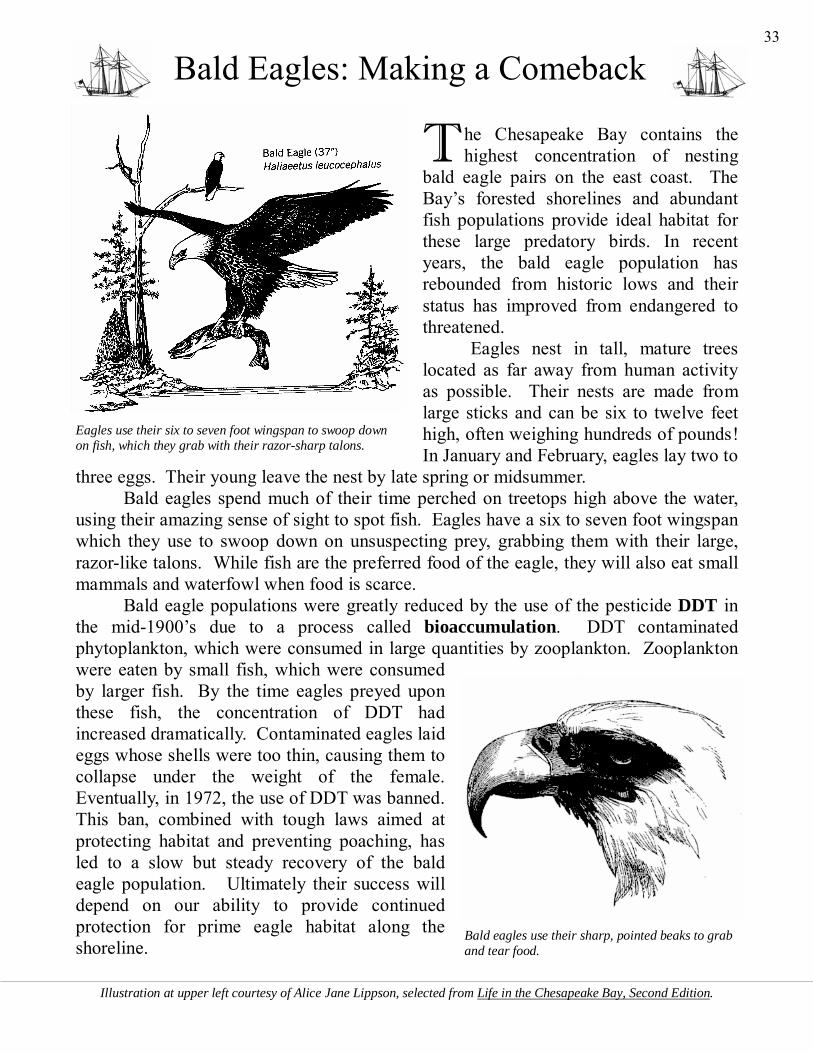
Bald Eagles: Making a Comeback
T he Chesapeake Bay contains the highest concentration of nesting
bald eagle pairs on the east coast. The Bay’s forested shorelines and abundant fish populations provide ideal habitat for these large predatory birds. In recent years, the bald eagle population has rebounded from historic lows and their status has improved from endangered to threatened. Eagles nest in tall, mature trees located as far away from human activity as possible. Their nests are made from large sticks and can be six to twelve feet high, often weighing hundreds of pounds! In January and February, eagles lay two to
three eggs. Their young leave the nest by late spring or midsummer. Bald eagles spend much of their time perched on treetops high above the water, using their amazing sense of sight to spot fish. Eagles have a six to seven foot wingspan which they use to swoop down on unsuspecting prey, grabbing them with their large, razor-like talons. While fish are the preferred food of the eagle, they will also eat small mammals and waterfowl when food is scarce. Bald eagle populations were greatly reduced by the use of the pesticide DDT in the mid-1900’s due to a process called bioaccumulation. DDT contaminated phytoplankton, which were consumed in large quantities by zooplankton. Zooplankton were eaten by small fish, which were consumed by larger fish. By the time eagles preyed upon these fish, the concentration of DDT had increased dramatically. Contaminated eagles laid eggs whose shells were too thin, causing them to collapse under the weight of the female. Eventually, in 1972, the use of DDT was banned. This ban, combined with tough laws aimed at protecting habitat and preventing poaching, has led to a slow but steady recovery of the bald eagle population. Ultimately their success will depend on our ability to provide continued protection for prime eagle habitat along the shoreline.
Bald eagles use their sharp, pointed beaks to grab and tear food.
Illustration at upper left courtesy of Alice Jane Lippson, selected from Life in the Chesapeake Bay, Second Edition.
Eagles use their six to seven foot wingspan to swoop down on fish, which they grab with their razor-sharp talons.
33
NAME: __________________________________________ DATE: ______________
COMPREHENSION QUESTIONS
DIRECTIONS: Read the text on the previous page, then answer the following questions in complete sentences. Write your answers on the lines. 1. Where and when do bald eagles nest? 2. How do eagles catch their food? What do they eat? 3. In the space below, explain how the contamination of phytoplankton negatively
affected the bald eagle population. 4. In the space below, explain how banning DDT helped to rescue the bald eagle.
Bald Eagles: Making a Comeback 34
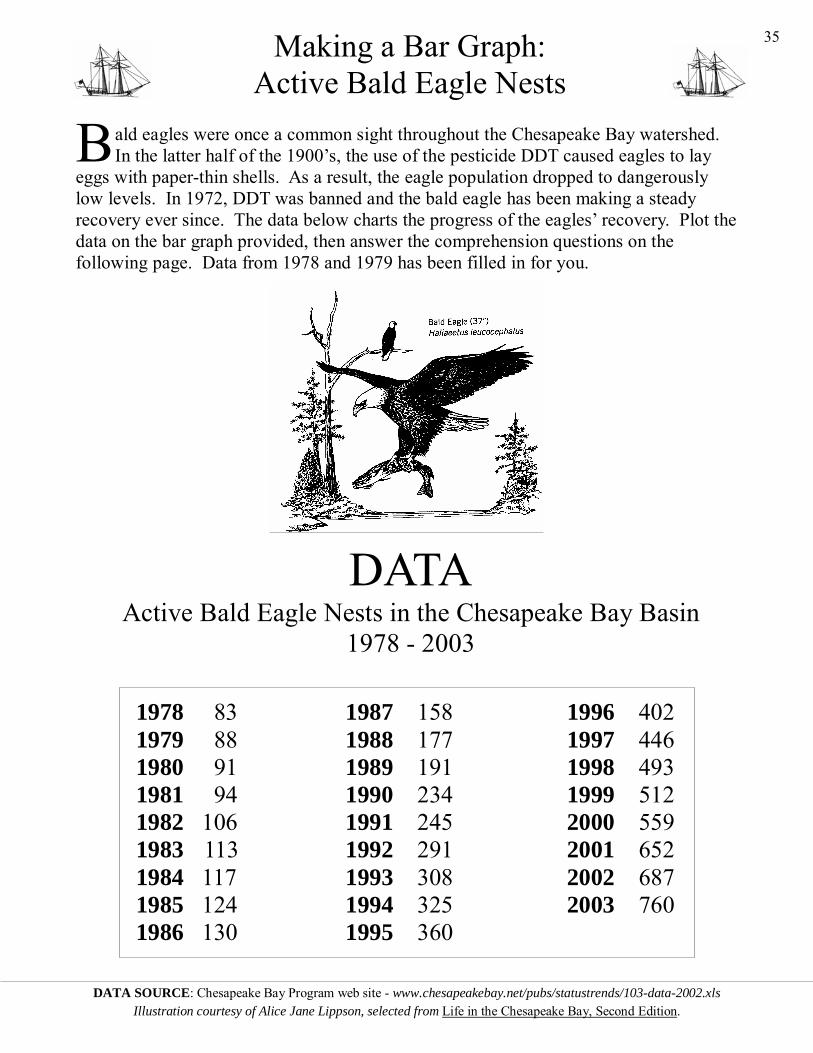
1978 83 1987 158 1996 402 1979 88 1988 177 1997 446 1980 91 1989 191 1998 493 1981 94 1990 234 1999 512 1982 106 1991 245 2000 559 1983 113 1992 291 2001 652 1984 117 1993 308 2002 687 1985 124 1994 325 2003 760 1986 130 1995 360
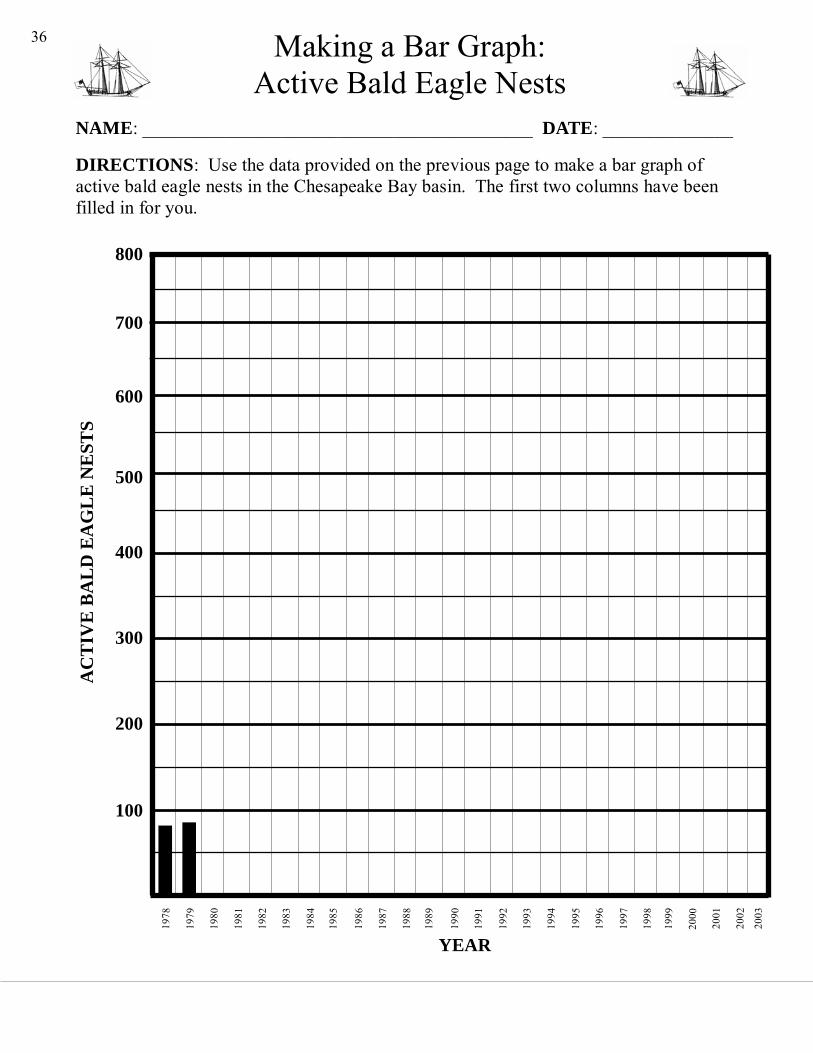
Making a Bar Graph: Active Bald Eagle Nests
B ald eagles were once a common sight throughout the Chesapeake Bay watershed. In the latter half of the 1900’s, the use of the pesticide DDT caused eagles to lay
eggs with paper-thin shells. As a result, the eagle population dropped to dangerously low levels. In 1972, DDT was banned and the bald eagle has been making a steady recovery ever since. The data below charts the progress of the eagles’ recovery. Plot the data on the bar graph provided, then answer the comprehension questions on the following page. Data from 1978 and 1979 has been filled in for you.
DATA Active Bald Eagle Nests in the Chesapeake Bay Basin
1978 - 2003
DATA SOURCE: Chesapeake Bay Program web site - www.chesapeakebay.net/pubs/statustrends/103-data-2002.xls
Illustration courtesy of Alice Jane Lippson, selected from Life in the Chesapeake Bay, Second Edition.
35
YEAR
500
200
100
AC
TIV
E B
AL
D E
AG
LE
NE
STS
400
300
600
197 8
197 9
198 0
198 1
198 2
198 3
198 4
198 5
198 6
198 7
198 8
198 9
199 0
199 1
199 2
199 3
199 4
199 5
199 6
199 7
199 8
199 9
200 0
700
800
200 1
200 2
200 3
NAME: __________________________________________ DATE: ______________ DIRECTIONS: Use the data provided on the previous page to make a bar graph of active bald eagle nests in the Chesapeake Bay basin. The first two columns have been filled in for you.
36 Making a Bar Graph: Active Bald Eagle Nests
NAME: __________________________________________ DATE: ______________
COMPREHENSION QUESTIONS
DIRECTIONS: Use the data from your bar graph on the previous page/s to answer the following questions in complete sentences. Write your answers on the lines. 1. Compare the amount of active bald eagle nests in the Chesapeake Bay basin in 1978 to
the amount present in 2003. How many more active nests were there in 2003? 2. In what year did the largest increase in the amount of bald eagle nests occur? 3. In what year did the smallest increase occur? 4. What do you think will happen to the bald eagle population in the next 25 years?
Active Bald Eagle Nests: Interpreting Your Data
37
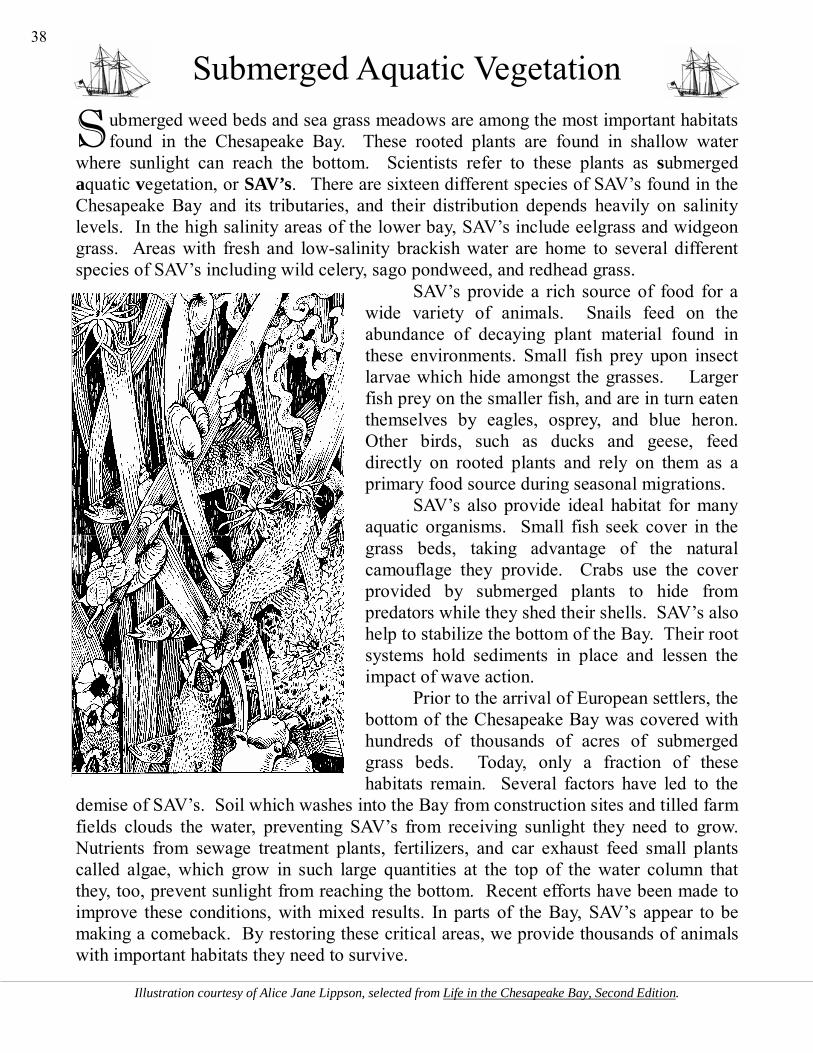
S ubmerged weed beds and sea grass meadows are among the most important habitats found in the Chesapeake Bay. These rooted plants are found in shallow water
where sunlight can reach the bottom. Scientists refer to these plants as submerged aquatic vegetation, or SAV’s. There are sixteen different species of SAV’s found in the Chesapeake Bay and its tributaries, and their distribution depends heavily on salinity levels. In the high salinity areas of the lower bay, SAV’s include eelgrass and widgeon grass. Areas with fresh and low-salinity brackish water are home to several different species of SAV’s including wild celery, sago pondweed, and redhead grass.
SAV’s provide a rich source of food for a wide variety of animals. Snails feed on the abundance of decaying plant material found in these environments. Small fish prey upon insect larvae which hide amongst the grasses. Larger fish prey on the smaller fish, and are in turn eaten themselves by eagles, osprey, and blue heron. Other birds, such as ducks and geese, feed directly on rooted plants and rely on them as a primary food source during seasonal migrations. SAV’s also provide ideal habitat for many aquatic organisms. Small fish seek cover in the grass beds, taking advantage of the natural camouflage they provide. Crabs use the cover provided by submerged plants to hide from predators while they shed their shells. SAV’s also help to stabilize the bottom of the Bay. Their root systems hold sediments in place and lessen the impact of wave action. Prior to the arrival of European settlers, the bottom of the Chesapeake Bay was covered with hundreds of thousands of acres of submerged grass beds. Today, only a fraction of these habitats remain. Several factors have led to the
demise of SAV’s. Soil which washes into the Bay from construction sites and tilled farm fields clouds the water, preventing SAV’s from receiving sunlight they need to grow. Nutrients from sewage treatment plants, fertilizers, and car exhaust feed small plants called algae, which grow in such large quantities at the top of the water column that they, too, prevent sunlight from reaching the bottom. Recent efforts have been made to improve these conditions, with mixed results. In parts of the Bay, SAV’s appear to be making a comeback. By restoring these critical areas, we provide thousands of animals with important habitats they need to survive.
Illustration courtesy of Alice Jane Lippson, selected from Life in the Chesapeake Bay, Second Edition.
Submerged Aquatic Vegetation 38
NAME: __________________________________________ DATE: ______________
COMPREHENSION QUESTIONS
DIRECTIONS: Read the text on the previous page, then answer the following questions in complete sentences. Write your answers on the lines. 1. What are some examples of submerges grasses that are found in waters with a high
salinity level? 2. What are some examples of submerged grasses that are found in waters with a low
salinity level? 3. In the space below, describe how submerged grass beds are important to fish and crabs. 4. What are some factors that have led to a decrease in the amount of submerged aquatic
vegetation found in the Chesapeake Bay?
Submerged Aquatic Vegetation 39
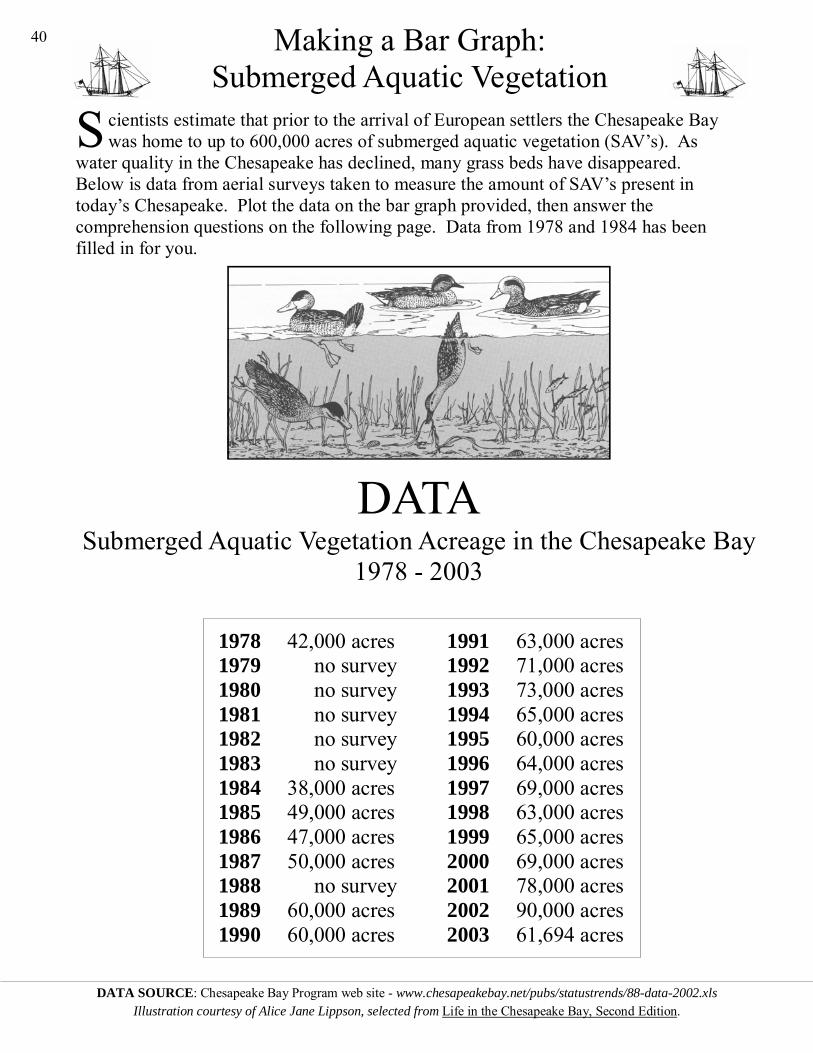
1978 42,000 acres 1991 63,000 acres 1979 no survey 1992 71,000 acres 1980 no survey 1993 73,000 acres 1981 no survey 1994 65,000 acres 1982 no survey 1995 60,000 acres 1983 no survey 1996 64,000 acres 1984 38,000 acres 1997 69,000 acres 1985 49,000 acres 1998 63,000 acres 1986 47,000 acres 1999 65,000 acres 1987 50,000 acres 2000 69,000 acres 1988 no survey 2001 78,000 acres 1989 60,000 acres 2002 90,000 acres 1990 60,000 acres 2003 61,694 acres
DATA SOURCE: Chesapeake Bay Program web site - www.chesapeakebay.net/pubs/statustrends/88-data-2002.xls
Illustration courtesy of Alice Jane Lippson, selected from Life in the Chesapeake Bay, Second Edition.
DATA Submerged Aquatic Vegetation Acreage in the Chesapeake Bay
1978 - 2003
Making a Bar Graph: Submerged Aquatic Vegetation
S cientists estimate that prior to the arrival of European settlers the Chesapeake Bay was home to up to 600,000 acres of submerged aquatic vegetation (SAV’s). As
water quality in the Chesapeake has declined, many grass beds have disappeared. Below is data from aerial surveys taken to measure the amount of SAV’s present in today’s Chesapeake. Plot the data on the bar graph provided, then answer the comprehension questions on the following page. Data from 1978 and 1984 has been filled in for you.
40
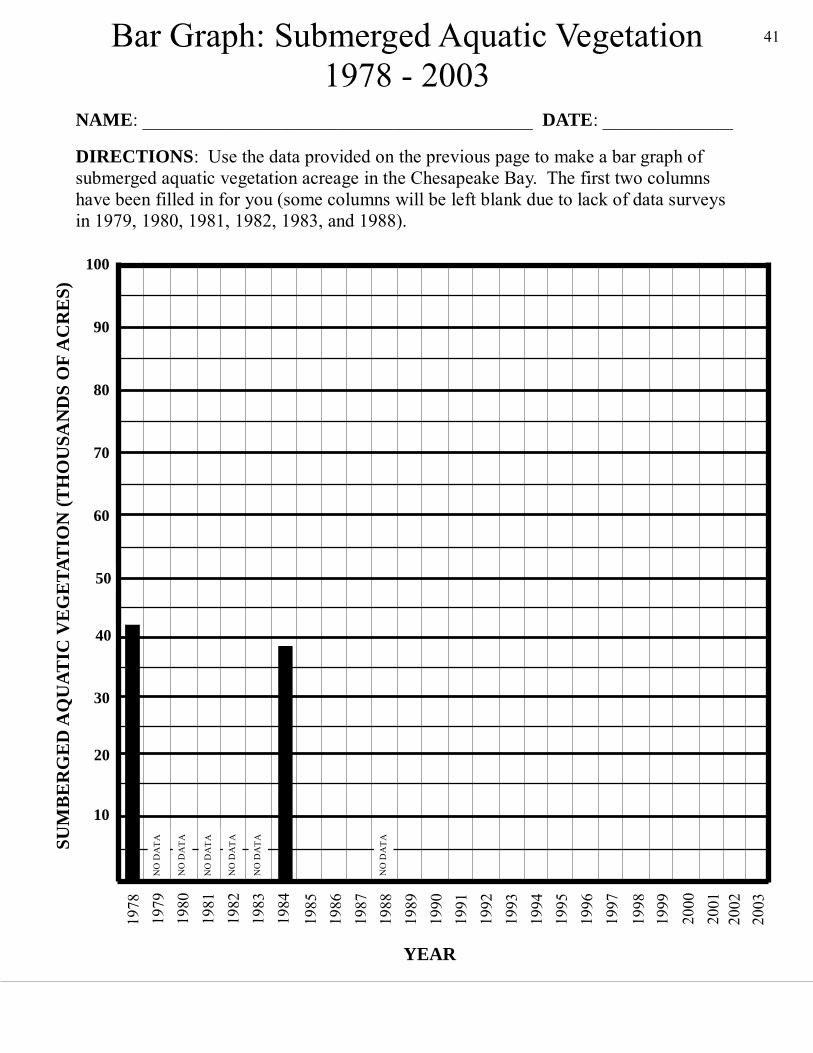
Bar Graph: Submerged Aquatic Vegetation 1978 - 2003
NAME: __________________________________________ DATE: ______________ DIRECTIONS: Use the data provided on the previous page to make a bar graph of submerged aquatic vegetation acreage in the Chesapeake Bay. The first two columns have been filled in for you (some columns will be left blank due to lack of data surveys in 1979, 1980, 1981, 1982, 1983, and 1988).
YEAR
10
60
30
20
19 7
8
70
80
90
100
19 7
9
19 8
0
19 8
1
19 8
2
19 8
3
19 8
4
19 8
5
19 8
6
19 8
7
19 8
8
19 8
9
19 9
0
19 9
1
19 9
2
19 9
3
19 9
4
19 9
5
19 9
6
19 9
7
19 9
8
19 9
9
20 0
0
20 0
1
20 0
2
40
50
SUM
BE
RG
ED
AQ
UAT
IC V
EG
ETA
TIO
N (T
HO
USA
ND
S O
F A
CR
ES)
NO
DA
TA
NO
DA
TA
NO
DA
TA
NO
DA
TA
NO
DA
TA
NO
DA
TA
41
20 0
3
NAME: __________________________________________ DATE: ______________
COMPREHENSION QUESTIONS
DIRECTIONS: Use the data from your bar graph on the previous page/s to answer the following questions in complete sentences. Write your answers on the lines. 1. In 1978, approximately 42,000 acres of submerged aquatic vegetation (SAV) existed in
the Chesapeake Bay. How many more acres of SAV were present in the Bay in 2003? 2. The years 2001 and 2002 were two of the driest year’s in the history of the Chesapeake
region. How might this have contributed to a rise in the amount of grass beds found in the Bay?
3. The year 2003 was one of the wettest years in the history of the Chesapeake region.
How might this have contributed to a decrease in the amount of Bay grasses present that year?
4. In the space below, predict whether you think the amount of Bay grasses will increase
or decrease in the next five years. Use data to support your prediction.
Submerged Aquatic Vegetation: Interpreting Your Data
42
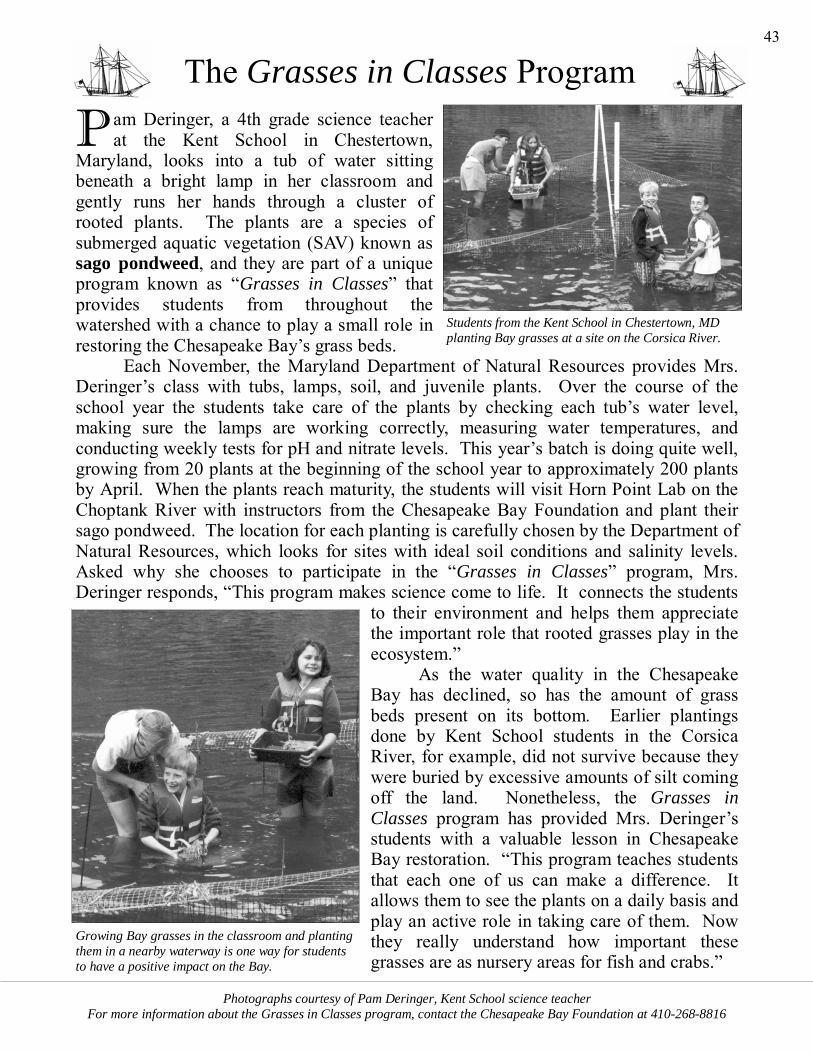
P am Deringer, a 4th grade science teacher at the Kent School in Chestertown,
Maryland, looks into a tub of water sitting beneath a bright lamp in her classroom and gently runs her hands through a cluster of rooted plants. The plants are a species of submerged aquatic vegetation (SAV) known as sago pondweed, and they are part of a unique program known as “Grasses in Classes” that provides students from throughout the watershed with a chance to play a small role in restoring the Chesapeake Bay’s grass beds. Each November, the Maryland Department of Natural Resources provides Mrs. Deringer’s class with tubs, lamps, soil, and juvenile plants. Over the course of the school year the students take care of the plants by checking each tub’s water level, making sure the lamps are working correctly, measuring water temperatures, and conducting weekly tests for pH and nitrate levels. This year’s batch is doing quite well, growing from 20 plants at the beginning of the school year to approximately 200 plants by April. When the plants reach maturity, the students will visit Horn Point Lab on the Choptank River with instructors from the Chesapeake Bay Foundation and plant their sago pondweed. The location for each planting is carefully chosen by the Department of Natural Resources, which looks for sites with ideal soil conditions and salinity levels. Asked why she chooses to participate in the “Grasses in Classes” program, Mrs. Deringer responds, “This program makes science come to life. It connects the students
to their environment and helps them appreciate the important role that rooted grasses play in the ecosystem.” As the water quality in the Chesapeake Bay has declined, so has the amount of grass beds present on its bottom. Earlier plantings done by Kent School students in the Corsica River, for example, did not survive because they were buried by excessive amounts of silt coming off the land. Nonetheless, the Grasses in Classes program has provided Mrs. Deringer’s students with a valuable lesson in Chesapeake Bay restoration. “This program teaches students that each one of us can make a difference. It allows them to see the plants on a daily basis and play an active role in taking care of them. Now they really understand how important these grasses are as nursery areas for fish and crabs.”
Photographs courtesy of Pam Deringer, Kent School science teacher For more information about the Grasses in Classes program, contact the Chesapeake Bay Foundation at 410-268-8816
The Grasses in Classes Program 43
Students from the Kent School in Chestertown, MD planting Bay grasses at a site on the Corsica River.
Growing Bay grasses in the classroom and planting them in a nearby waterway is one way for students to have a positive impact on the Bay.

NAME: __________________________________________ DATE: ______________
COMPREHENSION QUESTIONS
DIRECTIONS: Read the text on the previous page, then answer the following questions in complete sentences. Write your answers on the lines. 1. What were some of the jobs that Mrs. Deringer’s students performed to monitor the
health of their grasses? 2. What are two conditions that influence where the Department of Natural Resources
chooses to plant Bay grasses? 3. Why didn’t earlier plantings done by Mrs. Deringer’s classes survive? 4. According to Mrs. Deringer, what are some of the lessons that the Grasses in Classes
program teaches her students?
The Grasses in Classes Program 44
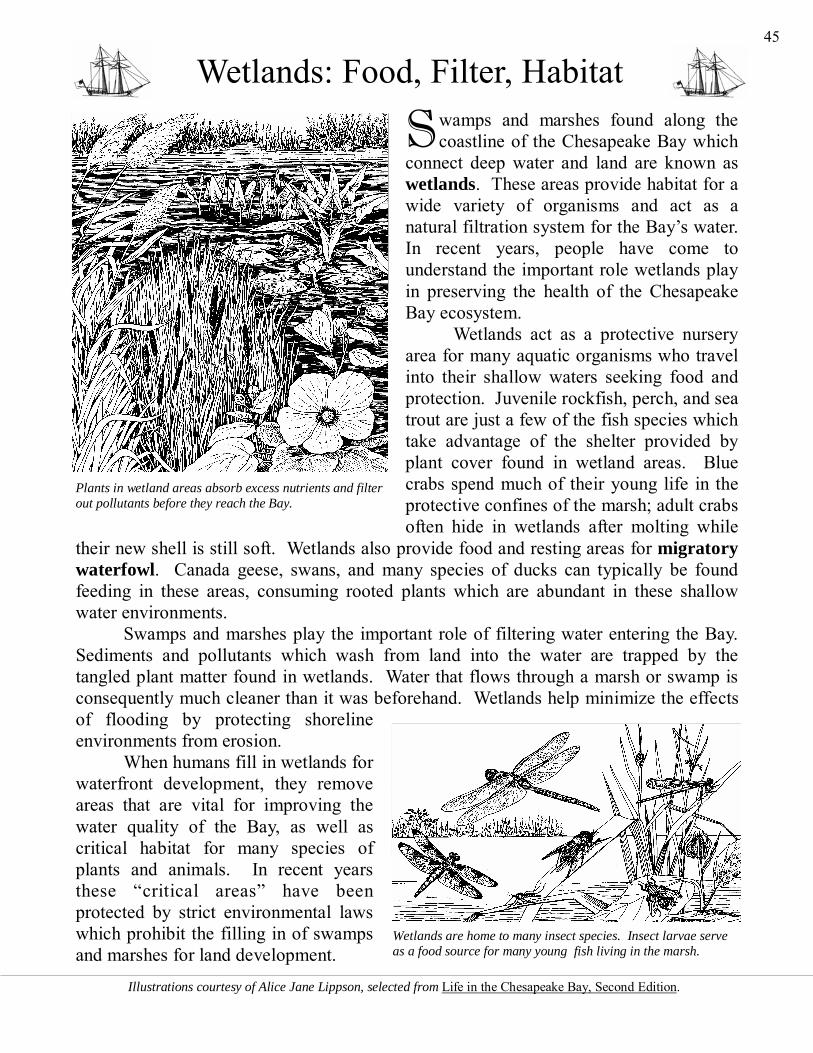
Wetlands: Food, Filter, Habitat
S wamps and marshes found along the coastline of the Chesapeake Bay which
connect deep water and land are known as wetlands. These areas provide habitat for a wide variety of organisms and act as a natural filtration system for the Bay’s water. In recent years, people have come to understand the important role wetlands play in preserving the health of the Chesapeake Bay ecosystem. Wetlands act as a protective nursery area for many aquatic organisms who travel into their shallow waters seeking food and protection. Juvenile rockfish, perch, and sea trout are just a few of the fish species which take advantage of the shelter provided by plant cover found in wetland areas. Blue crabs spend much of their young life in the protective confines of the marsh; adult crabs often hide in wetlands after molting while
their new shell is still soft. Wetlands also provide food and resting areas for migratory waterfowl. Canada geese, swans, and many species of ducks can typically be found feeding in these areas, consuming rooted plants which are abundant in these shallow water environments. Swamps and marshes play the important role of filtering water entering the Bay. Sediments and pollutants which wash from land into the water are trapped by the tangled plant matter found in wetlands. Water that flows through a marsh or swamp is consequently much cleaner than it was beforehand. Wetlands help minimize the effects of flooding by protecting shoreline environments from erosion. When humans fill in wetlands for waterfront development, they remove areas that are vital for improving the water quality of the Bay, as well as critical habitat for many species of plants and animals. In recent years these “critical areas” have been protected by strict environmental laws which prohibit the filling in of swamps and marshes for land development.
Wetlands are home to many insect species. Insect larvae serve as a food source for many young fish living in the marsh.
Plants in wetland areas absorb excess nutrients and filter out pollutants before they reach the Bay.
Illustrations courtesy of Alice Jane Lippson, selected from Life in the Chesapeake Bay, Second Edition.
45
NAME: __________________________________________ DATE: ______________
COMPREHENSION QUESTIONS
DIRECTIONS: Read the text on the previous page, then answer the following questions in complete sentences. Write your answers on the lines. 1. What is a wetland? 2. In the spaces below, list five species of animals named in the article that rely on
wetlands for food or protection:
A. ________________________________
B. ________________________________
C. ________________________________
D. ________________________________
E. ________________________________
3. In the space below, describe how wetlands filter the water entering the Bay: 4. What has been done to protect wetlands in recent years?
Wetlands: Food, Filter, Habitat 46
Artwork courtesy of Marc Castelli.
T he Chesapeake Bay has provided people with food for
thousands of years. It has also provided many fishermen with a source of income. Fishermen who make a living harvesting the resources of the Chesapeake Bay are known as watermen. Watermen make their living in a variety of ways. In the spring, many catch fish using pound nets. Summer months are devoted to crabbing and clamming, while winter months are spent working the oyster bars. Other occupations include leading guided fishing trips, netting menhaden, “scraping” grass beds for crabs and working eel pots. Each waterman is his own boss, functioning as an independent businessman. They set their own hours, choose where to lay their pots or nets and are responsible for purchasing and maintaining their own boats. Watermen are well known for their specially designed workboats, fierce independence, distinctive vocabulary and deep
devotion to “following the water”. Many communities in Maryland and Virginia still have large populations of working watermen including Smith, Tangier, Deal and Hooper’s Islands in the lower Bay, and Kent Island and Rock Hall, MD in the upper Bay (to name just a few). In these communities it is not unusual to find watermen whose families have been in the Chesapeake seafood industry for many generations. As the health of the Bay has declined in the last half of the 20th century, making a living on the water has become increasingly difficult. Declining oyster populations, increased fishing pressure on blue crabs and lower water quality in general have all taken their toll on watermen. Many of the same ports which once housed hundreds of wooden workboats are now filled with fiberglass yachts used for recreational purposes. Watermen who remain in the business face the challenge of turning a profit from an increasingly scarce resource. The individuals who still wake every morning to “work the water” are a living testimony to the unique cultural heritage of the Chesapeake Bay.
Watermen on the Chesapeake Bay
“Hand tonging” is one of the oldest techniques known for catching oysters, dating back to the early colonial period. This waterman from Rock Hall, Maryland is working an oyster bar on the Chester River near Langford Creek.
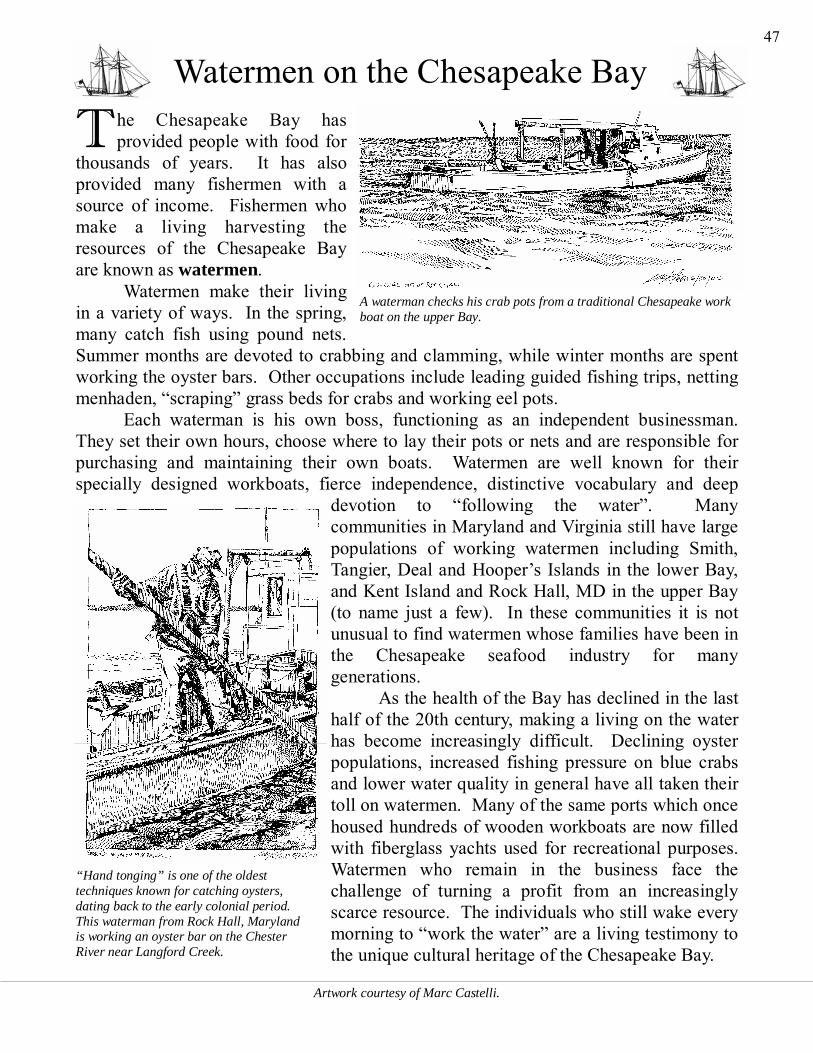
A waterman checks his crab pots from a traditional Chesapeake work boat on the upper Bay.
47
NAME: __________________________________________ DATE: ______________
COMPREHENSION QUESTIONS
DIRECTIONS: Read the text on the previous page, then answer the following questions in complete sentences. Write your answers on the lines. 1. What is a waterman? 2. In the spaces below, describe how most watermen make their living during the
different seasons (you do not need to use complete sentences): SPRING: ________________________________________________________________ SUMMER: ______________________________________________________________ WINTER: _______________________________________________________________ 3. What are some communities in the Chesapeake Bay that still have large populations of
working watermen? 4. In the space below, describe why it has become more difficult to make a living as a
waterman in recent years:
Watermen on the Chesapeake Bay 48
The Economics of “Crabbing”
Artwork courtesy of Marc Castelli.
W ould you like to work as a “crabber” on the Chesapeake
Bay? Before you answer that question you may first want to consider that the average waterman spends thousands of dollars on equipment even before a single crab is caught. To begin with, a waterman typically has one thousand dollars a month in boat payments and 150 dollar-a-month payments to reserve the slip where the boat is kept in the water. Then there is the matter of buying gear. A waterman working alone needs to fish at least 300 crab pots while keeping 150 pots in reserve to replace those that are taken out of the water for cleaning. Each one of these 450 pots costs twenty five dollars. Add in 260 dollars to buy two pairs of oil skin pants and 120 dollars to buy sixty pairs of gloves and you are only beginning to get a feel for the expenses involved in this business. Once on the water, there are many additional expenses that go along with simply running the boat. On average, a waterman working close to home in a small workboat uses thirty gallons of gasoline a day at a cost of $1.60 per gallon. Baiting the crab pots costs about ninety dollars a day. The hydraulic winder, which pulls the pots up to the side of the boat from the bottom of the Bay, costs approximately one thousand dollars. Finally, a heavy duty power washer is required to clean dirty pots, which costs another twelve hundred dollars. If it sounds like a lot of money just to get started, it is! Once on the Bay watermen need to catch a large amount of crabs just to break even. When crabs are hard
to find many watermen cannot meet their expenses and go out of business. C o m p l e t e t h e works he ets on the following pages to get a feel for the economic challenges faced by watermen, then think about whether or not “crabbing” is the business for you!
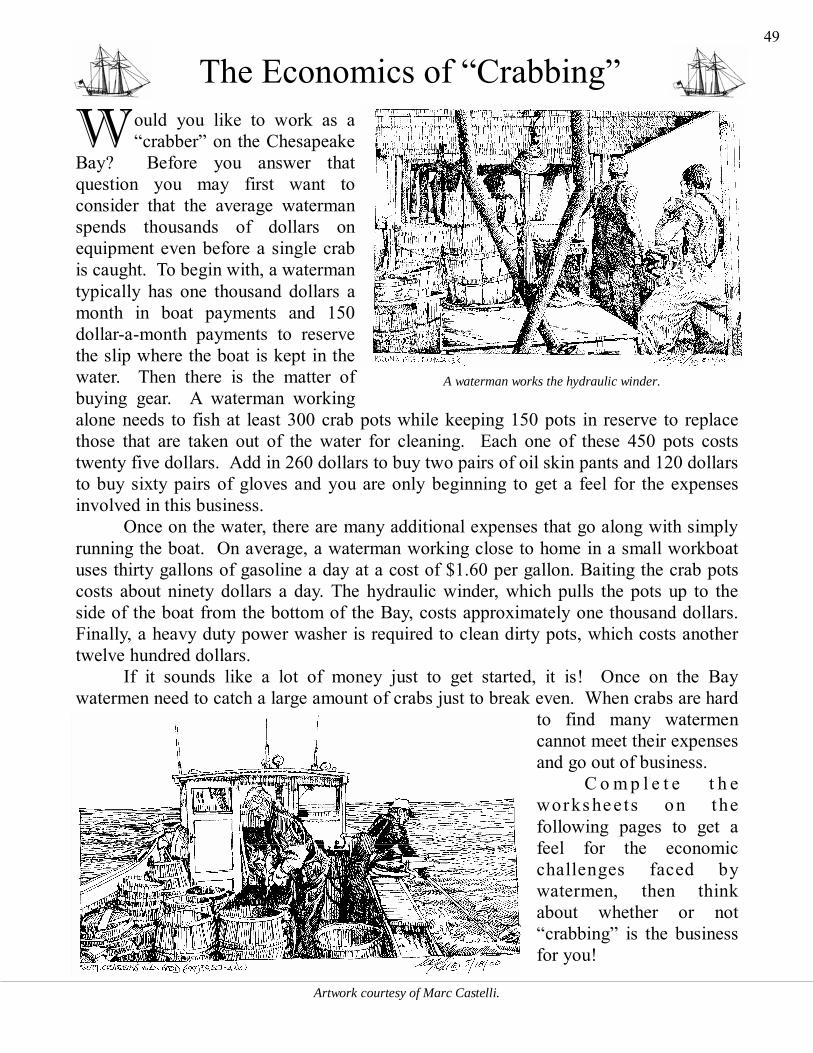
A waterman works the hydraulic winder.
49
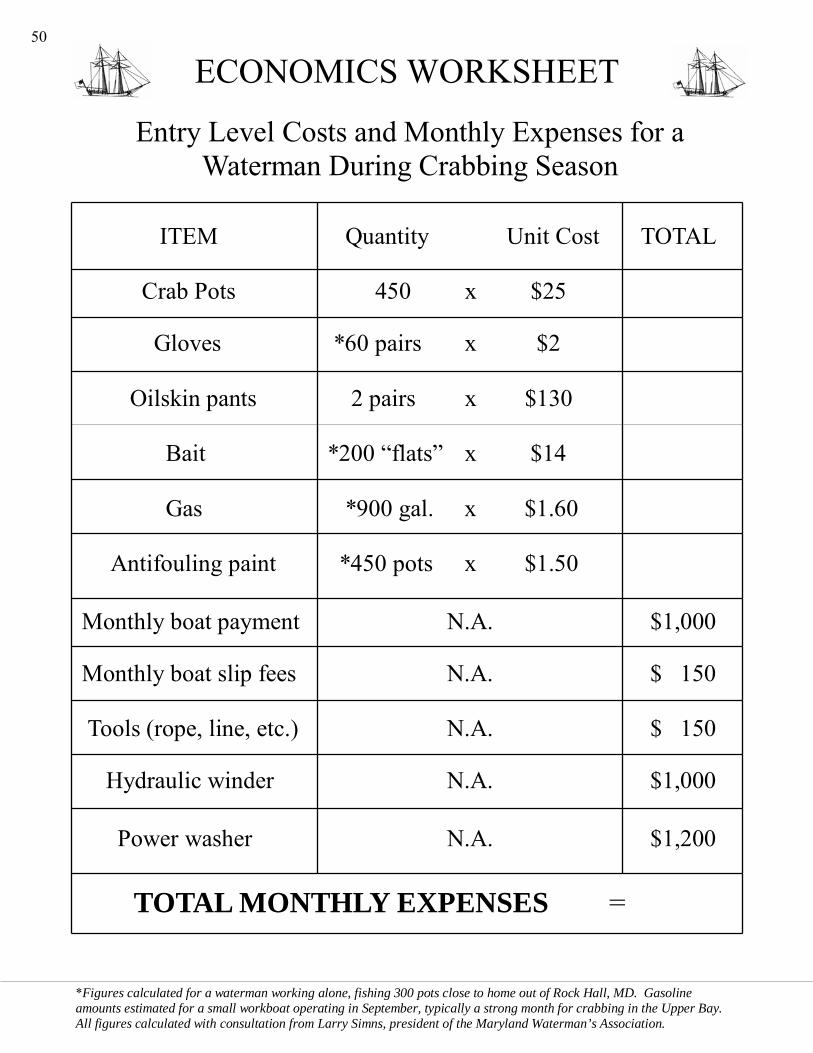
Entry Level Costs and Monthly Expenses for a Waterman During Crabbing Season
ITEM Quantity Unit Cost TOTAL Crab Pots 450 x $25 Gloves *60 pairs x $2 Oilskin pants 2 pairs x $130 Bait *200 “flats” x $14 Gas *900 gal. x $1.60 Antifouling paint *450 pots x $1.50 Monthly boat payment N.A. $1,000 Monthly boat slip fees N.A. $ 150 Tools (rope, line, etc.) N.A. $ 150 Hydraulic winder N.A. $1,000 Power washer N.A. $1,200 TOTAL MONTHLY EXPENSES =
*Figures calculated for a waterman working alone, fishing 300 pots close to home out of Rock Hall, MD. Gasoline amounts estimated for a small workboat operating in September, typically a strong month for crabbing in the Upper Bay. All figures calculated with consultation from Larry Simns, president of the Maryland Waterman’s Association.
ECONOMICS WORKSHEET 50
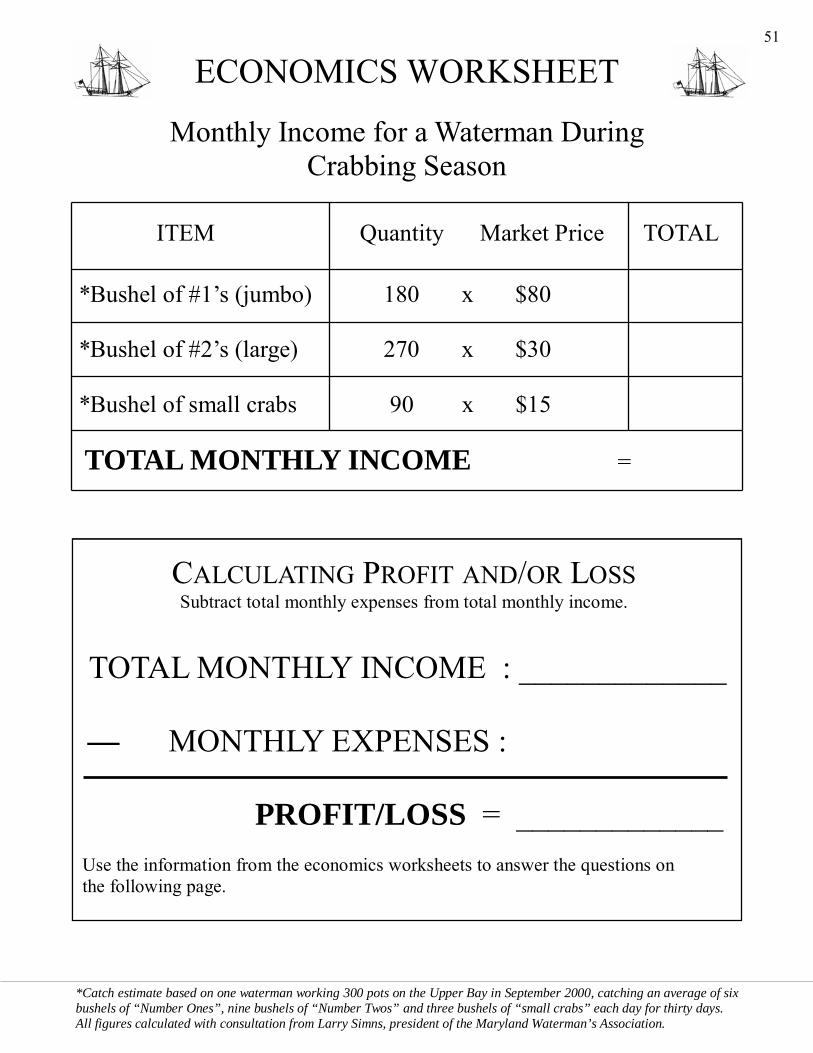
Monthly Income for a Waterman During Crabbing Season
ITEM Quantity Market Price TOTAL *Bushel of #1’s (jumbo) 180 x $80 *Bushel of #2’s (large) 270 x $30 *Bushel of small crabs 90 x $15 TOTAL MONTHLY INCOME =
*Catch estimate based on one waterman working 300 pots on the Upper Bay in September 2000, catching an average of six bushels of “Number Ones”, nine bushels of “Number Twos” and three bushels of “small crabs” each day for thirty days. All figures calculated with consultation from Larry Simns, president of the Maryland Waterman’s Association.
CALCULATING PROFIT AND/OR LOSS Subtract total monthly expenses from total monthly income.
TOTAL MONTHLY INCOME : _____________
— MONTHLY EXPENSES : PROFIT/LOSS = _____________ Use the information from the economics worksheets to answer the questions on the following page.
ECONOMICS WORKSHEET 51
NAME: __________________________________________ DATE: ______________
COMPREHENSION QUESTIONS
DIRECTIONS: Use the economics worksheets on the previous pages to answer the following questions in complete sentences. Write your answers on the lines. 1. What was this waterman’s profit/loss? Is he making enough money to make a living? 2. If the crabbing remained equally as productive through the month of November, how
much money would this waterman have made in that three month span? Explain how you arrived at your answer.
3. What would this waterman’s profit have been in June, typically a slow for crabbing on
the Upper Bay, if he had caught only half the amount of crabs? How would this have affected his ability to stay in business?
4. If it is so hard to make a living as a waterman, why do you think people still stay in the
business?
The Economics of “Crabbing” 52
Nutrients: Too Much of a Good Thing
53
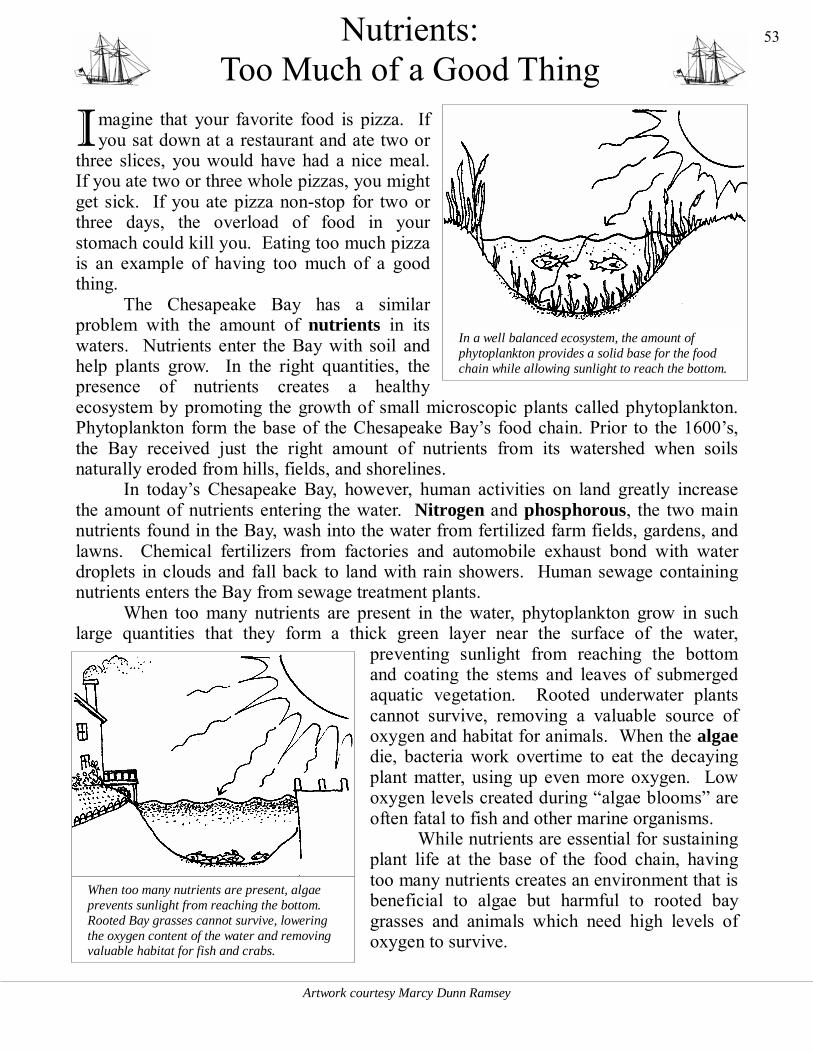
I magine that your favorite food is pizza. If you sat down at a restaurant and ate two or
three slices, you would have had a nice meal. If you ate two or three whole pizzas, you might get sick. If you ate pizza non-stop for two or three days, the overload of food in your stomach could kill you. Eating too much pizza is an example of having too much of a good thing. The Chesapeake Bay has a similar problem with the amount of nutrients in its waters. Nutrients enter the Bay with soil and help plants grow. In the right quantities, the presence of nutrients creates a healthy ecosystem by promoting the growth of small microscopic plants called phytoplankton. Phytoplankton form the base of the Chesapeake Bay’s food chain. Prior to the 1600’s, the Bay received just the right amount of nutrients from its watershed when soils naturally eroded from hills, fields, and shorelines. In today’s Chesapeake Bay, however, human activities on land greatly increase the amount of nutrients entering the water. Nitrogen and phosphorous, the two main nutrients found in the Bay, wash into the water from fertilized farm fields, gardens, and lawns. Chemical fertilizers from factories and automobile exhaust bond with water droplets in clouds and fall back to land with rain showers. Human sewage containing nutrients enters the Bay from sewage treatment plants. When too many nutrients are present in the water, phytoplankton grow in such large quantities that they form a thick green layer near the surface of the water,
preventing sunlight from reaching the bottom and coating the stems and leaves of submerged aquatic vegetation. Rooted underwater plants cannot survive, removing a valuable source of oxygen and habitat for animals. When the algae die, bacteria work overtime to eat the decaying plant matter, using up even more oxygen. Low oxygen levels created during “algae blooms” are often fatal to fish and other marine organisms. While nutrients are essential for sustaining plant life at the base of the food chain, having too many nutrients creates an environment that is beneficial to algae but harmful to rooted bay grasses and animals which need high levels of oxygen to survive.
In a well balanced ecosystem, the amount of phytoplankton provides a solid base for the food chain while allowing sunlight to reach the bottom.
When too many nutrients are present, algae prevents sunlight from reaching the bottom. Rooted Bay grasses cannot survive, lowering the oxygen content of the water and removing valuable habitat for fish and crabs.
Artwork courtesy Marcy Dunn Ramsey
NAME: __________________________________________ DATE: ______________
COMPREHENSION QUESTIONS
DIRECTIONS: Read the text on the previous page, then answer the following questions in complete sentences. Write your answers on the lines. 1. When the right amount of nutrients is present, how does this help to create a healthy
ecosystem? 2. What are the two main nutrients in the Chesapeake Bay?
3. What are some ways that nutrients enter the Chesapeake Bay?
4. In the space below, describe how having too many nutrients creates problems for the Chesapeake Bay ecosystem.
Nutrients: Too Much of a Good Thing
54
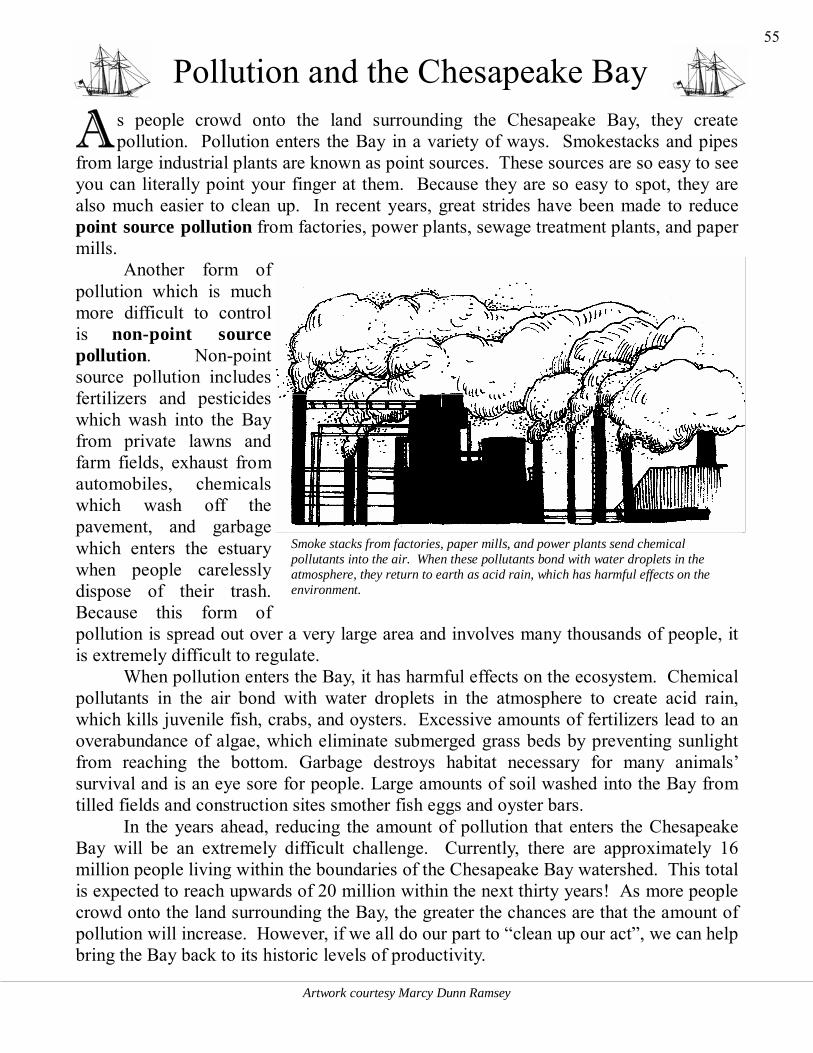
A s people crowd onto the land surrounding the Chesapeake Bay, they create pollution. Pollution enters the Bay in a variety of ways. Smokestacks and pipes
from large industrial plants are known as point sources. These sources are so easy to see you can literally point your finger at them. Because they are so easy to spot, they are also much easier to clean up. In recent years, great strides have been made to reduce point source pollution from factories, power plants, sewage treatment plants, and paper mills. Another form of pollution which is much more difficult to control is non-point source pollution. Non-point source pollution includes fertilizers and pesticides which wash into the Bay from private lawns and farm fields, exhaust from automobiles, chemicals which wash off the pavement, and garbage which enters the estuary when people carelessly dispose of their trash. Because this form of pollution is spread out over a very large area and involves many thousands of people, it is extremely difficult to regulate. When pollution enters the Bay, it has harmful effects on the ecosystem. Chemical pollutants in the air bond with water droplets in the atmosphere to create acid rain, which kills juvenile fish, crabs, and oysters. Excessive amounts of fertilizers lead to an overabundance of algae, which eliminate submerged grass beds by preventing sunlight from reaching the bottom. Garbage destroys habitat necessary for many animals’ survival and is an eye sore for people. Large amounts of soil washed into the Bay from tilled fields and construction sites smother fish eggs and oyster bars. In the years ahead, reducing the amount of pollution that enters the Chesapeake Bay will be an extremely difficult challenge. Currently, there are approximately 16 million people living within the boundaries of the Chesapeake Bay watershed. This total is expected to reach upwards of 20 million within the next thirty years! As more people crowd onto the land surrounding the Bay, the greater the chances are that the amount of pollution will increase. However, if we all do our part to “clean up our act”, we can help bring the Bay back to its historic levels of productivity.
Pollution and the Chesapeake Bay
Smoke stacks from factories, paper mills, and power plants send chemical pollutants into the air. When these pollutants bond with water droplets in the atmosphere, they return to earth as acid rain, which has harmful effects on the environment.
Artwork courtesy Marcy Dunn Ramsey
55

NAME: __________________________________________ DATE: ______________
COMPREHENSION QUESTIONS
DIRECTIONS: Read the text on the previous page, then answer the following questions in complete sentences. Write your answers on the lines. 1. What is point source pollution? Give one example of this type of pollution.
2. What is non-point source pollution? Give one example of this type of pollution. 3. Why is point source pollution easier to control than non-point source pollution?
4. What are three ways that pollution is harmful to the Chesapeake Bay ecosystem?
Pollution and the Chesapeake Bay 56
What One Person Can Do to Help the Chesapeake Bay
W ith the many problems and challenges facing the Chesapeake Bay today, it is easy to wonder if there is anything that one person can do to help. In reality,
there are many ways that individuals can lessen their impact on our Bay. One thing each person can do to improve the health of the estuary is conserve water. When people wash dishes, brush their teeth, or flush a toilet, the water they use is transported to a treatment plant in their community and ultimately reenters the watershed. When we reduce the amount of water that we use, we reduce the amount of treated water that reenters the Bay. Another thing that each person can do to lessen their impact on the Bay is conserve electricity. When light switches are left on all night, power plants need to
work overtime to supply power. These plants c r e a t e c h e m i c a l pollutants that enter the atmosphere from smoke stacks and fall back to the ground with rainfall. T he l e s s p o w e r electrical plants need to provide, the less pollution they create. There are many o t he r wa ys t ha t individuals can help the Bay. Carpooling, for example, cuts down on t h e a m o u n t o f automobile exhaust entering the atmosphere,
which lessens the amount of chemical nutrients entering the estuary. Recycling paper, aluminum, and other materials conserves resources and helps slow the rate of deforestation and clearing of land for mining. Getting involved in community projects to clean trash from roadsides, restore habitat on a local stream, or plant Bay grasses in shallow parts of the Chesapeake help improve habitat for plants and animals. Educating your friends and family about how they impact the Bay encourages them to get involved with improving the health of this environment. Ultimately the health of the estuary depends on the activities of the individuals who live within its watershed. By making simple lifestyle changes that lessen your impact on the Chesapeake Bay, YOU can take an active role in restoring the health of this amazing ecosystem!
Planting trees at home, at school, or near a local stream is one way to help the Bay. The roots from trees help to prevent erosion by holding the soil in place, while the leaves reduce erosion by lessening the impact of heavy rains.
Artwork courtesy Marcy Dunn Ramsey
57
NAME: __________________________________________ DATE: ______________
COMPREHENSION QUESTIONS
DIRECTIONS: Read the text on the previous page, then answer the following questions in complete sentences. Write your answers on the lines. 1. What happens to the water that goes down the drain after you brush your teeth or take
a shower? 2. In the spaces below, describe how the following actions help to lessen your impact on
the Bay and improve the health of the Chesapeake: A. Conserving electricity B. Carpooling C. Recycling D. Getting involved in community restoration projects
What One Person Can Do to Help the Chesapeake Bay
58
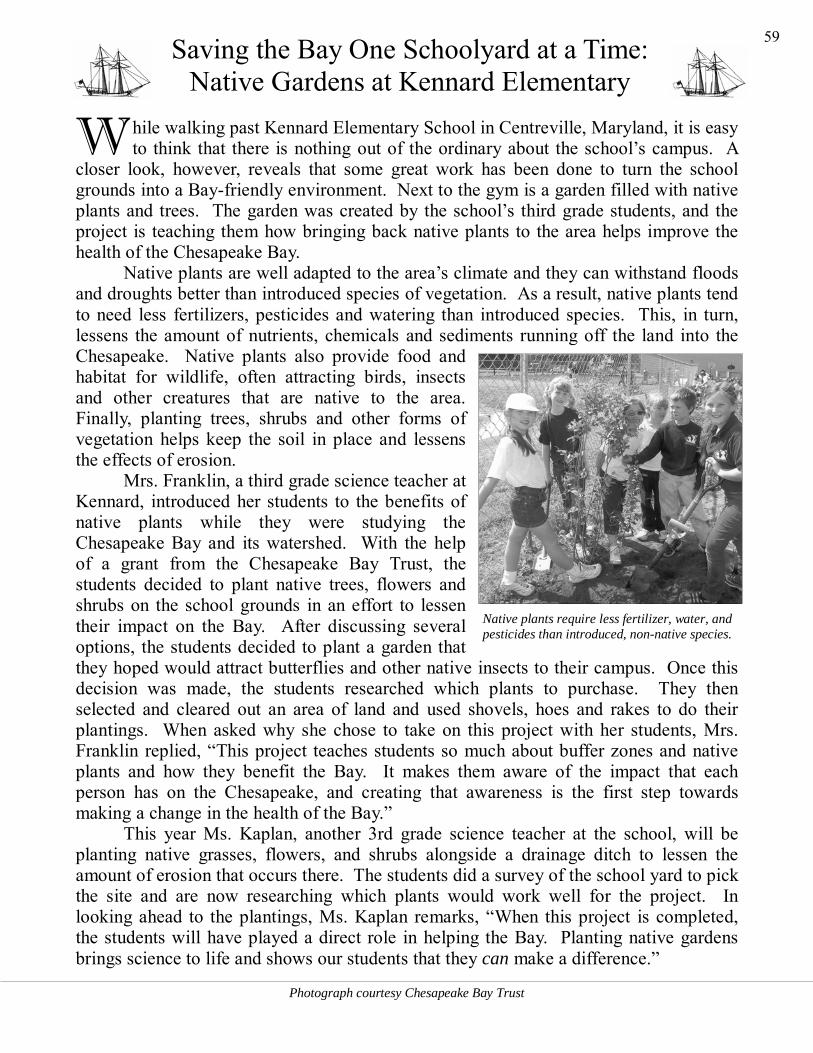
W hile walking past Kennard Elementary School in Centreville, Maryland, it is easy to think that there is nothing out of the ordinary about the school’s campus. A
closer look, however, reveals that some great work has been done to turn the school grounds into a Bay-friendly environment. Next to the gym is a garden filled with native plants and trees. The garden was created by the school’s third grade students, and the project is teaching them how bringing back native plants to the area helps improve the health of the Chesapeake Bay. Native plants are well adapted to the area’s climate and they can withstand floods and droughts better than introduced species of vegetation. As a result, native plants tend to need less fertilizers, pesticides and watering than introduced species. This, in turn, lessens the amount of nutrients, chemicals and sediments running off the land into the Chesapeake. Native plants also provide food and habitat for wildlife, often attracting birds, insects and other creatures that are native to the area. Finally, planting trees, shrubs and other forms of vegetation helps keep the soil in place and lessens the effects of erosion. Mrs. Franklin, a third grade science teacher at Kennard, introduced her students to the benefits of native plants while they were studying the Chesapeake Bay and its watershed. With the help of a grant from the Chesapeake Bay Trust, the students decided to plant native trees, flowers and shrubs on the school grounds in an effort to lessen their impact on the Bay. After discussing several options, the students decided to plant a garden that they hoped would attract butterflies and other native insects to their campus. Once this decision was made, the students researched which plants to purchase. They then selected and cleared out an area of land and used shovels, hoes and rakes to do their plantings. When asked why she chose to take on this project with her students, Mrs. Franklin replied, “This project teaches students so much about buffer zones and native plants and how they benefit the Bay. It makes them aware of the impact that each person has on the Chesapeake, and creating that awareness is the first step towards making a change in the health of the Bay.” This year Ms. Kaplan, another 3rd grade science teacher at the school, will be planting native grasses, flowers, and shrubs alongside a drainage ditch to lessen the amount of erosion that occurs there. The students did a survey of the school yard to pick the site and are now researching which plants would work well for the project. In looking ahead to the plantings, Ms. Kaplan remarks, “When this project is completed, the students will have played a direct role in helping the Bay. Planting native gardens brings science to life and shows our students that they can make a difference.”
Photograph courtesy Chesapeake Bay Trust
59 Saving the Bay One Schoolyard at a Time: Native Gardens at Kennard Elementary
Native plants require less fertilizer, water, and pesticides than introduced, non-native species.
NAME: __________________________________________ DATE: ______________
COMPREHENSION QUESTIONS
DIRECTIONS: Read the text on the previous page, then answer the following questions in complete sentences. Write your answers on the lines. 1. What are some ways that native plant species are better for the environment than
introduced species? 2. What were some of the steps involved in planning the Butterfly Garden? 3. According to Mrs. Franklin, how does the Butterfly Garden project benefit her
students? 4. Why did Ms. Kaplan’s class choose to plant their native grasses, flowers, and shrubs
near a drainage ditch?
60 Saving the Bay One Schoolyard at a Time: Native Gardens at Kennard Elementary
Here is a checklist which provides guidelines for living a “Bay friendly” lifestyle. Check off items which you already practice at school and at home, then think of other ways YOU can help minimize your impact on the Chesapeake Bay! GUIDELINES FOR A “BAY FRIENDLY” SCHOOL ENVIRONMENT _____ Lights, computers, etc. are consistently turned off when nobody is in the room. _____ Recycling boxes are in every classroom for paper and other recyclable products. Lunch trays and silverware in the school cafeteria are reusable. _____ “Bay Scaping” the campus is practiced: native grasses, shrubs and trees are planted in the schoolyard to reduce need for watering, fertilizer, and pesticides. _____ Native Bay grasses are grown in my classroom and planted in local waterways. _____ “Rain Gardens” are created at the base of storm drainage pipes to reduce runoff. _____ Storm drains, sinks, and toilets are marked with “Chesapeake Bay Drainage Area” signs to let others know that water going down the drain impacts the Bay. _____ My class raises native fish species such as yellow perch and American shad and releases them into local waterways. GUIDELINES FOR A “BAY FRIENDLY” HOME ENVIRONMENT _____ Recycling of paper, aluminum, and newspapers is practiced. _____ Water is conserved (showers take five minutes or less, sinks are turned off when not in use, watering the lawn is kept to a minimum, etc.). _____ Carpooling is practiced going to school and/or work; short travel distances are covered by walking or riding a bike. _____ Lawn fertilizer is applied carefully, using only the amount that is needed. _____ Products are researched before they are purchased to ensure that the companies which produce them responsibly dispose of their waste. _____ “Oyster Gardening” is practiced - juvenile oysters are raised at my dock in specially designed floats and then deposited on nearby oyster bars. _____ I have participated in stream clean-up efforts in my community.
For additional “Bay-friendly” projects, visit the Chesapeake Bay Trust web site at www.chesapeakebaytrust.org
Checklist for a “Bay Friendly” Lifestyle 61

algae small free floating or attached plants. Free floating algae grow in abundance near the top of the water column and are the most common form of phytoplankton in the Chesapeake Bay.
anal fin the fin on the rear underbelly of a fish that provides stability and protection while swimming.
bioaccumulation the build up of a toxic pollutant in a higher level organism, such as the bald eagle, due to the magnifying effects of the food chain.
brackish water a mixture of salt and fresh water.
camouflage blending in with one’s surroundings.
caudal fin the tail fin of a fish, used for propulsion.
counter shading a two part system of camouflage common to many Chesapeake Bay organisms. Many fish have a form of counter shading which features a dark green back and white under belly.
crustaceans animals containing ten legs and a hard shell, or exoskeleton. Crabs, shrimp, lobsters, and crayfish are all examples of crustaceans.
DDT a pesticide used in the mid 1900’s which contaminated the food chain and nearly led to the extinction of bald eagles, ospreys, blue heron, and other predatory birds.
dermo a parasite which preys upon adult oysters before they are able to reproduce.
dorsal fin the fin on the upper back of a fish used for vertical stability and protection.
ecosystem an environment which supports specific forms of plant and animal life. Deserts, forests, lakes, and rivers are examples of different types of ecosystems.
erosion the process of soil washing or being blown off the land and into the Chesapeake Bay.
estuary an aquatic ecosystem which contains brackish water.
exoskeleton a hard, outer covering of an animal which acts as its skeleton. Crabs, lobsters, shrimp, and crayfish all have exoskeletons.
fishing moratorium a complete ban on fishing for a particular species. The five year moratorium placed on fishing for striped bass is widely credited with promoting its recovery.
food web an interconnected feeding system which begins with plant life and generally progresses from small organisms such as plankton to large predatory organisms such as eagles, rockfish, and humans
fresh water water containing virtually no salt (less than one part per thousand). Fresh water is found in groundwater, lakes, ponds, brooks, streams, and non-tidal portions of rivers.
habitat areas which provide ideal living space for specific types of plants and animals.
larva the young, immature form of animals.
lateral line a line running from behind the gill plate to the base of the tail; nerve endings in this line allow fish to “hear” by detecting vibrations in the water, helping them locate food and avoid predators.
megalopa the second larval form of a crab, slightly larger than the zoea.
migratory waterfowl birds such as ducks, geese, and swans which pass through the Chesapeake Bay area during seasonal movements from one location to another.
molt the process of shedding one’s shell.
MSX a parasite which kills young oysters.
nitrogen and phosphorous the two most common types of nutrients found in the Bay
GLOSSARY
62
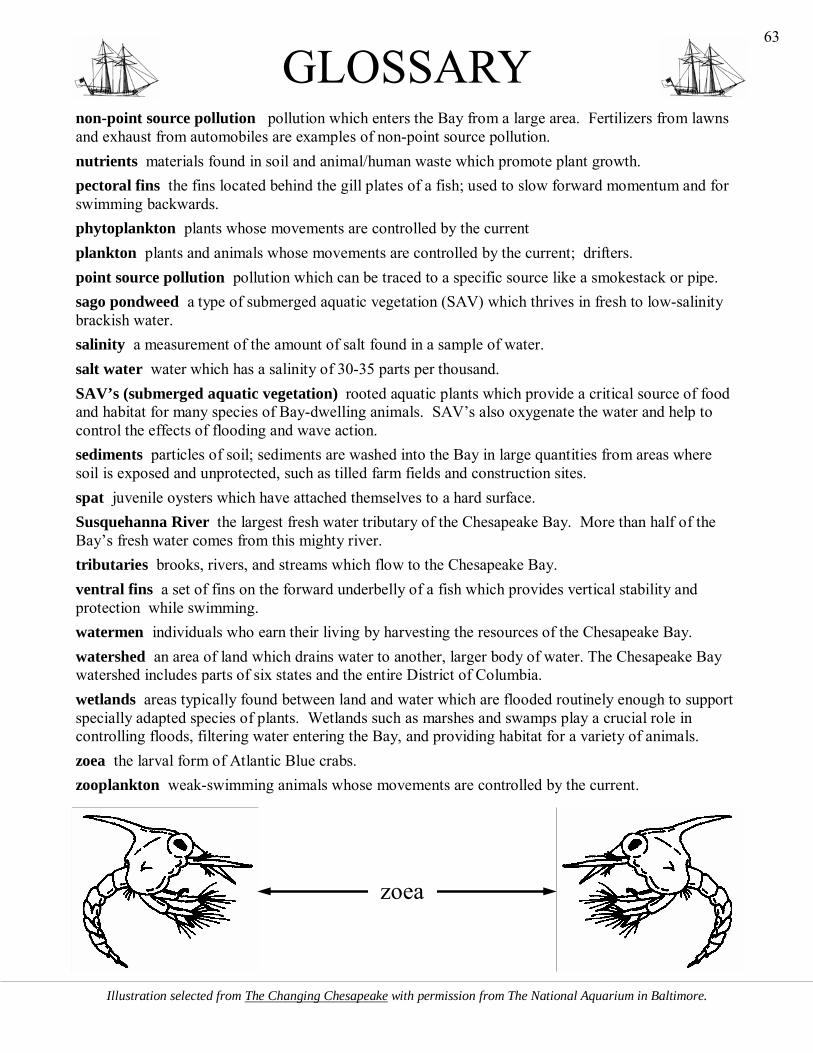
non-point source pollution pollution which enters the Bay from a large area. Fertilizers from lawns and exhaust from automobiles are examples of non-point source pollution.
nutrients materials found in soil and animal/human waste which promote plant growth.
pectoral fins the fins located behind the gill plates of a fish; used to slow forward momentum and for swimming backwards.
phytoplankton plants whose movements are controlled by the current
plankton plants and animals whose movements are controlled by the current; drifters.
point source pollution pollution which can be traced to a specific source like a smokestack or pipe.
sago pondweed a type of submerged aquatic vegetation (SAV) which thrives in fresh to low-salinity brackish water.
salinity a measurement of the amount of salt found in a sample of water.
salt water water which has a salinity of 30-35 parts per thousand.
SAV’s (submerged aquatic vegetation) rooted aquatic plants which provide a critical source of food and habitat for many species of Bay-dwelling animals. SAV’s also oxygenate the water and help to control the effects of flooding and wave action.
sediments particles of soil; sediments are washed into the Bay in large quantities from areas where soil is exposed and unprotected, such as tilled farm fields and construction sites.
spat juvenile oysters which have attached themselves to a hard surface.
Susquehanna River the largest fresh water tributary of the Chesapeake Bay. More than half of the Bay’s fresh water comes from this mighty river.
tributaries brooks, rivers, and streams which flow to the Chesapeake Bay.
ventral fins a set of fins on the forward underbelly of a fish which provides vertical stability and protection while swimming.
watermen individuals who earn their living by harvesting the resources of the Chesapeake Bay.
watershed an area of land which drains water to another, larger body of water. The Chesapeake Bay watershed includes parts of six states and the entire District of Columbia.
wetlands areas typically found between land and water which are flooded routinely enough to support specially adapted species of plants. Wetlands such as marshes and swamps play a crucial role in controlling floods, filtering water entering the Bay, and providing habitat for a variety of animals.
zoea the larval form of Atlantic Blue crabs.
zooplankton weak-swimming animals whose movements are controlled by the current.
Illustration selected from The Changing Chesapeake with permission from The National Aquarium in Baltimore.
GLOSSARY
63
zoea
Additional Resources for Learning About the Bay
BOOKS AND PUBLICATIONS FOR TEACHERS
Life in the Chesapeake Bay, Second Edition by Robert and Alice Jane Lippson
This book contains detailed descriptions of just about every living creature and environment found in the Chesapeake Bay. Each section is filled with wonderful illustrations depicting the Bay’s inhabitants and the text is written in terminology that is easily understandable by the casual reader. This book can be found at any major book store and at amazon.com. The State of the Chesapeake Bay published annually by the Chesapeake Bay Program
This annual publication contains the latest information on the health of the Chesapeake Bay. It includes recent data on the health of major Chesapeake Bay fisheries, bald eagle populations, oyster stocks, SAV acreage, and water quality. These manuals can be ordered by calling 1-800-YOUR-BAY. State of the Bay Report published annually by the Chesapeake Bay Foundation
This publication rates the health of the Bay on a scale of 1 to 100 in several categories, including fisheries (rockfish, crabs, shad, oysters), habitat (SAV’s, wetlands, resource lands and forested buffers), and pollution (dissolved oxygen, nitrogen and phosphorous, toxics, water clarity). It can be downloaded at www.cbf.org.
BOOKS FOR KIDS
Awesome Chesapeake by David Owen Bell
An overview of the ecosystem of the Chesapeake Bay, written on an elementary to middle school level and illustrated by Marcy Dunn Ramsey. This book can be found at most major book stores and at amazon.com.
INTERNET SOURCES
ChesSIE (Chesapeake Science on the Internet for Educators) - www.bayeducation.net
This is a fantastic web site for both teachers and students. It contains lesson plans, fisheries data, facts about Bay creatures, and links to just about every Bay-related web site on the Internet. Chesapeake Bay Program - www.chesapeakebay.net
This web site contains a variety of resources including articles about Chesapeake Bay organisms, ways to obtain publications related to the health of the estuary, and links to databases containing Annual Landings Records for major commercial fisheries. Chesapeake Bay Trust - www.chesapeakebaytrust.org
This is a fantastic site for teachers seeking grants to help fund restoration projects, field trips and other “meaningful Bay experiences”. Sultana Projects, Inc. - www.schoonersultana.com
All materials found in this publication can be downloaded from Sultana’s web site. The documents are listed as individual files in PDF format. The site also contains information about Sultana’s award-winning under sail programs, including program descriptions, scheduling info, and booking procedures.
64

SULTANA PROJECTS, INC. Post Office Box 524 • Chestertown, MD 21620
Telephone: 410-778-5954 • Facsimile: 410-778-4531 Web Site: www.schoonersultana.com • Email: [email protected]
Sultana under full sail on the Chesapeake Bay. Photo courtesy Lucian Niemeyer.
ABOUT SULTANA PROJECTS, INC.
Sultana Projects, Inc. is a private, non-profit 501(c)(3) organization based in Chestertown, MD that provides approximately 8,000 students of all ages with experiential education programs focusing on maritime history and Chesapeake Bay ecology each year. In 2004, Sultana Projects was the proud recipient of the National Maritime Heritage Foundation’s Walter Cronkite Award for Excellence in Maritime Education. Through education, Sultana Projects promotes stewardship of the Bay’s unique historic, cultural and environmental legacy.