
CHORASA NHAMO R105938P
135
AN EVALUATION OF THE INTERNAL CONTROL SYSTEMS AT ZIMBABWE ELECTRICITY TRANSMISSION AND DISTRIBUTION COMPANY (ZETDC) ON SERVICE DELIVERY (2009 – 2012) By Nhamo Chorasa Registration Number R105938P Dissertation submitted in partial fulfilment for the degree of Master of Administration Graduate School of Management University of Zimbabwe Supervisor : Dr N. KASEKE July 2012
Transcript of CHORASA NHAMO R105938P

AN EVALUATION OF THE INTERNAL CONTROL SYSTEMS AT ZI MBABWE
ELECTRICITY TRANSMISSION AND DISTRIBUTION COMPANY ( ZETDC) ON
SERVICE DELIVERY (2009 – 2012)
By Nhamo Chorasa
Registration Number R105938P
Dissertation submitted in partial fulfilment for t he degree of
Master of Administration
Graduate School of Management
University of Zimbabwe
Supervisor : Dr N. KASEKE
July 2012

i
DECLARATION
I Nhamo Chorasa, do hereby declare that this dissertation is the result of my own
investigation and research, except to the extent indicated in the
acknowledgements, references and by comments included in the body of the
report, and that it has not been submitted in part or in full for any other degree to
any other University.
……………………………………………… ……………………………
SIGNATURE DATE
SUPERVISOR
SIGNATURE………………………………… DATE………………………..

i
DEDICATION
To my wife Chipo, and our children, Joshua, Junior and Jonathan, you were a pillar
of support and a beacon of love and may the love of God always be with you Amen.

ii
ACKNOWLEDGEMENTS
The researcher extends gratitude to the following people for making this study
possible:
Dr N. Kaseke my supervisor, for providing the guidance, wisdom and
encouragement.
Mr O. Dondo and Mr T. Mushangwe, my workmates at ZESA Holdings for the
support, understanding, and for the fruitful discussions and idea sharing.
Mrs F Musimbo for editing and other support service.
Members of Hope Community Church, for the spiritual and moral support including
prayer and supplications.

iii
ABSTRACT
The aim of this study is to evaluate the internal control system in ZETDC (Zimbabwe
Electricity Transmission and Distribution Company) on service delivery with regards
to the period 2009 to 2012. This is the period when Zimbabwe, as a country
commenced using the US dollar and other foreign currencies after experiencing
several years of devastation by a record inflation, on the local Zimbabwean currency.
Most services were expected to improve with the stability in the economy. ZETDC is
a subsidiary of ZESA Holdings (Zimbabwe Electricity Supply Authority), the electricity
utility service provider in Zimbabwe.
The COSO framework on internal controls as noted by Chambers and Rand (2011)
articulates that internal controls should provide reasonable assurance regarding the
achievements of objectives on the effectiveness and efficiency of operations, the
reliability of financial reporting and compliance with applicable laws and regulations.
Authors such as Hopkin (2012), Warren (2012) and Graham (2010) in supporting
the COSO framework, notes that there are five elements of internal controls that
form an umbrella over the business to protect it from control threats and these
include, the control environment, risk assessment , control procedures, monitoring
and information communication. A good internal control system should have three
forms of controls as noted by Hall (2010), which include preventative, detective and
corrective controls. As noted by Harrer (2010), strong controls put up roadblocks for
fraud, bad decisions, human error and help to minimise pitfalls and surprises. On the
other hand, poor internal controls were noted to negatively affect service delivery
and Braiota, Gazzaway, Colson, Colson and Ramamoorti (2010) believe that an
organisation cannot produce reliable services or products without good internal
controls. Obtaining sufficient resources, recruiting and retaining the right expertise
and maintaining good communications and relations are some of the challenges in
implementing effective internal controls highlighted by Hightower (2008).
The target population for the study consist of ZETDC staff members estimated at
5,000 inclusive of board members.
A sample of 100 staff members was selected using multistage random sampling to
ensure a fair representation of all hierarchical levels of staff in ZETDC on the
iv
sample. Data was collected through a survey questionnaire which was distributed to
staff members in ZETDC including board members. A 55% response rate was
obtained from the distributed questionnaires.
The major findings were that ZETDC has an internal control system that is company
devised with some elements of a good internal control system, which however are
not modelled along any known frameworks. The internal control system was found to
be regularly breached as evidenced by common activities such as assets abuse,
electricity bill adjustments and illegal power connections. These internal control
breaches negatively affected service delivery in that service provision in many
instances was sub standard, was not done, was delayed and cost more. ZETDC
faced staff resistance as a major challenge in implementing internal control systems,
furthermore, it lacked the strategy to implement internal control systems.
The research concluded that ZETDC had an ineffective internal control system that
resulted in poor service delivery.
It is recommended that ZETDC should adopt the COSO framework on internal
controls to enhance its internal control system.
v
Table of Contents
DECLARATION ..................................................................................................................................... i
DEDICATION ......................................................................................................................................... i
ACKNOWLEDGEMENTS ................................................................................................................... ii
ABSTRACT .......................................................................................................................................... iii
LIST OF TABLES .............................................................................................................................. viii
LIST OF FIGURES .............................................................................................................................. ix
ABBREVIATIONS ................................................................................................................................ x
CHAPTER 1 .......................................................................................................................................... 1
INTRODUCTION AND BACKGROUND TO THE STUDY ............................................................ 1
1.INTRODUCTION ............................................................................................................................... 1
1.1 BACKGROUND OF THE STUDY ............................................................................. 2
1.1.1 OVERVIEW ......................................................................................................................... 2
1.1.2 BACKGROUND TO THE COMPANY - ZETDC ...................................................... 5
1.1.3 STRATEGIC PLANNING .......................................................................................... 11
1.1.4 THE CONTROL ENVIRONMENT ........................................................................... 13
1.1.5 FINANCIAL PERFOMANCE .................................................................................... 15
1.1.6 SWOT ANALYSIS ...................................................................................................... 16
1.1.7 PEST ANALYSIS........................................................................................................ 18
1.1.8 ZETDC’S INTERNAL CONTROL DEFICIENCIES ............................................... 20
1.2 PROBLEM STATEMENT .............................................................................................. 22
1.3 RESEARCH OBJECTIVES .......................................................................................... 22
1.4. RESEARCH QUESTIONS ............................................................................................ 23
1.5 RESEARCH PROPOSITION ........................................................................................ 23
1.6 SIGNIFICANCE OF THE STUDY ................................................................................ 23
1.7 SCOPE OF RESEARCH AREA ................................................................................... 24
1.8 DISSERTATION OUTLINE ........................................................................................... 24
1.9 CHAPTER SUMMARY .................................................................................................. 25
CHAPTER 2 ........................................................................................................................................ 26
LITERATURE REVIEW ..................................................................................................................... 26
2.1 INTRODUCTION ............................................................................................................ 26
2.2 INTERNAL CONTROL SYSTEM ................................................................................. 26
2.3 FORMS OF INTERNAL CONTROL SYSTEMS ........................................................ 31

vi
2.4 FRAMEWORK FOR EVALUATING INTERNAL CONTROLS ................................ 35
2.5 THE IMPORTANCE OF INTERNAL CONTROL SYSTEMS ................................... 38
2.6 FACTORS INFLUENCING INTERNAL CONTROL SYSTEMS .............................. 40
2.7 SERVICE DELIVERY .................................................................................................... 42
2.8 EFFECTIVE INTERNAL COTROL SYSTEMS AND SERVICE DELIVERY ......... 46
2.9 CHALLENGES IN IMPLEMENTING INTERNAL CONTROL SYSTEMS .............. 47
2.11 CONCEPTUAL FRAMEWORK .................................................................................... 50
2.10 CHAPTER SUMMARY .................................................................................................. 50
CHAPTER 3 ........................................................................................................................................ 51
RESEARCH METHODOLOGY ........................................................................................................ 51
3.1 INTRODUCTION ............................................................................................................ 51
3.2 RESEARCH DESIGN .................................................................................................... 51
3.3 RESEARCH PHILOSOPHY ......................................................................................... 52
3.4 POPULATION AND SAMPLING TECHNIQUES ...................................................... 53
3.5 RESEARCH APPROACH ............................................................................................. 60
3.6 RESEARCH METHODS ............................................................................................... 60
3.7 DATA COLLECTION METHODS .............................................................................. 61
3.8 DATA ANALYSIS AND PRESENTATION .................................................................. 66
3.9 ETHICAL CONSIDERATIONS ..................................................................................... 66
3.10 RESEARCH LIMITATIONS .......................................................................................... 66
3.11 CHAPTER SUMMARY .................................................................................................. 67
CHAPTER 4 ........................................................................................................................................ 68
FINDINGS AND DISCUSSION ........................................................................................................ 68
4.0 INTRODUCTION ............................................................................................................ 68
4.1 RESPONSE RATE ......................................................................................................... 68
4.2 DEMOGRAPHIC RESPONSE ..................................................................................... 69
4.3 ELEMENTS OF THE INTERNAL CONTROL SYSTEM .......................................... 71
4.4 STATE OF THE INTERNAL CONTROL SYSTEM ................................................... 75
4.5 IMPACT ON SERVICE DELIVERY ............................................................................. 84
4.6 INTERNAL CONTROL IMPLEMENTATION CHALLENGES .................................. 87
CHAPTER SUMMARY .............................................................................................................. 90
CHAPTER 5 ........................................................................................................................................ 91
CONLUSION AND RECOMMENDATIONS ................................................................................... 91
5.0 INTRODUCTION ............................................................................................................ 91
vii
5.1 CONCLUSION ................................................................................................................ 91
5.1.1 STATE OF INTERNAL CONTROL SYSTEM IN ZETDC ..................................... 91
5.1.2 INTERNAL CONTROL BREACHES ....................................................................... 92
5.1.2 IMPACT ON SERVICE DELIVERY ......................................................................... 92
5.1.3 INTERNAL CONTROL IMPLEMENTATION CHALLENGES .............................. 92
5.2 TEST OF THE STUDY PROPOSITION ................................................................. 92
5.3 RECOMMENDATIONS ............................................................................................. 93
5.3.1 INTERNAL CONTROL FRAMEWORK .................................................................. 93
5.3.2 ORGANISATIONAL STRUCTURE ......................................................................... 93
5.3.3 INTERNAL CONTROL CHALLENGES .................................................................. 93
5.4 AREA OF FURTHER STUDY .................................................................................. 93
REFERENCES ........................................................................................................................... 94
APPENDIX 1.1.1A HARARE SUMMER LOAD SHEDDING TIME TABLE .................. 106
APPENDIX 1.1.1B HARARE WINTER LOAD SHEDDING TIME TABLE .................... 107
APPENDIX 1.1.1C SCHEDULE OF SURBURB CODES IN HARARE REGION........ 108
APPENDIX 1.1.2A ELECTRICITY TARIFFS EFFECTIVE FEBRUARY 2009 ............ 109
APPENDIX 1.1.2B ELECTRICITY TARIFFS EFFECTIVE JUNE 2010 ........................ 110
APPENDIX 1.1.2C ELECTRICITY TARIFFS EFFECTIVE SEPTEMBER 2011 ......... 111
APPENDIX 1.1.4A ZETDC STATEMENT OF FINANCIAL POSITION 2011 .............. 112
APPENDIX 1.1.4B ZETDC COMPREHENSIVE INCOME STATEMENT 2011 .......... 113
APPENDIX 1.1.4C ZETDC STATEMENT OF CASH FLOWS 2011 ............................ 114
APPENDIX 1.1.4D ZETDC RATIO ANALYSIS 2011 ...................................................... 115
APPENDIX 4.1 RESEARCH QUESTIONAIRE ................................................................ 116
viii
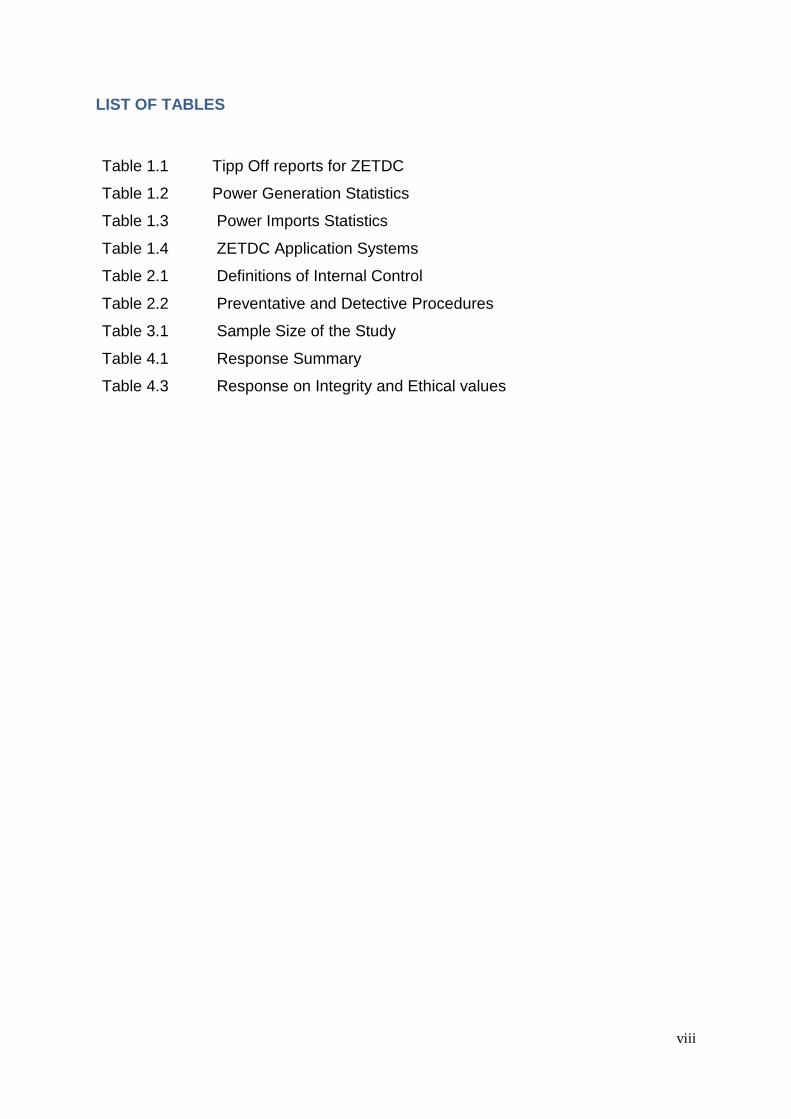
LIST OF TABLES
Table 1.1 Tipp Off reports for ZETDC
Table 1.2 Power Generation Statistics
Table 1.3 Power Imports Statistics
Table 1.4 ZETDC Application Systems
Table 2.1 Definitions of Internal Control
Table 2.2 Preventative and Detective Procedures
Table 3.1 Sample Size of the Study
Table 4.1 Response Summary
Table 4.3 Response on Integrity and Ethical values
ix
LIST OF FIGURES
Figure 1.1.1 Harare Region Service Evaluation
Figure 1.1.2 Tip-off Reports for ZETDC
Figure 2.3.1 Preventative, Detective and Corrective Controls
Figure 2.4.1 The COSO Internal Control Cube
Figure 4.2.1 Response by years of experience
Figure 4.2.2 Response by level of education
Figure 4.2.3 Response by department
Figure 4.3.2 Management philosophy
Figure 4.3.3 Response on organisational structure
Figure 4.4.1 Percentage response on type of controls
Figure 4.4.2 Response on internal control frameworks
Figure 4.4.3 Yes responses to internal control reviews
Figure 4.4.4 Percentage response on internal control breaches
Figure 4.4.6 Action taken on internal control breaches
Figure 4.4.7 Occurrence of internal control breaches
Figure 4.5.1 Response on internal control and service delivery
Figure 4.5.2 Services affected by internal control breaches
Figure 4.5.3 Impact on service delivery
Figure 4.6.1
Challenges faced in implementing internal control
systems
Figure 4.6.2 Responses to ZETDC technology adoption
x
ABBREVIATIONS
4G Fourth Generation
CCZ Consumer Council of Zimbabwe
CFL Compact Fluorescent Lamps
CoCo Criteria of Control
COSO Committee of Sponsoring Organizations of the Treadway
Commission
CPA Certified Public Auditor
ERP Enterprise Resource Planning
GNU Government of National Unity
GWh Gigawatt hour
ICS Integrated Customer Service
IIA Institute of Internal Auditors
ITC Incomes and Tariff Commission
KWh Kilowatt hour
KV Kilovolts
MD and A Management Discussion and Analysis
POTRAZ Postal and Telecommunications Regulatory Authority of
Zimbabwe
SADC Southern African Development Community
SAP Systems Application and Products
SAPP Southern Africa Power Pool
SPSS Statistical Package for the Social Sciences
STEM Short Term Energy Market

xi
USD United States Dollar
ZEDC Zimbabwe Electricity Distribution Company
ZEDC Zimbabwe Electricity Distribution Company
ZENT ZESA Enterprises
ZERA Zimbabwe Energy Regulation Authority
ZESA Zimbabwe Electricity Supply Authority
ZETC Zimbabwe Electricity Transmission Company
ZETDC Zimbabwe Electricity Transmission and Distribution Company
ZIMSTATS Zimbabwe Statistical Agency
ZPC Zimbabwe Power Company
1
CHAPTER 1
INTRODUCTION AND BACKGROUND TO THE STUDY
1. INTRODUCTION
The world economy has experienced various business scandals and corporate
failures such as the Enron accounting fraud, the Deutsche Bank spying scandal, the
Royal Dutch Shell overstatement of oil reserves, the WorldCom overstatement of
cash flows, the Olympus Corporation accounting scandal. Zimbabwe has also
experienced the Renaissance Merchant Bank (RMB) and Genesis Investment Bank
insolvency, the collapse of Ziscosteel and Air Zimbabwe among several other
corporate crisis. In view of this, focus has now shifted to the individual company’s
internal control system. A company’s internal control system has become
fundamental in various ways. Proponents of corporate governance have exerted
pressure to ensure that an effective internal control system forms part of the
corporate governance initiatives. There is growing perception that effective internal
controls help prevent and detect fraud, that reliable financial reporting is underpinned
by effective internal control system and that good internal controls will ultimately
deliver a quality product or service.
It is with this in mind that this research endeavours to evaluate one of the most vital
utility companies in Zimbabwe, the Zimbabwe Electricity Supply Authority (ZESA)
through its subsidiary company, the Zimbabwe Electricity Transmission and
Distribution Company (ZETDC) which is the sole supplier of electricity services in
the country. The study seeks to evaluate the internal control system, explore internal
control breaches, identify implementation challenges and find best practises that can
assist ZETDC in its mandate to deliver a quality service. This chapter provides the
background of the study, introduces the company under study - ZETDC, states the
problem statement, the research objectives and questions, the research proposition
and provides the significance, scope and the outline of the research.
2
1.1 BACKGROUND OF THE STUDY
1.1.1 OVERVIEW
There has been an unprecedented public outrage on the shoddy services obtaining
from Zimbabwe Electricity Supply Authority (ZESA) through its subsidiary company,
Zimbabwe Electricity and Distribution Company (ZETDC). Recently, Zimbabwean
readers have woken up to screaming front page newspaper headlines on ZESA such
as ‘ZESA billing woes to stay’ (Gumbo, 2012), ‘ZESA: A Thorn in flesh’ (Bwititi,
2011), ‘ZESA fails to import power’ (Nkala, 2011), ‘ZESA billing system chaotic’
(Harare Residents Trust, 2012), “Consumers Slam ZESA tariff hike”, (2011), ‘ZESA
attacked for load shedding’ (Ndlovu, 2010), ‘ZESA fears collapse’ (Mushava, 2011),
‘Hundreds march through Bulawayo to protest ZESA failures’ (Sibanda, 2011),
‘Disband ZESA’ (Zvauya and Kadirire, 2011), ‘Nerve racking power bills from ZESA’
(Mapimhidze, 2012) and many more such headlines. ZESA has fought hard to
manage a lot of public outrage. According to these newspaper reports, consumers
have bitterly and emotionally complained about the poor service quality offered by
ZETDC. The Consumer Council of Zimbabwe (CCZ) executive director Ms
Rosemary Siyachitema believes ‘ZESA has tossed electricity users from the frying
pan straight into the fire’ (Bwititi, 2011). Such is the frustration by electricity
consumers on power availability that they have even gone to the extent of changing
the acronym of ZESA from Zimbabwe Electricity Supply Authority to Zimbabwe
Electricity Sometimes Available (SW Radio Africa, 2011).
Most of the reported complaints from electricity consumers include unreasonable
bills sent to customers. Some bills as high as US $2 million were at one time
received by some domestic consumers and could possibly have arisen mainly from
continuous meter estimations that seem to go on forever as noted by the consumers.
Others have cited the non delivery of the bills with most consumers going for long
periods without being advised of their electricity dues which is not expected from any
reasonable supplier. Complaints have also been made on unfair load shedding.
Whilst the shortage of power has been widely publicised as a regional challenge and
many have had to accept the challenge, it is the manner of power allocation of the
available power which has irked many consumers.

3
Most complaints have cited long periods of load shedding going for as much as 8
hours to three days in some areas and these areas have been observed to be in the
high density suburbs. Consumers have also cried foul on power fault attendances by
ZESA staff as taking far too long with one cited area going with a fault for three
months unattended. On the other hand, the business community also complained of
unsustainable electricity tariffs.
It was on the basis of some of these consumer concerns that ZESA Holdings was
investigated by the Competition Tariff Commission (CTC) in 2011 which found ZESA
Holdings guilty of abusing its monopoly power particularly on services rendered
through ZETDC.
Research carried out by ZETDC titled “Customer Survey Monitor” in 2011, on
customer’s perception on some services offered by ZETDC in Harare region also
revealed increasing negative dispositions by customers on service delivery. The
details are illustrated in Figure 1.1.1
Figure 1.1.1 Harare Region Service Evaluation .Adapted from
ZETDC.”CUSTOMER SERVICE MONITOR HARARE REGION”. (2011)
a) Negative Opinions on Ratings b) Mean Opinion Ratings
0 %
20 %
40 %
60 %
80 %
100 %
B\Hall Rating
Timeliness
Service vs Charge
ChargePublic OpinionStaff
Upper Negative
Limit
30
40
50
60
70
80
90
M e a n P e r c en t
Banking Hall
Service Charge
Timeliness
4
Figure 1.1.1 shows that the latest survey findings (2011) show a heavy peaking of a
negative disposition on both “service vs. charges” and “public opinion” of ZETDC. In
other words, ZETDC public opinion in Harare Region in 2011 is disproportionately
influenced, in a negative manner, by perceptions of service charges – with a previously
isolated worst position of 36% in 2001. According to the survey, perceived inaccuracy
of meter readings, unpredictable timeliness of meter reading, negative perception of
staff courtesy all accounts for the greatest part of the negative outcome and, hence
partly, for the poor public opinion.
The survey, however acknowledged that excluded from considerations were other
significant factors contributing to customer service evaluation on ZETDC such as
power cuts and bill estimates. However the survey did take into account some positive
factors that were considered by customers and these included computerisation and
general customer care.
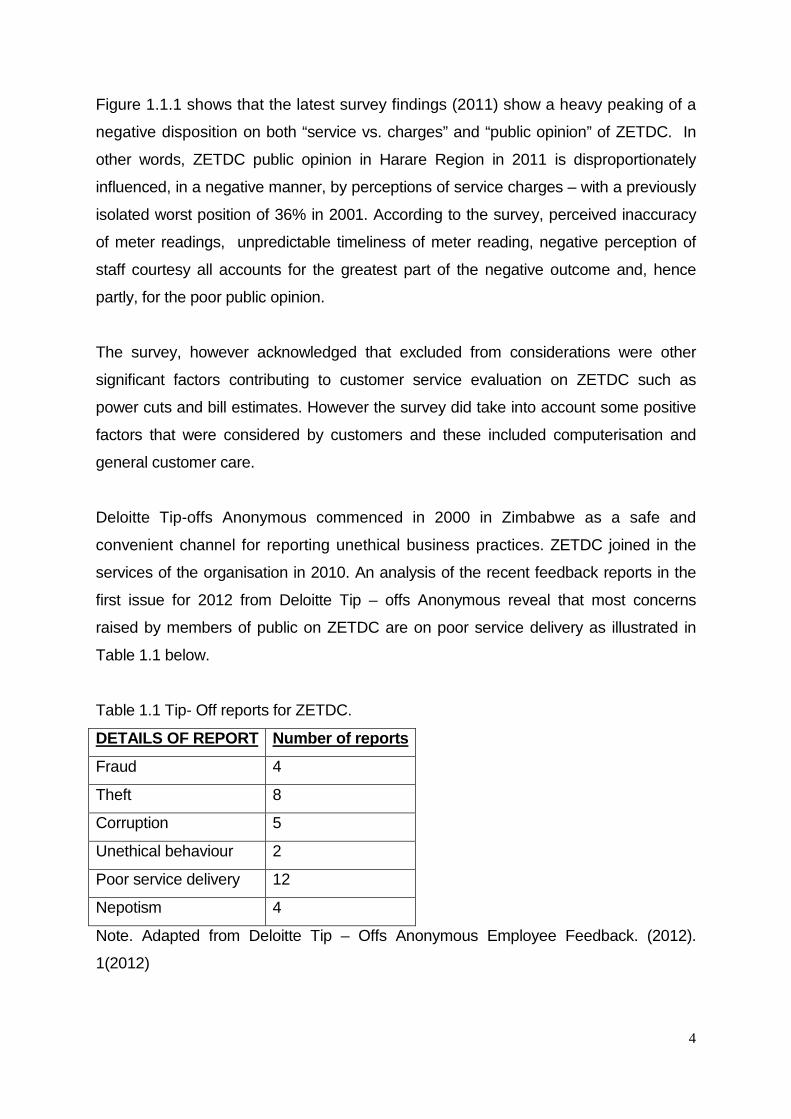
Deloitte Tip-offs Anonymous commenced in 2000 in Zimbabwe as a safe and
convenient channel for reporting unethical business practices. ZETDC joined in the
services of the organisation in 2010. An analysis of the recent feedback reports in the
first issue for 2012 from Deloitte Tip – offs Anonymous reveal that most concerns
raised by members of public on ZETDC are on poor service delivery as illustrated in
Table 1.1 below.
Table 1.1 Tip- Off reports for ZETDC.
DETAILS OF REPORT Number of reports
Fraud 4
Theft 8
Corruption 5
Unethical behaviour 2
Poor service delivery 12
Nepotism 4
Note. Adapted from Deloitte Tip – Offs Anonymous Employee Feedback. (2012).
1(2012)

5
Table 1.1 indicates that out of the 35 reports on ZETDC received in the first quarter in
2012, the majority of them,12 (34%) were on poor service delivery.
Furthermore, ZETDC the power distributer has had to ration the available inadequate
power through load shedding since 2007. However, in recent times (since 2009), it
has had to increase its load shedding frequency since power supply failed to meet
the increasing demand as highlighted in its load shedding programme. The load
shedding programme indicates that mostly residential areas will be without power
during the morning and evening peak periods. However, ZETDC has failed to
implement the load shedding as per schedule, a concern that has also irked
electricity consumers.
It is mostly when a company has collapsed or is in dire operational challenges that
questions begin to be asked as to what could have possibly gone wrong. Most
pointers will be in the direction of a breakdown in the system of internal controls and
this may not be far-fetched. In recent years, the relevance and objectives of Internal
Controls, have expanded far beyond the traditional ambit of protection against theft
and fraud, well into the areas of effectiveness, accountability and operational
efficiency of the organisation, hence the need for an evaluation of the system of
internal controls at ZETDC.
1.1.2 BACKGROUND TO THE COMPANY - ZETDC
Zimbabwe Electricity Transmission and Distribution Company (ZETDC), belongs to a
diversified group of companies whose core business is electricity generation,
transmission and distribution in Zimbabwe.
The Electricity Amendment Act Number 3 of 2003 provided for the setting up of a
company to hold shares of the state in the successor companies of the Zimbabwe
Electricity Supply Authority which company was registered under the Companies Act
[ Chapter 24;03] as ZESA Holdings (Private) Limited. The successor companies that
comprise the ZESA Holdings Group of companies are Zimbabwe Power Company
(ZPC), Zimbabwe Electricity Transmission and Distribution Company (ZETDC),

6
ZESA Enterprises and Powertel Communications. Each of the successor companies
is incorporated under the Companies Act (Chapter 24:03) and has its own board of
directors appointed by ZESA Holdings (Private) Limited as the shareholder. ZESA
Holdings (Private) Limited is the Holding company and is also run by a Board of
Directors. The company is wholly owned by the Government of Zimbabwe.
The Zimbabwe Electricity Transmission and Distribution Company (ZETDC) is a
subsidiary of ZESA Holding (Pvt) Ltd that is involved in the business of bulk
purchasing of electricity from power producers locally and regionally, transporting it
to load centres across the country for distribution and retail to end user customers.
Its major functions as highlighted on the ZESA website (2012) include : Electricity
retailing - Network planning, development, operation and maintenance -
Development, Operation and Maintenance of the transmission infrastructure within
Zimbabwe - Power System Operations - Bulk Power Purchases and System
Planning for Long Term Capacity.
ZETDC has its Head Office in Harare and Five regional offices in Harare (Harare
Region), Bulawayo (Western Region), Mutare (Eastern Region), Gweru (Southern
Region) and Chinhoyi (Northern Region). Each Regional office has several district
offices spread throughout the region stationed in city centres
CORE BUSINESS
Zimbabwe Electricity Transmission and Distribution Company (ZETDC) is mandated
in terms of the Electricity Act (Cap 13:09), to carry out the following activities which
are also outlined in its 2010 Annual report.
i) Transmission and Distribution Infrastructure Mai ntenance and
Development
The company develops, operates and maintains transmission and distribution
facilities within Zimbabwe. It receives power at 330 kilovolts (kv) from ZPC
(Zimbabwe Power Company)’ s Hwange, Bulawayo , Munyati and Harare Thermal
Power stations and Kariba Hydro-electrical Power station. It also gets import power

7
from Mozambique’s Carbora Bassa at 400 kv through the Bindura 330kv/132kv/33kv
substation.
Other regional power imports from South Africa’s Eskom and Democratic Republic of
Congo’s SNEL supplied at 420kv come through Insukamini Interconnector
Substation in Bulawayo.
It is this power which is then transmitted at high voltages of 330kv, 132kv, 88kv and
66kv to power users called load centres. Transmission lines span long distances with
the Kariba substation to Alaska substation (Chinhoyi) running more than 200
kilometres and Hwange substation to Marvel substation (Bulawayo) spanning 300
kilometres.
Before power is received by a consumer it has to be transformed to a lower voltage.
Voltage transformation is done at a substation using transformers. Power is
transformed from 330kv to 132kv and further down to 88kv and 33kv for distribution
to users.
Maintenance work involves the fixing, repairing and overhauling or servicing of the
physical assets which are the transformers, circuit breakers and the isolators. When
power supplies are lost due to a line that has fallen to the ground as a result of a
pylon which has collapsed, maintenance staff restores power by erecting a new
pylon or reconstructing the collapsed one.
ii) Electrical power system operations.
The company ensures that supply and demand match on a minute-by-minute basis.
ZETDC also monitors the power system and ensures safety of personnel and
equipment during switching operations of any equipment connected to the grid. This
may also be necessary to allow for maintenance of certain sections or for load
shedding purposes.

8
Due to the constrained power supply availability in Zimbabwe, ZETDC has had to
manage the demand side through load shedding and has continuously drawn a load
shedding programme for the various centres across Zimbabwe.
There are different load shedding programmes for the two distinct seasons in
Zimbabwe one for summer where power demand is comparatively low and one for
winter where power demand is high. According to a notice by ZETDC for 2010 Load
Shedding in the press (The Herald, 2010) essential services loads are exempted
from load shedding and these were classified as follows;
• Major Referral Hospitals
• Major Water and Sewer installations
• National security establishments
• Major airports
• Major Central business districts with high rise buildings
• Winter wheat farming belts to receive priority supplies.
Appendix 1.1.1A, Appendix 1.1.1B and Appendix 1.1.1 C shows the load shedding
programme during summer for 2010 and winter for 2012 for Harare region. On a
normal operations assumption taking the summer 2010 load shedding schedule,
each point on the schedule is shed during the morning peak period (between
0600hrs and 0800hrs) and during the evening peak period (between 1800hrs and
2200hrs). Consequently, each area should be shed a total of 22 hours weekly.
iii) Electricity Trading
The company purchases bulk electrical power from internal sources (Hwange, Kariba,
Harare, Munyati and Bulawayo Power Stations and Independent Power Producers) as
well as from neighbouring countries (Mozambique, Democratic Republic of Congo,
South Africa and Zambia) for sale to local consumers and also trading on the Southern
African Power Pool (SAPP).
However, ZETDC’s sources of power supply have remained depressed over the last
few years as a result of ZPC’s operational challenges coupled with regional supply
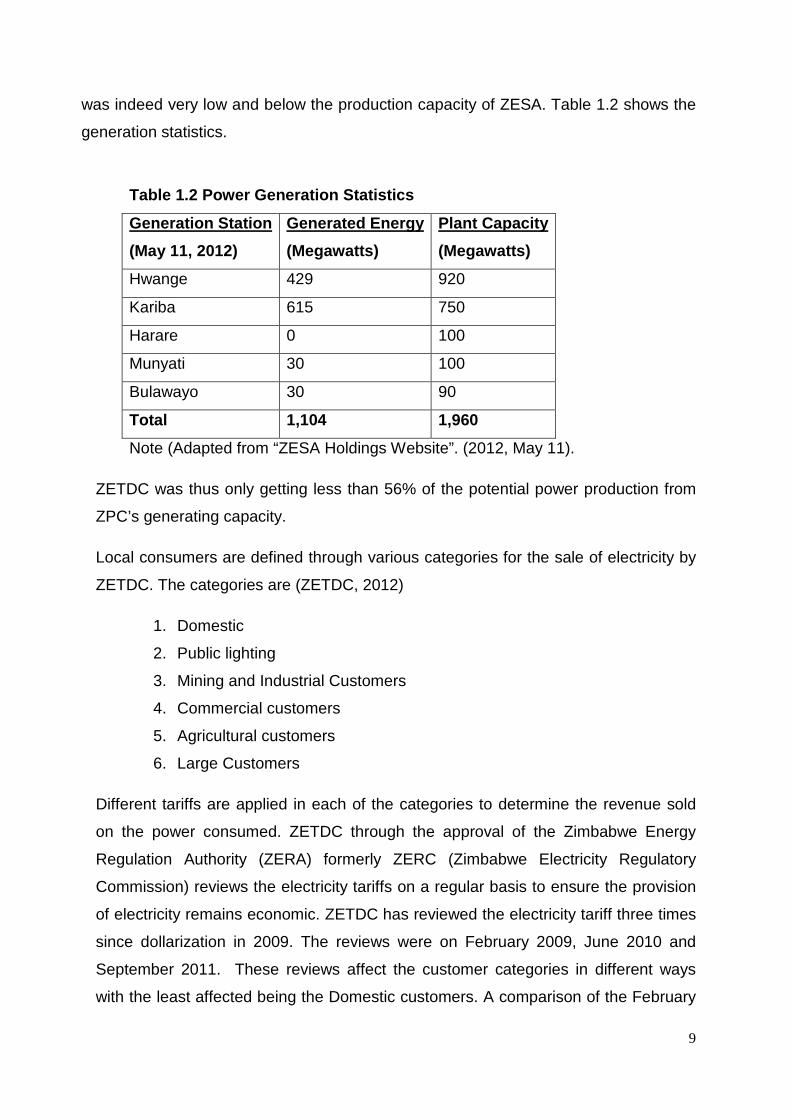
shortfalls. As at 11 May 2012, generation statistics showed that electricity production
9
was indeed very low and below the production capacity of ZESA. Table 1.2 shows the
generation statistics.
Table 1.2 Power Generation Statistics
Generation Station
(May 11, 2012)
Generated Energy
(Megawatts)
Plant Capacity
(Megawatts)
Hwange 429 920
Kariba 615 750
Harare 0 100
Munyati 30 100
Bulawayo 30 90
Total 1,104 1,960
Note (Adapted from “ZESA Holdings Website”. (2012, May 11).
ZETDC was thus only getting less than 56% of the potential power production from
ZPC’s generating capacity.
Local consumers are defined through various categories for the sale of electricity by
ZETDC. The categories are (ZETDC, 2012)
1. Domestic
2. Public lighting
3. Mining and Industrial Customers
4. Commercial customers
5. Agricultural customers
6. Large Customers
Different tariffs are applied in each of the categories to determine the revenue sold
on the power consumed. ZETDC through the approval of the Zimbabwe Energy
Regulation Authority (ZERA) formerly ZERC (Zimbabwe Electricity Regulatory
Commission) reviews the electricity tariffs on a regular basis to ensure the provision
of electricity remains economic. ZETDC has reviewed the electricity tariff three times
since dollarization in 2009. The reviews were on February 2009, June 2010 and
September 2011. These reviews affect the customer categories in different ways
with the least affected being the Domestic customers. A comparison of the February

10
2009 tariff review with the September 2011 indicate that on overage the price for the
domestic customer increased from US 7 cents to US 10 cents, a 43% increase.
The February 2009, June 2010 and September 2011 tariff reviews are indicated on
Appendix 1.1.2A, Appendix 1.1.2B and Appendix 1.1.2C respectively.
iv) Power System Planning
The company undertakes long-term supply and demand studies in order to develop a
national least cost System Development Plan that also takes cognisance of regional
developments. This involves identifying the need for new generating plants and
expansion of the grid to meet load growth and transfer power from new generation
plants to load centres.
v) Regional Cooperation
The company’s Transmission Division, as the Zimbabwe representative in SAPP, plays
a key role I n regional integration through its strategically positioned power grin that
provides critical links between Southern and Northern parts of the SAPP
interconnected power system. This makes the company the hub of transactions
between DRC, Zambia and Mozambique on one end and Botswana, South Africa,
Swaziland, Namibia and Lesotho on the other end. The wheeling services provided to
SAPP by the company facilitate electricity trading in the region.
The supply of power imports from SAPP has however remained restricted as the
SADCC region (Southern African Development Community) grapples with power
shortages. This, coupled with cash flow challenges, has seen ZETDC failing to obtain
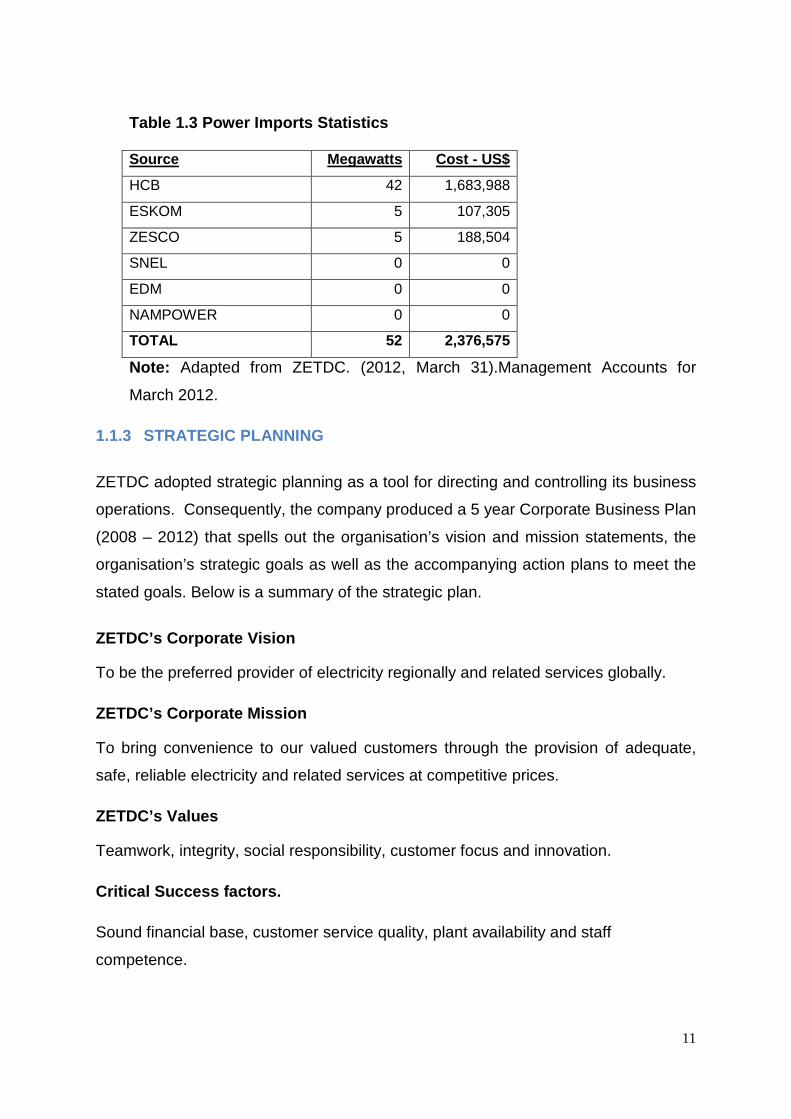
extra power from its neighbouring power utilities. The table 1.3 indicates the sources of
imports for ZETDC as at 31 March 2012.
11
Table 1.3 Power Imports Statistics Source Megawatts Cost - US$
HCB 42 1,683,988
ESKOM 5 107,305
ZESCO 5 188,504
SNEL 0 0
EDM 0 0
NAMPOWER 0 0
TOTAL 52 2,376,575
Note: Adapted from ZETDC. (2012, March 31).Management Accounts for
March 2012.
1.1.3 STRATEGIC PLANNING
ZETDC adopted strategic planning as a tool for directing and controlling its business
operations. Consequently, the company produced a 5 year Corporate Business Plan
(2008 – 2012) that spells out the organisation’s vision and mission statements, the
organisation’s strategic goals as well as the accompanying action plans to meet the
stated goals. Below is a summary of the strategic plan.
ZETDC’s Corporate Vision
To be the preferred provider of electricity regionally and related services globally.
ZETDC’s Corporate Mission
To bring convenience to our valued customers through the provision of adequate,
safe, reliable electricity and related services at competitive prices.
ZETDC’s Values
Teamwork, integrity, social responsibility, customer focus and innovation.
Critical Success factors.
Sound financial base, customer service quality, plant availability and staff
competence.

12
Core Competencies
The core competencies required in order to achieve the vision are strong technical
skills, sound financial management skills; professionalism, strong management
skills, and entrepreneurial skills.
ZETDC’s STRATEGIC BUSINESS OBJECTIVES
As outlined in its 2008 to 2012 business strategy, ZETDC has defined a set of
strategic objectives for its main functional business areas which are Transmission,
Distribution, Finance and Human resources. These are then translated into business
action strategies for Transmission, Distribution and Head Office. The strategic
objectives are listed as:-
• Financial Goals:
o Ensuring cost effective tariffs;
o Improving working capital;
o Improving financial management;
o Ensuring attainment of break-even point;
o Increasing revenue base and
o Ensuring revenue collection maximization.
• Customer Goals:
o Ensuring safe use of electricity;
o Improving Corporate Image;
o Improving customer communication;
o Improving availability of electricity to customers;
o Improving service delivery and customer satisfaction and
o Improving environmental management.
• Operational Goals:
o Improving system reliability;
o Improving productivity;
o Reducing accidents;
o Improving communication;

13
o Improving quality of supply and
o Improving operational efficiency.
• Human Capital Goals:
o Ensuring high employee productivity;
o Improving staff health and safety;
o Ensuring staff motivation and retention;
o Ensuring adequate and competent staff;
o Ensuring a good business culture and
o Ensuring a good industrial relations climate.
1.1.4 THE CONTROL ENVIRONMENT
1.1.4.1 ORGANIZATIONAL STRUCTURE
The organisational structure is made up of elements of the control systems logical
structure. The elements are the organisational units used to structure business
functions for reporting.
ZETDC is headed by a Managing Director who reports to the Group chief executive
officer at ZESA Holdings. There is also a board of directors at ZETDC the majority of
whom are non executive independent directors. The ZETDC Managing Director
heads an executive committee comprising the finance director, the commercial
director, the transmission services director, all at head office, and five regional
general managers for Harare, Western, Southern, Eastern and Northern Regions.
The regional managers overseer power distribution and revenue collection in each of
the regional centres in Zimbabwe through various district offices in their regions. An
internal audit unit at ZESA Holdings monitors the activities at ZETDC through regular
internal audits of all ZETDC centres and reports directly to the board audit
committee.
Each district is headed by a network manager responsible for the supply of power
and maintenance of the distribution networks and a sales manager responsible for
power sales and revenue collections.

14
1.1.4.2 APPLICATION SYSTEMS
The current internal control systems in ZETDC is characterised by fragmented
systems with varying degrees of business coverage and utilisation. (ZETDC I.T
Business Plan, 2009). This state of affairs is a result of limitations in data
communications facilities, partial implementation of some systems, high staff
turnover in user and IT departments as well as the amalgamation of ZETCO
(Zimbabwe Electricity Transmission Company) and ZEDC (Zimbabwe Electricity
Distribution Company).
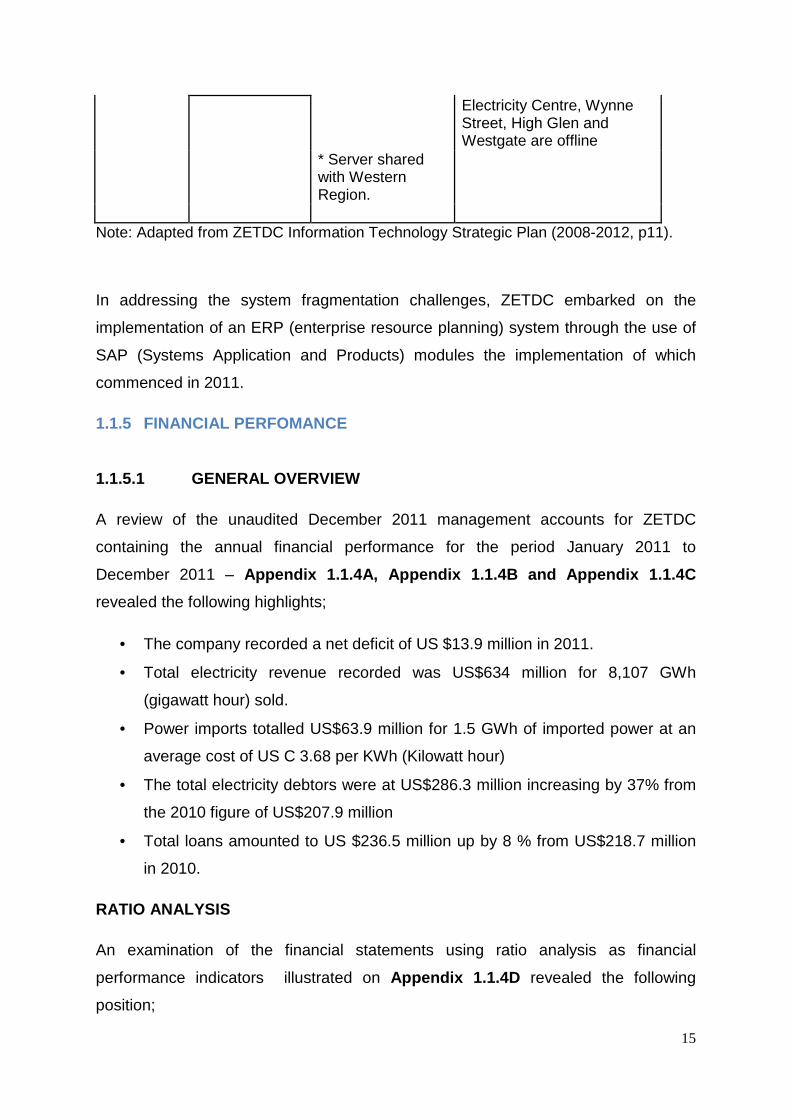
An overview of the current IT application systems currently in place at ZETDC head
office and Harare region is highlighted in table 1.4.
Table 1.4 ZETDC Application Systems
LOCATION APPLICATION PLATFORM COVERAGE ZETDC Head Office
SAP Financials Sun Solaris Both Distribution and Transmission at Head Office.
Finance Oracle database Control Sales and
Dist. * Server rented from Dexel and shared with Powertel.
Materials Management.
Harare Region
JBA Business/400
IBM OS/400 Entire Region where comms facilities are available.
General Ledger
DB2/400 database
Cash Book Purchase
Ledger * Dedicated AS/400 server.
Vision 2000 – Soluziona
Sun Solaris Entire Region where comms facilities are available.
IPMS Oracle database DCS Utilisation for MMS and IMS
almost at nil. MMS * Server shared
with Western and Southern as well as ZPC entities.
IMS
ICS - Soluziona Sun Solaris Entire Region where comms facilities are available.
Oracle database All Banking Halls except
15
Electricity Centre, Wynne Street, High Glen and Westgate are offline
* Server shared with Western Region.
Note: Adapted from ZETDC Information Technology Strategic Plan (2008-2012, p11).
In addressing the system fragmentation challenges, ZETDC embarked on the
implementation of an ERP (enterprise resource planning) system through the use of
SAP (Systems Application and Products) modules the implementation of which
commenced in 2011.
1.1.5 FINANCIAL PERFOMANCE
1.1.5.1 GENERAL OVERVIEW
A review of the unaudited December 2011 management accounts for ZETDC
containing the annual financial performance for the period January 2011 to
December 2011 – Appendix 1.1.4A, Appendix 1.1.4B and Appendix 1.1.4 C
revealed the following highlights;
• The company recorded a net deficit of US $13.9 million in 2011.
• Total electricity revenue recorded was US$634 million for 8,107 GWh
(gigawatt hour) sold.
• Power imports totalled US$63.9 million for 1.5 GWh of imported power at an
average cost of US C 3.68 per KWh (Kilowatt hour)
• The total electricity debtors were at US$286.3 million increasing by 37% from
the 2010 figure of US$207.9 million
• Total loans amounted to US $236.5 million up by 8 % from US$218.7 million
in 2010.
RATIO ANALYSIS
An examination of the financial statements using ratio analysis as financial
performance indicators illustrated on Appendix 1.1.4D revealed the following
position;
16
PROFITABILITY RATIOS
• Return on sales recorded a negative 2%. This means that sales are
generating a negative return in that from every dollar of sales 2 cents is lost.
• Return on total assets was at -0.013%. The assets are not getting a return for
their use. The company is losing 1 cent on every dollar of the assets.
• Return on capital employed was a negative .05%. An indication that 5 cents is
lost from every $1 invested into the company.
LIQUIDITY RATIOS
• The current ratio was 0.4. The company can only meet 40 cents from every
$1 on its current obligations. This is a far outcry from the standard
recommended ratio of 2 :1
• The quick ratio recorded 0.3. The liquid resources available to settle
immediate obligations are only 30 cents for every dollar owing. The standard
recommended ratio is 1:1
• Debtors collection period showed 278 days. The company is taking over a
year to collect money from its revenue. It is effectively funding other entities at
the expense of its own cash flows.
DEBT MANAGEMENT RATIO
• Debt to equity ratio was at 1.6. The company is heavily funded by outsiders in
that for every $1 that the shareholders own in ZETDC, $1.60 is owed to
creditors.
These highlights reveal that ZETDC made a huge loss from its operations and is
increasingly funding its debtors whilst borrowing heavily to keep operating. It is also
apparent that it cannot meet its current obligation. Its assets are under-utelised. This
scenario puts the company’s going concern perspective into questions.
1.1.6 SWOT ANALYSIS
A SWOT analysis (Strength, Weaknesses, Opportunities and Threats) is a valuable
tool to quickly analyse various aspects of the current state of the business process

17
undergoing change. It is a framework for strategic planning, opportunity analysis,
competitive analysis, business and product development (Brennan, 2009).
STRENGTHS
i. State owned – ZETDC is a government wholly owned state enterprise giving
it a distinct advantage in the influence of policies that can safeguard its
interest.
Furthermore, it is able to utilise government guarantees to access offshore
funding and also government is able to guarantee its going concern basis.
ii. Huge capital base – The asset base of ZETDC covers the geographical
spread of the entire country of Zimbabwe and even interlocks with
neighbouring power utilities. This enables ZETDC to reach as many
customers as possible with its national distribution grid. The nature and cost
of the asset base are a barrier of entry to possible competitors.
iii. Sole supplier – ZETDC currently enjoys a monopoly over the supply of
power emanating from the historical legal set up. This therefore means that it
currently has no competition except from fuel powered generators which
serve as a substitute in the event of ZETDC failing to supply.
WEAKNESSES
i. Aged infrastructure – The transmission and distribution assets were
installed in the 1960’s and are thus over 50 years old. This has consequently
resulted in frequent breakdown leading to a high number of faults in power
supply.
ii. Poor Image – As a result of the frequent power outages due to asset
breakdown and load shedding due to constrained supply, customers do not
have confidence in ZETDC. This has also been compounded by the
haphazard billing system, high power tariffs, poor workmanship on faults and
selective credit control policies on ‘political heavyweights’ leaving the
reputation of ZETDC in a battered state.
iii. High Cost structure – The aged asset infrastructure which is also very huge,
results in very high maintenance costs forcing ZETDC to operate at very high
levels of costs thus eroding profit margins.

18
OPPORTUNITIES
i. Unfulfilled customer needs – Many customers remain without power due to
ZETDC’s inability to connect all potential customers leading to some
customers illegally connecting themselves and thus existing outside of
ZETDC’s billing system.
ii. New Technologies – Prepaid meters are being installed in place of the
conventional meters . This will do away with estimated meter reading at the
same time providing advance cashflows eliminating electricity debtors.
iii. Privatisation – The possibility of ZETDC being privatised will give it the
impetus to operate on a more sound commercial basis drawing upon
investors to expand and maximise on revenue.
THREATS
i. Controlled tariff – The power tariff is regulated through control by ZERA
(Zimbabwe Energy Regulation Authority) . This means that ZETDC has no
total control over what it charges to the customer as this has to be determined
through ZERA. It cannot literally share most of its cost with the customer.
ii. Substitutes – The possibilities of gas found in Lupane being fully exploited
can result in many customers substituting electricity for gas for a competitive
price. Furthermore, subject to fuel prices declining, consumers can easily turn
to generators in the event that electricity tariffs become uncompetitive.
iii. Deregulation - The electricity industry is undergoing deregulation to allow
other private players to enter the industry. This may bring in competition which
ZETDC may be ill prepared to deal with.
1.1.7 PEST ANALYSIS
(i) POLITICAL AND LEGAL ENVIRONMENT
A government of national unity (GNU) was formed by the three popular political
formations in Zimbabwe in February 2009 following a condemned electoral process
in 2008. This is pending elections which are anticipated after the completion of a new
constitution which is under consideration. Ministerial positions are shared between
the political formations. A recently enacted indigenisation and empowerment act

19
which seeks to economically empower previously disadvantaged locals is under
implementation. The energy sector is partially liberalised and is regulated by a
statutory body the Zimbabwe Energy Regulation Authority (ZERA) which was set up
in October 2011.
These developments are likely to impact directly on the leadership and direction of
ZETDC itself being a state enterprise. Government policies have a direct bearing on
ZETDC being an essential utility service provider in terms of both tariff charges and
the electricity supply environment.
(ii) SOCIO –ECONOMIC ENVIRONMENT
There is a prevailing stable economic environment in Zimbabwe buttressed by a
steady economic growth which, according to the minister of finance, is focused to
grow by 9.4% in 2012 as outlined in the 2012 National Budget Statement (Ministry of
Finance Zimbabwe, 2012). Inflation was reported by Zimbabwe Statistical Agency
(ZIMSTAT) at 4% on year on year whilst the monthly inflation was at 0.2% during the
month of April 2012 (Zimstat, 2012). However, the country is experiencing a liquidity
crunch with most banks struggling to get any cash let alone issue loans and
government through the Reserve Bank of Zimbabwe adopted measures to improve
the situation in February 2012 (Reserve Bank of Zimbabwe, 2012). There are
currently no official statistics for the unemployment rate but experts have estimated it
to be at 95% per 2009 estimates (index mundi, 2012). Energy production is currently
depressed with only 1,200 megawatts available against a demand of 2,200
megawatt. (ZESA Megawatt bulletin, 2012). This has resulted in load shedding
across the country.
ZETDC as a utility service provider will need to balance expectations from the public
who largely depend on the services of the utility company for all their energy needs.
(iii) TECHNOLOGICAL ENVIRONMENT
Zimbabwe has moved with the rest of the world in adopting recent technological
advancements and ZETDC is no exception. Such technological advances have
demanded a lot of integration between technologies and between organisations. Bill
payment systems between banks and other organisations are now in high demand
using 4G (fourth generation) cell phone technologies. Technological integration

20
between systems technologies in various organisations is now vital and the
challenge faced by ZETDC towards this is great.
1.1.8 ZETDC’S INTERNAL CONTROL DEFICIENCIES
They are some recorded publicised cases at ZETDC where there have been
incidences of internal control deficiencies. The following cases highlight some of the
recorded publicised deficiencies.
Case 1 - US $3 million fraud
In September 2010 ZETDC lost over US $3 million to two workers of a Spanish
computer firm which it had contracted to develop new computer systems and render
technical assistance in its billing (Farawo, 2010). The two would enter false amounts
into the system on the pretext that a customer has paid up when in actual fact they
would have intercepted through collusion with some ZETDC staff the payment by the
customers and converted it to their own use. The money was supposed to be paid
to the company but the two allegedly concealed the offence by reducing amounts of
the bills in the system to zero using an unauthorised Harare BATCH, as a financial
programme in the national server. ZETDC suffered an actual prejudice in the sum of
US$3,635,927.59 and nothing was recovered.
Case 2 - Reconnection scam
The Chronicle on 17 February 2012 reported that ZETDC could be losing thousands
of dollars in electricity bills by consumers who were either deleted from the billing
system or had their power fraudulently reconnected. ((ZESA unearths reconnection
scam, 2012)). The power utility had unearthed a scam in which some of its
employees were prejudicing the company by either deleting some consumers from
the system or were reconnecting defaulters and getting paid kickbacks.
Case 3 - Ministers’ ZESA scandal
ZETDC was reportedly failing to collect money from high ranking government
officials for electricity bills owing and was also not disconnecting them. According to
Newsday of 14 February 2012, (Langa, 2012 ), cabinet ministers, senior civil
servants and MPs were bleeding the Zimbabwe Electricity Supply Authority (ZESA)
dry by refusing to pay electricity bills at their private properties and using political
21
muscle to avoid being switched off. Some of the officials named who were owing
very huge amounts included the Manicaland governor, whose outstanding bill was
US $145 000, and Secretary for Energy and Power Development who owed
US$20 000 among several high ranking government officials also named in the
report. At the time the power utility was owed US$537 million by both its industrial
and domestic customers highlighting ZETDC’s poor debt management.
Case 4 - Inaccurate electricity bills sent to custo mers
Incidence of suspiciously erroneous electricity bills that were received by some
customers was noted by the Newsday (Mapimhidze, 2012). The report highlighted
incidences of inaccurate bills sent to customers by the power utility. In July 2011, a
tenant in Harare’s Avenues area received a US$5 bill for a month’s uninterrupted
supply of electricity whilst a tenant in the adjacent flat even rejoiced more for not
paying for the power he used because his apartment number did not appear in
ZESA’s database at all! In another case, a company executive received a US$5,000
bill and ZESA employees threatened to discontinue supplies if he failed to pay. It
was reported that the man had to pay an officer at the power utility US$100 to “sort
out the mess”.
Case 5 – ZESA Boss Fired
In September 2010, ZETDC fired its then managing director Mr Ernest Muchayi for
helping himself to a US $25,000.00 loan and paying out unsanctioned allowances to
top managers (Zesa Boss fired, 2010).
Case 6 – ZETDC accounts qualified
The external auditors who conducted an audit of ZETDC’s accounts for the financial
period 2010 did not agree with ZETDC’s valuation of its revenue. The auditors
therefore qualified the accounts on the basis that part of ZETDC’s revenue (US $3
million) was based on estimates which could not be conclusively verified (ZETDC
Annual Statements 2010)
The above cases serve to highlight the magnitude of the loopholes that exist at
ZETDC that put the company into perspective on its ability to self regulate and
safeguard its service delivery without compromising on quality.

22
1.2 PROBLEM STATEMENT
The introduction of the multicurrency system in 2009 which curbed the spiralling
inflation was a relief to the Zimbabwean economy which had been battered and
bruised by the record galloping inflation over the last three years. After so many
excuses for poor performance premised on the lack of foreign currency, ZETDC was
expected to show signs of service improvement with the improving economy as was
the case with most Zimbabwean companies, commencing 2009. However,
electricity customers remain sceptical on the services obtaining from ZETDC.
Electricity Bills are fraught with many errors, bill estimations continue unhindered,
load shedding continues outside the advertised schedules, power tariff are increased
on a regular interval, many customers remain outside of the billing system and
continue to enjoy free electricity. Reports of the company’s staff involvement in
abuse and prejudice of company resources continue to surface, and the company
continues to record losses in its annual accounts. All these issues point to a
systems failure within the organisation. ZETDC is the sole essential power utility
service provider in Zimbabwe and any failures on its part has a consequence on the
entire economy of the country. Whilst the final service delivery is evident, as in
services obtaining, it became apparent that the internal processes that give rise to
these unpalatable services needed some interrogation in order to fully comprehend
ZETDC’s commitment to service delivery. Why is ZETDC continuing in failing its
customers? Does ZETDC have a control mechanism of ensuring good quality
service? What needs to be answered is an assurance on whether the public can
place reliance on ZETDC and its ability to self correct the apparent deficiencies that
continue to clog it. Furthermore, management need to be assisted in identifying
areas of concern within their processes in order for the company to obtain the best
value and plug off the unpalatable services reaching the customers.
The research therefore seeks to evaluate the control systems in ZETDC and their
influences on the services obtaining from the utility company to the public customer.
1.3 RESEARCH OBJECTIVES
In pursuance of the above problem, the research therefore attempts to pursue the
following objectives;
23
PRIMARY OBJECTIVE
1.3.1 The primary objective of this research is to evaluate the internal control
systems in ZETDC
SECONDARY OBJECTIVES
1.3.1 To explore the effects of internal control breaches in ZETDC on
service delivery
1.3.2 To assess the influence of the internal control system on service
delivery
1.3.3 To identify challenges in implementing the internal control systems
1.3.4 To recommend ideal internal control practises
1.4. RESEARCH QUESTIONS
The research will seek to answer the following vital questions;
1.4.1 What are the internal control systems in ZETDC?
1.4.2 What are the effects of internal control breaches in ZETDC?
1.4.3 How is service delivery affected by the internal control systems?
1.4.4 What problems are faced in implementing internal control systems?
1.4.5 What can be done to improve the internal control systems?
1.5 RESEARCH PROPOSITION
The study maintains that ZETDC has an ineffective internal control system that has
resulted in poor service delivery.
1.6 SIGNIFICANCE OF THE STUDY
There is significantly little research that exists evaluating the internal controls that
ultimately give rise to the final products of companies more so at ZETDC, a vital
utility service provider in Zimbabwe. Management are increasingly facing
responsibilities through corporate governance pressure, to evaluate internal controls
and assess the potential risks.

24
The study intends to extend the knowledge of internal control systems, which is
established as an effective management tool through which an organisation
enhances its performance. The research will explore the essential elements of a
sound internal control system, drawing upon experience in established situations.
The significance of the research is to outline a number of principles for use by
supervisory authorities when implementing internal control systems. The study will
also assist in obtaining the internal control environment existing in ZETDC for the
sake of all stake holders, chief among them electricity customers. Furthermore,
researchers will benefit on possible further areas of study that may need more
probing.
1.7 SCOPE OF RESEARCH AREA
The Sampling Frame for the study will be ZETDC and the focus will be the period
existing from January 2009 and thereafter to 2012. This study will only address the
function of an internal control system in relation to commercial activities. Although
engineers also need to evaluate an internal control system in terms of its
effectiveness in assuring reliable operations, this is not the concern of this study.
1.8 DISSERTATION OUTLINE
There are five chapters in this study
Chapter 1
Gives the introduction and background to the study as well as outlining the area of
study. Also in this chapter is the problem statement, research objectives, questions,
scope and justifications of the study.
Chapter 2
Outlines the literature review on internal control systems defining and giving
concepts and basis on internal controls as well as challenges. It is the theoretical
framework of the study that draws conclusions from authoritative sources on internal
control systems.
Chapter 3
25
States the methodology for the research including the research design, sample
frame and the research instruments for the study as well as justification for the
research design.
Chapter 4
Presents and analyses results of the study as well as interpreting the findings there
of in relation to the underlying basis. Gives answers to the research questions.
Chapter 5
Concludes on the findings giving practical recommendations and areas needing
further studies
1.9 CHAPTER SUMMARY
In this chapter the events leading to the study were introduced. The overall subject of
study was also introduced and details outlined culminating in the problem statement
which was stated. Five objectives where identified and matched to the requisite
research questions. Also clearly stated was the research hypothesis and the
significance and justification of the study. The underlying scope was defined and the
overall research structure was outlined.

26
CHAPTER 2
LITERATURE REVIEW
2.1 INTRODUCTION
This chapter will demonstrate the theoretical framework of the study as highlighted
by various authors. The importance of literature review as explained by Dawidowicz
(2010) is to examine scholarly information and research based information to acquire
understanding of the topic under study of what has already been done, how it was
researched, and the key issues involved. The chapter seeks therefore to lay the
theoretical foundation of the study. The literature review will attempt to expose the
related areas that have not been explored significantly enough to draw conclusions.
2.2 INTERNAL CONTROL SYSTEM
2.2.1 WHAT IS AN INTERNAL CONTROL SYSTEM?
The current issue of the CPA (Certified Public Auditor) Exam review by Delaney and
Whittington (2012) define internal controls using the widely accepted American
Committee of Sponsoring Organizations of the Treadway Commission (COSO)
framework. This framework defines internal control system as noted by Chambers
and Rand (2011), as a process effected by the entity’s body of directors,
managements, and other personnel designed to provide reasonable assurance
regarding the achievement of objectives in the category of reliability of financial
reporting, effectiveness and efficiency of operations and compliance with applicable
laws and regulations.
A similar approach is followed by Collier and Agyei- Ampomah (2009) who define
internal control system as including all policies and procedures adopted by the
directors and management of an entity to assist in achieving their objectives of
ensuring , as far as practicable, the orderly and efficient conduct of a business
including adherence to internal policies, the safeguarding of assets, the prevention
and detection of fraud and error, the accuracy and completeness of the amounting
records and the timely preparation of reliable financial information.

27
A more comprehensive definition of internal control systems is the one by Menzies
(as cited in Mooler, 2008), who defines internal control systems as consisting of
regulations for the guidance of company activities (internal guidance systems) and
regulations for the supervision of these regulations (internal supervision system). He
however notes further that the internal supervision system consist of process-
integrated and not process oriented supervision activities.
Hopkin (2012) summarises definition from some of the major accounting bodies as
depicted in the table 2.1.
Table 2.1 - Definitions of Internal Control
ORGANISATION DEFINITION OF INTERNAL CONTROL SYSTEM
COCO (Criteria of
Control)
All the elements of an organisation that, taken together,
support people in the achievement of the organisation’s
objectives. The elements include resources, systems,
processes, culture, structure and tasks.
COSO A process, effected by an entity’s board of directors,
management and other personnel, designed to provide
reasonable assurance regarding the achievements of
objectives in the following categories;
• Effectiveness and efficient of operations
• Reliability of financial reporting
• Compliance with applicable laws and regulations
IIIA (Institute of
Internal Auditors)
A set of processes ,functions, activities sub systems ,and
people who are grouped together or consciously segregate to
ensure the effective achievement of objective and goals
Note; Adapted from Fundamentals of risk management: Understanding evaluating,
and implementing effective risk management (2nd Edition). (p.334). Hopkin. (2012).
Great Britain. Kogan Page Publishers.
It can be summed up that from the definitions in table 2.1 by Hopkin (2012) that
internal control system includes internal control activities and the structure and
responsibilities that relate to them.
28
The purpose of which is to enable directors to drive the organisation with confidence
in both good and bad times, safeguarding the organisation’s resources and ensuring
adequacy of records and systems accountability.
2.2.2 ELEMENTS OF INTERNAL CONTROL
Graham (2010) notes that the COSO internal control framework identifies five
components of internal control:
i. Control environment
ii. Risk assessment
iii. Control procedures
iv. Information and communication
v. Monitoring
This view is also supported by Delaney and Whittington (2012) who contend that
internal controls can be viewed as including five components mentioning those
alluded to in the COSO framework. Warren (2012) notes that elements of internal
control form an umbrella over the business to protect it from control threats. He
identifies five internal control elements that aim at achieving the internal control
objectives which tallies with those of Delaney and Whittington (2012) and the COSO
framework as noted by Graham (2010), as the control environment, risk assessment,
control procedures, monitoring, and information communication.
i) THE INTERNAL CONTROL ENVIRONMENT
The purpose of the internal control environment is to ensure consistence responses
to risks that materialises (Hopkin, 2012). Warren (2012) adds that the internal control
environment is the overall attitude of management and employees about the
importance of internal controls. On the other hand Hopkin (2012) describes it taking
from the COSO framework viewpoint as a measure of the risk culture within the
organisation whereas Rittenberg, Johnstone and Gramling (2011) sees it as referring
to the overall governance of the organisation starting by the tone developed at the
top level of the organisation.
29
However, Hightower (2008) views the internal control environment as including
statements that define and/or reinforce the tone from the top expressing value to the
company and authority to act. She emphasises that senior leadership within the
company must ensure there are suitable and consistent activities to support the
control environment such as communication, providing adequate resources and
time to implement, and holding process owners accountable and responsible for
process outcomes.
II) RISK ASSESSMENT
Understanding and management of the risk environment is a basic element of the
internal control foundation, and an enterprise should have a process in place to
evaluate the potential risk that may impact attainment of its objectives (Moeller,
2009). In making reference to the COSO framework Moeller (2009) describes risk
assessment as a three step process beginning with 1. Estimation of the significance
of the risk. 2. Assessing the likelihood or frequency of the risk occurring and 3.
Considering how the risk should be managed and assessing what actions must be
taken. (p. 39). Put differently Leitch (2008) notes that the objectives of risk control
are simply two fold. 1 to help people take off their mental blinkers and see the true
range of possibilities they face and 2, to help people behave competently in a way
that is consistent with that wider view.
III) CONTROL ACTIVITIES
Control activities are indicated as the policies and procedures that help ensure that
management directives are carried out (Dauber, 2009). They help ensure that the
necessary actions are taken to address risks to the achievement of the entity’s
objectives. However Hightower (2008) views control activities as specific actions
designed to produce evidence in support of the control objectives indicating that this
may include some or all of the following techniques:
• Self assessments performed by process owners using predefined self
assessment or audit readiness checklist
• Walk-through and observations performed by peer groups and/or internal
control representatives.

30
• Monitoring preformed by management and/or submitted to internal control for
review
• Reconciliation between source data and reporting records including period to
period roll forward and period over period analysis.
• Testing performed by management and internal control representatives using
statistical or random sampling techniques.
• Quarterly sub certification submitted by executive leadership, process owners
and selected business area executives attesting to compliance with company
policies, procedures, and internal control requirements.
• Remediation of action items resulting from internal control and internal audit
reviews.
(p. 45)
IV) INFORMATION COMMUNICATION
Needles, Powers, and Crosson (2010) view information communication as pertaining
to the accounting system established by management, to the way the system
gathers and treats information about the company’s transaction and how it
communicates individual responsibilities within the system. They argue that
employees must understand exactly what their functions are. This is aptly summed
up by Vilsanoiu and Serban (2010) whose view is that information and
communication requires that financial reporting information should have reliability
and should be communicated in a timely and accurate manner to managers and
decision makers. A more comprehensive view is proffered by Heintz and Parry
(2010) who contend that Information and communication system is the set of
procedures, processes and records used to initiate, process, record and report the
business transactions.
V) MONITORING
As internal control process is implemented, management should monitor the
operation of controls to provide assurance that all five components continue to
operate effectively (Rittenberg, Johnstone and Gramling, 2011). Ramos (2008)
emphasises that ongoing and separate evaluations enable management to
determine whether internal control over financial reporting is present.
31
He argues that internal control deficiencies are identified and communicated in a
timely manner to those partied responsible for taking corrective action, and to
management and the board as appropriate.
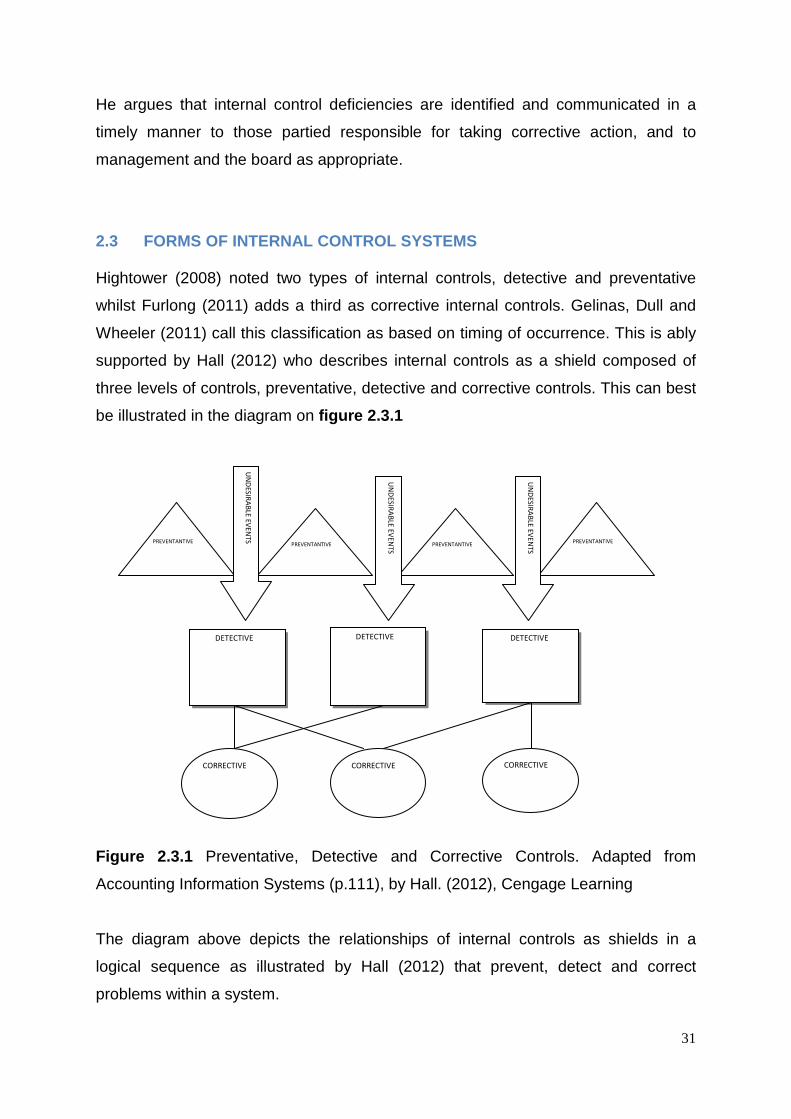
2.3 FORMS OF INTERNAL CONTROL SYSTEMS
Hightower (2008) noted two types of internal controls, detective and preventative
whilst Furlong (2011) adds a third as corrective internal controls. Gelinas, Dull and
Wheeler (2011) call this classification as based on timing of occurrence. This is ably
supported by Hall (2012) who describes internal controls as a shield composed of
three levels of controls, preventative, detective and corrective controls. This can best
be illustrated in the diagram on figure 2.3.1
Figure 2.3.1 Preventative, Detective and Corrective Controls. Adapted from
Accounting Information Systems (p.111), by Hall. (2012), Cengage Learning
The diagram above depicts the relationships of internal controls as shields in a
logical sequence as illustrated by Hall (2012) that prevent, detect and correct
problems within a system.
PREVENTANTIVE PREVENTANTIVE
PREVENTANTIVE
PREVENTANTIVE
DETECTIVE DETECTIVE DETECTIVE
CORRECTIVE CORRECTIVE
CORRECTIVE
UN
DE
SIR
AB
LE E
VE
NT
S
UN
DE
SIR
AB
LE E
VE
NT
S
UN
DE
SIR
AB
LE E
VE
NT
S

32
2.3.1 PREVENTANTIVE CONTROLS
According to Hall (2012), preventative controls force compliance with prescribed or
desired actions and thus screen out aberrant events. He notes that when designing
internal control systems an ounce of prevention is most certainly worth a pound of
cure. Both Hightower (2008) and Furlong (2011) agree that these are controls that
are put into place to keep errors and irregularities from happening as simply stated
by Gelinas Jr, Dull and Wheeler (2011), that they stop problems from occurring.
Furlong (2011) further alludes to the fact that while detective controls usually occur
irregularly, preventative controls occur on a regular basis. He gives examples that
range from locking the building before leaving to entering a password before
completing a transaction. Other preventative controls noted by Furlong (2011)
include testing for clerical accuracy, backing up computer data, drug testing of
employees, employee screening and training programs, segregation of duties,
enforced vacations, obtaining approval before processing a transaction and having
physical control over assets (locking money in a safe, for example).
Hopkin (2012) emphasises separation of duties as a preventative control where no
one person is not permitted to act without the consent of another when paying an
invoice. He notes that expenditure systems should prevent the same person from
ordering goods and then authorising the payment for them.
On the other hand Cannon (2011) adds that preventative controls would also include
administrative policy with technical protection and physical signs or barriers.
One main advantage of preventative controls as noted by Hopkin (2012) is that they
eliminate the hazard so that no further consideration of it is required.
2.3.2 DETECTIVE CONTROLS
Most authors agree that detective controls are designed to find errors after they have
occurred. Hightower (2008) and Furlong (2011) further allude to the fact that such
controls serve as part of a checks-and-balances system and also determine how
efficient policies are. Stewart, Tittel and Chapple (2011) describe detective controls
as a security mechanism used to verify the success of directives and preventative
controls. They describe them as actively searching for both violations of the security
policy and actual crimes, identifying attacks and errors so that appropriate action can

33
be taken citing audit trails, logs ,closed circuit television (CCTV), intrusion detection
systems and password crackers as examples., Furlong (2011) cites examples such
as surprise cash counts, taking inventory, review and approval of accounting work,
internal audits, peer reviews, and enforcement of job descriptions and expectations.
Coderre (2011) adds that the main feature of a detective control is the comparison of
what happened with what was supposed to happen. A vital point to note is that
detective controls do not prevent a problem from happening but instead, triggers an
alarm after the problem has happened Cendrowski and Mair (2009).
A sample of examples of procedures that can be classified into preventative, and
detective controls is highlighted by Hightower (2008) as depicted in the table 2.3.
Table 2.3.– Preventative and Detective Procedures
Type of Control Preventive
/Detective
Compliance with laws, GAAP, and company policies and
procedures
Detective
Compliance with company policies and procedures Detective
Compliance with contract terms and conditions Detective
Authorised and approved transactions Preventative
Payments paid and recorded Preventative
Payments received , deposited and recorded Preventative
Transactions recorded Preventative
Disclosed Detective
Reviewed Preventative
Reconciliation Detective
Integrity Preventative
Accuracy Preventative
Completeness Preventative
Timeliness Preventative
Segregation of duties Preventative
Safeguarding assets Preventative
Note. Adapted from Internal Controls, Policies and Procedures (p.44), by Hightower.
(2008). John Wiley and Sons.
34
2.3.3 CORRECTIVE CONTROLS
Corrective controls are actions taken to reverse the effects of detective errors Hall
(2012). On the other hand, Stewart, Tittel and Chapple (2011) identifies them as
instructions, procedures or guidelines used to mitigate the effects of an unwanted
activity such as attacks and errors. Simply stated by Gelinas Jr, Dull and Wheeler
(2011), they rectify problems that have occurred. Examples include manuals,
procedures, malware clean up and incident handling.
Hopkin (2011) articulates that corrective controls are the next options after it has
been decided that preventative controls are not technically feasible, operationally
desirable or cost effective.
The advantages of many corrective controls as noted by Hopkin (2011), is that they
can be simple and cost effective. They also do not require that existing practises are
eliminated or replaced with alternative methods of work. However, the major
disadvantage is that the marginal benefit that are achieved may be difficult to
quantify or conform as cost effective Hopkin (2011).
2.3.4 OTHER FORMS OF INTERNAL CONTROLS
Chambers and Rand (2011) are of the view that internal control can be classified by
control by division with supervision. They argue that this view of internal control
counsels that we should endeavour to achieve effective control by means of
judicious divisions of various sorts insisting that where adequate controls have been
achieved by divisions then we should rely to a greater extent on supervision
(Chambers and Rand, 2011).
However, Waymire (2008) classifies internal controls through internal and external
mechanism that may be employed to align the conflicting interest of managers,
shareholders and other stakeholders. He describes internal control mechanisms as
those that organisationally based and external control mechanism as those that are
market based or regulatory in nature.
He however notes that he does not understand the relationship among the various
forms of internal and external control mechanisms.
35
2.4 FRAMEWORK FOR EVALUATING INTERNAL CONTROLS
2.4.1 THE COSO FRAMEWORK
The Committee of Sponsoring Organisation of the Treadway Commission (COSO) is
a joint initiative of five private sector organisations in America which include
American Accounting Association, American Institute of CPAs’, Financial Executive
International, The Association of Accountants and Financial Professionals in
Business and The Institute of Internal Auditors (COSO, 2012) The Framework of the
Sponsoring Organisation of the Treadway Commission (COSO) introduced the
framework “Internal Control – Integrated Framework” in 1992 to support companies
and other organisations to assess and improve their internal control systems
(German Institute for Administrative Audit and Gallegos et al as cited by Moller
(2008)). Moeller (2011) observes that over the years the COSO internal controls
framework has become the worldwide guidance standard for defining, describing,
and assessing internal controls.
Bizmanualz (2008) observes that the COSO framework describes the internal control
as a process that provides reasonable assurance of organisational achievements in
processes. Amudo and Inanga (2008) identifies these processes more as primary
objectives of COSO and list them as;
• Effectiveness and efficiency of operations
• Reliability of financial reporting
• Compliance with applicable laws and regulations
In support of these processes, Rittenberg, Johnstone, and Gramling (2011) argue
that these processes are designed to assist the organisation in achieving one of its
most important objective, which is successfully implementing corporate strategies to
achieve returns for shareholders.
Burke, Guy, andTatum (2008) also observe that the COSO framework articulates
key points in the internal control definition which are;
• Internal control is a process. It is a means to an end, not an end in itself.

36
• Internal control is effected by people. It is not merely policy manuals and
forms but people at every level of the company.
• Internal control can be expected to provide only reasonable assurance, not
absolute assurance, to a company and its board of directors.
• Internal control is geared to the achievements of objectives in one or more of
the three separate but overlapping categories – financial reporting,
compliance and operations.
• Adaptable to the entity structure
(p.11.03)
The COSO frameworks notes that supporting the organisation in its efforts to
achieve its objectives are five components of internal control (COSO Internal Control
Integrated Framework, 2011) .The five dimension were depicted in the COSO
internal control cube as noted by Vilsannoiu and Serban (2010) illustrated in Figure
2.4.1
Figure 2.4.1 The COSO Internal Control Cube. Adapted from “Changing
Methodologies in Financial Audit and Their Impact on Information Systems
Audit, by Vilsanoiu and Serban, (2010). Information Economica, 14, p. 61
According to the COSO framework, a direct relationship exists between objectives
which are what an entity strives to achieve, the components, which represents what
37
is needed to achieve the objectives and the operating units, legal entities, and other
structures within the entity (COSO Internal Control Integrated framework, 2011).
Bizmualz (2008) also concurs that the COSO five components that create a
framework for internal control must all be in place to some degree for an internal
control system to be effective. The components include the control environment, risk
assessment, control activities, communication and information and finally monitoring.
COSO’s five internal control components have also been adopted over time by
various frameworks which includes Rutteman, Turnbull, the SEC (Security
Exchange Commission), PCAOB and many more others (Chambers and Rand,
2010) as the criteria to be used to assess internal control effectiveness.
The COSO framework describes the control environment as the foundation for all
other components of internal control, noting that it is the board and senior
management who establish the tone from the top regarding the importance of
internal control and expected standards of conduct. Risk assessment is
acknowledged as a dynamic and interactive process for identifying and analysing
risks to achieve the entity’s objectives, forming a basis for determining how risks
should be managed. On control activities the COSO framework depicts them as
actions established by policies and procedures to help ensure that management
directives to mitigate risks are carried out. Information and communication is
portrayed in the COSO framework as occurring both internally and externally and
enables all personnel to understand internal control responsibilities and their
importance to the achievements of objectives. On the other hand monitoring
activities are considered ongoing, separate evaluations or some combination of the
two used to ascertain whether each of the five components of internal control are
present and functioning (COSO Internal Control Integrated Framework, 2011).
The COSO framework also acknowledges the limitations of internal controls which
result from the quality and suitability of objectives, human judgement frailties in
decision making, cost versus benefit decisions, human failures, collusions between
people and management overrides.
The COSO framework thus concludes that these limitations preclude the board and
management from having absolute assurance of the achievements of the entities
38
objectives that is, controls provide reasonable but not absolute assurance. (COSO
Internal Control Integrated Framework, 2011).
COSO has decided to review its internal control framework as noted by Tysiac
(2012), who reports that COSO recently postponed release of its updated internal
control framework until the first quarter of 2013. The reasons according to the COSO
chairman, was to allow time to consider issues that were raised and the substance of
the comment letters raised by contributors to the exposure draft.
2.4.2 CRITICISM OF THE COSO FRAMEWORK
The COSO model has been criticized for failing to prevent the frauds and
restatements seen over the last decade (Lindorff, 2012). Tim Leech the managing
director of Canadian Consultancy Risk Oversight was quoted by Lindorff (2012) as
being sceptical and viewed the framework as too limited in scope and failing to deal
with forward risk. Lindorff (2012) also quotes Carol Fox the director of strategic and
enterprise risk practise at the Risk and Insurance Management Society as saying
that the framework does not look at past things that have an auditable line and also
does not look at the links that could lead to risks.
In their COSO survey report Beasley, Branson and Hancock (2010) found out that
most respondents believed that the COSO framework was overly theoretical. About
a quarter (26.5%) responded significantly to the perception that the COSO
framework contains overly vague guidance. 26.4 % believe that the depicted cube is
unnecessarily complicated and causes negative reaction to the COSO framework.
2.5 THE IMPORTANCE OF INTERNAL CONTROL SYSTEMS
If organisations are to be successful, as observed by Heitz and Parry (2010),
management must have adequate control of the operations of the business such that
records of business activities are reliable and timely, as a source of information for
decision making.
In United States of America Huang (2009) notes that firms are mandated to comply
with the Sarbanese- Oxley Act.
The law stipulates that management of an organisation is required to produce an
internal control report that affirms the responsibility of management for establishing

39
and maintaining an adequate internal control structure and procedures for financial
reporting.
On the other hand, Mulli and Ali (2011) notes that internal control systems have
continued to be a major concern in governance and this importance has been
magnified in the recent years due to global increase in financial scandals and
malpractices. Reports by various watchdog organisations have continued to serialize
massive financial frauds and malpractices in organisations despite having internal
controls in place. Leitch (2008), contends that internal controls is a process designed
to provide reasonable assurance as to achievement of controls in three areas of
effectiveness and efficiency of operations, reliability of financial reporting and
compliance with applicable laws and regulations. This is supported by Trenerry
(2009) who believes that a study of internal controls requires a study of the total
business environment. He contends that an organised and correctly constructed
system will have internal controls that check and confirm the operations of other
internal controls. Rittenberg, Johnston, Gramling and Schwieger (2009) add that the
quality of internal controls over financial reporting is an important part of an
organisation’s commitment to good governance.
The importance of internal controls in America has been highlighted by the
development of a broad integrated framework of internal control by the Committee of
Sponsoring Organizations of the Treadway Commission (COSO), which sought to
provide guidelines for creating, adapting and monitoring systems of control (Agbejule
and Jokipii, 2008). As recent as January 2012 COSO had issued an exposure draft
seeking comments on an updated internal control framework designed to help
organizations perform with efficiency and confidence (Tysiac, 2012). Mooler (2010)
believes that COSO can be considered the Master Framework of Internal Control
Systems because of its all encompassing of internal control issues. Internal control
frameworks are chosen to explain internal control: through them, important elements
of control and its relationships can be understood.
On the contrary, in other countries such as Canada, Hai, Gordon and Steven (2011)
notes that public disclosure about effectiveness of internal control systems is subject
to much controversy, resulting in Canadian disclosures being made in Management
40
Discussion and Analysis (MDandA). These disclosures are provided to investors
without a definition of the weaknesses to be reported, without implementation
effectiveness testing, with no direct management certification, and with no external
audit of such disclosures.
However, Hopkin (2012) concludes that the primary purpose of internal control
activities is to help the organisation achieve its objectives. He argues that the
purpose of internal controls are as follows:
• Safeguard and protect the assets of the organisation;
• Ensure the keeping of accurate records;
• Promote operational effectiveness and efficiency;
• Adhere to policies and procedures, including control procedures;
• Enhance reliability internal and external reporting;
• Ensure compliance with laws and regulations;
• Safeguard the interest of shareholders /stakeholders
(p.335)
The above purposes were summed up as threefold objectives by Warren, Reeve and
Duchac (2011), who contended that the objectives of internal control are to provide
assurance that:
i. Assets are safeguarded and used for business purposes.
ii. Business information is accurate
iii. Employees and managers comply with laws and regulations
That assurance according to Pfister (2009) is given when internal control is without
any material weakness.
2.6 FACTORS INFLUENCING INTERNAL CONTROL SYSTEMS
The Institute of Chartered Accountants in England and Wales (2009) issued a
guideline on internal control which contends that a sound system of internal control
depends on a thorough and regular evaluation of the nature and extent of the risks to
which the company is exposed. It further states that since profits are, in part, the
reward for successful risk taking in business, the purpose of internal control is to help
manage and control risk appropriately rather than to eliminate it. This approach is

41
further buttressed by the University of California guide on Understanding Internal
Controls (2009) which notes that risk is the probability that an event or action will
adversely affect the organization. The guide further attests that in order to achieve
goals and objectives, management needs to effectively balance risks and controls.
The guide concludes that control procedures need to be developed so that they
decrease risk to a level where management can accept the exposure to that risk.
Warren, Reeve and Duchac (2011) contend that the control environment is the
overall attitude of management and employees about the importance of controls.
They identified three factors which influence a company’s control environment as
follows:
i. Management ‘S philosophy and operating style
ii. The company’s organisational structure
iii. The company’s personnel policies
They state that management philosophy and operating style relates to whether
management emphasise the importance of internal controls. They further argue that
an effective control environment is created when management emphasis is on
controls and adherence to control policies whereas overemphasis on operating goals
and tolerating deviations from control policies creates an ineffective control
environment. The business’s organisational structure is viewed as the framework for
planning and controlling operations clearly delineating roles and responsibilities.
Furthermore, they state that company’s personnel policies involve the hiring,
training, evaluation, compensation and promotion of employees coupled with job
description, employee codes of ethics and conflict of interest policies, all being part
of the personnel policies, can enhance the internal control environment. However,
Rich, Jones, Mowen and Hansen (2011) whilst agreeing on the two elements of
management style and personnel policies contend that the third element is the
overall integrity, attitude, awareness and actions of everyone in the business
concerning the importance of controls.
A study on internal audit roles by Soh and Sussan (2007) suggested significant
expansion and refocus of the role of internal auditor and perceptions of its
effectiveness. However, the findings also suggest that performance evaluation
42
mechanisms of internal audit have not evolved contemporaneously. The
misalignment between the role and evaluation gives rise to difficulty in assessing the
extent to which internal audit functions are meeting stakeholders' expectations.
However, in Italy, Minelli, Rebora and Turri (2008) after an analysis of over a 15
years period, concluded that acceptance or otherwise of control, professional ability
and competence, coherence between methods and the object of control and
transparency, all appear as discriminating factors in the failure or success of control
systems.
The Scottish government issued a statement on internal controls outlining judgement
as a significant internal control issue (Statement on internal control, 2008). Several
factors are outlined which help in making judgement on internal controls and these
are:
• The issue seriously prejudiced or prevented achievement of a key target
• The issue has resulted in a need to seek additional funding to allow it to be
resolved, or has resulted in significant diversion of resources from another
aspect of the business
• The external auditor regards it as having a material impact on the accounts
• The audit committee advises it should be considered significant for this
purposes
• The head of internal audit reports on it as significant for this purpose in their
annual opinion on the whole of risk, control and governance.
• The issue or its impact has attracted significant public interest or has seriously
damaged the reputation of the body.
(para. 9)
2.7 SERVICE DELIVERY
2.7.1 DEFINING SERVICE DELIVERY
In the most simplest form, the online Cambridge business dictionary defines service
delivery as the act of providing a service to a customer (Cambridge Dictionaries
Online, 2011). Gibson (2011) acknowledges that though there have been changes in
the customer service industry the definition of customer service has not changed.
He defines customer service delivery as the process of satisfying the customer,
43
relative to a product or service, in whatever way the customer defines his or her
need and having that service delivered with efficiency , compassion and sensitivity.
On the other hand Snow and Yanovitch (2009) identifies service delivery as
encompassing the people element of the organisation noting that successful service
delivery is driven by employees performing in such a way that your customers not
only want to come back but they automatically come back.
However Rushton, Croucher and Baker (2010) perceive that one way of considering
customer service is to differentiate between the core product itself and the service
elements related to the product. They argue that the core product concerns the item
itself in terms of the technical content, product features, and the ease of use, the
style and the quality. They further argue that the service elements, represent the
availability of the product, the ease of ordering, the speed of delivery, after sales
support.
2.7.2 ELEMENTS OF CUSTOMER SERVICE DELIVERY
Firms must consider the cost of providing good customer service such as faster
transport, greater safety stock levels, service provider training and better
communication systems as well as the benefits of keeping customer’s future profit
streams (Wisner, Tan and Leong, 2011). Ballou as cited by Mendes (2011)
presents the elements of customer service according to when the transaction
between the supplier and the customer take place. He identifies three categories
which are also supported by Wisner, Tan and Leong (2011) as follows:
• Pre-transaction elements.
• Transaction elements
• Post transaction
Mendes (2011) argues that pre-transaction elements establish a climate for good
customer service providing a written statement of customer service policy
encompassing delivery times, handling returns and back orders procedures,
shipment methods and prioritisation procedures during shortages.
They also include contingency plans for labour and work stoppages. Furthermore
they incorporate organisational structures that implement customer service policy

44
including customer training. Transaction elements on the other hand are observed to
be those that directly result in the delivery of the product to the customer. They
include setting stock levels, delivery modes, order processing procedures which
affect delivery times, accuracy of order, condition on delivery and stock availability.
On Post transaction elements, Mendes (2011) notes that these represent the array
of services needed to support the product in the field, to protect consumers from
defective products, to provide for the return of packages and to handle claims,
complaints and returns.
A different view is proffered by Wellington (2010) who identifies six elements which
he believes directly influence customer service and these he lists as:
• The product or service
• Sales
• After sales
• Location
• Time
• Culture
However, a more pragmatic view is the one by McConnell (2010), who articulates
that the essentials of customer services in any activity in which employees deal
directly with customers are systems, strategies and employees. He describes
systems as policies, protocols, procedures, arrangement and accessibility of the
physical facilities, staffing, operations, workflow, and performance monitoring, which
must provide an effective and customer friendly environment. On strategies
McConnell (2010) sees them as consisting of developing a customer oriented culture
which is achieved when every employee understands that a good service is
expected, that exceptional service is rewarded , and that unsatisfactory service is not
tolerated. He further argues that employees are our best customers and must be
satisfied first before other customers, noting that a well satisfied employee is one
who is capable of extending the best in customer service to others.

45
2.7.3 CHALLENGES IN SERVICE DELIVERY
Butcher, Wanna and Freyens (2009), admit that service delivery is an inherently
complex enterprise, requiring managing across a huge number of fronts, often
simultaneously. They note that managers are accountable for the use of resources
associated with the delivery of services, maintaining constructive relationships with a
variety of stakeholders and for results. They indicate that failure on one of these
fronts can have cascading effects across others.
Policy failures during implementation is one major challenge noted by Butcher,
Wanna and Freyens (2009) as affecting service delivery. They explain that policy
models assume that policy implementation proceeds by approved processes that
need to be managed and controlled which however is disturbed by the political world
and policy environment. This results in policy being ad hoc, procedures being
inverted or discarded and sequence being staccato, broken and disjointed.
Information communication and Technology (ICT) is another aspect that places
challenges in service delivery as noted by Butcher, Wanna and Freyens (2009).
They argue that they are only a small sample of existing and potential applications of
ICT available to governments to support the delivery of services. Technological
change has often led to larger minimum efficiencies of scale in service delivery which
conflicts with shrinking rural demand as noted by the Organisation for Economic Co-
operation and Development (OECD, 2011).
Picazo and Zhao(2009) point to the issue of appropriate human resources as
affecting service delivery. Citing the Zambia health system, they noted that the
human resource situation in Zambia was at the state of a crisis. They observed that
the lack of appropriate human resources, which was worsened by the high attrition
rate has severely undermined the system’s capacity to deliver health services. In
concluding on poor service delivery in municipalities and citing governance as a
challenge, Idasa (2010) point out a number of issues that include the degree of
corruption, institutionalised capacity constraints relating to appropriate skills and
staff, and lack of transparency among major issues impacting on service delivery.
46
2.8 EFFECTIVE INTERNAL COTROL SYSTEMS AND SERVICE D ELIVERY
Hightower (2008) notes that companies with effective controls experience
improvements in operational effectiveness, efficiency, communication, reliability,
flexibility and resilience. She further articulates that companies with effective controls
have an ability to execute as planned, allocate resources predictably, and provide
consistent and reliable data and information available for decision making and
reporting. Leitch (2008) also believes that controls designed as an integral system
rather than a piecemeal can be more efficient and effective. He alludes to the fact
that this is so if special skill is applied and the focus is on value rather than just risk
coverage.
Harrer (2008) articulates that management and the board of directors can conclude
that internal controls are effective if there is reasonable assurance that:
• Operational objectives are achieved
• Published financial statements are reliable
• The company is complying with applicable laws and regulations
A wholesome dimension to effective internal controls is articulated by Pickett and
Pickett (2010) who observe that internal control is most effective when controls are
built into the entity’s infrastructure and are part of the essence of the enterprise.
They argue that built in controls support quality and empowerment initiatives at the
same time avoiding unnecessary costs thus enabling quick response to changing
conditions.
Braiotta, Gazzaway, Colson, Colson and Ramamoorti (2010) sum up by arguing
that just as an organisation cannot produce reliable services or products without
good controls over service delivery or manufacturing processes, it cannot produce
consistently reliable financial statements without good internal controls over financial
reporting.
47
Harrer (2008) notes that internal controls do not ensure success, however bad
decisions, poor managers, competition, collusion and override of controls can still
cause unreliable financial reports. He however argues that strong controls put up
roadblocks for fraud, bad decisions and human error and help to minimise pitfalls
and surprises. He concludes that an effective control system enables management
to discover and manage significant risks and monitor the integrity of financial and
operating information
On the other hand, Johnstone, Gramling, and Rittenberg (2011), advice that
management develop good internal controls for one fundamental reason, that is,
better internal controls lead to better data for decisions and increase the likelihood of
organisational success and sustainability. They argue that the assessment of internal
control should be a by product of good internal control process.
Goh and Li (2010) observe that weak internal controls can cause unintentional errors
in accrual estimations to occur and impact on the reported book value or earnings of
a company. They further allude to the fact that weak internal controls could also
impede the timely recognition of losses. As an example they cite lack of proper
policies and procedures to regularly value a firms’ inventory of fixed assets as
preventing asset impairment from being discovered early and hence delays the
recognition of losses.
Weaknesses in internal control systems has also been blamed for longer external
audit delays (Ika and Ghazali, 2012). Some companies could not meet the regulatory
deadline of filling because of weak internal controls. On the other hand Schneider (
2009), argues that regulators contend that increased scrutiny of control systems is
necessary because control weaknesses are at the heart of large-scale fraudulent
financial reporting, e.g. Enron, WorldCom, Lucent, and HealthSouth, to name a few.
He observed that the KPMG (2003) fraud surveys also consistently identified
inadequate internal controls as a factor that contributes to the occurrence of fraud.
2.9 CHALLENGES IN IMPLEMENTING INTERNAL CONTROL SYS TEMS
Hightower (2008) identifies some major challenges in attaining cost –effective
internal controls which he listed as follows;

48
• Obtaining sufficient resources to achieve adequate segregation of duties
• Management’s ability to dominate activities with significant opportunity for
management override control
• Recruiting individuals with requisite financial reporting and other expertise to
serve effectively on the board of directors and audit committees
• Recruiting and retaining personnel with sufficient experiences and skill in
accounting and financial reporting
• Taking management attention from running the business in order to provide
sufficient focus on accounting and financial reporting.
• Maintaining appropriate control over computer information systems with
limited technical resources.
(p.8)
On the other hand, Moeller (2009) specifies communication and relations as a major
obstacle that involves a target for internal audit that is always moving forward. He
further alludes to the fact that internal audit’s success in meeting that challenge
provides one of the greatest available opportunities to serve the organisation and to
achieve its maximum welfare. One of the moving challenges is also outlined by
Deluccia, IV (2008) who notes that the political stances of countries change with
each new election or lack thereof and directly impact company’s ability to sustain
operations in different political environments. He recommends that companies
should establish operational plans to respond when political and public opinion make
it difficult to conduct business. In buttressing this point Tarantino (2010) combines
cultural and politics noting that Japanese people’s belief that human beings are
inherently good and management trusts in the loyalty of its employees and sees it as
a negative thing to effectively spy on them by implementing internal controls.
Brown and Nasuti (as cited by Kumar, Pollanen and Maheshwari, 2008) identified
several technical problems that related to designing, implementing and managing
enterprise architecture. Among the identified problems were data structures,
inadequate security and differences in infrastructure as major challenges for
companies that want to implement SOX (Sarbanes – Oxley Act) hence impacting on
their internal control designs.
49
Runatsa (2011) after studying the control environment at the University of Zimbabwe
concluded that the institution of higher learning had adequate internal controls
buttressed by active roles of top management. He however noted that the system of
internal controls needed regular review to keep pace with recent developments.
De Kocker ( 2011) in a study on anti money laundering observed that the quality of
the identification and verification measures that an institution can implement is
restricted by a number of factors which were listed as cost, client resistance, laws,
Internationalisation, consistency and reliability. He argues that whilst it may be
effective to research a client’s background for a small transaction this may not be
commercially justifiable. Furthermore, he notes that they may be client resistance
where potential clients will move to other institutions that are less intrusive or less
bureaucratic in their account opening procedures. He also notes that privacy laws
may restrict access to relevant information at the same time identification of
foreigners may also present a challenge as there is no internationalised documents
for verification, which documents may also not be reliable. Moreover, he further
argues that client details may be subject to frequent changes which may not be
sufficiently consistent or reliable to support structured information management
systems.
A more different perspective is that proffered by Roach (2010) who identified four
major challenges which have to be managed;
• Underestimating the potential for wrongdoing
• Increasing pressure
• Compliance/Internal controls are often overlooked priorities
• Law/rules are not always logical/intuitively
He argues that they are some human behaviour basics underlined by ethics which
encompass perception and reality buttressed by cheating, stealing, and resumes and
reporting. They are also internal control basics such as appropriate procedures,
training, thoughtful metrics, management commitment, audits and reviews and
discipline for non-compliance. These issues underline the internal control challenges
that have to be managed.

50
Mills et al (as cited by Kumar, Pollanen and Maheshwari, 2008) noted that
organisational culture can be a key organisational constraint in implementing new
systems and processes. They observed that as beliefs, values and norms evolve
slowly; employees can resist change particularly, if it is implemented quickly. Kumar,
Pollanen and Maheshwari (2008) then concluded that challenges can come in the
form of resistance which could be due to lack of proper guidelines.
2.11 CONCEPTUAL FRAMEWORK
The research will thus be based on a conceptual framework that identifies the
internal control system as the one outlined in the COSO framework of internal
control. This means noting processes that provide assurance in the achievement of
objectives in the following categories:
• Effectiveness and efficiency of operations.
• Reliability of financial reporting.
• Compliance with applicable laws and regulations.
The internal control system is anticipated to take the form of preventative,
detective and corrective controls and effective internal controls will be measured
against service delivery.
2.10 CHAPTER SUMMARY
In this chapter the meaning and the importance for internal control systems was
defined and argued respectively and illustrated through various authors. The forms
of internal controls articulated by some authors were also explored. Several factors
influencing internal control systems were identified and justification was also outlined
for effective internal control systems on service delivery. Finally, challenges that
impact on effective internal control systems were also assessed including literature
weaknesses. This chapter outlined the theoretical frameworks of internal control
systems.
51
CHAPTER 3
RESEARCH METHODOLOGY
3.1 INTRODUCTION
This chapter sets out the research methodology for the study. This is the system of
data collection for the research. The methodology set out herein was carefully
selected to ensure data validity, ethical considerations and reliability of measures to
ensure completion within the time frame. The chapter states the research paradigm
followed as well as outlining the research design. Also outlined is the population,
sample and the research instruments for the study.
3.2 RESEARCH DESIGN
Kothari (2008) describes research design as the arrangement for conditions for
collection and analysis of data in a manner that aims to combine relevance to the
research process with economy in procedure. He articulates that research design is
the conceptual structure within which the research is conducted constituting the blue
print for the collection, measurement and analysis of data. On the other hand Salkind
(2010) articulates that designs often rest on inductive approaches to knowledge
development. He argues that research designs may be value-driven, acknowledge
the politics of the research endeavour, be attentive to power differentials in the
community, and promote social justice or social change. Designing a research
project must include serious consideration of the ethical dimension of social science
research (Babbie, 2010).
The approach to this study will be the descriptive-normative-survey approach. This
approach involves the description, recording, analysis and interpretation of the
prevailing conditions (Marczk, DeMatteo and Festinger, 2010). Berger (2011)
articulates that surveys seek to obtain information about demographic factors such
as age, gender, marital status, occupation, race, or ethnicity, income, and religion
and to relate this information to opinions values and behaviour of some group of
people.

52
Mitchell and Jolly (2009), notes that when you use the descriptive methods, you gain
the ability to test the hypothesis about virtually any variable in virtually every
situation. On the other hand, Elmes, Kantowitz and Roediger (2011) point out four
other advantages with the descriptive observation that include being an important
source of basic knowledge, flexibility, ethological approach and ecological validity.
They however also note the weakness of lack of reproducibility which leaves a lot of
questions on other researchers.
Wood and Ross-Kerr (2011) admit that although absolute proof of causality cannot
be established in a descriptive survey, it is possible to accumulate extensive
evidence to support causality. They further noted that much of the research on
cigarette smoking and lung cancer was done using descriptive surveys. Connaway
and Powell (2010) add that while descriptive surveys are usually less rigorous than
experimental research, they are however stronger than exploratory research for
testing relationships between variables.
3.3 RESEARCH PHILOSOPHY
Collins (2010), mentions that research philosophies are the development of
knowledge and the nature of that knowledge. He argues that the research
philosophy you decide, means that you accept certain assumptions about the way
you view the world. He notes that they are three core approaches to reflecting on
research philosophy namely epistemology, the study of the theory of knowledge,
Ontology, the philosophical study of the nature of being or existence and axiology,
the study of quality or value and is often concerned with ethics and values. Research
philosophy can be approached through paradigms and Collins (2010) admits that the
list of recognised paradigms includes positivism, realism, interpretism, objectivism,
subjectivism, pragmatism, functionalism, radical humanist and radical structuralism.
Mennen (2010) acknowledges three views concerning research philosophy,
positivism, interpretivism and realism. She argues that positivist approach does not
emphasise human interest and aims to analyse quantitative data in a statistical
analysis. Armstrong (2010) agrees that positivism is the belief that researchers
should focus on facts, look for causality and fundamental laws, reduce phenomena
to their simplest elements, formulate hypothesis and then test them.

53
Bachman and Schutt (2010) on the other hand believe that qualitative research is
often guided by a different , interpretivist philosophy. They note that interpretive
social scientist believe that social reality is socially constructed and that the goal of
social scientist is to understand what meanings people give to reality, not to
determine how reality works apart from these interpretations. On realism Lessem
and Schieffer (2010) notes that the key tenets are its combined objective and
subjective nature, its interpretive as well as explanatory orientation, its stratified
nature , its recognition of human fallibility and its critical as well as emancipator
orientation.
The study on ZETDC will be a constructivist paradigm. Constructivists claim that
truth is relative and that it is dependent on one’s perspective (Baxter and Jack,
2008). This paradigm recognizes the importance of the subjective human creation of
meaning, but does not out rightly reject some notion of objectivity. Emphasis will be
on pluralism, not relativism, with focus on the circular dynamic tension of subject and
object (Yin, 2009). Constructivism is built upon the premise of a social construction
of reality (Gerring, 2007).
One of the advantages of this approach is the close collaboration between the
researcher and the participant, while enabling participants to tell their stories
(Crabtree and Miller as cited by Scot 2011). Through these stories the participants
are able to describe their views of reality and this enables the researcher to better
understand the participants’ actions (Woodside, 2010).
3.4 POPULATION AND SAMPLING TECHNIQUES
3.4.1 THE RESEARCH POPULATION
According to Lohr (2009), the target population is the complete collection of
observations we want to study. The population frame as noted by Groves, Fowler Jr,
Couper, Lepkowski, Singer, and Tourangeau. (2011) is the set of target population
members that has a chance to be selected into the survey sample.
According to Connaway and Powell (2010) the actual list of units from which the
sample or some part of the sample is selected is the Sampling frame which is often
used interchangeably with population list. Abramson and Abramson (2011) agrees

54
that the study population is the group that is studied either in toto or by selecting a
sample of its members. They further allude to the fact that the appropriateness of the
study population refers mainly to its suitability for the attainment of the objectives of
the study and that the choice of a suitable study population is one of the factors
making for originality in research. The study population should be clearly and
explicitly defined in terms of place, time and other relevant criteria (Abramson and
Abramson, 2011)
The research target population for this study is all ZETDC staff members including
board members. The company has a board of directors that has five non executive
independent members and four executive members while the company’s staff
strength is almost five thousand employees in work places across Zimbabwe.
Employee staff levels include executive management, senior management , middle
management, supervisory, and junior workers. ZETDC’s staff are in several
divisions in accordance with operational activities which include finance, human
resources, information technology (I.T), security, planning, operations and
commercial. The divisions also have numerous sections below them. The
commercial division for example, has sections such as billing, revenue, costing,
customer services and marketing.
These ZETDC employee levels and corporate divisions and sections were
considered because of their daily involvement with commercial activities that are
guided mostly by internal control systems which have a direct impact on service
delivery to customers.
3.4.2 SAMPLING
Sampling consists of selecting some part of a population to observe so that one may
estimate something about the whole population (Thompson, 2012). Babbie (2010)
articulates that the list or quasi list of elements from which a probability sample is
selected is the sampling frame. He further stipulates that for a sample to be
representative of the population it is essential that the sampling frame include all (or
nearly all) members of the population Sampling of the population and the needed
sample size depends on the resources available, ensuring that it is representative of
the whole population (Athanasiou and Darzi, 2020).

55
The procedure by which the sample of units is selected from the population is called
the sampling design (Thompson, 2012). In a sample survey, the major statistical
components are referred to as the sample design and include both the sampling plan
and the estimation procedures (Levy and Lemeshow, 2011). Marlow (2010) argues
that a key aspect of sampling is the extent to which the sample is representative of
the population. She notes that a representative sample means that the sample has
the same distribution characteristics as the population from which it is selected.
3.4.2 SAMPLING METHODS
There are two major ways in which a sample can be selected: probability and non
probability sampling. Marlow (2010) observes that probability sampling allows you to
select a sample where each element in the population has a known chance of being
selected for the sample while non probability sampling allows the researcher to
handpick the sample according to the nature of the research problem and the
phenomenon under study. She however acknowledges that non probability sampling
is limited in terms of representativeness in that the probability of each element of the
population being included in the sample is unknown. However, non probability
sampling is often the method of choice in qualitative studies where generalisation of
results is less important (Marlow, 2010). Furthermore, non probability samples are
usually easier and cheaper to obtain than are probability samples (Connaway and
Powell, 2010).
3.4.3 NON PROBABILITY SAMPLING TECHNIQUES
Accidental Sampling is a non probability sampling technique in which the
researcher simply selects the cases that are at hand until the sample reaches the
desired designated size (Connaway and Powell, 2010). This method is also known
as convenient sampling or haphazard sampling and you simply sample people who
are easy to survey but may not be representative of the population (Mitchell and
Jolley, 2012). They are also referred to as purposive or judgemental samples
because the researcher presumes that they are typical of the study population
(Abramson and Abramson (2011)
Quota Sampling is designed to make your convenience sample more
representative of the population by reserving a part for some elements of the

56
population ( Mitchell and Jolley, 2012). The quota sample method also attempts to
ensure that the different elements are included in the sample in the proportions in
which they occur in the population (Connaway and Powell, 2010)
Snowball Sampling as described by Babbie (2010) is a technique which is used
when members of a special population are difficult to locate such as homeless
individuals , migrant workers or undocumented immigrants and is often employed in
field research for exploratory purposes. Each person interviewed may be asked to
suggest additional people for interviewing and this may however result in samples
with questionable representativeness.
3.4.4 PROBABILITY SAMPLING TECHNIQUES
Random Sampling is used in a large group of population rather than small size, the
method is characterised by selecting the unit to be observed randomly from the
population like drawing a name out of a hat (Changing Minds Org as cited by Oulte,
2011). Marlow (2010) agrees that simple random is the easiest of sampling methods
where the population is treated as a whole unit and each element has an equal
probability of being selected in the sample. In order for the probabilities of including
each element and each combination of elements to be equal, it is necessary that
there be independency from one draw to the next (Connaway and Powell, 2010).
Traditional methods used in selecting simple random samples include the roulette
wheel or lottery type approach, the use of a table of random numbers or using
calculators or computer drawn numbers as noted by Connaway and Powell (2010).
Systematic Random Sampling is considered the most reliable and accurate and
simple way of selecting a sample which involves taking every nth element from a list
until the total list has been sampled (Connawa and Powell, 2010). According to
Marlow (2010), the size of n depends on the size of the sampling frame and the
intended size of the sample. She however notes that problems may arise where the
ordering of elements follow a particular pattern which could result in a distortion of
the sample.
Cluster sampling is a form of sampling used when it is not convenient to pull one or
two people out of their environment for the research or when other methods of
sampling are impractical (Weathington, Cunningham and Pittenger, 2010). The

57
sampling units are clustered and the sampling frame is a list of these clusters which
may include villages , apartments, classes of schools, households and housing units
among several such classifications (Abramson and Abramson, 2011)
Stratified Random Sampling is another variation on simple random sampling useful
especially in situations where the population contains different subgroups that the
sample must include (Weathington, Cunningham and Pittenger, 2010). This is also
supported by Abramson and Abramson (2011) who suggests that to use this method
the population is first divided into the subgroups or strata according to one or more
characteristics such as sex and age.
The advantage of this method is that it eliminates sampling variations with respect to
the properties used in stratifying and also reduces sampling error if the strata are
more uniform than the total population with respect to other properties(Abramson
and Abramson, 2011).When using proportionate stratified random sampling you do
not leave the representativeness of your sample entirely to chance (Mitchell and
Jolley, 2012).
MULTISTAGE SAMPLING
It is for the above reasons of eliminating sampling variations and reducing sampling
errors that the study on ZETDC will adopt a mixture of the Stratified and clustered
random sampling technique termed multistage sampling. Judgemental sampling will
also be utelised bearing in mind the likely response rate as it may be difficult for
some higher management levels to find time to respond off their busy schedule.
ZETDC is clustered into its head office and the five regional offices of Harare
Region, Mutare Region, Southern Region, Western Region and Northern Region.
The set up and functions in all the regional offices are basically the same hence the
suitability of the cluster approach. Thus head office and Harare regional offices were
selected as the clusters for the study for their proximity and ease of access to the
researcher.
In order to eliminate sampling variations, the selected clusters (Head Office and
Harare Region were then stratified into the various level of management that
included the board members, executive management, senior management, middle
management, supervisory and junior staff thus cutting across all levels of staff.
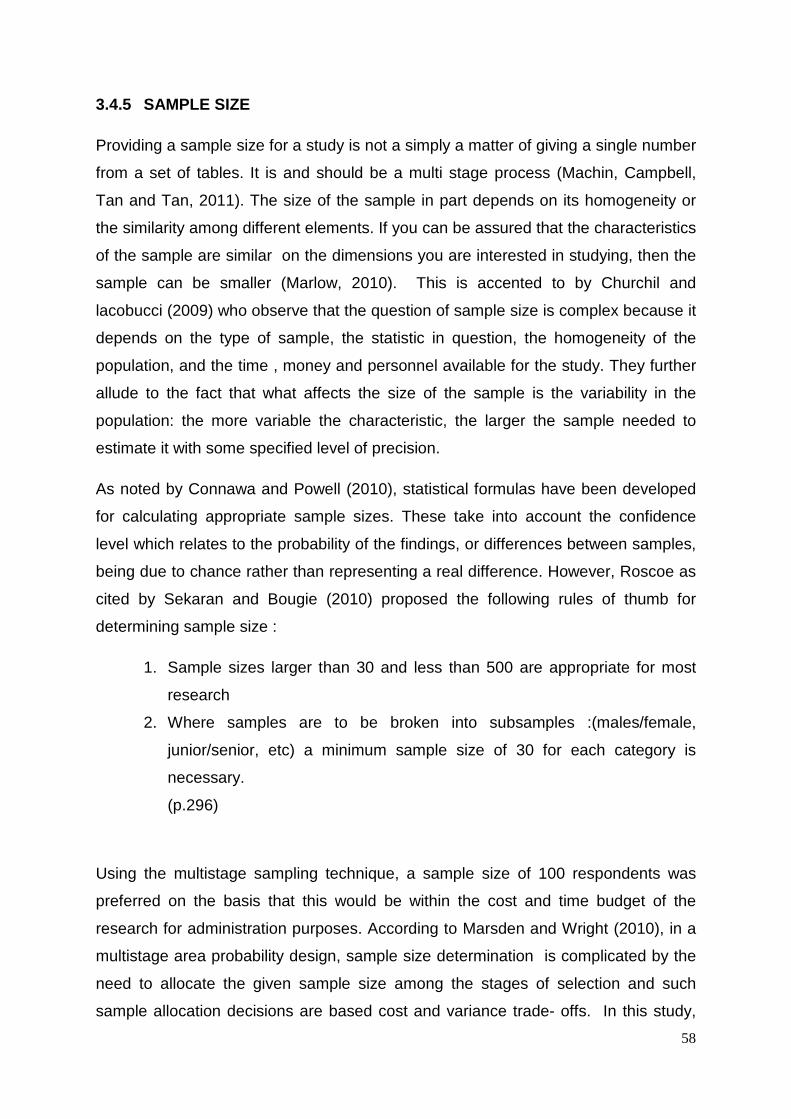
58
3.4.5 SAMPLE SIZE
Providing a sample size for a study is not a simply a matter of giving a single number
from a set of tables. It is and should be a multi stage process (Machin, Campbell,
Tan and Tan, 2011). The size of the sample in part depends on its homogeneity or
the similarity among different elements. If you can be assured that the characteristics
of the sample are similar on the dimensions you are interested in studying, then the
sample can be smaller (Marlow, 2010). This is accented to by Churchil and
lacobucci (2009) who observe that the question of sample size is complex because it
depends on the type of sample, the statistic in question, the homogeneity of the
population, and the time , money and personnel available for the study. They further
allude to the fact that what affects the size of the sample is the variability in the
population: the more variable the characteristic, the larger the sample needed to
estimate it with some specified level of precision.
As noted by Connawa and Powell (2010), statistical formulas have been developed
for calculating appropriate sample sizes. These take into account the confidence
level which relates to the probability of the findings, or differences between samples,
being due to chance rather than representing a real difference. However, Roscoe as
cited by Sekaran and Bougie (2010) proposed the following rules of thumb for
determining sample size :
1. Sample sizes larger than 30 and less than 500 are appropriate for most
research
2. Where samples are to be broken into subsamples :(males/female,
junior/senior, etc) a minimum sample size of 30 for each category is
necessary.
(p.296)
Using the multistage sampling technique, a sample size of 100 respondents was
preferred on the basis that this would be within the cost and time budget of the
research for administration purposes. According to Marsden and Wright (2010), in a
multistage area probability design, sample size determination is complicated by the
need to allocate the given sample size among the stages of selection and such
sample allocation decisions are based cost and variance trade- offs. In this study,
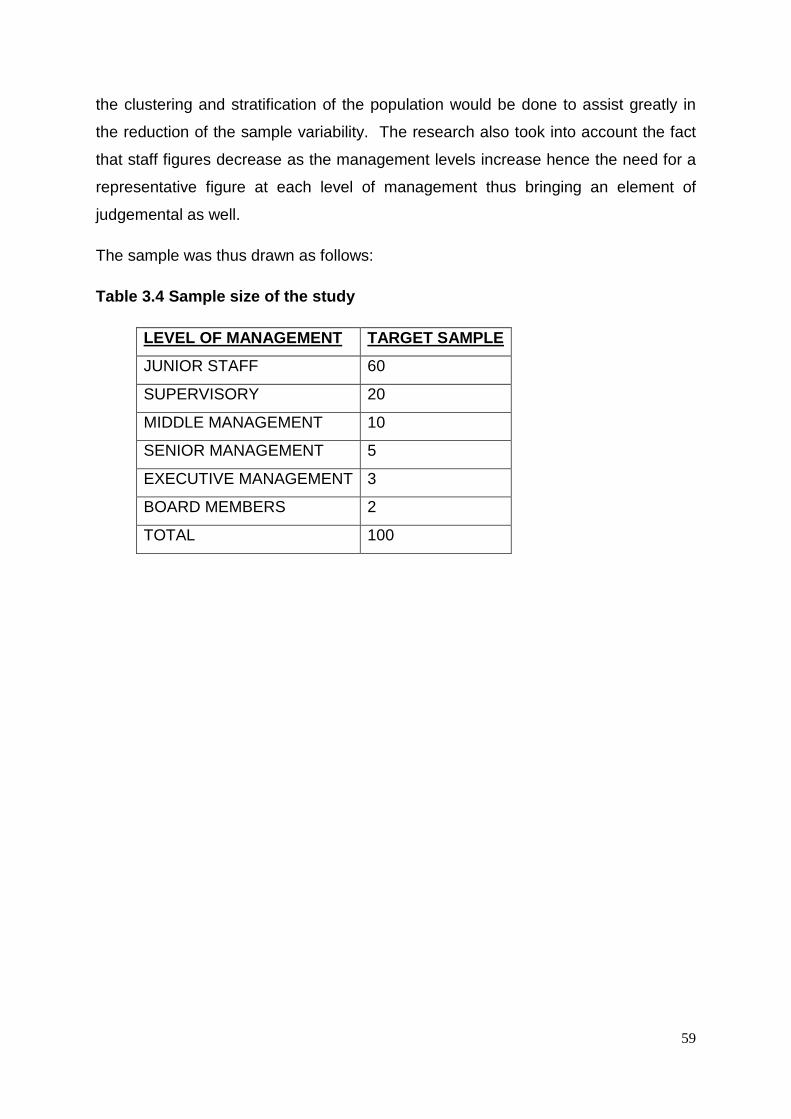
59
the clustering and stratification of the population would be done to assist greatly in
the reduction of the sample variability. The research also took into account the fact
that staff figures decrease as the management levels increase hence the need for a
representative figure at each level of management thus bringing an element of
judgemental as well.
The sample was thus drawn as follows:
Table 3.4 Sample size of the study
LEVEL OF MANAGEMENT TARGET SAMPLE
JUNIOR STAFF 60
SUPERVISORY 20
MIDDLE MANAGEMENT 10
SENIOR MANAGEMENT 5
EXECUTIVE MANAGEMENT 3
BOARD MEMBERS 2
TOTAL 100

60
3.5 RESEARCH APPROACH
Research approaches are best illustrated in the table 3.4
Table 3.4 Inductive and Deductive Strategies
Research Strategy
Nature of theory Use of Models
Inductive Form
Process
Generalisations
Networks of propositions
Generated by induction from data
Abstract description
Mathematical representations
Conceptual frameworks
Deductive Form
Process
Deductive argument produces hypothesis
Hypothesis tested by matching against data
Theoretical models
Diagrammatic representation
Mathematical represantation
Retroductive Form
Process
Generative structures and mechanisms
Modelling of hypothetical mechanisms
Abstract descriptions
May involve analogies
Abductive Form
Process
Social scientific accounts
Generated from everyday accounts
Abstract descriptions
(ideal types)
Adapted from Blaikie.(2009). Designing Social research. Polity
3.6 RESEARCH METHODS
Cross sectional
As noted by Mitchell and Jolley (2012), this is a method designed in such a way as
to obtain data on variables in different context simultaneously. Babbie (2010)
observed that they are an inexpensive research which is usually conducted when
they are constraints of time.
61
Experiments
Marlow (2010) describes experiments as research conducted in a laboratory or
natural setting which permits casual relationships to be identified with the aim of
manipulating the independent variable. He argues that they are conducted in a real
situation and Mitchell and Jolley (2012) observed that they are in the form of
repeated measure design, independent sample design ,matched pairs design or
single subject
Longitudinal
Abramson and Abramson, (2011) argues that this is a study done over time of a
variable group of subjects with the aim of researching the dynamics of a problem
through several and continuous investigations over the period of the problem.
Connawa and Powell,(2010) adds that this may involve a chain of studies.
Surveys
As described by (Marczk, DeMatteo and Festinger, 2010), in a survey a sample is
drawn from a population and studied to make inferences about the population.
Wood and Ross-Kerr (2011) notes that surveys may either be descriptive or
analytical. Descriptive is concerned with identifying and counting the frequency of a
specific population, either at one point in time or at various times for comparison
whereas Analytical survey- is where the intention is to determine whether there is
any relationship between different variables (Weathington, Cunningham and
Pittenger, 2010)
3.7 DATA COLLECTION METHODS
No matter how good its sample design, a survey will yield biased results if the rest of
the survey design is not appropriate to its purpose (Groves, Fowler, Couper,
Lepkowski, Singer and Tourangeau, 2011). According to Grinnell and Unrau (2010)
the research question directs what data are to be collected and who data could be
collected from.
They further allude to the fact that the research design refines the what question by
operationalising variables and the who question be developing a sampling strategy.

62
This is supported by Cottrell and McKenzie (2010) who suggests that if the
researcher is asking why and has comparison groups , then qualitative research
methods may not be appropriate.
They further state that If theories or variables have not been identified to explain or
understand the phenomena under study, then qualitative research methods may be
valuable.
Grinnell and Unrau (2010) point out that we must always consider which method of
data collection will lead to the most valid and reliable data to answer a specific
research question or to test a specific hypothesis. As noted by Grinnell and Unrau
(2010), data analysis should always be considered when choosing data collection
methods and data source because the analysis phase must summarise , synthesise,
and ultimately organise the data in an effort to have as clear cut an answer as
possible to our research question. Common data collection methods include in-
depth one on one interviews, focus group interviews, and direct observations
(Cottrell and McKenzie, 2010).
3.7.1 CRITERIA FOR SELECTING A DATA COLLECTION METH OD
As observed by Grinnell and Unrau (2010) there are many practical criteria that
ultimately refine the final data collection method to fit the conditions of any given
research study and these include size, scope, program participation, worker co-
operation, intrusion into the lives of research participants, resources, time and
previous research findings. However, Werner and DeSimone (2011), articulate that
there are three vital issues to consider when deciding which data collection method
to use and these are reliability, validity and practicality. They argue that reliability has
to do with the consistency of results and the freedom from error and bias, while
validity is concerned with whether the data collection method actually measures what
we want to measure and practicality concerns how much time, money, and
resources are available for an evaluation method.
63
3.7.2 INTERVIEWS
The interview method enables analysts to gather information directly from people in
the work place or people connected in various ways to the organisation and its
processes in person, groups and by telephone (Swanson, 2009).
In this process as noted by Piskurich (2010) you talk to your experts individually,
asking a series of questions or allow the interview to free form, listening to whatever
the experts have to say while questioning issues as they arise.
As noted by Marsden and Wright (2010), when interviewers administer surveys, their
utterances and behaviour are influenced by the complex interplay among their
personal characteristics and attributes, the role of interviewer, and their interaction
with sample members and respondents.
Piskurich (2010) also articulates the advantages of using interviews as a data
collection technique and notes that they can be used for almost any type of analysis,
they build supporters for training, they can easily be done at various organisational
levels, they are good for eliciting feelings and opinions and that they can be made
more efficient through technology such as the telephone.
However, Piskurichi (2010) notes that one of the problems with individual interviews
is that the individual bring their own bias into the situation and because you cannot
expect a person to be objective, you have to interview several experts from the
target population.
3.7.3 FOCUS GROUPS
When using a focus group you invite individuals who are experts on the information
you want to gather to meet and discuss what they know (Piskurich, 2010). As noted
by Liamputtong (2011), the focus group methodology is perceived as a methodology
which can generate complex information at low cost and with the minimum amount
of time while being useful in a wide range of people and groups in different settings.
They are called focus groups because the discussions start out broadly and
gradually narrow down to the focus of the research and focus groups typically
consist of 5 to 12 people (Connaway and Powell, 2010).

64
3.7.4 OBSERVATION
Observing a setting, person or group requires research skills to ensure observer
validity and reliability, to facilitate meaning and understanding across culture and
language , and to avoid drawing culturally bound interpretations (Pasick, D’Onofrio
and Otero- Sabogal as cited by Cottrell and McKenzie, 2010).
However, Gravetter and Forzano (2011) argues that there are three basic types of
observations: naturalistic, participative and contrived observation. They contend that
in naturalistic observation the researcher observes without being involved and
without altering the natural setting of the respondents whereas in participative
observation the researcher interacts with the participants and becomes one of them
to observe and record behaviour while in contrived observation the observer sets up
a situation that is likely to produce the behaviour to be observed.
3.7.5 QUESTIONNAIRES
The most common data collection method is the survey which uses a questionnaire.
Lavrakas as cited by Houser (2011) describes the survey method as an approach in
which a systematic tool is used to gather information directly from respondents about
their experience, behaviour, attitudes or perceptions. Piskurich (2010) simply
describes a survey questionnaire as a list of questions concerning the topic you are
analysing and suggests that they should be used when one wants a lot of responses
and for a widely dispensed audience.
Gravetter and Forzano (2011) observed that by presenting people with a few
carefully constructed questions, it is possible to obtain self reported answers about
attitudes, opinions, personal characteristics and behaviours. They noted that with a
survey questionnaire, a researcher does not have to wait until a behaviour or
response occurs.
The study on ZETDC adopted the common self administered survey structured
questionnaire wherein the researcher carefully crafted 20 questions to obtain an
accurate picture of events at ZETDC in respect of the internal control systems. The
questions were crafted based on the intended objectives as per the research
questions and available literature and recorded historical experiences of ZETDC.
65
Different types of questions were used to obtain responses that included the simple
yes and no answers, quantitative rating (Likert Scale), restricted response and open
ended questions. Gravetter and Forzano (2011) argues that different type of
questions encourage different types of response.
The questionnaire was divided into five different sections that were as follows:
Section A : Demographic Information – 4 Questions
Section B : Elements of the internal control environment – 3 Questions
Section C : State of the internal control system - 7 Questions
Section D : Impact on service delivery - 3 Questions
Section E : Implementation Challenges and Recommendations – 3 Questions
The questionnaire for ZETDC was physically dispatched to the workplaces of the
sampled staff by the researcher and respondents were given 1-3 days to give their
responses after which the questionnaires were recollected for analysis.
3.7.6 ALTERNATIVE METHODS OF DATA COLLECTION
As noted by Groves, Fowler, Couper, Lepkowski, Singer and Tourangeau (2011),
surveys have traditionally relied on the three basic data collection methods : mailing
paper questionnaires to respondents, having telephone interviews and sending
interviewers to correspondents ’s homes. They however argue that, the survey
modes now encompass a much wider variety of methods and approaches due to the
proliferation of computers and these include computer assisted personal
interviewing, audio computer assisted self interviewing, computer assisted telephone
interviews, interactive voice response and web surveys in which the computer
administers the question on line.
The researcher was unable to make maximum use of this technology as most of the
respondents though aware of this type of technology were not fully familiar with its
use. On this basis the researcher preferred using the traditional methods.

66
3.8 DATA ANALYSIS AND PRESENTATION
Alexander (2011), defines analysis as the investigation of the component parts of
your data and their relationship to the data source as a whole. He also adds that in
the context of data analysis, presentation deals with how you make the content of
your analysis available to a certain audience.
The data collected from the research questionnaires was edited to identify and
minimise as far as possible errors and gaps in the information obtained from
respondents. Coding was also applied depending on the measurement scale on the
questionnaires.
Using the Microsoft excel spreadsheets as a frame of analysis, frequency distribution
groups and cross tabulation will be done and the data presented using the Microsoft
charts that included tables, graphs and pie charts.
3.9 ETHICAL CONSIDERATIONS
All the data collected will be treated with strict confidence and the identity of the
respondents shall remain anonymous. Consent will be obtained first before soliciting
for participation from the respondents. The findings shall be solely for academic
purposes and shall in no way be used for any other purposes that may bring harm to
the researcher, ZETDC or the participants.
3.10 RESEARCH LIMITATIONS
The most notable problems encountered during the research include the
unwillingness to participate by targeted staff members in fear of perceived
victimisation. The researcher had to take time to persuade some of the respondents.
The possibility of bias was also another limitation particularly by management who
may intend to portray a favourable position so as to be seen to be “doing their work
properly”. Their input needed corroboration from their juniors. On the other hand
bias from juniors can also not be ruled out as they were most willing to participate.
Another limitation was the unwillingness by most respondents to answer to open
ended question on the survey questionnaire. This could have been as a result of
strict company regulations that control release of company information despite the
researcher giving assurance that the information would be treated in strict
confidence and was for academic purposes only.

67
The research sample was confined to ZETDC Head Office and Harare regional office
all geographically located in Harare due to proximity and easy access by the
researcher. ZETDC is geographically spread across the whole country of Zimbabwe
thus the research did not take into account issues such as distance, culture,
traditions, language, economic activity and weather patens which vary
geographically and which could have an impact on the research findings.
3.11 CHAPTER SUMMARY
This chapter has indicated the manner in which the research will be carried out. The
descriptive – normative survey approach was selected and the advantages were
also noted. A constructivist paradigm is to be followed on the research and the
selected data collection methods and instruments were also highlighted including
how the data will be analysed.

68
CHAPTER 4
FINDINGS AND DISCUSSION
4.0 INTRODUCTION
The aim of this study was to evaluate the internal control system at ZETDC on
service delivery. This chapter presents and analyse the research findings on the data
collected from ZETDC staff using a structured questionnaire. The study focused of
the internal control status of ZETDC and its impact on service delivery as evaluated
by the system users at ZETDC.
4.1 RESPONSE RATE
Table 4.1 Response Summary
LEVEL OF MANAGEMENT
TARGET SAMPLE
ACTUAL RESPONSE
RESPONSE RATE %
JUNIOR STAFF 60 35 58 %
SUPERVISORY 20 8 40%
MIDDLE MANAGEMENT 10 6 60%
SENIOR MANAGEMENT 5 3 60%
EXECUTIVE MANAGEMENT 3 2 67% BOARD MEMBERS 2 1 50%
TOTAL 100 55 55%
Out of the 100 questionnaires dispatched to ZETDC staff, the overall response rate
was 55%. The highest response was obtained from executive management who
registered a 66.7% return rate mainly due to the small number of 3 that was
considered and 2 responded. Except for junior staff which recorded a 40 % response
rate, all the other management levels of staff recorded an above 50% response rate
an above average representation giving a fairly reasonable figure across all staff
levels to validate the findings of the study.

4.2 DEMOGRAPHIC RESPONSE
4.2.1 LEVEL OF EXPERIENCE
Figure 4.2.1 Response by years of experience
The study shows that about 40%
between 5 and 10 years in ZETDC, followed by those above 10 years who
36% of the respondents and those between 2 and 5 years recorded
responses whilst the least number of
years in ZETDC. This again validates the study in that the majority of the
respondents were conversant with the operations at ZETDC.
4.2.2 LEVEL OF EDUCATION
Figure 4.2.2 level of education
LESS THAN 2 YEARS
2-5 YEARS
5-10 YEARS
ABOVE 10 YEARS
LEV
EL
OF
EX
PE
RIE
NC
E
LEVEL OF EXPERIENCE IN ZETDC
DIPLOMA
36%
CERTIFICATE
9%
RESPONSE BY LEVEL OF EDUCATION
DEMOGRAPHIC RESPONSE
IENCE IN ZETDC
Figure 4.2.1 Response by years of experience
about 40% of the respondents were those who had stayed
between 5 and 10 years in ZETDC, followed by those above 10 years who
and those between 2 and 5 years recorded
responses whilst the least number of 9% of respondents was from those be
years in ZETDC. This again validates the study in that the majority of the
respondents were conversant with the operations at ZETDC.
LEVEL OF EDUCATION
Figure 4.2.2 level of education
9%
15%
40%
36%
LEVEL OF EXPERIENCE IN ZETDC
Number of respondents
MASTER
DEGREE
22%
UNDERGRADUATE
DEGREE
33%
CERTIFICATE
9%
RESPONSE BY LEVEL OF EDUCATION
69
those who had stayed
between 5 and 10 years in ZETDC, followed by those above 10 years who made up
and those between 2 and 5 years recorded 15% of the total
respondents was from those below 2
years in ZETDC. This again validates the study in that the majority of the
40%
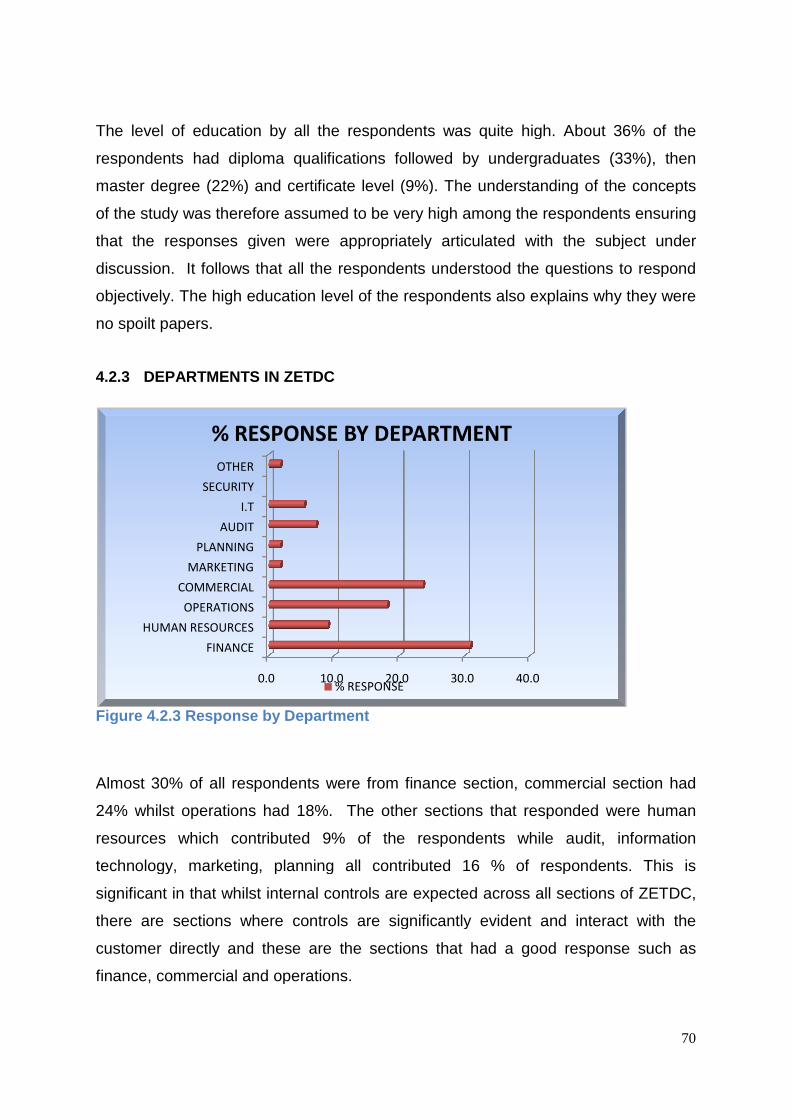
The level of education by all the respondents was quite high.
respondents had diploma qualifications followed by undergraduates (33%), then
master degree (22%) and certificate level (9%). The understanding of the concepts
of the study was therefore assumed to be very high among the respondents ensuring
that the responses given were appropriately articulated with the subject under
discussion. It follows that all the respondents understood the questions to respond
objectively. The high educa
no spoilt papers.
4.2.3 DEPARTMENTS IN ZETDC
Figure 4.2.3 Response by Department
Almost 30% of all respondents
24% whilst operations had 18%. The other sections that responded were human
resources which contributed 9% of the respondents while audit, information
technology, marketing, planning all contributed 16 % of respondents. This is
significant in that whilst internal controls are expected across all sections of ZETDC,
there are sections where controls are significantly evident and interact with the
customer directly and these are the sections that had a good response such as
finance, commercial and operations.
0.0
FINANCE
HUMAN RESOURCES
OPERATIONS
COMMERCIAL
MARKETING
PLANNING
AUDIT
I.T
SECURITY
OTHER
% RESPONSE BY DEPARTMENT
The level of education by all the respondents was quite high. About
had diploma qualifications followed by undergraduates (33%), then
master degree (22%) and certificate level (9%). The understanding of the concepts
therefore assumed to be very high among the respondents ensuring
that the responses given were appropriately articulated with the subject under
discussion. It follows that all the respondents understood the questions to respond
objectively. The high education level of the respondents also explains why they were
IN ZETDC
Figure 4.2.3 Response by Department
30% of all respondents were from finance section, commercial section had
24% whilst operations had 18%. The other sections that responded were human
resources which contributed 9% of the respondents while audit, information
technology, marketing, planning all contributed 16 % of respondents. This is
nificant in that whilst internal controls are expected across all sections of ZETDC,
there are sections where controls are significantly evident and interact with the
customer directly and these are the sections that had a good response such as
mmercial and operations.
10.0 20.0 30.0 40.0
% RESPONSE BY DEPARTMENT
% RESPONSE
70
About 36% of the
had diploma qualifications followed by undergraduates (33%), then
master degree (22%) and certificate level (9%). The understanding of the concepts
therefore assumed to be very high among the respondents ensuring
that the responses given were appropriately articulated with the subject under
discussion. It follows that all the respondents understood the questions to respond
tion level of the respondents also explains why they were
commercial section had
24% whilst operations had 18%. The other sections that responded were human
resources which contributed 9% of the respondents while audit, information
technology, marketing, planning all contributed 16 % of respondents. This is
nificant in that whilst internal controls are expected across all sections of ZETDC,
there are sections where controls are significantly evident and interact with the
customer directly and these are the sections that had a good response such as
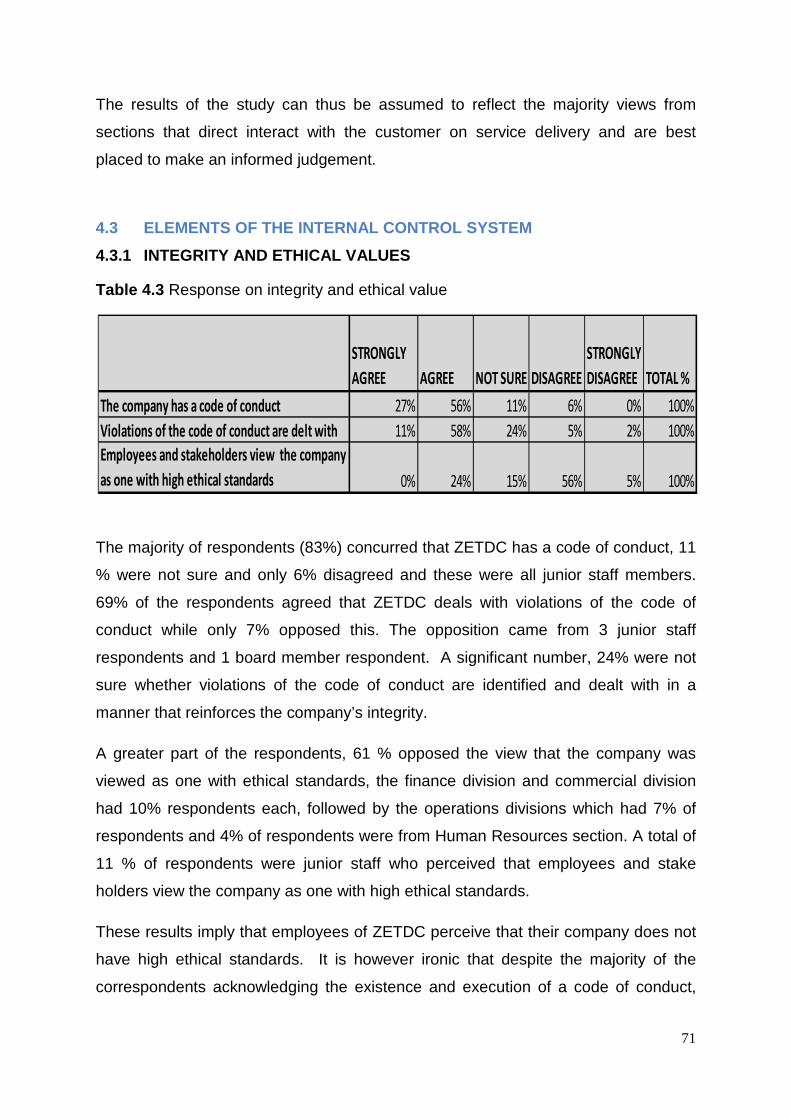
71
The results of the study can thus be assumed to reflect the majority views from
sections that direct interact with the customer on service delivery and are best
placed to make an informed judgement.
4.3 ELEMENTS OF THE INTERNAL CONTROL SYSTEM
4.3.1 INTEGRITY AND ETHICAL VALUES
Table 4.3 Response on integrity and ethical value
The majority of respondents (83%) concurred that ZETDC has a code of conduct, 11
% were not sure and only 6% disagreed and these were all junior staff members.
69% of the respondents agreed that ZETDC deals with violations of the code of
conduct while only 7% opposed this. The opposition came from 3 junior staff
respondents and 1 board member respondent. A significant number, 24% were not
sure whether violations of the code of conduct are identified and dealt with in a
manner that reinforces the company’s integrity.
A greater part of the respondents, 61 % opposed the view that the company was
viewed as one with ethical standards, the finance division and commercial division
had 10% respondents each, followed by the operations divisions which had 7% of
respondents and 4% of respondents were from Human Resources section. A total of
11 % of respondents were junior staff who perceived that employees and stake
holders view the company as one with high ethical standards.
These results imply that employees of ZETDC perceive that their company does not
have high ethical standards. It is however ironic that despite the majority of the
correspondents acknowledging the existence and execution of a code of conduct,
STRONGLY
AGREE AGREE NOT SURE DISAGREE
STRONGLY
DISAGREE TOTAL %
The company has a code of conduct 27% 56% 11% 6% 0% 100%
Violations of the code of conduct are delt with 11% 58% 24% 5% 2% 100%
Employees and stakeholders view the company
as one with high ethical standards 0% 24% 15% 56% 5% 100%
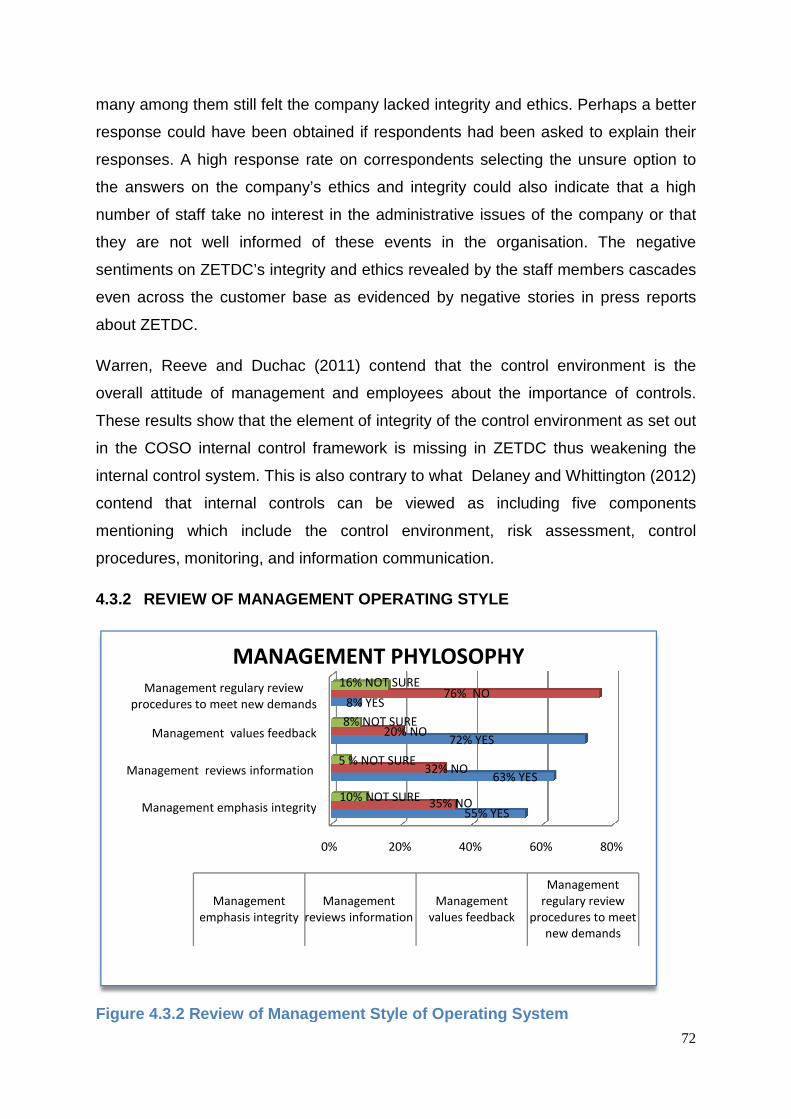
many among them still felt the company lacked integrity and ethics. Perhaps a better
response could have been obtained if respondents had been asked to explain t
responses. A high response rate on correspondents
the answers on the company’s ethics and integrity could also indicate that a high
number of staff take no interest in the administrative issues of the company
they are not well informed of these events in the organisation
sentiments on ZETDC’s integrity and ethics revealed by the staff members cascades
even across the customer base as
about ZETDC.
Warren, Reeve and Duchac (2011)
overall attitude of management and employees about the importance of controls.
These results show that the
in the COSO internal control framework is missing in ZETDC thus weakening the
internal control system. This
contend that internal controls can be viewed as including five components
mentioning which include
procedures, monitoring, and information communication.
4.3.2 REVIEW OF MANAGEMENT OPERATING
Figure 4.3.2 Review of Management
Management emphasis integrity
Management reviews information
Management values feedback
Management regulary review
procedures to meet new demands
Management
emphasis integrity
MANAGEMENT PHYLOSOPHY
many among them still felt the company lacked integrity and ethics. Perhaps a better
response could have been obtained if respondents had been asked to explain t
responses. A high response rate on correspondents selecting the
the company’s ethics and integrity could also indicate that a high
number of staff take no interest in the administrative issues of the company
y are not well informed of these events in the organisation
sentiments on ZETDC’s integrity and ethics revealed by the staff members cascades
across the customer base as evidenced by negative stories
Duchac (2011) contend that the control environment is the
overall attitude of management and employees about the importance of controls.
the element of integrity of the control environment
ternal control framework is missing in ZETDC thus weakening the
This is also contrary to what Delaney and Whittington (2012)
contend that internal controls can be viewed as including five components
mentioning which include the control environment, risk assessment, control
procedures, monitoring, and information communication.
MANAGEMENT OPERATING STYLE
Management Style of Operating System
0% 20% 40% 60%
Management emphasis integrity
Management reviews information
Management values feedback
Management regulary review
procedures to meet new demands
55% YES
63% YES
72% YES
8% YES
35% NO
32% NO
20% NO
76% NO
10% NOT SURE
5 % NOT SURE
8% NOT SURE
16% NOT SURE
Management
emphasis integrity
Management
reviews information
Management
values feedback
Management
regulary review
procedures to meet
new demands
MANAGEMENT PHYLOSOPHY
72
many among them still felt the company lacked integrity and ethics. Perhaps a better
response could have been obtained if respondents had been asked to explain their
selecting the unsure option to
the company’s ethics and integrity could also indicate that a high
number of staff take no interest in the administrative issues of the company or that
y are not well informed of these events in the organisation. The negative
sentiments on ZETDC’s integrity and ethics revealed by the staff members cascades
evidenced by negative stories in press reports
contend that the control environment is the
overall attitude of management and employees about the importance of controls.
the control environment as set out
ternal control framework is missing in ZETDC thus weakening the
Delaney and Whittington (2012)
contend that internal controls can be viewed as including five components
ontrol environment, risk assessment, control
80%
Management
regulary review
procedures to meet
new demands
73
Figure 4.3.4 shows that slightly above half of the respondents, agreed that
management emphasises the importance of integrity in financial reporting with
disproval emanating from 45% of junior staff and 37% supervisory staff who made up
the 35% no response. This could largely be due to too many reporting layers within
the organisation effectively creating a top down communication gap. Almost three
quarters (72%) of all correspondents agreed that management values customer
feedback whereas 24% of junior staff and 25% of supervisory staff did not agree,
constituting 20% of the total no answers by respondents. Management was found
wanting in the review of procedures to meet new customer demands as 76 % of
respondents did not agree and twice as much as those who agreed were not sure
that management were reviewing control procedures. However, respondents were
overwhelmingly in support that management values customer feedback as 72% of
respondents agreed while 63% of respondents also agreed that management had
processes in place to review information before it goes public.
The COSO framework describes the control environment as the foundation for all
other components of internal control, noting that it is the board and senior
management who establish the tone from the top regarding the importance of
internal control and expected standards of conduct and thus ZETDC partially fulfils
this aspects.
4.3.3 THE ORGANISATIONAL STRUCTURE AND INTERNAL CON TROL
Respondents were asked four questions on the internal control systems of the
organisational structure and the responses are highlighted as follows;

Figure 4.3.3 Responses on Organisational Structure
Responses to the four questions on ZETDC’s structure on internal control
majority of affirmative answers except on the qu
82% of the respondents agreed that there are human resources policies that are
designed to promote internal controls and 13% did not agree, while 5% were not
sure. On the other hand, 65% of respondents also agreed that ther
of authority and responsibilities for all individuals whereas 27% did not agree while
8% were unsure.
Furthermore, a total of 78% of the respondents confirmed the commitment of ZETDC
to hiring competent individuals, 16% did not concur w
Despite the majority 61% respondents affirming that performance evaluations were
consistent with promoting internal controls, a significant 25% of respondents did not
agree, as well as 14% respondents who were not sure whether this
position. There were more respondents (45%) who did not agree that the
organisational structure facilitates communication than those who agreed (35%)
while 25% of the respondents were not sure.
In all the four questions on ZETDC’s structur
management all had ‘Yes’ answers to their responses whilst the majority in the junior
staff members preferred a ‘not sure’ answer hence a high rate of ‘not sure’
responses to all the four questions.
Org structure facilitates communication
Perf evaluations promote internal controls
Org committed to hire competent indiv
Clear lines of authority and responsibility
established
HR policies designed to promote internal
controls
Figure 4.3.3 Responses on Organisational Structure
Responses to the four questions on ZETDC’s structure on internal control
majority of affirmative answers except on the question for communication.
82% of the respondents agreed that there are human resources policies that are
designed to promote internal controls and 13% did not agree, while 5% were not
sure. On the other hand, 65% of respondents also agreed that ther
of authority and responsibilities for all individuals whereas 27% did not agree while
Furthermore, a total of 78% of the respondents confirmed the commitment of ZETDC
to hiring competent individuals, 16% did not concur while 6% remained unsure.
Despite the majority 61% respondents affirming that performance evaluations were
consistent with promoting internal controls, a significant 25% of respondents did not
agree, as well as 14% respondents who were not sure whether this
position. There were more respondents (45%) who did not agree that the
organisational structure facilitates communication than those who agreed (35%)
while 25% of the respondents were not sure.
In all the four questions on ZETDC’s structure, board member, executive and senior
management all had ‘Yes’ answers to their responses whilst the majority in the junior
staff members preferred a ‘not sure’ answer hence a high rate of ‘not sure’
responses to all the four questions.
0 10 20 30 40 50 60 70
Org structure facilitates communication
Perf evaluations promote internal controls
Org committed to hire competent indiv
Clear lines of authority and responsibility
established
HR policies designed to promote internal
controls
35% Y
61% Y
78% Y
65% Y
82% Y
45% N
25% N
16% N
27% N
13% N
20% NS
14% NS
6% NS
8% NS
5% NSNOT SURE NO YES
74
Responses to the four questions on ZETDC’s structure on internal controls had the
estion for communication. About
82% of the respondents agreed that there are human resources policies that are
designed to promote internal controls and 13% did not agree, while 5% were not
sure. On the other hand, 65% of respondents also agreed that there are clear lines
of authority and responsibilities for all individuals whereas 27% did not agree while
Furthermore, a total of 78% of the respondents confirmed the commitment of ZETDC
hile 6% remained unsure.
Despite the majority 61% respondents affirming that performance evaluations were
consistent with promoting internal controls, a significant 25% of respondents did not
agree, as well as 14% respondents who were not sure whether this was indeed the
position. There were more respondents (45%) who did not agree that the
organisational structure facilitates communication than those who agreed (35%)
e, board member, executive and senior
management all had ‘Yes’ answers to their responses whilst the majority in the junior
staff members preferred a ‘not sure’ answer hence a high rate of ‘not sure’
70 80 90
78% Y
82% Y
75
It can be assumed that the senior executive of ZETDC are protective of the
organisational structure as they are highly involved in its creation whereas junior staff
members are unwilling to comment on the structure as they are not privy to its
production. However, there were a substantial number of junior staff respondents
that selected either a ‘Yes’ or ‘No’ answer than those with a ‘Not Sure’ responses to
validate the responses on the organisational structure of ZETDC.
The results support the views noted by Needles, Powers, and Crosson (2010) who
argue that employees must understand exactly what their functions are if they are to
effectively communicate within the organisation. The business’s organisational
structure is viewed as the framework for planning and controlling operations clearly
delineating roles and responsibilities.
4.4 STATE OF THE INTERNAL CONTROL SYSTEM
A total of seven questions were put across to respondents to ascertain the current
state of the internal control system in ZETDC. The questions covered issues on type
of controls, internal control frameworks, internal control reviews and internal control
breaches.
4.4.1 FORMS OF INTERNAL CONTROLS
Respondents were asked whether in their sections they were preventative, detective,
corrective or other controls or to respond if there were no controls at all. Results
reveal that most respondents either did not understand the listed type of controls or
did not have confidence that the type of controls were operational.
Table 4.4.1 Forms of Internal Controls at ZETDC

76
Results from the finance sections indicated that 47% of respondents believe that
there are preventative controls, 82 % believe there are detective controls and 47%
believe that there are corrective controls. However, all respondents in the human
resources and planning departments believe they have preventative controls while
all respondents in Audit and Information technology believe they have detective
controls. There is a significantly high number of respondents who are not sure of the
type of controls in their departments. There were 50% respondents from the
operations department who were not sure whether they have preventative controls
and 30% were not sure whether they have detective controls, on the other hand, in
finance 35% of respondents were not sure whether they had preventative controls
while 24% were also not sure whether they had corrective controls.
However results for departments such as audit, information technology, marketing
and planning need to be viewed with caution as there were very few respondents
numbering 4, 3 and 1 each respectively. It follows that a number of ZETDC staff are
unaware of the forms of controls governing the very operations they perform.
These results do not fully support the idea by Hall (2012) who describes internal
controls as a shield composed of three levels of controls, preventative, detective and
corrective controls. According to Hall (2012), preventative controls force compliance
with prescribed or desired actions and thus screen out aberrant events.
TYPE OF CONTROLS BY DEPARTMENTS
YES FINANCE HUMAN
RESOURCES
OPERATIONS COMMERCIAL MARKETING PLANNING AUDIT I.T OTHER
Preventative 47 100 20 54 0 100 50 67 100
Detective 82 60 50 38 0 0 100 100 0
Corrective 47 60 80 85 0 100 25 0 0
NO
Preventative 18 0 30 15 100 0 50 33 0
Detective 12 33 20 46 0 0 0 0 0
Corrective 29 20 20 0 0 0 75 0 100
NOT SURE
Preventative 35 0 50 31 0 0 0 0 0
Detective 6 7 30 15 100 100 0 0 100
Corrective 24 20 0 15 100 0 0 100 0
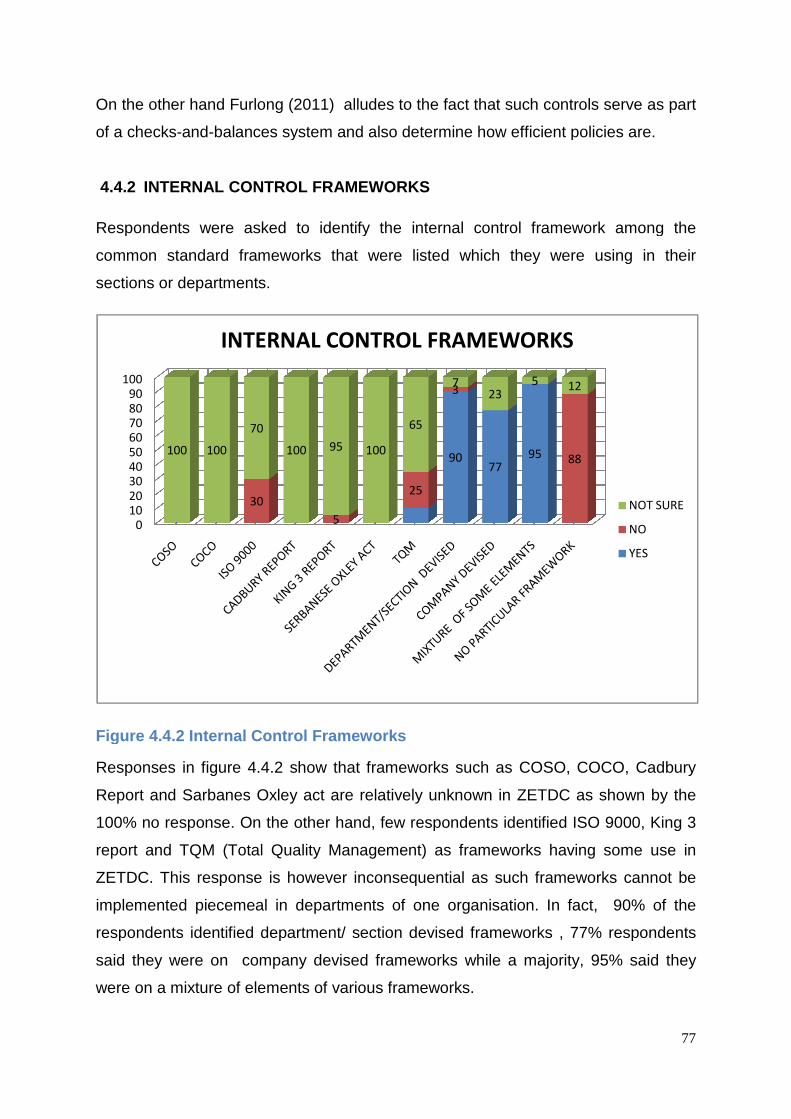
On the other hand Furlong (2011) allude
of a checks-and-balances system and also determine how efficient policies are.
4.4.2 INTERNAL CONTROL FRA
Respondents were asked to identify the internal control framework among the
common standard frameworks that were listed which they were using in their
sections or departments.
Figure 4.4.2 Internal Control Frameworks
Responses in figure 4.4.2 show that frameworks such as COSO, COCO, Cadbury
Report and Sarbanes Oxley act are relatively unknown in
100% no response. On the other hand, few respondents identified ISO 9000, King 3
report and TQM (Total Quality Management) as frameworks having some use in
ZETDC. This response is however inconsequential as such frameworks cannot be
implemented piecemeal in
respondents identified department/ section devised frameworks , 77% respondents
said they were on company devised frameworks while a majority, 95% said they
were on a mixture of elements of various frameworks.
0102030405060708090
100
30
100 100
70
INTERNAL CONTROL FRAMEWORKS
urlong (2011) alludes to the fact that such controls serve as part
balances system and also determine how efficient policies are.
INTERNAL CONTROL FRA MEWORKS
Respondents were asked to identify the internal control framework among the
meworks that were listed which they were using in their
Figure 4.4.2 Internal Control Frameworks
Responses in figure 4.4.2 show that frameworks such as COSO, COCO, Cadbury
Report and Sarbanes Oxley act are relatively unknown in ZETDC as shown by the
100% no response. On the other hand, few respondents identified ISO 9000, King 3
report and TQM (Total Quality Management) as frameworks having some use in
ZETDC. This response is however inconsequential as such frameworks cannot be
mplemented piecemeal in departments of one organisation. In fact, 90% of the
respondents identified department/ section devised frameworks , 77% respondents
said they were on company devised frameworks while a majority, 95% said they
elements of various frameworks.
9077
95
5
25
3
88100 95 100
65
723
5 12
INTERNAL CONTROL FRAMEWORKS
77
to the fact that such controls serve as part
balances system and also determine how efficient policies are.
Respondents were asked to identify the internal control framework among the
meworks that were listed which they were using in their
Responses in figure 4.4.2 show that frameworks such as COSO, COCO, Cadbury
ZETDC as shown by the
100% no response. On the other hand, few respondents identified ISO 9000, King 3
report and TQM (Total Quality Management) as frameworks having some use in
ZETDC. This response is however inconsequential as such frameworks cannot be
one organisation. In fact, 90% of the
respondents identified department/ section devised frameworks , 77% respondents
said they were on company devised frameworks while a majority, 95% said they
88
12
INTERNAL CONTROL FRAMEWORKS
NOT SURE
NO
YES

78
Some of the respondents’ answers indicate that they were showing that they knew
some of the frameworks rather than using them. This is particularly evident by the
responses on TQM (Total Quality Management) which attracted different
responses.TQM is a familiar topic for many workshops and it can be assumed that
many of the respondents had attended one such workshop.
The results show that ZETDC does not follow any known specific framework in its
design of its control system but largely relies on its own company devised and
department devised internal control design.
These results are in contradiction to what Moeller (2011) observed, that over the
years the COSO internal controls framework has become the worldwide guidance
standard for defining, describing, and assessing internal controls.
4.4.3 REVIEW OF THE INTERNAL CONTROL SYSTEM
Table 4.4 Responses to Internal Control Reviews
In Table 4.4 all the respondents agreed that some form of internal control reviews
are done with many respondents, that is 92%, indicating that reconciliations are done
as a review of internal controls. Audit checks were confirmed by 89% of the
respondents while 78% also indicated that they had some form of structured reports
as a control review measure.
YES NO NOT SURE TOTAL
Spot checks 66 12 22 100
Regular reports 78 12 10 100
Audit checks 89 6 5 100
Statutory checks 8 36 56 100
Peer reviews 3 66 31 100
Reconci l iations 92 3 5 100
No reviews are done 0 100 0 100
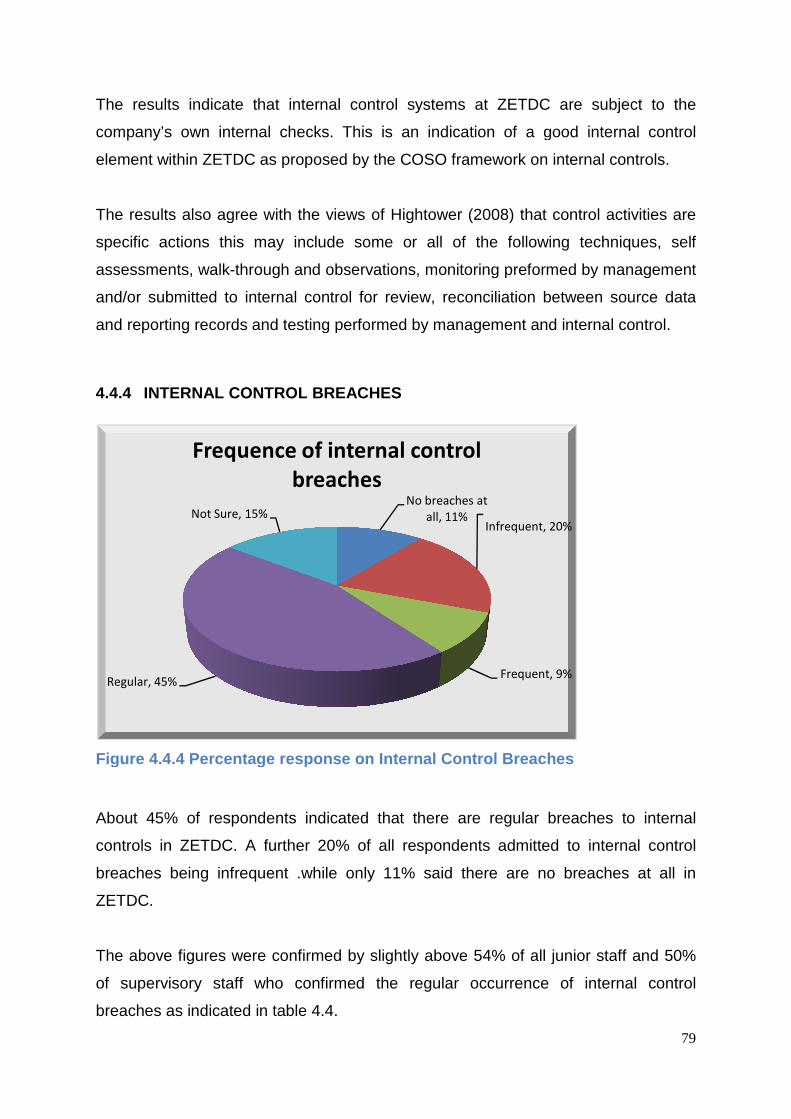
The results indicate that internal control systems at ZETDC are subject to
company’s own internal checks. This is
element within ZETDC as proposed by the COSO framework on internal controls.
The results also agree with the views of
specific actions this may include some or all of the following techniques
assessments, walk-through and observations
and/or submitted to internal control for review
and reporting records and t
4.4.4 INTERNAL CONTROL
Figure 4.4.4 Percentage response on Internal Contro l Breaches
About 45% of respondents
controls in ZETDC. A further 20% of all respondents admitted to internal control
breaches being infrequent .while only 11% said there are no breaches at all in
ZETDC.
The above figures were confirmed
of supervisory staff who confirmed the regular occurrence of internal control
breaches as indicated in table 4.4.
Regular, 45%
Not Sure, 15%
Frequence of internal control
The results indicate that internal control systems at ZETDC are subject to
own internal checks. This is an indication of a good internal control
element within ZETDC as proposed by the COSO framework on internal controls.
The results also agree with the views of Hightower (2008) that control activities
specific actions this may include some or all of the following techniques
through and observations, monitoring preformed by management
and/or submitted to internal control for review, reconciliation between source data
testing performed by management and internal control.
INTERNAL CONTROL BREACHES
Figure 4.4.4 Percentage response on Internal Contro l Breaches
of respondents indicated that there are regular breaches to internal
A further 20% of all respondents admitted to internal control
infrequent .while only 11% said there are no breaches at all in
confirmed by slightly above 54% of all junior sta
of supervisory staff who confirmed the regular occurrence of internal control
n table 4.4.
No breaches at
all, 11%Infrequent, 20%
Frequent, 9%
Frequence of internal control
breaches
79
The results indicate that internal control systems at ZETDC are subject to the
an indication of a good internal control
element within ZETDC as proposed by the COSO framework on internal controls.
control activities are
specific actions this may include some or all of the following techniques, self
onitoring preformed by management
econciliation between source data
esting performed by management and internal control.
Figure 4.4.4 Percentage response on Internal Contro l Breaches
breaches to internal
A further 20% of all respondents admitted to internal control
infrequent .while only 11% said there are no breaches at all in
54% of all junior staff and 50%
of supervisory staff who confirmed the regular occurrence of internal control

Table 4.4.4 Level of Staff Responses to Internal Control Breaches
This high response of admissions of internal control breaches is an indication of the
ineffectiveness of the control systems in ZETDC
The COSO framework also acknowledges the limitations of internal controls which
result from the quality and suitability of objectives, human judgement frailties in
decision making, cost versus benefit decisions, human failures, collusions between
people and management overrides.
4.4.5 CAUSES OF INTERNAL C
Figure 4.4.4 Causes of Internal Control Breaches
A bout 17% of respondents
of internal control breaches. Other causes identified by respondents include self
enrichments and systems shortcomings which were both identified by 16% of the
respondents. Management override wa
none of which were either board, executive or senior management members.
of the respondents indicated that fatigue was a cause of internal control breaches.
LEVEL OF STAFFJUNIOR STAFFSUPERVISORYMIDDLE MANAGEMENTSENIOR MANAGEMENTEXECUTIVE MANAGEMENTBOARD MEMBERS
Staff fatigue
Staff rewards
17%
Disgruntlements
14%
Self enrichment
16%
Table 4.4.4 Level of Staff Responses to Internal Control Breaches
of admissions of internal control breaches is an indication of the
ineffectiveness of the control systems in ZETDC that are subject to regular breaches.
The COSO framework also acknowledges the limitations of internal controls which
result from the quality and suitability of objectives, human judgement frailties in
decision making, cost versus benefit decisions, human failures, collusions between
d management overrides.
CAUSES OF INTERNAL C ONTROL BREACHES
Figure 4.4.4 Causes of Internal Control Breaches
bout 17% of respondents identified low staff rewards as one of the major causes
of internal control breaches. Other causes identified by respondents include self
enrichments and systems shortcomings which were both identified by 16% of the
respondents. Management override was also identified by 15% of the respondents,
none of which were either board, executive or senior management members.
of the respondents indicated that fatigue was a cause of internal control breaches.
No breach Infrequent Frequent Regular
3% 12% 11% 54%
50% 0 0 50%
17% 50% 0 17%
0 67% 0 33%
0 100% 0 0
0 0 100% 0
Staff
Incompetence
11%Management
override
Systems
shortcomings
Staff collusion
11%
Staff fatigue
0%
Self enrichment
16%
80
of admissions of internal control breaches is an indication of the
that are subject to regular breaches.
The COSO framework also acknowledges the limitations of internal controls which
result from the quality and suitability of objectives, human judgement frailties in
decision making, cost versus benefit decisions, human failures, collusions between
identified low staff rewards as one of the major causes
of internal control breaches. Other causes identified by respondents include self
enrichments and systems shortcomings which were both identified by 16% of the
s also identified by 15% of the respondents,
none of which were either board, executive or senior management members. None
of the respondents indicated that fatigue was a cause of internal control breaches.
Not Sure TOTAL
54% 20% 100%
50% 0 100%
17% 16% 100%
33% 0 100%
0 0 100%
0 0 100%
Management
override
15%
Systems
shortcomings
16%
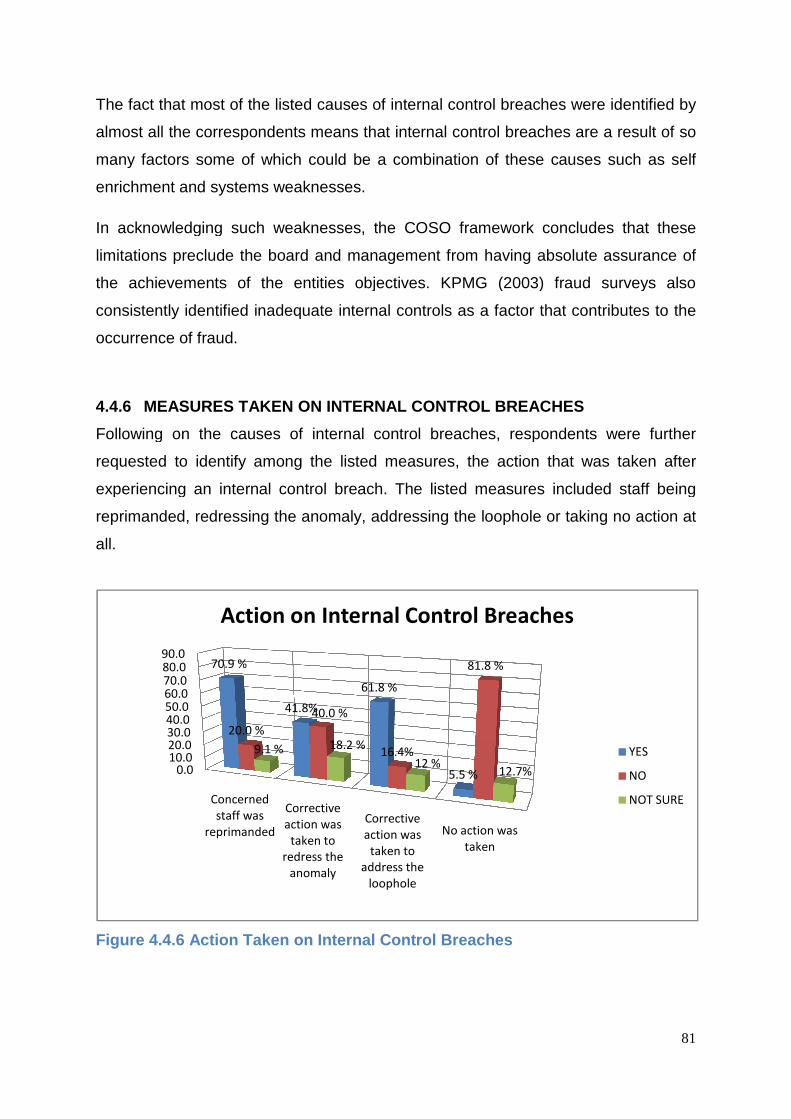
The fact that most of the listed causes of
almost all the correspondents means that internal control breaches are a result of so
many factors some of which could be a combination
enrichment and systems weaknesses.
In acknowledging such weaknesses, t
limitations preclude the board and management from having absolute assurance of
the achievements of the entities objectives
consistently identified inadequate i
occurrence of fraud.
4.4.6 MEASURES TAKEN ON IN
Following on the causes of internal control breaches, respondents were further
requested to identify among the listed measures, the
experiencing an internal control breach. The listed measures included staff being
reprimanded, redressing the anomaly, addressing the loophole or taking no action at
all.
Figure 4.4.6 Action Taken on Internal Control
0.010.020.030.040.050.060.070.080.090.0
Concerned
staff was
reprimanded
Corrective
action was
redress the
70.9 %
41.8%
20.0 %
9.1 %
Action on Internal Control Breaches
The fact that most of the listed causes of internal control breaches were identified by
almost all the correspondents means that internal control breaches are a result of so
many factors some of which could be a combination of these causes
enrichment and systems weaknesses.
edging such weaknesses, the COSO framework concludes that these
limitations preclude the board and management from having absolute assurance of
the achievements of the entities objectives. KPMG (2003) fraud surveys also
consistently identified inadequate internal controls as a factor that contributes to the
MEASURES TAKEN ON IN TERNAL CONTROL BREAC HES
Following on the causes of internal control breaches, respondents were further
requested to identify among the listed measures, the action that was taken after
experiencing an internal control breach. The listed measures included staff being
reprimanded, redressing the anomaly, addressing the loophole or taking no action at
Figure 4.4.6 Action Taken on Internal Control Breaches
Corrective
action was
taken to
redress the
anomaly
Corrective
action was
taken to
address the
loophole
No action was
taken
41.8%
61.8 %
5.5 %
40.0 %
16.4%
81.8 %
18.2 %
12 %12.7%
Action on Internal Control Breaches
81
internal control breaches were identified by
almost all the correspondents means that internal control breaches are a result of so
of these causes such as self
concludes that these
limitations preclude the board and management from having absolute assurance of
(2003) fraud surveys also
that contributes to the
HES
Following on the causes of internal control breaches, respondents were further
action that was taken after
experiencing an internal control breach. The listed measures included staff being
reprimanded, redressing the anomaly, addressing the loophole or taking no action at
Action on Internal Control Breaches
YES
NO
NOT SURE

82
Figure 4.4.6 indicates that almost 80% of respondents agreed that staff who
breached internal controls were reprimanded, that is provided they were discovered,
while 20% believe that staff were not reprimanded and 10% were not sure. ZETDC
staff were inconclusive on whether action was taken to redress the anomaly with
42% agreeing that action was taken whilst 40% did not agree and 18% were not
sure. There were however conclusive responses on addressing internal control
loopholes with 62% of the respondents agreeing that action was taken to address
the loophole .Above 80% of the respondents disagreed that no action was taken on
internal control breaches.
The above results indicate that ZETDC is strong in dealing with culprits who breach
internal controls and also strong in addressing the identified loopholes while not
making similar efforts in redressing the anomaly. This could mean that many
customers are left to face their dilemma alone without any compensation where loss
is involved with ZETDC.
The results go against the elements of risk assessment as advised in the COSO
framework on internal controls. In making reference to the COSO framework Moeller
(2009) describes risk assessment as a three step process beginning with 1.
Estimation of the significance of the risk. 2. Assessing the likelihood or frequency of
the risk occurring and 3. Considering how the risk should be managed and
assessing what actions must be taken. (p. 39).
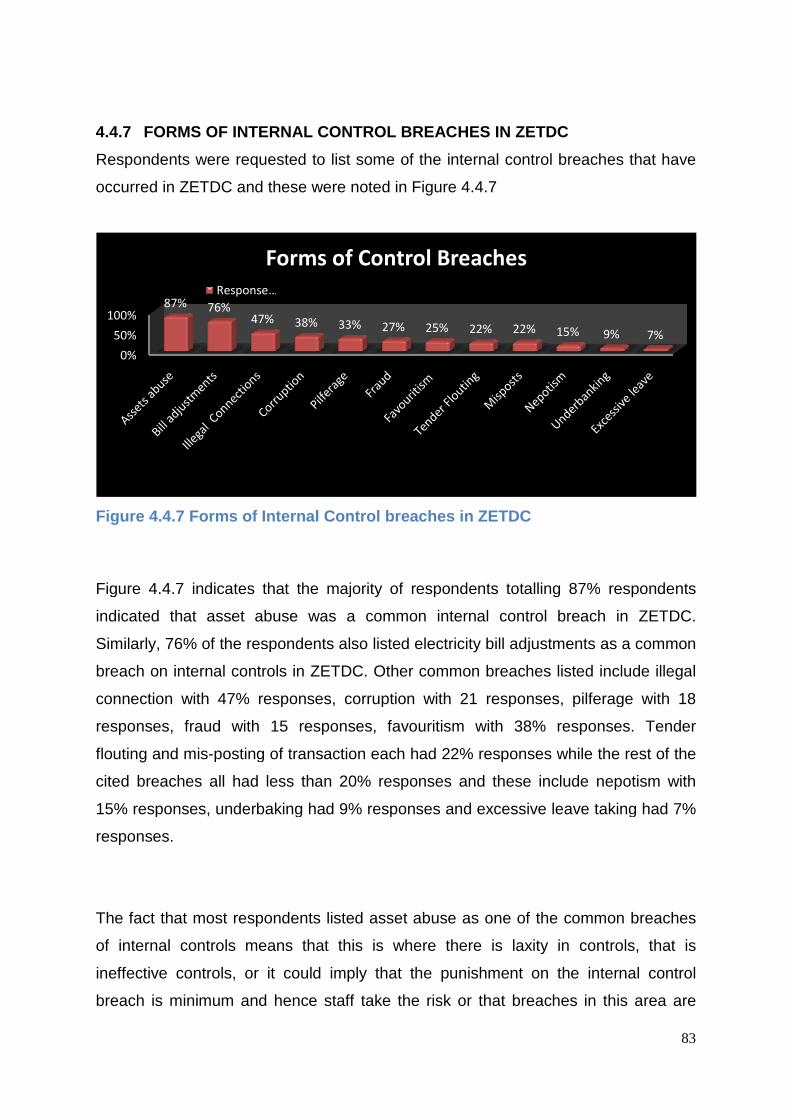
4.4.7 FORMS OF INTERNAL CONTROL BRE
Respondents were requested to list some of the internal control breaches that have
occurred in ZETDC and these were noted in Figure 4.4.7
Figure 4.4.7 Forms of Internal Control breaches in ZETDC
Figure 4.4.7 indicates that the majority of respondents totalling
indicated that asset abuse was a common internal control breach in ZETDC.
Similarly, 76% of the respondents also listed
breach on internal controls in ZETDC. Other common breaches listed include illega
connection with 47% responses, corruption with 21 responses, pilferage with 18
responses, fraud with 15 responses, favouritism with
flouting and mis-posting of transaction each had
cited breaches all had less than
15% responses, underbaking had
responses.
The fact that most respondents listed asset abuse as one of the common breaches
of internal controls means that this is where there is laxity in controls,
ineffective controls, or it could imply that the punishment on the internal control
breach is minimum and hence staff take the risk or that breaches in this a
0%
50%
100%87% 76%
47%
Forms of Control Breaches
Response …
INTERNAL CONTROL BRE ACHES IN ZETDC
were requested to list some of the internal control breaches that have
occurred in ZETDC and these were noted in Figure 4.4.7
of Internal Control breaches in ZETDC
Figure 4.4.7 indicates that the majority of respondents totalling 87%
indicated that asset abuse was a common internal control breach in ZETDC.
respondents also listed electricity bill adjustments as a common
breach on internal controls in ZETDC. Other common breaches listed include illega
responses, corruption with 21 responses, pilferage with 18
responses, fraud with 15 responses, favouritism with 38% responses. Tender
posting of transaction each had 22% responses while the rest of the
all had less than 20% responses and these include nepotism with
responses, underbaking had 9% responses and excessive leave taking had
The fact that most respondents listed asset abuse as one of the common breaches
eans that this is where there is laxity in controls,
or it could imply that the punishment on the internal control
breach is minimum and hence staff take the risk or that breaches in this a
38% 33% 27% 25% 22% 22% 15%
Forms of Control Breaches
83
were requested to list some of the internal control breaches that have
87% respondents
indicated that asset abuse was a common internal control breach in ZETDC.
ill adjustments as a common
breach on internal controls in ZETDC. Other common breaches listed include illegal
responses, corruption with 21 responses, pilferage with 18
responses. Tender
responses while the rest of the
responses and these include nepotism with
responses and excessive leave taking had 7%
The fact that most respondents listed asset abuse as one of the common breaches
eans that this is where there is laxity in controls, that is
or it could imply that the punishment on the internal control
breach is minimum and hence staff take the risk or that breaches in this area are
15% 9% 7%
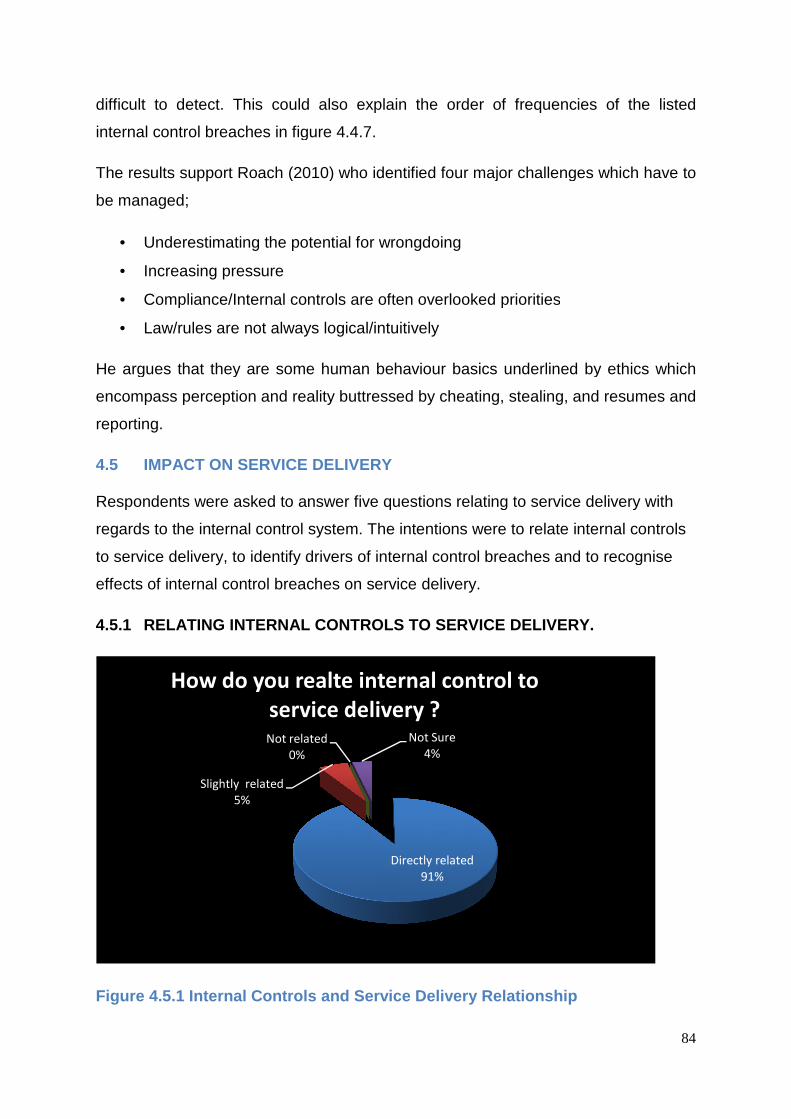
difficult to detect. This cou
internal control breaches in figure 4.4
The results support Roach (2010) who identified four major challenges which have to
be managed;
• Underestimating the potential for wrongdoing
• Increasing pressure
• Compliance/Internal controls are often overlooked priorities
• Law/rules are not always logical/intuitively
He argues that they are some human behaviour basics underlined by ethics which
encompass perception and reality buttressed by cheating, stea
reporting.
4.5 IMPACT ON SERVICE DELIVERY
Respondents were asked to answer five questions relating to service delivery with
regards to the internal control system. The intentions were to relate internal controls
to service delivery, to identify drivers of internal control breaches and to recognise
effects of internal control breaches on service delivery.
4.5.1 RELATING INTERNAL CO
Figure 4.5.1 I nternal Controls
Slightly related
5%
Not related
How do you realte internal control to
service delivery ?
difficult to detect. This could also explain the order of frequencies of the listed
in figure 4.4.7.
Roach (2010) who identified four major challenges which have to
Underestimating the potential for wrongdoing
Compliance/Internal controls are often overlooked priorities
Law/rules are not always logical/intuitively
He argues that they are some human behaviour basics underlined by ethics which
encompass perception and reality buttressed by cheating, stealing, and resumes and
IMPACT ON SERVICE DELIVERY
Respondents were asked to answer five questions relating to service delivery with
regards to the internal control system. The intentions were to relate internal controls
to identify drivers of internal control breaches and to recognise
effects of internal control breaches on service delivery.
RELATING INTERNAL CO NTROLS TO SERVICE DELIVERY.
nternal Controls and Service Delivery Relationship
Directly related
91%
Not related
0%
Not Sure
4%
How do you realte internal control to
service delivery ?
84
the order of frequencies of the listed
Roach (2010) who identified four major challenges which have to
He argues that they are some human behaviour basics underlined by ethics which
ling, and resumes and
Respondents were asked to answer five questions relating to service delivery with
regards to the internal control system. The intentions were to relate internal controls
to identify drivers of internal control breaches and to recognise
LIVERY.
Relationship

Figure 4.5.1 indicates that almost all respondents (91%) indicated that internal
controls are directly related to service delivery while 5% thought that there are
slightly related and 4% were not sure while none said they were not related.
This shows that ZETDC staf
also affects service delivery directly and that the importance one places on internal
controls is a reflection of the type of service one is likely to offer.
The results support the view by
Ramamoorti (2010) who argu
services or products without good controls over service delivery or manufacturing
processes, it cannot produce consistently reliable financial statements without good
internal controls over financial reporting.
4.5.2 SERVICES AFFECTED BY
Respondents were requested to indicate from a provided list those services that they
think were most likely affected by internal control breaches
rated to be mostly affected by internal control breaches
0%
Financial reports production
Electricity bill production
New connections
Electricity Fault repairs
Connection quotations
Load shedding
Customer Enquiries
Disconnections
Meter reading
Supplier selection
Staff recruitment
Cash receipting
SERVICES WITH MOST INTERNAL CONTROL BREACHES
.1 indicates that almost all respondents (91%) indicated that internal
controls are directly related to service delivery while 5% thought that there are
slightly related and 4% were not sure while none said they were not related.
This shows that ZETDC staff is aware that any issues that affect internal controls
also affects service delivery directly and that the importance one places on internal
controls is a reflection of the type of service one is likely to offer.
The results support the view by Braiotta, Gazzaway, Colson
argues that just as an organisation cannot produce reliable
services or products without good controls over service delivery or manufacturing
processes, it cannot produce consistently reliable financial statements without good
trols over financial reporting.
SERVICES AFFECTED BY INTERNAL CONTROL BRE ACHES
Respondents were requested to indicate from a provided list those services that they
think were most likely affected by internal control breaches. The results for services
to be mostly affected by internal control breaches are depicted in Figure 4.5.2.
0% 10% 20% 30% 40% 50% 60% 70% 80%
18%
65%
38%
40%
18%
55%
20%
80%
27%
44%
78%
53%
SERVICES WITH MOST INTERNAL CONTROL BREACHES
85
.1 indicates that almost all respondents (91%) indicated that internal
controls are directly related to service delivery while 5% thought that there are
slightly related and 4% were not sure while none said they were not related.
f is aware that any issues that affect internal controls
also affects service delivery directly and that the importance one places on internal
Colson, Colson and
that just as an organisation cannot produce reliable
services or products without good controls over service delivery or manufacturing
processes, it cannot produce consistently reliable financial statements without good
ACHES
Respondents were requested to indicate from a provided list those services that they
The results for services
are depicted in Figure 4.5.2.
SERVICES WITH MOST INTERNAL CONTROL BREACHES
Material Breaches

Figure 4.5.2 Services most affected by Internal Con trol Breaches
The results in Figure 4.5.2 show that the majority of respondents (80%) ind
that disconnection of customers for non payment was the most service affected by
internal control breaches with almost a similar number of respondents (78%) also
citing Staff recruitment as another common service affected by internal control
breaches.
Other services noted by most respondents include electricity bill production (65.5%),
load shedding (55%) and cash receipting (53%) which were cited by over 50% of the
respondents.
These results are an indication that internal control breaches affect a
number of services in ZETDC and are not limited to activities that involve customers
but internal activities as well such as staff recruitment and financial reports.
The results also indicate what
controls can cause unintentional errors in accrual estimations to occur and impact on
the reported book value or earnings of a company. They further allude to the fact that
weak internal controls could also impede the timely recognition of losses.
4.5.3 IMPACT OF INTERNAL C
Respondents were asked to identify the impact that could have resulted on services
due to internal control breaches.
Figure 4.5.3 Impact on service delivery
0.0
50.0
100.0
Services
were not
done
Services were
delayed
100 % 100%
IMPACT ON SERVICE DELIVERY
Figure 4.5.2 Services most affected by Internal Con trol Breaches
The results in Figure 4.5.2 show that the majority of respondents (80%) ind
that disconnection of customers for non payment was the most service affected by
internal control breaches with almost a similar number of respondents (78%) also
citing Staff recruitment as another common service affected by internal control
Other services noted by most respondents include electricity bill production (65.5%),
load shedding (55%) and cash receipting (53%) which were cited by over 50% of the
These results are an indication that internal control breaches affect a
number of services in ZETDC and are not limited to activities that involve customers
but internal activities as well such as staff recruitment and financial reports.
The results also indicate what Goh and Li (2010) observed, that weak interna
controls can cause unintentional errors in accrual estimations to occur and impact on
the reported book value or earnings of a company. They further allude to the fact that
weak internal controls could also impede the timely recognition of losses.
IMPACT OF INTERNAL C ONTROL BREACHES ON S ERVICE DELIVERY.
Respondents were asked to identify the impact that could have resulted on services
due to internal control breaches.
Figure 4.5.3 Impact on service delivery
Services were
delayed Services were
substandardServices cost
moreNo Impact on
service
100% 100% 100%
0.0
IMPACT ON SERVICE DELIVERY
86
Figure 4.5.2 Services most affected by Internal Con trol Breaches
The results in Figure 4.5.2 show that the majority of respondents (80%) indicated
that disconnection of customers for non payment was the most service affected by
internal control breaches with almost a similar number of respondents (78%) also
citing Staff recruitment as another common service affected by internal control
Other services noted by most respondents include electricity bill production (65.5%),
load shedding (55%) and cash receipting (53%) which were cited by over 50% of the
These results are an indication that internal control breaches affect a significant
number of services in ZETDC and are not limited to activities that involve customers
but internal activities as well such as staff recruitment and financial reports.
Goh and Li (2010) observed, that weak internal
controls can cause unintentional errors in accrual estimations to occur and impact on
the reported book value or earnings of a company. They further allude to the fact that
weak internal controls could also impede the timely recognition of losses.
ERVICE DELIVERY.
Respondents were asked to identify the impact that could have resulted on services
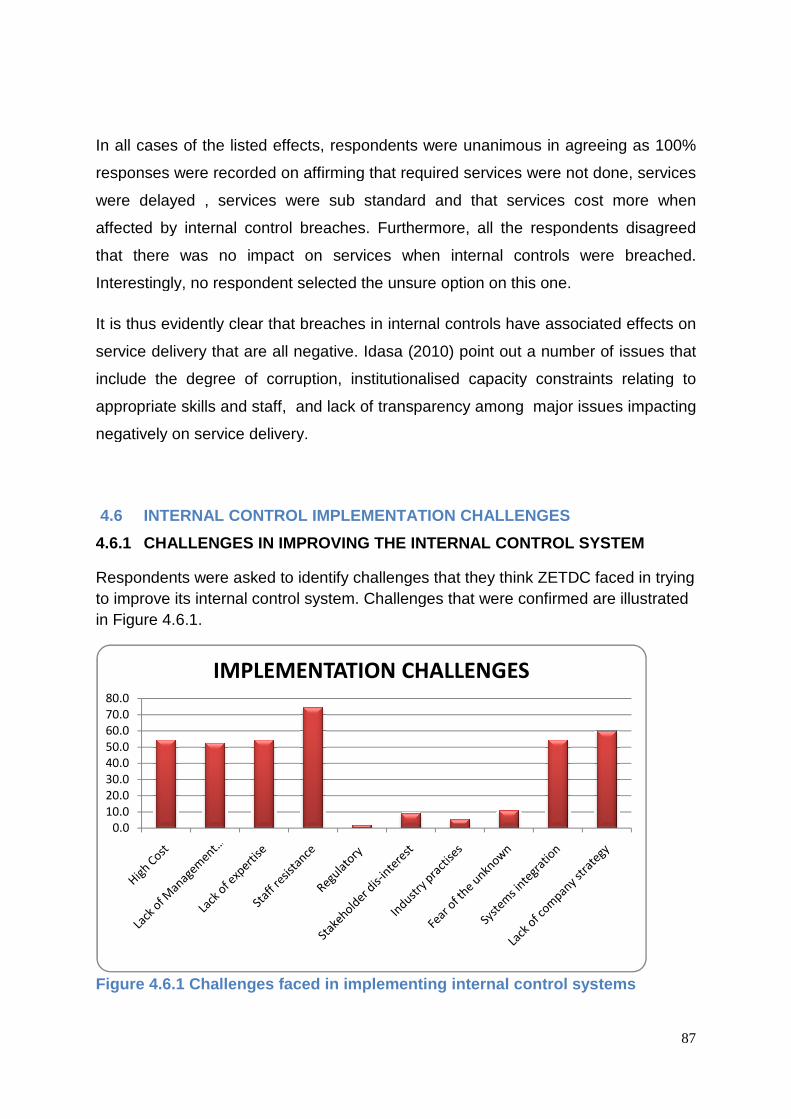
In all cases of the listed effec
responses were recorded on affirming that required services were not done, services
were delayed , services were sub standard and that services cost more when
affected by internal control breaches. Further
that there was no impact on services when internal controls were breached.
Interestingly, no respondent
It is thus evidently clear that breaches in internal controls have associate
service delivery that are all negative.
include the degree of corruption, institutionalised capacity constraints relating to
appropriate skills and staff, and lack of transparency among major is
negatively on service delivery.
4.6 INTERNAL CONTROL IMPLEMENTATION CHALLENGES
4.6.1 CHALLENGES IN IMPROV
Respondents were asked to identify challenges that they think ZETDC faced in trying to improve its internal control system. Challenges that were confirmed are illustrated in Figure 4.6.1.
Figure 4.6.1 Challenges faced in implementing inter nal control systems
0.0
10.0
20.0
30.0
40.0
50.0
60.0
70.0
80.0
IMPLEMENTATION CHALLENGES
In all cases of the listed effects, respondents were unanimous in agreeing as 100%
responses were recorded on affirming that required services were not done, services
were delayed , services were sub standard and that services cost more when
affected by internal control breaches. Furthermore, all the respondents disagreed
no impact on services when internal controls were breached.
Interestingly, no respondent selected the unsure option on this one.
It is thus evidently clear that breaches in internal controls have associate
service delivery that are all negative. Idasa (2010) point out a number of issues that
include the degree of corruption, institutionalised capacity constraints relating to
appropriate skills and staff, and lack of transparency among major is
negatively on service delivery.
INTERNAL CONTROL IMPLEMENTATION CHALLENGES
CHALLENGES IN IMPROV ING THE INTERNAL CONTROL SYSTEM
Respondents were asked to identify challenges that they think ZETDC faced in trying ernal control system. Challenges that were confirmed are illustrated
Figure 4.6.1 Challenges faced in implementing inter nal control systems
IMPLEMENTATION CHALLENGES
87
ts, respondents were unanimous in agreeing as 100%
responses were recorded on affirming that required services were not done, services
were delayed , services were sub standard and that services cost more when
more, all the respondents disagreed
no impact on services when internal controls were breached.
It is thus evidently clear that breaches in internal controls have associated effects on
Idasa (2010) point out a number of issues that
include the degree of corruption, institutionalised capacity constraints relating to
appropriate skills and staff, and lack of transparency among major issues impacting
TROL SYSTEM
Respondents were asked to identify challenges that they think ZETDC faced in trying ernal control system. Challenges that were confirmed are illustrated
Figure 4.6.1 Challenges faced in implementing inter nal control systems

88
Staff resistance was identified by 75% of the respondents as the major obstacle in
implementing internal control improvements. Another major challenge was lack of
company strategy where 60% of respondents agreed that it is a hindrance in
improving internal controls. Slightly above half of all the respondents (55%) identified
systems integration, lack of expertise, lack of management interest and high cost as
further obstacles that hinder internal control improvements.
While some the identified challenges may appear to be beyond the influence of
ZETDC, such as high costs, the majority if not all of the challenges can all be tackled
by ZETDC.
These challenges support Roach (2010), who identified that internal control basics
such as appropriate procedures, training, thoughtful metrics, management
commitment, audits and reviews and discipline for non-compliance underline the
internal control challenges that have to be managed.
4.6.2 TECHNOLOGICAL INNOVATION IN INTERNAL CONTROLS
The proliferation of technology in recent years has put pressure upon organisation to
keep pace or face extinction. In light of technological advancements, respondents
were asked to confirm or deny whether ZETDC was responding to the technological
environment with particular reference to internal controls.

Figure 4.6.2 Responses to ZETDC’s technological ado ption
The results as illustrated by figure 4.6.2 show that all respondents disagreed that
ZETDC has not moved to new technologies while all agreeing that it is in the
processing of implementing new technologies. Furthermore, 78% of the respondents
noted that ZETDC was assessin
company had up to date technologies in the management of its internal control
system.
These results indicate that ZETDC is making some attempts to move in line with
technological demands that are now the
internal control system.
Brown and Nasuti (as cited by Kumar, Pollanen and Maheshwari, 2008) identified
several technical problems that related to designing, implementing and managing
enterprise architecture. Am
inadequate security and differences in infrastructure as major challenges for
companies that want to implement SOX (Sarbanes
their internal control designs.
The company has up to date technology
The company is implementing new technology
The company is assessing technology options
The company has not changed to new
technologies
Has company adopted new technologies ?
Figure 4.6.2 Responses to ZETDC’s technological ado ption
illustrated by figure 4.6.2 show that all respondents disagreed that
ZETDC has not moved to new technologies while all agreeing that it is in the
processing of implementing new technologies. Furthermore, 78% of the respondents
noted that ZETDC was assessing technological options while 60% disagreed that the
company had up to date technologies in the management of its internal control
These results indicate that ZETDC is making some attempts to move in line with
technological demands that are now the world trend in its endeavour to manage its
Brown and Nasuti (as cited by Kumar, Pollanen and Maheshwari, 2008) identified
several technical problems that related to designing, implementing and managing
enterprise architecture. Among the identified problems were data structures,
inadequate security and differences in infrastructure as major challenges for
companies that want to implement SOX (Sarbanes – Oxley Act) hence impacting on
their internal control designs.
0.0 20.0 40.0 60.0 80.0
The company has up to date technology
The company is implementing new technology
The company is assessing technology options
The company has not changed to new
technologies
YES, 30.9 %
YES, 0.0
NO, 60.0 %
NO, 0.0
NO, 16.4 %
NOT SURE, 9.1 %
NOT SURE, 0.0
NOT SURE, 5.5 %
NOT SURE, 0.0
Has company adopted new technologies ?
89
illustrated by figure 4.6.2 show that all respondents disagreed that
ZETDC has not moved to new technologies while all agreeing that it is in the
processing of implementing new technologies. Furthermore, 78% of the respondents
g technological options while 60% disagreed that the
company had up to date technologies in the management of its internal control
These results indicate that ZETDC is making some attempts to move in line with
world trend in its endeavour to manage its
Brown and Nasuti (as cited by Kumar, Pollanen and Maheshwari, 2008) identified
several technical problems that related to designing, implementing and managing
ong the identified problems were data structures,
inadequate security and differences in infrastructure as major challenges for
Oxley Act) hence impacting on
80.0 100.0
YES, 100%
YES, 78.2 %
NO, 60.0 %
NO, 100%
Has company adopted new technologies ?

90
CHAPTER SUMMARY
In this chapter the findings based on a sample from ZETDC’s staff, management and
board’s perception of the company’s internal control system was presented,
analysed and discussed. The conclusion and recommendations now follow in the
next chapter.
91
CHAPTER 5
CONLUSION AND RECOMMENDATIONS
5.0 INTRODUCTION
The chapter presents the study conclusion and recommendations. The study
conclusion will put to test the research proposition to either accept or refute it.
5.1 CONCLUSION
5.1.1 STATE OF INTERNAL CONTROL SYSTEM IN ZETDC
In conclusion, ZETDC has an internal control system that is company devised which
is also buttressed by departments and section devised internal control systems. The
internal control system in ZETDC has elements of a good internal control system
similar to those found in the widely used COSO framework which however is not
used and is not known by ZETDC. Some of the internal control elements found in
ZETDC include a control environment as revealed by the availability of a code of
conduct and management’s operational philosophy which emphasises on integrity in
reporting and the reviewing of all information before it goes to the public. Also
evident in ZETDC’s internal control system is the strong organisational structure
which has human resources policies that promote internal controls, clear lines of
authority and the hiring of competent staff. Elements of preventative, detective and
corrective controls were also found to be present in ZETDC as was the review of
controls through reports, spot checks, reconciliations and audits.
However, they were areas that were noted that had weaknesses and these include
the company’s poor image perception by both employees and stakeholders, poor
communication in the organisation buttressed by the high number of staff who were
not sure of the administrative activities in the organisation, such as dealing with
violations of the code of conduct.
It was also noted that the company while implementing new technologies had not yet
adopted up to date technologies in internal control systems management.
92
5.1.2 INTERNAL CONTROL BREACHES
In conclusion, the study also noted that the breaching of internal controls was regular
thus making the internal controls ineffective. Internal control breaches were driven by
low staff rewards, self enrichments and internal control systems deficiencies.
Activities that manifest in internal control breaches at ZETDC include assets abuse,
electricity bill adjustments and illegal power connections.
5.1.2 IMPACT ON SERVICE DELIVERY
In conclusion, internal controls are directly related to service delivery and any
breaches on internal controls directly affect services. The most common services
affected by internal control breaches in ZETDC include customer disconnections for
non payment, staff recruitment, electricity bill production and load shedding. The
impact on service delivery is that the service is not done, the service is delayed, the
service is substandard and/or the service may cost more.
5.1.3 INTERNAL CONTROL IMPLEMENTATION CHALLENGES
In conclusion, the most common challenges faced by ZETDC in implementing
internal control systems include staff resistance, lack of a company strategy,
integration of complex systems, lack of management interest and the associated
high costs of implementation.
5.2 TEST OF THE STUDY PROPOSITION
The research proposition maintains that ZETDC has an ineffective internal control
system that has resulted in poor service delivery. Results of the study indicate that
ZETDC has a self devised internal control system not based on any known
framework which is regularly breached resulting in services not done, being delayed,
substandard and costing more.
It is therefore clearly apparent that the internal control system in ZETDC is ineffective
and result in poor service delivery thus the research proposition is accepted.
93
5.3 RECOMMENDATIONS
5.3.1 INTERNAL CONTROL FRAMEWORK
ZETDC is highly recommended to adopt an internationally recognised internal
control framework such as COSO. This will enable the company to model its internal
controls along international standards that are widely accepted and capable of
standard regular reviews. This will also enable ZETDC to benchmark its performance
against similar organisations that use such international frameworks.
5.3.2 ORGANISATIONAL STRUCTURE
There are too many hierarchical levels of staff in ZETDC resulting in a long
hierarchical structure that negatively affects information communication in both top -
down and bottom- up approaches. It is therefore recommended that ZETDC should
adopt a flat structure that facilitates communication with not more than three levels of
hierarchical staff.
5.3.3 INTERNAL CONTROL CHALLENGES
ZETDC should focus on multi-skilling its staff to be able to rotate staff regulary and
avoid familiarity as repetitive tasks have enabled staff to breach systems regularly.
The company should deal and be seen to be dealing decisively with any control
breaches to bring confidence in both staff and stakeholders. ZETDC should also
implement change management to prepare staff for any systems changes within the
company to manage staff resistance to internal control systems implementation.
5.4 AREA OF FURTHER STUDY The research recommends further study in the area of adoption of the COSO internal
control framework by local Zimbabwean organisations.

94
REFERENCES
Abramson, J., and Abramson, Z. H . (2011). Research Methods in Community
Medicine: Surveys, Epidemiological Research, Programme Evaluation,
Clinical Trials (6th Edition). John Wiley and Sons.
Adebayo, A., and Annukka, J. (2009). Strategy, Control Activities, Monitoring and
Effectiveness. Managerial Auditing Journal, 24(6), 500 - 522.
Alexander, M. (2011). Microsoft Access 2007 Data Analysis . John Wiley and Sons.
Amudo, A., and Inanga, E. L. (2009). Evaluation of Internal Control Systems: A
case study from Uganda. International Research Journal of Finance and
Economics, Euro Journals Publishing, 27. Retrieved from
http://eurojournals.com
Armstrong, M. (2010). Armstrong’s Essential Human Resource Management
Practice: A Guide to People Management (11th Edition). Kogan Page
Publishers.
Athanasiou, T., and Darzi, A . (2010). Key Topics in Surgical Research and
Methodology. Springer
Babbie, E.R. (2010). The Practise of Social Research (12th Edition). Wadsworth
Cengage Learning.
Bachman, R., and Schutt, R. K . (2010). The practise of Research in Criminology
and Criminal Justice (4th Edition). SAGE.
Baxter, P. and Jack, S. (2008). Qualitative Case Study Methodology: Study Design
and Implementation for Novice Researchers. The Qualitative Report. 13(4),
544-559.
Beasley. M. S., Branson, B. C., and Hancock, B. V. (2010). COSO’s 2010 report
on ERM. Current State of Enterprise Risk Oversight and Market Perception of
COSO’s ERM Framework. Committee of Sponsoring Organisation of the
Treadway Commission. [Document]. Retrieved from http://www.coso.org
95
Berger, A. A. (2010). Media and Communication Research Methods. An
Introduction to Qualitative and Quantitative Approaches (2nd Edition). Sage
Publication Inc.
Bizmanualz. (2008) . Finance and Treasury Procedures for Compliance and
Performance. A Guide to Meeting Compliance Requirements and Improving
Financial Planning. Author.
Blaikie, N .(2009). Designing Social research. Polity
Braiotta, L. Jr., Gazzaway, T., Colson, R., Colson, R. H., and Ramamoorti, S.
(2010). The Audit Committee Handbook. John Wiley and Sons.
Brennan, K. (2009). A guide to the Business Analysis Body of Knowledge (Babok
Guide). IIBA.
Burke, F.M., Guy, D. M., and Tatum, K. W. (2008), Audit Committees: A Guide for
Directors, management and Consultants (5th Edition). CCH.
Butcher, J., Wanna, J., and Freyens, B. (2009). Policy in Action: The challenge of
Service Delivery. UNSW Press.
Bwititi, K. (2011, September 17). ZESA: A thorn in flesh. Zimpapers. Retrieved from
http://www.zimpapers.co.zw.
Cambridge Business Dictionary online . (2012). Definition of service delivery.
Retrieved from http://www.dictionary.cambridge.org
Cannon, D. L. (2011). Cisa Certified Information Systems Auditor Study Guide (3rd
Edition). West Sussex, United Kingdom. John Wiley and Sons.
Cendrowski, H., and Mair, W. C. (2009). Enterprise Risk Management and COSO:
A Guide for Directors, Executives and Practitioners. John Wiley and Sons.
Chambers, A. and Rand, G . (2011). The Operational Auditing Handbook: Auditing
Business and IT Processes (2nd Edition). John Wiley and Sons.
Chen, K.-T., and Lee, R. M. (2008). Schematic Evaluation of Internal Accounting
Control Systems, Euridis Research Monograph. Erasmus University.

96
Churchill, G. A., and lacobucci, D. (2009). Marketing Research: Methodological
Foundations (10th Edition). Cengage Learning.
Coderre, D. (2009). Computer Aided Fraud Prevention and Detection. A Step by
Step Guide. John Wiley and Sons
Collier, P. M., and Agyei-Ampomah, S. (2008). CIMA Official learning. Systems
Management Accounting and Control Strategy (2009 edition), Butterworth-
Heinemann.
Collins, H . (2010). Creative Research: The theory and Practise of Research for the
Creative Industries. AVA Publishing.
Committee of Sponsoring Organisation of the Treadwa y Commission . (2012).
Welcome to COSO. Retrieved from http://www.coso.org
Connaway, L. S., and Powell, R . (2010). Basic Research Methods for Librarians
(5th Edition). ABC-CLIO.
Consumers slam ZESA tariff hike . (2011, February 21). The Herald Online.
Retrieved from http://www.herald.co.zw.
Dawidowicz, P. (2010). Literature reviews made easy; A quick guide to success.
Charlotte NC Information Age Publishers.
de Koker, L . (2011). Aligning anti-money laundering, combating of financing of terror
and financial inclusion: Questions to consider when FATF standards are
clarified. Journal of Financial Crime, 18 (4), 361 – 386.
Delaney, P. R., Whittington, R. O., and Delaney, P. R. (2011). Wiley CPA Exam
Review 2012. Business Environment and Concepts.
Deloitte . Zimbabwe Tip – offs Anonymous. (2012). Employee Feedback Bulletin.
1(2012).
DeLuccia, IV J. J. (2008). I T Compliance and Controls. Best practises for
Implementation. John Wiley and Sons
Electricity Act [Chapter 13:09] . (2002). Government Printers

97
Elmes, D. G., Kantowitz, B. H., and Roediger, III H . L. (2011). Research Methods
in Psychology (9th Edition). Cengage Learning
Farawo, T. (2010, September 28). Fraud Costs ZESA US $3m. The Herald Online.
Retrieved from http://www.herald.co.zw
Fleak, S. K., Harrison, K. E., andTurner, L. A. (2010). Issues in Accounting
Education. Nov2010. 25(4), 709-720.
Furlong, M. (2011). What Are the Types of Internal Controls? Retrieved from
www.ehow.com (2012, May 2)
Gelinas, Jr. U. J., Dull, R. B., and Wheeler, P. R. , (2011). Accounting Information
Systems ( 9th Edition). Cengage Learning.
Gerring, J. (2007). Case Study research: principles and practises. Cambridge
University Press.
Gibson, P. (2011). The world of customer service (3rd Edition). Cengage Learning.
Goh, B. W., and Li, D. (2010). Internal Control and Conditional Conservatism.
Accounting Review. 86 (3,2011) Retrieved from http//
ssrn.com/abstract=1340286
Graham, L. (2010). Complying with Sarbanes-Oxley Section 404: A guide for Small
Publicly Held Companies. John Wiley and Sons.
Gravetter, F. J., and Forzano, L-A. (2011). Research Methods for the Behavioural
Sciences (4th Edition). Cengage Learning.
Grinnell, Jr, R. M., and Unrau, Y. A. (2010). Social Work Research and Evaluation :
Foundations of Evidence Based Practise (9th Edition). Oxford University
Press.
Groves, R. M., Fowler, F. J. Jr., Couper, M.P., Lep kowski, J. M., Singer, E., and
Tourangeau, R. (2011). Survey Methodology (2nd Edition). John Wiley and
Sons.
Gumbo, L. (2012, March 23). ZESA billing woes to stay. The Herald Online.
Retrieved from http://www.herald.co.zw

98
Hall, J. A. (2012). Accounting Information Systems (8th Edition). Cengage Learning.
Harare Residents Trust. (2012, March 9). ZESA Billing system chaotic. The
Financial Gazette. Retrieved from http://www.fingaz.co.zw.
Harrer, J. (2008). Internal Control Strategies, A Mid to Small Business Guide. John
Wiley and Sons.
Heintz, J. A., and Parry, R. W. (2010). College Accounting, Instructor’s 20th Edition.
South Western. Cengage learning.
Hightower, R. (2008). Internal Controls Policies and Procedures. Hoboken, New
Jersey. John Wiley and Sons.
Hopkin, P. (2012). Fundamentals of risk management: Understanding evaluating,
and implementing effective risk management (2nd Edition). Great Britain.
Kogan Page Publishers.
Houser, J. (2011). Nursing Research : Reading, Using, and Creating Evidence (2nd
Edition). Jones and Bartlett Publishers.
Hua-Wei, H. (2009). Sarbanes-Oxley section 404 compliance: Recent changes in
US-traded foreign firm’s internal control reporting. Managerial Auditing
Journal . 24( 6), 584 – 598.
IDASA (2010). An African Democracy Institute. The State of Local Government and
Service Delivery In Southern Africa: Challenges and Solutions. IDASA Local
Governance Unit. Retrieved from http://www.idasa.org
Ika, S. R., and GHazali, M. N. A. (2012). Audit committee effectiveness and
timeliness of reporting : Indonesia evidence. Managerial Auditing Journal. 27
(4). 403-424.
Index Mundi . (2012). Zimbabwe Economy profile 2012. Retrieved from
http://www.indexmundi.com
Internal Control Guidance for Directors on Combined Code. (2009). The Institute
of Chartered Accountants in England and Wales.
99
Johnstone, K., Gramling, G., and Rittenberg, L. E. (2011). Auditing A Business
Risk Approach, International Edition (8th Edition). South-Western Cengage
Learning.
Khothari, C.R. (2008). Research Methodology, Methods and Techniques (2nd
Edition). New Age International.
Kumar, V., Pollanen, R., and Maheshwari, B. (2008). Challenges In Enhancing
Enterprise Resource Planning Systems for Compliance With Sarbanes-Oxley
Act and Analogous Canadian Legislation. Management Research News.
31(10) 758 – 773.
Langa, V. (2012, February 14). Ministers’ ZESA scandal exposed. Newsday.
Retrieved from http://www.newsday.co.zw
Leitch, M. (2008). Intelligent Internal Control and Risk Management: Designing High
Performance Risk Systems. Gower Publishing, Ltd.
Lessem, R., and Schieffer, A. (2010). Integral Research and Innovation :
Transforming Enterprise and Society. Gower Publishing.
Levy, P. S., and Lemeshow, S. (2011). Sampling and Populations : Methods and
Applications (4th Edition). John Wiley and Sons
Liamputtong, P. (2011). Focus Group Methodology :Principles and Practise . SAGE
Publications
Lindorff, D. (2012). Building a Better ERM. Treasury and Risk Magazine. (2012
February). Retrieved from http://www.treasuryandrisk.com
Lohr, S. L . (2009). Sampling :Design and analysis (2nd Edition). Cengange Learning.
Lu, H., Richardson, G.D., and Salterio, S. (2011). Direct and Indirect Effects of
Internal Control Weaknesses on Accrual Quality : Evidence from a Unique
Canadian Regulatory Setting. Contemporary Accounting Research.
Summer2011. 28 ( 2), 675-707.
Machin, D. , Campbell, M. J., Tan , S. B., and Tan, S. H. (2011). Sample Size Tables
for Clinical Studies( 3rd Edition). John Wiley and Sons.
100
Mapimhidze, R. (2012, April 14). Nerve- racking power bills from ZESA. Newsday.
Retrieved from http://www.newsday.co.zw.
Marczyk, G. K., DeMatteo, D., and Festinger, D. (2010). Essential of Research
Design and Methodology. Hoboken, NJ. John Wiley and Sons.
Marlow, C. R. (2010). Research Methods for Generalist Social Work. Cengage
Learning.
Marsden, P. V., and Wright, J. D. (2010). Handbook of Survey Research (2nd
Edition). Emerald Group Publishing.
McConnell, C.R. (2010). Umiker’s Management Skills for the New Health Care
Supervisor (5th Edition). Sudburry. Johns and Bartlett Learning.
Mendes, P. (2011). Demand Driven Supply Chain: A Structure and Practical
Roadmap to Increase profitability. London NY. Springer
Mennen, M. (2010). Applied Research Methods for Business and Management –
Job Satisfaction. GRIN Verlag.
Minelli, E., Rebora, G, and Turri, M. (2008). The risk of failure of controls and
levers of change: an examination of two Italian public sectors. Journal of
Accounting and Organizational Change. 4 (1), 5 – 26
Mitchell, M. L., and Jolley, J. M. (2009). Research Design Explained (7th Edition).
Cengage Learning Inc.
Mitchell, M. L., and Jolley, J. M. (2012). Research Design Explained (8th Edition).
Cengage Learning Inc.
Moeller, R. R. (2009). Brinks Modern Internal Auditing – A Common Body of
Knowledge (7th Edition). John Wiley and Sons.
Moller, B. (2010). Internal Control Systems Within the Framework of the 8th EU
Directive: Significance and Implementation in Companies-Master Thesis.
GRIN Verlag.
Mugowo, M. (2011, April 21). ZESA presses on with tariff hike. The Financial
Gazette. Retrieved from http://www.financialgazette.co.zw.

101
Mulli, B. K., and Ali, H. F. Professor. (2011). Review of Internal Control Systems.
Lambert Academic Publishing.
Mushava, E. (2011, October 24). ZESA fears collapse. The Daily News. Retrieved
from http://www.dailynews.co.zw
Ndlovu, P. (2010, August 23). ZESA attacked for load shedding. The Zimbabwean.
Retrieved from http://www.thezimbabwean.co.uk
Needles, B. E., Powers, M., and Crosson, S. V. (2010). Financial and Management
Accounting (9th Edition). Cengage Learning.
Nkala, O .(2011, May 6). ZESA fails to import power. The Daily News. Retrieved from
http://www.zimbabwesituation.com
OECD Rural Policy Reviews (2011): England, United Kingdom 2011. OECD
Publishing.
Oulte, D. (2011). Sampling Method: Scholarly Essay. GRIN Verlag
Pfister, J.A. (2009). Managing Organizational Culture for Effective Internal Control.
From Practise to Theory. Springer.
Picazo, O. F. and Zhao, F. (2009), Zambia Health Sector Public Expenditure
Review: Accounting for Resources to Improve Effective Service Coverage.
World Bank Publication.
Pickett, K. H. S., and Pickett, J. M. (CON). (2010). The Internal Auditing Handbook
(3rd Edition). John Wiley and Sons.
Piskurich, G. M. (2010). Rapid Instruction Design : Learning ID Fast and Right (2nd
Edition). John Wiley and Sons.
Ramos, M. J. (2008). How to Comply with Sarbanese-Oxley Section 404: Assessing
the Effectiveness of Internal Control (3rd Edition). Hoboken, NJ. John Wiley
and Sons.
Reserve Bank of Zimbabwe . (2012, February 16). Press Statement by the
Governor on Measures to Improve Liquidity. Retrieved from http://
http://www.rbz.co.zw
102
Rich, J., Jones, J., Mowen, M., and Hansen, D. (2011). Cornerstones of Financial
accounting (2nd Edition). South- Western, Cengage Learning.
Rittenberg, L. E., Johnston, K., Gramling, A. A., a nd Schwieger, B. (2009).
Auditing: A Business Risk Approach (7th Edition). South Western Cengage
Learning.
Rittenberg, L. E., Johnstone, K., and Gramling, A. (2011). Auditing: A Business
Risk Approach (8Th Edition). South- Western, Cengage Learning.
Roach JD, D.R. (2010). Internal Control Challenges in a Down Economy. [HFMA
Northern California Meeting March 25 and26, 2010 Sacramento, California].
Catholic Healthcare West. Retrieved from http://www.ussc.gov/orguide.htm
Runatsa, E. (2011) An Evaluation of the Effectiveness of Internal Control Systems
as a Corporate Governance Instrument in State Institutions, The Case of the
University of Zimbabwe (2007-2010). Graduate School of Management.
University of Zimbabwe Dissertation.
Rushton, A., Croucher, P., and Baker, P. (2010). The Handbook of Logistics and
Distribution Management ( 4th Edition). London UK. Kogan Page Publishers.
Salkind, N. J. ( 2010). Encyclopaedia of Research Design (Volume 3). Sage
Publication.
Schneider, A. (2009). Auditors internal control opinions: do they influence
judgements about investments?. Managerial Auditing Journal. 24(8). 709-723.
Scott, L. (2011). African American Male Academic Success ,Universal Publishers.
Sekaran, U., and Bougie, R. (2010). Research Methods for Business : A Skill
Building Approach (5th Edition). John Wiley and Sons.
Sibanda, T. (2011, October 27). Hundreds march through Bulawayo to protest
ZESA failures. SW Radio Africa. Retrieved from
http://www.swradioafrica.com
Simmons, H. (2009). Case Study Research in Practice. Sage Publication Ltd.
103
Snow, D. and Yanovitch, T. (2009), Unleashing Excellence: The complete guide to
Ultimate Customer Service ( 2nd Edition). Hoboken, NJ. John Wiley and Sons
Soh, D. B., and Martinov-Bennie, N. (2011). The Internal Audit Function:
Perceptions of Internal Audit Roles, Effectiveness and Evaluation. Managerial
Auditing Journal. 26( 7), 605 – 622.
Soy, Susan K, (2007). The case study as a research method. Unpublished paper,
University of Texas at Austin.
Statement on Internal Controls. (2008). The Scottish Government. Retrieved from
http://www.scotland.gov.uk.
Stewart, J. M., Tittel, E., and Chapple, M. (2011). CISSP: Certified Information
Systems Security Professional Study Guide (5th Edition). John Wiley and
Sons.
SW Radio Africa . (2011, August 27). ZESA orders radical tariff increase. The
Zimbabwean. Retrieved from http://www.thezimbabwean.co.uk.
Swanson, R . A. (2009). Analysis for Improving performance : Tools for Diagnosing
Organisations and Documenting Workplace Expertise : Easyread Large
Edition (2nd Edition). Berrett- Koehler Publishers.
Tarantino, A. (2010). Operational Risk management in Financial Services. John
Wiley and Sons.
The Ministry of Finance Zimbabwe . (2012). The 2012 National Budget. Retrieved
from http://zimtreasury.gov.zw
Thompson, T. (2012). Sampling (3rd Edition). John Wiley and Sons.
Tshuma, S. (2009, December 4). ZESA continues bleeding. Zimbabwe Metro.
Retrieved from http:// www.zimbabwemetro.com
Tysiac, K. (2012). COSO postpones release of internal control framework until 1Q
3013. Journal of Accountancy. Retrieved from http://
www.journalofaccountancy.com

104
Ulf, N. (2009). Measuring and Regulating Extreme Risk. Journal of Financial
Regulation and Compliance. 17(2) , 156 – 171.
Understanding Internal controls. (2009). A Reference Guide for Managing
University Business Practises. University of California.
Vilsanoiu. D. and Serban, M. (2010). Changing Methodologies in Financial Audit
and Their Impact on Information Systems Audit. Informatica Economic. 14
(1/2010), 57-65.
Warren, C. S. (2012). Survey of Accounting (6th Edition). Cengange Learning.
Warren, C. S., Reeve, J. M., and Duchac, J. (2011). Financial and Managerial
Accounting (11th Edition). Cengage Learning.
Waymire, T. R. S. (2008). Internal and External Control Mechanism : The Impact of
Alignment on Market and Operating Performance. University of Arkansas,
ProQuest.
Weathington, B. L., Cunningham, C. J. L., and Pitte nger, D. J. (2010). Research
Methods for the Behavioural and Social Sciences. John Wiley and Sons.
Wellington, P. (2010). Effective customer care . London. Kogan Page Publishers.
Werner, J. M., and DeSimone, R. L. (2011). Human Resource Development (6th
Edition). South – Western Cengage Learning.
Wisner, D. J., Tan, K-C., and Leong, G. K. (2011), Principles of Supply Chain
Management : A Balanced Approach (3rd Edition).South Western Cengage
Learning.
Wood, M.J., and Ross-Kerr, J. C . (2011). Basic Steps in Planning Nursing
Research: From Questions to Proposal (7th Edition). Jones and Bartlett
Publishers.
Woodside, A. G. (2010). Case Study Research : Theory, Methods and Practise.
Emerald Group Publishing.
Yin, K. R. (2009). Case study research: Design and methods (4th Edition), Sage
Publications.
105
ZESA Boss fired. (2010, September 15). Zimbabwe Situation. Retrieved from
http://www.zimbabwesituation.org
ZESA unearths reconnection scum. (2012, February 17). The Chronicle. Retrieved
from http://www.chronicle.co.zw.
ZESA Generation Statistics (2012, March 13) Retrieved from http:// www.zesa.co.zw
ZETDC. (2009). Financial Blue Print
ZETDC. (2009). IT Business Plan
ZETDC. (2010). Annual Report
ZETDC. (2011). Customer Service Monitor Report
ZIMSTAT. (2012). Price Statistics. Latest Inflation Figures.(2012, April). Retrieved
from http:// www.zimstat.co.zw
Zvauya, C. and Kadirire, H. (2011, July 9). Disband ZESA. Daily News. Retrieved
from http://www.dailynews.co.zw.

106
APPENDIX 1.1.1A HARARE SUMMER LOAD SHEDDING TIME TA BLE
TABLE 1: AREA LOAD SHEDDING PERIODS DAY MORNING PEAK 5am-8am EVENING PEAK 5pm – 8pm
MONDAY
First areas to be affected
H1, H2, H3, H6, H7, H10, H11, H14, H15, H18, H19, H26, H27, H28, C1, C2
H4, H5, H8, H9, H12, H13, H16, H17, H22, H23, H25, H29, C3, C4, C5
Additional areas that could be affected
H4, H5, H8, H9, H12, H13, H16, H17, H22, H23, H25, H29, C3, C4, C5
H1, H2, H3, H6, H7, H10, H11, H14,
H15, H18, H19, H26, H27, H28, C1, C2
TUESDAY
First areas to be affected
H4, H5, H8, H9, H12, H13, H16, H17, H22, H23, H25, H29, C3, C4, C5
H1, H2, H3, H6, H7, H10, H11, H14, H15, H18, H19, H26, H27, H28, C1, C2
Additional areas that could be affected
H1, H2, H3, H6, H7, H10, H11, H14,
H15, H18, H19, H26, H27, H28, C1, C2
H4, H5, H8, H9, H12, H13, H16, H17, H22, H23, H25, H29, C3, C4, C5
WEDNESDAY
First areas to be affected
H1, H2, H3, H6, H7, H10, H11, H14, H15, H18, H19, H26, H27, H28, C1, C2
H4, H5, H8, H9, H12, H13, H16, H17, H22, H23, H25, H29, C3, C4, C5
Additional areas that could be affected
H4, H5, H8, H9, H12, H13, H16, H17, H22, H23, H25, H29, C3, C4, C5
H1, H2, H3, H6, H7, H10, H11, H14,
H15, H18, H19, H26, H27, H28, C1, C2
THURSDAY
First areas to be affected
H4, H5, H8, H9, H12, H13, H16, H17, H22, H23, H25, H29, C3, C4, C5
H1, H2, H3, H6, H7, H10, H11, H14, H15, H18, H19, H26, H27, H28, C1, C2
Additional areas that could be affected
H1, H2, H3, H6, H7, H10, H11, H14,
H15, H18, H19, H26, H27, H28, C1, C2
H4, H5, H8, H9, H12, H13, H16, H17, H22, H23, H25, H29, C3, C4, C5
FRIDAY
First areas to be affected
H1, H2, H3, H6, H7, H10, H11, H14, H15, H18, H19, H26, H27, H28, C1, C2
H4, H5, H8, H9, H12, H13, H16, H17, H22, H23, H25, H29, C3, C4, C5
Additional areas that could be affected
H4, H5, H8, H9, H12, H13, H16, H17, H22, H23, H25, H29, C3, C4, C5
H1, H2, H3, H6, H7, H10, H11, H14,
H15, H18, H19, H26, H27, H28, C1, C2
SATURDAY
First areas to be affected
H4, H5, H8, H9, H12, H13, H16, H17, H22, H23, H25, H29, C3, C4, C5
H1, H2, H3, H6, H7, H10, H11, H14, H15, H18, H19, H26, H27, H28, C1, C2
Additional areas that could be affected
H1, H2, H3, H6, H7, H10, H11, H14,
H4, H5, H8, H9, H12, H13, H16, H17, H22, H23, H25, H29, C3, C4, C5
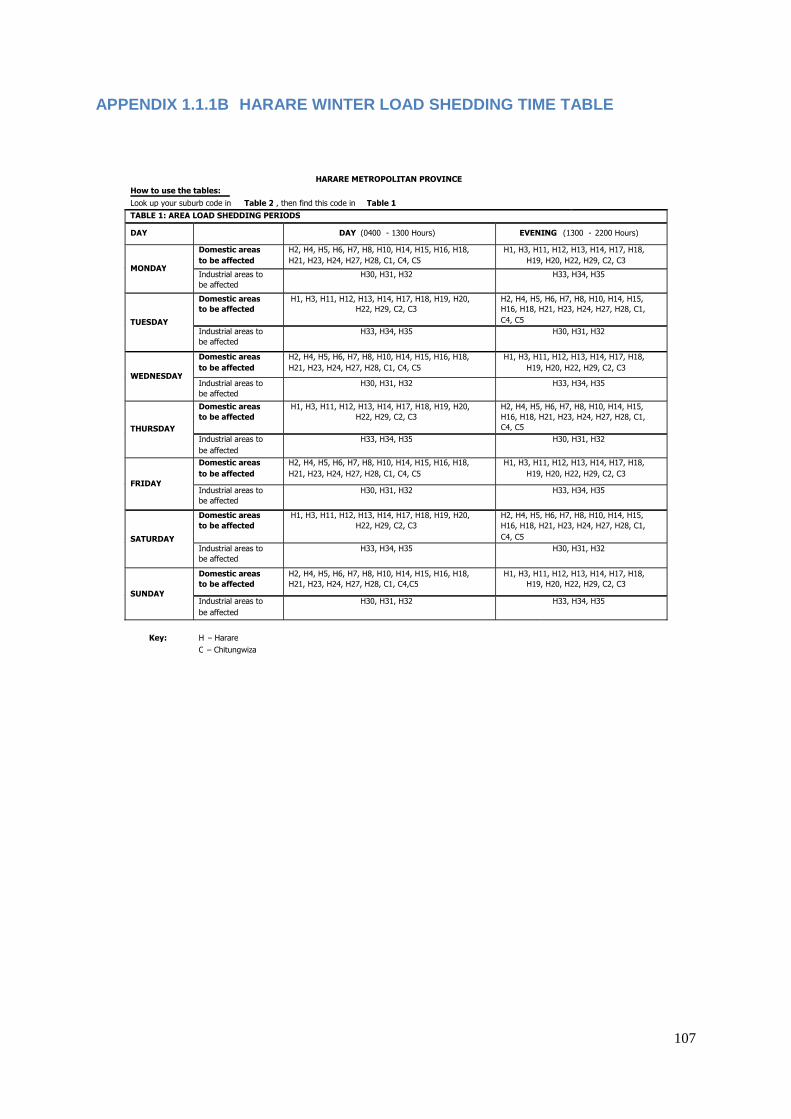
107
APPENDIX 1.1.1B HARARE WINTER LOAD SHEDDING TIME TA BLE
HARARE METROPOLITAN PROVINCE
How to use the tables:
Look up your suburb code in Table 2 , then find this code in Table 1
TABLE 1: AREA LOAD SHEDDING PERIODS
DAY
DAY (0400 -
1300 Hours)
EVENING
(1300 -
2200 Hours)
MONDAY
Domestic areas
to be affected
H2, H4, H5, H6, H7, H8, H10, H14, H15, H16, H18,
H21, H23, H24, H27, H28, C1, C4, C5
H1, H3, H11, H12, H13, H14, H17, H18,
H19, H20, H22, H29, C2, C3
Industrial areas to
be affected
H30, H31, H32
H33, H34, H35
TUESDAY
Domestic areas
to be affected
H1, H3, H11, H12, H13, H14, H17, H18, H19, H20,
H22, H29, C2, C3
H2, H4, H5, H6, H7, H8, H10, H14, H15,
H16, H18, H21, H23, H24, H27, H28, C1,
C4, C5
Industrial areas to
be affected
H33, H34, H35
H30, H31, H32
WEDNESDAY
Domestic areas
to be affected
H2, H4, H5, H6, H7, H8, H10, H14, H15, H16, H18,
H21, H23, H24, H27, H28, C1, C4, C5
H1, H3, H11, H12, H13, H14, H17, H18,
H19, H20, H22, H29, C2, C3
Industrial areas to
be affected
H30, H31, H32
H33, H34, H35
THURSDAY
Domestic areas
to be affected
H1, H3, H11, H12, H13, H14, H17, H18, H19, H20,
H22, H29, C2, C3
H2, H4, H5, H6, H7, H8, H10, H14, H15,
H16, H18, H21, H23, H24, H27, H28, C1,
C4, C5
Industrial areas to
be affected
H33, H34, H35
H30, H31, H32
FRIDAY
Domestic areas
to be affected
H2, H4, H5, H6, H7, H8, H10, H14, H15, H16, H18,
H21, H23, H24, H27, H28, C1, C4, C5
H1, H3, H11, H12, H13, H14, H17, H18,
H19, H20, H22, H29, C2, C3
Industrial areas to
be affected
H30, H31, H32
H33, H34, H35
SATURDAY
Domestic areas
to be affected
H1, H3, H11, H12, H13, H14, H17, H18, H19, H20,
H22, H29, C2, C3
H2, H4, H5, H6, H7, H8, H10, H14, H15,
H16, H18, H21, H23, H24, H27, H28, C1,
C4, C5
Industrial areas to
be affected
H33, H34, H35
H30, H31, H32
SUNDAY
Domestic areas
to be affected
H2, H4, H5, H6, H7, H8, H10, H14, H15, H16, H18,
H21, H23, H24, H27, H28, C1, C4,C5
H1, H3, H11, H12, H13, H14, H17, H18,
H19, H20, H22, H29, C2, C3
Industrial areas to
be affected
H30, H31, H32
H33, H34, H35
Key:
H –
Harare
C – Chitungwiza
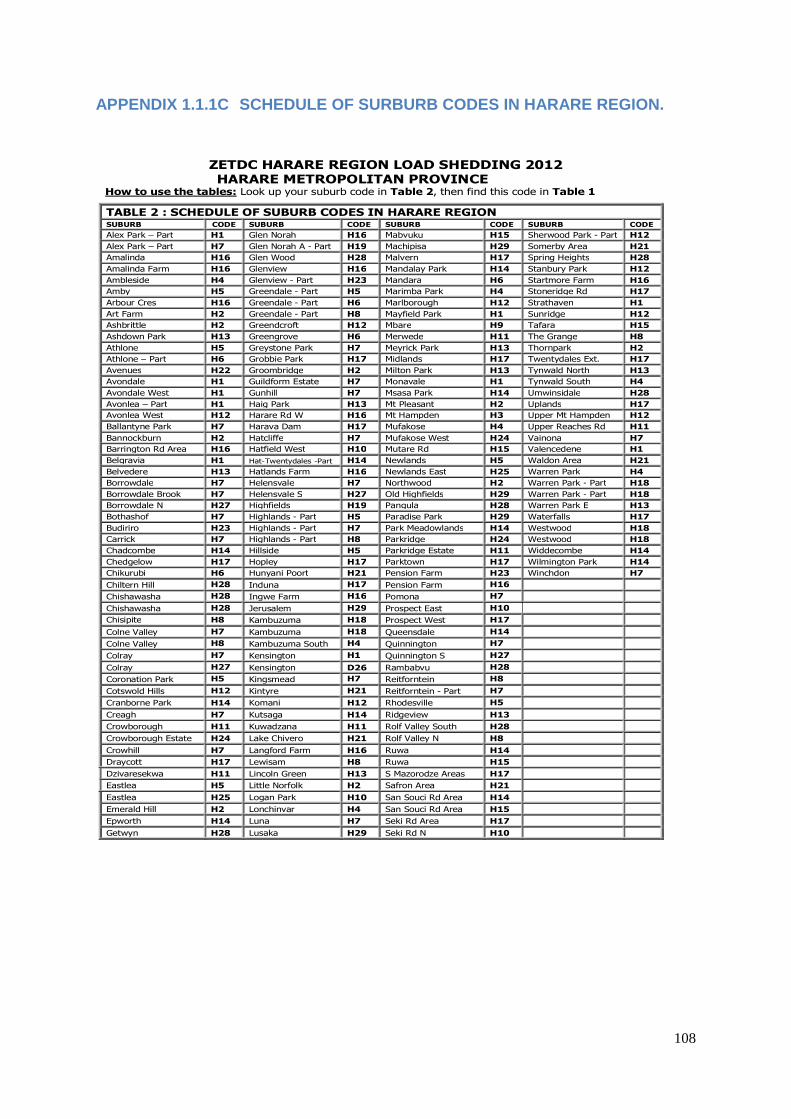
108
APPENDIX 1.1.1C SCHEDULE OF SURBURB CODES IN HARARE REGION.
ZETDC HARARE REGION LOAD SHEDDING 2012 HARARE METROPOLITAN PROVINCE
How to use the tables: Look up your suburb code in Table 2, then find this code in Table 1
TABLE 2 : SCHEDULE OF SUBURB CODES IN HARARE REGION SUBURB CODE SUBURB CODE SUBURB CODE SUBURB CODE
Alex Park – Part H1 Glen Norah H16 Mabvuku H15 Sherwood Park - Part H12
Alex Park – Part H7 Glen Norah A - Part H19 Machipisa H29 Somerby Area H21
Amalinda H16 Glen Wood H28 Malvern H17 Spring Heights H28
Amalinda Farm H16 Glenview H16 Mandalay Park H14 Stanbury Park H12
Ambleside H4 Glenview - Part H23 Mandara H6 Startmore Farm H16
Amby H5 Greendale - Part H5 Marimba Park H4 Stoneridge Rd H17
Arbour Cres H16 Greendale - Part H6 Marlborough H12 Strathaven H1
Art Farm H2 Greendale - Part H8 Mayfield Park H1 Sunridge H12
Ashbrittle H2 Greendcroft H12 Mbare H9 Tafara H15
Ashdown Park H13 Greengrove H6 Merwede H11 The Grange H8
Athlone H5 Greystone Park H7 Meyrick Park H13 Thornpark H2
Athlone – Part H6 Grobbie Park H17 Midlands H17 Twentydales Ext. H17
Avenues H22 Groombridge H2 Milton Park H13 Tynwald North H13
Avondale H1 Guildform Estate H7 Monavale H1 Tynwald South H4
Avondale West H1 Gunhill H7 Msasa Park H14 Umwinsidale H28
Avonlea – Part H1 Haig Park H13 Mt Pleasant H2 Uplands H17
Avonlea West H12 Harare Rd W H16 Mt Hampden H3 Upper Mt Hampden H12
Ballantyne Park H7 Harava Dam H17 Mufakose H4 Upper Reaches Rd H11
Bannockburn H2 Hatcliffe H7 Mufakose West H24 Vainona H7
Barrington Rd Area H16 Hatfield West H10 Mutare Rd H15 Valencedene H1
Belgravia H1 Hat-Twentydales -Part H14 Newlands H5 Waldon Area H21
Belvedere H13 Hatlands Farm H16 Newlands East H25 Warren Park H4
Borrowdale H7 Helensvale H7 Northwood H2 Warren Park - Part H18
Borrowdale Brook H7 Helensvale S H27 Old Highfields H29 Warren Park - Part H18
Borrowdale N H27 Highfields H19 Pangula H28 Warren Park E H13
Bothashof H7 Highlands - Part H5 Paradise Park H29 Waterfalls H17
Budiriro H23 Highlands - Part H7 Park Meadowlands H14 Westwood H18
Carrick H7 Highlands - Part H8 Parkridge H24 Westwood H18
Chadcombe H14 Hillside H5 Parkridge Estate H11 Widdecombe H14
Chedgelow H17 Hopley H17 Parktown H17 Wilmington Park H14
Chikurubi H6 Hunyani Poort H21 Pension Farm H23 Winchdon H7
Chiltern Hill H28 Induna H17 Pension Farm H16
Chishawasha H28 Ingwe Farm H16 Pomona H7
Chishawasha H28 Jerusalem H29 Prospect East H10
Chisipite H8 Kambuzuma H18 Prospect West H17
Colne Valley H7 Kambuzuma H18 Queensdale H14
Colne Valley H8 Kambuzuma South H4 Quinnington H7
Colray H7 Kensington H1 Quinnington S H27
Colray H27 Kensington D26 Rambabvu H28
Coronation Park H5 Kingsmead H7 Reitforntein H8
Cotswold Hills H12 Kintyre H21 Reitforntein - Part H7
Cranborne Park H14 Komani H12 Rhodesville H5
Creagh H7 Kutsaga H14 Ridgeview H13
Crowborough H11 Kuwadzana H11 Rolf Valley South H28
Crowborough Estate H24 Lake Chivero H21 Rolf Valley N H8
Crowhill H7 Langford Farm H16 Ruwa H14
Draycott H17 Lewisam H8 Ruwa H15
Dzivaresekwa H11 Lincoln Green H13 S Mazorodze Areas H17
Eastlea H5 Little Norfolk H2 Safron Area H21
Eastlea H25 Logan Park H10 San Souci Rd Area H14
Emerald Hill H2 Lonchinvar H4 San Souci Rd Area H15
Epworth H14 Luna H7 Seki Rd Area H17
Getwyn H28 Lusaka H29 Seki Rd N H10

109
APPENDIX 1.1.2A ELECTRICITY TARIFFS EFFECTIVE FEBRU ARY 2009
STANDARD PRICES FOR THE SUPPLY OF ELECTRICITY : FEB RUARY 2009It is hereby notified that the Zimbabwe Electricity Regulatory Commission has, in terms of section 53 of of the Electricity Act [Chapter 13:19], approved the following prices for the supply of electricity to customers with effect from 1 February, 2009.
Basic +Levies & Charges RE levies VAT
(US$) (US$) (US$)E 1 DOMESTIC CUSTOMERSE 1.1 Conventional meter
a) Fixed Monthly Charge 7.94 8.81 8.81b) Energy consumption per kWh (i) 1 st 50 kWh 0.005 0.006 0.006 (ii) 51 to 300 kWh 0.078 0.086 0.086 (iii) Balance 0.125 0.138 0.138
E 1.2.1 Prepayment meter : Standard 0.124 0.137 0.137
E 1.2.2 Prepayment meter : SteppedEnergy consumption per kWh (i) 1 st 50 kWh 0.005 0.006 0.006 (ii) 51 to 300 kWh 0.077 0.086 0.086 (iii) Balance 0.124 0.137 0.137
E 1.3 Load Limited : FMC 6.62 7.34 7.341.0 amp 3.578 3.970 3.972.5 amp 8.944 9.930 9.935.0 amp 17.888 19.860 19.867.5 amp 26.831 29.780 29.7810.0 amp 35.775 39.710 39.7115.0 amp 53.663 59.570 59.5722.5 amp 96.593 107.220 107.2230.0 amp 128.790 142.960 142.96
E 2 PUBLIC LIGHTINGE 2.1 Metered Circuits
a) Fixed Monthly Charge 68.81 76.38 76.38b) Energy consumption per kWh 0.070 0.078 0.089
E 2.2 Unmetered circuitsA fixed monthly charge per watt of installed luminaire capacity 0.031 0.035 0.039
E 3 MINING AND INDUSTRIAL CUSTOMERSE 3.1 Low Voltage Supply (capacity up to 300 kVA)
a) Fixed Monthly Charge 83.52 92.70 92.70b) Energy charge per kWh 0.086 0.096 0.109
E 3.2.11 Distribution Supply (capacity exceeding 300 kVA) ToUa) Fixed Monthly Charge 230.11 255.43 255.43b) Up to 11 kV supply: A monthly capacity charge per unit of demand 9.104 10.11 11.47 c) Energy charge per kWh during Peak periods 0.099 0.110 0.125 d) Energy charge per kWh during Standard periods 0.041 0.046 0.052 e) Energy charge per kWh during Off-Peak periods 0.028 0.031 0.035
E 3.2.33 Distribution Supply (capacity exceeding 300 kVA) ToUa) Fixed Monthly Charge 230.11 255.43 255.43b) 33 kV supply: A monthly capacity charge per unit of demand 6.678 7.41 8.41 c) Energy charge per kWh during Peak periods 0.099 0.110 0.125 d) Energy charge per kWh during Standard periods 0.041 0.046 0.125 e) Energy charge per kWh during Off-Peak periods 0.028 0.031 0.052
E 4 COMMERCIAL CUSTOMERSE 4.1 Low Voltage Supply (capacity up to 300 kVA)
a) Fixed Monthly Charge 83.52 92.70 92.70b) Energy charge per kWh 0.086 0.096 0.109
E 4.2.11 Distribution Supply (capacity exceeding 300 kVA) ToUa) Fixed Monthly Charge 230.11 255.43 255.43b) Up to 11 kV supply: A monthly capacity charge per unit of demand 9.104 10.11 11.47 c) Energy charge per kWh during Peak periods 0.099 0.110 0.125 d) Energy charge per kWh during Standard periods 0.033 0.074 0.085 e) Energy charge per kWh during Off-Peak periods 0.022 0.055 0.062
E 4.2.33 Distribution Supply (capacity exceeding 300 kVA) ToUa) Fixed Monthly Charge 184.09 0.00 0.00b) 33 kV supply: A monthly capacity charge per unit of demand 5.342 5.39 6.15 c) Energy charge per kWh during Peak periods 0.079 0.128 0.146 d) Energy charge per kWh during Standard periods 0.033 0.074 0.085 e) Energy charge per kWh during Off-Peak periods 0.022 0.055 0.062

110
APPENDIX 1.1.2B ELECTRICITY TARIFFS EFFECTIVE JUNE 2010
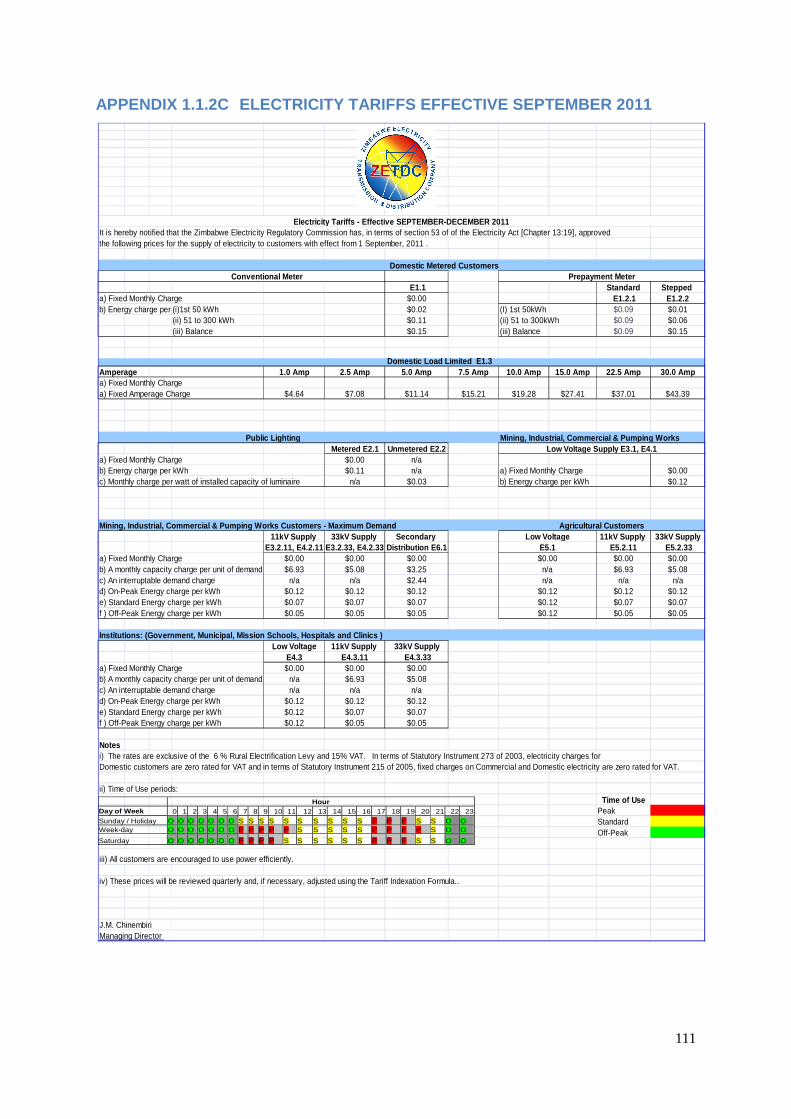
111
APPENDIX 1.1.2C ELECTRICITY TARIFFS EFFECTIVE SEPTE MBER 2011
It is hereby notified that the Zimbabwe Electricity Regulatory Commission has, in terms of section 53 of of the Electricity Act [Chapter 13:19], approved the following prices for the supply of electricity to customers with effect from 1 September, 2011 .
E1.1 Standard Stepped a) Fixed Monthly Charge $0.00 E1.2.1 E1.2.2b) Energy charge per kWh(i)1st 50 kWh $0.02 (I) 1st 50kWh $0.09 $0.01
(ii) 51 to 300 kWh $0.11 (ii) 51 to 300kWh $0.09 $0.06(iii) Balance $0.15 (iii) Balance $0.09 $0.15
Amperage 1.0 Amp 2.5 Amp 5.0 Amp 7.5 Amp 10.0 Amp 15.0 Amp 22.5 Am p 30.0 Ampa) Fixed Monthly Chargea) Fixed Amperage Charge $4.64 $7.08 $11.14 $15.21 $19.28 $27.41 $37.01 $43.39
Metered E2.1 Unmetered E2.2a) Fixed Monthly Charge $0.00 n/ab) Energy charge per kWh $0.11 n/a a) Fixed Monthly Charge $0.00c) Monthly charge per watt of installed capacity of luminaire n/a $0.03 b) Energy charge per kWh $0.12
Mining, Industrial, Commercial & Pumping Works Cust omers - Maximum Demand11kV Supply 33kV Supply Secondary 11kV Supply 33kV Supply
E3.2.11, E4.2.11 E3.2.33, E4.2.33 Distribution E6.1 E5.2.11 E5.2.33a) Fixed Monthly Charge $0.00 $0.00 $0.00 $0.00 $0.00b) A monthly capacity charge per unit of demand $6.93 $5.08 $3.25 $6.93 $5.08c) An interruptable demand charge n/a n/a $2.44 n/a n/ad) On-Peak Energy charge per kWh $0.12 $0.12 $0.12 $0.12 $0.12e) Standard Energy charge per kWh $0.07 $0.07 $0.07 $0.07 $0.07f ) Off-Peak Energy charge per kWh $0.05 $0.05 $0.05 $0.05 $0.05
Institutions: (Government, Municipal, Mission Schoo ls, Hospitals and Clinics )Low Voltage 11kV Supply 33kV Supply
E4.3 E4.3.11 E4.3.33a) Fixed Monthly Charge $0.00 $0.00 $0.00b) A monthly capacity charge per unit of demand n/a $6.93 $5.08c) An interruptable demand charge n/a n/a n/ad) On-Peak Energy charge per kWh $0.12 $0.12 $0.12e) Standard Energy charge per kWh $0.12 $0.07 $0.07f ) Off-Peak Energy charge per kWh $0.12 $0.05 $0.05
Notesi) The rates are exclusive of the 6 % Rural Electrification Levy and 15% VAT. In terms of Statutory Instrument 273 of 2003, electricity charges forDomestic customers are zero rated for VAT and in terms of Statutory Instrument 215 of 2005, fixed charges on Commercial and Domestic electricity are zero rated for VAT.
ii) Time of Use periods:Time of Use
PeakStandardOff-Peak
iii) All customers are encouraged to use power efficiently.
iv) These prices will be reviewed quarterly and, if necessary, adjusted using the Tariff Indexation Formula..
J.M. ChinembiriManaging Director
Electricity Tariffs - Effective SEPTEMBER-DECEMBER 2011
Domestic Load Li mited E1.3
Public Lighting Mining, Industrial, Commercial & Pumpi ng Works
Domestic Met ered CustomersConventional Meter
$0.12$0.12
n/a$0.12
n/a
E5.1
Prepayment Meter
Low Voltage Supply E3.1, E4.1
Agricultural CustomersLow Voltage
$0.00
Hour Day of Week 0 1 2 3 4 5 6 7 8 9 10 11 12 13 14 15 16 17 18 19 20 21 22 23 Sunday / Holiday O O O O O O O S S S S S S S S S S P P P S S O O Week-day O O O O O O O P P P P P S S S S S P P P P S O O
Saturday O O O O O O O P P P P S S S S S S P P P S S O O
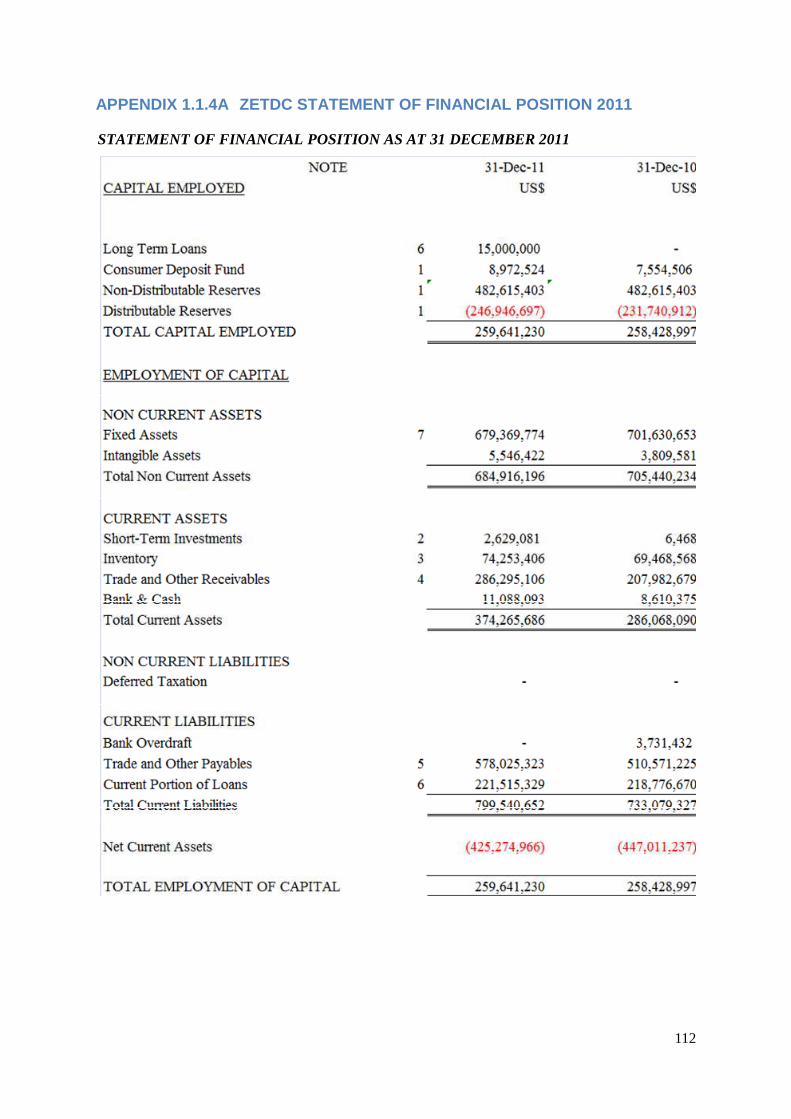
112
APPENDIX 1.1.4A ZETDC STATEMENT OF FINANCIAL POSITI ON 2011
STATEMENT OF FINANCIAL POSITION AS AT 31 DECEMBER 2011
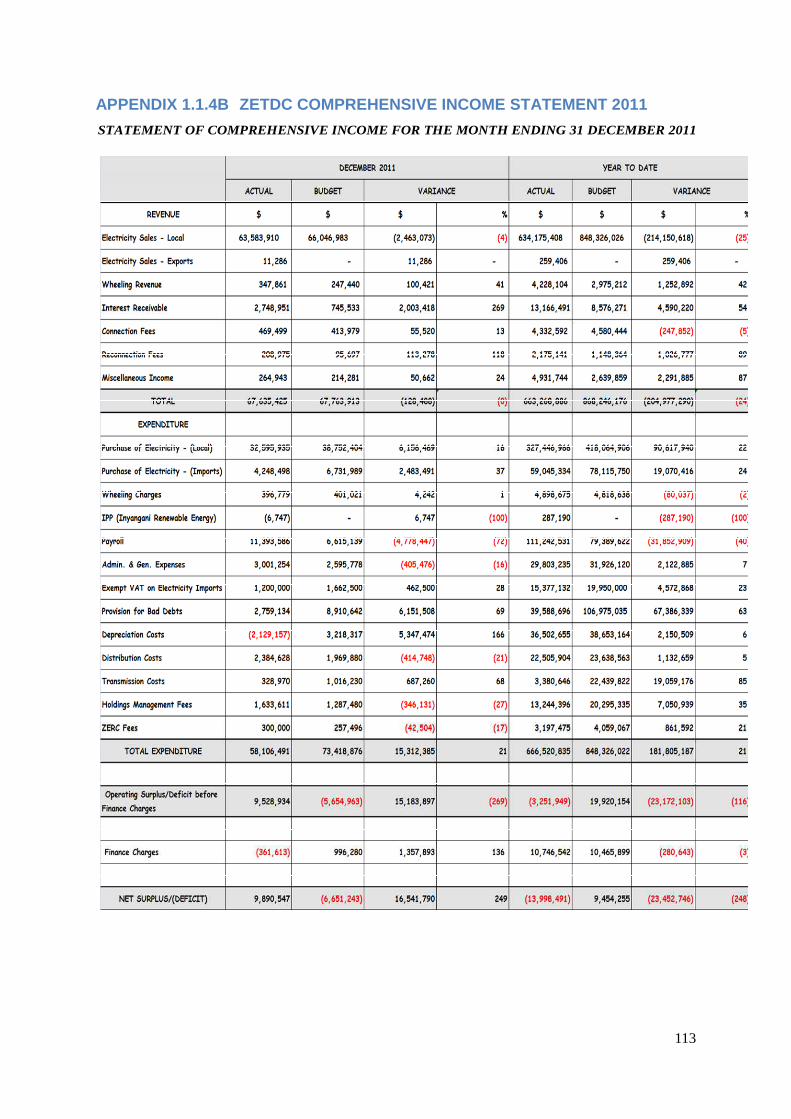
113
APPENDIX 1.1.4B ZETDC COMPREHENSIVE INCOME STATEMEN T 2011
STATEMENT OF COMPREHENSIVE INCOME FOR THE MONTH ENDING 31 DECEMBER 2011

114
APPENDIX 1.1.4C ZETDC STATEMENT OF CASH FLOWS 2011
STATEMENT OF CASH FLOWS
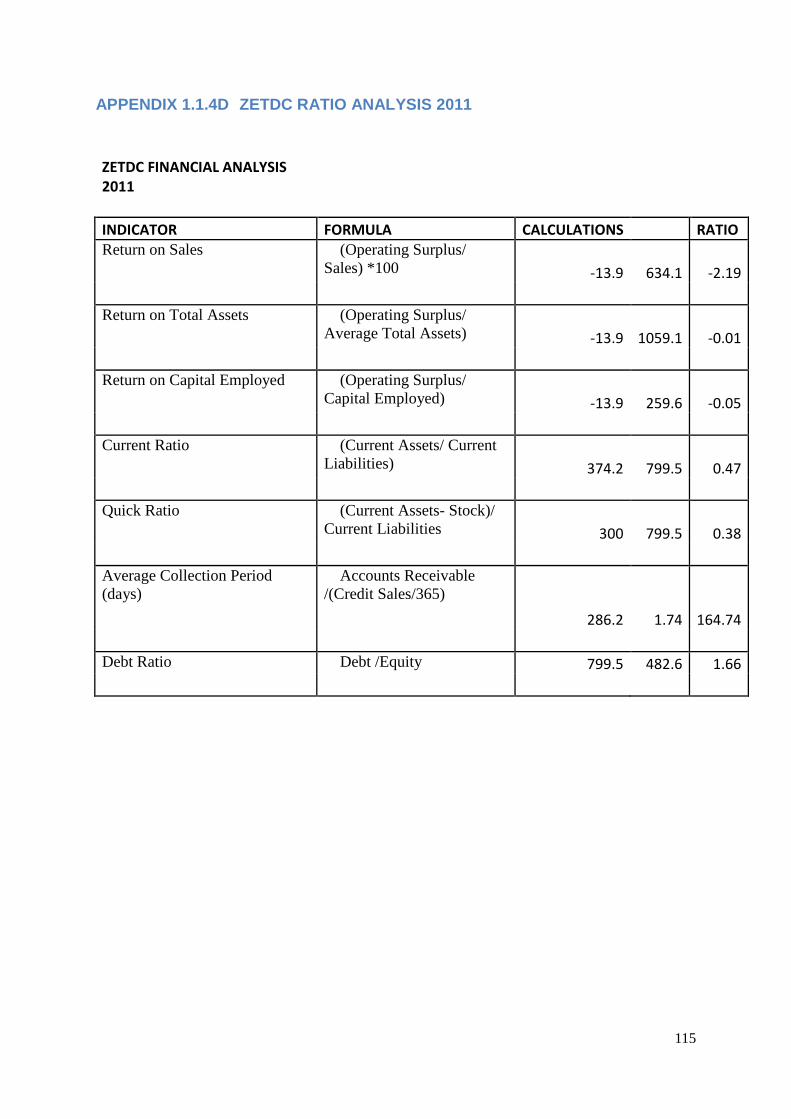
115
APPENDIX 1.1.4D ZETDC RATIO ANALYSIS 2011
ZETDC FINANCIAL ANALYSIS
2011
INDICATOR FORMULA CALCULATIONS RATIO
Return on Sales (Operating Surplus/ Sales) *100 -13.9 634.1 -2.19
Return on Total Assets (Operating Surplus/ Average Total Assets) -13.9 1059.1 -0.01
Return on Capital Employed (Operating Surplus/ Capital Employed) -13.9 259.6 -0.05
Current Ratio (Current Assets/ Current Liabilities) 374.2 799.5 0.47
Quick Ratio (Current Assets- Stock)/ Current Liabilities 300 799.5 0.38
Average Collection Period (days)
Accounts Receivable /(Credit Sales/365)
286.2 1.74 164.74
Debt Ratio Debt /Equity 799.5 482.6 1.66

116
APPENDIX 4.1 RESEARCH QUESTIONAIRE
2 July 2012
25 Samora Machel Avenue
Electricity Center
Harare
Phone + 263-4-78682526 Cell +263-773 357 647
email [email protected] : [email protected]
Dear Sir / Madam
RE: QUESTIONNAIRE FOR ZETDC INTERNAL CONTROLS AND S ERVICE DELIVERY
I would like to know your experiences in ZETDC with regard to the internal control system and its likely impact on service delivery. This is specifically in partial fulfilment of the requirement for the Masters Degree in Business Administration (MBA) at the University of Zimbabwe (UZ).
Kindly ensure you complete all questions to enable me to gather as much detail on this important subject. This is strictly for academic purposes .Your input will be treated in strict confidence.
Your co-operation is greatly appreciated
Nhamo Chorasa

117
QUESTIONNAIRE
AN EVALUATION OF THE INTERNAL CONTROL SYSTEM IN ZET DC ON SERVICE DELIVERY (2009 – 2012)
INSTRUCTIONS
• Mark with a tick or X on all of your appropriat e responses • There are 20 questions. • Ensure your tick fits neatly in the correct place • Write clearly in the spaces provided where appropri ate • You can add relevant information where applicable
SECTION A: DEMOGRAPHIC INFORMATION
1. DEPARTMENT/SECTION FINANCE ........ ........ HUMAN RESOURCES OPERATIONS COMMERCIAL MARKETING PLANNING AUDIT I.T SECURITY OTHER
2. MANAGEMENT LEVEL BOARD .................. EXECUTIVE MANAGEMENT SENIOR MANAGEMENT MIDLE MANAGEMENT SUPERVISORY JUNIOR OTHER
3. EXPERIENCE IN ZETDC – (YEARS) LESS THAN 2
2-5 5-10 ABOVE10 .......
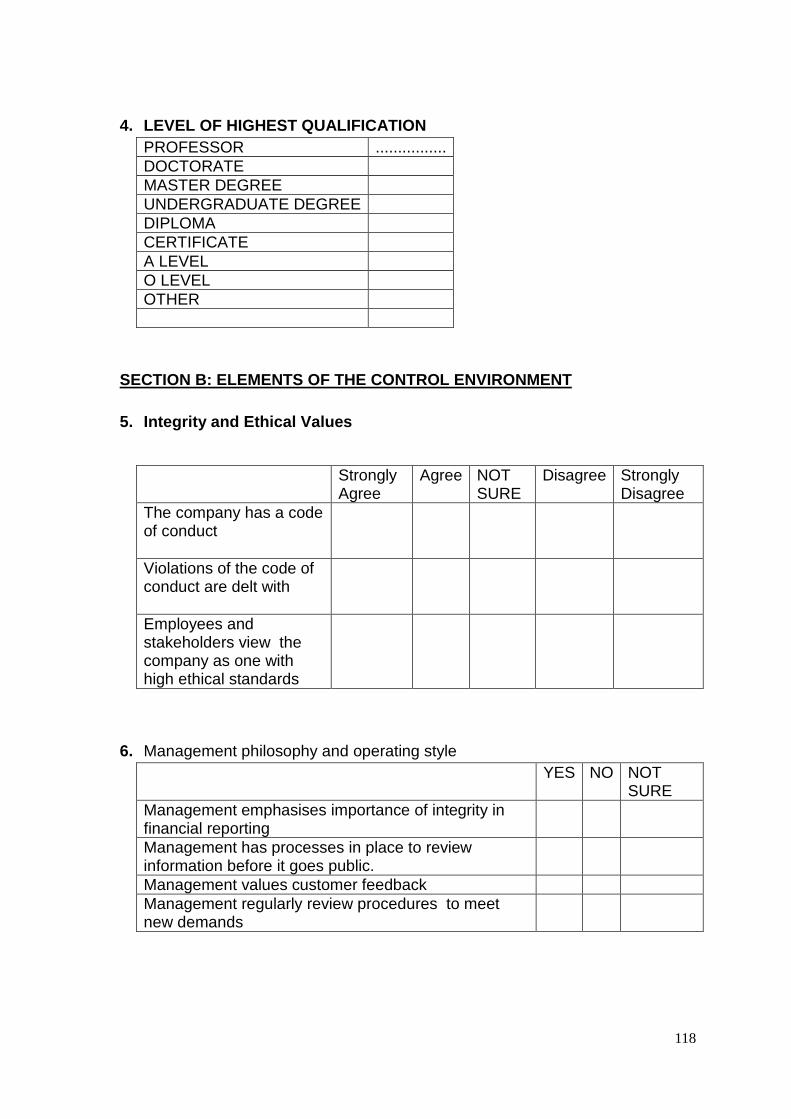
118
4. LEVEL OF HIGHEST QUALIFICATION
PROFESSOR ................ DOCTORATE MASTER DEGREE UNDERGRADUATE DEGREE DIPLOMA CERTIFICATE A LEVEL O LEVEL OTHER
SECTION B: ELEMENTS OF THE CONTROL ENVIRONMENT
5. Integrity and Ethical Values
Strongly Agree
Agree NOT SURE
Disagree Strongly Disagree
The company has a code of conduct
Violations of the code of conduct are delt with
Employees and stakeholders view the company as one with high ethical standards
6. Management philosophy and operating style
YES NO NOT SURE
Management emphasises importance of integrity in financial reporting
Management has processes in place to review information before it goes public.
Management values customer feedback Management regularly review procedures to meet new demands
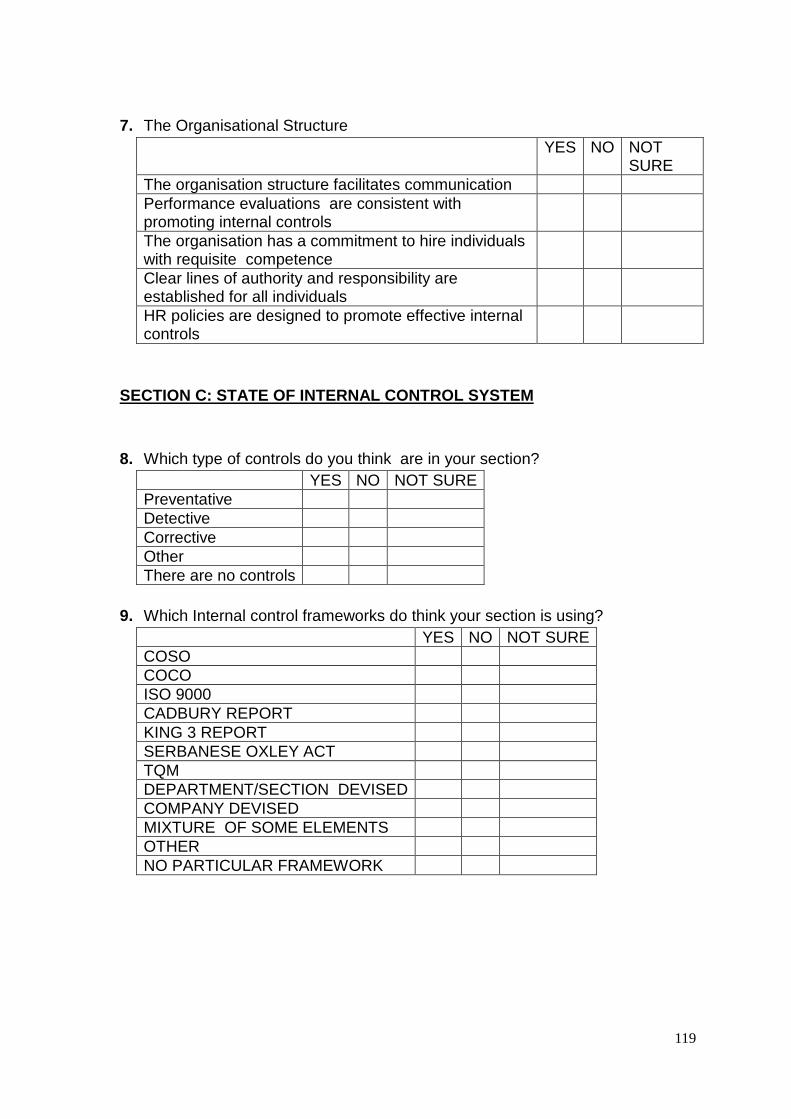
119
7. The Organisational Structure
YES NO NOT SURE
The organisation structure facilitates communication Performance evaluations are consistent with promoting internal controls
The organisation has a commitment to hire individuals with requisite competence
Clear lines of authority and responsibility are established for all individuals
HR policies are designed to promote effective internal controls
SECTION C: STATE OF INTERNAL CONTROL SYSTEM
8. Which type of controls do you think are in your section? YES NO NOT SURE Preventative Detective Corrective Other There are no controls
9. Which Internal control frameworks do think your section is using? YES NO NOT SURE COSO COCO ISO 9000 CADBURY REPORT KING 3 REPORT SERBANESE OXLEY ACT TQM DEPARTMENT/SECTION DEVISED COMPANY DEVISED MIXTURE OF SOME ELEMENTS OTHER NO PARTICULAR FRAMEWORK

120
10. How are internal control systems reviewed in your section?
YES NO NOT SURE Spot checks Regular reports Audit checks Statutory checks Peer reviews Reconciliations No reviews are done Other
11. How do you rate the occurrence of internal control breaches in the company? No breaches at all Infrequent Frequent Regular Not Sure .............
12. In your opinion what may have caused the internal control breaches? YES NO NOT SURE Staff Incompetence Management override Systems shortcomings Staff collusion Staff fatigue Staff rewards Disgruntlements Self enrichment Other
13. State measures taken on internal control breaches. YES NO NOT SURE Concerned staff was reprimanded Corrective action was taken to redress the anomaly Corrective action was taken to address the loophole No action was taken
14. Kindly list some of the internal control breaches that have occurred. ..................................................................................................................... 1 2 3
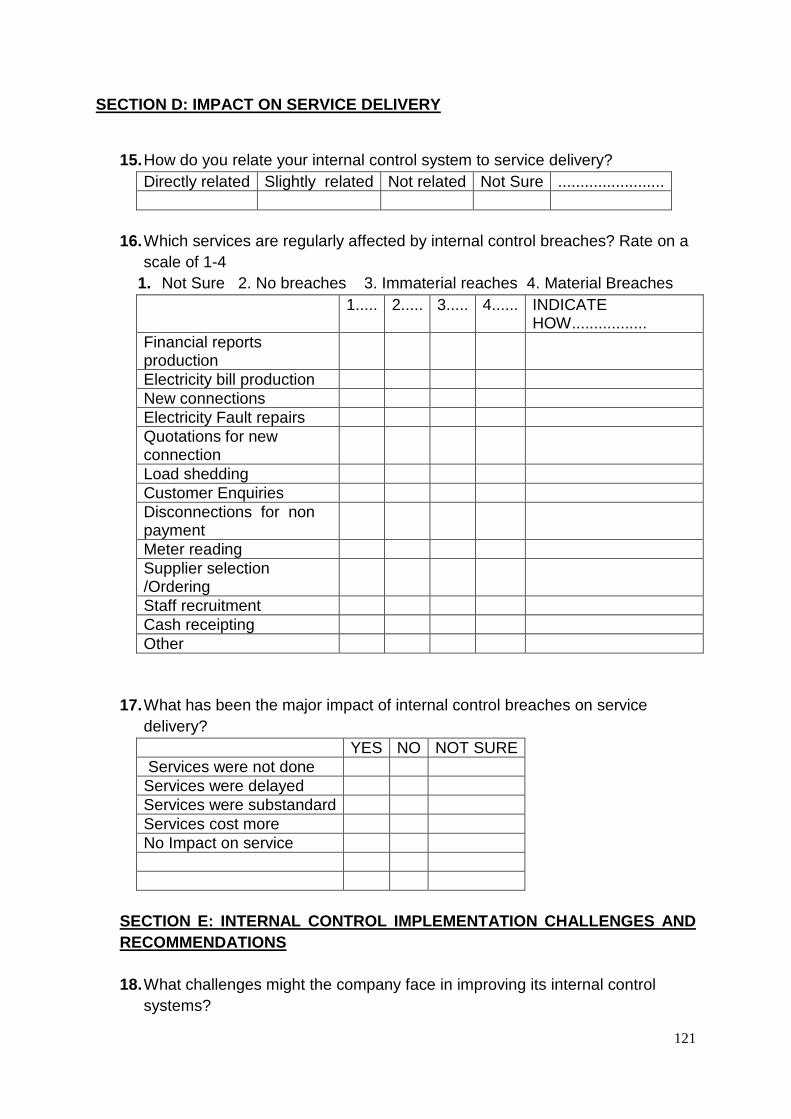
121
SECTION D: IMPACT ON SERVICE DELIVERY
15. How do you relate your internal control system to service delivery?
Directly related Slightly related Not related Not Sure ........................
16. Which services are regularly affected by internal control breaches? Rate on a scale of 1-4
1. Not Sure 2. No breaches 3. Immaterial reaches 4. Material Breaches 1..... 2..... 3..... 4...... INDICATE
HOW................. Financial reports production
Electricity bill production New connections Electricity Fault repairs Quotations for new connection
Load shedding Customer Enquiries Disconnections for non payment
Meter reading Supplier selection /Ordering
Staff recruitment Cash receipting Other
17. What has been the major impact of internal control breaches on service delivery? YES NO NOT SURE Services were not done Services were delayed Services were substandard Services cost more No Impact on service
SECTION E: INTERNAL CONTROL IMPLEMENTATION CHALLENG ES AND RECOMMENDATIONS 18. What challenges might the company face in improving its internal control
systems?
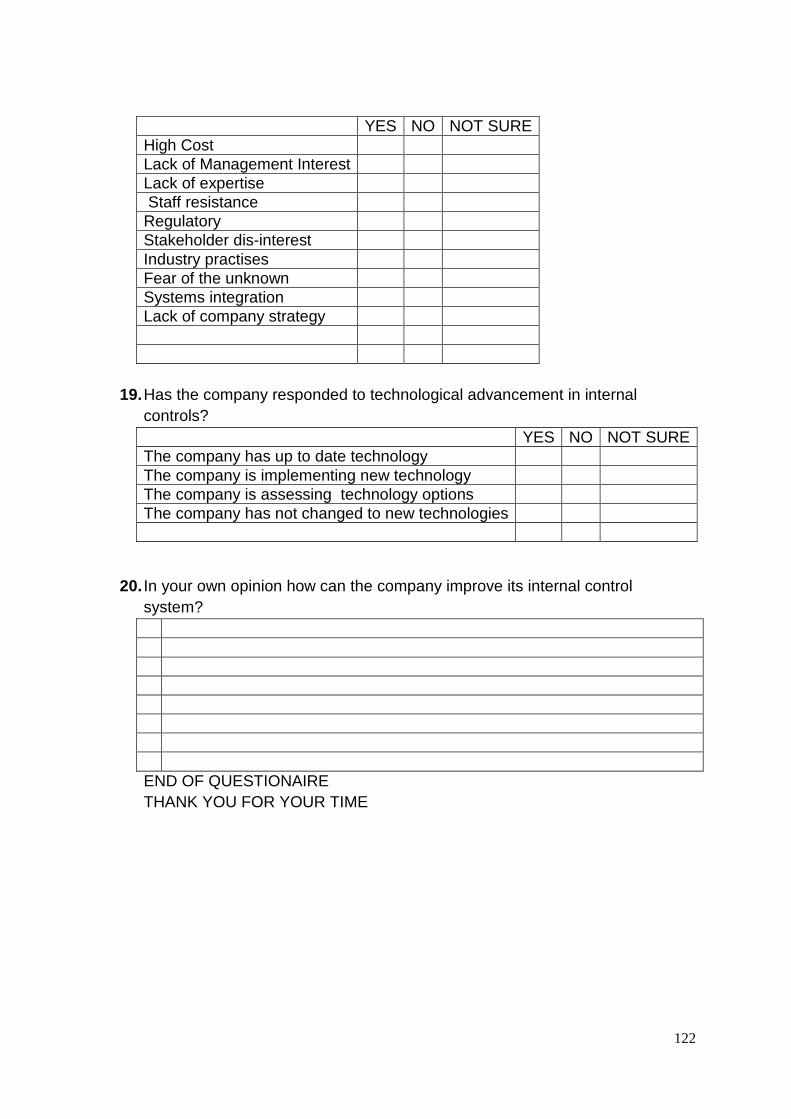
122
YES NO NOT SURE High Cost Lack of Management Interest Lack of expertise Staff resistance Regulatory Stakeholder dis-interest Industry practises Fear of the unknown Systems integration Lack of company strategy
19. Has the company responded to technological advancement in internal controls? YES NO NOT SURE The company has up to date technology The company is implementing new technology The company is assessing technology options The company has not changed to new technologies
20. In your own opinion how can the company improve its internal control system? END OF QUESTIONAIRE THANK YOU FOR YOUR TIME


