chool Accountability Report Card - Find a SARC · Darnall recognizes its responsibility to generate...
17
S chool A ccountability R eport C ard Issued Spring 2016 for Academic Year 2014–15 San Diego Unified School District • Cindy Marten, Superintendent • 4100 Normal Street, San Diego, CA 92103 • www.sandiegounified.org What Is a SARC? All California public schools are re- quired by state law to publish a School Accountability Report Card (SARC) by February 1 of each year. The SARC contains specific information about the condition and performance of the school from the previous school year. Furthermore, under the Local Con- trol Funding Formula (LCFF), San Die- go Unified is required to prepare a Lo- cal Control Accountability Plan (LCAP), which describes how it intends to meet annual school-specific goals for all students, with specific activities to ad- dress state and local priorities. Data reported in the SARC are to be con- sistent with data reported in the LCAP. More information about the re- quirements for the SARC is available on the state’s SARC website: www.cde.ca.gov/ta/ac/sa/ Additional copies of this SARC may be obtained from the school office or from the district’s SARC website: www.sandiegounified.org/sarc For more information about the LCFF or LCAP, see the state’s LCFF website: www.cde.ca.gov/fg/aa/lc/ Finally, for more information about this school, contact the principal or the district office. Contents Data and Access ...................................2 About This School .................................2 Conditions of Learning ...........................2 Student Outcomes ................................5 Engagement ....................................... 13 Other Information ............................... 14 Adequate Yearly Progress ................. 14 Federal Intervention Program ............ 14 Average Class Size and Class Size Distribution (Elementary) .................. 15 Average Class Size and Class Size Distribution (Secondary) ................... 15 Academic Counselors and Other Support Staff Members ..................... 15 Expenditures per Pupil and School- Site Teacher Salaries ........................ 15 Types of Services Funded.................. 16 Teacher and Administrative Salaries ... 16 Advanced Placement Courses ............ 16 Professional Development ................. 16 Appendix: Adopted Texts and Instructional Materials ......................... 17 Darnall Charter School 6020 Hughes St, San Diego, CA 92115-6520 Phone: (619) 582-1822 E-mail: [email protected] Web: www.darnallcharter.org/ CDS Code: 37-68338-6039457 Dawna Halama, Associate Director School Description and Mission Statement Our mission at Darnall Charter School is to produce students who are college-bound and career-ready! We are committed to academic excellence by vigorously engaging students in a rigorous, student-centered learning environment that will foster the development of global citizens. We believe children in the 21st century must become literate and articulate, mathe- matically competent, and technologically adept. We further believe that all children should have the opportunity to develop their creative and physical abilities, curiosity, and love of learning. Darnall recognizes its responsibility to generate enthusiasm and excitement for the lifelong process of learning by providing a curriculum that is rele- vant, integrated, and age appropriate, and that, at the same time, is aligned to the Common Core State Standards. At Darnall, students in K–8 engage in a challenging learning program that is tailored to their individual needs and is focused on equip- ping them for success in the 21st century. The Darnall curriculum and instructional programs emphasize core subjects in the timeless fundamentals such as reading, writing, mathematics, science, and social studies; learning skills required for lifelong, continuous learning; and communication skills necessary to interact with adults and children of all ages. Darnall also believes that the individualized and supported per- sonalized learning educational program facilitates the development of self-direction and personal responsibility among its students. In these ways, Darnall will meet the objective of producing students who are self-motivated, competent, lifelong learners. The vision of Darnall Charter School is that students will embrace learning, oppor- tunity, and responsibility, explore their unlimited potential, and create positive change. Our students will learn flexibility and adaptability; initiative, self-direction, and per- sistence; social and cross-cultural skills; effective communication and collaboration; responsible and strategic use of technology; productivity and accountability; and leadership and responsibility. Our core beliefs are that every child deserves high quality instruction based on stand- ards; high expectations for academic achievement; personalized learning opportuni- ties to meet his or her unique needs; opportunities to think critically and creatively; a safe and caring learning environment; and decisions about instruction that are in- formed by data. At Darnall Charter School, our motto is: Be Respectful—Be Responsible—Be Safe. These ideals embody our commitment to providing a safe and secure learning envi- ronment for each and every child and adult on campus. To that end, we have imple- mented programs to provide restorative practices and positive behavior intervention and support. With these practices in place, we have created a school culture that nur- tures the whole child.
Transcript of chool Accountability Report Card - Find a SARC · Darnall recognizes its responsibility to generate...
School Accountabi l i ty Report Card Issued Spring 2016 for Academic Year 2014–15
San Diego Unified School District • Cindy Marten, Superintendent • 4100 Normal Street, San Diego, CA 92103 • www.sandiegounified.org
What Is a SARC?
All California public schools are re-quired by state law to publish a School Accountability Report Card (SARC) by February 1 of each year. The SARC contains specific information about the condition and performance of the school from the previous school year.
Furthermore, under the Local Con-trol Funding Formula (LCFF), San Die-go Unified is required to prepare a Lo-cal Control Accountability Plan (LCAP), which describes how it intends to meet annual school-specific goals for all students, with specific activities to ad-dress state and local priorities. Data reported in the SARC are to be con-sistent with data reported in the LCAP.
More information about the re-quirements for the SARC is available on the state’s SARC website:
www.cde.ca.gov/ta/ac/sa/
Additional copies of this SARC may be obtained from the school office or from the district’s SARC website:
www.sandiegounified.org/sarc
For more information about the LCFF or LCAP, see the state’s LCFF website:
www.cde.ca.gov/fg/aa/lc/
Finally, for more information about this school, contact the principal or the district office.
Contents Data and Access ................................... 2 About This School ................................. 2 Conditions of Learning ........................... 2 Student Outcomes ................................ 5 Engagement ....................................... 13 Other Information ............................... 14
Adequate Yearly Progress ................. 14 Federal Intervention Program ............ 14 Average Class Size and Class Size Distribution (Elementary) .................. 15 Average Class Size and Class Size Distribution (Secondary) ................... 15 Academic Counselors and Other Support Staff Members ..................... 15 Expenditures per Pupil and School- Site Teacher Salaries ........................ 15 Types of Services Funded .................. 16 Teacher and Administrative Salaries ... 16 Advanced Placement Courses ............ 16 Professional Development ................. 16
Appendix: Adopted Texts and Instructional Materials ......................... 17
Darnall Charter School 6020 Hughes St, San Diego, CA 92115-6520
Phone: (619) 582-1822 E-mail: [email protected]
Web: www.darnallcharter.org/ CDS Code: 37-68338-6039457
Dawna Halama, Associate Director
School Description and Mission Statement Our mission at Darnall Charter School is to produce students who are college-bound and career-ready! We are committed to academic excellence by vigorously engaging students in a rigorous, student-centered learning environment that will foster the development of global citizens.
We believe children in the 21st century must become literate and articulate, mathe-matically competent, and technologically adept. We further believe that all children should have the opportunity to develop their creative and physical abilities, curiosity, and love of learning. Darnall recognizes its responsibility to generate enthusiasm and excitement for the lifelong process of learning by providing a curriculum that is rele-vant, integrated, and age appropriate, and that, at the same time, is aligned to the Common Core State Standards. At Darnall, students in K–8 engage in a challenging learning program that is tailored to their individual needs and is focused on equip-ping them for success in the 21st century. The Darnall curriculum and instructional programs emphasize core subjects in the timeless fundamentals such as reading, writing, mathematics, science, and social studies; learning skills required for lifelong, continuous learning; and communication skills necessary to interact with adults and children of all ages. Darnall also believes that the individualized and supported per-sonalized learning educational program facilitates the development of self-direction and personal responsibility among its students. In these ways, Darnall will meet the objective of producing students who are self-motivated, competent, lifelong learners.
The vision of Darnall Charter School is that students will embrace learning, oppor-tunity, and responsibility, explore their unlimited potential, and create positive change.
Our students will learn flexibility and adaptability; initiative, self-direction, and per-sistence; social and cross-cultural skills; effective communication and collaboration; responsible and strategic use of technology; productivity and accountability; and leadership and responsibility.
Our core beliefs are that every child deserves high quality instruction based on stand-ards; high expectations for academic achievement; personalized learning opportuni-ties to meet his or her unique needs; opportunities to think critically and creatively; a safe and caring learning environment; and decisions about instruction that are in-formed by data.
At Darnall Charter School, our motto is: Be Respectful—Be Responsible—Be Safe. These ideals embody our commitment to providing a safe and secure learning envi-ronment for each and every child and adult on campus. To that end, we have imple-mented programs to provide restorative practices and positive behavior intervention and support. With these practices in place, we have created a school culture that nur-tures the whole child.
Darnall (079) 2 Spring 2016 School Accountability Report Card
Data and Access
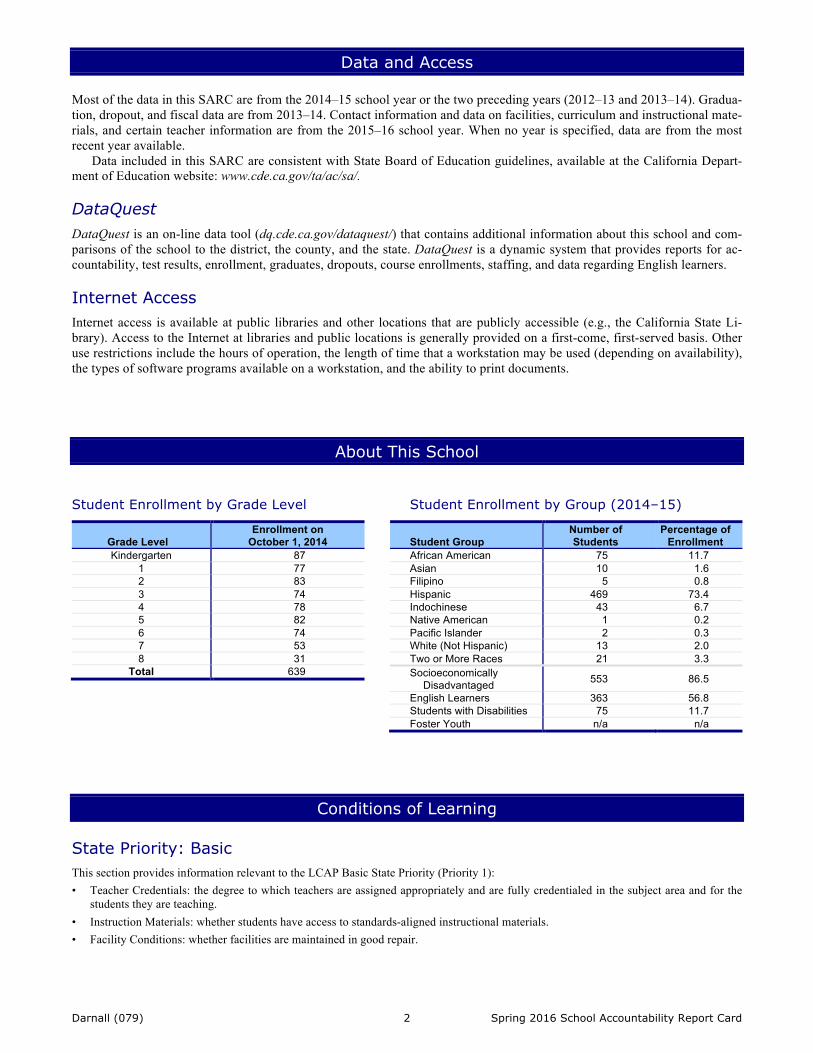
Most of the data in this SARC are from the 2014–15 school year or the two preceding years (2012–13 and 2013–14). Gradua-tion, dropout, and fiscal data are from 2013–14. Contact information and data on facilities, curriculum and instructional mate-rials, and certain teacher information are from the 2015–16 school year. When no year is specified, data are from the most recent year available.
Data included in this SARC are consistent with State Board of Education guidelines, available at the California Depart-ment of Education website: www.cde.ca.gov/ta/ac/sa/. DataQuest DataQuest is an on-line data tool (dq.cde.ca.gov/dataquest/) that contains additional information about this school and com-parisons of the school to the district, the county, and the state. DataQuest is a dynamic system that provides reports for ac-countability, test results, enrollment, graduates, dropouts, course enrollments, staffing, and data regarding English learners. Internet Access Internet access is available at public libraries and other locations that are publicly accessible (e.g., the California State Li-brary). Access to the Internet at libraries and public locations is generally provided on a first-come, first-served basis. Other use restrictions include the hours of operation, the length of time that a workstation may be used (depending on availability), the types of software programs available on a workstation, and the ability to print documents.
About This School
Student Enrollment by Grade Level
Grade Level Enrollment on
October 1, 2014 Kindergarten 87
1 77 2 83 3 74 4 78 5 82 6 74 7 53 8 31
Total 639
Student Enrollment by Group (2014–15)
Student Group Number of Students
Percentage of Enrollment
African American 75 11.7 Asian 10 1.6 Filipino 5 0.8 Hispanic 469 73.4 Indochinese 43 6.7 Native American 1 0.2 Pacific Islander 2 0.3 White (Not Hispanic) 13 2.0 Two or More Races 21 3.3 Socioeconomically
Disadvantaged 553 86.5
English Learners 363 56.8 Students with Disabilities 75 11.7 Foster Youth n/a n/a
Conditions of Learning
State Priority: Basic This section provides information relevant to the LCAP Basic State Priority (Priority 1): • Teacher Credentials: the degree to which teachers are assigned appropriately and are fully credentialed in the subject area and for the
students they are teaching. • Instruction Materials: whether students have access to standards-aligned instructional materials. • Facility Conditions: whether facilities are maintained in good repair.

Darnall (079) 3 Spring 2016 School Accountability Report Card
Teacher Credentials
This table displays the number of teachers assigned to the school who are fully credentialed, who are working without a full credential, and who are credentialed but teaching outside of their subject area of competence. District totals do not include charter schools. Detailed infor-mation about teachers’ qualifications can be found on the CDE DataQuest website at dq.cde.ca.gov/dataquest/.
Number of Teachers School District 2013–14 2014–15 2015–16 2015–16
With full credential and teaching in subject area 28 33 35 — With full credential but teaching outside area of competence 4 1 0 — Without full credential 0 0 1 — Total 32 34 36 —
Teacher Misassignments and Vacant Teacher Positions
This table displays the number of teacher misassignments (i.e., teachers who lack legal authorization to teach that grade level, subject area, student group, etc.) and the number of vacant teacher positions (long-term vacancies for which there was no teacher assigned by the twenti-eth day of the school year or semester). Total teacher misassignments includes the number of misassignments of teachers of English learn-ers. For 2015–16, the most current data are reported.
Indicator* 2013–14 2014–15 2015–16 Misassignments of teachers of English learners 0 0 0 Total teacher misassignments 0 0 0 Vacant teacher positions 0 0 0
*Some of these data were not available at the time of publication. For more up-to-date information, contact the San Diego Unified School District’s Human Resources Department.
Core Academic Courses Taught by Teachers in Compliance with the No Child Left Behind Act (2014–15)
The federal Elementary and Secondary Education Act (ESEA), also known as the No Child Left Behind Act (NCLB), requires all teachers of core academic subjects to be “highly qualified.” In general, ESEA requires that each teacher must have: (1) a bachelor’s degree, (2) a state credential (or an Intern Certificate/Credential for no more than three years), and (3) demonstrated subject-matter competence for each core subject he or she will teach.
This table displays the percentage of classes in core academic subjects taught by teachers who are compliant with ESEA at this school, at all schools in the district, in high-poverty schools in the district, and in low-poverty schools in the district. (High-poverty schools are defined as those with student eligibility rates of approximately 40 percent or higher in the free and reduced-price meals program. Low-poverty schools are defined as those with student eligibility rates of 39 percent or lower in the program.) These data do not include inde-pendently reporting charter schools. More information on teacher qualifications required under ESEA can be found at the CDE website at www.cde.ca.gov/nclb/sr/tq/.
Location of Classes
Percentage of Classes in Core Academic Subjects Taught by Highly
Qualified Teachers Not Taught by Highly
Qualified Teachers This school 93.10 6.90 All schools in district 97.69 2.31 High-poverty schools in district 97.66 2.34 Low-poverty schools in district 97.81 2.19
Darnall (079) 4 Spring 2016 School Accountability Report Card
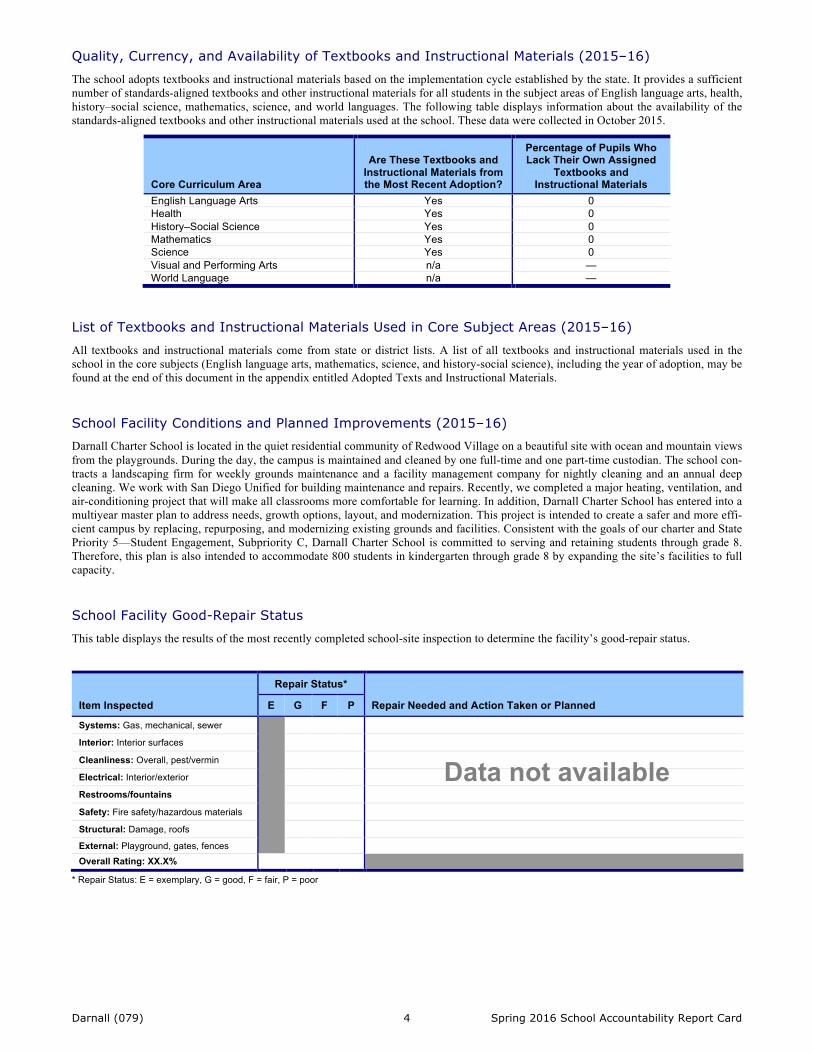
Quality, Currency, and Availability of Textbooks and Instructional Materials (2015–16)
The school adopts textbooks and instructional materials based on the implementation cycle established by the state. It provides a sufficient number of standards-aligned textbooks and other instructional materials for all students in the subject areas of English language arts, health, history–social science, mathematics, science, and world languages. The following table displays information about the availability of the standards-aligned textbooks and other instructional materials used at the school. These data were collected in October 2015.
Core Curriculum Area
Are These Textbooks and Instructional Materials from the Most Recent Adoption?
Percentage of Pupils Who Lack Their Own Assigned
Textbooks and Instructional Materials
English Language Arts Yes 0 Health Yes 0 History–Social Science Yes 0 Mathematics Yes 0 Science Yes 0 Visual and Performing Arts n/a — World Language n/a —
List of Textbooks and Instructional Materials Used in Core Subject Areas (2015–16)
All textbooks and instructional materials come from state or district lists. A list of all textbooks and instructional materials used in the school in the core subjects (English language arts, mathematics, science, and history-social science), including the year of adoption, may be found at the end of this document in the appendix entitled Adopted Texts and Instructional Materials. School Facility Conditions and Planned Improvements (2015–16) Darnall Charter School is located in the quiet residential community of Redwood Village on a beautiful site with ocean and mountain views from the playgrounds. During the day, the campus is maintained and cleaned by one full-time and one part-time custodian. The school con-tracts a landscaping firm for weekly grounds maintenance and a facility management company for nightly cleaning and an annual deep cleaning. We work with San Diego Unified for building maintenance and repairs. Recently, we completed a major heating, ventilation, and air-conditioning project that will make all classrooms more comfortable for learning. In addition, Darnall Charter School has entered into a multiyear master plan to address needs, growth options, layout, and modernization. This project is intended to create a safer and more effi-cient campus by replacing, repurposing, and modernizing existing grounds and facilities. Consistent with the goals of our charter and State Priority 5—Student Engagement, Subpriority C, Darnall Charter School is committed to serving and retaining students through grade 8. Therefore, this plan is also intended to accommodate 800 students in kindergarten through grade 8 by expanding the site’s facilities to full capacity. School Facility Good-Repair Status
This table displays the results of the most recently completed school-site inspection to determine the facility’s good-repair status.
Item Inspected
Repair Status*
Repair Needed and Action Taken or Planned E G F P
Systems: Gas, mechanical, sewer
Interior: Interior surfaces Cleanliness: Overall, pest/vermin Electrical: Interior/exterior Restrooms/fountains Safety: Fire safety/hazardous materials Structural: Damage, roofs External: Playground, gates, fences Overall Rating: XX.X%
* Repair Status: E = exemplary, G = good, F = fair, P = poor
Data not available
Darnall (079) 5 Spring 2016 School Accountability Report Card
Student Outcomes
State Priority: Pupil Achievement This section provides information relevant to the Pupil Achievement State Priority (Priority 4): • Statewide Assessments: results of the California Assessment of Student Performance and Progress (CAASPP) and the Science Califor-
nia Standards Tests. • Preparation for College or Career: successful completion of courses that satisfy requirements for entrance to the University of Califor-
nia or the California State University, or career technical education sequences or programs of study. Statewide Assessments CAASPP Assessment Results
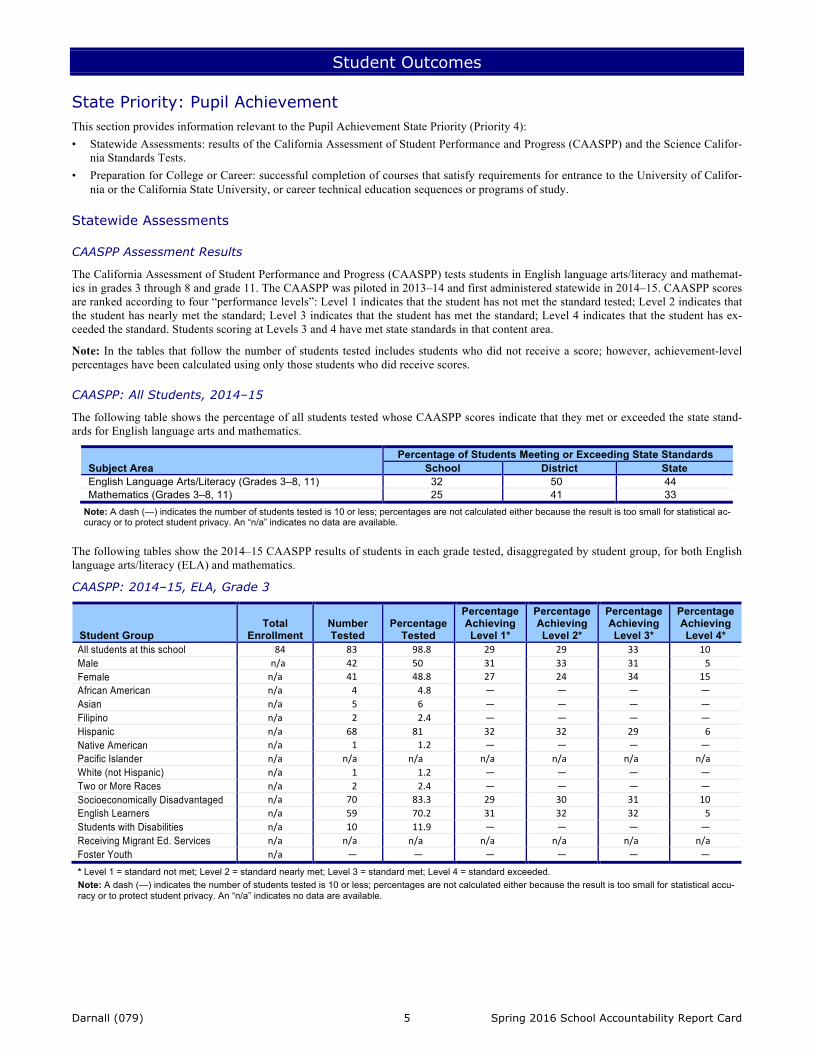
The California Assessment of Student Performance and Progress (CAASPP) tests students in English language arts/literacy and mathemat-ics in grades 3 through 8 and grade 11. The CAASPP was piloted in 2013–14 and first administered statewide in 2014–15. CAASPP scores are ranked according to four “performance levels”: Level 1 indicates that the student has not met the standard tested; Level 2 indicates that the student has nearly met the standard; Level 3 indicates that the student has met the standard; Level 4 indicates that the student has ex-ceeded the standard. Students scoring at Levels 3 and 4 have met state standards in that content area.
Note: In the tables that follow the number of students tested includes students who did not receive a score; however, achievement-level percentages have been calculated using only those students who did receive scores. CAASPP: All Students, 2014–15
The following table shows the percentage of all students tested whose CAASPP scores indicate that they met or exceeded the state stand-ards for English language arts and mathematics.
Subject Area Percentage of Students Meeting or Exceeding State Standards
School District State English Language Arts/Literacy (Grades 3–8, 11) 32 50 44 Mathematics (Grades 3–8, 11) 25 41 33
Note: A dash (—) indicates the number of students tested is 10 or less; percentages are not calculated either because the result is too small for statistical ac-curacy or to protect student privacy. An “n/a” indicates no data are available.
The following tables show the 2014–15 CAASPP results of students in each grade tested, disaggregated by student group, for both English language arts/literacy (ELA) and mathematics.
CAASPP: 2014–15, ELA, Grade 3
Student Group Total
Enrollment Number Tested
Percentage Tested
Percentage Achieving Level 1*
Percentage Achieving Level 2*
Percentage Achieving Level 3*
Percentage Achieving Level 4*
All students at this school 84 83 98.8 29 29 33 10Male n/a 42 50 31 33 31 5Female n/a 41 48.8 27 24 34 15African American n/a 4 4.8 — — — —Asian n/a 5 6 — — — —Filipino n/a 2 2.4 — — — —Hispanic n/a 68 81 32 32 29 6Native American n/a 1 1.2 — — — —Pacific Islander n/a n/a n/a n/a n/a n/a n/aWhite (not Hispanic) n/a 1 1.2 — — — —Two or More Races n/a 2 2.4 — — — —Socioeconomically Disadvantaged n/a 70 83.3 29 30 31 10English Learners n/a 59 70.2 31 32 32 5Students with Disabilities n/a 10 11.9 — — — —Receiving Migrant Ed. Services n/a n/a n/a n/a n/a n/a n/aFoster Youth n/a — — — — — —
* Level 1 = standard not met; Level 2 = standard nearly met; Level 3 = standard met; Level 4 = standard exceeded. Note: A dash (—) indicates the number of students tested is 10 or less; percentages are not calculated either because the result is too small for statistical accu-racy or to protect student privacy. An “n/a” indicates no data are available.
Darnall (079) 6 Spring 2016 School Accountability Report Card
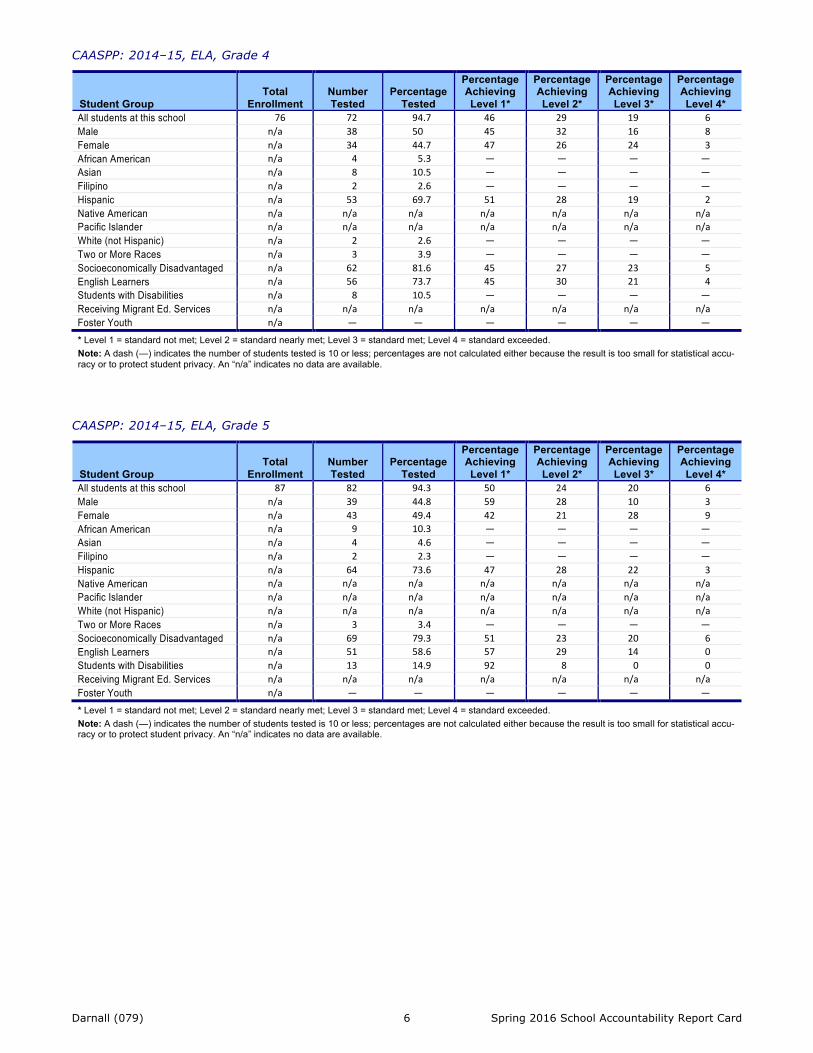
CAASPP: 2014–15, ELA, Grade 4
Student Group Total
Enrollment Number Tested
Percentage Tested
Percentage Achieving Level 1*
Percentage Achieving Level 2*
Percentage Achieving Level 3*
Percentage Achieving Level 4*
All students at this school 76 72 94.7 46 29 19 6Male n/a 38 50 45 32 16 8Female n/a 34 44.7 47 26 24 3African American n/a 4 5.3 — — — —Asian n/a 8 10.5 — — — —Filipino n/a 2 2.6 — — — —Hispanic n/a 53 69.7 51 28 19 2Native American n/a n/a n/a n/a n/a n/a n/aPacific Islander n/a n/a n/a n/a n/a n/a n/aWhite (not Hispanic) n/a 2 2.6 — — — —Two or More Races n/a 3 3.9 — — — —Socioeconomically Disadvantaged n/a 62 81.6 45 27 23 5English Learners n/a 56 73.7 45 30 21 4Students with Disabilities n/a 8 10.5 — — — —Receiving Migrant Ed. Services n/a n/a n/a n/a n/a n/a n/aFoster Youth n/a — — — — — —
* Level 1 = standard not met; Level 2 = standard nearly met; Level 3 = standard met; Level 4 = standard exceeded. Note: A dash (—) indicates the number of students tested is 10 or less; percentages are not calculated either because the result is too small for statistical accu-racy or to protect student privacy. An “n/a” indicates no data are available.
CAASPP: 2014–15, ELA, Grade 5
Student Group Total
Enrollment Number Tested
Percentage Tested
Percentage Achieving Level 1*
Percentage Achieving Level 2*
Percentage Achieving Level 3*
Percentage Achieving Level 4*
All students at this school 87 82 94.3 50 24 20 6Male n/a 39 44.8 59 28 10 3Female n/a 43 49.4 42 21 28 9African American n/a 9 10.3 — — — —Asian n/a 4 4.6 — — — —Filipino n/a 2 2.3 — — — —Hispanic n/a 64 73.6 47 28 22 3Native American n/a n/a n/a n/a n/a n/a n/aPacific Islander n/a n/a n/a n/a n/a n/a n/aWhite (not Hispanic) n/a n/a n/a n/a n/a n/a n/aTwo or More Races n/a 3 3.4 — — — —Socioeconomically Disadvantaged n/a 69 79.3 51 23 20 6English Learners n/a 51 58.6 57 29 14 0Students with Disabilities n/a 13 14.9 92 8 0 0Receiving Migrant Ed. Services n/a n/a n/a n/a n/a n/a n/aFoster Youth n/a — — — — — —
* Level 1 = standard not met; Level 2 = standard nearly met; Level 3 = standard met; Level 4 = standard exceeded. Note: A dash (—) indicates the number of students tested is 10 or less; percentages are not calculated either because the result is too small for statistical accu-racy or to protect student privacy. An “n/a” indicates no data are available.

Darnall (079) 7 Spring 2016 School Accountability Report Card
CAASPP: 2014–15, ELA, Grade 6
Student Group Total
Enrollment Number Tested
Percentage Tested
Percentage Achieving Level 1*
Percentage Achieving Level 2*
Percentage Achieving Level 3*
Percentage Achieving Level 4*
All students at this school 74 73 98.6 34 33 26 7Male n/a 39 52.7 46 36 13 5Female n/a 34 45.9 21 29 41 9African American n/a 10 13.5 — — — —Asian n/a 8 10.8 — — — —Filipino n/a n/a n/a n/a n/a n/a n/aHispanic n/a 50 67.6 38 36 22 4Native American n/a n/a n/a n/a n/a n/a n/aPacific Islander n/a n/a n/a n/a n/a n/a n/aWhite (not Hispanic) n/a 3 4.1 — — — —Two or More Races n/a 1 1.4 — — — —Socioeconomically Disadvantaged n/a 60 81.1 38 33 23 5English Learners n/a 33 44.6 55 36 9 0Students with Disabilities n/a 15 20.3 80 20 0 0Receiving Migrant Ed. Services n/a n/a n/a n/a n/a n/a n/aFoster Youth n/a — — — — — —
* Level 1 = standard not met; Level 2 = standard nearly met; Level 3 = standard met; Level 4 = standard exceeded. Note: A dash (—) indicates the number of students tested is 10 or less; percentages are not calculated either because the result is too small for statistical accu-racy or to protect student privacy. An “n/a” indicates no data are available.
CAASPP: 2014–15, ELA, Grade 7
Student Group Total
Enrollment Number Tested
Percentage Tested
Percentage Achieving Level 1*
Percentage Achieving Level 2*
Percentage Achieving Level 3*
Percentage Achieving Level 4*
All students at this school 55 53 96.4 32 30 28 9Male n/a 24 43.6 33 33 21 13Female n/a 29 52.7 31 28 34 7African American n/a 10 18.2 — — — —Asian n/a 8 14.5 — — — —Filipino n/a 2 3.6 — — — —Hispanic n/a 33 60 30 39 27 3Native American n/a n/a n/a n/a n/a n/a n/aPacific Islander n/a n/a n/a n/a n/a n/a n/aWhite (not Hispanic) n/a n/a n/a n/a n/a n/a n/aTwo or More Races n/a n/a n/a n/a n/a n/a n/aSocioeconomically Disadvantaged n/a 44 80 30 32 34 5English Learners n/a 18 32.7 44 22 33 0Students with Disabilities n/a 7 12.7 — — — —Receiving Migrant Ed. Services n/a n/a n/a n/a n/a n/a n/aFoster Youth n/a — — — — — —
* Level 1 = standard not met; Level 2 = standard nearly met; Level 3 = standard met; Level 4 = standard exceeded. Note: A dash (—) indicates the number of students tested is 10 or less; percentages are not calculated either because the result is too small for statistical accu-racy or to protect student privacy. An “n/a” indicates no data are available.

Darnall (079) 8 Spring 2016 School Accountability Report Card
CAASPP: 2014–15, ELA, Grade 8
Student Group Total
Enrollment Number Tested
Percentage Tested
Percentage Achieving Level 1*
Percentage Achieving Level 2*
Percentage Achieving Level 3*
Percentage Achieving Level 4*
All students at this school 31 30 96.8 33 37 27 3Male n/a 20 64.5 40 35 20 5Female n/a 10 32.3 — — — —African American n/a 3 9.7 — — — —Asian n/a 3 9.7 — — — —Filipino n/a 1 3.2 — — — —Hispanic n/a 23 74.2 30 39 30 0Native American n/a n/a n/a n/a n/a n/a n/aPacific Islander n/a n/a n/a n/a n/a n/a n/aWhite (not Hispanic) n/a n/a n/a n/a n/a n/a n/aTwo or More Races n/a n/a n/a n/a n/a n/a n/aSocioeconomically Disadvantaged n/a 24 77.4 33 38 25 4English Learners n/a 13 41.9 54 46 0 0Students with Disabilities n/a 5 16.1 — — — —Receiving Migrant Ed. Services n/a n/a n/a n/a n/a n/a n/aFoster Youth n/a — — — — — —
* Level 1 = standard not met; Level 2 = standard nearly met; Level 3 = standard met; Level 4 = standard exceeded. Note: A dash (—) indicates the number of students tested is 10 or less; percentages are not calculated either because the result is too small for statistical accu-racy or to protect student privacy. An “n/a” indicates no data are available.
CAASPP: 2014–15, Mathematics, Grade 3
Student Group Total
Enrollment Number Tested
Percentage Tested
Percentage Achieving Level 1*
Percentage Achieving Level 2*
Percentage Achieving Level 3*
Percentage Achieving Level 4*
All students at this school 84 82 97.6 23 33 29 13Male n/a 41 48.8 24 22 37 15Female n/a 41 48.8 22 44 22 12African American n/a 4 4.8 — — — —Asian n/a 5 6 — — — —Filipino n/a 2 2.4 — — — —Hispanic n/a 67 79.8 25 39 25 9Native American n/a 1 1.2 — — — —Pacific Islander n/a n/a n/a n/a n/a n/a n/aWhite (not Hispanic) n/a 1 1.2 — — — —Two or More Races n/a 2 2.4 — — — —Socioeconomically Disadvantaged n/a 70 83.3 23 31 31 13English Learners n/a 59 70.2 25 36 27 12Students with Disabilities n/a 10 11.9 — — — —Receiving Migrant Ed. Services n/a n/a n/a n/a n/a n/a n/aFoster Youth n/a — — — — — —
* Level 1 = standard not met; Level 2 = standard nearly met; Level 3 = standard met; Level 4 = standard exceeded. Note: A dash (—) indicates the number of students tested is 10 or less; percentages are not calculated either because the result is too small for statistical accu-racy or to protect student privacy. An “n/a” indicates no data are available.

Darnall (079) 9 Spring 2016 School Accountability Report Card
CAASPP: 2014–15, Mathematics, Grade 4
Student Group Total
Enrollment Number Tested
Percentage Tested
Percentage Achieving Level 1*
Percentage Achieving Level 2*
Percentage Achieving Level 3*
Percentage Achieving Level 4*
All students at this school 76 73 96.1 40 41 10 10Male n/a 39 51.3 38 36 10 15Female n/a 34 44.7 41 47 9 3African American n/a 4 5.3 — — — —Asian n/a 8 10.5 — — — —Filipino n/a 2 2.6 — — — —Hispanic n/a 54 71.1 41 41 9 9Native American n/a n/a n/a n/a n/a n/a n/aPacific Islander n/a n/a n/a n/a n/a n/a n/aWhite (not Hispanic) n/a 2 2.6 — — — —Two or More Races n/a 3 3.9 — — — —Socioeconomically Disadvantaged n/a 63 82.9 38 41 10 11English Learners n/a 56 73.7 34 46 9 11Students with Disabilities n/a 8 10.5 — — — —Receiving Migrant Ed. Services n/a n/a n/a n/a n/a n/a n/aFoster Youth n/a — — — — — —
* Level 1 = standard not met; Level 2 = standard nearly met; Level 3 = standard met; Level 4 = standard exceeded. Note: A dash (—) indicates the number of students tested is 10 or less; percentages are not calculated either because the result is too small for statistical accu-racy or to protect student privacy. An “n/a” indicates no data are available.
CAASPP: 2014–15, Mathematics, Grade 5
Student Group Total
Enrollment Number Tested
Percentage Tested
Percentage Achieving Level 1*
Percentage Achieving Level 2*
Percentage Achieving Level 3*
Percentage Achieving Level 4*
All students at this school 87 83 95.4 52 30 13 5Male n/a 39 44.8 54 28 15 3Female n/a 44 50.6 50 32 11 7African American n/a 10 11.5 — — — —Asian n/a 4 4.6 — — — —Filipino n/a 2 2.3 — — — —Hispanic n/a 64 73.6 48 34 13 5Native American n/a n/a n/a n/a n/a n/a n/aPacific Islander n/a n/a n/a n/a n/a n/a n/aWhite (not Hispanic) n/a n/a n/a n/a n/a n/a n/aTwo or More Races n/a 3 3.4 — — — —Socioeconomically Disadvantaged n/a 70 80.5 54 30 13 3English Learners n/a 51 58.6 57 27 14 2Students with Disabilities n/a 13 14.9 77 8 15 0Receiving Migrant Ed. Services n/a n/a n/a n/a n/a n/a n/aFoster Youth n/a — — — — — —
* Level 1 = standard not met; Level 2 = standard nearly met; Level 3 = standard met; Level 4 = standard exceeded. Note: A dash (—) indicates the number of students tested is 10 or less; percentages are not calculated either because the result is too small for statistical accu-racy or to protect student privacy. An “n/a” indicates no data are available.
Darnall (079) 10 Spring 2016 School Accountability Report Card
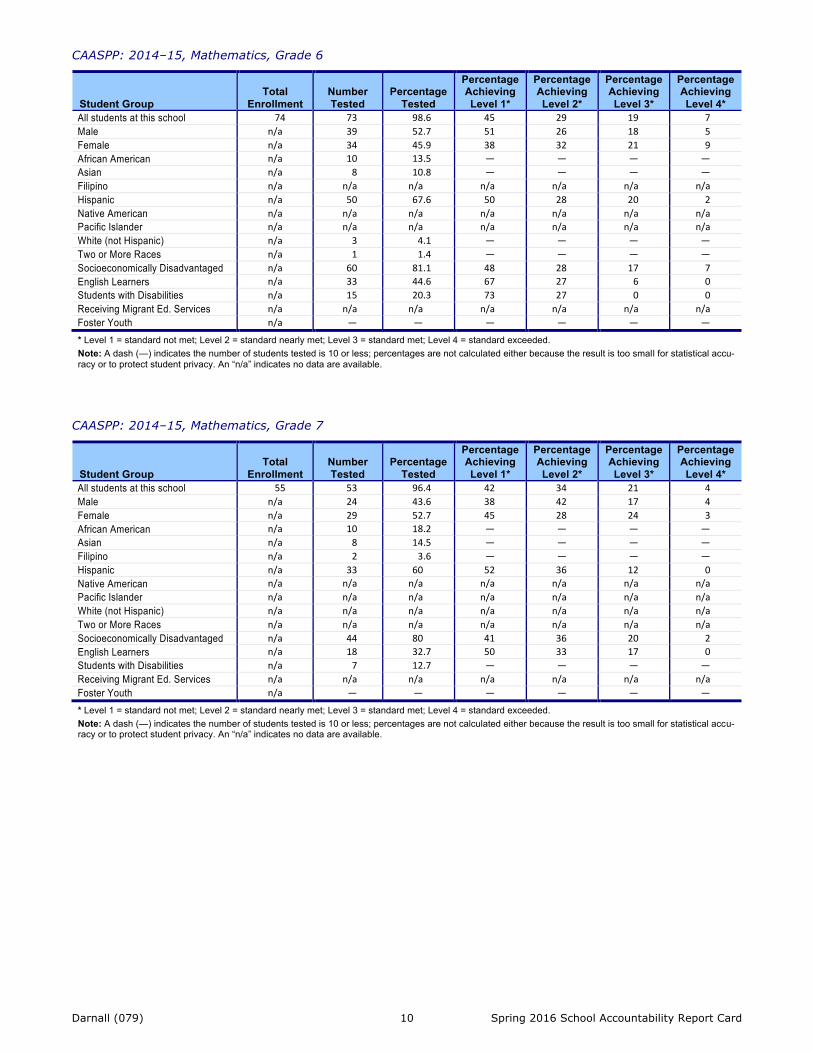
CAASPP: 2014–15, Mathematics, Grade 6
Student Group Total
Enrollment Number Tested
Percentage Tested
Percentage Achieving Level 1*
Percentage Achieving Level 2*
Percentage Achieving Level 3*
Percentage Achieving Level 4*
All students at this school 74 73 98.6 45 29 19 7Male n/a 39 52.7 51 26 18 5Female n/a 34 45.9 38 32 21 9African American n/a 10 13.5 — — — —Asian n/a 8 10.8 — — — —Filipino n/a n/a n/a n/a n/a n/a n/aHispanic n/a 50 67.6 50 28 20 2Native American n/a n/a n/a n/a n/a n/a n/aPacific Islander n/a n/a n/a n/a n/a n/a n/aWhite (not Hispanic) n/a 3 4.1 — — — —Two or More Races n/a 1 1.4 — — — —Socioeconomically Disadvantaged n/a 60 81.1 48 28 17 7English Learners n/a 33 44.6 67 27 6 0Students with Disabilities n/a 15 20.3 73 27 0 0Receiving Migrant Ed. Services n/a n/a n/a n/a n/a n/a n/aFoster Youth n/a — — — — — —
* Level 1 = standard not met; Level 2 = standard nearly met; Level 3 = standard met; Level 4 = standard exceeded. Note: A dash (—) indicates the number of students tested is 10 or less; percentages are not calculated either because the result is too small for statistical accu-racy or to protect student privacy. An “n/a” indicates no data are available.
CAASPP: 2014–15, Mathematics, Grade 7
Student Group Total
Enrollment Number Tested
Percentage Tested
Percentage Achieving Level 1*
Percentage Achieving Level 2*
Percentage Achieving Level 3*
Percentage Achieving Level 4*
All students at this school 55 53 96.4 42 34 21 4Male n/a 24 43.6 38 42 17 4Female n/a 29 52.7 45 28 24 3African American n/a 10 18.2 — — — —Asian n/a 8 14.5 — — — —Filipino n/a 2 3.6 — — — —Hispanic n/a 33 60 52 36 12 0Native American n/a n/a n/a n/a n/a n/a n/aPacific Islander n/a n/a n/a n/a n/a n/a n/aWhite (not Hispanic) n/a n/a n/a n/a n/a n/a n/aTwo or More Races n/a n/a n/a n/a n/a n/a n/aSocioeconomically Disadvantaged n/a 44 80 41 36 20 2English Learners n/a 18 32.7 50 33 17 0Students with Disabilities n/a 7 12.7 — — — —Receiving Migrant Ed. Services n/a n/a n/a n/a n/a n/a n/aFoster Youth n/a — — — — — —
* Level 1 = standard not met; Level 2 = standard nearly met; Level 3 = standard met; Level 4 = standard exceeded. Note: A dash (—) indicates the number of students tested is 10 or less; percentages are not calculated either because the result is too small for statistical accu-racy or to protect student privacy. An “n/a” indicates no data are available.
Darnall (079) 11 Spring 2016 School Accountability Report Card
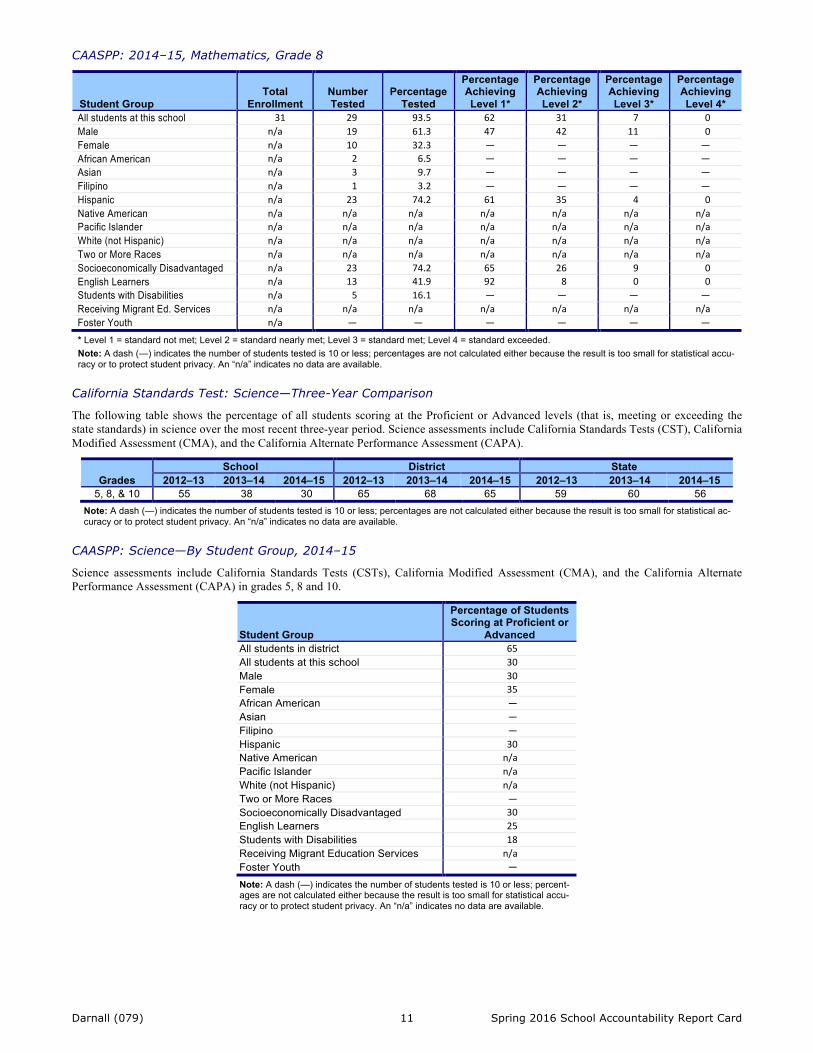
CAASPP: 2014–15, Mathematics, Grade 8
Student Group Total
Enrollment Number Tested
Percentage Tested
Percentage Achieving Level 1*
Percentage Achieving Level 2*
Percentage Achieving Level 3*
Percentage Achieving Level 4*
All students at this school 31 29 93.5 62 31 7 0Male n/a 19 61.3 47 42 11 0Female n/a 10 32.3 — — — —African American n/a 2 6.5 — — — —Asian n/a 3 9.7 — — — —Filipino n/a 1 3.2 — — — —Hispanic n/a 23 74.2 61 35 4 0Native American n/a n/a n/a n/a n/a n/a n/aPacific Islander n/a n/a n/a n/a n/a n/a n/aWhite (not Hispanic) n/a n/a n/a n/a n/a n/a n/aTwo or More Races n/a n/a n/a n/a n/a n/a n/aSocioeconomically Disadvantaged n/a 23 74.2 65 26 9 0English Learners n/a 13 41.9 92 8 0 0Students with Disabilities n/a 5 16.1 — — — —Receiving Migrant Ed. Services n/a n/a n/a n/a n/a n/a n/aFoster Youth n/a — — — — — —
* Level 1 = standard not met; Level 2 = standard nearly met; Level 3 = standard met; Level 4 = standard exceeded. Note: A dash (—) indicates the number of students tested is 10 or less; percentages are not calculated either because the result is too small for statistical accu-racy or to protect student privacy. An “n/a” indicates no data are available.
California Standards Test: Science—Three-Year Comparison
The following table shows the percentage of all students scoring at the Proficient or Advanced levels (that is, meeting or exceeding the state standards) in science over the most recent three-year period. Science assessments include California Standards Tests (CST), California Modified Assessment (CMA), and the California Alternate Performance Assessment (CAPA).
Grades School District State
2012–13 2013–14 2014–15 2012–13 2013–14 2014–15 2012–13 2013–14 2014–15 5, 8, & 10 55 38 30 65 68 65 59 60 56
Note: A dash (—) indicates the number of students tested is 10 or less; percentages are not calculated either because the result is too small for statistical ac-curacy or to protect student privacy. An “n/a” indicates no data are available.
CAASPP: Science—By Student Group, 2014–15
Science assessments include California Standards Tests (CSTs), California Modified Assessment (CMA), and the California Alternate Performance Assessment (CAPA) in grades 5, 8 and 10.
Student Group
Percentage of Students Scoring at Proficient or
Advanced All students in district 65All students at this school 30Male 30Female 35African American —Asian —Filipino —Hispanic 30Native American n/aPacific Islander n/aWhite (not Hispanic) n/aTwo or More Races —Socioeconomically Disadvantaged 30English Learners 25Students with Disabilities 18Receiving Migrant Education Services n/aFoster Youth —
Note: A dash (—) indicates the number of students tested is 10 or less; percent-ages are not calculated either because the result is too small for statistical accu-racy or to protect student privacy. An “n/a” indicates no data are available.

Darnall (079) 12 Spring 2016 School Accountability Report Card
Career Technical Education Programs (2014–15)
Career Technical Education (CTE) in the San Diego Unified School District is a program of study involving a sequence of courses that integrates core academic knowledge with technical skills. The program provides students with multiple pathways to college and careers. Students complete a career pathway, which includes: (a) two or more CTE courses in a single, defined field of study, (b) passing of the pre- and co-requisites CTE and core curriculum courses, and (c) passing of at least one CTE advanced-level course. The career pathways are organized within the context of the state-defined 15 different industry sectors, which have been identified as critical for the fiscal stability and prosperity of the State of California. Student internships are a required component of the advanced-level CTE course curriculum. CTE programs of study often fulfill the “a–g” subject-area requirements of the University of California and the California State University and may lead to community college credit, an industry-recognized credential, a certificate, or a degree at the postsecondary level. Courses for University of California and/or California State University Admission
University of California
Admission requirements for the University of California (UC) follow guidelines set forth in the Master Plan, which requires that the top one-eighth of the state’s high school graduates, as well as those transfer students who have successfully completed specified college work, be eligible for admission to the UC. These requirements are designed to ensure that all eligible students are adequately prepared for univer-sity-level work. For general admissions requirements, please visit the University of California website at admission.universityofcalifornia .edu/ California State University
Admission requirements for the California State University (CSU) include three factors to determine eligibility: specific high school cours-es; grades in specified courses and test scores; and graduation from high school. Some campuses have higher standards for particular ma-jors or students who live outside the local campus area. Because of the number of students who apply, a few campuses have higher stand-ards (supplementary admission criteria) for all applicants. Most CSU campuses utilize local admission guarantee policies for students who graduate or transfer from high schools and colleges that are historically served by a CSU campus in that region. For general admissions requirements please visit the California State University website at www.calstate.edu/admission/admission.shtml. This table displays, for the most recent year for which data are available, two measures related to the school’s courses that are required for UC and/or CSU admission. Detailed information about student enrollment in and completion of courses required for UC/CSU admission can be found at the CDE website at dq.cde.ca.gov/dataquest/.
Measure Percentage 2014–15 students enrolled in courses required for UC/CSU admission 0.0 2013–14 graduates who completed all courses required for UC/CSU admission —
State Priority: Other Pupil Outcomes This section provides information relevant to the Other Pupil Outcomes Sate Priority (Priority 8): student outcomes in English, mathemat-ics, and physical education. The results of the California High School Exit Examination (CAHSEE) provide the outcomes in English and mathematics. The results of the California Physical Fitness Test provide the outcomes in physical fitness. California High School Exit Examination
This section does not apply to this school. California Physical Fitness Test Results (2014–15)
The California Physical Fitness Test is administered to students in grades 5, 7, and 9 only. This table displays by grade level the percentage of students tested who met the fitness standards for the most recent testing period. Data on students receiving migrant education services are not available. Detailed information regarding this test, and comparisons of a school’s test results to the district and state levels, may be found at the CDE website at www.cde.ca.gov/ta/tg/pf/.
Grade Level
Percentage of Students Tested Who Met Fitness Standards
Four of Six Standards Five of Six Standards Six of Six Standards 5 20.9 20.9 39.5 7 13.0 31.5 42.6
Note: A dash (—) indicates the number of students tested is 10 or less; percentages are not calculated either because the re-sult is too small for statistical accuracy or to protect student privacy. An “n/a” indicates no data are available.
Darnall (079) 13 Spring 2016 School Accountability Report Card
Engagement
State Priority: Parental Involvement This section provides information relevant to the Parental Involvement State Priority (Priority 3): efforts the school district makes to seek parent input in making decisions for the school district and each school. Opportunities for Parent Involvement
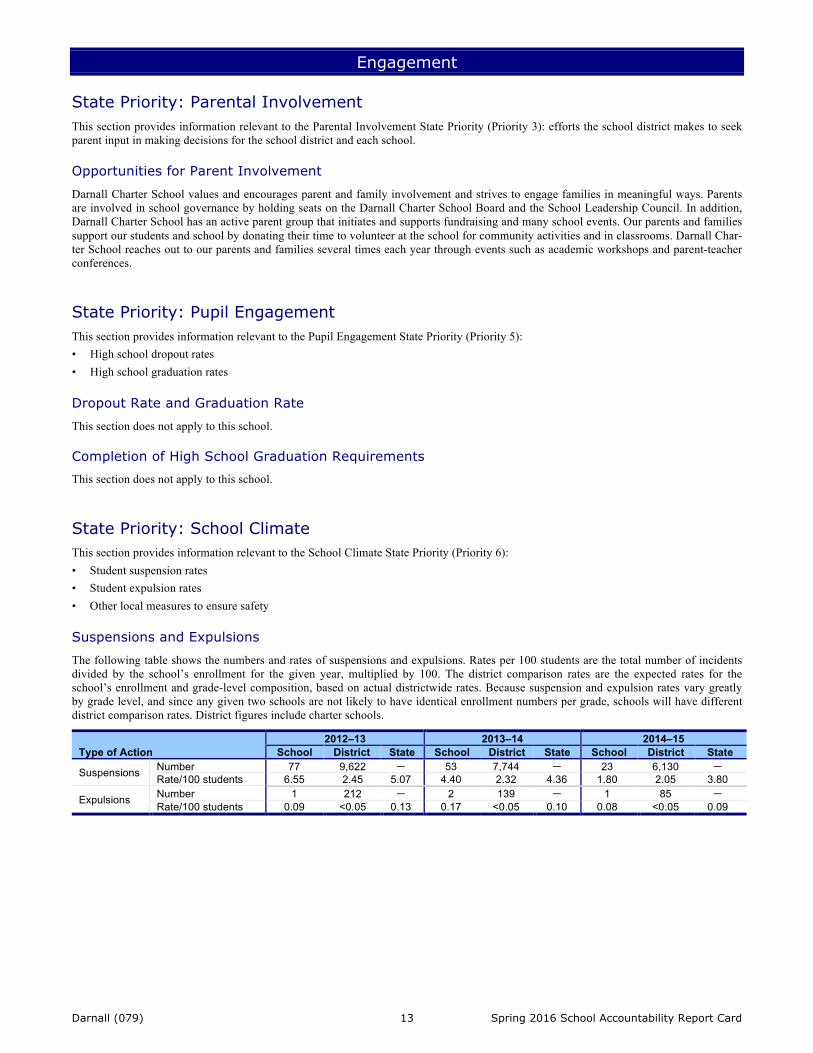
Darnall Charter School values and encourages parent and family involvement and strives to engage families in meaningful ways. Parents are involved in school governance by holding seats on the Darnall Charter School Board and the School Leadership Council. In addition, Darnall Charter School has an active parent group that initiates and supports fundraising and many school events. Our parents and families support our students and school by donating their time to volunteer at the school for community activities and in classrooms. Darnall Char-ter School reaches out to our parents and families several times each year through events such as academic workshops and parent-teacher conferences. State Priority: Pupil Engagement This section provides information relevant to the Pupil Engagement State Priority (Priority 5): • High school dropout rates • High school graduation rates Dropout Rate and Graduation Rate
This section does not apply to this school. Completion of High School Graduation Requirements This section does not apply to this school. State Priority: School Climate This section provides information relevant to the School Climate State Priority (Priority 6): • Student suspension rates • Student expulsion rates • Other local measures to ensure safety Suspensions and Expulsions
The following table shows the numbers and rates of suspensions and expulsions. Rates per 100 students are the total number of incidents divided by the school’s enrollment for the given year, multiplied by 100. The district comparison rates are the expected rates for the school’s enrollment and grade-level composition, based on actual districtwide rates. Because suspension and expulsion rates vary greatly by grade level, and since any given two schools are not likely to have identical enrollment numbers per grade, schools will have different district comparison rates. District figures include charter schools.
Type of Action 2012–13 2013–14 2014–15
School District State School District State School District State
Suspensions Number 77 9,622 — 53 7,744 — 23 6,130 — Rate/100 students 6.55 2.45 5.07 4.40 2.32 4.36 1.80 2.05 3.80
Expulsions Number 1 212 — 2 139 — 1 85 — Rate/100 students 0.09 <0.05 0.13 0.17 <0.05 0.10 0.08 <0.05 0.09
Darnall (079) 14 Spring 2016 School Accountability Report Card
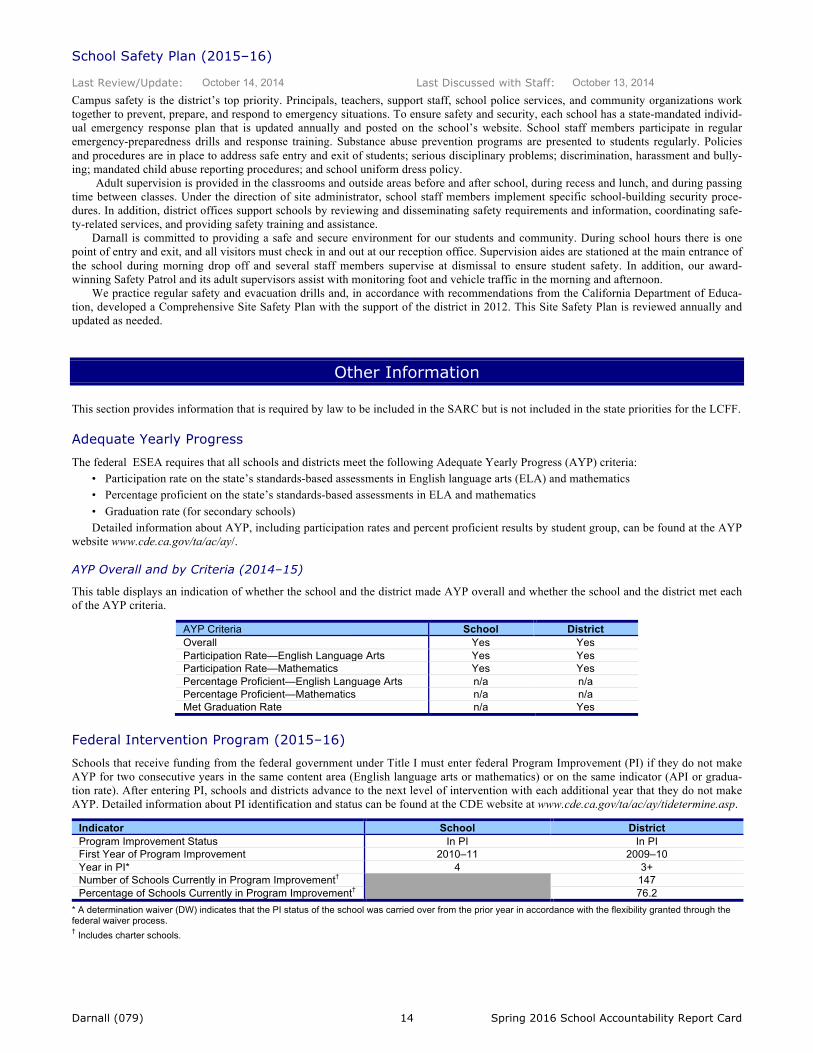
School Safety Plan (2015–16)
Last Review/Update: October 14, 2014 Last Discussed with Staff: October 13, 2014 Campus safety is the district’s top priority. Principals, teachers, support staff, school police services, and community organizations work together to prevent, prepare, and respond to emergency situations. To ensure safety and security, each school has a state-mandated individ-ual emergency response plan that is updated annually and posted on the school’s website. School staff members participate in regular emergency-preparedness drills and response training. Substance abuse prevention programs are presented to students regularly. Policies and procedures are in place to address safe entry and exit of students; serious disciplinary problems; discrimination, harassment and bully-ing; mandated child abuse reporting procedures; and school uniform dress policy.
Adult supervision is provided in the classrooms and outside areas before and after school, during recess and lunch, and during passing time between classes. Under the direction of site administrator, school staff members implement specific school-building security proce-dures. In addition, district offices support schools by reviewing and disseminating safety requirements and information, coordinating safe-ty-related services, and providing safety training and assistance.
Darnall is committed to providing a safe and secure environment for our students and community. During school hours there is one point of entry and exit, and all visitors must check in and out at our reception office. Supervision aides are stationed at the main entrance of the school during morning drop off and several staff members supervise at dismissal to ensure student safety. In addition, our award-winning Safety Patrol and its adult supervisors assist with monitoring foot and vehicle traffic in the morning and afternoon.
We practice regular safety and evacuation drills and, in accordance with recommendations from the California Department of Educa-tion, developed a Comprehensive Site Safety Plan with the support of the district in 2012. This Site Safety Plan is reviewed annually and updated as needed.
Other Information
This section provides information that is required by law to be included in the SARC but is not included in the state priorities for the LCFF. Adequate Yearly Progress
The federal ESEA requires that all schools and districts meet the following Adequate Yearly Progress (AYP) criteria: • Participation rate on the state’s standards-based assessments in English language arts (ELA) and mathematics • Percentage proficient on the state’s standards-based assessments in ELA and mathematics • Graduation rate (for secondary schools) Detailed information about AYP, including participation rates and percent proficient results by student group, can be found at the AYP
website www.cde.ca.gov/ta/ac/ay/. AYP Overall and by Criteria (2014–15)
This table displays an indication of whether the school and the district made AYP overall and whether the school and the district met each of the AYP criteria.
AYP Criteria School District Overall Yes Yes Participation Rate—English Language Arts Yes Yes Participation Rate—Mathematics Yes Yes Percentage Proficient—English Language Arts n/a n/a Percentage Proficient—Mathematics n/a n/a Met Graduation Rate n/a Yes
Federal Intervention Program (2015–16)
Schools that receive funding from the federal government under Title I must enter federal Program Improvement (PI) if they do not make AYP for two consecutive years in the same content area (English language arts or mathematics) or on the same indicator (API or gradua-tion rate). After entering PI, schools and districts advance to the next level of intervention with each additional year that they do not make AYP. Detailed information about PI identification and status can be found at the CDE website at www.cde.ca.gov/ta/ac/ay/tidetermine.asp.
Indicator School District Program Improvement Status In PI In PI First Year of Program Improvement 2010–11 2009–10 Year in PI* 4 3+ Number of Schools Currently in Program Improvement†
147
Percentage of Schools Currently in Program Improvement† 76.2 * A determination waiver (DW) indicates that the PI status of the school was carried over from the prior year in accordance with the flexibility granted through the federal waiver process. † Includes charter schools.
Darnall (079) 15 Spring 2016 School Accountability Report Card
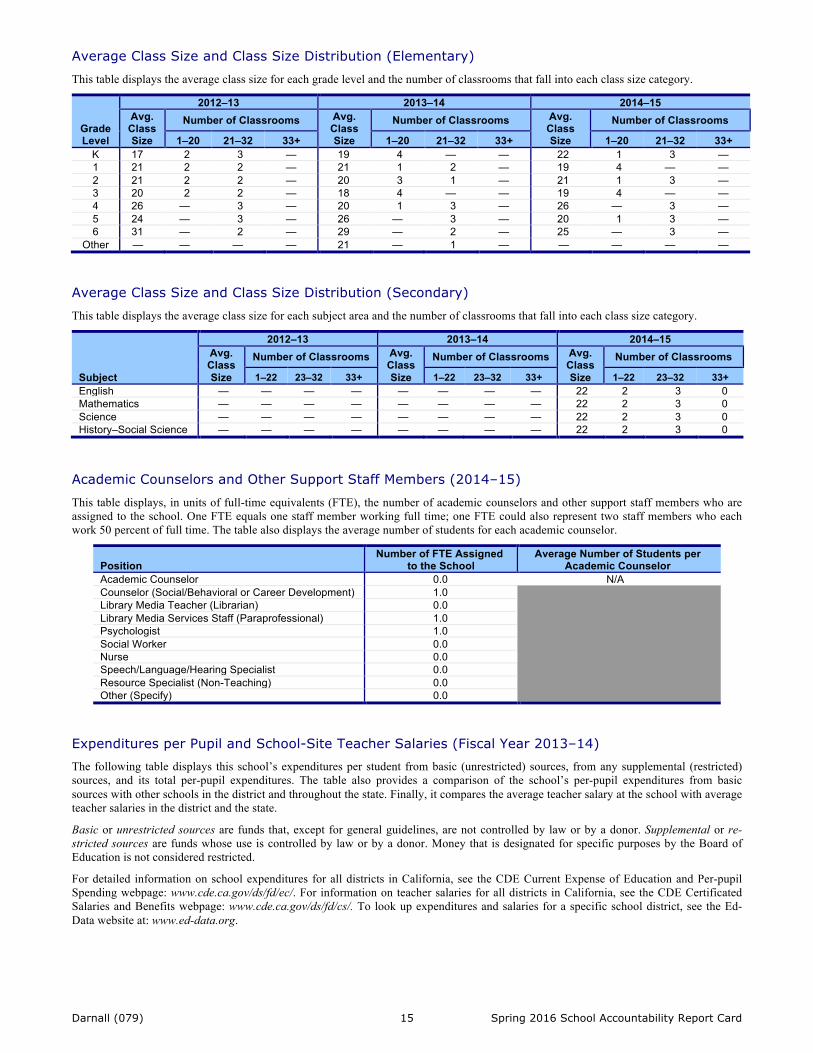
Average Class Size and Class Size Distribution (Elementary)
This table displays the average class size for each grade level and the number of classrooms that fall into each class size category.
Grade Level
2012–13 2013–14 2014–15 Avg. Class Size
Number of Classrooms Avg. Class Size
Number of Classrooms Avg. Class Size
Number of Classrooms
1–20 21–32 33+ 1–20 21–32 33+ 1–20 21–32 33+ K 17 2 3 — 19 4 — — 22 1 3 — 1 21 2 2 — 21 1 2 — 19 4 — — 2 21 2 2 — 20 3 1 — 21 1 3 — 3 20 2 2 — 18 4 — — 19 4 — — 4 26 — 3 — 20 1 3 — 26 — 3 — 5 24 — 3 — 26 — 3 — 20 1 3 — 6 31 — 2 — 29 — 2 — 25 — 3 —
Other — — — — 21 — 1 — — — — — Average Class Size and Class Size Distribution (Secondary)
This table displays the average class size for each subject area and the number of classrooms that fall into each class size category.
Subject
2012–13 2013–14 2014–15 Avg. Class Size
Number of Classrooms Avg. Class Size
Number of Classrooms Avg. Class Size
Number of Classrooms
1–22 23–32 33+ 1–22 23–32 33+ 1–22 23–32 33+ English — — — — — — — — 22 2 3 0 Mathematics — — — — — — — — 22 2 3 0 Science — — — — — — — — 22 2 3 0 History–Social Science — — — — — — — — 22 2 3 0
Academic Counselors and Other Support Staff Members (2014–15)
This table displays, in units of full-time equivalents (FTE), the number of academic counselors and other support staff members who are assigned to the school. One FTE equals one staff member working full time; one FTE could also represent two staff members who each work 50 percent of full time. The table also displays the average number of students for each academic counselor.
Position Number of FTE Assigned
to the School Average Number of Students per
Academic Counselor Academic Counselor 0.0 N/A Counselor (Social/Behavioral or Career Development) 1.0
Library Media Teacher (Librarian) 0.0 Library Media Services Staff (Paraprofessional) 1.0 Psychologist 1.0 Social Worker 0.0 Nurse 0.0 Speech/Language/Hearing Specialist 0.0 Resource Specialist (Non-Teaching) 0.0 Other (Specify) 0.0
Expenditures per Pupil and School-Site Teacher Salaries (Fiscal Year 2013–14) The following table displays this school’s expenditures per student from basic (unrestricted) sources, from any supplemental (restricted) sources, and its total per-pupil expenditures. The table also provides a comparison of the school’s per-pupil expenditures from basic sources with other schools in the district and throughout the state. Finally, it compares the average teacher salary at the school with average teacher salaries in the district and the state.
Basic or unrestricted sources are funds that, except for general guidelines, are not controlled by law or by a donor. Supplemental or re-stricted sources are funds whose use is controlled by law or by a donor. Money that is designated for specific purposes by the Board of Education is not considered restricted.
For detailed information on school expenditures for all districts in California, see the CDE Current Expense of Education and Per-pupil Spending webpage: www.cde.ca.gov/ds/fd/ec/. For information on teacher salaries for all districts in California, see the CDE Certificated Salaries and Benefits webpage: www.cde.ca.gov/ds/fd/cs/. To look up expenditures and salaries for a specific school district, see the Ed-Data website at: www.ed-data.org.

Darnall (079) 16 Spring 2016 School Accountability Report Card
Level Total Expenditures
Per Pupil Expenditures Per Pupil
(Supplemental) Expenditures Per
Pupil (Basic) Average
Teacher Salary School Site $8,716 $1,391 $7,325 $64,097 District (excludes charter schools)
$5,218 $69,748 Difference: School Site and District (%) 40.38 – 8.10 State $5,348 $72,971 Difference: School Site and State (%) 36.97 – 12.16
Types of Services Funded (Fiscal Year 2014–15)
The school’s general fund includes monies for: • General operations—salaries, benefits, services, materials, and support to the general education • Special Education—programs offering appropriate, individualized instruction to students with special needs • Special projects—monies from agencies (federal or state) earmarked for specific programs/projects or services • Maintenance and operations • District administration Each school in the district receives an instructional budget based on enrollment, programs, and formulas set by Board of Education pol-
icy, state law, agreements with employee bargaining units, and guidelines of outside funding sources. As a charter school, Darnall receives its funding directly from the state. Darnall Charter School operates a $6,000,000 budget under the direction of its Board of Directors and Budget Committee. The school board contracts with a back-office provider and ensures that the money is spent in ways that benefit stu-dents and support the school’s vision, mission, and charter. Teacher and Administrative Salaries (Fiscal Year 2013–14)
This table displays district-level salary information for teachers, principals, and the superintendent, and compares these figures to the state averages for districts of the same type and size. The table also displays teachers and administrative salaries as a percentage of a district’s budget, and compares these figures to the state averages for districts of the same type and size. Detailed information regarding salaries may be found at the CDE website at www.cde.ca.gov/ds/fd/cs/.
Position District Amount Statewide Average for
Districts in Same Category Beginning Teacher Salary $39,983 $43,165 Mid-Range Teacher Salary $60,754 $68,574 Highest Teacher Salary $82,578 $89,146 Average Principal Salary (Elementary School Level) $114,227 $111,129 Average Principal Salary (Middle School Level) $116,019 $116,569 Average Principal Salary (High School Level) $126,214 $127,448 Superintendent Salary $252,960 $234,382 Percentage of Budget for Teachers’ Salaries 39 38 Percentage of Budget for Administrative Salaries 5 5
Advanced Placement Courses (2014–15) This section does not apply to this school. Professional Development
The development of teacher capacity is an integral component of Darnall Charter School’s educational philosophy. We have an instruction-al leader who, in collaboration with faculty, plans and schedules professional learning regularly into our annual calendar. Professional learning occurs at three levels: K–8, grade-level teams, and individually. Our professional learning model is evolving to incorporate 21st-century learning skills and engage teachers in blended learning. We believe that this experiential learning provides teachers with the most authentic ways in which to understand the expectations that we have for students, and, in doing so, develop a deeper understanding of how to create robust learning experiences for our students. Over the next five years, we are committed to the following professional learning objectives: • Deep understanding of the Common Core State Standards • Thorough integration of 21st-century skills and proficiencies • Responding to the impact of Common Core State Standards and 21st-century learning on English language development • Implementation of project-based learning and performance assessments • Individualized learning supported by the strategic use of technology tools • Development of blended learning
Time for professional learning is scheduled into our annual calendar by including one modified day each week. Approximately 7 per-cent of these days are dedicated to structured professional learning activities during which the entire teaching staff meets for presentations and discussions on relevant topics. In addition, professional learning also occurs during weekly grade-level meetings. At these meetings,
Darnall (079) 17 Spring 2016 School Accountability Report Card
teams collaborate for up to 1.5 hours, engaged in activities such as evaluating student data, comparing the results of instructional strategies, or revising instructional plans. Teacher expertise is also supported and developed through coaching and off-site workshops. In addition, we support individual teachers in pursuit of advanced degrees and National Board Certification.
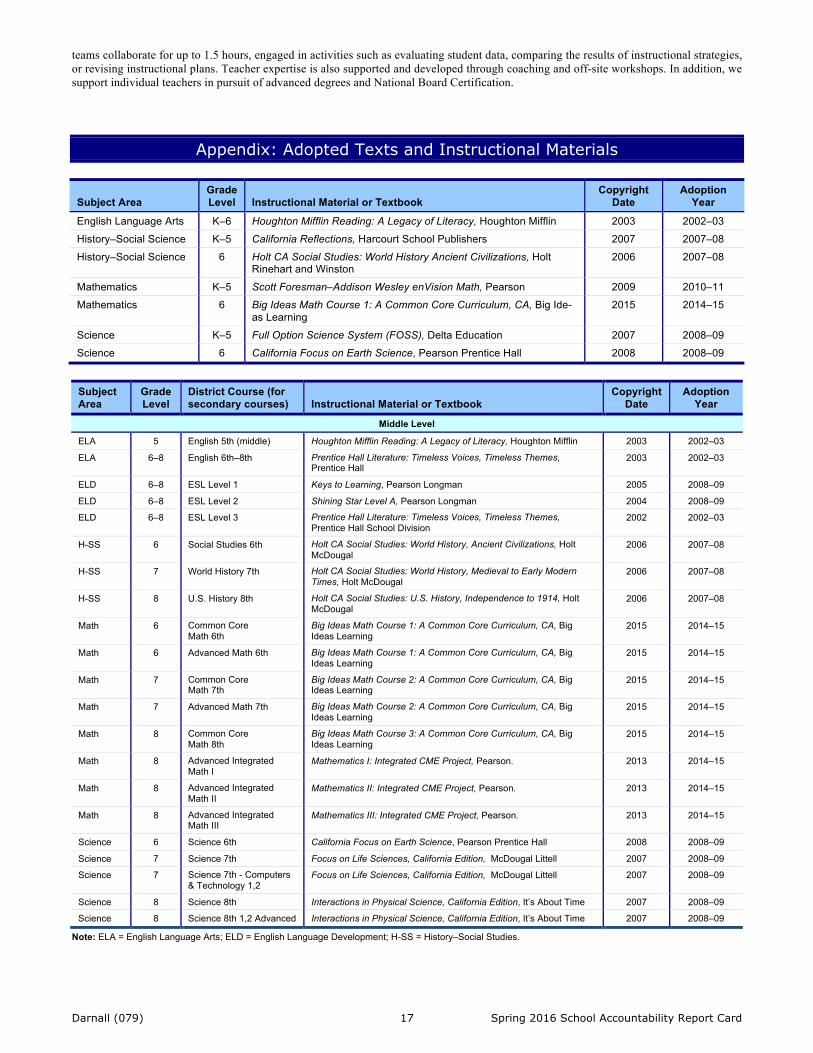
Appendix: Adopted Texts and Instructional Materials
Subject Area Grade Level Instructional Material or Textbook
Copyright Date
Adoption Year
English Language Arts K–6 Houghton Mifflin Reading: A Legacy of Literacy, Houghton Mifflin 2003 2002–03 History–Social Science K–5 California Reflections, Harcourt School Publishers 2007 2007–08 History–Social Science 6 Holt CA Social Studies: World History Ancient Civilizations, Holt
Rinehart and Winston 2006 2007–08
Mathematics K–5 Scott Foresman–Addison Wesley enVision Math, Pearson 2009 2010–11 Mathematics 6 Big Ideas Math Course 1: A Common Core Curriculum, CA, Big Ide-
as Learning 2015 2014–15
Science K–5 Full Option Science System (FOSS), Delta Education 2007 2008–09 Science 6 California Focus on Earth Science, Pearson Prentice Hall 2008 2008–09
Subject Area
Grade Level
District Course (for secondary courses) Instructional Material or Textbook
Copyright Date
Adoption Year
Middle Level
ELA 5 English 5th (middle) Houghton Mifflin Reading: A Legacy of Literacy, Houghton Mifflin 2003 2002–03
ELA 6–8 English 6th–8th Prentice Hall Literature: Timeless Voices, Timeless Themes, Prentice Hall
2003 2002–03
ELD 6–8 ESL Level 1 Keys to Learning, Pearson Longman 2005 2008–09
ELD 6–8 ESL Level 2 Shining Star Level A, Pearson Longman 2004 2008–09
ELD 6–8 ESL Level 3 Prentice Hall Literature: Timeless Voices, Timeless Themes, Prentice Hall School Division
2002 2002–03
H-SS 6 Social Studies 6th Holt CA Social Studies: World History, Ancient Civilizations, Holt McDougal
2006 2007–08
H-SS 7 World History 7th Holt CA Social Studies: World History, Medieval to Early Modern Times, Holt McDougal
2006 2007–08
H-SS 8 U.S. History 8th Holt CA Social Studies: U.S. History, Independence to 1914, Holt McDougal
2006 2007–08
Math 6 Common Core Math 6th
Big Ideas Math Course 1: A Common Core Curriculum, CA, Big Ideas Learning
2015 2014–15
Math 6 Advanced Math 6th Big Ideas Math Course 1: A Common Core Curriculum, CA, Big Ideas Learning
2015 2014–15
Math 7 Common Core Math 7th
Big Ideas Math Course 2: A Common Core Curriculum, CA, Big Ideas Learning
2015 2014–15
Math 7 Advanced Math 7th Big Ideas Math Course 2: A Common Core Curriculum, CA, Big Ideas Learning
2015 2014–15
Math 8 Common Core Math 8th
Big Ideas Math Course 3: A Common Core Curriculum, CA, Big Ideas Learning
2015 2014–15
Math 8 Advanced Integrated Math I
Mathematics I: Integrated CME Project, Pearson. 2013 2014–15
Math 8 Advanced Integrated Math II
Mathematics II: Integrated CME Project, Pearson. 2013 2014–15
Math 8 Advanced Integrated Math III
Mathematics III: Integrated CME Project, Pearson. 2013 2014–15
Science 6 Science 6th California Focus on Earth Science, Pearson Prentice Hall 2008 2008–09
Science 7 Science 7th Focus on Life Sciences, California Edition, McDougal Littell 2007 2008–09
Science 7 Science 7th - Computers & Technology 1,2
Focus on Life Sciences, California Edition, McDougal Littell 2007 2008–09
Science 8 Science 8th Interactions in Physical Science, California Edition, It’s About Time 2007 2008–09
Science 8 Science 8th 1,2 Advanced Interactions in Physical Science, California Edition, It’s About Time 2007 2008–09
Note: ELA = English Language Arts; ELD = English Language Development; H-SS = History–Social Studies.