CHLORINATION BASICSCHLORINATION BASICS Created by: Mark D. Pauli, P.G. WDNR –Public Drinking Water...
54
CHLORINATION BASICS Created by: Mark D. Pauli, P.G. WDNR – Public Drinking Water Field Supervisor Rhinelander, WI
Transcript of CHLORINATION BASICSCHLORINATION BASICS Created by: Mark D. Pauli, P.G. WDNR –Public Drinking Water...

CHLORINATION BASICS
Created by:
Mark D. Pauli, P.G.
WDNR – Public Drinking Water Field Supervisor
Rhinelander, WI
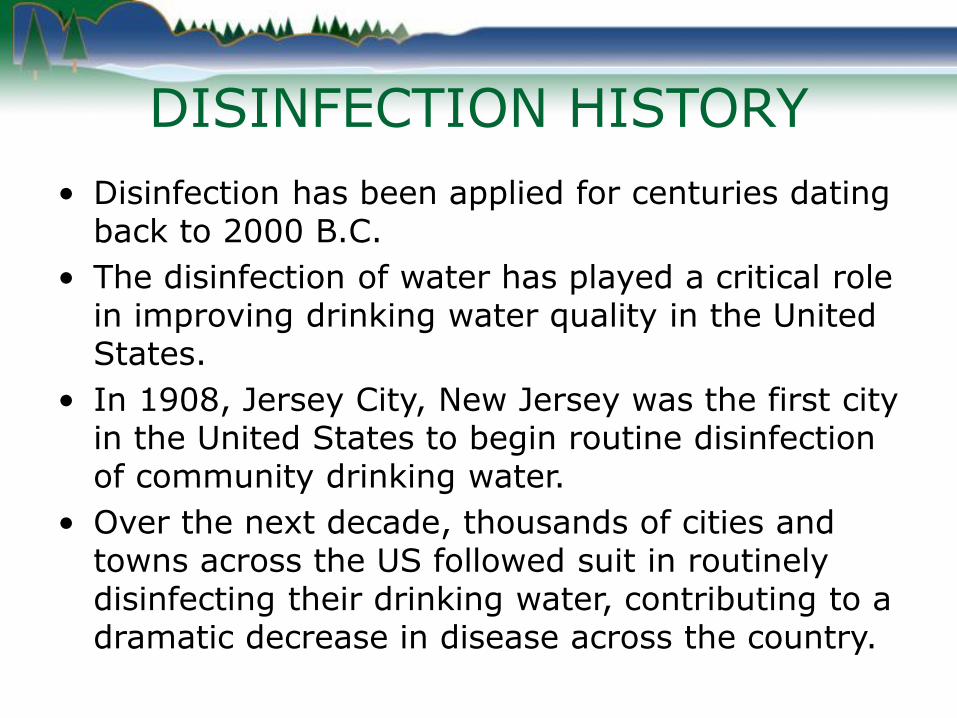
DISINFECTION HISTORY
• Disinfection has been applied for centuries dating back to 2000 B.C.
• The disinfection of water has played a critical role in improving drinking water quality in the United States.
• In 1908, Jersey City, New Jersey was the first city in the United States to begin routine disinfection of community drinking water.
• Over the next decade, thousands of cities and towns across the US followed suit in routinely disinfecting their drinking water, contributing to a dramatic decrease in disease across the country.

DISEASE PREVENTION
• By 1918 there were 33 million people across the country that were provided chlorinated water
• Recent slight downward trend due to the emergence of new diseases (aids) or reemergence of diseases (antibiotic resistant TB).
• Underscores the need for prevention through continual monitoring.
• Dramatic increase in life expectancy in the United States from 1900 to 2014

US LIFE EXPECTANCY
1900
2014

DISEASE PREVENTION
• In 1900, the occurrence of typhoid fever in the US was approximately 100 cases per 100,000 people.
• By 1920, it had decreased to 33.8 cases per 100,000 people.
• In 2006, it had decreased to 0.1 cases per 100,000 people (only 353 cases) with approximately 75% occurring among international travelers.

DISINFECTION HISTORY

DISINFECTION
• A process which inactivates pathogenic organisms in water by chemical oxidants or equivalent agents.

COMMON DISINFECTANTS
• Chlorine
• Sodium hypochlorite
• Chlorine dioxide
• Chloramines
• Hydrogen peroxide
• Copper/silver ionization
• Bromide
• Ozone and UV
• Sodium Dichloroisocyanurate

HOW DID WE GET HERE?
• Bacterial monitoring indicated the presence of total coliform and/or E. colibacteria (unsafe result)
• Collect Check/Repeat/Triggered samples to confirm the presence of bacteriological contamination?
• Private Well – Call Licensed Well Driller/Pump Installer
• Non-community Public Water System -Conduct Level 2 Assessment to determine the source of the sanitary seal break

Driller/Level 2 Assessment Findings
• Did the driller/Level 2 Assessment identify a physical sanitary defect?
–Yes: Fix the identified issue, disinfect the well and collect samples
–Check samples?

COLIFORM BACTERIA
• Why use coliform bacteria as an indicator of pathogens in water?
–They act in a similar fashion to pathogens
–They need similar growth requirements and environments
–They are generally easier to culture
–Relatively simple to identify
If coliform bacteria or E.coli is present in samples, the well shall be disinfected.

CHLORINATION
• For non-community public water systems/private wells (NR812) the most common disinfection procedure will be chlorination.

CHORINE DISINFECTION
• Chlorine kills pathogens such as bacteria and viruses by breaking the chemical bonds in their molecules. When enzymes come in contact with chlorine, one or more of the hydrogen atoms in the molecule are replaced by chlorine. This causes the entire molecule to change shape or fall apart.
Chemical
replacement
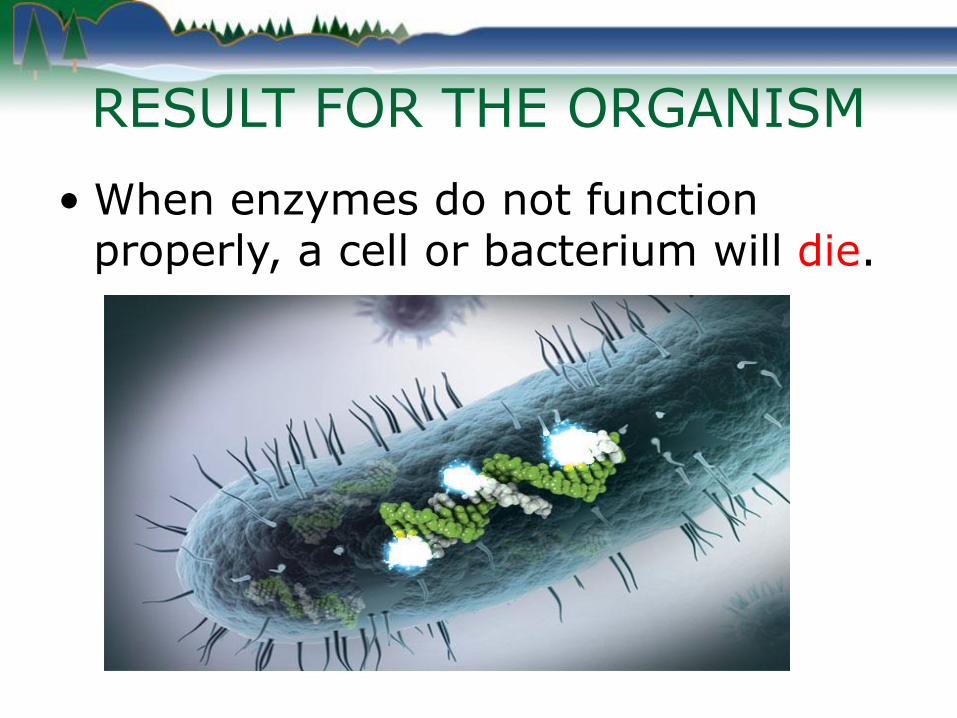
RESULT FOR THE ORGANISM
• When enzymes do not function properly, a cell or bacterium will die.

Factors Affecting Chlorination
• Contact Time (CT)
• Type of Microorganism
• Age of Microorganism
• Water Chemistry
• Temperature
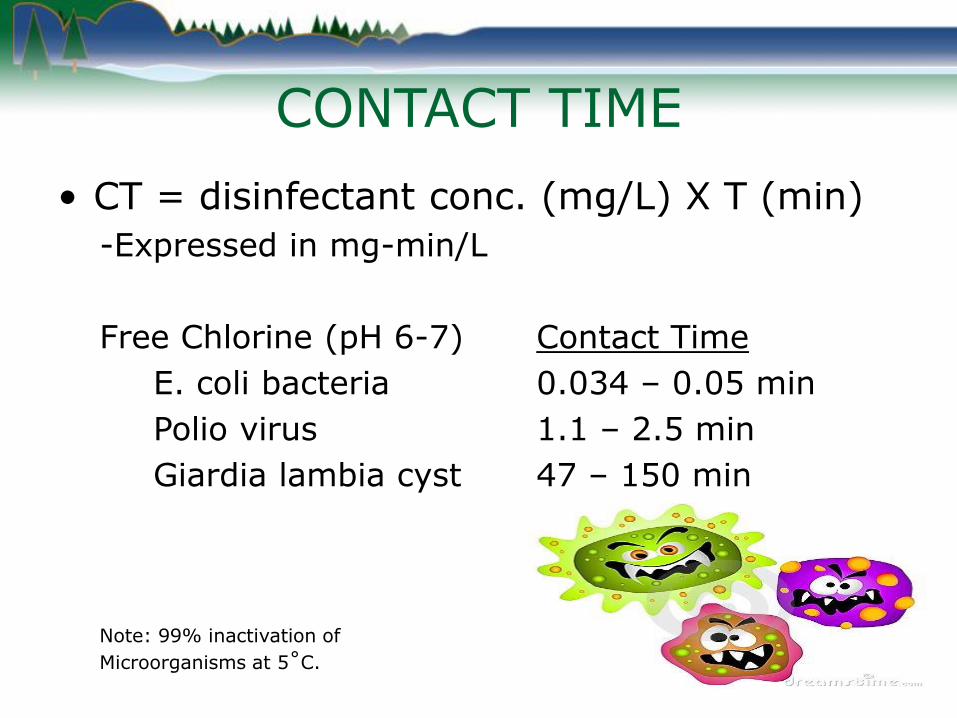
CONTACT TIME
• CT = disinfectant conc. (mg/L) X T (min)
-Expressed in mg-min/L
Free Chlorine (pH 6-7) Contact Time
E. coli bacteria 0.034 – 0.05 min
Polio virus 1.1 – 2.5 min
Giardia lambia cyst 47 – 150 min
Note: 99% inactivation of
Microorganisms at 5˚C.

TYPE OF MICROORGANISM
• Bacteria, viruses and parasites can effectively be killed by disinfection.
• E. coli is typically more resistant to disinfectants and are therefore used as indicator species.
• Protozoa parasites like Cryptosporidium and Giardia are very resistant to chlorine.
• Bacterial spores can also be very resistant to chlorine.

AGE OF THE MICRORGANISM
• Young bacteria are easier to kill than older bacteria
• Older bacteria develop a slime layer (polysaccharide shell) over their cell wall
–A 2.0 mg/L chlorine solution will require 30 minute CT for 10 day old bacteria
–The same solution would require 1 day 1 minute CT for older bacteria (24 hour CT)

PATHOGENIC ORGANISM
The cell walls of pathogenic microorganisms are negatively charged by nature.
http://www.haccpper.co.jp/e/aboutcomfosy/images/canfa_img09.jpg

WATER CHEMISTRY
• Dissolved iron, manganese, hydrogen sulfide and nitrates often react with chlorine, which disrupts disinfection.
• Alkalinity – ability to neutralize acids
–Carbonates (CO32-)
• Turbidity/Organic Matter – reduces free chlorine levels

TEMPERATURE
• Increasing temperatures usually increases the speed of reactions and of disinfection
• Can decrease disinfection because the disinfectant falls apart or volatilizes
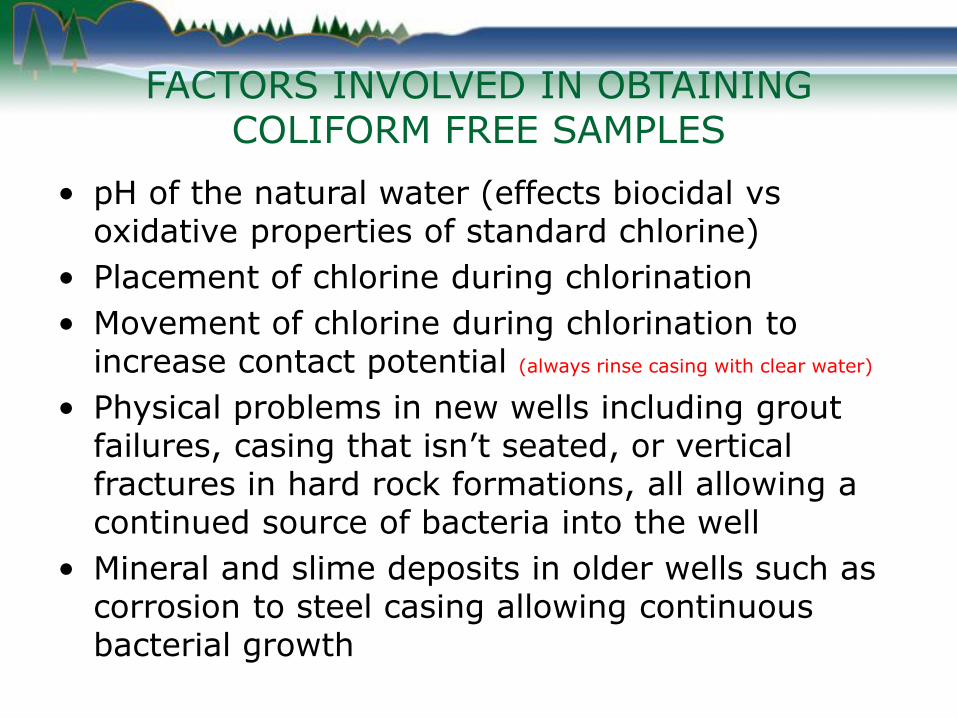
FACTORS INVOLVED IN OBTAINING COLIFORM FREE SAMPLES
• pH of the natural water (effects biocidal vs oxidative properties of standard chlorine)
• Placement of chlorine during chlorination
• Movement of chlorine during chlorination to increase contact potential (always rinse casing with clear water)
• Physical problems in new wells including grout failures, casing that isn’t seated, or vertical fractures in hard rock formations, all allowing a continued source of bacteria into the well
• Mineral and slime deposits in older wells such as corrosion to steel casing allowing continuous bacterial growth

Chlorination pH Dependency
HOCL (Hypochlorous Acid) + OCL- (Hypochlorite Ion) = Free Chlorine
Hypochlorous acid is split into hydrochloric acid (HCl) and Oxygen (O).
The oxygen atom is a powerful disinfectant.

Hypochlorous vs Hypochlorite
• The effectiveness of chlorination is determined by the pH of the water.
• Disinfection with chlorine will take place optimally when the pH is between 5.5 and 7.5.
• pH value of 6 has 80% hypochlorous acid and pH of 8 has 80% hypochlorite ion

Hypochlorous vs Hypochlorite
• Hypochlorous acid is 60 to 100 times more effective than hypochlorite ion at killing or oxidizing microorganisms.
• The cell wall of pathogenic organisms is negatively charged, therefore neutrally charged hypochlorous acid can more readily penetrate the cell wall than negatively charged OCL
-.

HOW TO MEASURE pH
• Indicator strips
– Colorimetric (colored/turbid water can cause
interference)
• Portable pH meter

PROPER pH METER USE
• Always store the pH meter in electrolyte solution when not in use
• Always use fresh calibration solutions
• Use a two-point calibration

WELL MEASUREMENTS
• Total depth of well (ft) (from top of casing)
• Depth to static water level (ft) (from top
of casing)
• Diameter of well (inches)– 2 inch diameter well = 0.17 gal/ft Volume Factor
– 4 inch diameter well = 0.66 gal/ft
– 5 inch diameter well = 1.04 gal/ft
– 6 inch diameter well = 1.50 gal/ft
– 8 inch diameter well = 2.60 gal/ft
Total Depth of well (ft) – depth to static water level (ft) = Standing Water Column (ft)
Standing Water Column (ft) X Volume Factor (gal/ft) = Volume of Standing Water (gal)

Chlorine Solution Calculator
• Enter: chlorine calculation
Into web browser: example
http://www.publichealthontario.ca/en/ServicesAndTools/Tools/Pages/Dilution-Calculator.aspx
• Watch % chlorine in bleach. No standard for industry. Sodium hypochlorite has a shelf life.

Distribution System Size
• Size of distribution system should be taken into consideration
Engineering ToolBox, (2010). Pipes - Water Content - Weight and Volume. [online] Available at: https://www.engineeringtoolbox.com/pipe-
water-content-volume-weight-d_1734.html [Accessed Day Mo. Year].

Distribution System Size
• Examples:
• Average home: – 200 ft 1 inch pipe: 200 ft X 0.041 gal/ft = 8.2 gal
– Water heater: 40 gal
– Pressure tank: 40 gal
– Total distribution volume = approximately 88 gal
• Non-transient Non-community (NN) public water system (factory)– 1000 ft 2 inch pipe: 1000 ft X 0.163 gal/ft = 163 gal
– Water Heater: 80 gal
– Pressure Tanks: 120 gal
– Total distribution volume = approximately 363 gal

CONFLICTING RESULTS?
• Why might I get conflicting results when I take more than one bacteriological sample at a system?
– Average distribution system 50 gal
(minus water heater)
– Bacteriological sample container contains 100 milliliters (ml)
• 50 gal x 1000ml/liter X 3.79 liter/gal= 189,500 ml
• 100 ml/189,500 ml= 0.000528 X100 (percent) = 0.05%
• 1% represents parts per million sampling, therefore the confidence interval is very low

CAUTION ARSENIC• Too much of a good thing?
– Over chlorinating or chlorinating too frequently may be less effective
• The inorganic form of arsenic (most toxic form) has been detected in many wells in Wisconsin.
• There have been reports of wells which did not exceed the maximum contaminant level (MCL) of 10 micrograms per liter (ppb) prior to disinfection that exhibited elevated levels of arsenic after excessive chlorination to combat a bacteriological problem.
• While a direct link to well chlorination and increased incidences of high levels of arsenic in drinking water wells has not been scientifically confirmed, preliminary information seems to point to that conclusion.
• See WDNR Publication PUB-DG-069 2012 for more information: Well Chlorination in Arsenic Sensitive Areas https://dnr.wi.gov/files/PDF/pubs/DG/DG0069.pdf
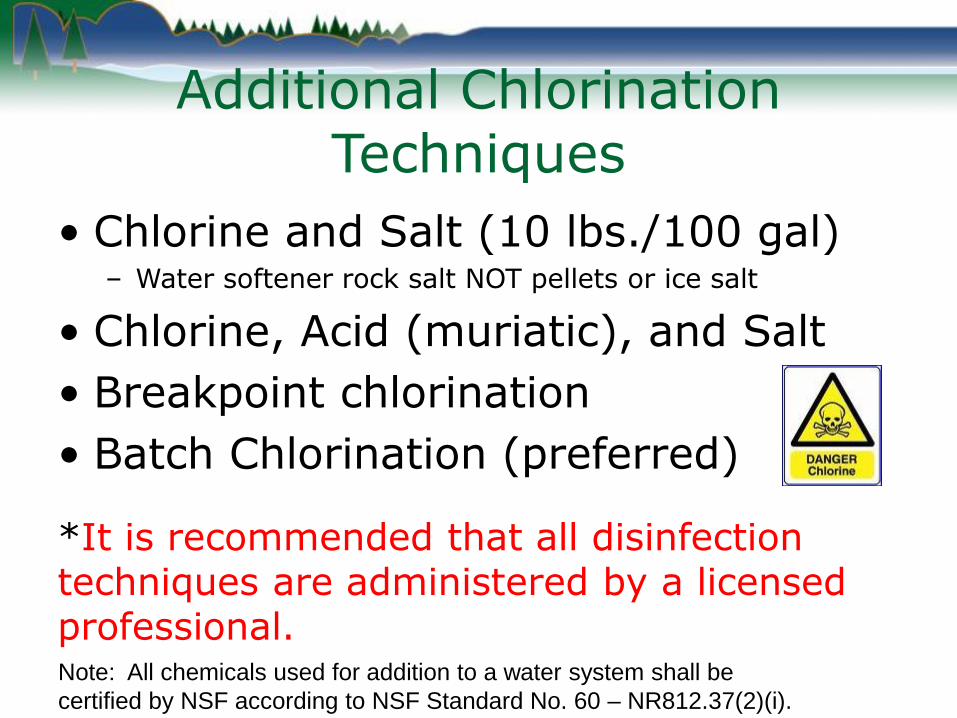
Additional Chlorination Techniques
• Chlorine and Salt (10 lbs./100 gal)– Water softener rock salt NOT pellets or ice salt
• Chlorine, Acid (muriatic), and Salt
• Breakpoint chlorination
• Batch Chlorination (preferred)
*It is recommended that all disinfection techniques are administered by a licensed professional.Note: All chemicals used for addition to a water system shall be
certified by NSF according to NSF Standard No. 60 – NR812.37(2)(i).
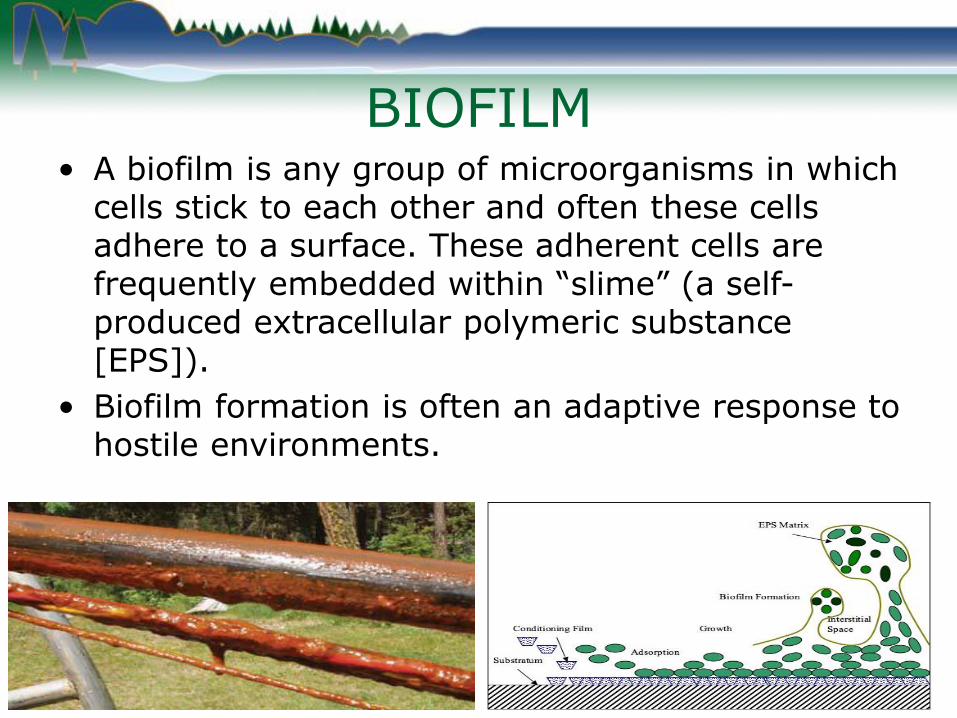
BIOFILM• A biofilm is any group of microorganisms in which
cells stick to each other and often these cells adhere to a surface. These adherent cells are frequently embedded within “slime” (a self-produced extracellular polymeric substance [EPS]).
• Biofilm formation is often an adaptive response to hostile environments.

BIOFILM IMPORTANCE
• Are the basis for a number of water treatments (i.e., Wastewater tertiary treatment)
• Constitute the major source of self-treatment in water bodies

BIOFILM IN WELLS
6 in. steel cased well Discharge from artesian well

BIOFILM LIFE CYCLE
• Free floating cell (planktonic cell)
• Adhesion to surface
• Formation of monolayer and production of “slime”
• Microcolony formation, with multilayer cells

BIOFILM LIFE CYCLE
• Mature biofilm with characteristic “mushroom” formed polysaccharide like cells starting to detach, reverting to planktonic cells thus completing the life cycle

BIOFILM FORMATION TIMELINE
• The biofilm cycle can occur in a matter of days.
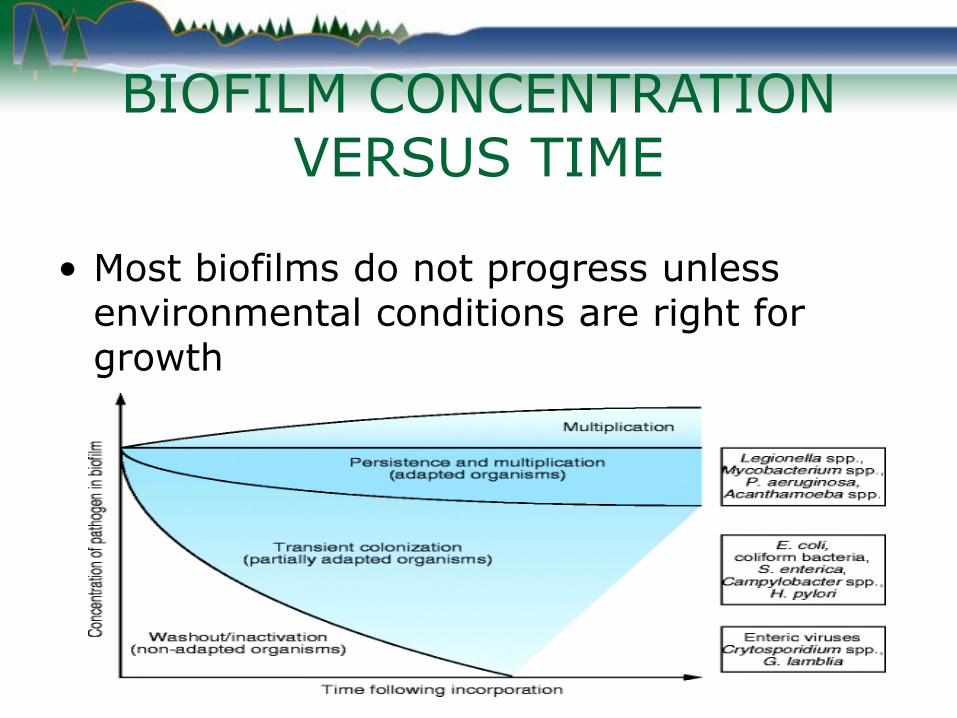
BIOFILM CONCENTRATION VERSUS TIME
• Most biofilms do not progress unless environmental conditions are right for growth

ENVIRONMENTAL CONDITIONS
• Temperature – low temps reduce growth rates
• Acidity – ideal pH is 6.5 to 7.0
• Water activity (stagnation)
• Oxygen – aerobic versus anaerobic
• Micronutrients – can limit growth
• Toxins – can hinder growth

BIOFILM DIVERSITY
• Aerobic and anaerobic species capable of co-existing.
• Proliferating and dormant species co-exist.
• Single layer to 3 dimensional structures.
• Unicellular to multi-cellular.
• Biofilm remediation indicates that a weaker disinfectant, (if it penetrates) will easily outperform a strong disinfectant that fails to penetrate.

BIOFILM DIVERSITY
• Some capable of forming single-species biofilms under certain conditions.
• A biofilm may grow very quickly, from microscopic to macroscopic when sufficient resources are available.
• Social structure within a particular biofilm is highly dependent on types of organisms present.
• Microbial cells growing in a biofilm are physiologically distinct from free floating (planktonic cells) of the same organism.
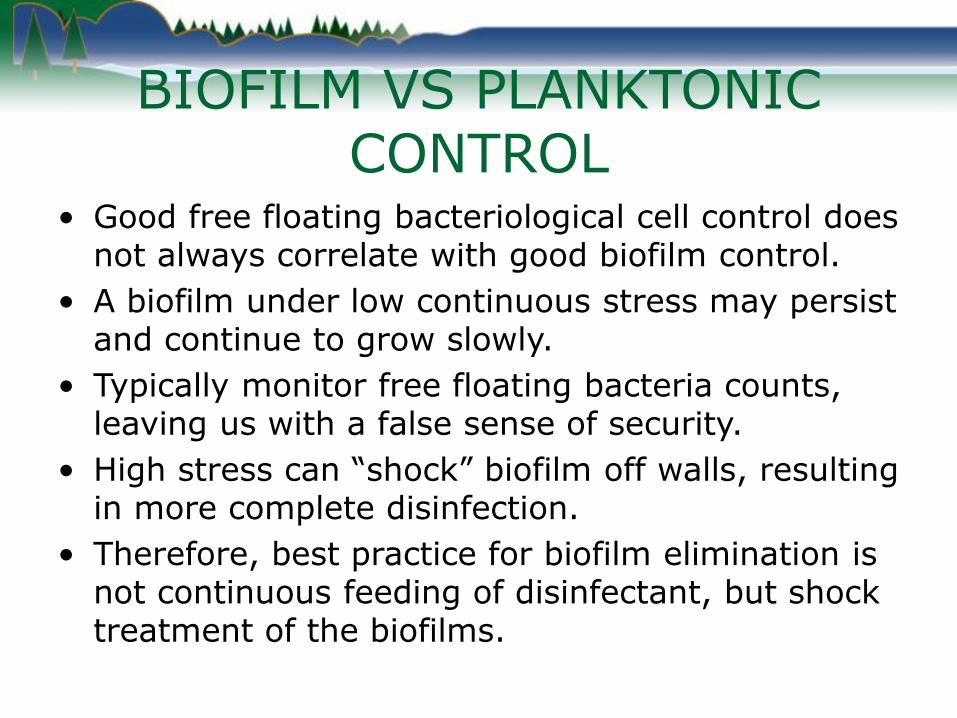
BIOFILM VS PLANKTONIC CONTROL
• Good free floating bacteriological cell control does not always correlate with good biofilm control.
• A biofilm under low continuous stress may persist and continue to grow slowly.
• Typically monitor free floating bacteria counts, leaving us with a false sense of security.
• High stress can “shock” biofilm off walls, resulting in more complete disinfection.
• Therefore, best practice for biofilm elimination is not continuous feeding of disinfectant, but shock treatment of the biofilms.

Removal of Biofilm from Well
• Physical Scrub of Well

Removal of Biofilm from Well
• Better to use a bailer to remove material, assists with removal of sediment from the bottom of the well.
• Avoid “air lifting” material out of the well as it may force microbes deeper into the aquifer matrix.
• If scaling and incrustation are prevalent enough a descaler and/or biocide may have to be used.

BACTERIA DEFENSE MECHANISMS
• SLIME LAYER - Extracellular Polymeric
Substance (EPS)
• Quorum Sensing
• Metabolic Dormancy
• Chemical Resistance (more medical related)
• Reservoir (aquifer)

Reasons Why Chlorination May Fail
• Bacteria may be present in areas outside the well and in the formation (aquifer). Batch chlorinate
• Lack of Well Development – drilling equipment can carry material containing bacteria into the aquifer
Steam clean equipment prior to each use?
• Natural pH of groundwater is > 7.0

Reasons Why Chlorination May Fail
• Dead-end lines exist in the distribution system
• Entire distribution system is not disinfected (open all faucets)
• Bladder is compromised in the pressure tank, or not stretched
• Not enough contact time
• Scale and/or biofilm consumes chlorine and residual is not maintained

Reasons Why Chlorination May Fail
• Large distribution system (dilution/chemical reactions)
• Cross-connection/backflow issue(s)
• Sanitary break in the system that has not been identified
• Water heater temperature has been decreased below 140
oF
• Sediment in the bottom of
well prohibits disinfection

Reasons Why Chlorination May Fail
• Unused wells on the property causing aquifer contamination
• Potential influence from sanitary system(s): on-site, or off-site

QUESTIONS?
Questions?
REFERENCES• American Chemistry Council. Chlorine – The Element of Surprise
(https://www.elementofsurprise.org/celebrate-110/).
• CDC. A Century of U.S. Water Chlorination and Treatment: One of the Ten Greatest Public Health Achievements of the 20th Century. (https://www.cdc.gov/mmwr/preview/mmwrhtml/mm4829a1.htm) Morb Mortal WklyRep. 1999;48(29):621-9.
• Engineering ToolBox, Pipes - Water Content - Weight and Volume. [online] Available at: https://www.engineeringtoolbox.com/pipe-water-content-volume-weight-d_1734.html (2010).
• Gillis, R.J. and J.R. Gillis, “Microbials: A Comparative Study of Bacterial Attachment to High-Purity Water System Surfaces,” Ultrapure Water, 13(6):27-36 (1996).
• Haccpper Advantec Corporation. Comfosy; Canfa; image09 http://www.haccpper.co.jp/e/aboutcomfosy/images/canfa_img09.jpg
• Lenntech BV. Processes; Disinfection; Chemical Disinfectants https://www.lenntech.com/processes/disinfection/disinfection.htm (1998-2017).
• Wisconsin Department of Natural Resources. Publication PUB-DG-069: Well Chlorination in Arsenic Sensitive Areas. (https://dnr.wi.gov/files/PDF/pubs/DG/DG0069.pdf (2012).