Chlorinated Paraffins Industry Association - AWPA · Chlorinated Paraffins Industry Association...
24
1 Chlorinated Paraffins Industry Association Evaluation of Environmental Release and Environmental Assessment of Medium Chain Chlorinated Paraffins (C14-C17) and Long Chain Chlorinated Paraffins (C18-C20) Executive Summary The Environmental Protection Agency’s (EPA) Draft Standard Review Risk Assessments of Medium Chain Chlorinated Paraffins (MCCP) (C14-C17) and Long Chain Chlorinated Paraffins (LCCP) (C18-C20) indicated that these substances may present an unreasonable risk to the environment because of concerns that they are released into the environment, particularly to the water, in amounts that could result in levels in excess of the concentrations of concern (CoC). Additionally, EPA has also concluded that these substances are expected to be persistence, bioaccumulative, and toxic (PBT). EPA specifically notes that its concerns are based upon: Release of both MCCP and LCCP to water during processing and use. Estimated environmental concentrations of MCCP and LCCP; Measured concentrations of MCCP in the environment; With these concerns in mind, the Chlorinated Paraffins Industry Association (CPIA) conducted an evaluation of the environmental release pathways associated with the use, waste generation, and waste handling of MCCP and LCCP for the following industrial use segments: Rubber - Compounding and Converting PVC and Plastic - Compounding and Converting Coatings, Adhesives, Sealants – Formulation and Use Additionally, the Independent Lubricant Manufacturers Association (ILMA) is working to develop similar information on use, waste generation and waste handling for metalworking fluids (MWF) formulation and use. There are only a few companies that use the majority of the total MCCP and LCCP volume going into rubber, PVC, plastic, coating, adhesives and sealant applications. For example, only 3 companies represent approximately 80% of the total MCCP and LCCP volume used in rubber, PVC and plastics. The largest users in the above industries were surveyed for information regarding their use practices. All of the respondents confirmed that they do not have any water releases from the processes involving MCCP or LCCP. None of the rubber, PVC or plastic applications use water in their processes or cleaning at all. The coating, adhesive and sealant manufacturers use water for process equipment cleaning; however, this cleaning water is either recycled into the products (some of which are water-based) or sent to landfill for disposal. Based on this information, CPIA believes that any water release pathways can be completely eliminated for these uses. Eliminating these release pathways will have the effect of eliminating the specific concerns identified by EPA for these applications, namely releases to water and estimated environmental concentrations above the CoCs. CPIA also hired an exposure expert to review the MCCP environmental monitoring data considered by EPA in its risk assessment. EPA concluded these data helped to support a conclusion of unreasonable risk to the environment for these substances. However, the weight of
-
Upload
hoangthien -
Category
Documents
-
view
221 -
download
1
Transcript of Chlorinated Paraffins Industry Association - AWPA · Chlorinated Paraffins Industry Association...
1
Chlorinated Paraffins Industry Association
Evaluation of Environmental Release and Environmental Assessment of Medium Chain
Chlorinated Paraffins (C14-C17) and Long Chain Chlorinated Paraffins (C18-C20)
Executive Summary
The Environmental Protection Agency’s (EPA) Draft Standard Review Risk Assessments of
Medium Chain Chlorinated Paraffins (MCCP) (C14-C17) and Long Chain Chlorinated Paraffins
(LCCP) (C18-C20) indicated that these substances may present an unreasonable risk to the
environment because of concerns that they are released into the environment, particularly to the
water, in amounts that could result in levels in excess of the concentrations of concern (CoC).
Additionally, EPA has also concluded that these substances are expected to be persistence,
bioaccumulative, and toxic (PBT). EPA specifically notes that its concerns are based upon:
Release of both MCCP and LCCP to water during processing and use.
Estimated environmental concentrations of MCCP and LCCP;
Measured concentrations of MCCP in the environment;
With these concerns in mind, the Chlorinated Paraffins Industry Association (CPIA) conducted
an evaluation of the environmental release pathways associated with the use, waste generation,
and waste handling of MCCP and LCCP for the following industrial use segments:
Rubber - Compounding and Converting
PVC and Plastic - Compounding and Converting
Coatings, Adhesives, Sealants – Formulation and Use
Additionally, the Independent Lubricant Manufacturers Association (ILMA) is working to
develop similar information on use, waste generation and waste handling for metalworking fluids
(MWF) formulation and use.
There are only a few companies that use the majority of the total MCCP and LCCP volume
going into rubber, PVC, plastic, coating, adhesives and sealant applications. For example, only 3
companies represent approximately 80% of the total MCCP and LCCP volume used in rubber,
PVC and plastics. The largest users in the above industries were surveyed for information
regarding their use practices. All of the respondents confirmed that they do not have any water
releases from the processes involving MCCP or LCCP. None of the rubber, PVC or plastic
applications use water in their processes or cleaning at all. The coating, adhesive and sealant
manufacturers use water for process equipment cleaning; however, this cleaning water is either
recycled into the products (some of which are water-based) or sent to landfill for disposal. Based
on this information, CPIA believes that any water release pathways can be completely eliminated
for these uses. Eliminating these release pathways will have the effect of eliminating the specific
concerns identified by EPA for these applications, namely releases to water and estimated
environmental concentrations above the CoCs.
CPIA also hired an exposure expert to review the MCCP environmental monitoring data
considered by EPA in its risk assessment. EPA concluded these data helped to support a
conclusion of unreasonable risk to the environment for these substances. However, the weight of
2
the evidence presented by these data does not suggest that exceedances of the EPA COC for
surface water or sediment are likely. For example, the only exceedance of the aquatic CoC noted
in these data is from a study in Norway using a lower resolution analytical method. All of the
water samples in the U.S. and North America are below the water CoC and, in particular, those
samples developed using higher resolution analytical methods were well below the CoC.
Likewise the vast majority of sediment samples are below the CoC and the only U.S. samples
above the CoC are from a surface impoundment at a CP manufacturing location, not from the
native environment. These monitoring data are also significant because they represent the
cumulative impact of all release sources in the environment and also appear to indicate that even
after decades of use levels of MCCP in the environment are not accumulating to levels above the
CoC.
1. Introduction
This evaluation is intended to inform the U.S. Environmental Protection Agency’s (EPA) review
of Medium Chain Chlorinated Paraffins (C14-C17) and Long Chain Chlorinated Paraffins (C18-
C20) for a series of PMNs that EPA received on these substances from CPIA members1.
EPA’s Draft Standard Review Risk Assessments of MCCP and LCCP indicated that these
substances may present an unreasonable risk to the environment. In particular EPA concluded
that these substances are: 1) expected to be persistent, bioaccumulative, and toxic (PBT), and 2)
released into the environment in amounts that may lead to exceedances in the concentrations of
concern (CoC) for aquatic and sediment-dwelling organisms.
In regards to concern #2, EPA specifically notes that its concerns are based upon:
Estimated environmental concentrations of MCCP and LCCP.
Measured concentrations of MCCP.
Release of both MCCP and LCCP to water during processing and use.
This document considers the release pathways for MCCP and LCCP identified by EPA in its risk
assessment of the downstream uses. A summary of these release pathways is provided followed
by recent information collected from downstream users regarding waste generation and handling
practices and the potential for water release. The survey results are considered in an assessment
of the relevance of EPA’s initially identified release pathways. Finally, a detailed analysis of the
available monitoring data is provided to better assess the current understanding of environmental
concentrations in the U.S. and the impact sampling location and analytical methods have on
those data.
1 CPIA members are Dover Chemical, INEOS Chlorvinyls, and Qualice LCC.
3
2. Physicochemical Parameters Important to the Assessment
The table below presents the physicochemical parameters used by EPA in its assessment of
MCCP and LCCP. There are several important physicochemical properties of MCCP and LCCP
that impact their environmental risk assessment, including their very low water solubilities and
the fact that these substances decompose prior to boiling.
Table 1: Summary of Physiochemical Data EPA used in its Assessment of MCCPs and LCCPs Substance %Cl (wt.) Melting
Point
Boiling
Point
Vapor
Pressure
Water
Solubility
Log KOW
MCCPs > 40 < 25 °C
(pour point)
> 200 °C
(dec)
< 0.036 Pa
at 20 °C
27 μg/L
at 20 °C
> 5.5
(measured)
8.30
(estimated)
LCCPs > 40 < 25 °C
(pour point)
> 200 °C
(dec)
< 2.7 × 10⁻⁴
Pa
at 20 °C
5 μg/L at 20
°C
> 10
EPA Sources: EURAR (ECB, 2008); EA (2009)
EPA Notes: Value calculated using the KOWWIN Program (v1.68) available in EPA’s Estimation
Programs Interface (EPI) Suite TM. This estimate was generated using a representative MCCP (i.e.,
C14H24Cl6, 52 wt % Cl) with the following SMILES notation:
CCC(Cl)CC(Cl)CCCl)CC(Cl)CC(Cl)CC(Cl)C. The EURAR (ECB, 2008) cited Renberg’s liquid
chromatography to measure a log KOW between 5.5 and 8.2 and then chose to use log KOW = 7 as a
representative log KOW for MCCP 45 – 52 wt % Cl.
The very low water solubilities noted by EPA for MCCP and LCCP will limit their ability to be
released via the dissolved fraction in water, will increase the efficacy of treatment technologies,
and will limit the overall mass released to water. As discussed in Section 8, the very low water
solubilities of these substances also complicate aquatic testing and the evaluation of aquatic
toxicity results.
Furthermore, the decomposition of MCCP and LCCP coupled with their very low vapor pressure
will limit any air emissions of MCCP and LCCP. This decomposition is a consideration in high
pressure/temperature applications such as found in metalworking, where the substance will de-
chlorinate and degrade during use. This de-chlorination is, in fact, the desired chemical
phenomenon during high pressure metalworking as the free chloride ions react with the metal
surface to reduce friction.
3. Environmental Critical Release Pathways in Draft Standard Review Risk Assessments
The following is a summary of the critical release pathways for the main downstream uses of
MCCP and LCCP from EPA’s Draft Standard Review Risk Assessment. Sections 4 and 5
review how these release pathways have been evaluated for this report by collecting information
from downstream users and how these release pathways can be modified based on this
information. The critical pathways summarized below focus on the assumed releases to water,
although it should be noted that in many cases EPA assumed a release could occur to water or
incineration or landfill. The E-FAST predicted surface water concentrations are based on the
release to water.
4
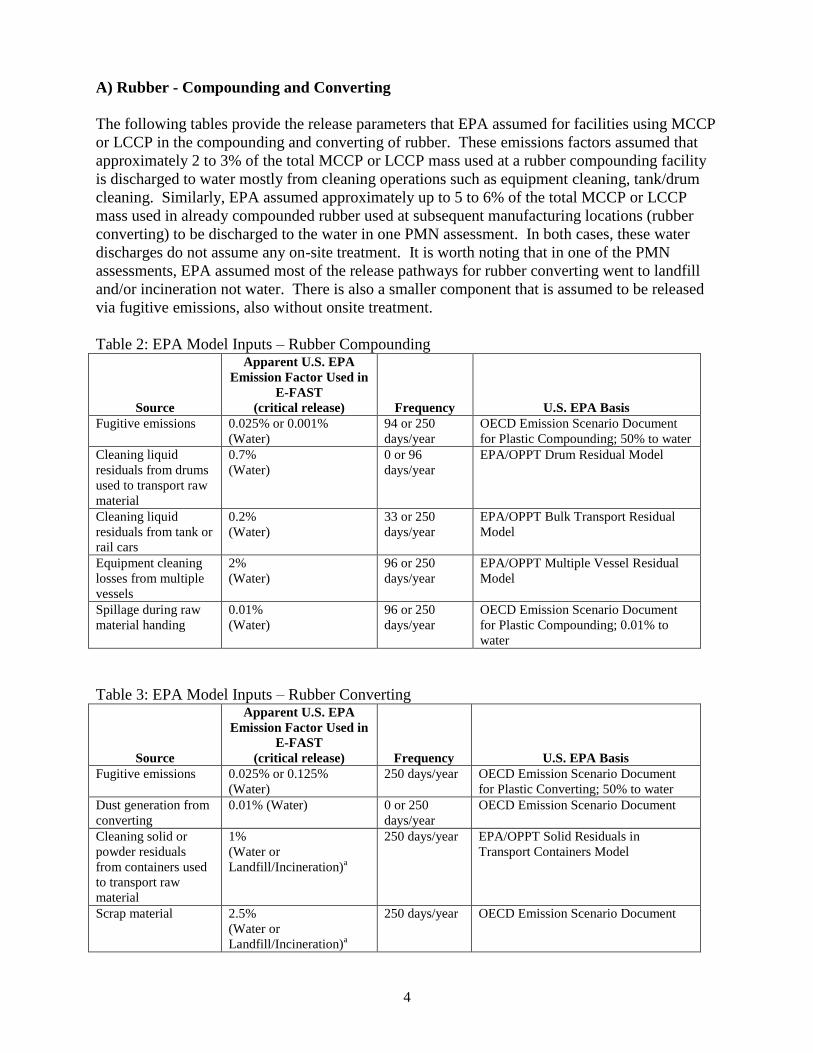
A) Rubber - Compounding and Converting
The following tables provide the release parameters that EPA assumed for facilities using MCCP
or LCCP in the compounding and converting of rubber. These emissions factors assumed that
approximately 2 to 3% of the total MCCP or LCCP mass used at a rubber compounding facility
is discharged to water mostly from cleaning operations such as equipment cleaning, tank/drum
cleaning. Similarly, EPA assumed approximately up to 5 to 6% of the total MCCP or LCCP
mass used in already compounded rubber used at subsequent manufacturing locations (rubber
converting) to be discharged to the water in one PMN assessment. In both cases, these water
discharges do not assume any on-site treatment. It is worth noting that in one of the PMN
assessments, EPA assumed most of the release pathways for rubber converting went to landfill
and/or incineration not water. There is also a smaller component that is assumed to be released
via fugitive emissions, also without onsite treatment.
Table 2: EPA Model Inputs – Rubber Compounding
Source
Apparent U.S. EPA
Emission Factor Used in
E-FAST
(critical release) Frequency U.S. EPA Basis
Fugitive emissions 0.025% or 0.001%
(Water)
94 or 250
days/year
OECD Emission Scenario Document
for Plastic Compounding; 50% to water
Cleaning liquid
residuals from drums
used to transport raw
material
0.7%
(Water)
0 or 96
days/year
EPA/OPPT Drum Residual Model
Cleaning liquid
residuals from tank or
rail cars
0.2%
(Water)
33 or 250
days/year
EPA/OPPT Bulk Transport Residual
Model
Equipment cleaning
losses from multiple
vessels
2%
(Water)
96 or 250
days/year
EPA/OPPT Multiple Vessel Residual
Model
Spillage during raw
material handing
0.01%
(Water)
96 or 250
days/year
OECD Emission Scenario Document
for Plastic Compounding; 0.01% to
water
Table 3: EPA Model Inputs – Rubber Converting
Source
Apparent U.S. EPA
Emission Factor Used in
E-FAST
(critical release) Frequency U.S. EPA Basis
Fugitive emissions 0.025% or 0.125%
(Water)
250 days/year OECD Emission Scenario Document
for Plastic Converting; 50% to water
Dust generation from
converting
0.01% (Water) 0 or 250
days/year
OECD Emission Scenario Document
Cleaning solid or
powder residuals
from containers used
to transport raw
material
1%
(Water or
Landfill/Incineration)a
250 days/year EPA/OPPT Solid Residuals in
Transport Containers Model
Scrap material 2.5%
(Water or
Landfill/Incineration)a
250 days/year OECD Emission Scenario Document
5
Equipment cleaning
losses from multiple
vessels
2%
(Water or
Landfill/Incineration)a
250 days/year EPA/OPPT Multiple Vessel Residual
Model
Spillage during raw
material handing
0.01%
(Water)
250 days/year OECD Emission Scenario Document
for Plastic Compounding; 0.01% to
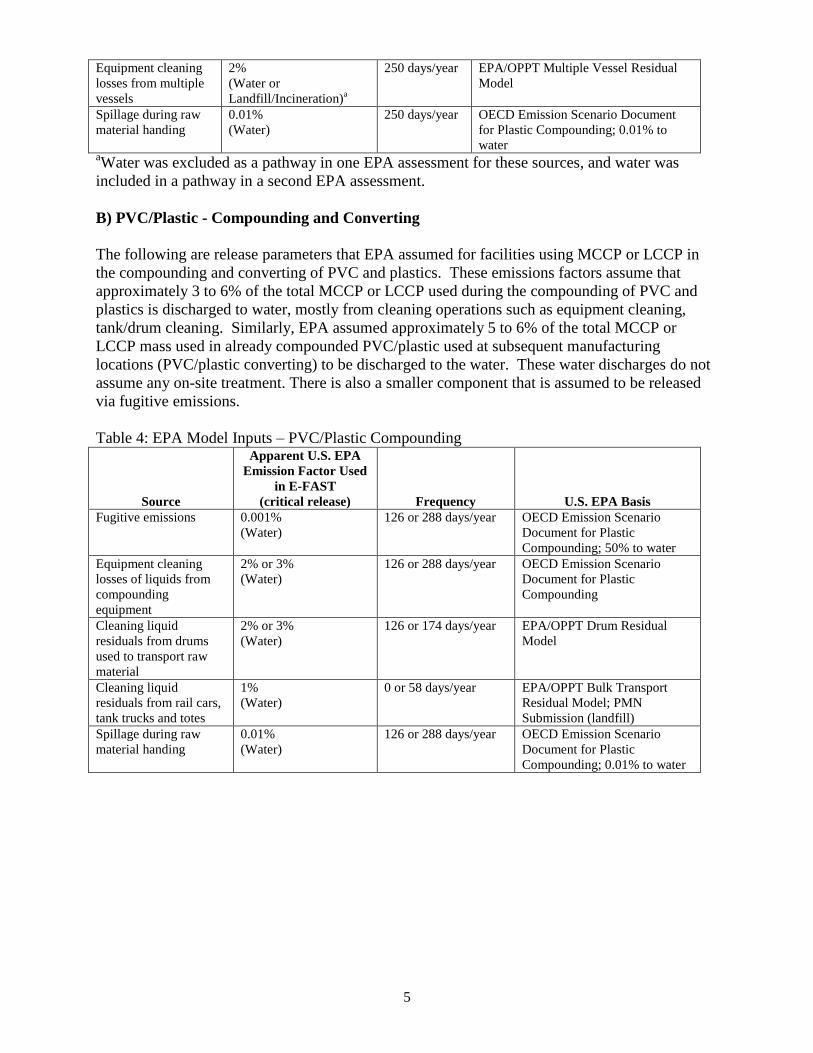
water aWater was excluded as a pathway in one EPA assessment for these sources, and water was
included in a pathway in a second EPA assessment.
B) PVC/Plastic - Compounding and Converting
The following are release parameters that EPA assumed for facilities using MCCP or LCCP in
the compounding and converting of PVC and plastics. These emissions factors assume that
approximately 3 to 6% of the total MCCP or LCCP used during the compounding of PVC and
plastics is discharged to water, mostly from cleaning operations such as equipment cleaning,
tank/drum cleaning. Similarly, EPA assumed approximately 5 to 6% of the total MCCP or
LCCP mass used in already compounded PVC/plastic used at subsequent manufacturing
locations (PVC/plastic converting) to be discharged to the water. These water discharges do not
assume any on-site treatment. There is also a smaller component that is assumed to be released
via fugitive emissions.
Table 4: EPA Model Inputs – PVC/Plastic Compounding
Source
Apparent U.S. EPA
Emission Factor Used
in E-FAST
(critical release) Frequency U.S. EPA Basis
Fugitive emissions 0.001%
(Water)
126 or 288 days/year OECD Emission Scenario
Document for Plastic
Compounding; 50% to water
Equipment cleaning
losses of liquids from
compounding
equipment
2% or 3%
(Water)
126 or 288 days/year OECD Emission Scenario
Document for Plastic
Compounding
Cleaning liquid
residuals from drums
used to transport raw
material
2% or 3%
(Water)
126 or 174 days/year EPA/OPPT Drum Residual
Model
Cleaning liquid
residuals from rail cars,
tank trucks and totes
1%
(Water)
0 or 58 days/year EPA/OPPT Bulk Transport
Residual Model; PMN
Submission (landfill)
Spillage during raw
material handing
0.01%
(Water)
126 or 288 days/year OECD Emission Scenario
Document for Plastic
Compounding; 0.01% to water

6
Table 5: EPA Model Inputs – PVC/Plastic Converting
Source
Apparent U.S. EPA
Emission Factor Used in
E-FAST
(critical release) Frequency U.S. EPA Basis
Fugitive emissions 0.075%
(Water)
250 days/year OECD Emission Scenario
Document for Plastic
Converting; 50% to water
Spillage during raw
material handing
0.01%
(Water)
250 days/year OECD Emission Scenario
Document for Plastic
Converting;
Cleaning powders
residuals from
containers used to
transport raw material
1%
(Water)
250 days/year EPA/OPPT Model for Solid
Residuals
Equipment cleaning
losses from multiple
vessels
2%
(Water)
250 days/year EPA/OPPT Multiple Vessel
Residual Model
Scrap material 2.5%
(Water)
250 days/year EPA assessment of SCCP
(1992)
C) Coatings, Adhesives, Sealants – Formulation and Use
The following are release parameters that EPA assumed for facilities using MCCP or LCCP in
the formulation and use of coatings, adhesives and sealants. These emissions factors generally
assume that approximately 4 to 5% of the total MCCP or LCCP used in the formulation of
coatings, adhesives and sealants is discharged to water, mostly from cleaning operations such as
equipment cleaning, tank/drum cleaning. These factors also assume that up to 14% of the total
mass of MCCP and LCCP in finished coatings, adhesives and sealants is discharged to the water.
These water discharges do not assume any on-site treatment.
Table 6: EPA Model Inputs – Formulation of Coatings, Adhesives, Sealants
Source
Apparent U.S. EPA
Emission Factor Used in
E-FAST
(critical release) Frequency U.S. EPA Basis
Spills during raw
material transfer
0.01%
(Water)
0 or 2 days/year RM-2 SCCP Assessment
(1992)
Equipment cleaning
losses of liquids from
a blending tank or
mixing vessel
2.5% or 4%
(Water)
2 or 200 days/year EPA/OPPT Single Vessel
Residual Model or OECD
Emission Scenario Document
for Adhesives
Cleaning liquid
residuals from drums
used to transport raw
material
2.% or 6%
(Water)
1 or 200 days year EPA/OPPT Drum Residual
Model
Discharge of off-
specification material
100% (Water)a 0 or 4 days/year OECD Emission Scenario
Document for Adhesives a100% of daily use on days with off-specification material.
7
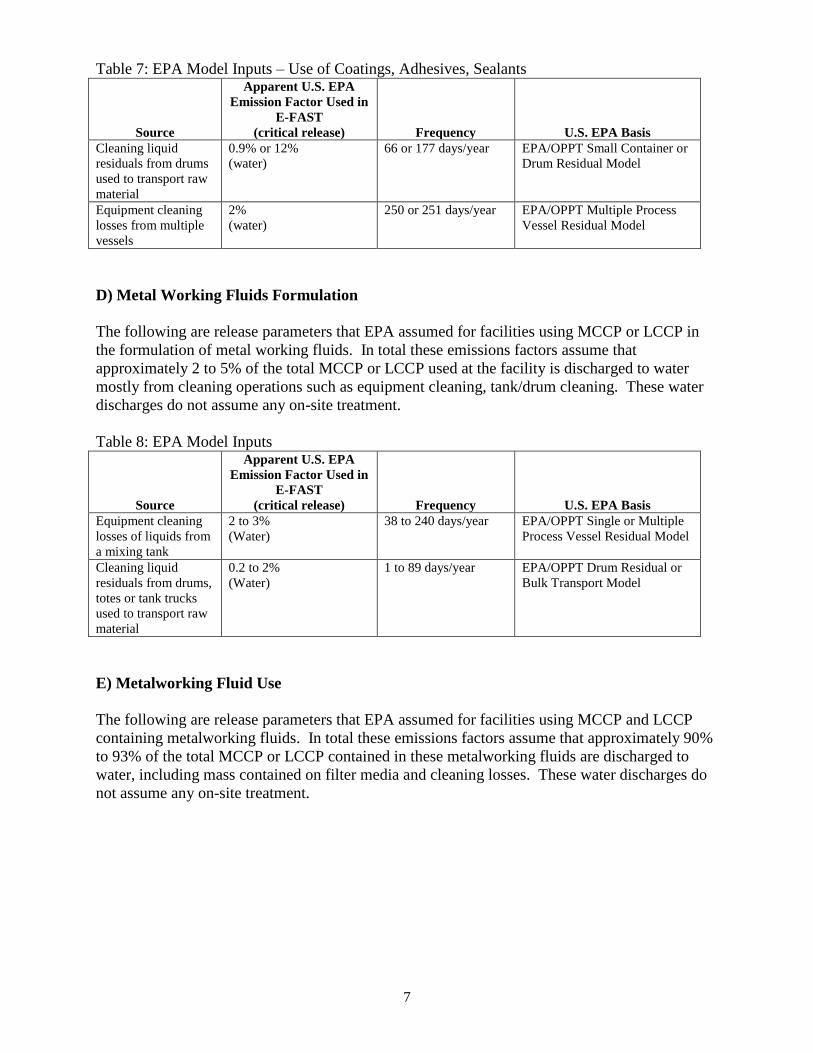
Table 7: EPA Model Inputs – Use of Coatings, Adhesives, Sealants
Source
Apparent U.S. EPA
Emission Factor Used in
E-FAST
(critical release) Frequency U.S. EPA Basis
Cleaning liquid
residuals from drums
used to transport raw
material
0.9% or 12%
(water)
66 or 177 days/year EPA/OPPT Small Container or
Drum Residual Model
Equipment cleaning
losses from multiple
vessels
2%
(water)
250 or 251 days/year EPA/OPPT Multiple Process
Vessel Residual Model
D) Metal Working Fluids Formulation
The following are release parameters that EPA assumed for facilities using MCCP or LCCP in
the formulation of metal working fluids. In total these emissions factors assume that
approximately 2 to 5% of the total MCCP or LCCP used at the facility is discharged to water
mostly from cleaning operations such as equipment cleaning, tank/drum cleaning. These water
discharges do not assume any on-site treatment.
Table 8: EPA Model Inputs
Source
Apparent U.S. EPA
Emission Factor Used in
E-FAST
(critical release) Frequency U.S. EPA Basis
Equipment cleaning
losses of liquids from
a mixing tank
2 to 3%
(Water)
38 to 240 days/year EPA/OPPT Single or Multiple
Process Vessel Residual Model
Cleaning liquid
residuals from drums,
totes or tank trucks
used to transport raw
material
0.2 to 2%
(Water)
1 to 89 days/year EPA/OPPT Drum Residual or
Bulk Transport Model
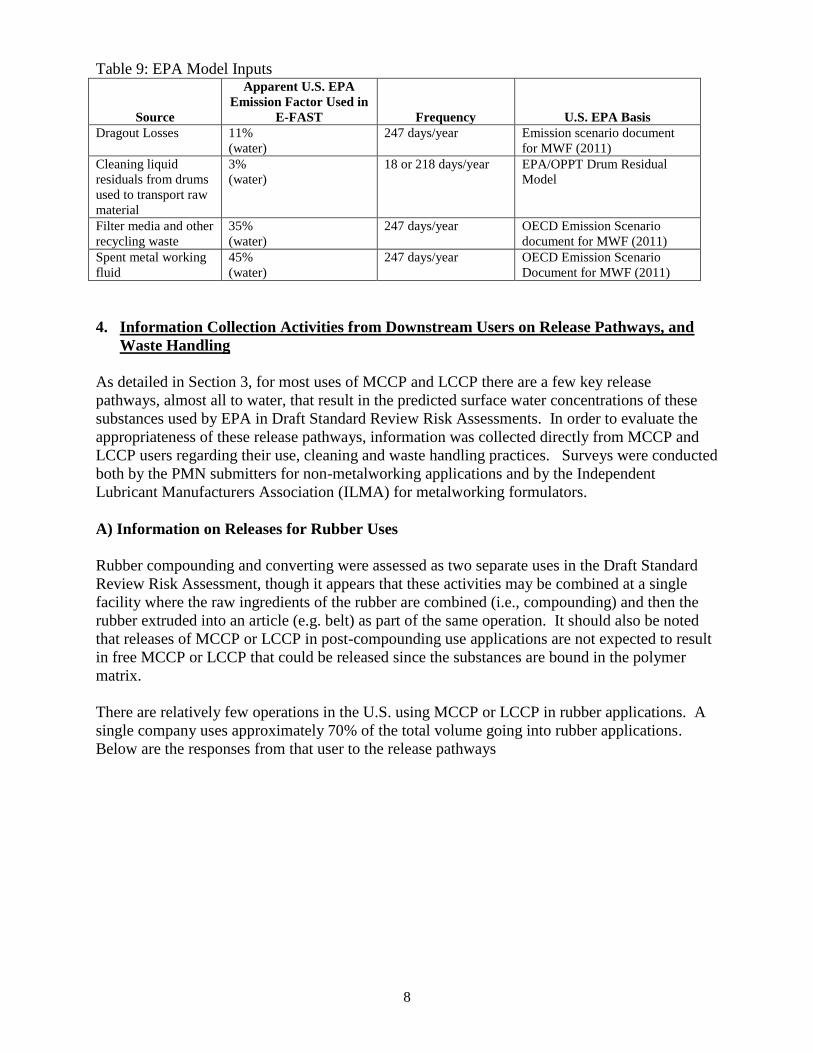
E) Metalworking Fluid Use
The following are release parameters that EPA assumed for facilities using MCCP and LCCP
containing metalworking fluids. In total these emissions factors assume that approximately 90%
to 93% of the total MCCP or LCCP contained in these metalworking fluids are discharged to
water, including mass contained on filter media and cleaning losses. These water discharges do
not assume any on-site treatment.
8
Table 9: EPA Model Inputs
Source
Apparent U.S. EPA
Emission Factor Used in
E-FAST Frequency U.S. EPA Basis
Dragout Losses 11%
(water)
247 days/year Emission scenario document
for MWF (2011)
Cleaning liquid
residuals from drums
used to transport raw
material
3%
(water)
18 or 218 days/year EPA/OPPT Drum Residual
Model
Filter media and other
recycling waste
35%
(water)
247 days/year OECD Emission Scenario
document for MWF (2011)
Spent metal working
fluid
45%
(water)
247 days/year OECD Emission Scenario
Document for MWF (2011)
4. Information Collection Activities from Downstream Users on Release Pathways, and
Waste Handling
As detailed in Section 3, for most uses of MCCP and LCCP there are a few key release
pathways, almost all to water, that result in the predicted surface water concentrations of these
substances used by EPA in Draft Standard Review Risk Assessments. In order to evaluate the
appropriateness of these release pathways, information was collected directly from MCCP and
LCCP users regarding their use, cleaning and waste handling practices. Surveys were conducted
both by the PMN submitters for non-metalworking applications and by the Independent
Lubricant Manufacturers Association (ILMA) for metalworking formulators.
A) Information on Releases for Rubber Uses
Rubber compounding and converting were assessed as two separate uses in the Draft Standard
Review Risk Assessment, though it appears that these activities may be combined at a single
facility where the raw ingredients of the rubber are combined (i.e., compounding) and then the
rubber extruded into an article (e.g. belt) as part of the same operation. It should also be noted
that releases of MCCP or LCCP in post-compounding use applications are not expected to result
in free MCCP or LCCP that could be released since the substances are bound in the polymer
matrix.
There are relatively few operations in the U.S. using MCCP or LCCP in rubber applications. A
single company uses approximately 70% of the total volume going into rubber applications.
Below are the responses from that user to the release pathways

9
Table 10: Survey of Rubber Compounding and Converting User
Source
Critical
Release
Media
Assumed by
EPA User 1 Response Release Pathway Results
Fugitive emissions Air to Water 1 of 2 U.S. plants has
thermal oxidizer.
Minor pathway not a significant source
of release.
Cleaning liquid residuals
from drums used to
transport raw material
Water No delivery via drums.
Totes are not cleaned
on site.
Pathway not relevant to actual user.
Could be eliminated/restricted for
future evaluation/regulation.
Cleaning liquid residuals
from rail cars
Water No delivery via rail
cars. Trucks are
dedicated and not
cleaned onsite.
Pathway not relevant to actual user.
Could be eliminated/restricted for
future evaluation/regulation.
Equipment cleaning
losses from multiple
vessels
Water Process equipment are
not cleaned with
water.
Pathway not relevant to actual user.
Could be eliminated/restricted for
future evaluation/regulation.
Spillage during raw
material handing
Water No discharge to water.
Spills are sent for
waste treatment.
Pathway not relevant to actual user.
Could be eliminated/restricted for
future evaluation/regulation.
Cleaning powders
residuals from containers
used to transport raw
material
Water Activity does not
occur.
Pathway not relevant to actual user.
Could be eliminated/restricted for
future evaluation/regulation.
Scrap material Water Wastes not sent to
water.
Pathway not relevant to actual user.
Could be eliminated/restricted for
future evaluation/regulation.
B) Information on Releases for PVC and Plastic Uses
PVC or plastic compounding and converting were assessed as two separate uses in the Draft
Standard Review Risk Assessment, though it appears that these activities may be combined at a
single facility where both the raw ingredients of the PVC/plastic are combined (i.e.,
compounding) and then the compounded polymer extruded into an article (e.g. flooring) as part
of the same operation. It should also be noted that releases of MCCP or LCCP in post-
compounding use applications are not expected to result in free MCCP or LCCP that could be
released as the substances are bound in the polymer matrix.
There are relatively few operations in the U.S. using MCCP or LCCP in PVC and plastic
applications. The three companies that have responded to the survey, to date, represent the
majority, approximately 80%, of MCCP and LCCP used in PVC, plastic and polymer
applications. Their collective responses to the pathways identified by EPA are presented in the
table below.
10
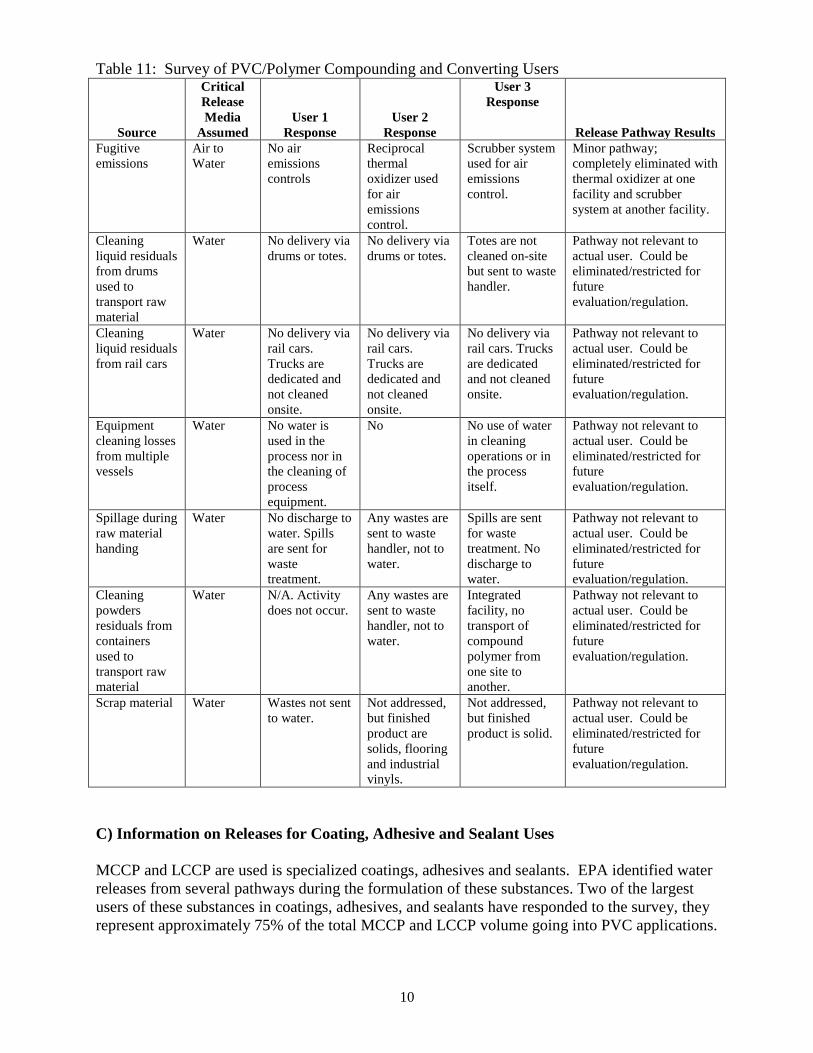
Table 11: Survey of PVC/Polymer Compounding and Converting Users
Source
Critical
Release
Media
Assumed
User 1
Response
User 2
Response
User 3
Response
Release Pathway Results
Fugitive
emissions
Air to
Water
No air
emissions
controls
Reciprocal
thermal
oxidizer used
for air
emissions
control.
Scrubber system
used for air
emissions
control.
Minor pathway;
completely eliminated with
thermal oxidizer at one
facility and scrubber
system at another facility.
Cleaning
liquid residuals
from drums
used to
transport raw
material
Water No delivery via
drums or totes.
No delivery via
drums or totes.
Totes are not
cleaned on-site
but sent to waste
handler.
Pathway not relevant to
actual user. Could be
eliminated/restricted for
future
evaluation/regulation.
Cleaning
liquid residuals
from rail cars
Water No delivery via
rail cars.
Trucks are
dedicated and
not cleaned
onsite.
No delivery via
rail cars.
Trucks are
dedicated and
not cleaned
onsite.
No delivery via
rail cars. Trucks
are dedicated
and not cleaned
onsite.
Pathway not relevant to
actual user. Could be
eliminated/restricted for
future
evaluation/regulation.
Equipment
cleaning losses
from multiple
vessels
Water No water is
used in the
process nor in
the cleaning of
process
equipment.
No No use of water
in cleaning
operations or in
the process
itself.
Pathway not relevant to
actual user. Could be
eliminated/restricted for
future
evaluation/regulation.
Spillage during
raw material
handing
Water No discharge to
water. Spills
are sent for
waste
treatment.
Any wastes are
sent to waste
handler, not to
water.
Spills are sent
for waste
treatment. No
discharge to
water.
Pathway not relevant to
actual user. Could be
eliminated/restricted for
future
evaluation/regulation.
Cleaning
powders
residuals from
containers
used to
transport raw
material
Water N/A. Activity
does not occur.
Any wastes are
sent to waste
handler, not to
water.
Integrated
facility, no
transport of
compound
polymer from
one site to
another.
Pathway not relevant to
actual user. Could be
eliminated/restricted for
future
evaluation/regulation.
Scrap material Water Wastes not sent
to water.
Not addressed,
but finished
product are
solids, flooring
and industrial
vinyls.
Not addressed,
but finished
product is solid.
Pathway not relevant to
actual user. Could be
eliminated/restricted for
future
evaluation/regulation.
C) Information on Releases for Coating, Adhesive and Sealant Uses
MCCP and LCCP are used is specialized coatings, adhesives and sealants. EPA identified water
releases from several pathways during the formulation of these substances. Two of the largest
users of these substances in coatings, adhesives, and sealants have responded to the survey, they
represent approximately 75% of the total MCCP and LCCP volume going into PVC applications.
11
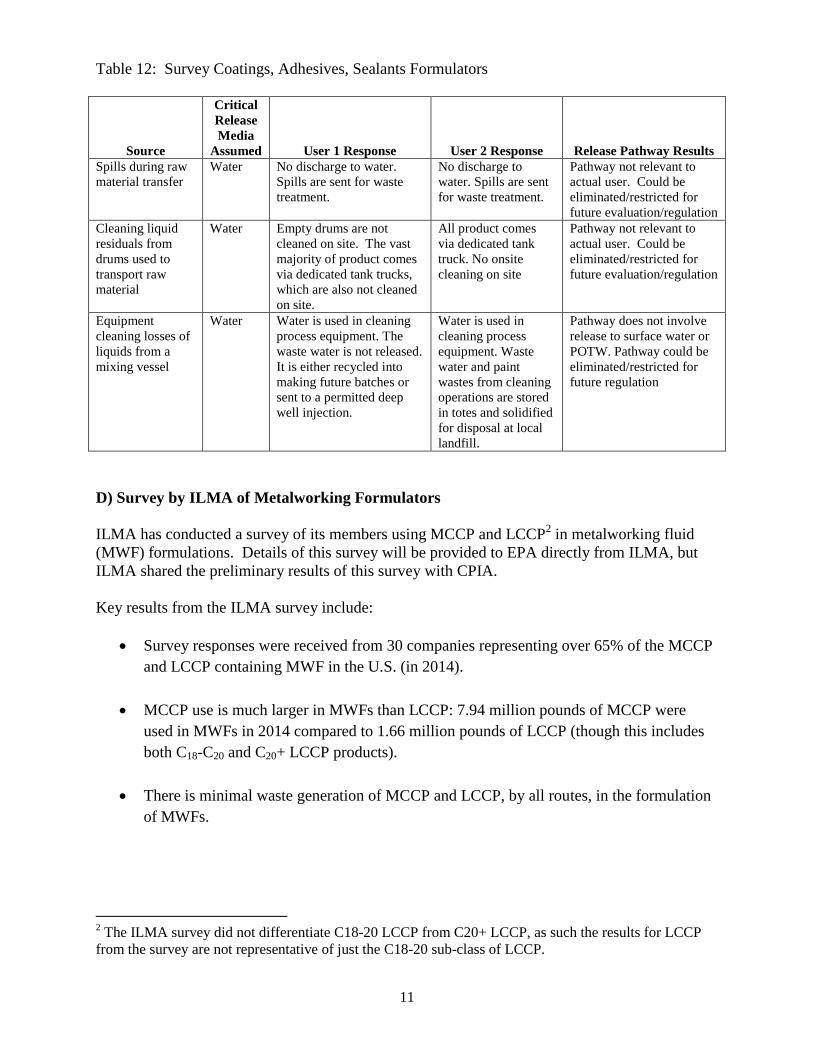
Table 12: Survey Coatings, Adhesives, Sealants Formulators
Source
Critical
Release
Media
Assumed User 1 Response User 2 Response Release Pathway Results
Spills during raw
material transfer
Water No discharge to water.
Spills are sent for waste
treatment.
No discharge to
water. Spills are sent
for waste treatment.
Pathway not relevant to
actual user. Could be
eliminated/restricted for
future evaluation/regulation
Cleaning liquid
residuals from
drums used to
transport raw
material
Water Empty drums are not
cleaned on site. The vast
majority of product comes
via dedicated tank trucks,
which are also not cleaned
on site.
All product comes
via dedicated tank
truck. No onsite
cleaning on site
Pathway not relevant to
actual user. Could be
eliminated/restricted for
future evaluation/regulation
Equipment
cleaning losses of
liquids from a
mixing vessel
Water
Water is used in cleaning
process equipment. The
waste water is not released.
It is either recycled into
making future batches or
sent to a permitted deep
well injection.
Water is used in
cleaning process
equipment. Waste
water and paint
wastes from cleaning
operations are stored
in totes and solidified
for disposal at local
landfill.
Pathway does not involve
release to surface water or
POTW. Pathway could be
eliminated/restricted for
future regulation
D) Survey by ILMA of Metalworking Formulators
ILMA has conducted a survey of its members using MCCP and LCCP2 in metalworking fluid
(MWF) formulations. Details of this survey will be provided to EPA directly from ILMA, but
ILMA shared the preliminary results of this survey with CPIA.
Key results from the ILMA survey include:
Survey responses were received from 30 companies representing over 65% of the MCCP
and LCCP containing MWF in the U.S. (in 2014).
MCCP use is much larger in MWFs than LCCP: 7.94 million pounds of MCCP were
used in MWFs in 2014 compared to 1.66 million pounds of LCCP (though this includes
both C18-C20 and C20+ LCCP products).
There is minimal waste generation of MCCP and LCCP, by all routes, in the formulation
of MWFs.
2 The ILMA survey did not differentiate C18-20 LCCP from C20+ LCCP, as such the results for LCCP
from the survey are not representative of just the C18-20 sub-class of LCCP.
12
Those companies that receive shipments of MCCP and LCCP in drums send the empty
drums to a waste handler or recycler. None of the survey respondents cleaned their
drums with water and released the waste water.
Out of the more than 9.6 million pounds of MCCP and LCCP used in MWF formulations
in 2014, the total water release to POTWs was 750 pounds; these releases were from just
two companies.
Most operations, 28 out of the 30, have no (zero) release to water.
E) Information on Releases from MWF Users
Additional information on the waste generation and handling practices of MWF users is being
sought. As CPIA previously indicated in its April 27, 2015 regulatory review, all of these
facilities are subject to waste regulations and water discharge restrictions. Recent informal
communications with several large metalworking operations indicate that these facilities
generally do not discharge waste oils/fluids to surface water or to POTW but rather use regulated
hazardous waste handlers to dispose of these wastes. Confirming information is being sought on
these practices.
One important information gap on the use MCCP and LCCP in MWFs is how much of the
MCCP and LCCP are consumed (i.e. de-chlorinated) by the metalworking process. Based on the
chemistry of the process, it appears likely that some portion of the MCCP and LCCP no longer
remain at the stage of spent fluid removal.
5. Release Modifications/Pathway Elimination
Considering the responses from MCCP and LCCP users regarding their waste generation and
handling practices, CPIA believes that there is sufficient basis to revise the release pathways
identified by EPA (summarized in Section 3).
EPA should be able to eliminate the various release pathways to water for rubber, PVC, plastic
applications (both compounding and converting) and also the formulation of coatings, adhesives
and sealants. With a majority of the total volume of MCCP and LCCP used in these applications
having been covered in recent survey questionnaires, there is no indication of water releases
from these users. With the elimination of these release pathways to water, CPIA believes that
EPA’s initial concerns regarding unreasonable risk to the environment from the release of MCCP
and LCCP to water should be eliminated for these applications. Further, as these facilities are
already avoiding releases to water, it should be feasible for EPA to craft use restrictions to ensure
this practice continues. See Section 7 below for additional discussion on this point. It should
also be noted that these U.S. rubber, PVC, and plastic manufacturing operations, who appear to
be operating in an environmentally responsible manner, compete directly with foreign
manufactured rubber, PVC and plastic goods which will not be held to the same requirements
regarding the use of MCCP and LCCP in their manufacturing operations and finished products.
13
In regards to metalworking formulation and use, it appears that the water releases assumed by
EPA for these applications are likely much, much lower than originally estimated. Additional
follow-up research and coordination with that industry should help eliminate any remaining
discharges or release pathways that might results in excess levels of MCCP and LCCP in the
environment.
An enhanced review of the environmental monitoring data in the next section appears to support
the conclusion that releases of MCCP to the environment are low. These monitoring results
show levels of MCCP in the aquatic environment are largely below the CoCs. Further, these
monitoring data capture both current releases and any background levels of the substance
demonstrating that even after decades of use levels in the environment remain low.
6. Evaluation of MCCP and LCCP Environmental Monitoring Data
The EPA Draft Standard Review Risk Assessments summarized available literature on measured
MCCP and LCCP concentrations between 1980 and 2013. This review considered research
where the CP congeners were identified both from the United States and internationally. The
EPA draft risk assessments identified three selection criteria, including:
defined chain length;
use of “modern analytical techniques”; and
“at a minimum, general information on sampling location.”
The EPA concluded that the data “provide some evidence that MCCPs and LCCPs are released
into the environment” at discrete locations and times. The risk assessments for MCCPs and
LCCPs concluded that measured concentrations reported in the literature may indicate a risk of
acute or chronic injury to aquatic organisms, and a risk of chronic injury to sediment-dwelling
organisms. The EPA concentration of concern (COC) for surface water is 1 g/L (acute and
chronic). The acute sediment COC is 374 mg/kg d.w. and the chronic sediment COC is 18.7
mg/kg d.w.
As described below, a review of the complete set of data considered by the EPA does not
indicate any systematic exceedance of the COCs in the environment. Furthermore, a comparison
of the measured surface water data to the results of EPA modeling demonstrate opportunities for
refinement of the EPA modeling inputs to better reflect environmentally plausible surface water
concentrations. It is important to note that much of the data were collected outside North
America, where historical discharge and pre-treatment standards may be less comprehensive than
in the United States. Some of the data reflect impacts not representative of current exposure
scenarios in the United States, such as a CP manufacturing facility surface impoundment lagoon,
and surface water ponds impacted by uncontrolled electronic waste recovery operations. As
explained below, the available analysis methods are subject to interferences which may result in
a positive bias (i.e. overestimate) of actual MCCP and LCCP concentrations. The weight of the
evidence indicates that the MCCP load in the environment can be well managed by eliminating
discharge pathways to water, which is reflective of current practices in the United States.
14
General Limitations of the Measured Data
The EPA draft reports noted that it is unknown whether the data summarized is representative of
the overall distribution of MCCP and LCCP in the environment. EPA also acknowledged that
quantification of MCCP and LCCP by “modern techniques” can be positively biased by
“detection of low chlorination congeners in samples.” The EPA summary also notes that a
round-robin study of SCCPs has shown appreciable inter-laboratory variation, and that poor
selection of calibration standards may cause errors of up to an order of magnitude. The EPA
specifically discussed electron capture negative ion mass spectroscopy (ECNI-MS) as an
example of a method capable of detecting specific congeners, but where difficulties with data
reliability still persist. Literature reviews of ECNI-MS generally indicate that use of low
resolution mass spectroscopy (LRMS) “increases the risk of interferences, which have to be
controlled or eliminated” (Kassim and Barcelo, 2009). The use of high resolution mass
spectroscopy (HRMS) may address some of these interferences by offering a more selective
detection method, but is typically not used for routine analyses.
Surface Water
EPA identified nine references with at least one reported MCCP surface water concentration. A
total of 15 concentrations (some of which represent mean or maximum values) were converted to
uniform units by EPA and presented in Appendix D of the reports.
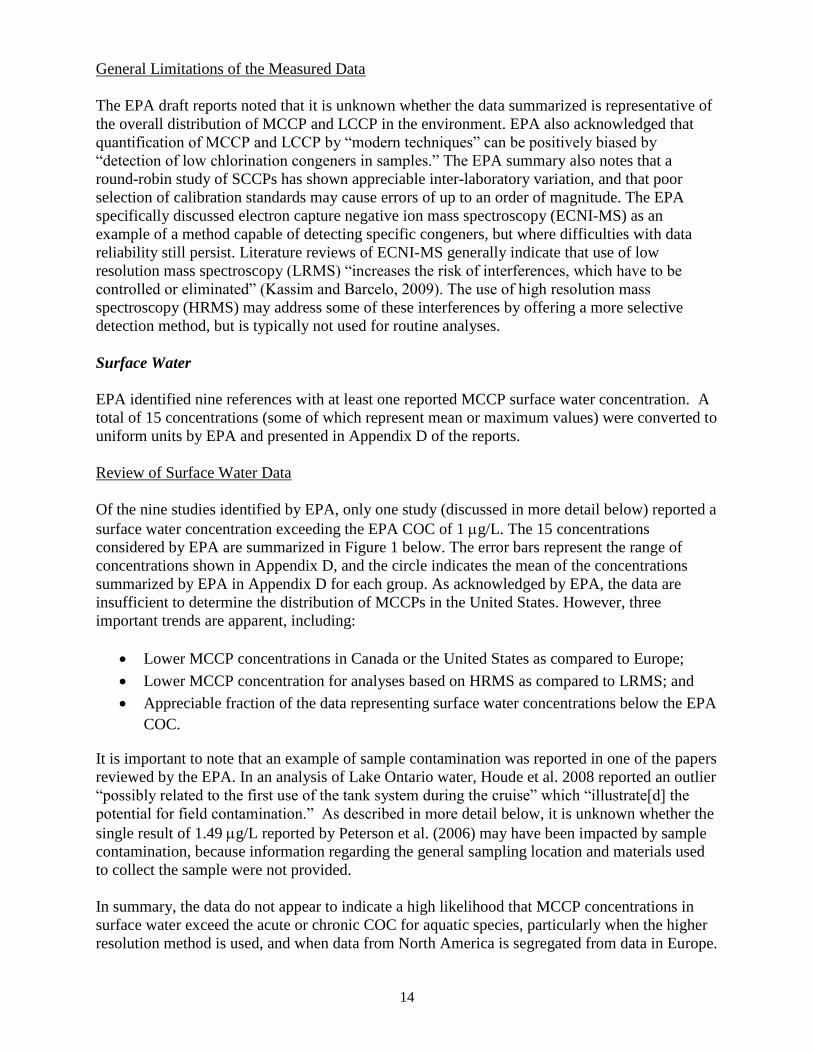
Review of Surface Water Data
Of the nine studies identified by EPA, only one study (discussed in more detail below) reported a
surface water concentration exceeding the EPA COC of 1 g/L. The 15 concentrations
considered by EPA are summarized in Figure 1 below. The error bars represent the range of
concentrations shown in Appendix D, and the circle indicates the mean of the concentrations
summarized by EPA in Appendix D for each group. As acknowledged by EPA, the data are
insufficient to determine the distribution of MCCPs in the United States. However, three
important trends are apparent, including:
Lower MCCP concentrations in Canada or the United States as compared to Europe;
Lower MCCP concentration for analyses based on HRMS as compared to LRMS; and
Appreciable fraction of the data representing surface water concentrations below the EPA
COC.
It is important to note that an example of sample contamination was reported in one of the papers
reviewed by the EPA. In an analysis of Lake Ontario water, Houde et al. 2008 reported an outlier
“possibly related to the first use of the tank system during the cruise” which “illustrate[d] the
potential for field contamination.” As described in more detail below, it is unknown whether the
single result of 1.49 g/L reported by Peterson et al. (2006) may have been impacted by sample
contamination, because information regarding the general sampling location and materials used
to collect the sample were not provided.
In summary, the data do not appear to indicate a high likelihood that MCCP concentrations in
surface water exceed the acute or chronic COC for aquatic species, particularly when the higher
resolution method is used, and when data from North America is segregated from data in Europe.
15
The HRMS data suggest that the MCCP concentration may be as much as 5 to 6 orders of
magnitude less the EPA COC for surface water.
Figure 1: Summary of Surface Water Data Considered by EPA by Region and Analytical
Method
Limitations of Key Study Identified by EPA
In the risk characterizations, EPA choose to focus on the maximum surface water concentration
from Petersen et al. (2006) collected in Norway from an undisclosed location of 1.49 g/L. The
draft risk assessments note that for surface water, “…EPA based the aquatic risk findings for
MCCPs and LCCPs on the highest concentration reported by Peterson et al. (2006).” This study
was the only one reviewed by EPA to report a surface water concentration exceeding the COC of
1 g/L. This study has several limitations, which call into question whether it should have been
considered in the EPA assessment. Most importantly, a general location of the sample (other than
the country of origin) was not reported. Therefore, this study did not meet one of the three
selection criteria identified by EPA, and the conditions and release scenario that this sample
result represents are unknown. Second, while this study did include steps to remove organo-
chlorine interferences like PCBS, quantification was by LRMS, which may have confounded the
analysis of SCCP and MCCPs in the sample. Third, there was a significant difference between
the two water sample results reported in the study, with one MCCP result of 1.49 g/L, and a
second MCCP result that appears to be less than 0.05 g/L based on the figure presented in the
paper. The authors do not offer an explanation for such a significant difference, and it is not
possible to rule out that there may have been sample contamination affecting the first sample. As
mentioned above, details were not provided regarding the sampling locations, sampling
0.0000001
0.000001
0.00001
0.0001
0.001
0.01
0.1
1
10
High ResolutionMass
Spectroscopy(Canada)
Low ResolutionMass
Spectroscopy(Canada, USA)
Low ResolutionMass
Spectroscopy(Europe)
Not Reported(Germany)
Surf
ace
Wat
er C
on
cen
trat
ion
(g/
L) U.S. EPA COC
* = Suspected interference from new tank (Houde et al. 2008).
16
equipment and sampling methods, which are essential attributes necessary for assessing the
likelihood of unintended sample contamination. Finally, this work was presented at the 2006
annual Dioxin Symposia in Oslo and, therefore, was subject to a more cursory peer review as
compared to a peer-reviewed publication. Taking into account the limitations of this study, as
well as the results of the remaining studies indicating surface water concentrations less than the
EPA COC, there appears to be a very low likelihood that environmental surface water
concentrations in the United States exceed the EPA COC.
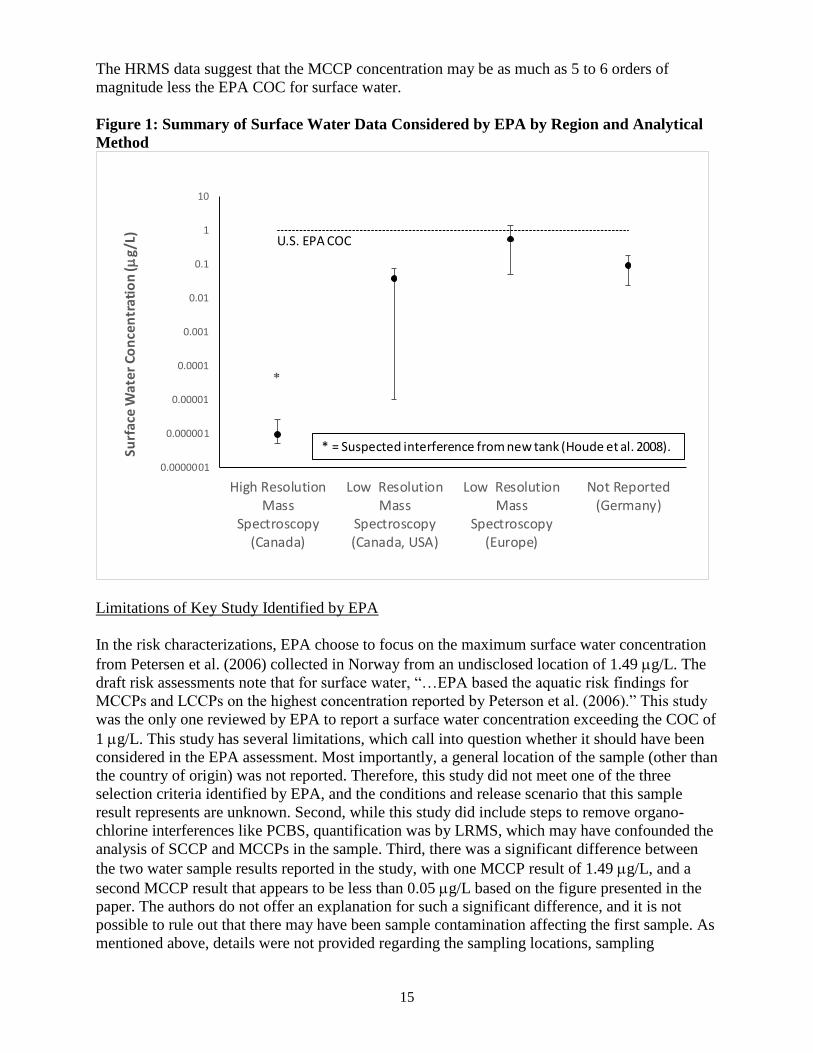
Comparison of Measured Concentrations to EPA Model Results
EPA indicated in its summary of the risk findings that the measured data “…were used as
supporting information to inform the relevant pathways for estimating potential releases from
relevant use categories…” A comparison of the EPA modeling results to measured surface water
concentrations indicates significant disagreement between the modeling results and the available
surface water data. Figures 2a, 2b and 2c compare the predicted EPA surface water
concentrations to measured data from North America for the metrics 7Q10 (10th
percentile),
harmonic mean (10th
percentile) and harmonic mean (50th
percentile). Irrespective of the surface
water concentration metric selected from the EPA modeling, the measured surface water
concentration data reviewed by EPA indicate that the modeled concentrations are not
environmental plausible. Furthermore, as noted in the EPA draft risk assessment reports, the
water solubility of MCCPs and LCCPs is very low, and less than 5 to 27 g/L. In contrast, the
EPA model results reflect maximum predicted surface water concentrations in some cases
exceeding 500 g/L (7Q10 – 10th
percentile).
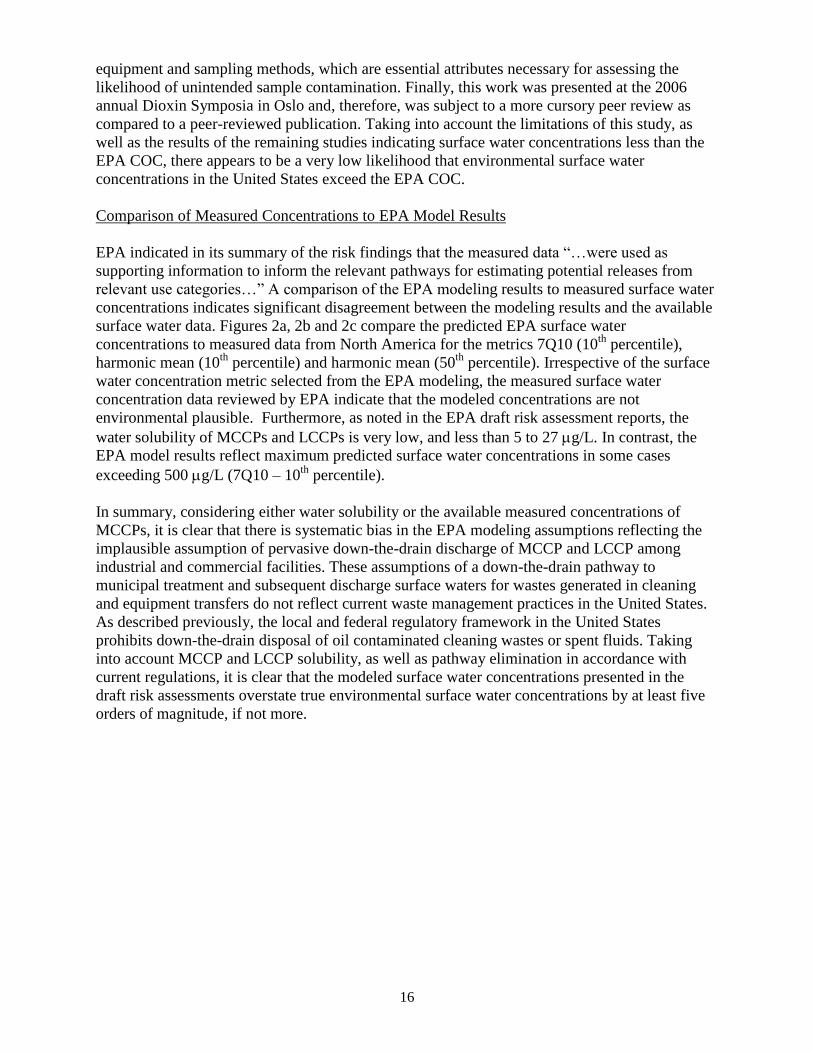
In summary, considering either water solubility or the available measured concentrations of
MCCPs, it is clear that there is systematic bias in the EPA modeling assumptions reflecting the
implausible assumption of pervasive down-the-drain discharge of MCCP and LCCP among
industrial and commercial facilities. These assumptions of a down-the-drain pathway to
municipal treatment and subsequent discharge surface waters for wastes generated in cleaning
and equipment transfers do not reflect current waste management practices in the United States.
As described previously, the local and federal regulatory framework in the United States
prohibits down-the-drain disposal of oil contaminated cleaning wastes or spent fluids. Taking
into account MCCP and LCCP solubility, as well as pathway elimination in accordance with
current regulations, it is clear that the modeled surface water concentrations presented in the
draft risk assessments overstate true environmental surface water concentrations by at least five
orders of magnitude, if not more.
17
Figure 2a: Comparison of Model Result to Measure Data (7Q10 – 10th
Percentile)
Figure 2b: Comparison of Model Result to Measure Data (Harmonic Mean – 10th
Percentile)
0.0000001
0.000001
0.00001
0.0001
0.001
0.01
0.1
1
10
100
1000
10000
RubberCompounding
RubberConverting
PlasticCompounding
PlasticConverting
MWFFormulation
MWF Use
Surf
ace
Wa
ter
Co
nce
ntr
ati
on
(g/
L)
Maximum measured surface water concentration (Canada) - HRMS*
*excludes sample with interference from new tank.
Maximum measured surface water concentration (USA and Canada) - LRMS
Legend
U.S.. EPA Model Results7Q10 - 10th Percentile
0.0000001
0.000001
0.00001
0.0001
0.001
0.01
0.1
1
10
100
1000
10000
RubberCompounding
RubberConverting
PlasticCompounding
PlasticConverting
MWFFormulation
MWF Use
Surf
ace
Wa
ter
Co
nce
ntr
ati
on
(g/
L)
Maximum measured surface water concentration (Canada) - HRMS*
*excludes sample with interference from new tank.
Maximum measured surface water concentration (USA and Canada) - LRMS
Legend
U.S.. EPA Model ResultsHarmonic Mean - 10th Percentile
18
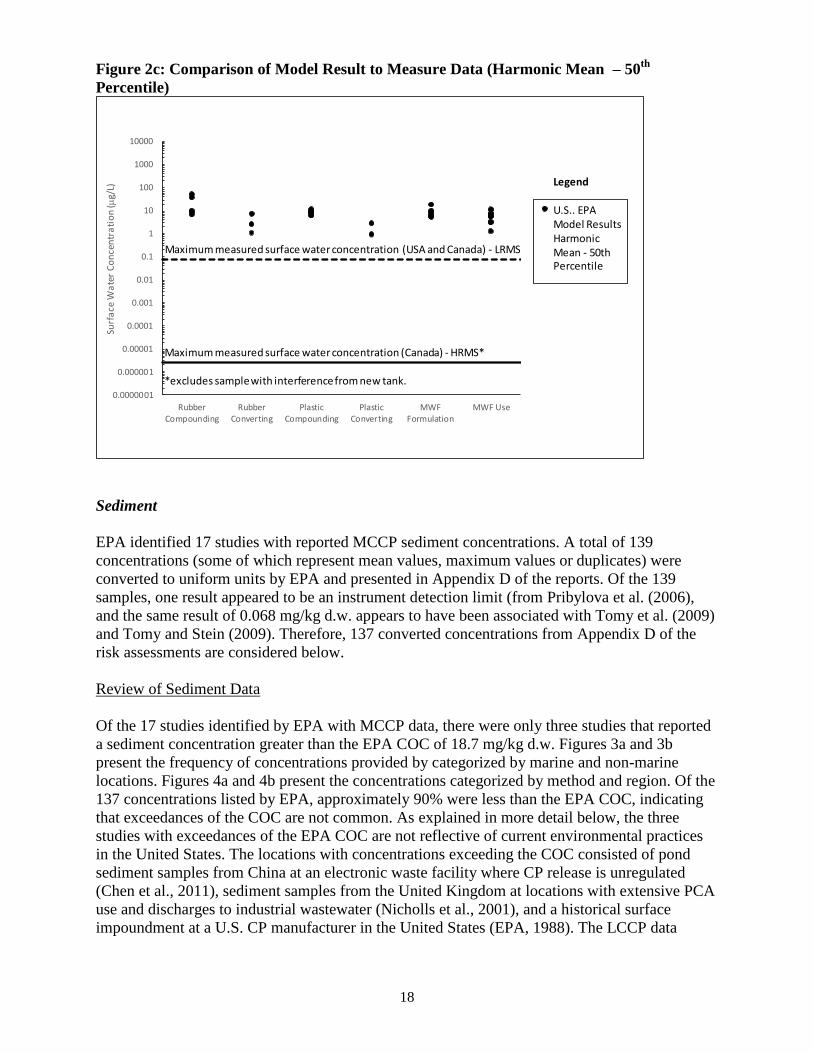
Figure 2c: Comparison of Model Result to Measure Data (Harmonic Mean – 50th
Percentile)
Sediment
EPA identified 17 studies with reported MCCP sediment concentrations. A total of 139
concentrations (some of which represent mean values, maximum values or duplicates) were
converted to uniform units by EPA and presented in Appendix D of the reports. Of the 139
samples, one result appeared to be an instrument detection limit (from Pribylova et al. (2006),
and the same result of 0.068 mg/kg d.w. appears to have been associated with Tomy et al. (2009)
and Tomy and Stein (2009). Therefore, 137 converted concentrations from Appendix D of the
risk assessments are considered below.
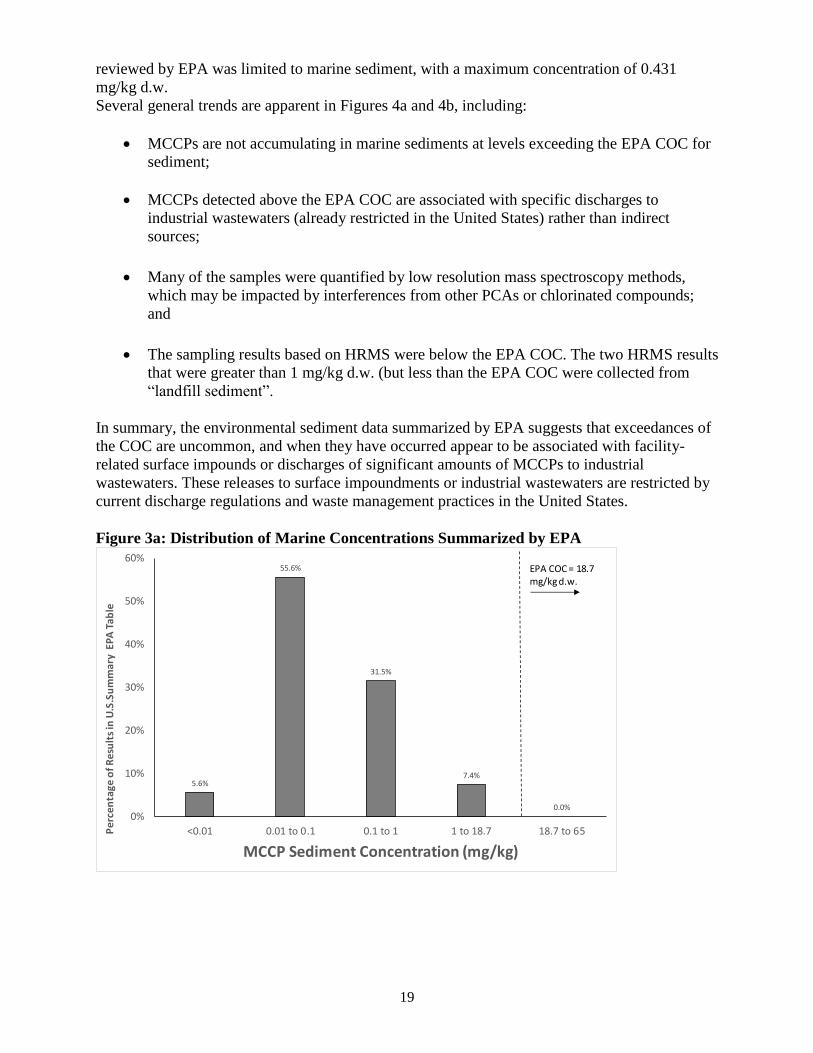
Review of Sediment Data
Of the 17 studies identified by EPA with MCCP data, there were only three studies that reported
a sediment concentration greater than the EPA COC of 18.7 mg/kg d.w. Figures 3a and 3b
present the frequency of concentrations provided by categorized by marine and non-marine
locations. Figures 4a and 4b present the concentrations categorized by method and region. Of the
137 concentrations listed by EPA, approximately 90% were less than the EPA COC, indicating
that exceedances of the COC are not common. As explained in more detail below, the three
studies with exceedances of the EPA COC are not reflective of current environmental practices
in the United States. The locations with concentrations exceeding the COC consisted of pond
sediment samples from China at an electronic waste facility where CP release is unregulated
(Chen et al., 2011), sediment samples from the United Kingdom at locations with extensive PCA
use and discharges to industrial wastewater (Nicholls et al., 2001), and a historical surface
impoundment at a U.S. CP manufacturer in the United States (EPA, 1988). The LCCP data
0.0000001
0.000001
0.00001
0.0001
0.001
0.01
0.1
1
10
100
1000
10000
RubberCompounding
RubberConverting
PlasticCompounding
PlasticConverting
MWFFormulation
MWF Use
Surf
ace
Wa
ter
Co
nce
ntr
ati
on
(g/
L)
Maximum measured surface water concentration (Canada) - HRMS*
*excludes sample with interference from new tank.
Maximum measured surface water concentration (USA and Canada) - LRMS
Legend
U.S.. EPA Model ResultsHarmonic Mean - 50th Percentile
19
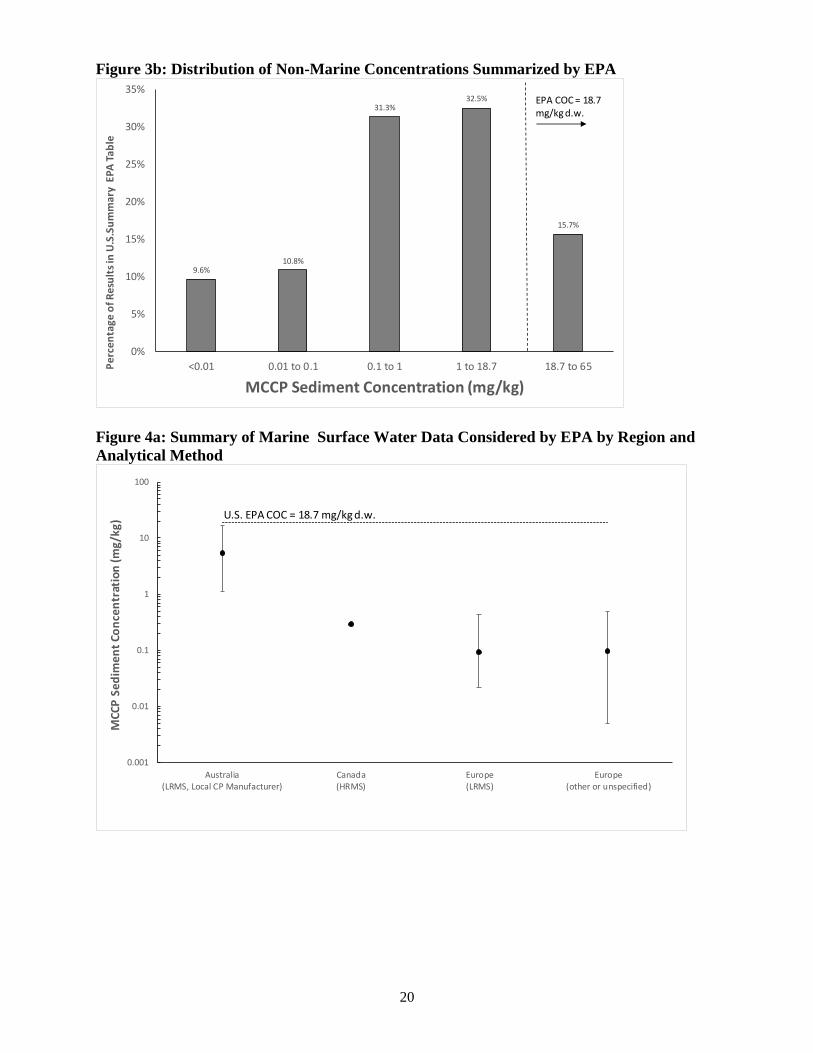
reviewed by EPA was limited to marine sediment, with a maximum concentration of 0.431
mg/kg d.w.
Several general trends are apparent in Figures 4a and 4b, including:
MCCPs are not accumulating in marine sediments at levels exceeding the EPA COC for
sediment;
MCCPs detected above the EPA COC are associated with specific discharges to
industrial wastewaters (already restricted in the United States) rather than indirect
sources;
Many of the samples were quantified by low resolution mass spectroscopy methods,
which may be impacted by interferences from other PCAs or chlorinated compounds;
and
The sampling results based on HRMS were below the EPA COC. The two HRMS results
that were greater than 1 mg/kg d.w. (but less than the EPA COC were collected from
“landfill sediment”.
In summary, the environmental sediment data summarized by EPA suggests that exceedances of
the COC are uncommon, and when they have occurred appear to be associated with facility-
related surface impounds or discharges of significant amounts of MCCPs to industrial
wastewaters. These releases to surface impoundments or industrial wastewaters are restricted by
current discharge regulations and waste management practices in the United States.
Figure 3a: Distribution of Marine Concentrations Summarized by EPA
5.6%
55.6%
31.5%
7.4%
0.0%0%
10%
20%
30%
40%
50%
60%
<0.01 0.01 to 0.1 0.1 to 1 1 to 18.7 18.7 to 65Pe
rce
nta
ge o
f R
esu
lts
in U
.S.S
um
mar
y E
PA
Tab
le
MCCP Sediment Concentration (mg/kg)
EPA COC = 18.7 mg/kg d.w.
20
Figure 3b: Distribution of Non-Marine Concentrations Summarized by EPA
Figure 4a: Summary of Marine Surface Water Data Considered by EPA by Region and
Analytical Method
9.6%10.8%
31.3%32.5%
15.7%
0%
5%
10%
15%
20%
25%
30%
35%
<0.01 0.01 to 0.1 0.1 to 1 1 to 18.7 18.7 to 65Pe
rce
nta
ge
of
Re
sult
s in
U.S
.Su
mm
ary
EP
A T
ab
le
MCCP Sediment Concentration (mg/kg)
EPA COC = 18.7 mg/kg d.w.
0.001
0.01
0.1
1
10
100
Australia(LRMS, Local CP Manufacturer)
Canada(HRMS)
Europe(LRMS)
Europe(other or unspecified)
MC
CP
Se
dim
en
t C
on
cen
trat
ion
(mg
/kg
) U.S. EPA COC = 18.7 mg/kg d.w.
21
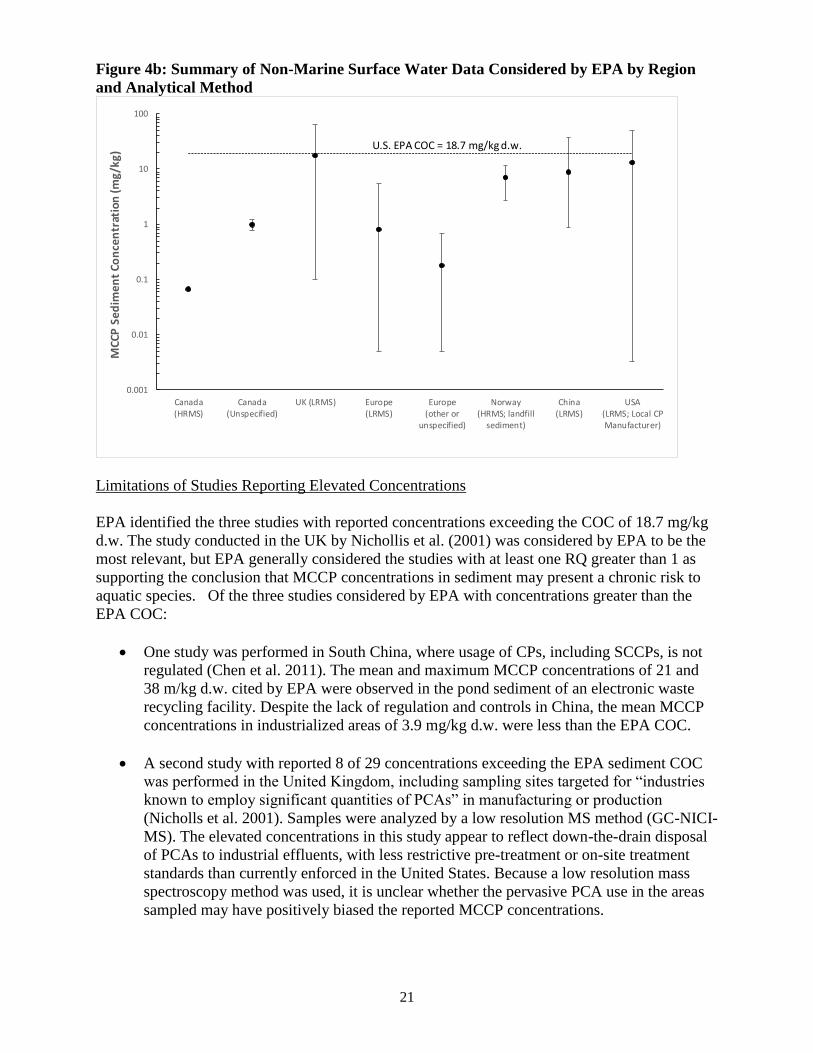
Figure 4b: Summary of Non-Marine Surface Water Data Considered by EPA by Region
and Analytical Method
Limitations of Studies Reporting Elevated Concentrations
EPA identified the three studies with reported concentrations exceeding the COC of 18.7 mg/kg
d.w. The study conducted in the UK by Nichollis et al. (2001) was considered by EPA to be the
most relevant, but EPA generally considered the studies with at least one RQ greater than 1 as
supporting the conclusion that MCCP concentrations in sediment may present a chronic risk to
aquatic species. Of the three studies considered by EPA with concentrations greater than the
EPA COC:
One study was performed in South China, where usage of CPs, including SCCPs, is not
regulated (Chen et al. 2011). The mean and maximum MCCP concentrations of 21 and
38 m/kg d.w. cited by EPA were observed in the pond sediment of an electronic waste
recycling facility. Despite the lack of regulation and controls in China, the mean MCCP
concentrations in industrialized areas of 3.9 mg/kg d.w. were less than the EPA COC.
A second study with reported 8 of 29 concentrations exceeding the EPA sediment COC
was performed in the United Kingdom, including sampling sites targeted for “industries
known to employ significant quantities of PCAs” in manufacturing or production
(Nicholls et al. 2001). Samples were analyzed by a low resolution MS method (GC-NICI-
MS). The elevated concentrations in this study appear to reflect down-the-drain disposal
of PCAs to industrial effluents, with less restrictive pre-treatment or on-site treatment
standards than currently enforced in the United States. Because a low resolution mass
spectroscopy method was used, it is unclear whether the pervasive PCA use in the areas
sampled may have positively biased the reported MCCP concentrations.
0.001
0.01
0.1
1
10
100
Canada(HRMS)
Canada(Unspecified)
UK (LRMS) Europe(LRMS)
Europe(other or
unspecified)
Norway(HRMS; landfill
sediment)
China(LRMS)
USA(LRMS; Local CPManufacturer)
MC
CP
Se
dim
en
t C
on
cen
trat
ion
(mg
/kg
) U.S. EPA COC = 18.7 mg/kg d.w.
22
The third and final study with concentrations exceeding the EPA COC (EPA, 1998) was
a field study completed in the United States near a chlorinated paraffin manufacturing
facility. Of the 8 sample results summarized by EPA, only three results exceeded the
COC. These three samples were not representative of environmental sediment, but rather
were collected from the surface impoundment lagoon located at the chlorinated paraffin
manufacturing facility.
Conclusion on Measured Data
Based on a review of the environmental measurements summarized by the EPA, the weight of
evidence does not suggest that exceedances of the EPA COC for surface water or sediment are
likely. While limited in geographical and temporal coverage, a conclusion of frequent or likely
exceedances of the EPA COCs does not appear to be supported by the available data.
Information regarding general sample location was not available for the sole surface water result
exceeding the EPA COC, though the study appears to have been conducted in Norway. With
regard to the sediment data, two of the studies characterized areas with obvious impacts,
including a historical surface impoundment at a CP manufacturing location in the United States,
and a pond at an electronic waste facility in China. Sediment data collected in the United
Kingdom appears to reflect significant discharge of PCA to industrial wastewater, a scenario
which is not applicable to the current regulatory framework in the United States. The available
data suggest that environmental concentrations of MCCPs and LCCPs may be effectively
managed by eliminating discharge pathways to water.
7. Conclusions and Reducing Uncertainties in Risk Assessments
In its Draft Standard Review Risk Assessments and subsequent letters3 to the PMN submitters,
EPA identified concerns with MCCP and LCCP, including the potential for release to water
during processing and use, estimated environmental concentrations above the CoCs, and
measured environmental concentrations above the CoCs. CPIA believes that this submission
establishes that for most uses of MCCP and LCCP there are not releases to water and that for
those use applications with releases to water, the total mass is very low and well controlled by
existing water discharge practices and regulations. Eliminating the release pathways to water
eliminates the estimated environmental concerns above the CoC. Additionally, a detailed review
of the monitoring data used by EPA does not a support a conclusion of high levels in the
environment. Data most relevant to the PMN assessments, based on location and higher
resolution analytical methods, in fact supports the conclusion that releases are low and resulting
concentrations in the environment are below EPA’s concentrations of concern.
Overall, the conclusions from this assessment are:
The physiochemical properties of MCCP and LCCP, such as very low ambient vapor
pressure, decomposition at elevated temperatures, and very low water solubility, limit the
ability to release significant quantities of these substances the environment, particularly
via the water or air.
3 January 21, 2015 letters from Greg Schweer to each MCCP and LCCP PMN submitter.
23
Information from users indicates that there are not the release pathways to water for
MCCP and LCCP that EPA assumed in it Draft Standard Review Risk Assessment.
Exceedances of EPA’s COC in environmental surface water or sediment are not expected
to occur.
Finally, that these data support that MCCP and LCCP can be effectively managed by
eliminating discharge pathways to water using existing U.S. industry practices and th
regulatory framework.
CPIA believes that there is sufficient information for EPA to reconsider its risk conclusions and
also to propose alternative actions to those presented in the Agency’s January 21, 2015, letters to
the PMN submitters. To the extent that EPA still has concerns about uncertainties in the risk
assessments for these substances, CPIA believes there are actions short of elimination from the
market or extensive additional laboratory studies that could be undertaken reduce these
uncertainties.
Perhaps the main follow-up activity that EPA should consider for these substances is new
environmental monitoring data in the U.S. along the lines of what was suggested in the 2015
report on chlorinated paraffins by U.S. and Canada Identification Task Team (ITT) on Chemicals
of Mutual Concern in the Great Lakes. The ITT 2015 report concluded that there are
“insufficient data and/or information available to effectively apply the Binational
Considerations” and, therefore it made a designation of “No Determination” for all CPs - SCCPs
(C10-C13), MCCPs (C14-C17) and LCCPs (> C18). The ITT specifically recommended
“continued targeted monitoring in top predator fish across the Great Lakes, including in the near-
shore environment, in order to confirm recent trends continue to show decreases for SCCPs and
definitely establish whether downward trend exists for MCCPs.” The ITT also recommended
“targeted sediment monitoring… in the near shore environment and tributaries, to establish
trends and evaluate loadings of these chemicals to the lakes.” The ITT noted that “this
monitoring work will provide some of the information necessary to evaluate the performance of
existing and forthcoming risk management and control activities.” It is worth noting that the ITT
report had already found that what trend data did exist for CPs in the Great Lakes showed a drop
in levels of SCCP and MCCP in the biota based on the work by Ismail et al. (2009). Based on
the enhanced review of the monitoring data in this report, CPIA believe that collecting new water
and sediment data using high resolution methods could provide a confirmation that these
substances are not presenting an unreasonable risk to the environment. Such an approach could
also confirm initially identified downward trends and eliminate any concerns that these
substances are accumulating in the environment.
CPIA has separately provided EPA information regarding the environmental fate and aquatic
toxicity of these substances that CPIA believes supports a conclusion that these substances are
not PBTs. These data include analysis of the bioaccumulation potential of MCCP in the
environment demonstrating that MCCP is not bioaccumulating in environmental organisms.
While CPIA believes these data are sufficient to demonstrate a lack of bioaccumulation,
additional sampling could also be done on organism as a part of the monitoring efforts
mentioned above.
24
References
Chen, M. Y., X. J. Luo, X. L. Zhang, M. J. He, S. J. Chen, and B. X. Mai. 2011. Chlorinated
Paraffins in Sediments from the Pearl River Delta, South China: Spatial and Temporal
Distributions and Implication for Processes. Environmental Science and Technology, 45(23),
9936-9943.
Identification Task Team (ITT) for Chemicals of Mutual Concern (CMCs) in the Great Lakes.
2015. Binational Summary Report: Chlorinated Paraffins.
Ismail, N., S.B. Gewurtz, K. Pleskach,† D.M. Whittle, P.A. Helm, C.H. MARVIN, and G.T.
Tomy. 2009. BROMINATED AND CHLORINATED FLAME RETARDANTS IN
LAKE ONTARIO, CANADA, LAKE TROUT (SALVELINUS NAMAYCUSH) BETWEEN
1979 AND 2004 AND POSSIBLE INFLUENCES OF FOOD-WEB CHANGES. Environmental
Toxicology and Chemistry, Vol. 28, No. 5, pp. 910–920.
Nicholls, C. R., C. R. Allchin, and R. J. Law. 2001. Levels of Short and Medium Chain Length
Polychlorinated N-Alkanes in Environmental Samples from Selected Industrial Areas in England
and Wales. Environmental Pollution, 114(3), 415-430.
Petersen, M., P. Bussmann, R. Grumping, and G. Liek. 2006. Analysis of Short-Chain (C10-
C13) and Medium-Chain Chlorinated Paraffins (C14-C17) in Norwegian Sediment and Water
Samples by Gc/Ecni-Ms. Organohalogen Compounds, 68, 2101-2104.
Houde, M., D. C. Muir, G. T. Tomy, D. M. Whittle, C. Teixeira, and S. Moore. 2008.
Bioaccumulation and Trophic Magnification of Short- and Medium-Chain Chlorinated Paraffins
in Food Webs from Lake Ontario and Lake Michigan. Environmental Science & Technology,
42(10), 3893-3899.
Kassim, Tarek A., and Damià Barceló, eds. Contaminated sediments. Vol. 5. Springer Science &
Business Media, 2009.


![[INFO] | [July2018] | [ISSUE 7] INTERTEK INFO€¦ · 단쇄염화파라핀(SCCP)을포함하는부적합제품에대한유럽의 강화조치 Short Chain Chlorinated Paraffins (SCCPs)](https://static.fdocuments.net/doc/165x107/5e2246e9dfdd15387b5db56a/info-july2018-issue-7-intertek-eoeoeesccpeeoeeoeoeoee.jpg)


![CHLORINATED PARAFFINS [ASSESSMENT]echa.europa.eu/.../orats_summary_2-nitrotoluene_en.pdfMelting point - 9.55 ºC Kirk-Othmer, 1996 Boiling point 221.7 ºC Kirk-Othmer, 1996 Relative](https://static.fdocuments.net/doc/165x107/60e045b44c3f5a4210771b47/chlorinated-paraffins-assessmentecha-melting-point-955-c-kirk-othmer-1996.jpg)


![CHLORINATED PARAFFINS [ASSESSMENT] - Europapublications.jrc.ec.europa.eu/repository/bitstream/JRC... · 2012. 4. 17. · Institute for Health and Consumer Protection Toxicology and](https://static.fdocuments.net/doc/165x107/60e8f79488685508db7aa39d/chlorinated-paraffins-assessment-2012-4-17-institute-for-health-and-consumer.jpg)