Chlorinated hydrocarbon pesticides and …avangeen/publications/documents/... · Chlorinated...
13
Ž . Marine Chemistry 64 1999 85–97 Chlorinated hydrocarbon pesticides and polychlorinated biphenyls in sediment cores from San Francisco Bay 1 M.I. Venkatesan a, ) , R.P. de Leon a,2 , A. van Geen b,3 , S.N. Luoma c,4 a Institute of Geophysics and Planetary Physics, UniÕersity of California, Los Angeles, CA 90095-1567, USA b Lamont-Doherty Earth ObserÕatory of Columbia UniÕersity, Palisades, New York, NY 10964, USA c Water Resources DiÕision, USGS, 345 Middlefield Road, Menlo Park, CA 94025, USA Received 31 July 1997; revised 26 June 1998; accepted 27 August 1998 Abstract Sediment cores of known chronology from Richardson and San Pablo Bays in San Francisco Bay, CA, were analyzed for a suite of chlorinated hydrocarbon pesticides and polychlorinated biphenyls to reconstruct a historic record of inputs. Total Ž X X X X . DDTs DDT s2,4 - and 4,4 -dichlorodiphenyltrichloroethane and the metabolites, 2,4 - and 4,4 -DDE, -DDD range in Ž . concentration from 4–21 ngrg and constitute a major fraction )84% of the total pesticides in the top 70 cm of Richardson Bay sediment. A subsurface maximum corresponds to a peak deposition date of 1969–1974. The first measurable DDT levels are found in sediment deposited in the late 1930’s. The higher DDT inventory in the San Pablo relative to the Richardson Bay core probably reflects the greater proximity of San Pablo Bay to agricultural activities in the Ž . watershed of the Sacramento and San Joaquin rivers. Total polychlorinated biphenyls PCBs occur at comparable levels in Ž . the two Bays -1–34 ngrg . PCBs are first detected in sediment deposited during the 1930’s in Richardson Bay, about a decade earlier than the onset of detectable levels of DDTs. PCB inventories in San Pablo Bay are about a factor of four higher in the last four decades than in Richardson Bay, suggesting a distribution of inputs not as strongly weighed towards the upper reaches of the estuary as DDTs. The shallower subsurface maximum in PCBs compared to DDT in the San Pablo Bay core is consistent with the imposition of drastic source control measures for these constituents in 1970 and 1977 respectively. The observed decline in DDT and PCB levels towards the surface of both cores is consistent with a dramatic drop in the input of these pollutants once the effect of sediment resuspension and mixing is taken into account. q 1999 Elsevier Science B.V. All rights reserved. Keywords: chlorinated hydrocarbon pesticides; polychlorinated biphenyls; sediment cores; San Francisco Bay ) Corresponding author. Tel.: q1-310-206-2561; Fax: q1-310- 206-3051; E-mail: [email protected] 1 Institute of Geophysics and Planetary Physics Contribution Number: 4214. 2 Fax: q1-818-992-8940; E-mail: [email protected] 3 Fax: q1-914-365-8154; E-mail: [email protected] 4 Fax: q1-650-329-4463; E-mail: [email protected] 1. Introduction San Francisco Bay is a shallow epicontinental basin which receives drainage from about 40% of the total land area of the state of California; it is one of the largest estuaries in Western North America Ž . Nichols et al., 1986 . Chlorinated hydrocarbon con- taminants have entered the catchment from a variety 0304-4203r99r$ - see front matter q 1999 Elsevier Science B.V. All rights reserved. Ž . PII: S0304-4203 98 00086-3
-
Upload
nguyenthien -
Category
Documents
-
view
220 -
download
0
Transcript of Chlorinated hydrocarbon pesticides and …avangeen/publications/documents/... · Chlorinated...

Ž .Marine Chemistry 64 1999 85–97
Chlorinated hydrocarbon pesticides and polychlorinated biphenylsin sediment cores from San Francisco Bay 1
M.I. Venkatesan a,), R.P. de Leon a,2, A. van Geen b,3, S.N. Luoma c,4
a Institute of Geophysics and Planetary Physics, UniÕersity of California, Los Angeles, CA 90095-1567, USAb Lamont-Doherty Earth ObserÕatory of Columbia UniÕersity, Palisades, New York, NY 10964, USA
c Water Resources DiÕision, USGS, 345 Middlefield Road, Menlo Park, CA 94025, USA
Received 31 July 1997; revised 26 June 1998; accepted 27 August 1998
Abstract
Sediment cores of known chronology from Richardson and San Pablo Bays in San Francisco Bay, CA, were analyzed fora suite of chlorinated hydrocarbon pesticides and polychlorinated biphenyls to reconstruct a historic record of inputs. Total
Ž X X X X .DDTs DDTs2,4 - and 4,4 -dichlorodiphenyltrichloroethane and the metabolites, 2,4 - and 4,4 -DDE, -DDD range inŽ .concentration from 4–21 ngrg and constitute a major fraction )84% of the total pesticides in the top 70 cm of
Richardson Bay sediment. A subsurface maximum corresponds to a peak deposition date of 1969–1974. The firstmeasurable DDT levels are found in sediment deposited in the late 1930’s. The higher DDT inventory in the San Pablorelative to the Richardson Bay core probably reflects the greater proximity of San Pablo Bay to agricultural activities in the
Ž .watershed of the Sacramento and San Joaquin rivers. Total polychlorinated biphenyls PCBs occur at comparable levels inŽ .the two Bays -1–34 ngrg . PCBs are first detected in sediment deposited during the 1930’s in Richardson Bay, about a
decade earlier than the onset of detectable levels of DDTs. PCB inventories in San Pablo Bay are about a factor of fourhigher in the last four decades than in Richardson Bay, suggesting a distribution of inputs not as strongly weighed towardsthe upper reaches of the estuary as DDTs. The shallower subsurface maximum in PCBs compared to DDT in the San PabloBay core is consistent with the imposition of drastic source control measures for these constituents in 1970 and 1977respectively. The observed decline in DDT and PCB levels towards the surface of both cores is consistent with a dramaticdrop in the input of these pollutants once the effect of sediment resuspension and mixing is taken into account. q 1999Elsevier Science B.V. All rights reserved.
Keywords: chlorinated hydrocarbon pesticides; polychlorinated biphenyls; sediment cores; San Francisco Bay
) Corresponding author. Tel.: q1-310-206-2561; Fax: q1-310-206-3051; E-mail: [email protected]
1 Institute of Geophysics and Planetary Physics ContributionNumber: 4214.
2 Fax: q1-818-992-8940; E-mail: [email protected] Fax: q1-914-365-8154; E-mail:
[email protected] Fax: q1-650-329-4463; E-mail: [email protected]
1. Introduction
San Francisco Bay is a shallow epicontinentalbasin which receives drainage from about 40% of thetotal land area of the state of California; it is one ofthe largest estuaries in Western North AmericaŽ .Nichols et al., 1986 . Chlorinated hydrocarbon con-taminants have entered the catchment from a variety
0304-4203r99r$ - see front matter q 1999 Elsevier Science B.V. All rights reserved.Ž .PII: S0304-4203 98 00086-3
( )M.I. Venkatesan et al.rMarine Chemistry 64 1999 85–9786
of sources, including sewage and industrial outfallsŽ .Hoffman and Meighan, 1984; Chapman et al., 1986 ,
Ž .urban runoff Law and Goerlitz, 1974 , agriculturalŽdischarges Bailey et al., 1967; Risebrough et al.,
.1968a , atmospheric fallout, harbor and shippingŽtraffic and other anthropogenic inputs Nichols et al.,
. Ž .1986 . For example, Bailey et al. 1967 estimatedthat about 2 tonnes of DDT and its metabolitesentered San Francisco Bay in 1967 from the drainageof agricultural lands in the region. Pereira et al.Ž .1996 described a contamination gradient of DDTsin the Lauritzen Canal and Richmond Harbor inCentral Bay that originated from a large DDT ship-ping facility active in the 1970’s. Gilliom and CliftonŽ .1990 found some of the highest bed sedimentconcentrations of DDTs amongst major rivers in theUSA in the San Joaquin River, a major tributary tothe Bay.
The massive usage of chlorinated hydrocarbons inthe ;1950–;1975 period had significant ecosys-tem implications in the Bay Area, as it did else-where. Chlorinated hydrocarbon contaminationspread to coastal waters outside the Bay, and DDTsand PCBs were detected in fish, collected along thelower continental slope down to water depths of
Ž1000 m near the Farallon Islands Melzian et al.,.1987 . Most notably the contamination threatened
the survival of important piscivorous Pacific seaŽbirds on the Pacific coast Risebrough et al., 1967,
.1968b, 1978; Long et al., 1990 .The widespread presence of chlorinated hydrocar-
bons and particularly PCBs in the Bay and Delta, asa result of the inputs described above, have beendocumented by determinations of chlorinated hydro-carbons in Bay sediments by various programs since
Žthe 1980’s Chapman et al., 1986; Spies et al., 1987;NOAA, 1987, 1988; Phillips and Spies, 1988; RMP,
.1995, 1996 . These studies provide a comparativedata base against which modern concentrations ofchlorinated hydrocarbons can be assessed. The his-tory of chlorinated hydrocarbon contamination canalso be followed using contaminant profiles fromdated sediment cores, since sediments integrate andretain records of the influx of recalcitrant organiccontaminants. Past studies of historical trends ofpollutants levels have resulted in stringent laws aswell as improved technologies in curtailing wastedisposal into the ocean waters, especially since the
late 1970s. A comparison of the recent status ofchlorinated hydrocarbon contamination with pastcontaminant concentrations has not been conductedin San Francisco Bay. Profiles of chlorinated hydro-carbon pesticides and polychlorinated biphenyls fromdated sediment cores from the Richardson and SanPablo Bays, San Francisco are reported here. Thedata show distinct differences for the two classes oforganic contaminant that can be attributed to differ-ent input histories and distributions in the watershed.
2. Methods
2.1. Sampling and chronology
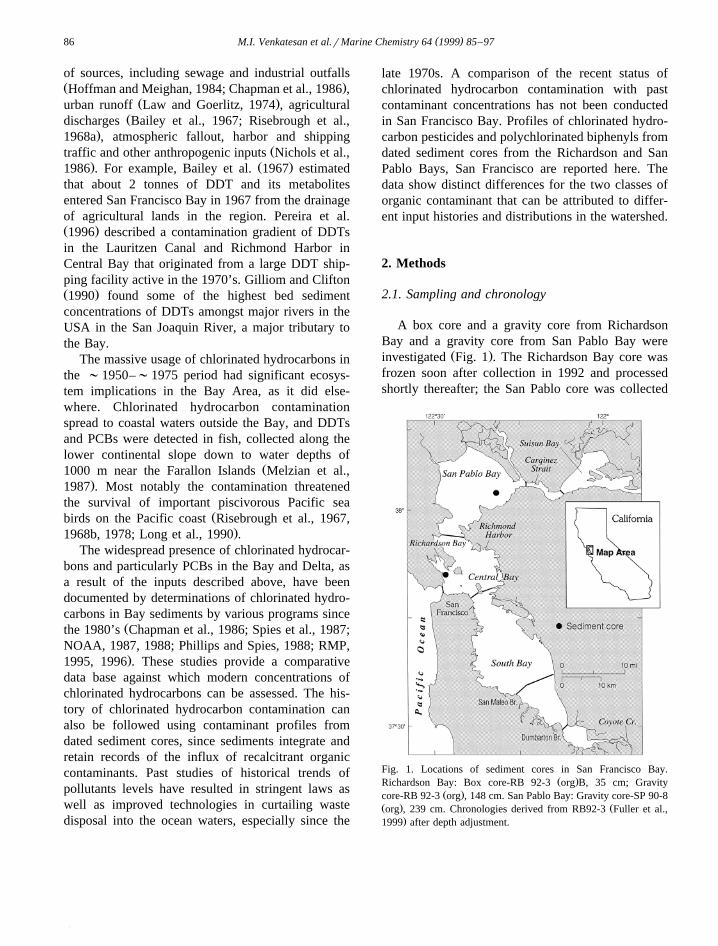
A box core and a gravity core from RichardsonBay and a gravity core from San Pablo Bay were
Ž .investigated Fig. 1 . The Richardson Bay core wasfrozen soon after collection in 1992 and processedshortly thereafter; the San Pablo core was collected
Fig. 1. Locations of sediment cores in San Francisco Bay.Ž .Richardson Bay: Box core-RB 92-3 org B, 35 cm; Gravity
Ž .core-RB 92-3 org , 148 cm. San Pablo Bay: Gravity core-SP 90-8Ž . Žorg , 239 cm. Chronologies derived from RB92-3 Fuller et al.,
.1999 after depth adjustment.
( )M.I. Venkatesan et al.rMarine Chemistry 64 1999 85–97 87
in 1990 and stored at 48C in a cold room untilanalysis in 1992. The box core was sectioned at 5 cmand the gravity cores at 10 cm intervals. The coresections were air-dried in clean-baked aluminum panscovered with baked foil and dried in a hood awayfrom the chemistry laboratory to avoid contamina-tion. Dry samples were stored in organically-cleanglass jars. Box and gravity cores were dated by 210 Pb
234 Ž . 14and Th activities Fuller et al., 1999 C in10 Žmollusc shells and sediment Be van Geen et al.,
. Ž137 239,240 .1999 . Fallout isotope profiles Cs and Puwere determined for comparison to the 210 Pbchronology. A gravity core, RB92-3, from Richard-son Bay was used for age-dating while another core,
Ž .RB92-3 org collected within a circle of diameterF10 m, was used for the analysis of organic con-stituents. Visual correlation of high-resolution den-sity and magnetic susceptibility profiles in the twocores were used to transfer the chronology of RB92-3
Ž .to RB92-3org Pereira et al., 1999 . Strong verticalmixing of the sediments is indicated by the nearlyconstant excess 210 Pb in the upper 25 cm, the depthof excess 234 Th activity and the profiles of bomb
Ž .fallout nuclides Fuller et al., 1999 . A chronologyhas, therefore, been developed by assigning the mini-mum age of deposition and a date of peak concentra-tion to each depth. The minimum age of sediments ata given depth corresponds to the earliest date acontaminant could have been deposited. The depthinterval with the highest concentration of the specificcontaminant represents the peak year of input for
Ž .that contaminant Fuller et al., 1999 .Profiles of 210 Pb, 137Cs and 239,240 Pu in the Pablo
Bay core indicate considerably higher, albeit spo-radic, sedimentation than in Richardson Bay over the
Ž .past several decades Fuller et al., 1999 . A hiatus inthe core suggested by the radionuclides and otherproperties is consistent with historical bathymetrydata indicating a prolonged period of erosion in thearea at the turn of the century. The San Pablo Baycore does not extend to sediment deposited before
Žerosional disturbance of the watershed van Geen et.al., 1999 .
2.2. Analytical procedures
The sediment sections were analyzed for chlori-nated hydrocarbon pesticides and selected poly-chlorinated biphenyl congeners listed by NOAA NS
Ž .&T Program Table 1 . The analytical procedure isŽ .described by Venkatesan 1998 and Venkatesan et
Ž .al. 1998 . In the present study, the air-dried sedi-ment samples were extracted with methylene chlo-ride and processed; in the earlier work, on southernCalifornia sediments, the pore water was removed bymethanol extraction of the wet sediments. All othersteps are the same in both the studies.
Ž .Dry sediment 20–30 g was sonicated for 15 minwith 50 ml of methylene chloride and surrogates andthen extracted by homogenization with 100 ml ofmethylene chloride three times. The concentratedextract was exchanged into hexane to precipitateasphaltene, treated with activated copper for elemen-tal sulfur removal and then subjected to columnchromatography on activated silica gel over alumina.
Ž .The aromatic fraction f2 containing target com-pounds eluted from the column was analyzed on aVarian 3500 gas chromatograph with electron cap-
Ž . Ž .ture detector ECD using a DB-5 30 m and aŽ .confirmation DB-1701 column. Quantitation of all
the target compounds listed in Table 1 was carriedout.
GCrECD operating conditions were optimized toyield the best possible resolution of all the compo-
Table 1List of target analytes
Pesticides PCBs
Aldrin BZ8Alpha-chlordane BZ18Dieldrin BZ28Endrin BZ44Heptachlor BZ52Heptachlor epoxide BZ66Hexachlorobenzene BZ77
Ž .Lindane gamma-BHC BZ101Mirex BZ105Trans-Nonachlor BZ118
X2,4 -DDE BZ126X4,4 -DDE BZ128X2,4 -DDD BZ138X4,4 -DDD BZ153X2,4 -DDT BZ170X4,4 -DDT BZ180
BZ187BZ195BZ206BZ209
( )M.I. Venkatesan et al.rMarine Chemistry 64 1999 85–9788
nents in both the columns. The conditions used areas follows: injection temperature 2608C; split openafter 0.75 min; detector temperature 3308C; tempera-ture program 10 min at 608C; 158Crmin to 1508C,hold 0.1 min; 28Crmin to 2008C, hold 10 min;58Crmin to 2808C, hold 40 min. Hydrogen at 40cmrs was used as carrier gas. Nitrogen at 30 mlrminwas used as make-up gas. A four-point responsefactor calibration was established to quantitate thetarget analytes. Selected samples were run byGCrMS for confirming compound identification andmolecular weight of the biphenyls.
QArQC procedures of the NOAArNS&T Pro-gram were strictly adhered to throughout the project.A surrogate solution at a concentration of ;10=
w Ž .MDL dibromooctafluorobiphenyl DBOFB and BZxa155 were added to the sediment before extraction.
Internal standard BZ a103 and retention time mark-Ž .ers tetrachloro-m-xylene TCMX and BZ a198 of
appropriate concentration were used for accuratequantitation. With the analysis of every batch of fieldsamples, a laboratory procedure blank, a matrix spikeŽsediment spiked with known amount of all the
. Žtarget analytes and a reference sediment SRM 1941,.NIST, USA were also processed. UCLA also took
part in the interlaboratory calibration exercises con-ducted by NISTrNOAA.
All the box core sections were extracted, pro-cessed and analyzed in duplicate. Duplicate analysiswas performed with selected sections from the grav-ity cores as well. Replicate instrumental analysis wasalso carried out for several fractions. The averagerecovery of the analytes from three matrix spikeanalyses ranged from 54–110% which was used tocorrect the data. Method detection limits were deter-mined processing standard compounds at low levelsŽ . Ž10 pgrml , close to the estimated MDL Federal
. Ž .Register, 1984 . Limit of quantitation LOQ wasŽ .calculated after Clesceri et al. 1989 . LOQ was 2.5
times that of MDL.A piece of the butyrate core liner material, the
same as that used for sediment subsampling was alsoanalyzed for the target compounds. This sample didnot contain detectable levels of any of the targetanalytes. However, small amounts of some phtha-lates were detected. Most of the target analytes werenot detected in any of the procedure blanks either. A
Ž .few PCBs BZ a138, 153, 105, and 180 were
occasionally detected at the level of 1–2 picogramrml of the blank sample injected. These analytes werepresent well above this limit in the field samples inwhich they could be quantitated. The possibility ofextraneous contaminants being introduced duringsample handling and processing is, therefore, mini-mal. A low level of contaminants was sporadicallyfound very close to detection or quantitation limits inthe pre-industrial horizons. For example, section110–120 cm in RB92-3 contained no quantifiablepesticides but section 120–138 cm contained a mea-surable quantity of only hexachlorobenzene. Theseanomalous detections are probably the result ofsmearing of contaminated surface sediment along thewalls of the liner during coring, and should probablybe treated as field blanks. However, no attempt wasmade to correct for this effect.
3. Results
3.1. Chlorinated hydrocarbon pesticides
3.1.1. Richardson BayThe total pesticides listed in Table 1 range in
Ž .concentration from ;0.2 near detection limit –22ngrg dry weight and most of the box and gravity
Žcore sections exhibited nearly concordant values Fig..2 . All concentrations are reported in ngrg dry
weight and will be referred to as only ngrg fromŽhereon. Horizons deposited before 1938 deeper than
. Ž70 cm contain very few pesticides see field blanks.discussed above . Pesticides begin to appear consis-
tently from 60 cm upwards. In the sections above 60Ž .cm minimum age in the post-1940s 80–93% of the
total pesticides are DDTs. There is a subsurfacemaximum in total pesticide concentrations around30–35 cm in the box core, corresponding to peakyears of contaminant input from 1969–1974. Simi-larly, a subsurface maximum occurs at 20–30 cm inthe gravity core with the 30–40 cm also containingnear maximum value.
Ž X XTotal DDTs sum of 2,4 - and 4,4 -DDE, DDD.and DDT range in concentration from -0.2 to 21
ngrg. They were detected in 3 sections between 80and 110 cm in the pre-industrial horizon at the levelof 30 to 70 times less than surface strata and theother sections contained none. DDTs are consistentlydetected in sediments deposited after 1938. Fig. 3
( )M.I. Venkatesan et al.rMarine Chemistry 64 1999 85–97 89
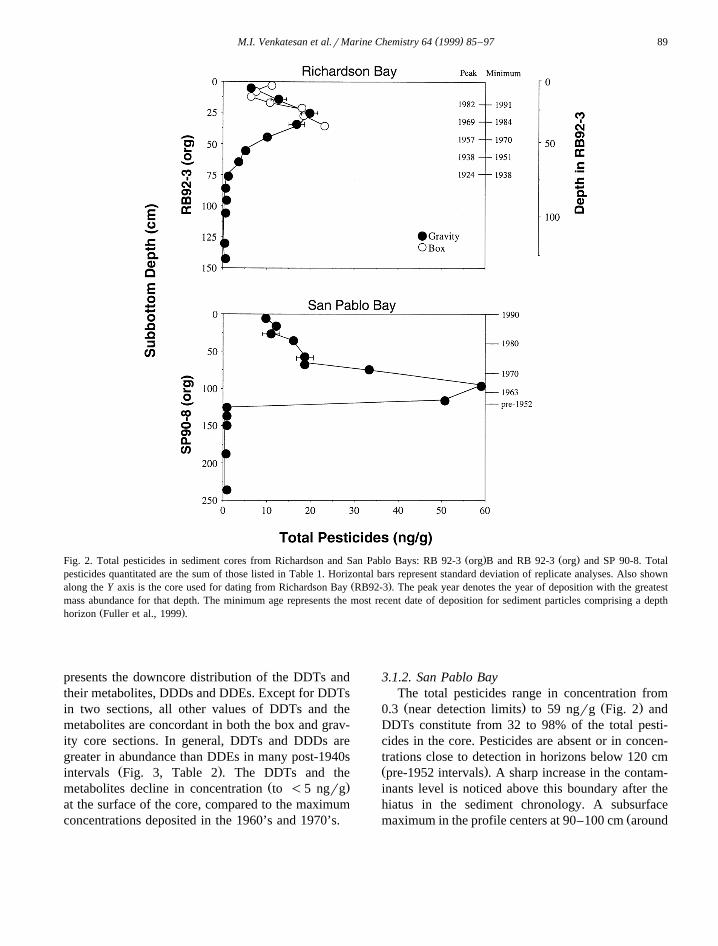
Ž . Ž .Fig. 2. Total pesticides in sediment cores from Richardson and San Pablo Bays: RB 92-3 org B and RB 92-3 org and SP 90-8. Totalpesticides quantitated are the sum of those listed in Table 1. Horizontal bars represent standard deviation of replicate analyses. Also shown
Ž .along the Y axis is the core used for dating from Richardson Bay RB92-3 . The peak year denotes the year of deposition with the greatestmass abundance for that depth. The minimum age represents the most recent date of deposition for sediment particles comprising a depth
Ž .horizon Fuller et al., 1999 .
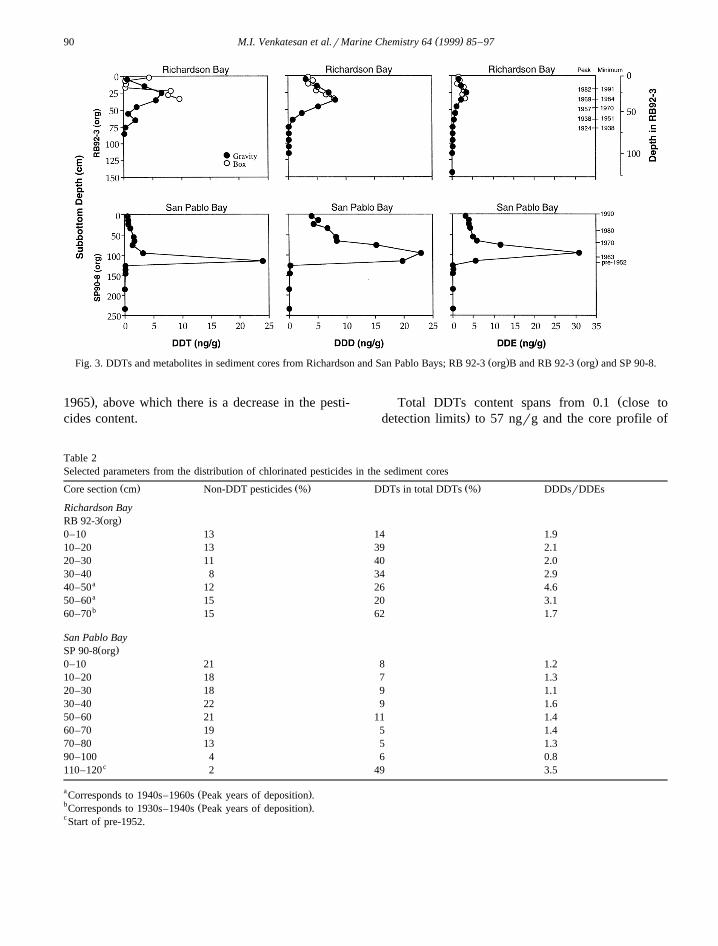
presents the downcore distribution of the DDTs andtheir metabolites, DDDs and DDEs. Except for DDTsin two sections, all other values of DDTs and themetabolites are concordant in both the box and grav-ity core sections. In general, DDTs and DDDs aregreater in abundance than DDEs in many post-1940s
Ž .intervals Fig. 3, Table 2 . The DDTs and theŽ .metabolites decline in concentration to -5 ngrg
at the surface of the core, compared to the maximumconcentrations deposited in the 1960’s and 1970’s.
3.1.2. San Pablo BayThe total pesticides range in concentration fromŽ . Ž .0.3 near detection limits to 59 ngrg Fig. 2 and
DDTs constitute from 32 to 98% of the total pesti-cides in the core. Pesticides are absent or in concen-trations close to detection in horizons below 120 cmŽ .pre-1952 intervals . A sharp increase in the contam-inants level is noticed above this boundary after thehiatus in the sediment chronology. A subsurface
Žmaximum in the profile centers at 90–100 cm around
( )M.I. Venkatesan et al.rMarine Chemistry 64 1999 85–9790
Ž . Ž .Fig. 3. DDTs and metabolites in sediment cores from Richardson and San Pablo Bays; RB 92-3 org B and RB 92-3 org and SP 90-8.
.1965 , above which there is a decrease in the pesti-cides content.
ŽTotal DDTs content spans from 0.1 close to.detection limits to 57 ngrg and the core profile of
Table 2Selected parameters from the distribution of chlorinated pesticides in the sediment cores
Ž . Ž . Ž .Core section cm Non-DDT pesticides % DDTs in total DDTs % DDDsrDDEs
Richardson BayŽ .RB 92-3 org
0–10 13 14 1.910–20 13 39 2.120–30 11 40 2.030–40 8 34 2.9
a40–50 12 26 4.6a50–60 15 20 3.1b60–70 15 62 1.7
San Pablo BayŽ .SP 90-8 org
0–10 21 8 1.210–20 18 7 1.320–30 18 9 1.130–40 22 9 1.650–60 21 11 1.460–70 19 5 1.470–80 13 5 1.390–100 4 6 0.8
c110–120 2 49 3.5
a Ž .Corresponds to 1940s–1960s Peak years of deposition .b Ž .Corresponds to 1930s–1940s Peak years of deposition .cStart of pre-1952.
( )M.I. Venkatesan et al.rMarine Chemistry 64 1999 85–97 91
the total DDTs mimics that of the total pesticides.The contaminants are either not detected or close todetectionrquantitation limits of 0.1–0.3 ngrg in thepre-1952 intervals. Above 120 cm the levels ofDDTs begin to rise sharply. A subsurface maximumaround 1965 centers at 90 to 100 cm, similar to the
Ž .total pesticides Fig. 2 . Most of the sections in SanPablo Bay, in contrast to Richardson Bay, are uni-formly enriched in DDEs and DDDs relative to
Ž . ŽDDTs Fig. 3, Table 2 . In only one section 110–120.cm are DDTs slightly higher than DDDs. This
skewes the subsurface maximum in the DDTs profiletowards a slightly lower horizon than those of DDDsand DDEs.
3.2. Non-DDT pesticides in Richardson and SanPablo cores
ŽThe concentration of non-DDT pesticides Total.PesticidesyDDTs in Richardson Bay ranges from
below detection limits to 2.2 ngrg. They are eithernot detected or almost at detection limits below 70cm in RB92-3, similar to the total pesticides. Alpha-chlordane is the most dominant component in mostof the sections in the post-1940s interval. Totalnon-DDT pesticides in San Pablo Bay range in con-tent from -1 to 4 ngrg. Pre-1952 strata contain
Ž .about 0.2–0.5 ngrg close to detection limits of thetotal components.
( )3.3. Polychlorinated biphenyls PCBs
3.3.1. Richardson BayŽTotal PCBs sum of all the congeners listed in
. ŽTable 1 content ranges from 0.8 near detection.limits to 32 ngrg. Traces of PCB were found at the
level of 0.8–2 ngrg below 80 cm in the cores. TheŽ .topmost section 0–5 cm in the box core was nearly
two-fold enriched in PCBs compared to the gravitycore. However, all other corresponding sections frombox and gravity core exhibited concordant abun-
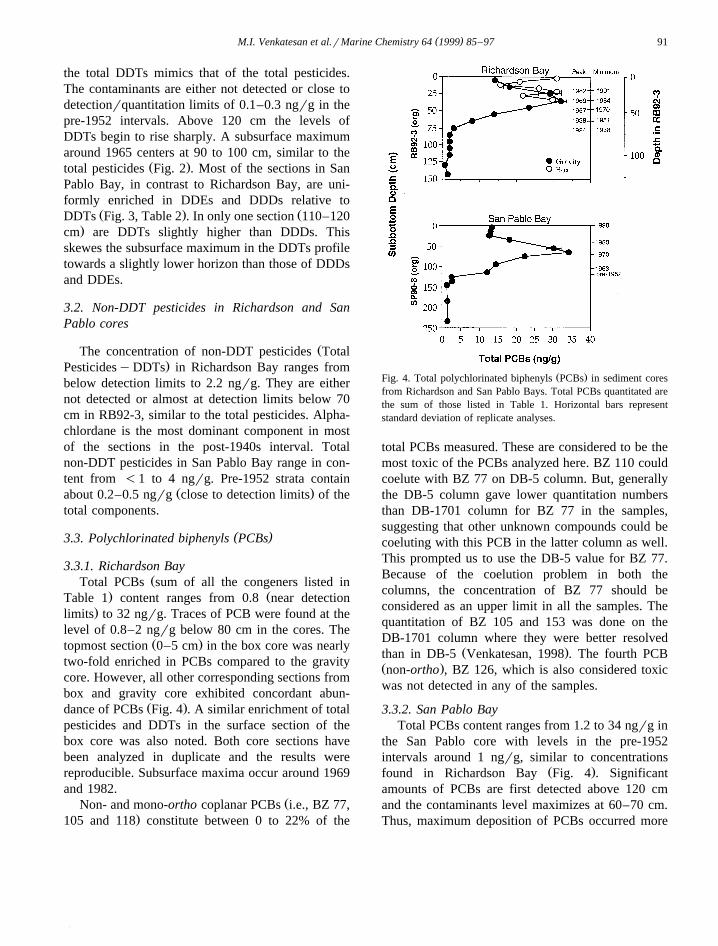
Ž .dance of PCBs Fig. 4 . A similar enrichment of totalpesticides and DDTs in the surface section of thebox core was also noted. Both core sections havebeen analyzed in duplicate and the results werereproducible. Subsurface maxima occur around 1969and 1982.
ŽNon- and mono-ortho coplanar PCBs i.e., BZ 77,.105 and 118 constitute between 0 to 22% of the
Ž .Fig. 4. Total polychlorinated biphenyls PCBs in sediment coresfrom Richardson and San Pablo Bays. Total PCBs quantitated arethe sum of those listed in Table 1. Horizontal bars representstandard deviation of replicate analyses.
total PCBs measured. These are considered to be themost toxic of the PCBs analyzed here. BZ 110 couldcoelute with BZ 77 on DB-5 column. But, generallythe DB-5 column gave lower quantitation numbersthan DB-1701 column for BZ 77 in the samples,suggesting that other unknown compounds could becoeluting with this PCB in the latter column as well.This prompted us to use the DB-5 value for BZ 77.Because of the coelution problem in both thecolumns, the concentration of BZ 77 should beconsidered as an upper limit in all the samples. Thequantitation of BZ 105 and 153 was done on theDB-1701 column where they were better resolved
Ž .than in DB-5 Venkatesan, 1998 . The fourth PCBŽ .non-ortho , BZ 126, which is also considered toxicwas not detected in any of the samples.
3.3.2. San Pablo BayTotal PCBs content ranges from 1.2 to 34 ngrg in
the San Pablo core with levels in the pre-1952intervals around 1 ngrg, similar to concentrations
Ž .found in Richardson Bay Fig. 4 . Significantamounts of PCBs are first detected above 120 cmand the contaminants level maximizes at 60–70 cm.Thus, maximum deposition of PCBs occurred more
( )M.I. Venkatesan et al.rMarine Chemistry 64 1999 85–9792
Ž .recently in ;1975 than maximum deposition ofDDTs. Non- and mono-ortho coplanar PCBs arealmost at detection limits below 120 cm and consti-tute 4 to 36% of the total PCBs in the post-1952intervals following a depth distribution similar to thetotal PCBs.
4. Discussion
4.1. Chlorinated hydrocarbon pesticides
As a consequence of major source control ef-fected by the Clean Water Act of 1970–1971, thesale and use of DDT were banned by the US Envi-ronmental Protection Agency in 1972. California hadalready curbed the sale and use of DDT two yearsearlier in 1970. The use of DDT in the USA peaked
Ž .in the late 50s and early 60s Mearns et al., 1991 . Inaddition to the large urbanrindustrial area surround-ing the Bay, which historically included an activeDDTs shipping facility, the majority of the catch-ment of the San Francisco Estuary consists of theagriculturally productive Central Valley which drainsinto the Sacramento and San Joaquin Rivers. Sosignificant agricultural and industrial development inthe watershed provide potentially important sourcesof the chlorinated hydrocarbons in this aquatic
Ž .ecosystem Phillips and Spies, 1988 .
4.1.1. DDTs in Richardson BayThe historic trends in the DDTs profile in the well
constrained RB92-3 core document the history ofDDTs use described above. DDTs are present in onlytrace amounts in sediments deposited before the1930s. They are first detected in sediments depositedin late 1930s and early 40s. Concentrations increaseslightly in sediments deposited around 1950–1955,with a subsequent rapid increase to a maximum, inthe sediment horizon at 30–35 cm, between 1969 to1974. The latter observations are consistent with thetime when DDTs were in common agricultural use
Ž .as a major pesticide Fig. 3 . The maximum concen-trations of DDTs and the metabolites found in RB92-3 are lower by several orders of magnitude thanfound in sediments from Palos Verdes Shelf andSanta MonicarSan Pedro basins off southern Cali-
Žfornia coast Word and Mearns, 1979; Venkatesan,
.1998 . But the concentrations in Richardson Bay arecomparable to the levels detected in the San Fran-cisco region by the NS&T Program and from other
Ž .coastal areas such as Puget Sound Washington coastŽ . Žand Boston Harbor Massachusetts Phillips and
.Spies, 1988; NOAA, 1991 . The gradual decline inDDTs observed in recent years reflects the ban of thecompound.
The detection of chronic levels of DDTs around6–9 ngrg in the surface sediments of Richardsonand San Pablo Bays, despite the ban, could be due tocontinuing agricultural inputs or to resuspension andredistribution. The mixingraccumulation model of
Ž .Fuller et al. 1999 for Richardson Bay indicates thateven if all new inputs of these contaminants hadabruptly ended in 1970, surface sediment would stillcontain about 50% of the maximum levels of input.On the other hand, agricultural soils could also pro-vide a reservoir of DDT which is released to theaquatic environments through soil erosion and stormrunoff. In 1983 DDT was detected at levels exceed-ing National Academy of Sciences guidelines forpredator protection in fish from seven rivers andstreams in the agricultural watershed of the Bay,including the San Joaquin River at Vernalis. Anton
Ž .et al. 1986 suggest that a combination of the mix-ing of DDT into the soil column and soil erosionrates will result in continued release of DDT wellinto the 21st century in the Central valley.
The sum of 2,4X- and 4,4X-DDT in RB92-3 consti-tutes about 5–62% of the total DDTs from 1930–present; in the last two decades, these average about20% of the total DDTs. The enhanced levels ofparent DDTs and DDDs compared to DDEs in theRichardson Bay core is in contrast to observations indeeper waters off the southern California Basins.While parent DDTs are the dominant isomers insome isolated sites from the Santa MonicarSan Pe-dro basins, most likely originating from chemical
Ž .dumpsites located nearby Venkatesan et al., 1996 ,most sites were characterized by relatively more
ŽDDEs than the other compounds MacGregor, 1974,.1976; Venkatesan, 1998 .
The dominance of DDDs over DDEs in sedimentsŽ .Table 2 might imply reductive dechlorination ofDDTs to DDDs under anaerobic conditionsŽ .Wedemeyer, 1967; Baxtor, 1990 . However, it isunlikely that significant DDDs could have been

( )M.I. Venkatesan et al.rMarine Chemistry 64 1999 85–97 93
formed from DDTs in the well-aerated sedimentstypical of San Francisco Bay. DDTs are metabolizedto DDEs by dehydrochlorination under aerobic con-
Ž .ditions Aguliar, 1984 . This suggests the possibilityof an additional source for DDDs. Technical DDDwas, indeed, used as a commercial insecticide inagriculture and its runoff could have contributed tothe enrichment of DDDs in the sediments. Morelikely, however, is a contribution from the DDTsshipping facility in Lauritzen Canal, within the Rich-mond Harbor of Central San Francisco Bay. In anintensive study of the sediments of the Canal and
Ž .Richmond Harbor, Pereira et al. 1996 concludedthat both p, pX-DDT and p, pX-DDD were processedat the site, and that both degradation of p, pX-DDTand direct input of p, pX-DDD were responsible forthe contamination. They found DDD concentrationsin Bay sediments, adjacent to Richmond Harbor, thatwere more than double the concentrations deter-mined at all other sites in the Bay. They concludedthat DDD from Lauritzen Canal had entered the Bayvia resuspension and gradual mixing or transport offine grained suspended material. Physical re-entrain-ment of surface sediments across substantial dis-tances, by strong currents and storm events, wasresponsible for the dispersal of DDTs in Palos Verdes
Žshelf, southern California Young et al., 1977;.Niedoroda et al., 1996 . It is conceivable that similar
processes could have moved DDDs into RichardsonBay from Richmond Harbor, especially given thecomplex nature of long term sediment transport in
Ž .the Bay Conomos, 1979 . The ratio of DDDsrDDEsdown to 70 cm in the Richardson Bay core are close
Ž . Ž .to 2 or above Table 2 . This ratio is highest 3.1–4.6in the 40–60 cm horizon which corresponds to thepeak years of deposition during 1940–1960, but alsocoincides with the activities of the DDDs packaging
Ž .site. The much lower ratios 0.4–1.7 below 60 cmmight reflect aerobic degradation of DDTs into DDEsŽ .Aguliar, 1984 . The lack of anaerobic conditions aswell as the absence of data on DDMU preclude
Žfurther interpretation of degradation processes e.g.,.Quensen et al., 1998 .
4.1.2. DDTs in San Pablo BayThe post-1952 profile of DDTs in SP90-8 reflects
what we would expect to be the history of riverineinputs from agricultural runoff during the period of
intensive DDT usage, as well as declining concentra-Žtions during the period of source control Phillips
.and Spies, 1988 . DDT, DDD and DDE concentra-tions are substantially higher in the San Pablo Baycore than in Richardson Bay, at their maximum.Surface sediment concentrations are similar in the
Žtwo cores i.e., the decline of DDTs concentrationsfrom their maximum, since the ban of the compound,is larger in the San Pablo core than in the Richardson
.Bay . The higher maximum concentrations couldreflect closer proximity of San Pablo Bay to agricul-tural inputs of DDTs. The strong influence of riverinflows at this site is verified by a higher content of
Žterrigenous alkanes biomarkers of terrigenous plant. Žinput in SP90-8 than in RB92-3 Hostettler et al.,.1999 . An enhanced influx of agricultural DDTs
might also explain the higher ratio of DDErDDD inSP90-8 compared to RB92-3 at the time of maxi-mum input. The TOC concentrations in post-1952
Ž .sediments of San Pablo Bay 1.4–1.7% are slightlyŽ . Žgreater than in Richardson Bay 0.74–1.28% Per-
.eira et al., 1999 and grain size is finer in bulksediments. Both could enhance organic contaminantconcentrations in SP90-8 compared to RB92-3.However, it is unlikely that this influence dominated,otherwise it would have affected surface sedimentssimilar to the buried horizons.
Percentage of DDTs in total DDTs as well as theratio of DDDs to DDEs are nearly constant through-
Ž .out the post-1952 horizons Table 2 . It is not sur-prising that the industrial DDD signature was notevident in SP90-8, given the greater distance fromLauritzen Canal, and more landward location of thissite compared to RB92-3. The high concentrations ofDDTs, at their maximum, in San Pablo Bay, suggestthat agricultural inputs had a greater regional influ-ence on sediment contamination than did the indus-trial site.
4.1.3. Non-DDT pesticides in Richardson and SanPablo Bays
Chlordane, dieldrin and aldrin are among theŽ .chlorinated polycyclic hydrocarbons Table 1 for-
merly used as pesticides primarily in the control ofŽ .soil pests Mearns et al., 1991 . In Richardson Bay,
these components vary from 8 to 21% of the totalpesticides, stabilizing in the last two decades around11–15%. Similarly in San Pablo Bay, the post-1952
( )M.I. Venkatesan et al.rMarine Chemistry 64 1999 85–9794
horizons contain these compounds at the level of2–22% of the total with the last two decades contain-ing around 20% of the total. They were at the lowestlevel of 2–4% during the 1950s and 1960s whenDDTs probably were used the most. Alpha-chlordaneis the dominant compound of the non-DDT pesti-cides in the post-1940 horizon in both sites. Thedepth profiles of the non-DDT pesticides roughlycorrespond to those of the DDTs in terms of onset as
Žwell as decline from the peak levels figure not.shown here .
( )4.2. Polychlorinated biphenyls PCBs
The historic trends in the usage of PCBs areŽwidely documented i.e., Bopp et al., 1982; Olsen et
.al., 1984 . Studies from the Hudson River and estu-ary, New York, show that PCBs first appeared insediments deposited in the late 1930s and their con-centrations exhibit subsurface maxima from the late1960s through the early 1970s with declining trends
Ž .in the recent years. Hom et al. 1974 observed asteady increase in PCBs content from 1945 through1967 in a dated core from the anoxic sediments ofSanta Barbara Basin collected in 1970, but no dataexists from this site to document recent trends.
PCBs are first detected in sediment depositedduring the 1930’s in Richardson Bay. The subsurfacemaximum suggests the peak years of deposition werebetween 1969 and 1974 in RB92-3; the subsurfacemaximum in SP90-8 is approximately 1975. Maxi-mum concentrations in both cores correspond to theperiod when PCB usage was at a maximum. How-ever, the upper level of PCBs detected in the twosites from San Francisco Bay is at least an order ofmagnitude less than that reported for southern Cali-
Žfornia sediments Young et al., 1977; NOAA, 1991;.Venkatesan, 1998 . Concentrations are comparable
to other data from the general region of San Fran-cisco Bay and coastal areas of Florida and OregonŽ .Phillips and Spies, 1988; NOAA, 1991 . The com-parability of PCBs concentrations between SP90-8and RB92-3 indicate that inputs were diffusely asso-
Žciated with development perhaps atmosphericandror from a large number of discharges into a
.well mixed Bay , in contrast to the distinct differ-ences in DDTs concentrations between the coresduring the period of maximum usage.
The decrease in PCBs content in recent years areconsistent with the ban on production in 1977Ž .Mearns et al., 1991; Valette-Silver, 1993 . Waste-water treatment technology also improved to reducesolids and toxic wastes emissions beginning in the1970s due to the Clean Water Act of 1970–1971.The depth profile in RB92-3 is similar for both totaland selected toxic PCBs and is analogous to profilesobserved previously for Santa MonicarSan Pedro
Ž .Basin cores Venkatesan, 1998 and other regions.The elevated level of PCBs in the topmost sectionfrom box core and the post-1970s excursions in thePCBs signal cannot be fully justified by sedimentmixing.
The onset of DDTs contamination in RB92-3lagged by almost a decade that of PCBs. This differ-ence coincides with the earlier start of the usage ofPCBs. The subsurface maximum concentrations ofDDTs and subsequent decline precedes the maxi-mum and decline in PCB concentrations in bothcores. This lag also coincides with the relative timingin source control measures which became effectivein 1970 and 1977 respectively for DDTs and PCBs.The extent of the decline in PCBs content in recent
Ž .years post 1980s in both cores attests to the effec-tiveness of the source control measures.
Because the histories of DDTs and PCBs inputare better known than for most contaminants, theirprofiles may also be informative with regard tosedimentation processes in the cores. Because thechlorinated hydrocarbon profiles in the post-in-dustrial horizon in the Richardson Bay core followusage so closely, they also provide an independentconstraint on the age of the core horizons, and helpvalidate the age model based on radiochronologyŽ .Fuller et al., 1999 . The decline in the DDTs fromtheir maximum is larger in the surface horizon of theSP90-8 relative to Richardson Bay. This is consistentwith more rapid sediment deposition at SP90-8, es-
Žpecially if there was less vertical mixing Fuller et.al., 1999 .
4.3. Non- and mono-ortho PCBs
The ratios of the total PCBs to non- and mono-or-tho PCBs fall within a narrow range of values, from5–8 and 3–8 in the post-industrial sediments fromboth the sites. Ratios from pre-industrial horizons are
( )M.I. Venkatesan et al.rMarine Chemistry 64 1999 85–97 95
Table 3Ž 2 .aInventories of chlorinated hydrocarbon contaminants in San Francisco Bay ngrcm
Core interval in years Total DDTs Total DDDs Non-DDT pesticides Total PCBs
Richardson BayŽ .RB 92-3 org
1950s–1992 557 286 76 11541930s–1992 618 320 90 1391
San Pablo BayŽ .SP 90-8 org
1952–1990 3453 1582 369 4069
a Ž . Ž 3. Ž . Ž .MassrareasMeasured concentration ngrg =Bulk density grcm =Thickness of the interval cm . See Fuller et al. 1999 .
sporadic covering a range from 3-A where all PCBsŽ .except three congeners BZ 8,18 and 28 are close to
LOQ or MDL. In a recent study of historical trendsof these highly toxic PCBs in cod liver oils, theconcentration of congener BZ 77 was found to de-cline in concurrence with total PCB levels in cod andthus appears to be metabolized andror excreted incod compared to the other congeners, BZ 126 and169Ž .Falandysz et al., 1994 . In view of this finding, ourdata was examined to infer trends in the degradationof the toxic PCBs in the sediment cores. Althoughwe did not detect BZ 126 and measure 169, the othertoxic PCBs including BZ 77, BZ 105 and 118 appar-ently covary with the total PCBs down to 60 cm inthe core and, therefore, are at least as stable as all
Žother PCBs assuming their ratio of output has re-mained historically the same as that measured in the
.sediments .
4.4. InÕentories of contaminants in San FranciscoBay
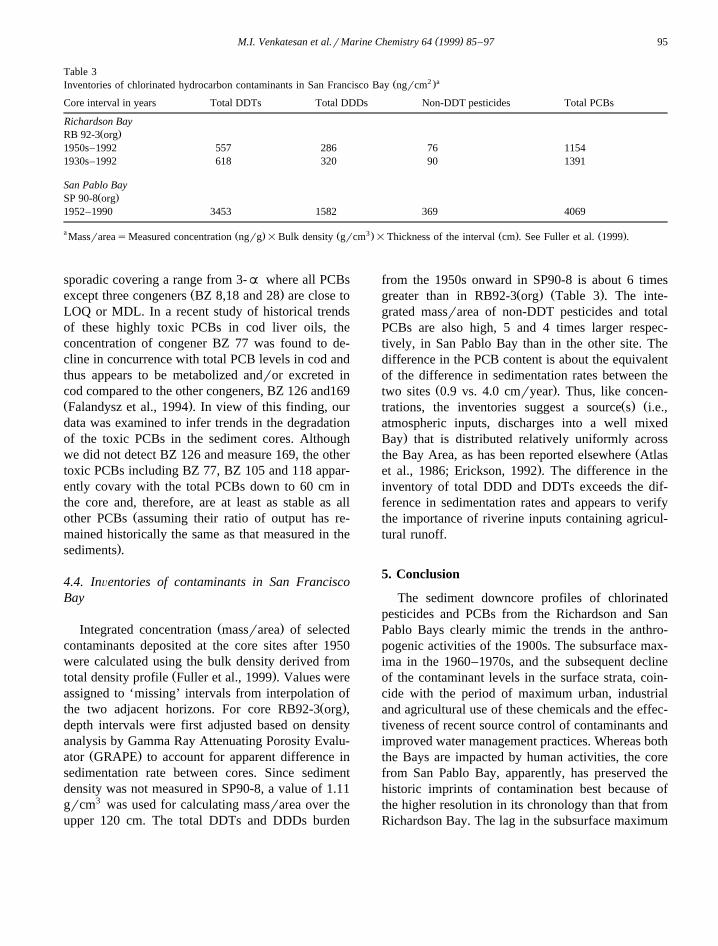
Ž .Integrated concentration massrarea of selectedcontaminants deposited at the core sites after 1950were calculated using the bulk density derived from
Ž .total density profile Fuller et al., 1999 . Values wereassigned to ‘missing’ intervals from interpolation of
Ž .the two adjacent horizons. For core RB92-3 org ,depth intervals were first adjusted based on densityanalysis by Gamma Ray Attenuating Porosity Evalu-
Ž .ator GRAPE to account for apparent difference insedimentation rate between cores. Since sedimentdensity was not measured in SP90-8, a value of 1.11grcm3 was used for calculating massrarea over theupper 120 cm. The total DDTs and DDDs burden
from the 1950s onward in SP90-8 is about 6 timesŽ . Ž .greater than in RB92-3 org Table 3 . The inte-
grated massrarea of non-DDT pesticides and totalPCBs are also high, 5 and 4 times larger respec-tively, in San Pablo Bay than in the other site. Thedifference in the PCB content is about the equivalentof the difference in sedimentation rates between the
Ž .two sites 0.9 vs. 4.0 cmryear . Thus, like concen-Ž . Žtrations, the inventories suggest a source s i.e.,
atmospheric inputs, discharges into a well mixed.Bay that is distributed relatively uniformly across
Žthe Bay Area, as has been reported elsewhere Atlas.et al., 1986; Erickson, 1992 . The difference in the
inventory of total DDD and DDTs exceeds the dif-ference in sedimentation rates and appears to verifythe importance of riverine inputs containing agricul-tural runoff.
5. Conclusion
The sediment downcore profiles of chlorinatedpesticides and PCBs from the Richardson and SanPablo Bays clearly mimic the trends in the anthro-pogenic activities of the 1900s. The subsurface max-ima in the 1960–1970s, and the subsequent declineof the contaminant levels in the surface strata, coin-cide with the period of maximum urban, industrialand agricultural use of these chemicals and the effec-tiveness of recent source control of contaminants andimproved water management practices. Whereas boththe Bays are impacted by human activities, the corefrom San Pablo Bay, apparently, has preserved thehistoric imprints of contamination best because ofthe higher resolution in its chronology than that fromRichardson Bay. The lag in the subsurface maximum
( )M.I. Venkatesan et al.rMarine Chemistry 64 1999 85–9796
between the core profile of DDTs and PCBs coin-cides well with the relative timing in source controlmeasures adopted for these compound classes. Theonset of organic contamination evident at the begin-ning of the industrial horizon in the Richardson Baycore, despite the lack of very fine resolution, pro-vides a constraint on the age of the sediment, espe-cially in the upper 50 cm, independent of the agemodel based on radiochronology.
The larger mass of total DDDs and DDTs accu-mulated in San Pablo than in Richardson Bay can beaccounted for by closer proximity of the former tothe freshwater inflows from Sacramento and SanJoaquin Rivers draining agricultural lands. Subtledifferences in the relative distribution of DDTs andthe metabolites between the sediments from the twoBays indicate some industrial input of DDD toRichardson Bay. PCBs are more uniform in concen-tration and follow sediment deposition more closelythan do the DDTs, suggesting sources more uni-formly associated with the urbanizationrindustriali-zation of the Bay area.
Acknowledgements
We thank E. Ruth for the GCrECD analysis, X.Ouyang, L. Wei and S. Bhalla for technical assis-tance, S. Bhalla for data reduction, R. Anima, C.Fuller, F. Hostettler and W. Pereira for samplesandror pertinent information. This work was fundedby USGS award a1434-93-A-1016 as part of theNOAArNS&T Program.
References
Aguliar, A., 1984. Relationship of DDErDDT in marine mam-mals to the chronology of DDT input into the ecosystem.Canadian J. Fish. Aquatic Science 41, 840–844.
Anton, E.C., Lininger, M., Youngerman, J.M., Agee, B.A., 1986.DDT in the Salinas Valley. A special report on the probablesource of Technical grade DDT found in the Blanco Drainnear Salinas, California. Special Water Quality MonitoringReport No. 86-2 WQ. pp 49.
Atlas, E., Bidleman, T., Giam, C.S., 1986. Atmospheric transportŽ .of PCBs to the ocean. In: Waid, J.S. Ed. , PCBs and the
Environment, CRC Press, Boca Raton, FL, pp. 79–100.Bailey, T.E., Acse, A.M., Hannum, R.R., 1967. Distribution of
pesticides in California. J. Sanit. Eng. Div. Am. Soc. Eng. 93,27–43.
Baxtor, R.M., 1990. Reductive dechlorination of certain chlori-nated organic compounds by reduced haematin compared withtheir behaviour in the environment. Chemosphere 21, 451–458.
Bopp, R.F., Simpson, H.J., Olsen, C.R., Trier, R.M., Kostyk, N.,1982. Chlorinated hydrocarbons and radionuclide chronologiesin sediments of the Hudson River and estuary, New York.Environ. Sci. Technol. 16, 666–676.
Chapman, P.M., Dexter, R.N., Cross, S.F., Mitchell, D.G., 1986.A field trial of the sediment quality triad in San FranciscoBay. NOAA Tech. Mem. NOS OMA 25. National Oceanicand Atmospheric Administration, Rockville, MD, USA.
Clesceri, L.S., Greenberg, A.E., Trussell, R.R., 1989. Standardmethods for the examination of water and wastewater, 17thedn. Publication Office, American Public Health Association,Washington, DC, pp. 18–20.
Ž .Conomos, T.J. Ed. , 1979. San Francisco Bay: The urbanizedestuary. American Association for the Advancement of Sci-ence, San Francisco, CA, pp 493.
Erickson, M.D., 1992. Analytical Chemistry of PCBs. LewisPubl., Boston, 508 pp.
Federal Register, 1984. Vol. 49, No. 209, pp. 198–199.Falandysz, J., Kannan, K., Tanabe, S., Tatsukawa, R., 1994.
Concentrations, clearance rates and toxic potential of Non-or-tho coplanar PCBs in cod liver oil from the southern BalticSea from 1971 to 1989. Mar. Pollut. Bull. 28, 259–262.
Fuller, C.C., van Geen, A., Baskaran, M., Anima, R., 1999.Sediment chronology in San Francisco Bay, California, de-fined by 210 Pb, 234 Th, 137Cs, and 239,240 Pu. Mar. Chem. 64,
Ž .7–27, this issue .Gilliom, R.J., Clifton, D.G., 1990. Organochlorine pesticide
residues in bed sediments of the San Joaquin River. CA. Wat.Res. Bull. 26, 11–23.
Hoffman, R.W., Meighan, R.B., 1984. The impact of combinedsewer overflows from San Francisco on the western shore ofcentral San Francisco Bay. J. Water Pollut. Control Fed. 56,1277–1285.
Hom, W., Risebrough, R.W., Soutar, A., Young, D.R., 1974.Deposition of DDE and polychlorinated biphenyls in datedsediments of the Santa Barbara Basin. Science 184, 1197–1199.
Hostettler, F.D., Pereira, W.E., Kvenvolden, K.A., van Geen, A.,Luoma, S.N., Fuller, C.C., Anima, R., 1999. A record ofhydrocarbon input to San Francisco Bay as traced by biomarkerprofiles in surface sediment and sediment cores. Mar. Chem.
Ž .64, 115–127, this issue .Law, L.M., Goerlitz, D.F., 1974. Selected chlorinated hydrocar-
bons in bottom material from streams tributary to San Fran-cisco Bay. Pestic. Monit. J. 8, 33–36.
Long, E.R., Buchman, M.F., Bay, S.M., Carr, R.S., Chapman,P.M., Hose, J.E., Lissner, A.L., Scott, J., Wolfe, D.A., 1990.Comparative evaluation of five toxicity tests with sedimentsfrom San Francisco Bay and Tomales Bay, California. Envi-ron. Toxicol. Chem. 9, 1193–1214.
MacGregor, J.S., 1974. Changes in the amount and proportions ofDDT and its metabolites, DDE and DDD, in the marineenvironment off southern California. 1949–72. Fish. Bull. 72,275–293.
( )M.I. Venkatesan et al.rMarine Chemistry 64 1999 85–97 97
MacGregor, J.S., 1976. DDT and its metabolites in the sedimentsoff Southern California. Fish. Bull. 74, 27–35.
Mearns, A.J., Matta, M., Shigenaka, G., MacDonald, D., Buch-man, M., Harris, H. Golas, J., Lauenstein, G., 1991. Contami-nant trends in the southern California Bight: Inventory andassessment. NOAA Technical Memorandum NOS ORCA 62.Seattle, WA. pp 423.
Melzian, B.D., Zoffman, C., Spies, R.B., 1987. Chlorinated hy-drocarbons in lower continental slope fish collected near theFarallon Islands, California. Mar. Pollut. Bull. 18, 388–393.
Nichols, F.H., Cloern, J.E., Luoma, S.N., Peterson, D.H., 1986.The modification of an estuary. Science 231, 567–573.
Niedoroda, A.W., Swift, D.J.P., Reed, C.W., Stull, J.K., 1996.Contaminant dispersal on the Palos Verdes continental margin:III. Processes controlling transport, accumulation and re-emer-gence of DDT-contaminated sediment particles. The Scienceof the Total Environ. 179, 109–133.
NOAA, 1987. National Status and Trends Program for MarineEnvironmental Quality. Progress report and preliminary as-sessment of findings of the benthic surveillance project-1984.National Oceanic and Atmospheric Administration, Rockville,MD, USA.
NOAA, 1988. Status and trends in concentrations of contaminantsand measures of biological stress in San Francisco Bay. NOAATechnical Memorandum NOS OMA 41, Seattle, WA, 268 pp.
NOAA, 1991. Second summary of data on chemical concentra-tions in sediments from the National Status and Trends Pro-gram. NOAA Tech. Mem. NOS OSMA 59. National Oceanicand Atmospheric Administration, US Dept. of Commerce.
Olsen, C.R., Larsen, I.L., Brewster, R.H., Cutshall, N.H., Bopp,R.F., Simpson, H.J., 1984. A geochemical assessment ofsedimentation and contaminant distributions in the Hudson-Raritan Estuary. NOAA Technical report, NOSrOMS,2, pp101.
Pereira, W.E., Hostettler, F.D., Rapp, J.B., 1996. Distributionsand fate of chlorinated pesticides, biomarkers and polycyclicaromatic hydrocarbons in sediments along a contaminationgradient from a point-source in San Francisco Bay, California.Mar. Environ. Res. 41, 299–314.
Pereira, W.F., Hostettler, F.D., Luoma, S.N., van Geen, A., Fuller,C.C., Anima, J., 1999. Sedimentation record of anthropogenicand biogenic polycyclic aromatic hydrocarbons in San Fran-
Ž .cisco Bay, California. Mar. Chem. 64, 99–113, this issue .Phillips, D.J.H., Spies, R.B., 1988. Chlorinated hydrocarbons in
the San Francisco estuarine ecosystem. Mar. Pollut. Bull. 19,445–453.
Quensen, J.F. III, Mueller, S., Jain, M.K., Tiedje, J.M., 1998.Reductive dechlorination of DDE to DDMU in marine sedi-ment microcosms. Science 280, 722–724.
Regional Monitoring Program for trace Substances, 1995. 1995Annual Report, San Francisco Estuary Institute. 324 pp. withappendices.
Regional Monitoring Program for trace Substances, 1996. 1996Annual Report, San Francisco Estuary Institute. 299 pp. withappendices.
Risebrough, R.W., Menzel, D.B., Martin, D.J. Jr., Olcott, H.S.,1967. DDT residues in Pacific sea birds: a persistent insecti-cide in marine food chains. Nature 216, 589–591.
Risebrough, R.W., Hugget, R.J., Griffin, J.J., Goldberg, E.D.,1968a. Pesticides: transatlantic movements in the northeasttrades. Science 159, 1233–1236.
Risebrough, R.W., Rieche, P., Peakall, D.B., Herman, S.G., Kir-ven, M.N., 1968b. Polychlorinated biphenyls in the globalecosystem. Nature 220, 1098–1102.
Risebrough, R.W., Chapman, J.W., Okazaki, R.K., Schmidt, T.T.,1978. Toxicants in San Francisco Bay and Estuary. Report ofthe Association of Bay Area Governments, Berkeley, CA,USA.
Spies, R.B., Andersen, B.D., Rice, D.W. Jr., 1987. Benzthiazolesin estuarine sediments as indicators of street runoff. Nature327, 697–699.
Valette-Silver, N.J., 1993. The use of sediment cores to recon-struct historical trends in contamination of estuarine and coastal
Ž .sediments. Estuaries 16 3B , 577–588.van Geen, A., Valette-Silver, N.J., Luoma, S.N., Fuller, C.C.,
Baskaran, M., Tera, F., Klein, J., 1999. Constraints on thesedimentation history of San Francisco Bay from 14C and10 Ž .Be. Mar. Chem. 64, 29–38, this issue .
Venkatesan, M.I., 1998. Part II. Historical trends in the depositionof organic pollutants in the Southern California Bight. NOAATechnical Memorandum NOS ORCA 129. National Oceanicand Atmospheric Administration, US Dept. Commerce, SilverSpring, MD, USA, 136 pp.
Venkatesan, M.I., Mirsadeghi, F., Ruth, E., 1998. Historic recordof the deposition of organic pollutants in the sediments fromsouthern California Bight. To be submitted to Mar. Env. Res.
Venkatesan, M.I., Greene, G.E., Ruth, E., Chartrand, A.B., 1996.DDTs and dumpsite in the Santa Monica Basin, California.Science of the Total Environment 179, 61–71.
Wedemeyer, G., 1967. Dechlorination of 1,1,1-trichloro-2,2-Ž .bis p-chlorophenyl ethane by Aerobacter aerogenes. Applied
Microbiol. 15, 569–574.Word, J.W., Mearns, A.J., 1979. 60-meter control survey off
southern California. Tech. Mem. 229, Southern CaliforniaCoastal Water Research Project, El Segundo, CA, 58 pp.
Young, D.R., McDermott-Ehrlich, D., Heesen, T.C., 1977. Sedi-ments as sources of DDT and PCB. Mar. Pollut. Bull. 8,254–257.