ChipMOS TECHNOLOGIES INC. AND SUBSIDIARIES
55
~1~ ChipMOS TECHNOLOGIES INC. AND SUBSIDIARIES CONSOLIDATED FINANCIAL STATEMENTS AND REVIEW REPORT OF INDEPENDENT ACCOUNTANTS FOR THE NINE MONTHS ENDED SEPTEMBER 30, 2021 AND 2020 ------------------------------------------------------------------------------------------------------------------------------------ For the convenience of readers and for information purpose only, the review report of independent accountants and the accompanying consolidated financial statements have been translated into English from the original Chinese version prepared and used in the Republic of China. In the event of any discrepancy between the English version and the original Chinese version or any differences in the interpretation of the two versions, the Chinese-language review report of independent accountants and consolidated financial statements shall prevail.
Transcript of ChipMOS TECHNOLOGIES INC. AND SUBSIDIARIES

~1~
ChipMOS TECHNOLOGIES INC. AND
SUBSIDIARIES
CONSOLIDATED FINANCIAL STATEMENTS AND
REVIEW REPORT OF INDEPENDENT ACCOUNTANTS
FOR THE NINE MONTHS ENDED
SEPTEMBER 30, 2021 AND 2020
------------------------------------------------------------------------------------------------------------------------------------
For the convenience of readers and for information purpose only, the review report of independent
accountants and the accompanying consolidated financial statements have been translated into English from
the original Chinese version prepared and used in the Republic of China. In the event of any discrepancy
between the English version and the original Chinese version or any differences in the interpretation of the
two versions, the Chinese-language review report of independent accountants and consolidated financial
statements shall prevail.

~2~
ChipMOS TECHNOLOGIES INC. AND SUBSIDIARIES
CONSOLIDATED FINANCIAL STATEMENTS
AND REVIEW REPORT OF INDEPENDENT ACCOUNTANTS
FOR THE NINE MONTHS ENDED SEPTEMBER 30, 2021 AND 2020
CONTENTS
Items Page
1. Cover 1
2. Contents 2
3. Review report of independent accountants 3 ~ 4
4. Consolidated balance sheets 5 ~ 6
5. Consolidated statements of comprehensive income 7
6. Consolidated statements of changes in equity 8
7. Consolidated statements of cash flows 9 ~ 10
8. Notes to the consolidated financial statements 11 ~ 55
(1) History and organization 11
(2) The authorization of the consolidated financial statements 11
(3) Application of new and amended International Financial
Reporting Standards and interpretations
11 ~ 12
(4) Summary of significant accounting policies 12 ~ 14
(5) Critical accounting judgments, estimates and key sources of
assumption uncertainty
14
(6) Details of significant accounts 14 ~ 35
(7) Related party transactions 35 ~ 36
(8) Pledged assets 36
(9) Significant contingent liabilities and unrecognized contract
commitments
36
(10) Significant disaster loss 36
(11) Significant events after the reporting period 36
(12) Others 37 ~ 49
(13) Supplementary disclosures 50 ~ 54
(i) Significant transactions information 50 ~ 52
(ii) Information on investees 52
(iii) Information on investments in the P.R.C. 53
(iv) Major shareholders information 53 ~ 54
(14) Segment information 55


ChipMOS TECHNOLOGIES INC. AND SUBSIDIARIES CONSOLIDATED BALANCE SHEETS
(Expressed in thousands of New Taiwan dollars) (The consolidated balance sheets as of September 30, 2021 and 2020 are reviewed, not audited)
~5~
September 30, 2021 December 31, 2020 September 30, 2020
Assets Notes Amount % Amount % Amount %
Current assets
1100 Cash and cash equivalents 6(1) $ 5,188,760 13 $ 4,113,651 12 $ 4,788,223 14
1110 Current financial assets at fair
value through profit or loss
6(2)
361,200 1 53,120 - 217,820 1
1136 Current financial assets at
amortized cost
6(3)
202,100 - 206,482 1 181,450 -
1140 Current contract assets 6(19) 361,287 1 389,016 1 352,461 1
1150 Notes receivable, net 1,051 - 599 - 559 -
1170 Accounts receivable, net 6(4) 6,169,900 16 5,364,156 15 4,637,088 14
1200 Other receivables 61,930 - 51,436 - 27,742 -
1210 Other receivables-related
parties
- - - - 17,000 -
1220 Current tax assets 180 - - - - -
130X Inventories 6(5) 2,612,075 7 2,102,075 6 2,036,181 6
1410 Prepayments 166,233 - 75,568 - 59,117 -
11XX Total current assets 15,124,716 38 12,356,103 35 12,317,641 36
Non-current assets
1510 Non-current financial assets at
fair value through profit or
loss
6(2)
- - 10,368 - 9,982 -
1517 Non-current financial assets at
fair value through other
comprehensive income
6(6)
261,604 1 262,007 1 218,003 1
1535 Non-current financial assets at
amortized cost
6(3) and 8
45,339 - 48,319 - 55,325 -
1550 Investments accounted for
using equity method
6(7)
3,512,212 9 3,271,677 9 3,282,693 10
1600 Property, plant and equipment 6(8) and 8 18,513,415 47 17,994,686 51 17,276,800 51
1755 Right-of-use assets 6(9) 1,085,496 3 859,069 3 731,352 2
1840 Deferred tax assets 170,563 - 185,691 1 181,585 -
1920 Refundable deposits 20,758 - 21,186 - 21,150 -
1990 Other non-current assets 599,742 2 71,708 - 56,320 -
15XX Total non-current assets 24,209,129 62 22,724,711 65 21,833,210 64
1XXX Total assets $ 39,333,845 100 $ 35,080,814 100 $ 34,150,851 100
(Continued)

ChipMOS TECHNOLOGIES INC. AND SUBSIDIARIES CONSOLIDATED BALANCE SHEETS
(Expressed in thousands of New Taiwan dollars) (The consolidated balance sheets as of September 30, 2021 and 2020 are reviewed, not audited)
The accompanying notes are an integral part of these consolidated financial statements.
~6~
September 30, 2021 December 31, 2020 September 30, 2020
Liabilities and Equity Notes Amount % Amount % Amount %
Liabilities Current liabilities 2100 Short-term bank loans 6(10)(30) $ 1,207,201 3 $ - - $ - - 2150 Notes payable 93 - 2,899 - 26 - 2170 Accounts payable 6(11) 1,098,806 3 966,821 3 791,679 2 2200 Other payables 6(12) 2,929,409 8 3,249,403 9 2,167,889 7 2220 Other payables-related parties 968 - - - - - 2230 Current tax liabilities 557,152 1 474,765 1 280,577 1 2250 Current provisions 2,570 - 3,463 - 2,039 - 2280 Current lease liabilities 6(30) 336,334 1 132,549 1 52,569 - 2310 Receipts in advance - - 10,790 - 9,475 - 2320 Long-term bank loans, current portion 6(13)(30)
and 8 748,735 2 748,353 2 748,264 2 2365 Current refund liabilities 10,335 - 9,864 - 9,597 - 2399 Other current liabilities 21,146 - 21,059 - 22,661 - 21XX Total current liabilities 6,912,749 18 5,619,966 16 4,084,776 12 Non-current liabilities 2540 Long-term bank loans 6(13)(30)
and 8 7,948,709 20 6,985,212 20 8,467,254 25 2570 Deferred tax liabilities 250,934 1 300,179 1 300,466 1 2580 Non-current lease liabilities 6(30) 764,465 2 737,946 2 688,771 2 2630 Long-term deferred revenue 97,145 - 72,438 - 65,823 - 2640 Net defined benefit liability, non-current 496,058 1 511,651 2 466,971 1 2645 Guarantee deposits 6(30) 21,627 - 21,670 - 1,686 - 25XX Total non-current liabilities 9,578,938 24 8,629,096 25 9,990,971 29 2XXX Total liabilities 16,491,687 42 14,249,062 41 14,075,747 41 Equity Equity attributable to equity holders of
the Company
Capital stock 6(15) 3110 Capital stock-common stock 7,272,401 19 7,272,401 21 7,272,401 21 Capital surplus 6(16) 3200 Capital surplus 6,059,651 15 6,059,651 17 6,059,651 18 Retained earnings 3310 Legal reserve 2,070,505 5 1,837,894 5 1,837,894 6 3320 Special reserve - - 19,802 - 19,802 - 3350 Unappropriated retained earnings 7,335,050 19 5,498,370 15 4,853,521 14 Other equity interest 6(18) 3400 Other equity interest 104,551 - 143,634 1 31,835 - 31XX Equity attributable to equity
holders of the Company
22,842,158 58 20,831,752 59 20,075,104 59 3XXX Total equity 22,842,158 58 20,831,752 59 20,075,104 59 Significant contingent liabilities and
unrecognized contract commitments 9
3X2X Total liabilities and equity $ 39,333,845 100 $ 35,080,814 100 $ 34,150,851 100

ChipMOS TECHNOLOGIES INC. AND SUBSIDIARIES CONSOLIDATED STATEMENTS OF COMPREHENSIVE INCOME
(Expressed in thousands of New Taiwan dollars, except earnings per share in dollars) (Unaudited)
The accompanying notes are an integral part of these consolidated financial statements.
~7~
Three months ended September 30, Nine months ended September 30,
2021 2020 2021 2020
Items Notes Amount % Amount % Amount % Amount %
4000 Revenue 6(19) $ 7,161,039 100 $ 5,686,127 100 $ 20,608,620 100 $ 16,701,062 100
5000 Cost of revenue 6(5)(25)(26) ( 5,203,242 ) ( 73 ) ( 4,590,534 ) ( 81 ) ( 15,123,161 ) ( 73 ) ( 13,210,293 ) ( 79 )
5900 Gross profit 1,957,797 27 1,095,593 19 5,485,459 27 3,490,769 21
Operating expenses 6(25)(26)
6100 Sales and marketing expenses ( 20,137 ) - ( 13,958 ) - ( 51,513 ) - ( 41,566 ) -
6200 General and administrative
expenses
( 152,107 ) ( 2 ) ( 135,436 ) ( 3 ) ( 451,734 ) ( 2 ) ( 391,805 ) ( 2 )
6300 Research and development expenses ( 290,792 ) ( 4 ) ( 244,960 ) ( 4 ) ( 847,144 ) ( 4 ) ( 755,077 ) ( 5 )
6000 Total operating expenses ( 463,036 ) ( 6 ) ( 394,354 ) ( 7 ) ( 1,350,391 ) ( 6 ) ( 1,188,448 ) ( 7 )
6500 Other income (expenses), net 6(20) 32,744 - 16,405 - 91,818 - 104,630 -
6900 Operating profit 1,527,505 21 717,644 12 4,226,886 21 2,406,951 14
Non-operating income (expenses)
7100 Interest income 6(21) 2,510 - 3,281 - 6,630 - 24,740 -
7010 Other income 6(22) 10,667 - 6,855 - 23,273 - 14,800 -
7020 Other gains and losses 6(23) 9,275 - ( 105,567 ) ( 2 ) ( 57,132 ) - ( 167,293 ) ( 1 )
7050 Finance costs 6(24) ( 32,354 ) - ( 39,872 ) - ( 97,553 ) - ( 132,679 ) ( 1 )
7060 Share of gain (loss) of associates
and joint ventures accounted for
using equity method
157,353 2 ( 43,149 ) ( 1 ) 278,646 - ( 55,127 ) -
7000 Total non-operating income
(expenses)
147,451 2 ( 178,452 ) ( 3 ) 153,864 - ( 315,559 ) ( 2 )
7900 Profit before income tax 1,674,956 23 539,192 9 4,380,750 21 2,091,392 12
7950 Income tax expense 6(27) ( 276,072 ) ( 4 ) ( 115,757 ) ( 2 ) ( 739,157 ) ( 3 ) ( 410,312 ) ( 2 )
8200 Profit for the period $ 1,398,884 19 $ 423,435 7 $ 3,641,593 18 $ 1,681,080 10
Other comprehensive income (loss)
8316 Unrealized (loss) gain on valuation
of equity instruments at fair value
through other comprehensive
income
6(6)
( $ 16,941 ) - $ 51,014 1 ( $ 403 ) - $ 96,195 -
8320 Share of other comprehensive
income of associates and joint
ventures accounted for using
equity method that will not be
reclassified to profit or loss
6(7)
8,465 - 4,433 - 17,061 - 3,189 -
8349 Income tax effect on components
that will not be reclassified to
profit or loss
6(27)
3,388 - ( 10,204 ) - 80 - ( 19,240 ) -
8310 Components of other
comprehensive (loss) income that
will not be reclassified to profit or
loss
( 5,088 ) - 45,243 1 16,738 - 80,144 -
8361 Exchange differences on translation
of foreign operations
6(18)
( 3,805 ) - 42,059 1 ( 47,997 ) - ( 28,327 ) -
8360 Components of other
comprehensive (loss) income
that will be reclassified to profit or
loss
( 3,805 ) - 42,059 1 ( 47,997 ) - ( 28,327 ) -
8300 Other comprehensive (loss) income,
net of income tax
( $ 8,893 ) - $ 87,302 2 ( $ 31,259 ) - $ 51,817 -
8500 Total comprehensive income for the
period
$ 1,389,991 19 $ 510,737 9 $ 3,610,334 18 $ 1,732,897 10
9750 Earnings per share - basic 6(28) $ 1.93 $ 0.58 $ 5.01 $ 2.31
9850 Earnings per share - diluted 6(28) $ 1.91 $ 0.58 $ 4.92 $ 2.29

ChipMOS TECHNOLOGIES INC. AND SUBSIDIARIES CONSOLIDATED STATEMENTS OF CHANGES IN EQUITY
(Expressed in thousands of New Taiwan dollars) (Unaudited)
The accompanying notes are an integral part of these consolidated financial statements.
~8~
Equity attributable to equity holders of the Company
Retained earnings Other equity interest
Notes Capital stock-common stock
Capital surplus
Legal reserve
Special reserve
Unappropriated retained earnings
Financial statements translation differences of foreign operations
Unrealized gain on valuation of
financial assets at fair value through
other comprehensive
income Total equity
Year 2020
Balance at January 1, 2020 $ 7,272,401 $ 6,059,651 $ 1,579,478 $ - $ 4,759,511 ( $ 89,682 ) $ 69,880 $ 19,651,239
Profit for the period - - - - 1,681,080 - - 1,681,080
Other comprehensive income (loss) 6(18) - - - - 180 ( 28,327 ) 79,964 51,817
Total comprehensive income (loss) for the period - - - - 1,681,260 ( 28,327 ) 79,964 1,732,897
Appropriation of prior year’s earnings: 6(17)
Legal reserve - - 258,416 - ( 258,416 ) - - -
Special reserve - - - 19,802 ( 19,802 ) - - -
Cash dividends - - - - ( 1,309,032 ) - - ( 1,309,032 )
Balance at September 30, 2020 $ 7,272,401 $ 6,059,651 $ 1,837,894 $ 19,802 $ 4,853,521 ( $ 118,009 ) $ 149,844 $ 20,075,104
Year 2021
Balance at January 1, 2021 $ 7,272,401 $ 6,059,651 $ 1,837,894 $ 19,802 $ 5,498,370 ( $ 61,330 ) $ 204,964 $ 20,831,752
Profit for the period - - - - 3,641,593 - - 3,641,593
Other comprehensive income (loss) 6(18) - - - - 7,824 ( 47,997 ) 8,914 ( 31,259 )
Total comprehensive income (loss) for the period - - - - 3,649,417 ( 47,997 ) 8,914 3,610,334
Appropriation of prior year’s earnings: 6(17)
Legal reserve - - 232,611 - ( 232,611 ) - - -
Special reserve - - - ( 19,802 ) 19,802 - - -
Cash dividends - - - - ( 1,599,928 ) - - ( 1,599,928 )
Balance at September 30, 2021 $ 7,272,401 $ 6,059,651 $ 2,070,505 $ - $ 7,335,050 ( $ 109,327 ) $ 213,878 $ 22,842,158

ChipMOS TECHNOLOGIES INC. AND SUBSIDIARIES CONSOLIDATED STATEMENTS OF CASH FLOWS
(Expressed in thousands of New Taiwan dollars) (Unaudited)
Nine months ended September 30,
Notes 2021 2020
~9~
CASH FLOWS FROM OPERATING ACTIVITIES Profit before income tax $ 4,380,750 $ 2,091,392 Adjustments to reconcile profit (loss)
Depreciation expenses 6(8)(9)(25) 3,479,304 3,115,716 Expected credit losses 230 32 Interest expense 6(24) 89,884 126,112 Interest income 6(21) ( 6,630 ) ( 24,740 ) Dividend income 6(22) ( 3,658 ) ( 1,911 ) Share of (gain) loss of associates and joint ventures
accounted for using equity method
( 278,646 ) 55,127 Gain on valuation of financial assets at fair value
through profit or loss 6(2)(23)
( 15,937 ) ( 21,808 ) Gain on disposal of property, plant and equipment 6(20) ( 32,435 ) ( 44,324 ) Deferred income ( 8,795 ) ( 7,555 )
Changes in operating assets and liabilities Changes in operating assets
Financial assets at fair value through profit or loss ( 291,202 ) ( 194,956 ) Current contract assets 27,738 25,416 Notes receivable ( 452 ) 206 Accounts receivable ( 805,976 ) ( 184,235 ) Accounts receivable-related parties - 1,045 Other receivables ( 7,887 ) 25,798 Other receivables-related parties - 4,923 Inventories ( 510,000 ) ( 268,539 ) Prepayments ( 85,205 ) 4,359 Other non-current assets 5,762 5,185
Changes in operating liabilities Current contract liabilities - ( 1,231 ) Notes payable ( 2,806 ) 26 Accounts payable 131,985 ( 27,869 ) Other payables 35,835 ( 248,057 ) Current provisions ( 893 ) 41 Current refund liabilities 471 ( 16,403 ) Other current liabilities 87 ( 9,581 ) Net defined benefit liability, non-current ( 15,593 ) ( 13,136 )
Cash generated from operations 6,085,931 4,391,033 Interest received 6,127 29,514 Dividend received 16,108 21,911 Interest paid ( 74,472 ) ( 118,221 ) Income tax paid ( 690,319 ) ( 271,906 )
Net cash generated from operating activities 5,343,375 4,052,331
(Continued)

ChipMOS TECHNOLOGIES INC. AND SUBSIDIARIES CONSOLIDATED STATEMENTS OF CASH FLOWS
(Expressed in thousands of New Taiwan dollars) (Unaudited)
Nine months ended September 30,
Notes 2021 2020
The accompanying notes are an integral part of these consolidated financial statements.
~10~
CASH FLOWS FROM INVESTING ACTIVITIES
Decrease in financial assets at amortized cost $ 7,362 $ 645
Proceeds from disposal of financial assets at fair value
through profit or loss
9,427 -
Acquisition of property, plant and equipment 6(29) ( 4,212,147 ) ( 2,925,293 )
Proceeds from disposal of property, plant and equipment 106,679 78,348
Decrease (increase) in refundable deposits 428 ( 5 )
(Increase) decrease in other non-current assets ( 533,796 ) 5,621
Increase in long-term deferred revenue 22,712 75,391
Net cash used in investing activities ( 4,599,335 ) ( 2,765,293 )
CASH FLOWS FROM FINANCING ACTIVITIES 6(30)
Proceeds from short-term bank loans 1,579,625 151,071
Payments on short-term bank loans ( 372,424 ) ( 151,071 )
Payments on lease liabilities ( 214,956 ) ( 48,131 )
Proceeds from long-term bank loans 1,822,287 3,539,109
Payments on long-term bank loans ( 878,450 ) ( 3,378,450 )
(Decrease) increase in guarantee deposits ( 43 ) 591
Cash dividend paid 6(17) ( 1,599,928 ) ( 1,309,032 )
Net cash generated from (used in) financing activities 336,111 ( 1,195,913 )
Effect of foreign exchange rate changes ( 5,042 ) ( 6,986 )
Net increase in cash and cash equivalents 1,075,109 84,139
Cash and cash equivalents at beginning of period 4,113,651 4,704,084
Cash and cash equivalents at end of period $ 5,188,760 $ 4,788,223

~11~
ChipMOS TECHNOLOGIES INC. AND SUBSIDIARIES
NOTES TO THE CONSOLIDATED FINANCIAL STATEMENTS
FOR THE NINE MONTHS ENDED SEPTEMBER 30, 2021 AND 2020
(Expressed in thousands of New Taiwan dollars, except as otherwise indicated)
(Unaudited)
1. HISTORY AND ORGANIZATION
ChipMOS TECHNOLOGIES INC. (the “Company”) was incorporated on July 28, 1997. The Company
and its subsidiaries (collectively referred herein as the “Group”) are primarily engaged in the research,
development, manufacturing and sale of high-integration and high-precision integrated circuits and
related assembly and testing services. On April 11, 2014, the Company’s shares were listed on the
Taiwan Stock Exchange. On November 1, 2016, the Company’s American Depositary Shares (“ADSs”)
were listed on the NASDAQ Global Select Market.
2. THE AUTHORIZATION OF THE CONSOLIDATED FINANCIAL STATEMENTS
The accompanying consolidated financial statements were authorized for issuance by the Board of
Directors on November 8, 2021.
3. APPLICATION OF NEW AND AMENDED INTERNATIONAL FINANCIAL REPORTING
STANDARDS AND INTERPRETATIONS
(1) Effect of the adoption of new or amended International Financial Reporting Standards (“IFRS”) as
endorsed by the Financial Supervisory Commission (“FSC”)
A. New standards, interpretations and amendments endorsed by the FSC effective from 2021 are as
follows:
New Standards, Interpretations and Amendments
Effective date issued by
International Accounting
Standards Board (“IASB”)
Amendments to IFRS 4, “Extension of the Temporary Exemption
from Applying IFRS 9”
January 1, 2021
Amendments to IFRS 9, International Accounting Standards
(“IAS”) 39, IFRS 7, IFRS 4 and IFRS 16, “Interest Rate
Benchmark Reform-Phase 2”
January 1, 2021
Amendments to IFRS 16, “Covid-19-Related Rent Concessions
beyond 30 June 2021”
April 1, 2021
(Note)
Note: Early adoption from January 1, 2021 is allowed by FSC.
B. Based on the Group’s assessment, the above standards and interpretations have no significant
impact on the Group’s financial position and financial performance.

~12~
(2) Effect of new, revised or amended IFRSs as endorsed by the FSC that has not yet adopted
A. New standards, interpretations and amendments endorsed by the FSC effective from 2022 are as
follows:
New Standards, Interpretations and Amendments
Effective date issued by
IASB
Amendments to IFRS 3, “Reference to the Conceptual Framework” January 1, 2022
Amendments to IAS 16, “Property, Plant and Equipment: Proceeds
before Intended Use”
January 1, 2022
Amendments to IAS 37, “Onerous Contracts-Cost of Fulfilling a
Contract”
January 1, 2022
Annual Improvements to IFRS Standards 2018-2020” January 1, 2022
B. Based on the Group’s assessment, the above standards and interpretations have no significant
impact on the Group’s financial position and financial performance.
(3) The IFRSs issued by IASB but not yet endorsed by the FSC
A. New standards, interpretations and amendments issued by IASB but not yet included in the
IFRSs as endorsed by the FSC are as follows:
New Standards, Interpretations and Amendments
Effective date issued by
IASB
Amendments to IFRS 10 and IAS 28, “Sale or Contribution of
Assets between an Investor and its Associate or Joint Venture”
To be determined by
IASB
IFRS 17, “Insurance Contracts” January 1, 2023
Amendments to IFRS 17, “Insurance Contracts” January 1, 2023
Amendments to IAS 1, “Classification of Liabilities as Current or
Non-current”
January 1, 2023
Amendments to IAS 1, “Disclosure of Accounting Policies” January 1, 2023
Amendments to IAS 8, “Definition of Accounting Estimates” January 1, 2023
Amendments to IAS 12, “Deferred Tax related to Assets and
Liabilities arising from a Single Transaction”
January 1, 2023
B. Based on the Group’s assessment, the above standards and interpretations have no significant
impact on the Group’s financial position and financial performance.
4. SUMMARY OF SIGNIFICANT ACCOUNTING POLICIES
The significant accounting policies adopted are consistent with Note 4 in the consolidated financial
statements for the year ended December 31, 2020, except for the statement of compliance, basis of
preparation, basis of consolidation and additional policies as set out below. These policies have been
consistently applied to all the periods presented, unless otherwise stated.
(1) Statement of compliance
A. The consolidated financial statements of the Group have been prepared in accordance with the
Regulations Governing the Preparation of Financial Reports by Securities Issuers, and IAS 34,
“Interim Financial Reporting” as endorsed by the FSC.
B. The consolidated financial statements are to be read in conjunction with the consolidated
financial statements for the year ended December 31, 2020.

~13~
(2) Basis of preparation
A. Except for the following items, the consolidated financial statements have been prepared under
the historical cost convention:
(a) Financial assets at fair value through profit or loss (including derivative instruments).
(b) Financial assets at fair value through other comprehensive income.
(c) Defined benefit liabilities were recognized based on the net amount of pension fund assets
less the present value of benefit obligation.
B. The preparation of the consolidated financial statements in conformity with IFRSs, IASs,
International Financial Reporting Interpretations Committee interpretations, and SIC
interpretations as endorsed by the FSC requires the use of certain critical accounting estimates. It
also requires management to exercise its judgment in the process of applying the Group’s
accounting policies. The areas involving a higher degree of judgment or complexity, or areas
where assumptions and estimates are significant to the consolidated financial statements are
disclosed in Note 5.
(3) Basis of consolidation
A. Basis for preparation of consolidated financial statements:
The basis for preparation of consolidated financial statements are consistent with those for the
year ended December 31, 2020.
B. Subsidiaries included in the consolidated financial statements: Percentage of Ownership (%)
Name of investor Name of investee Main business
September 30,
2021
December 31,
2020
September 30,
2020
The Company ChipMOS U.S.A., Inc. (“ChipMOS USA”)
Marketing of semiconductors and electronic related products
100 100 100
The Company ChipMOS TECHNOLOGIES (BVI) LTD. (“ChipMOS BVI”)
Holding company 100 100 100
ChipMOS BVI ChipMOS SEMICONDUCTORS
(Shanghai) LTD. (“ChipMOS Shanghai”)
Marketing of semiconductors and
electronic related products
100 100 100
C. Subsidiaries not included in the consolidated financial statements: None.
D. Adjustments for subsidiaries with different balance sheet dates: Not applicable.
E. No significant restrictions on the ability of subsidiaries to transfer funds to parent company.
F. Subsidiaries that have non-controlling interests that are material to the Group: None.
(4) Employee benefits
Defined benefit plans
Pension cost for the interim period is calculated on a year-to-date basis by using the pension cost
rate derived from the actuarial valuation at the end of the prior financial year, adjusted for
significant market fluctuations since that time and for significant curtailments, settlements, or other
significant one-off events. And, the related information is disclosed accordingly.
(5) Income tax
A. The interim period income tax expense is recognized based on the estimated average annual
effective income tax rate expected for the full financial year applied to the pretax income of the
interim period, and the related information is disclosed accordingly.

~14~
B. If a change in tax rate is enacted or substantively enacted in an interim period, the Group
recognizes the effect of the change immediately in the interim period in which the change occurs.
The effect of the change on items recognized outside profit or loss is recognized in other
comprehensive income or equity while the effect of the change on items recognized in profit or
loss is recognized in profit or loss.
5. CRITICAL ACCOUNTING JUDGMENTS, ESTIMATES AND KEY SOURCES OF ASSUMPTION
UNCERTAINTY
There have been no significant changes during the period. Please refer to Note 5 in the consolidated
financial statements for the year ended December 31, 2020.
6. DETAILS OF SIGNIFICANT ACCOUNTS
(1) Cash and cash equivalents
September 30,
2021
December 31,
2020
September 30,
2020
Cash on hand and petty cash $ 470 $ 470 $ 470
Checking accounts and demand deposits 1,542,040 2,609,421 2,812,600
Time deposits 3,646,250 1,503,760 1,975,153
$ 5,188,760 $ 4,113,651 $ 4,788,223
A. The Group transacts with a variety of financial institutions all with high credit quality to
disperse credit risk, so it expects that the probability of counterparty default is remote.
B. No cash and cash equivalents of the Group were pledged to others.
(2) Financial assets at fair value through profit or loss
September 30,
2021
December 31,
2020
September 30,
2020
Current:
Financial assets mandatorily measured at
fair value through profit or loss
Listed stocks $ 339,679 $ 46,512 $ 46,512
Beneficiary certificates - - 150,000
Valuation adjustment 21,521 6,608 21,308
$ 361,200 $ 53,120 $ 217,820
Non-current:
Financial assets mandatorily measured at
fair value through profit or loss
Foreign partnership interests $ - $ 10,940 $ 10,940
Valuation adjustment - ( 572 ) ( 958 )
$ - $ 10,368 $ 9,982
~15~
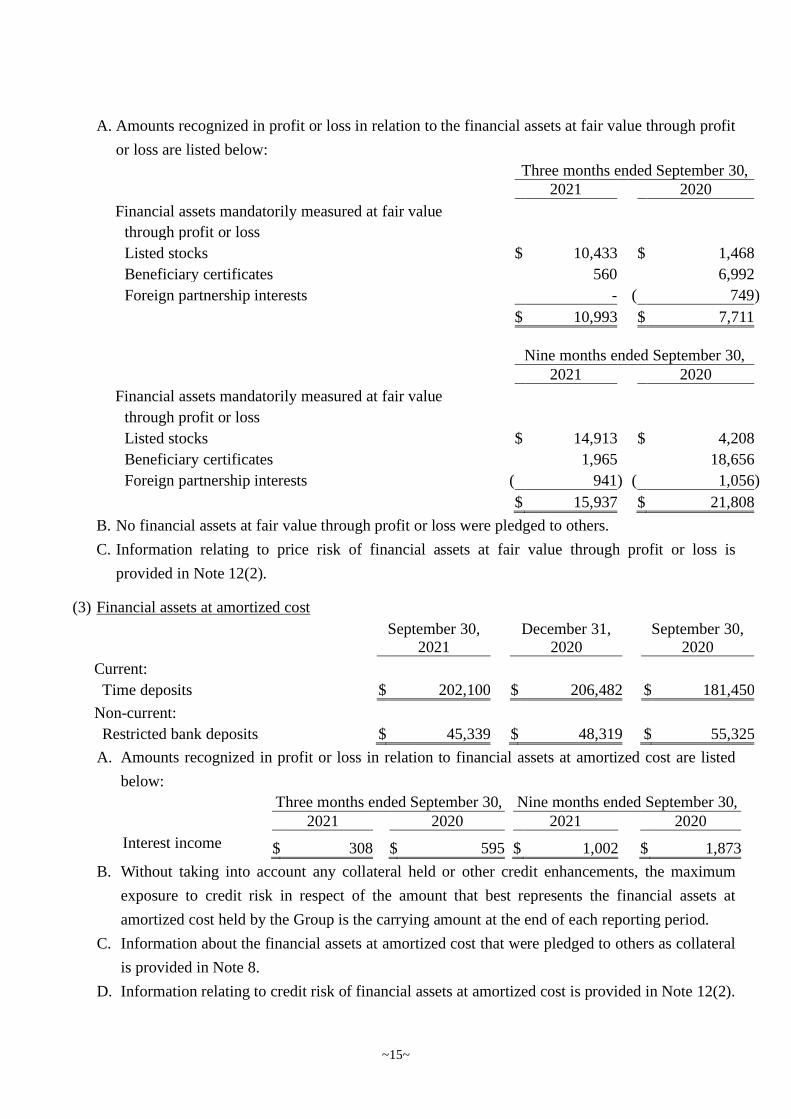
A. Amounts recognized in profit or loss in relation to the financial assets at fair value through profit
or loss are listed below:
Three months ended September 30,
2021 2020
Financial assets mandatorily measured at fair value
through profit or loss
Listed stocks $ 10,433 $ 1,468
Beneficiary certificates 560 6,992
Foreign partnership interests - ( 749 )
$ 10,993 $ 7,711
Nine months ended September 30,
2021 2020
Financial assets mandatorily measured at fair value
through profit or loss
Listed stocks $ 14,913 $ 4,208
Beneficiary certificates 1,965 18,656
Foreign partnership interests ( 941 ) ( 1,056 )
$ 15,937 $ 21,808
B. No financial assets at fair value through profit or loss were pledged to others.
C. Information relating to price risk of financial assets at fair value through profit or loss is
provided in Note 12(2).
(3) Financial assets at amortized cost
September 30,
2021
December 31,
2020
September 30,
2020
Current:
Time deposits $ 202,100 $ 206,482 $ 181,450
Non-current:
Restricted bank deposits $ 45,339 $ 48,319 $ 55,325
A. Amounts recognized in profit or loss in relation to financial assets at amortized cost are listed
below:
Three months ended September 30, Nine months ended September 30,
2021 2020 2021 2020
Interest income $ 308 $ 595 $ 1,002 $ 1,873
B. Without taking into account any collateral held or other credit enhancements, the maximum
exposure to credit risk in respect of the amount that best represents the financial assets at
amortized cost held by the Group is the carrying amount at the end of each reporting period.
C. Information about the financial assets at amortized cost that were pledged to others as collateral
is provided in Note 8.
D. Information relating to credit risk of financial assets at amortized cost is provided in Note 12(2).
~16~
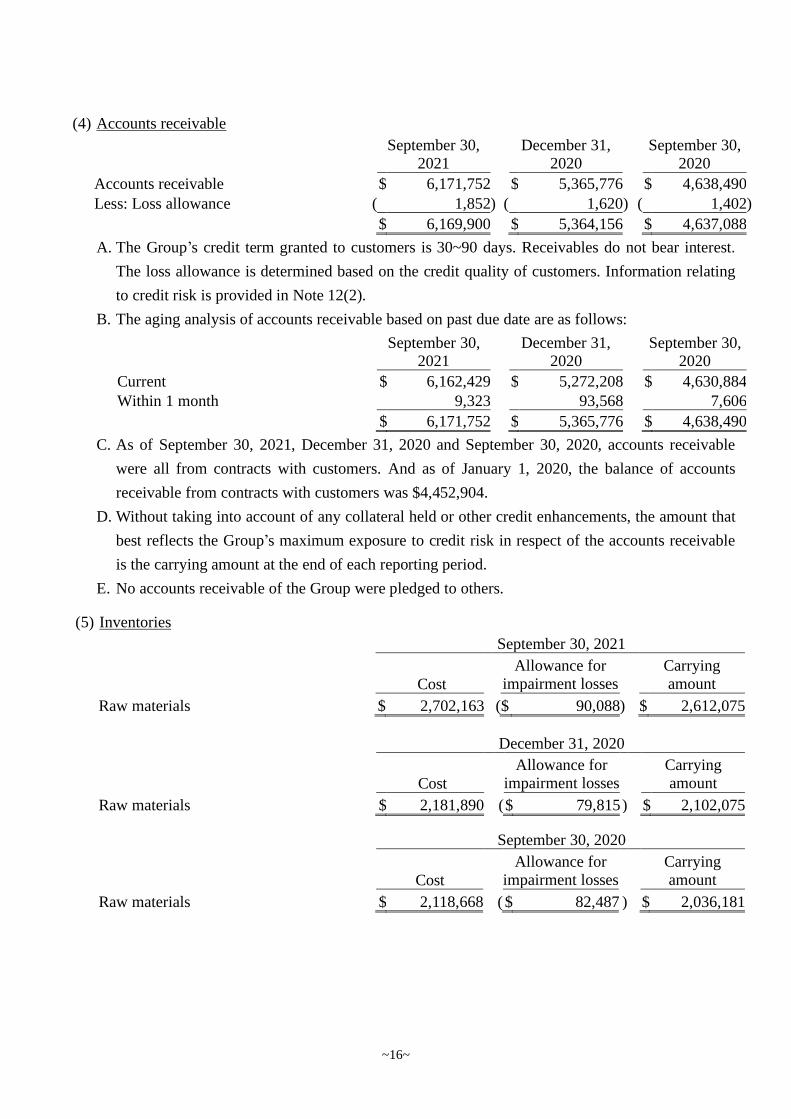
(4) Accounts receivable
September 30,
2021
December 31,
2020
September 30,
2020
Accounts receivable $ 6,171,752 $ 5,365,776 $ 4,638,490
Less: Loss allowance ( 1,852 ) ( 1,620 ) ( 1,402 )
$ 6,169,900 $ 5,364,156 $ 4,637,088
A. The Group’s credit term granted to customers is 30~90 days. Receivables do not bear interest.
The loss allowance is determined based on the credit quality of customers. Information relating
to credit risk is provided in Note 12(2).
B. The aging analysis of accounts receivable based on past due date are as follows:
September 30,
2021
December 31,
2020
September 30,
2020
Current $ 6,162,429 $ 5,272,208 $ 4,630,884
Within 1 month 9,323 93,568 7,606
$ 6,171,752 $ 5,365,776 $ 4,638,490
C. As of September 30, 2021, December 31, 2020 and September 30, 2020, accounts receivable
were all from contracts with customers. And as of January 1, 2020, the balance of accounts
receivable from contracts with customers was $4,452,904.
D. Without taking into account of any collateral held or other credit enhancements, the amount that
best reflects the Group’s maximum exposure to credit risk in respect of the accounts receivable
is the carrying amount at the end of each reporting period.
E. No accounts receivable of the Group were pledged to others.
(5) Inventories
September 30, 2021
Cost
Allowance for
impairment losses
Carrying
amount
Raw materials $ 2,702,163 ( $ 90,088 ) $ 2,612,075
December 31, 2020
Cost
Allowance for
impairment losses
Carrying
amount
Raw materials $ 2,181,890 ( $ 79,815 ) $ 2,102,075
September 30, 2020
Cost
Allowance for
impairment losses
Carrying
amount
Raw materials $ 2,118,668 ( $ 82,487 ) $ 2,036,181

~17~
The cost of inventories recognized as an expense for the period:
Three months ended September 30,
2021 2020
Cost of revenue $ 5,196,222 $ 4,572,856
Allowance for inventory valuation and obsolescence loss 7,020 17,678
$ 5,203,242 $ 4,590,534
Nine months ended September 30,
2021 2020
Cost of revenue $ 15,112,889 $ 13,186,083
Loss on abandonment - 5,221
Allowance for inventory valuation and obsolescence loss 10,272 18,989
$ 15,123,161 $ 13,210,293
A. Allowance for inventory valuation and obsolescence loss was recognized due to the change in
net realizable value.
B. No inventories of the Group were pledged to others.
(6) Non-current financial assets at fair value through other comprehensive income
September 30,
2021
December 31,
2020
September 30,
2020
Designation of equity instruments
Foreign unlisted stocks $ 38,534 $ 38,534 $ 38,534
Valuation adjustment 223,070 223,473 179,469
$ 261,604 $ 262,007 $ 218,003
A. Based on the Group’s business model, the foreign unlisted stocks held for strategic investments
were elected to classify as “Financial assets at fair value through other comprehensive income”.
As of September 30, 2021, December 31, 2020 and September 30, 2020, the fair value of
aforementioned investments is the carrying amount at the end of each reporting period.
B. Amounts recognized in other comprehensive income in relation to the financial assets at fair
value through other comprehensive income are listed below:
Three months ended September 30,
2021 2020
Financial assets at fair value through other
comprehensive income
Foreign unlisted stocks ( $ 16,941 ) $ 51,014
Nine months ended September 30,
2021 2020
Financial assets at fair value through other
comprehensive income
Foreign unlisted stocks ( $ 403 ) $ 96,195

~18~
C. No financial assets at fair value through other comprehensive income were pledged to others.
D. Information about fair value measurement is provided in Note 12(3).
(7) Investments accounted for using equity method
Associates
September 30,
2021
December 31,
2020
September 30,
2020
JMC ELECTRONICS CO., LTD. (“JMC”) $ 283,584 $ 250,769 $ 229,371
Unimos Microelectronics (Shanghai) Co., Ltd.
(“Unimos Shanghai”)
3,228,628
3,020,908
3,053,322
$ 3,512,212 $ 3,271,677 $ 3,282,693
A. The basic information and summarized financial information of the associates that are material
to the Group are as follows:
(a) Basic information
Company
name
Principal place
of business
Shareholding ratio Nature of
relationship
Method of
measurement
September 30,
2021
December 31,
2020
September 30,
2020 Unimos
Shanghai People’s Republic
of China (“P.R.C.”) 45.02% 45.02% 45.02% Strategic
Investee Equity method
(b) Summarized financial information
Balance sheets
Unimos Shanghai
September 30,
2021
December 31,
2020
September 30,
2020
Current assets $ 2,416,774 $ 2,438,725 $ 2,711,308
Non-current assets 4,481,708 3,905,089 3,485,965
Current liabilities ( 626,124 ) ( 618,949 ) ( 522,807 )
Non-current liabilities ( 249,707 ) ( 248,583 ) ( 155,037 )
Total net assets $ 6,022,651 $ 5,476,282 $ 5,519,429
Share in associate’s net assets $ 2,711,650 $ 2,465,651 $ 2,485,078
Depreciable assets 494,860 533,139 546,126
Goodwill 22,118 22,118 22,118
Carrying amount of the associate $ 3,228,628 $ 3,020,908 $ 3,053,322
Statements of comprehensive income
Unimos Shanghai
Three months ended September 30,
2021 2020
Revenue $ 1,110,170 $ 393,946
Profit (loss) for the period from continuing operations $ 349,374 ( $ 80,675 )
Other comprehensive income, net of income tax - -
Total comprehensive income (loss) $ 349,374 ( $ 80,675 )
Dividends received from the associate $ - $ -

~19~
Statements of comprehensive income
Unimos Shanghai
Nine months ended September 30,
2021 2020
Revenue $ 2,557,403 $ 1,238,431
Profit (loss) for the period from continuing operations $ 641,256 ( $ 67,075 )
Other comprehensive income, net of income tax - -
Total comprehensive income (loss) $ 641,256 ( $ 67,075 )
Dividends received from the associate $ - $ -
B. The carrying amount of the Group’s interests in all individually immaterial associates and the
Group’s share of the operating results are summarized below:
As of September 30, 2021, December 31, 2020 and September 30, 2020, the carrying amount of
the Group’s individually immaterial associates amounted to $283,584, $250,769 and $229,371,
respectively.
Three months ended September 30,
2021 2020
Profit for the period from continuing operations $ 12,810 $ 5,946
Other comprehensive income, net of income tax 8,465 4,433
Total comprehensive income $ 21,275 $ 10,379
Nine months ended September 30,
2021 2020
Profit for the period from continuing operations $ 28,204 $ 13,389
Other comprehensive income, net of income tax 17,061 3,189
Total comprehensive income $ 45,265 $ 16,578
C. JMC has quoted market prices. As of September 30, 2021, December 31, 2020 and September
30, 2020, the fair value was $489,700, $454,010 and $395,495, respectively.

~20~
(8) Property, plant and equipment 2021
Land Buildings
Machinery
and equipment Tools Others
Construction in progress and
equipment
to be inspected Total
January 1 Cost $ 452,738 $ 11,212,129 $ 53,246,474 $ 5,451,547 $ 2,185,299 $ 639,607 $ 73,187,794
Accumulated
depreciation and
impairment - ( 7,119,843) ( 41,898,177 ) ( 4,499,186) ( 1,675,902 ) - ( 55,193,108 )
$ 452,738 $ 4,092,286 $ 11,348,297 $ 952,361 $ 509,397 $ 639,607 $ 17,994,686
January 1 $ 452,738 $ 4,092,286 $ 11,348,297 $ 952,361 $ 509,397 $ 639,607 $ 17,994,686
Additions - 1,046 8,392 406 76 3,857,436 3,867,356
Disposals - - ( 66,854 ) ( 9,502) - - ( 76,356 )
Reclassifications - 428,128 2,584,738 492,384 153,524 ( 3,658,774) -
Depreciation expenses - ( 314,368) ( 2,178,309 ) ( 600,963) ( 178,619 ) - ( 3,272,259 )
Exchange adjustment - - ( 9 ) - ( 3 ) - ( 12 )
September 30 $ 452,738 $ 4,207,092 $ 11,696,255 $ 834,686 $ 484,375 $ 838,269 $ 18,513,415
September 30
Cost $ 452,738 $ 11,640,160 $ 54,944,768 $ 5,712,008 $ 2,314,105 $ 838,269 $ 75,902,048
Accumulated
depreciation and
impairment - ( 7,433,068) ( 43,248,513 ) ( 4,877,322) ( 1,829,730 ) - ( 57,388,633 ) $ 452,738 $ 4,207,092 $ 11,696,255 $ 834,686 $ 484,375 $ 838,269 $ 18,513,415
2020
Land Buildings
Machinery
and equipment Tools Others
Construction in progress and
equipment
to be inspected Total
January 1 Cost $ 452,738 $ 10,821,972 $ 51,244,512 $ 5,008,321 $ 1,937,755 $ 936,389 $ 70,401,687
Accumulated
depreciation and
impairment - ( 6,726,043) ( 40,081,391 ) ( 4,111,845) ( 1,502,964 ) - ( 52,422,243 )
$ 452,738 $ 4,095,929 $ 11,163,121 $ 896,476 $ 434,791 $ 936,389 $ 17,979,444
January 1 $ 452,738 $ 4,095,929 $ 11,163,121 $ 896,476 $ 434,791 $ 936,389 $ 17,979,444
Additions - 132,572 592,528 409,832 142,775 1,095,829 2,373,536
Disposals - - ( 77 ) ( 2,091) ( 484 ) - ( 2,652 )
Reclassifications - 154,650 1,115,476 144,941 97,205 ( 1,512,272) -
Depreciation expenses - ( 295,044) ( 2,056,390 ) ( 560,592) ( 161,489 ) - ( 3,073,515 )
Exchange adjustment - - ( 12 ) - ( 1 ) - ( 13 )
September 30 $ 452,738 $ 4,088,107 $ 10,814,646 $ 888,566 $ 512,797 $ 519,946 $ 17,276,800
September 30
Cost $ 452,738 $ 11,109,195 $ 52,588,997 $ 5,516,741 $ 2,160,241 $ 519,946 $ 72,347,858
Accumulated
depreciation and
impairment - ( 7,021,088) ( 41,774,351) ( 4,628,175) ( 1,647,444 ) - ( 55,071,058 ) $ 452,738 $ 4,088,107 $ 10,814,646 $ 888,566 $ 512,797 $ 519,946 $ 17,276,800

~21~
A. Amount of borrowing costs capitalized as part of property, plant and equipment and the range of
the interest rates for such capitalization are as follows:
Three months ended September 30,
2021 2020
Amount of interest capitalized $ 2,643 $ 1,889
Range of the interest rates for capitalization 1.1475% 1.5467%
Nine months ended September 30,
2021 2020
Amount of interest capitalized $ 8,638 $ 8,024
Range of the interest rates for capitalization 1.1475% 1.5467%
B. Information about the property, plant and equipment that were pledged to others as collaterals is
provided in Note 8.
(9) Leasing arrangements-lessee
A. The Group leases various assets, including land, buildings, machinery and equipment, and
others. Lease agreements are typically made for periods of 2 to 30 years. Lease terms are
negotiated on an individual basis and contain a wide range of different terms and conditions.
The lease agreements do not impose covenants, but leased assets may not be used as security for
borrowing purposes.
B. The carrying amount of right-of-use assets and the depreciation expenses are as follows:
September 30, 2021 December 31, 2020 September 30, 2020
Carrying amount Carrying amount Carrying amount
Land $ 621,579 $ 636,261 $ 641,344
Buildings 12,933 19,044 9,113
Machinery and equipment 446,647 203,249 79,995
Others 4,337 515 900
$ 1,085,496 $ 859,069 $ 731,352
Three months ended September 30,
2021 2020
Depreciation expenses Depreciation expenses
Land $ 5,121 $ 5,143
Buildings 1,953 1,942
Machinery and equipment 73,444 8,275
Others 419 387
$ 80,937 $ 15,747

~22~
Nine months ended September 30,
2021 2020
Depreciation expenses Depreciation expenses
Land $ 15,288 $ 15,855
Buildings 5,891 5,879
Machinery and equipment 184,652 19,309
Others 1,214 1,158
$ 207,045 $ 42,201
C. For the nine months ended September 30, 2021 and 2020, additions to right-of-use assets were
$433,692 and $125,767, respectively.
D. The information on profit or loss accounts relating to lease contracts is as follows: Three months ended September 30,
2021 2020
Items affecting profit or loss
Interest expense on lease liabilities $ 3,892 $ 3,249
Expense on short-term lease contracts 39,193 46,024
Nine months ended September 30,
2021 2020
Items affecting profit or loss
Interest expense on lease liabilities $ 11,568 $ 9,984
Expense on short-term lease contracts 111,515 161,904
E. For the nine months ended September 30, 2021 and 2020, the Group’s total cash outflow for
leases were $335,560 and $189,339, respectively.
(10) Short-term bank loans
Type of loans
September 30,
2021
December 31,
2020
September 30,
2020
Bank loans
Unsecured bank loans $ 1,207,201 $ - $ -
Interest rate range 0.64%~0.7775% - -
Unused credit lines of short-term bank loans
NT$ $ 2,814,798 $ 3,251,000 $ 3,150,200
US$ (in thousands) $ 68,862 $ 90,000 $ 90,000
~23~
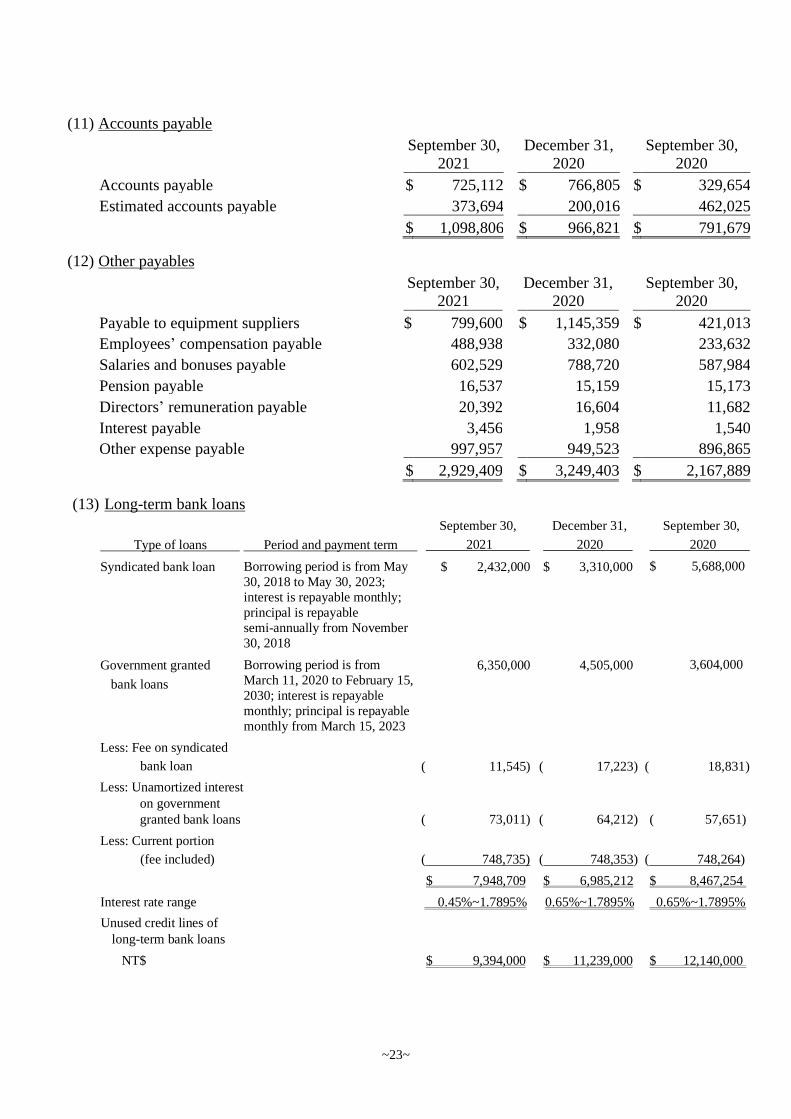
(11) Accounts payable
September 30,
2021
December 31,
2020
September 30,
2020
Accounts payable $ 725,112 $ 766,805 $ 329,654
Estimated accounts payable 373,694 200,016 462,025
$ 1,098,806 $ 966,821 $ 791,679
(12) Other payables
September 30,
2021
December 31,
2020
September 30,
2020
Payable to equipment suppliers $ 799,600 $ 1,145,359 $ 421,013
Employees’ compensation payable 488,938 332,080 233,632
Salaries and bonuses payable 602,529 788,720 587,984
Pension payable 16,537 15,159 15,173
Directors’ remuneration payable 20,392 16,604 11,682
Interest payable 3,456 1,958 1,540
Other expense payable 997,957 949,523 896,865
$ 2,929,409 $ 3,249,403 $ 2,167,889
(13) Long-term bank loans
Type of loans Period and payment term
September 30,
2021
December 31,
2020
September 30,
2020
Syndicated bank loan Borrowing period is from May
30, 2018 to May 30, 2023;
interest is repayable monthly;
principal is repayable
semi-annually from November
30, 2018
$ 2,432,000 $ 3,310,000 $ 5,688,000
Government granted
bank loans
Borrowing period is from
March 11, 2020 to February 15,
2030; interest is repayable
monthly; principal is repayable
monthly from March 15, 2023
6,350,000 4,505,000 3,604,000
Less: Fee on syndicated
bank loan ( 11,545) ( 17,223) ( 18,831 )
Less: Unamortized interest
on government
granted bank loans ( 73,011) ( 64,212) ( 57,651)
Less: Current portion
(fee included) ( 748,735) ( 748,353) ( 748,264)
$ 7,948,709 $ 6,985,212 $ 8,467,254
Interest rate range
0.45%~1.7895% 0.65%~1.7895% 0.65%~1.7895%
Unused credit lines of
long-term bank loans
NT$
$ 9,394,000 $ 11,239,000 $ 12,140,000

~24~
A. On January 1, 2019, Ministry of Economic Affairs, R.O.C. (“MOEA”) implemented the
“Action Plan for Welcoming Overseas Taiwanese Businesses to Return to Invest in Taiwan”
and companies are subsidized with preferential interest loans for qualified investment projects.
The Company has obtained the qualification from the MOEA, and signed loan agreements with
financial institutions during January and March 2020 with the line of credit amounted to
NT$12.144 billion and terms from seven to ten years. Funding from these loans was used to
invest in machineries, equipment and plant expansions and broaden the Company’s working
capital.
B. On May 15, 2018, the Company entered into a syndicated loan with eleven banks in Taiwan,
including Taiwan Cooperative Bank, in the amount of NT$12 billion with a term of five years.
Funding from this syndicated loan was used to repay the existing debt of financial institutions
and broaden the Company’s working capital. Pursuant to the syndicated loan agreement, the
Group is required to maintain certain financial ratios including current ratio, interest protection
multiples and debt to equity ratio during the loan periods.
C. Information about the items that are pledged to others as collaterals for long-term bank loans is
provided in Note 8.
(14) Pensions
A. Defined Benefit Plans
(a) The Company has a defined benefit pension plan in accordance with the Labor Standards Act,
covering all regular employees’ service years prior to the enforcement of the Labor Pension
Act on July 1, 2005 and service years thereafter of employees who chose to continue to be
subject to the pension mechanism under the Labor Standards Act. Under the defined benefit
pension plan, two units are accrued for each year of service for the first 15 years and one unit
for each additional year thereafter, subject to a maximum of 45 units. Pension benefits are
based on the number of units accrued and the average monthly salaries and wages of the last
6 months prior to retirement. The Company contributes monthly an amount equal to 2% of
the employees’ monthly salaries and wages to the pension fund deposited with the Bank of
Taiwan, the trustee, under the name of the independent pension fund committee. Also, the
Company would assess the balance in the aforementioned labor pension reserve account by
the end of every year. If the account balance is insufficient to pay the pension calculated by
the aforementioned method, to the employees expected to be qualified for retirement next
year, the Company will make contributions to cover the deficit by March of following year.
(b) For the aforementioned pension plan, the Company recognized pension costs of $682,
$1,232, $2,046 and $3,695 for the three months and nine months ended September 30, 2021
and 2020, respectively.

~25~
B. Defined Contribution Plans
Effective from July 1, 2005, the Company established a defined contribution pension plan
(“New Plan”) under the Labor Pension Act, covering all regular employees with Republic of
China (“R.O.C.”) nationality. Under the New Plan, the Company contributes monthly an
amount based on 6% of the employees’ monthly salaries and wages to the employees’ individual
pension accounts at the Bureau of Labor Insurance. The benefits accrued are paid monthly or in
lump sum upon termination of employment. The pension costs under defined contribution
pension plans of the Company for the three months and nine months ended September 30, 2021
and 2020 were $50,175, $46,368, $147,106 and $138,892, respectively.
(15) Capital stock
A. As of September 30, 2021, the Company’s authorized capital was $9,700,000, consisting of
970,000 thousand ordinary shares, and the paid-in capital was $7,272,401 with a par value of
$10 (in dollars) per share, consisting of 727,240 thousand ordinary shares. All proceeds from
shares issued have been collected.
B. As of September 30, 2021, the outstanding ADSs were approximately 4,353,263 units
representing 87,065 thousand ordinary shares and each ADS represents 20 ordinary shares of the
Company. The major terms and conditions of the ADSs are summarized as follows:
(a) Voting rights:
ADS holders have no right to directly vote in shareholders’ meetings with respect to the
deposited shares. The depository bank shall vote on behalf of ADS holders or provide voting
instruction to the designated person of the Company. The depository bank shall vote in the
manner as instructed by ADS holders.
(b) Distribution of dividends:
ADS holders are deemed to have the same rights as holders of ordinary shares with respect
to the distribution of dividends.
C. The number of the Company’s ordinary shares outstanding as of January 1 and September 30 of
2021 and 2020 were all 727,240 thousand shares, respectively.
(16) Capital surplus
Pursuant to the R.O.C. Company Act, any capital surplus arising from paid-in capital in excess of par
value on issuance of ordinary shares and donations can be used to cover accumulated deficits or to
issue new shares or cash to shareholders in proportion to their share ownership, provided that the
Company has no accumulated deficits. Furthermore, the R.O.C. Securities and Exchange Act
requires that the amount of capital surplus to be capitalized mentioned above may not exceed 10% of
the paid-in capital each year. The capital surplus may not be used to cover accumulated deficits
unless the legal reserve is insufficient.

~26~
2021
Share
Employee
restricted Long-term premium shares investment Total
January 1 $ 6,043,483 $ - $ 16,168 $ 6,059,651
September 30 $6,043,483 $ - $ 16,168 $ 6,059,651
2020
Share
Employee
restricted Long-term premium shares investment Total
January 1 $ 5,674,242 $ 369,241 $ 16,168 $ 6,059,651
Reclassifications 369,241 ( 369,241) - -
September 30 $6,043,483 $ - $ 16,168 $ 6,059,651
(17) Retained earnings
A. Under the Company’s Articles of Incorporation, the current year’s earnings, if any, shall first be
used to pay all taxes and offset prior years’ operating losses and then 10% of the remaining
amount shall be set aside as a legal reserve. The Company may then appropriate or reverse a
certain amount as special reserve according to the relevant regulations. After the distribution of
earnings, the remaining earnings and prior years’ unappropriated retained earnings may be
appropriated according to a proposal by the Board of Directors and approved in the shareholders’
meeting.
B. The Company’s dividend policy is summarized here. As the Company operates in a volatile
business environment, the issuance of dividends to be distributed takes into consideration the
Company’s financial structure, operating results and future expansion plans. The earnings
distribution of the Company may be made by way of cash dividends or stock dividends, provided
that cash dividends account for at least 10% of the total dividends distributed. The earnings
distribution will be proposed by the Board of Directors and approved at the shareholders’
meeting.
C. Except for covering accumulated deficits or issuing new shares or cash to shareholders in
proportion to their share ownership, the legal reserve may not be used for any other purpose. The
use of the legal reserve for the issuance of shares or cash to shareholders in proportion to their
share ownership is permitted, provided that the distribution of the reserve is limited to the portion
in excess of 25% of the Company’s paid-in capital.
D. In accordance with the regulations, the Company must set aside a special reserve from the debit
balance on other equity items at the balance sheet date before distributing earnings. When the
debit balance on other equity items is reversed subsequently, the reversed amount may be
included in the distributable earnings.

~27~
E. The appropriations of 2020 and 2019 earnings were resolved in the shareholders’ meeting held
on July 12, 2021 and June 9, 2020, respectively. The appropriations and dividends per share are
as follows:
2020 2019
Cash
distribution
Cash
distribution
per share per share Amount (in dollars) Amount (in dollars)
Legal reserve $ 232,611 $ 258,416
Special reserve ( 19,802) 19,802
Cash dividend 1,599,928 $ 2.20 1,309,032 $ 1.80
(18) Other equity interest 2021
Financial statements
translation differences of
Unrealized gain (loss) on
valuation of financial
assets at fair value
through other
comprehensive foreign operations income Total
January 1 ($ 61,330) $ 204,964 $ 143,634
Currency translation differences
- The Company ( 47,997) - ( 47,997)
Evaluation adjustment
- The Company - ( 403) ( 403)
- Associates - 9,237 9,237
Evaluation adjustment related tax
- The Company - 80 80
September 30 ($ 109,327 ) $ 213,878 $ 104,551
2020
Financial statements
translation differences of
Unrealized gain (loss) on
valuation of financial
assets at fair value through other
comprehensive foreign operations income Total
January 1 ($ 89,682) $ 69,880 ($ 19,802)
Currency translation differences
- The Company ( 28,327) - ( 28,327)
Evaluation adjustment
- The Company - 96,195 96,195
- Associates - 3,009 3,009
Evaluation adjustment related tax
- The Company - ( 19,240) ( 19,240)
September 30 ($ 118,009) $ 149,844 ($ 31,835

~28~
(19) Revenue
Three months ended September 30,
2021 2020
Revenue from contracts with customers $ 7,161,039 $ 5,686,127
Nine months ended September 30,
2021 2020
Revenue from contracts with customers $ 20,608,620 $ 16,701,062
A. The Group is primarily engaged in the assembly and testing services on high-integration and
high-precision integrated circuits, and recognized revenue based on the progress towards
completion of performance obligation during the service period. Information on revenue
disaggregation is provided in Note 14.
B. Contract assets and liabilities
The Group has recognized the following contract assets and liabilities in relation to revenue
from contracts with customers:
September 30,
2021
December 31,
2020
September 30,
2020
January 1,
2020
Contract assets $ 361,287 $ 389,016 $ 352,461 $ 377,869
Contract liabilities
(Advance payments) $ - $ - $ - $ 1,231
C. The information relating to loss allowance for contract assets is provided in Note 12(2).
D. Revenue recognized for the nine months ended September 30, 2021 and 2020, amounted to $0
and $565, respectively, was related to carried forward contract liabilities for performance
obligations not satisfied in prior year.
E. All of the service contracts are for periods of one year or less. As permitted under IFRS 15,
“Revenue from Contracts with Customers”, the transaction price allocated to these unsatisfied
contracts is not disclosed.
(20) Other income (expenses), net
Three months ended September 30,
2021 2020
Gain on disposal of scrapped materials $ 12,380 $ 9,815
Royalty income 166 -
Gain on disposal of items purchased on behalf of others 4,472 5,917
Gain on disposal of property, plant and equipment 8,269 669
Others 7,457 4
$ 32,744 $ 16,405

~29~
Nine months ended September 30,
2021 2020
Gain on disposal of scrapped materials $ 33,334 $ 29,459
Royalty income 768 2,962
Gain on disposal of items purchased on behalf of others 9,628 27,871
Gain on disposal of property, plant and equipment 32,435 44,324
Others 15,653 14
$ 91,818 $ 104,630
(21) Interest income
Three months ended September 30,
2021 2020
Bank deposits $ 2,202 $ 2,686
Financial assets at amortized cost 308 595
$ 2,510 $ 3,281
Nine months ended September 30,
2021 2020
Bank deposits $ 5,623 $ 22,867
Financial assets at amortized cost 1,002 1,873
Other interest income 5 -
$ 6,630 $ 24,740
(22) Other income
Three months ended September 30,
2021 2020
Rental income $ 3,891 $ 2,575
Grant income 3,118 2,369
Dividend income 3,658 1,911
$ 10,667 $ 6,855
Nine months ended September 30,
2021 2020
Rental income $ 10,820 $ 7,809
Grant income 8,795 5,080
Dividend income 3,658 1,911
$ 23,273 $ 14,800
~30~
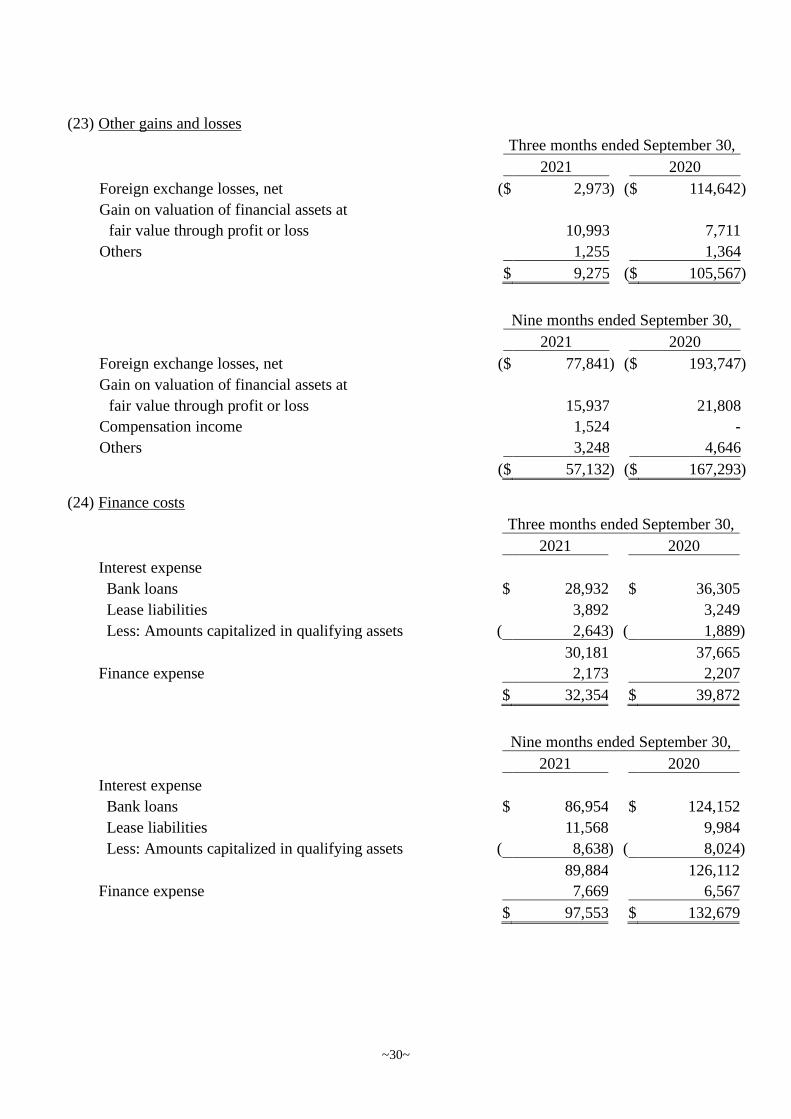
(23) Other gains and losses
Three months ended September 30,
2021 2020
Foreign exchange losses, net ( $ 2,973 ) ( $ 114,642 )
Gain on valuation of financial assets at
fair value through profit or loss
10,993 7,711
Others 1,255 1,364
$ 9,275 ( $ 105,567 )
Nine months ended September 30,
2021 2020
Foreign exchange losses, net ( $ 77,841 ) ( $ 193,747 )
Gain on valuation of financial assets at
fair value through profit or loss
15,937
21,808
Compensation income 1,524 -
Others 3,248 4,646
( $ 57,132 ) ( $ 167,293 )
(24) Finance costs
Three months ended September 30,
2021 2020
Interest expense
Bank loans $ 28,932 $ 36,305
Lease liabilities 3,892 3,249
Less: Amounts capitalized in qualifying assets ( 2,643 ) ( 1,889 )
30,181 37,665
Finance expense 2,173 2,207
$ 32,354 $ 39,872
Nine months ended September 30,
2021 2020
Interest expense
Bank loans $ 86,954 $ 124,152
Lease liabilities 11,568 9,984
Less: Amounts capitalized in qualifying assets ( 8,638 ) ( 8,024 )
89,884 126,112
Finance expense 7,669 6,567
$ 97,553 $ 132,679

~31~
(25) Expenses by nature
Three months ended September 30,
2021 2020
Raw materials and supplies used $ 1,385,624 $ 1,243,725
Employee benefit expenses 1,751,283 1,458,934
Depreciation expenses 1,196,076 1,063,102
Others 1,333,295 1,219,127
$ 5,666,278 $ 4,984,888
(26) Employee benefit expenses
Three months ended September 30,
2021 2020
Salaries $ 1,464,378 $ 1,195,150
Directors’ remuneration 9,698 5,844
Labor and health insurance 109,041 98,067
Pension 50,857 47,600
Other personnel expenses 117,309 112,273
$ 1,751,283 $ 1,458,934
Nine months ended September 30,
2021 2020
Salaries $ 4,191,014 $ 3,696,392
Directors’ remuneration 30,521 20,352
Labor and health insurance 316,917 303,063
Pension 149,152 142,587
Other personnel expenses 348,590 342,114
$ 5,036,194 $ 4,504,508
A. In accordance with the Company’s Articles of Incorporation, employees’ compensation is based
on the current year’s earnings, which should first be used to cover accumulated deficits, if any,
and then 10% of the remaining balance distributed as employees’ compensation, including
distributions to certain qualifying employees in affiliate companies, and no more than 0.5% as
directors’ remuneration. Subject to the Board of Directors’ approval, employees’ compensation
may be made by way of cash or share issuance. Distribution of employees’ compensation and
directors’ remuneration shall be presented and reported in the subsequent shareholders’ meeting.
Nine months ended September 30,
2021 2020
Raw materials and supplies used $ 4,172,582 $ 3,294,419
Employee benefit expenses 5,036,194 4,504,508
Depreciation expenses 3,479,304 3,115,716
Others 3,785,472 3,484,098
$ 16,473,552 $ 14,398,741
~32~
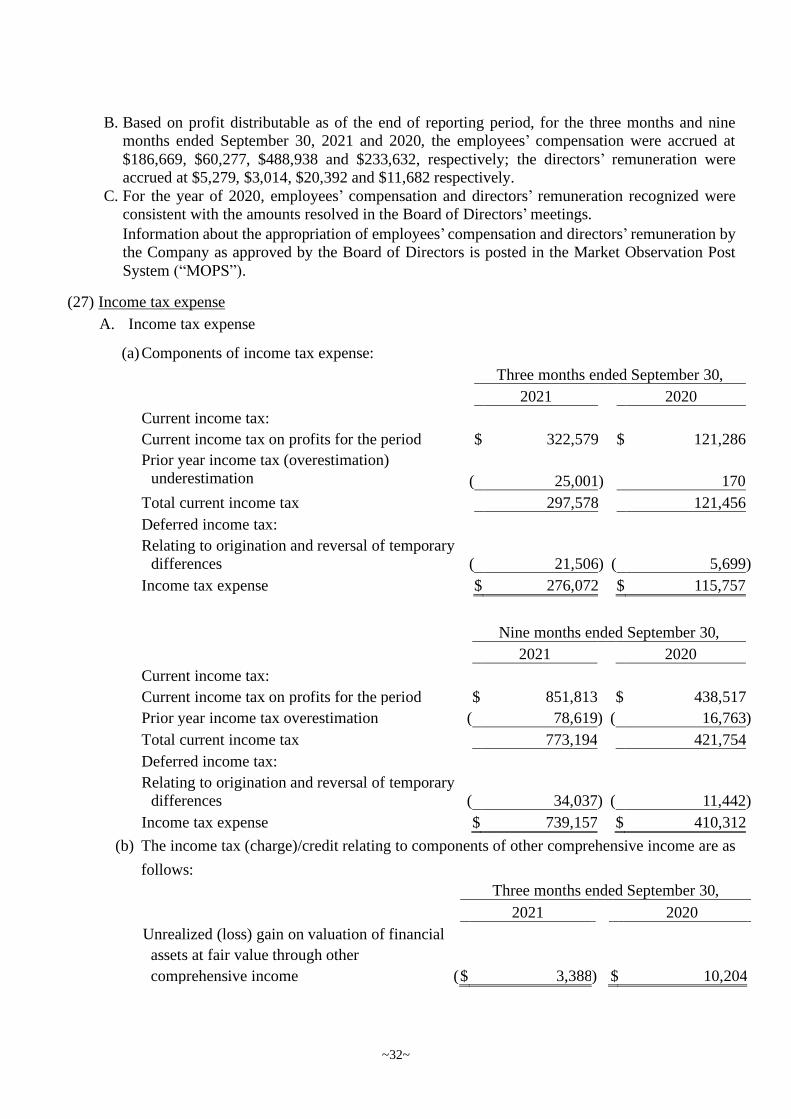
B. Based on profit distributable as of the end of reporting period, for the three months and nine
months ended September 30, 2021 and 2020, the employees’ compensation were accrued at
$186,669, $60,277, $488,938 and $233,632, respectively; the directors’ remuneration were
accrued at $5,279, $3,014, $20,392 and $11,682 respectively.
C. For the year of 2020, employees’ compensation and directors’ remuneration recognized were
consistent with the amounts resolved in the Board of Directors’ meetings.
Information about the appropriation of employees’ compensation and directors’ remuneration by
the Company as approved by the Board of Directors is posted in the Market Observation Post
System (“MOPS”).
(27) Income tax expense
A. Income tax expense
(a) Components of income tax expense:
Three months ended September 30,
2021 2020
Current income tax:
Current income tax on profits for the period $ 322,579 $ 121,286
Prior year income tax (overestimation)
underestimation
(
25,001 )
170
Total current income tax 297,578 121,456
Deferred income tax:
Relating to origination and reversal of temporary
differences (
21,506 ) (
5,699 )
Income tax expense $ 276,072 $ 115,757
Nine months ended September 30,
2021 2020
Current income tax:
Current income tax on profits for the period $ 851,813 $ 438,517
Prior year income tax overestimation ( 78,619 ) ( 16,763 )
Total current income tax 773,194 421,754
Deferred income tax:
Relating to origination and reversal of temporary
differences (
34,037 ) (
11,442 )
Income tax expense $ 739,157 $ 410,312
(b) The income tax (charge)/credit relating to components of other comprehensive income are as
follows:
Three months ended September 30,
2021 2020
Unrealized (loss) gain on valuation of financial
assets at fair value through other
comprehensive income ( $ 3,388 ) $ 10,204

~33~
Nine months ended September 30,
2021 2020
Unrealized (loss) gain on valuation of financial
assets at fair value through other
comprehensive income ( $ 80 ) $ 19,240
B. The Company’s income tax returns through 2019 have been assessed and approved by the Tax
Authority.
C. On October 31, 2016, the Company merged with its former parent company, ChipMOS
TECHNOLOGIES (Bermuda) LTD. And as a result, the Company recognized its own shares
originally held by former parent company as treasury stock. Subsequently, the Company
deducted unappropriated retained earnings by $5,052,343 to reflect the loss due from the
cancellation of treasury stock. In January 2017, the Company has filed an application to the
National Taxation Bureau of the Northern Area, Ministry of Finance to apply the accumulated
deficit amount, as a deduction in the calculation of years 2016 and 2015 additional 10% tax on
unappropriated retained earnings. In April and June 2020, the Company received the Notice for
Assessment of Tax for the years 2016 and 2015 from the National Taxation Bureau of the
Northern Area, Ministry of Finance, and is entitled to tax refund amounted to $138,941.
(28) Earnings per share Three months ended September 30, 2021
Amount after
Weighted average
number of ordinary shares outstanding
Earnings per share
Basic earnings per share income tax (in thousands) (in dollars)
Profit attributable to equity holders of the Company $ 1,398,884 727,240 $ 1.93
Diluted earnings per share
Assumed conversion of all dilutive
potential ordinary shares:
Employees’ compensation 3,913
Profit attributable to equity holders of the
Company $ 1,398,884 731,153 $ 1.91
Three months ended September 30, 2020
Amount after
Weighted average
number of ordinary
shares outstanding
Earnings per
share Basic earnings per share income tax (in thousands) (in dollars)
Profit attributable to equity holders of the
Company $ 423,435 727,240 $ 0.58
Diluted earnings per share
Assumed conversion of all dilutive potential ordinary shares:
Employees’ compensation 2,111
Profit attributable to equity holders of the
Company $ 423,435 729,351 $ 0.58

~34~
Nine months ended September 30, 2021
Amount after
Weighted average
number of ordinary shares outstanding
Earnings per share
Basic earnings per share income tax (in thousands) (in dollars)
Profit attributable to equity holders of the Company $ 3,641,593 727,240 $ 5.01
Diluted earnings per share
Assumed conversion of all dilutive
potential ordinary shares:
Employees’ compensation 12,607
Profit attributable to equity holders of the
Company $ 3,641,593 739,847 $ 4.92
Nine months ended September 30, 2020
Amount after
Weighted average number of ordinary
shares outstanding
Earnings per
share
Basic earnings per share income tax (in thousands) (in dollars) Profit attributable to equity holders of the
Company $ 1,681,080 727,240 $ 2.31
Diluted earnings per share
Assumed conversion of all dilutive
potential ordinary shares:
Employees’ compensation 8,183
Profit attributable to equity holders of the
Company $ 1,681,080 735,423 $ 2.29
(29) Supplemental cash flow information
Partial cash paid for investing activities
Property, plant and equipment
Nine months ended September 30,
2021 2020
PurchPurchase of property, plant and equipment $ 3,867,356 $ 2,373,536
Add: Beginning balance of payable on equipment 1,145,359 972,770
Less: Ending balance of payable on equipment ( 799,600 ) ( 421,013 )
Less: Ending balance of payable on equipment
(Shown as “Other payables-related parties”)
(
968 )
-
Cash paid during the period $ 4,212,147 $ 2,925,293

~35~
(30) Changes in liabilities from financing activities 2021
Short-term
bank loans
Long-term
bank loans
(including
current portion)
Guarantee
deposits
Lease
liabilities
Total liabilities
from financing
activities
January 1 $ - $ 7,733,565 $ 21,670 $ 870,495 $ 8,625,730
Changes in cash flow
from financing
activities 1,207,201 943,837 ( 43) ( 214,956) 1,936,039
Adjustment of
right-of-use assets - - - 433,692 433,692
Amortization of loan
fees - 6,128 - - 6,128
Amortization of
interest expense - 13,914 - 11,568 25,482
September 30 $ 1,207,201 $ 8,697,444 $ 21,627 $ 1,100,799 $ 11,027,071
2020
Short-term
bank loans
Long-term
bank loans
(including
current portion)
Guarantee
deposits
Lease
liabilities
Total liabilities
from financing
activities
January 1 $ - $ 9,041,645 $ 1,095 $ 692,951 $ 9,735,691
Changes in cash flow
from financing
activities - 160,659 591 ( 48,131) 113,119
Adjustment of
right-of-use assets - - - 86,536 86,536
Amortization of loan
fees - 5,974 - - 5,974
Amortization of
interest expense - 7,240 - 9,984 17,224
September 30 $ - $ 9,215,518 $ 1,686 $ 741,340 $ 9,958,544
7. RELATED PARTY TRANSACTIONS
(1) Parent and ultimate controlling party
The Company has neither a parent company nor an ultimate controlling party. The transactions
between the Company and its subsidiaries were eliminated in the accompanying consolidated
financial statements and were not disclosed herein. The transactions between the Group and other
related parties are as follows.
(2) Names of related parties and relationship
Name Relationship
Unimos Shanghai Associate
JMC Associate

~36~
(3) Significant related party transactions
None.
(4) Key management personnel compensation
Three months ended September 30,
2021 2020
Salaries and other short-term employee benefits $ 50,748 $ 30,803
Post-employment compensation 573 574
$ 51,321 $ 31,377
Nine months ended September 30,
2021 2020
Salaries and other short-term employee benefits $ 197,945 $ 145,051
Post-employment compensation 1,643 3,400
$ 199,588 $ 148,451
8. PLEDGED ASSETS
Carrying amount
Assets Purpose September 30,
2021 December 31,
2020 September 30,
2020
Non-current financial assets at
amortized cost
Lease and bank loan
$ 45,339 $ 48,319 $ 55,325
Property, plant and equipment
- Land Bank loan 452,738 452,738 452,738
- Buildings Bank loan 4,207,092 4,092,287 4,088,107
- Machinery and equipment Bank loan 7,719,203 6,912,544 6,422,278
$ 12,424,372 $ 11,505,888 $ 11,018,448
9. SIGNIFICANT CONTINGENT LIABILITIES AND UNRECOGNIZED CONTRACT COMMITMENTS
(1) A letter of guarantee was issued by the financial institutions to the Customs Administration of the
Ministry of Finance for making payment of customs-duty deposits when importing. As of
September 30, 2021, December 31, 2020 and September 30, 2020, the amounts guaranteed by the
financial institutions were $216,700, $99,000 and $199,800, respectively.
(2) Capital expenditures that are contracted for, but not provided for, are as follows:
September 30,
2021
December 31,
2020
September 30,
2020
Property, plant and equipment $ 2,891,092 $ 2,331,041 $ 1,143,450
10. SIGNIFICANT DISASTER LOSS
None.
11. SIGNIFICANT EVENTS AFTER THE REPORTING PERIOD
None.

~37~
12. OTHERS
(1) Capital management
There was no significant change during the period. Please refer to Note 12 in the consolidated
financial statements for the year ended December 31, 2020.
(2) Financial instruments
A. Financial instruments by category
September 30,
2021 December 31,
2020 September 30,
2020
Financial assets
Financial assets at fair value through profit or loss Financial assets mandatorily measured at fair
value through profit or loss
$ 361,200 $ 63,488 $ 227,802
Financial assets at fair value through other
comprehensive income
Designation of equity instruments 261,604 262,007 218,003
Financial assets at amortized cost
Cash and cash equivalents 5,188,760 4,113,651 4,788,223 Financial assets at amortized cost 247,439 254,801 236,775
Notes receivable 1,051 599 559
Accounts receivable 6,169,900 5,364,156 4,637,088
Other receivables 61,930 51,436 27,742
Other receivables-related parties - - 17,000
Refundable deposits 20,758 21,186 21,150 $ 12,312,642 $ 10,131,324 $ 10,174,342
Financial liabilities Financial liabilities at amortized cost
Short-term bank loans $ 1,207,201 $ - $ -
Notes payable 93 2,899 26 Accounts payable 1,098,806 966,821 791,679
Other payables 2,929,409 3,249,403 2,167,889
Other payables-related parties 968 - -
Long-term bank loans (including current portion) 8,697,444 7,733,565 9,215,518
Lease liabilities (including current portion) 1,100,799 870,495 741,340
Guarantee deposits 21,627 21,670 1,686
$ 15,056,347 $ 12,844,853 $ 12,918,138
B. Risk management policies
There was no significant change during the period. Please refer to Note 12 in the consolidated
financial statements for the year ended December 31, 2020.
C. Significant financial risks and degrees of financial risks
Except for the items explained below, there was no significant change during the period. Please
refer to Note 12 in the consolidated financial statements for the year ended December 31, 2020.

~38~
(a) Market risk
Foreign exchange risk
i. The Group’s businesses involve some non-functional currency operations. The
information on assets and liabilities denominated in foreign currencies whose values
would be materially affected by the exchange rate fluctuations are as follows:
September 30, 2021 Foreign currency Carrying amount
(in thousands) Exchange rate (NTD)
(Foreign currency: functional
currency)
Financial assets
Monetary items
USD:NTD $ 170,450 27.8500 $ 4,747,033
JPY:NTD 155,445 0.2490 38,706
RMB:NTD 5,048 4.3050 21,732
Non-monetary items
JPY:NTD 1,050,619 0.2490 261,604
RMB:NTD 749,972 4.3050 3,228,628
Financial liabilities
Monetary items
USD:NTD $ 63,990 27.8500 $ 1,782,122
JPY:NTD 918,257 0.2490 228,646
December 31, 2020
Foreign currency Carrying amount
(in thousands) Exchange rate (NTD)
(Foreign currency: functional
currency) Financial assets
Monetary items $ 175,840 28.4800 $ 5,007,923
USD:NTD 137,635 0.2763 38,029
JPY:NTD 6,838 4.3770 29,930
RMB:NTD
Non-monetary items
JPY:NTD 948,270 0.2763 262,007
RMB:NTD 690,178 4.3770 3,020,908
Financial liabilities
Monetary items
USD:NTD $ 26,410 28.4800 $ 752,157
JPY:NTD 1,538,241 0.2763 425,016

~39~
September 30, 2020 Foreign currency Carrying amount
(in thousands) Exchange rate (NTD)
(Foreign currency: functional currency)
Financial assets
Monetary items $ 207,266 29.1000 $ 6,031,441
USD:NTD 210,400 0.2756 57,986
JPY:NTD 9,496 4.2690 40,538
RMB:NTD
Non-monetary items
JPY:NTD 791,012 0.2756 218,003
RMB:NTD 715,231 4.2690 3,053,322
Financial liabilities
Monetary items
USD:NTD $ 10,822 29.1000 $ 314,920
JPY:NTD 631,827 0.2756 174,132
ii. The total exchange losses, including realized and unrealized losses arising from
significant foreign exchange variations on monetary items held by the Group for the
three months and nine months ended September 30, 2021 and 2020, amounted to
$2,973, $114,642, $77,841, and $193,747, respectively.
iii. Analysis of foreign currency market risk arising from significant foreign exchange
variations:
Nine months ended September 30, 2021 Sensitivity analysis
Change in exchange Effect on
Effect on other comprehensive
rate profit (loss) income
Financial assets
Monetary items
USD:NTD 5% $ 237,352 $ -
JPY:NTD 5% 1,935 -
RMB:NTD 5% 1,087 -
Financial liabilities
Monetary items
USD:NTD 5% $ 89,106 $ -
JPY:NTD 5% 11,432 -

~40~
Nine months ended September 30, 2020 Sensitivity analysis
Change in
exchange Effect on
Effect on other
comprehensive
rate profit (loss) income
Financial assets
Monetary items
USD:NTD 5% $ 301,572 $ -
JPY:NTD 5% 2,899 -
RMB:NTD 5% 2,027 -
Financial liabilities
Monetary items
USD:NTD 5% $ 15,746 $ -
JPY:NTD 5% 8,707 -
Price risk
i. The Group’s financial instruments, which are exposed to price risk, are the financial
assets at fair value through profit or loss and financial assets at fair value through other
comprehensive income. To manage its price risk arising from investments in financial
instruments, the Group diversifies its portfolio. Diversification of the portfolio is in
accordance with the limits set by the Group.
ii. The Group invests in beneficiary certificates and listed stocks issued by the domestic
companies. The prices of equity securities would change due to change of the future
value of investee companies. For the nine months ended September 30, 2021 and 2020,
it is estimated that the prices of equity securities increase or decrease by 1%, with all
other variables held constant, would increase or decrease the Group’s profit before
income tax by $3,612 and $2,178, respectively.
iii. The Group’s investments in financial instruments comprise foreign unlisted stocks and
partnership. The prices of financial instruments would change due to different valuation
models and assumptions used. Analysis related to the effect on profit or other
comprehensive income if these assumptions change is provided in Note 12(3)G.
Interest rate risk on cash flow and fair value
i. Interest rate risk is the risk that the fair value or future cash flows of a financial
instrument will fluctuate because of changes in market interest rates. The Group’s
exposure to the risk of changes in market interest rates relates primarily to the Group’s
bank loans with floating interest rates. The Group manages its interest rate risk by
having a balanced portfolio of fixed and variable rate bank loans. The Group reassesses
the hedge management periodically to make sure it complies with the cost
effectiveness.

~41~
ii. The sensitivity analysis depends on the exposure of interest rate risk at the end of the
reporting period.
iii. Analysis of debt with floating interest rates is based on the assumption that the
outstanding debt at the end of the reporting period is outstanding throughout the period.
The degree of variation the Group used to report to internal management is increase or
decrease of 1% in interest rates which is assessed as the reasonable degree of variation
by the management.
iv. For the nine months ended September 30, 2021 and 2020, it is estimated that a general
increase or decrease of 1% in interest rates, with all other variables held constant,
would decrease or increase the Group’s profit before income tax approximately by
$74,919 and $69,690, respectively, mainly due to the Group’s floating rate on bank
loans.
(b) Credit risk
i. Credit risk is the risk that a counterparty will not meet its obligations under a financial
instrument or customer contract, leading to a financial loss, mainly resulted from its
operating activities (primarily notes and accounts receivable) and from its financing
activities (primarily deposits with banks and financial instruments). The Group is
exposed to credit risk arising from the carrying amount of the financial assets
recognized in the consolidated balance sheet.
ii. Each business unit performs ongoing credit evaluations of its debtors’ financial
conditions according to the Group’s established policies, procedures and controls
relating to customer credit risk management. The Group maintains an account for loss
allowance based upon the available facts and circumstances, history of collection and
write-off experiences of all trade and other receivables which consequently minimize
the Group’s exposure to bad debts.
iii. Credit risk from balances with banks and financial institutions is managed by the
Group’s finance unit in accordance with the Group’s policies. Transaction counterparty
of the Group is determined through its internal controls policy. For banks and financial
institutions, only parties rated above BBB+ by Taiwan Ratings are accepted. The
probability of counterparty default is remote, so there is no significant credit risk.
iv. The Group adopts the assumptions under IFRS 9, “Financial Instruments” and the
default is deemed to have occurred when the contract payments are past due over 90
days.
v. The Group categorized contract assets, accounts receivable and other receivables by
characteristics of credit risk and applied the simplified approach using loss rate
methodology to estimate expected credit loss.
vi. The Group referred to the forecastability of business monitoring indicators published
by the National Development Council to adjust the loss rate which is based on
historical and current information when assessing the future default possibility of

~42~
contract assets, accounts receivable and other receivables. As of September 30, 2021,
December 31, 2020 and September 30, 2020, the loss rate methodologies are as
follows:
September 30, 2021
Contract
assets
Accounts receivable (including
related parties)
Other receivables (including
related parties) Expected loss rate 0.030% 0.030% 0.030% Total carrying amount $ 361,395 $ 6,171,752 $ 61,947 Loss allowance ( $ 108 ) ( $ 1,852 ) ( $ 17 )
December 31, 2020
Contract
assets
Accounts receivable (including
related parties)
Other receivables (including
related parties) Expected loss rate 0.030% 0.030% 0.030% Total carrying amount $ 389,133 $ 5,365,776 $ 51,446 Loss allowance ( $ 117 ) ( $ 1,620 ) ( $ 10 )
September 30, 2020
Contract
assets
Accounts receivable (including
related parties)
Other receivables (including
related parties) Expected loss rate 0.030% 0.030% 0.030% Total carrying amount $ 352,567 $ 4,638,490 $ 44,749 Loss allowance ( $ 106 ) ( $ 1,402 ) ( $ 7 )
vii. Under the simplified approach, movements in relation to loss allowance for contract assets, accounts receivable, and other receivables are as follows:
2021
Contract
assets
Accounts receivable (including
related parties)
Other receivables
(including related parties)
January 1 ( $ 117 ) ( $ 1,620 ) ( $ 10 ) Provision for impairment loss - ( 232 ) ( 7 ) Reversal of impairment loss 9 - - September 30 ( $ 108 ) ( $ 1,852 ) ( $ 17 )
2020
Contract
assets
Accounts receivable (including
related parties)
Other receivables
(including related parties)
January 1 ( $ 114 ) ( $ 1,351 ) ( $ 18 ) Provision for impairment loss - ( 51 ) - Reversal of impairment loss 8 - 11 September 30 ( $ 106 ) ( $ 1,402 ) ( $ 7 )

~43~
viii. The Group’s recorded financial assets at amortized cost include time deposits with
contract period over three months and restricted bank deposits. Because of the low
credit risk, expected credit losses for the period are measured through a loss allowance
at an amount equal to the 12-month expected credit losses. There is no significant
provision for the losses.
(c) Liquidity risk
i. The Group manages and maintains adequate cash and cash equivalents to finance the
Group’s operations, and minimize the impact from cash flow fluctuations. The Group
also monitors its debt financing plans to ensure it is in compliance with the financial
covenants required under its loan agreements.
ii. The primary source of liquidity for the Group is from bank loans. See Note 6(10)(13)
for details of the unused credit lines of the Group as of September 30, 2021, December
31, 2020 and September 30, 2020.
iii. The contractual undiscounted cash flows of notes payable, accounts payable (including
related parties) and other payables (including related parties) due within one year is
equivalent to its carrying amount. Except for the aforementioned, the table below
summarizes the maturity profile of the Group’s non-derivative financial liabilities based
on the earliest repayment dates and contractual undiscounted payments, including
principal and interest. The Group does not consider the probability of early repayments
requested by the banks. September 30, 2021
Non-derivative financial Within Over
liabilities 1 year 1 to 3 years 3 to 5 years 5 years Total
Short-term bank loans $ 1,210,242 $ - $ - $ - $ 1,210,242
Long-term bank loans ,832,522 3,803,968 3,112,939 1,244,908 8,994,337 Lease liabilities ,350,271 199,085 54,106 698,463 1,301,925
Guarantee deposits - - , - 21,627 21,627
$ 2,393,035 $ 4,003,053 $ 3,167,045 $ 1,964,998 $11,528,131
December 31, 2020
Non-derivative financial Within Over
liabilities 1 year 1 to 3 years 3 to 5 years 5 years Total Long-term bank loans $ 846,401 $ 3,558,597 $ 2,198,717 $ 1,487,808 $ 8,091,523 Lease liabilities 145,594 160,146 54,689 718,752 1,079,181 Guarantee deposits - - - 21,670 21,670 $ 991,995 $ 3,718,743 $ 2,253,406 $ 2,228,230 $ 9,192,374
September 30, 2020
Non-derivative financial Within Over
liabilities 1 year 1 to 3 years 3 to 5 years 5 years Total
Long-term bank loans $ 848,859 $ 5,422,586 $ 1,764,555 $ 1,616,642 $ 9,652,642
Lease liabilities 64,865 106,371 55,272 725,516 952,024
Guarantee deposits - - - 1,686 1,686
$ 913,724 $ 5,528,957 $ 1,819,827 $ 2,343,844 $ 10,606,352

~44~
The difference between the floating interest rates and estimated interest rates will affect
the non-derivative financial liabilities stated above.
(3) Fair value information
A. The different levels of inputs used in valuation techniques to measure fair value of financial
and non-financial instruments are defined as follows:
Level 1: Quoted prices (unadjusted) in active markets for identical assets or liabilities that can
be accessed at the measurement date. An active market is a market in which trading
for the asset or liability take place with sufficient frequency and volume to provide
pricing information on an ongoing basis.
Level 2: Inputs other than quoted prices from Level 1 that are observable information for the
asset or liability, either directly or indirectly.
Level 3: Unobservable inputs for the asset or liability. The fair value of the Group’s investment
in equity investment without active market is included in Level 3.
B. The carrying amounts of cash and cash equivalents, financial assets at amortized cost, contract
assets, notes receivable, accounts receivable (including related parties), other receivables,
(including related parties), refundable deposits, bank loans, contract liabilities, notes payable,
accounts payable (including related parties), other payables (including related parties), lease
liabilities and guarantee deposits are approximate to their fair values.
C. The related information of financial and non-financial instruments measured at fair value by
level based on the nature, characteristics and risks of the assets and liabilities are as follows:
(a) The related information of natures of the assets and liabilities are as follows:
September 30, 2021
Level 1 Level 2 Level 3 Total
Assets
Recurring fair value measurements
Financial assets at fair value through profit or loss
- Listed stocks $ 361,200 $ - $ - $ 361,200
Financial assets at fair value through other comprehensive income
- Foreign unlisted stocks - - 261,604 261,604
$ 361,200 $ - $ 261,604 $ 622,804

~45~
December 31, 2020
Level 1 Level 2 Level 3 Total
Assets
Recurring fair value measurements
Financial assets at fair value through profit
or loss
- Listed stocks $ 53,120 $ - $ - $ 53,120
- Foreign partnership interests - - 10,368 10,368
Financial assets at fair value through other
comprehensive income
- Foreign unlisted stocks - - 262,007 262,007
$ 53,120 $ - $ 272,375 $ 325,495
September 30, 2020
Level 1 Level 2 Level 3 Total
Assets
Recurring fair value measurements
Financial assets at fair value through profit or loss
- Beneficiary certificates $ 167,100 $ - $ - $ 167,100
- Listed stocks 50,720 - - 50,720
- Foreign partnership interests - - 9,982 9,982
Financial assets at fair value through other comprehensive income
- Foreign unlisted stocks - - 218,003 218,003
$ 217,820 $ - $ 227,985 $ 445,805
(b) The methods and assumptions the Group used to measure fair value are as follows:
i. The fair value of the Group’s listed stocks is measured by using the market quoted prices,
which is categorized within Level 1 fair value.
ii. Except for listed stocks with active markets, the fair value of the Group’s other financial
instruments is measured by using valuation techniques or by reference to counterparty
quotes. The fair value of financial instruments measured by using valuation techniques
can be referred to current fair value of instruments with similar terms and characteristics
in substance, discounted cash flow method or other valuation methods, including
calculated by applying model using market information available at the consolidated
balance sheet date.

~46~
iii. The Group’s financial instruments issued by foreign partnerships are measured by using
the discounted cash flow method, which derives present value estimates by discounting
expected future operating effectiveness and free cash flows projections.
iv. The Group’s financial instruments issued by foreign companies are measured by the
comparable company valuation (EV/EBITDA ratio and P/B ratio).
v. The Group takes into account adjustments for credit risks to measure the fair value of
financial and non-financial instruments to reflect credit risk of the counterparty and the
Group’s credit quality.
D. The following table shows the movements of Level 3 for the nine months ended September 30,
2021 and 2020: 2021
Debt
instruments
Equity
instruments Total
January 1 $ 10,368 $ 262,007 $ 272,375
Gains or losses recognized in profit or loss
Recorded as non-operating expenses ( 941 ) - ( 941)
Gains or losses recognized in other
comprehensive income
Recorded as unrealized losses on valuation
of financial assets at fair value through
other comprehensive income - ( ,403) ( 403)
Sold in the period ( 9,427 ) - ( 9,427)
September 30 $ - $ 261,604 $ 261,604
2020
Debt
instruments
Equity
instruments
Total
January 1 $ 11,038 $ 121,808 $ 132,846
Gains or losses recognized in profit or loss
Recorded as non-operating expenses ( 1,056) - ( 1,056)
Gains or losses recognized in other
comprehensive income
Recorded as unrealized gains on valuation
of financial assets at fair value through
other comprehensive income - 96,195 96,195
September 30 $ 9,982 $ 218,003 $ 227,985
E. The Group performs the fair value measurements being categorized within Level 3 with
assistance from specialist. Such assessment is to ensure the valuation results are reasonable by
applying independent information to make results close to current market conditions,
confirming the resource of information is independent, reliable and in line with other resources
and represented as the exercisable price, and frequently calibrating valuation model, updating

~47~
inputs used to the valuation model and making any other necessary adjustments to the fair
value.
F. The following is the qualitative information and sensitivity analysis of changes in significant
unobservable inputs under valuation model used in Level 3 fair value measurement:
Fair value as of
September 30,
2021
Valuation
technique
Significant
unobservable input
Range
(weighted
average
method)
Relationship of
inputs to fair value
Non-derivative equity
instrument:
Foreign unlisted
stocks
$ 261,604 Comparable
companies
Price to book ratio
multiple
2.98 The higher the
multiple, the higher the
fair value
Enterprise value to
EBITDA multiple
9.29 The higher the
multiple, the higher the
fair value
Discount for lack of
marketability
15.80% The higher the
discount for lack of
marketability, the lower the fair value
Fair value as of
December 31,
2020
Valuation
technique
Significant
unobservable input
Range
(weighted
average
method)
Relationship of
inputs to fair value
Non-derivative debt
instrument:
Foreign partnership
interests
$ 10,368 Discounted
cash flow
Discount rate 0.30% The lower the discount
rate, the higher the fair
value
Non-derivative equity
instrument:
Foreign unlisted
stocks
262,007 Comparable
companies
Price to book ratio
multiple
1.97 The higher the
multiple, the higher the
fair value
Enterprise value to
EBITDA multiple
12.00 The higher the
multiple, the higher the
fair value
Discount for lack of
marketability
15.80% The higher the
discount for lack of
marketability, the lower
the fair value

~48~
Fair value as of
September 30,
2020
Valuation
technique
Significant
unobservable input
Range
(weighted
average
method)
Relationship of
inputs to fair value
Non-derivative debt
instrument:
Foreign partnership
interests
$ 9,982 Discounted
cash flow
Discount rate 0.30% The lower the discount
rate, the higher the fair
value
Non-derivative equity
instrument:
Foreign unlisted
stocks
218,003 Comparable
companies
Price to book ratio
multiple
1.74 The higher the
multiple, the higher the
fair value
Enterprise value to
EBITDA multiple
10.54 The higher the
multiple, the higher the
fair value
Discount for lack of
marketability
15.80% The higher the
discount for lack of
marketability, the lower
the fair value
G. The Group has carefully assessed the valuation models and assumptions used to measure fair
value. However, use of different valuation models or assumptions may result in different
measurement. The following is the effect of profit or loss or of other comprehensive income
from financial assets categorized within Level 3 if the inputs used to valuation models have
changed:
September 30, 2021
Recognized in
profit or loss
Recognized in other
comprehensive income
Input Change
Favorable
change
Unfavorable
change
Favorable
change
Unfavorable
change
Financial assets: Foreign unlisted stocks Price to book ratio
multiple ± 1% $ - $ - $ 48 $ 41
Enterprise value to
EBITDA multiple ± 1% - - 2,120 2,121
Discount for lack of
marketability ± 1% - -
3,123 3,116
$ - $ - $ 5,291 $ 5,278

~49~
September 30, 2020
Recognized in
profit or loss
Recognized in other
comprehensive income
Input Change
Favorable
change
Unfavorable
change
Favorable
change
Unfavorable
change
Financial assets:
Foreign partnership
interests Discount rate Note $ - $ - $ - $ -
Foreign unlisted stocks Price to book ratio
multiple ± 1% - - 38 38
Enterprise value to
EBITDA multiple ± 1% - -
1,748 1,748
Discount for lack of
marketability ± 1% - - 2,585 2,585
$ - $ - $ 4,371 $ 4,371
Note: Based on the Group’s assessment, change in input would not have significant impact on profit or loss or
other comprehensive income.
(4) Other matter
In response to the COVID-19 pandemic, besides complying with the reporting guidelines and
prevention management measures issued by the Taiwan Centers for Disease Control, the Group has
also drawn up an epidemic preparedness and contingency plan and set up a response team, taking
appropriate actions on pandemic protections as well as establishing epidemic prevention and
response mechanism based on the pandemic situation to ensure employees’ health and the normal
operation of production lines. Meanwhile, the Group maintains sufficient stock of main raw
materials required for production. To reduce the risk of raw materials disruption, the Group takes
the proper preventive plan based on the pandemic situation in the suppliers’ region, including
increase safety stock or establish a second supply source. In summary, the Group has
proactively adopted corresponding measures and continued to manage relevant matters. Based on
the Group’s assessment, the COVID-19 pandemic has no significant impact on the Group.
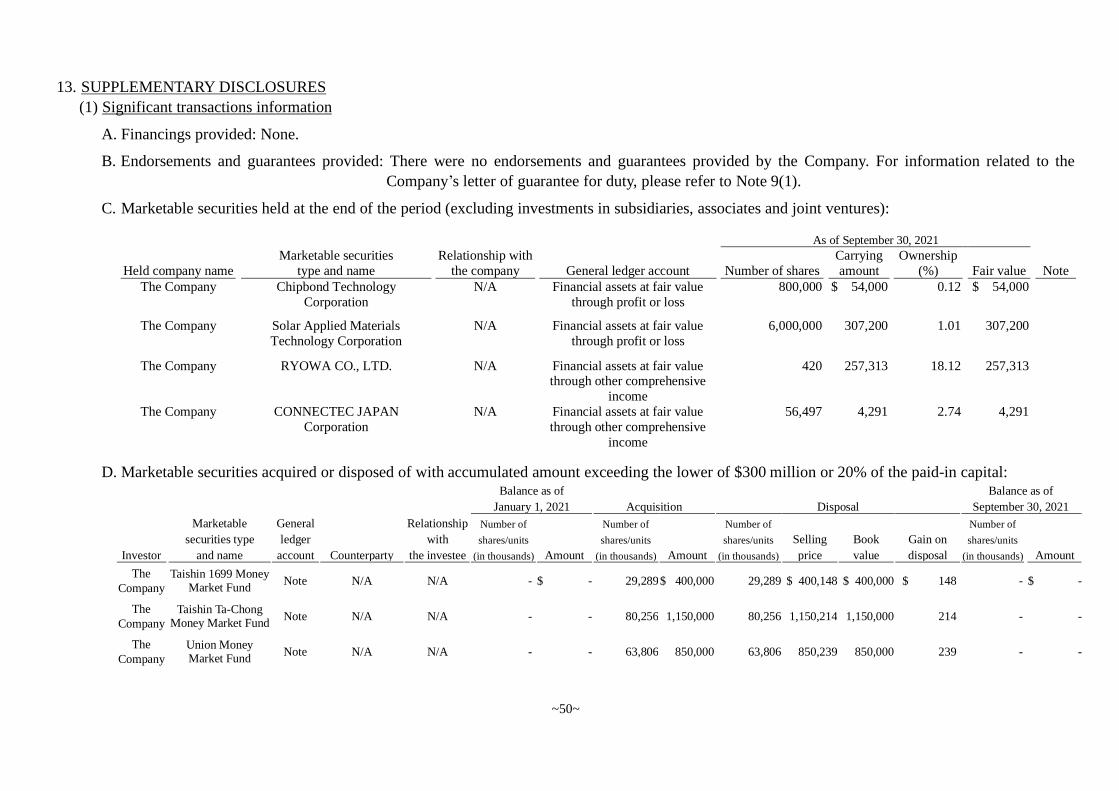
~50~
13. SUPPLEMENTARY DISCLOSURES
(1) Significant transactions information
A. Financings provided: None.
B. Endorsements and guarantees provided: There were no endorsements and guarantees provided by the Company. For information related to the
Company’s letter of guarantee for duty, please refer to Note 9(1).
C. Marketable securities held at the end of the period (excluding investments in subsidiaries, associates and joint ventures):
As of September 30, 2021
Held company name
Marketable securities
type and name
Relationship with
the company General ledger account Number of shares
Carrying
amount
Ownership
(%) Fair value Note
The Company Chipbond Technology
Corporation
N/A Financial assets at fair value
through profit or loss
800,000 $ 54,000 0.12 $ 54,000
The Company Solar Applied Materials
Technology Corporation
N/A Financial assets at fair value
through profit or loss
6,000,000 307,200 1.01 307,200
The Company RYOWA CO., LTD. N/A Financial assets at fair value through other comprehensive
income
420 257,313 18.12 257,313
The Company CONNECTEC JAPAN
Corporation
N/A Financial assets at fair value
through other comprehensive
income
56,497 4,291 2.74 4,291
D. Marketable securities acquired or disposed of with accumulated amount exceeding the lower of $300 million or 20% of the paid-in capital:
Balance as of
January 1, 2021 Acquisition
Disposal
Balance as of
September 30, 2021
Investor
Marketable
securities type
and name
General
ledger
account Counterparty
Relationship
with
the investee
Number of
shares/units
(in thousands) Amount
Number of
shares/units
(in thousands) Amount
Number of
shares/units
(in thousands)
Selling
price
Book
value
Gain on
disposal
Number of
shares/units
(in thousands) Amount
The
Company Taishin 1699 Money
Market Fund Note N/A N/A
-
$ - 29,289 $,, 400,000 29,289 $ 400,148 $ 400,000 $ 148 - $ -
The
Company
Taishin Ta-Chong Money Market Fund
Note N/A N/A
-
- 80,256 1,150,000 80,256 1,150,214 1,150,000 214 - -
The
Company
Union Money Market Fund
Note N/A N/A
-
- 63,806 850,000 63,806 850,239 850,000 239 - -

~51~
Balance as of
January 1, 2021 Acquisition Disposal Balance as of
September 30, 2021
Investor
Marketable
securities type
and name
General ledger
account Counterparty
Relationship
with
the investee
Number of
shares/units
(in thousands) Amount
Number of
shares/units
(in thousands) Amount
Number of
shares/units
(in thousands)
Selling
price
Book
value
Gain on
disposal
Number of
shares/units
(in thousands) Amount
The
Company
Fuh Hwa Money Market Fund
Note N/A N/A
- $ - 82,499 $1,200,000 82,499 $1,200,117 $1,200,000 $ 117 - $ -
The
Company
Cathay Taiwan Money Market Fund
Note N/A N/A
-
- 43,868 550,000 43,868 550,269 550,000 269 - -
The
Company
UPAMC James Bond Money Market
Fund Note N/A N/A
-
- 86,045 1,450,000 86,045 1,450,394 1,450,000 394 - -
The
Company Shin Kong Chi-Shin Money Market Fund
Note N/A N/A
-
- 44,816 700,000 44,816 700,216 700,000 216 - -
The
Company
FSITC Taiwan Money Market Fund
Note N/A N/A
-
- 27,829 430,000 27,829 430,093 430,000 93 - -
The
Company Prudential Financial Money Market Fund
Note N/A N/A
-
- 37,573 600,000 37,573 600,236 600,000 236 - -
The
Company
FSITC Money Market Fund
Note N/A N/A
-
- 1,944 350,000 1,944 350,039 350,000 39 - -
Note: Accounted for as “Financial assets at fair value through profit or loss”.
E. Acquisition of real estate properties with amount exceeding the lower of $300 million or 20% of the paid-in capital: None.
F. Disposal of real estate properties with amount exceeding the lower of $300 million or 20% of paid-in capital: None.
G. Purchases from or sales to related parties with amount exceeding the lower of $100 million or 20% of paid-in capital or more: None.
H. Receivables from related parties with amount exceeding the lower of $100 million or 20% of paid-in capital or more: None.
I. Trading in derivative instruments undertaken during the reporting periods: None.

~52~
J. Significant inter-company transactions during the reporting periods:
Transaction
Number Company name Counterparty Relationship General ledger account Amount
Transaction
terms
Percentage of
consolidated total revenues or total
assets (%)
0 The Company ChipMOS USA Note Service expense $ 25,362 - 0.12%
0 The Company ChipMOS Shanghai Note Service expense 7,916 - 0.04%
Note: Represents the transactions from parent company to subsidiary.
(2) Information on investees
Names, locations and related information of investees (excluding information on investments in the P.R.C.):
Original investment amount Shares held as of September 30, 2021
Net profit
of the investee for
the nine months
ended September
30, 2021
Investment income
recognized for the
nine months ended
September
30, 2021
Note Investor Investee Location Main business activities
Ending
balance
Beginning
balance
Number of
shares
Ownership
(%)
Carrying
amount
The Company ChipMOS USA San Jose, USA Marketing of semiconductors and
electronic related products $ 217,918 $ 217,918 3,550,000 100 $ ,223,368 $ 1,626 $ 1,626
The Company JMC Kaohsiung,
Taiwan
Manufacturing, processing and trading of
high-end flexible IC substrates for display
driver ICs
148,007 148,007 8,300,000 10 283,584 282,041 28,204
Note
The Company ChipMOS BVI British Virgin
Islands Holding company 3,087,825 3,087,825 2,413,992,975 100 3,254,837 243,043 243,043
Note: Company’s associate accounted for using equity method.

~53~
(3) Information on investments in the P.R.C.
A. Basic information:
Investee in
P.R.C.
Main business activities
Paid-in capital
Investment
method
Accumulated
amount of
remittance from
Taiwan to
P.R.C.as of
January 1, 2021
Amount remitted from Taiwan to
P.R.C./ Amount remitted back to
Taiwan for the nine months ended
September 30, 2021
Accumulated
amount
of remittance from
Taiwan to P.R.C. as
of September 30,
2021
Net income
of investee
for the nine
months ended
September 30,
2021
Ownership
(%) held
by the
Company
(directly
or
indirectly)
Investment
income
recognized
for the nine
months ended
September 30,
2021
Carrying
amount of
investments in
P.R.C. as of
September 30,
2021
Accumulated
amount
of investment
income
remitted back to
Taiwan through
September 30,
2021
Note
Remitted to
P.R.C.
Remitted back
to Taiwan
Unimos
Shanghai
Semiconductor
assembling and testing
services
$ 10,817,191
Note 1
$ 2,885,586
$ - $ -
$ 2,885,586
$ 641,256
45.02
$ 250,442
$ 3,228,628
$ -
Note 2
ChipMOS
Shanghai
Marketing of
semiconductors and
electronic related products
15,113
Note 1
15,113
- -
15,113
250
100.00
250
14,880
-
Note 2
Note 1: Through investing in an existing company (ChipMOS BVI) in the third area, which then invested in the investee in P.R.C.
Note 2: Recognized based on the financial statements that are reviewed by the Company’s independent accountants.
Company
name
Accumulated
amount of
remittance from
Taiwan to P.R.C.
as of September
30, 2021
Investment amount
approved by the
Investment
Commission of
MOEA
Limit on investments
in P.R.C. imposed by
the Investment
Commission of
MOEA
The Company $ 2,900,699
$ 2,900,699
$ 13,705,295
B. Significant transactions, either directly or indirectly through a third area, with investee companies in the P.R.C.: None.
(4) Major shareholders information
Major shareholder name Number of shares Ownership (%) Notes
First Bank in Its Capacity as Master Custodian for Custodial
Account of ChipMOS’ ADSs 87,065,274 11.97% Notes 1, 2
Siliconware Precision Industries Co., Ltd. 78,910,390 10.85% Note 1
Yann Yuan Investment Co., Ltd. 41,200,000 5.66% Note 1

~54~
Note 1: The information is calculated by the Taiwan Depository & Clearing Corporation, based on total number of ordinary shares and preferred shares that have completed the
dematerialized registration and delivery (including treasury shares) for shareholders who owns more than 5% of the Company on the last business day at the end of each quarter.
However, there may be differences due to basis of preparation between the share capital recorded in the company’s consolidated financial report and the number of shares which
the Company has completed the dematerialized registration and delivery.
Note 2: For shareholders who transfer shares into a trust, they are disclosed by the principal of individual account opened by the trustee. As for shareholders who declare insider equity
holding for more than 10% in accordance with the Securities and Exchange Act, their shareholdings include their personal shareholdings plus the shares transferred to a trust and
have the rights to make decisions on trust property. Please refer to the information on the MOPS for insider equity declaration.

~55~
14. SEGMENT INFORMATION
(1) General information
The Group engages mainly in the assembly and testing of semiconductors, memory modules and
general investments. In accordance with IFRS 8, “Operating Segments”, the Group’s segments
include Testing, Assembly, Testing and Assembly for LCD, OLED and other Display Panel Driver
Semiconductors (“LCDD”), Bumping and others as the five reportable segments.
(2) Measurement of segment information
The Group’s reportable segments are strategic business units which provide different products and
services. The accounting policies adopted by the operating segments are the same as the
accounting policies described in Note 4.
(3) Information about segment profit or loss
The segment information provided to the chief operating decision maker for the reportable
segments is as follows:
Nine months ended September 30, 2021
Testing Assembly LCDD Bumping Others Elimination Total Revenue:
External customers $ 4,428,285 $ 6,141,421 $ 6,079,385 $ 3,959,529 $ - $ - $ 20,608,620
Inter-segment - - - - 32,811 ( 32,811) -
Total revenue $ 4,428,285 $ 6,141,421 $ 6,079,385 $ 3,959,529 $ 32,811 ($ 32,811) $ 20,608,620
Operating profit (loss) $ 1,383,617 $ 780,912 $ 1,667,884 $ 399,082 ($ 4,628) $ 19 $ 4,226,886
Nine months ended September 30, 2020
Testing Assembly LCDD Bumping Others Elimination Total Revenue:
External customers $ 3,721,755 $ 4,350,542 $ 5,126,020 $ 3,502,745 $ - $ - $ 16,701,062
Inter-segment - - - - 29,664 ( 29,664 ) -
Total revenue $ 3,721,755 $ 4,350,542 $ 5,126,020 $ 3,502,745 $ 29,664 ($ 29,664 ) $ 16,701,062
Operating profit (loss) $ 969,923 ($ 9,359) $ 1,155,592 $ 297,903 ($ 7,042) ($ 66) $ 2,406,951
(4) Reconciliation for segment income (loss)
Revenue from external customers and segment income (loss) reported to the chief operating
decision maker are measured using the same method as for revenue and operating profit in the
financial statements. Thus, no reconciliation is needed.