Chinese Companies Listed on Major U.S. Stock Exchanges
12
Last updated: February 25, 2019 1 Chinese Companies Listed on Major U.S. Stock Exchanges Below is a complete list of all Chinese companies listed on the NASDAQ, New York Stock Exchange, and NYSE American, the three largest U.S. exchanges. As of February 25, 2019, there were 156 Chinese companies listed on these U.S. exchanges with a total market capitalization of $1.2 trillion. An asterisk next to the stock symbol indicates a company with at least 30 percent state ownership. As of February 25, 2019, there were at least 11 Chinese state-owned companies listed on the three major U.S. exchanges. A highlighted row indicates a company that was not included on the Public Company Accounting Oversight Board’s (PCAOB) September 2018 review of non-U.S. companies where the PCAOB is denied access to conduct inspections. The full PCAOB list can be found at https://pcaobus.org/International/Inspections/Pages/IssuerClientsWithoutAccess.aspx. Note on methodology: This list only accounts for U.S.-listed companies based in China. It does not account for all offshore Chinese companies in Hong Kong or elsewhere. The actual number of Chinese companies listed on these exchanges is higher. For some of the companies, information on their IPO year, IPO value, or underwriters was not available, in some cases due to reverse mergers or direct listings. This table is not a complete list of all Chinese companies listed on U.S. exchanges, but is a close approximation using information from three of the main U.S. exchanges. All data was pulled on February 25, 2019 from NASDAQ, “Companies in China.” https://www.nasdaq.com/screening/companies-by-region.aspx?region=Asia&country=China. Symbol Name Market Cap (US$ mil) IPO Year IPO Value (US$ mil) Sector Lead Underwriters 1. BABA Alibaba Group Holding Limited $458,609 2014 $21,767 Business Services Credit Suisse, Deutsche Bank, Goldman Sachs, JP Morgan Chase, Morgan Stanley, Citigroup 2. PTR* PetroChina Company Limited $123,612 2000 $680 Energy Blackrock, Inc., JP Morgan Chase, Citigroup, Goldman Sachs 3. SNP* China Petroleum & Chemical Corporation $104,618 2000 $3,500 Energy Morgan Stanley, China International Capital Corp (CICC) 4. LFC* China Life Insurance Company Limited $76,145 2003 $3,000 Finance CICC, Credit Suisse, Citigroup, Deutsche Bank 5. BIDU Baidu, Inc. $58,269 2005 $109 Technology Goldman Sachs, Piper Jaffray, Credit Suisse
Transcript of Chinese Companies Listed on Major U.S. Stock Exchanges

Last updated: February 25, 2019
1
Chinese Companies Listed on Major U.S. Stock Exchanges
Below is a complete list of all Chinese companies listed on the NASDAQ, New York Stock
Exchange, and NYSE American, the three largest U.S. exchanges. As of February 25, 2019, there
were 156 Chinese companies listed on these U.S. exchanges with a total market capitalization of
$1.2 trillion.
An asterisk next to the stock symbol indicates a company with at least 30 percent state ownership.
As of February 25, 2019, there were at least 11 Chinese state-owned companies listed on the three
major U.S. exchanges.
A highlighted row indicates a company that was not included on the Public Company Accounting
Oversight Board’s (PCAOB) September 2018 review of non-U.S. companies where the PCAOB
is denied access to conduct inspections. The full PCAOB list can be found at
https://pcaobus.org/International/Inspections/Pages/IssuerClientsWithoutAccess.aspx.
Note on methodology: This list only accounts for U.S.-listed companies based in China. It does not
account for all offshore Chinese companies in Hong Kong or elsewhere. The actual number of
Chinese companies listed on these exchanges is higher. For some of the companies, information on
their IPO year, IPO value, or underwriters was not available, in some cases due to reverse mergers
or direct listings. This table is not a complete list of all Chinese companies listed on U.S. exchanges,
but is a close approximation using information from three of the main U.S. exchanges. All data was
pulled on February 25, 2019 from NASDAQ, “Companies in China.”
https://www.nasdaq.com/screening/companies-by-region.aspx?region=Asia&country=China.
Symbol Name Market Cap
(US$ mil)
IPO Year
IPO Value (US$ mil)
Sector Lead Underwriters
1. BABA Alibaba Group Holding Limited
$458,609 2014 $21,767 Business Services
Credit Suisse, Deutsche Bank, Goldman Sachs, JP Morgan Chase, Morgan Stanley, Citigroup
2. PTR* PetroChina Company Limited
$123,612 2000 $680 Energy Blackrock, Inc., JP Morgan Chase, Citigroup, Goldman Sachs
3. SNP* China Petroleum &
Chemical Corporation
$104,618 2000 $3,500 Energy Morgan Stanley, China International Capital Corp (CICC)
4. LFC* China Life Insurance Company Limited
$76,145 2003 $3,000 Finance CICC, Credit Suisse, Citigroup, Deutsche Bank
5. BIDU Baidu, Inc. $58,269 2005 $109 Technology Goldman Sachs, Piper Jaffray, Credit Suisse

Last updated: February 25, 2019
2
Symbol Name Market Cap
(US$ mil)
IPO Year
IPO Value (US$ mil)
Sector Lead Underwriters
6. CHA* China Telecom Corp Ltd
$45,565 2002
Public Utilities JP Morgan Chase, Blackrock, Government of Singapore Investment Corporation
7. JD JD.com, Inc. $37,544 2014 $1,800 Consumer Services
Merrill Lynch, UBS
8. PDD Pinduoduo Inc. $32,727 2018 $1,626 Business Services
CICC, Credit Suisse, and Goldman Sachs
9. NTES NetEase, Inc. $29,240 2000
Business Services
Merrill Lynch and Deutsche Bank
10. IQ iQIYI, Inc. $20,046 2018 $2,250 Consumer Services
Goldman Sachs, Merrill Lynch, Credit Suisse
11. TAL TAL Education Group
$19,257 2010 $120 Consumer Services
Credit Suisse, Morgan Stanley
12. CTRP Ctrip.com International,
Ltd.
$17,733 2003 $76 Business Services
Merrill Lynch
13. ZTO ZTO Express (Cayman) Inc.
$15,436 2016 $1,406 Transportation Morgan Stanley, Goldman Sachs
14. WB Weibo Corporation
$15,249 2014 $286 Technology Credit Suisse, Goldman Sachs
15. EDU New Oriental Education & Technology Group, Inc.
$12,762 2006 $113 Consumer Services
Credit Suisse, Goldman Sachs
16. HTHT Huazhu Group Limited
$10,288 2010 $110 Consumer Services
Goldman Sachs, Morgan Stanley
17. CEA* China Eastern Airlines
Corporation Ltd.
$10,032 1997
Transportation Morgan Stanley
18. ZNH* China Southern Airlines
Company Limited
$9,924 1997
Transportation Goldman Sachs
19. HNP* Huaneng Power
International, Inc.
$9,858 1994
Public Utilities CICC, Goldman Sachs, Macquarie, Morgan Stanley

Last updated: February 25, 2019
3
Symbol Name Market Cap
(US$ mil)
IPO Year
IPO Value (US$ mil)
Sector Lead Underwriters
20. MOMO Momo Inc. $6,847 2014 $216 Technology Morgan Stanley, Credit Suisse, J.P. Morgan, China Renaissance Securities
21. ACH* Aluminum Corporation of China Limited
$5,884 2001
Basic Industries
JP Morgan Chase, Blackrock, Goldman Sachs, Templeton Asset Management, Capital Group
22. SHI* SINOPEC Shangai
Petrochemical Company, Ltd.
$5,451 1993
Basic Industries
Morgan Stanley, CICC
23. SMI* Semiconductor Manufacturing International Corporation
$5,423 2004 $1,712 Technology Credit Suisse and Deutsche Bank
24. SINA Sina Corporation
$4,689 2000
Technology Morgan Stanley, CICC
25. YY YY Inc. $4,662 2012 $82 Technology Citigroup, Deutsche Bank, Morgan Stanley
26. JOBS 51job, Inc. $4,425 2004 $74 Technology Morgan Stanley
27. VIPS Vipshop Holdings Limited
$4,402 2012 $72 Consumer Services
Goldman Sachs and Deutsche Bank
28. BILI Bilibili Inc. $3,762 2018 $483 Technology Merrill Lynch, JP Morgan Chase, Morgan Stanley
29. GDS GDS Holdings Limited
$3,666 2016 $193 Technology Credit Suisse, J.P. Morgan
30. QTT Qutoutiao Inc. $3,547 2018 $84 n/a Citigroup, Deutsche Bank
31. CBPO China Biologic Products
Holdings, Inc.
$3,180 2010 $152 Health Care Morgan Stanley
32. NOAH Noah Holdings Ltd.
$3,154 2010 $101 Finance Merrill Lynch, JP Morgan Chase
33. GSH* Guangshen Railway
Company Limited
$3,111 1996
Transportation JP Morgan Chase

Last updated: February 25, 2019
4
Symbol Name Market Cap
(US$ mil)
IPO Year
IPO Value (US$ mil)
Sector Lead Underwriters
34. QFIN 360 Finance, Inc.
$2,318 2018 $52 Finance AAMTD Global Markets Ltd, Citigroup Global Markets, Goldman Sachs, Haitong International Securities Co Ltd, Lighthouse Capital Inc.
35. BZUN Baozun Inc. $2,111 2015 $110 Consumer Services
Merrill Lynch, Credit Suisse, Morgan Stanley
36. QD Qudian Inc. $1,893 2017 $900 Finance Citigroup, CICC, Credit Suisse, Morgan Stanley, and UBS
37. LX LexinFintech Holdings Ltd.
$1,881 2017 $108 Finance Deutsche Bank, Goldman Sachs, Merrill Lynch, China Renaissance Securities
38. FANH Fanhua Inc. $1,683 2007 $188 Finance Morgan Stanley
39. ZLAB Zai Lab Limited $1,441 2017 $150 Health Care Citigroup, JP Morgan Chase, Leerink Partners
40. CSIQ Canadian Solar Inc.
$1,425 2006 $116 Technology Deutsche Bank, Lehman Brothers
41. UXIN Uxin Limited $1,408 2018 $225 Business Services
CICC, China Renaissance Securities, Goldman Sachs, JP Morgan Chase, Morgan Stanley
42. BEDU Bright Scholar Education Holdings Limited
$1,400 2017 $158 Consumer Services
Deutsche Bank, Morgan Stanley
43. BITA Bitauto Holdings Limited
$1,362 2010 $127 Technology Citigroup, UBS
44. HOLI Hollysys Automation
Technologies, Ltd.
$1,325
Energy JP Morgan Chase
45. CYOU Changyou.com Limited
$1,139 2009 $120 Technology Merrill Lynch, Credit Suisse
46. VNET 21Vianet Group, Inc.
$1,053 2011 $195 Technology Deutsche Bank, Goldman Sachs, Barclays
47. HMI Huami Corporation
$1,001 2018 $110 Technology China Renaissance Securities, Credit Suisse, Citigroup
48. JG Aurora Mobile Limited
$977 2018 $77 Technology Credit Suisse, Deutsche Bank, Goldman Sachs

Last updated: February 25, 2019
5
Symbol Name Market Cap
(US$ mil)
IPO Year
IPO Value (US$ mil)
Sector Lead Underwriters
49. YRD Yirendai Ltd. $852 2015 $75 Finance China Renaissance Securities, Credit Suisse, Morgan Stanley
50. EHIC eHi Car Services Limited
$839 2014 $120 Consumer Services
Deutsche Bank, Goldman Sachs, JP Morgan Chase
51. HLG Hailiang Education Group Inc.
$830 2015 $20 Consumer Services
Network 1 Financial Securities
52. JKS JinkoSolar Holding
Company Limited
$821 2010 $64 Technology Credit Suisse
53. SOHU Sohu.com Limited
$808 2000 $60 Technology Credit Suisse
54. VIOT Viomi Technology
Co., Ltd
$751 2018 $103 Consumer Durables
CICC, Morgan Stanley
55. SFUN Fang Holdings Limited
$657 2010 $125 Technology Deutsche Bank, Goldman Sachs
56. YI 111, Inc. $656 2018 $101 Health Care CICC, Citigroup, JP Morgan Chase
57. TOUR Tuniu Corporation
$646 2014 $72 Consumer Services
China Renaissance Securities, Credit Suisse, Morgan Stanley
58. REDU RISE Education Cayman Ltd
$594 2017 $160 Consumer Services
Credit Suisse, Morgan Stanley
59. NIU Niu Technologies
$564 2018 $63 Capital Goods Citigroup, Credit Suisse
60. DQ DAQO New Energy Corp.
$513 2010 $76 Technology Morgan Stanley
61. WINS Wins Finance Holdings Inc.
$510 2014
Finance Deutsche Bank, Goldman Sachs, JP Morgan Chase
62. TC TuanChe Limited
$499 2018 $20 Business Services
AMTD Global Markets, Maxim Group
63. YIN Yintech Investment
Holdings Limited
$489 2016 $101 Finance Jefferies LLC
64. KNDI Kandi Technologies Group, Inc.
$464 2013 $28 Capital Goods FT Global Capital
Last updated: February 25, 2019
6
Symbol Name Market Cap
(US$ mil)
IPO Year
IPO Value (US$ mil)
Sector Lead Underwriters
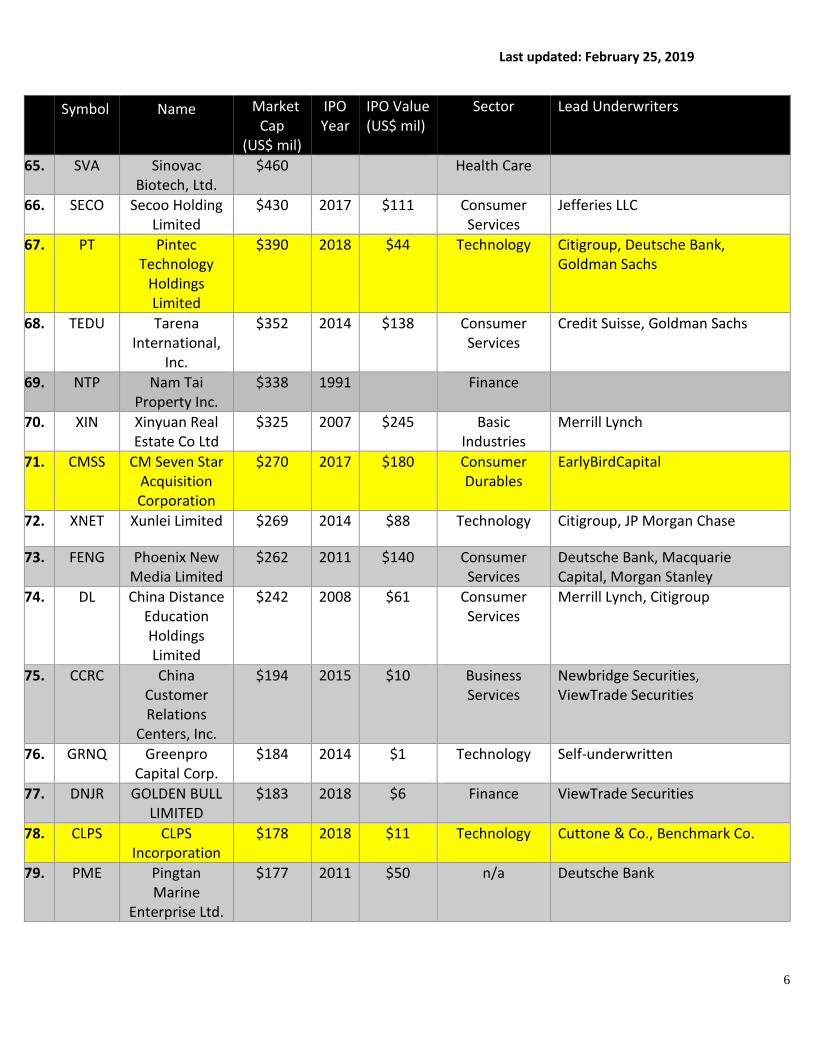
65. SVA Sinovac Biotech, Ltd.
$460 Health Care
66. SECO Secoo Holding Limited
$430 2017 $111 Consumer Services
Jefferies LLC
67. PT Pintec Technology
Holdings Limited
$390 2018 $44 Technology Citigroup, Deutsche Bank, Goldman Sachs
68. TEDU Tarena International,
Inc.
$352 2014 $138 Consumer Services
Credit Suisse, Goldman Sachs
69. NTP Nam Tai Property Inc.
$338 1991
Finance
70. XIN Xinyuan Real Estate Co Ltd
$325 2007 $245 Basic Industries
Merrill Lynch
71. CMSS CM Seven Star Acquisition Corporation
$270 2017 $180 Consumer Durables
EarlyBirdCapital
72. XNET Xunlei Limited $269 2014 $88 Technology Citigroup, JP Morgan Chase
73. FENG Phoenix New Media Limited
$262 2011 $140 Consumer Services
Deutsche Bank, Macquarie Capital, Morgan Stanley
74. DL China Distance Education Holdings Limited
$242 2008 $61 Consumer Services
Merrill Lynch, Citigroup
75. CCRC China Customer Relations
Centers, Inc.
$194 2015 $10 Business Services
Newbridge Securities, ViewTrade Securities
76. GRNQ Greenpro Capital Corp.
$184 2014 $1 Technology Self-underwritten
77. DNJR GOLDEN BULL LIMITED
$183 2018 $6 Finance ViewTrade Securities
78. CLPS CLPS Incorporation
$178 2018 $11 Technology Cuttone & Co., Benchmark Co.
79. PME Pingtan Marine
Enterprise Ltd.
$177 2011 $50 n/a Deutsche Bank

Last updated: February 25, 2019
7
Symbol Name Market Cap
(US$ mil)
IPO Year
IPO Value (US$ mil)
Sector Lead Underwriters
80. HX Hexindai Inc. $167 2017 $50 Finance Network 1 Financial Securities
81. UTSI UTStarcom Holdings Corp
$144 2000 $180 Consumer Durables
Bank of America Securities, Merrill Lynch, Piper Jaffray
82. AMBO Ambow Education
Holding Ltd.
$137 2018 $8 Consumer Services
Benchmark Company
83. COE China Online Education
Group
$134 2016 $46 Consumer Services
Credit Suisse, Morgan Stanley
84. CCM Concord Medical Services Holdings Limited
$130 2009 $132 Health Care CICC, JP Morgan Chase, Morgan Stanley
85. BRQS Borqs Technologies,
Inc.
$130 2015 $50 Technology EarlyBirdCapital
86. CXDC China XD Plastics
Company Limited
$126 2007 $20 Capital Goods Rodman & Renshaw
87. SXTC China SXT Pharmaceutica
ls, Inc.
$119 2019 $10 Health Care Boustead Securities, LLC
88. GSUM Gridsum Holding Inc.
$114 2016 $87 Technology Citigroup, Goldman Sachs
89. RENN Renren Inc. $103 2011 $743 Technology Merrill Lynch, Deutsche Bank, Morgan Stanley
90. MTC MMTec, Inc. $101 2019 $7 n/a Westpark Capital
91. CAAS China Automotive Systems, Inc.
$99 2003
Capital Goods
92. DOGZ Dogness (International)
Corporation
$91 2017 $55 Consumer Durables
Spartan Securities
93. AIHS Senmiao Technology
Limited
$84 2018 $12 Finance ViewTrade Securities

Last updated: February 25, 2019
8
Symbol Name Market Cap
(US$ mil)
IPO Year
IPO Value (US$ mil)
Sector Lead Underwriters
94. BCAC Bison Capital Acquisition
Corp.
$84 2017 $53 Health Care EarlyBirdCapital
95. SGOC SGOCO Group, Ltd
$83 2008 $32 Technology Broadband Capital Management, Chardan Capital Markets
96. ATV Acorn International,
Inc.
$77 2007 $119 Consumer Services
Merrill Lynch, Deutsche Bank
97. SOL Renesola Ltd. $74 2008 $130 Technology Credit Suisse, Deutsche Bank
98. NEWA Newater Technology,
Inc.
$73 2017 $7 Basic Industries
ViewTrade Securities
99. JMU JMU Limited $71 2015 $40 Technology Axiom Capital Management
100. DTSS Datasea Inc. $71 2017 $7 Technology ViewTrade Securities
101. DXF Dunxin Financial Holdings Limited
$67 2010 $88 Consumer Non-Durables
Cowen and Co.
102. TMSR TMSR Holding Company Limited
$64 2015 $50 Finance Cantor Fitzgerald & Co.
103. CJJD China Jo-Jo Drugstores,
Inc.
$62
Consumer Durables
104. SORL SORL Auto Parts, Inc.
$60 2006 $31 Capital Goods Maxim Group
105. BIMI NF Energy Saving
Corporation
$60 Capital Goods
106. GLAC Greenland Acquisition Corporation
$58 2018 $40 Finance Chardan Capital Markets
107. KGJI Kingold Jewelry Inc.
$55 1999 $23 Business Services
JMP Securities, Rodman & Renshaw
108. EVK Ever-Glory International Group, Inc.
$54
Consumer Non-Durables

Last updated: February 25, 2019
9
Symbol Name Market Cap
(US$ mil)
IPO Year
IPO Value (US$ mil)
Sector Lead Underwriters
109. HPJ Highpower International
Inc
$53 2008 $8 Industrial Machinery/Co
mponents
Westpark Capital
110. LOAC Longevity Acquisition Corporation
$53 2018 $40 Finance Cantor Fitzgerald & Co.
111. LITB LightInTheBox Holding Co.,
Ltd.
$48 2013 $79 Consumer Services
Credit Suisse, Stifel Nicolaus & Co.
112. TANH Tantech Holdings Ltd.
$48 2015 $13 Basic Industries
Newbridge Securities, ViewTrade Securities
113. GURE Gulf Resources, Inc.
$47
Basic Industries
114. HGSH China HGS Real Estate, Inc.
$47 2006
Finance
115. TAOP Taoping Inc. $47
$0 Technology
116. MDJH MDJM LTD $47 2019 $6 Finance Network 1 Financial Securities
117. FORK Fuling Global Inc.
$46 2015 $20 Consumer Non-Durables
Burnham Securities, Network 1 Financial Securities
118. RETO ReTo Eco-Solutions, Inc.
$45 2017 $14 Capital Goods ViewTrade Securities
119. PHCF PUHUI WEALTH
INVESTMENT MANAGEMEN
T CO., LTD.
$43 2018 $12 Finance Joseph Stone Capital LLC, Windsor Street Capital L.P.
120. FAMI FARMMI, INC. $37 2018 $7 Consumer Non-Durables
ViewTrade Securities
121. MOXC Moxian, Inc. $34 2016 $20 Technology Axiom Capital Management, Cuttone & Co.
122. CCIH ChinaCache International Holdings Ltd.
$31 2010 $84 Technology Merrill Lynch, Deutsche Bank
123. CBAT CBAK Energy Technology,
Inc.
$30
Industrial Machinery/Co
mponents
124. CIFS China Internet Nationwide
$28 2017 $20 Consumer Services
Boustead Securities, Network 1 Financial Securities
Last updated: February 25, 2019
10
Symbol Name Market Cap
(US$ mil)
IPO Year
IPO Value (US$ mil)
Sector Lead Underwriters
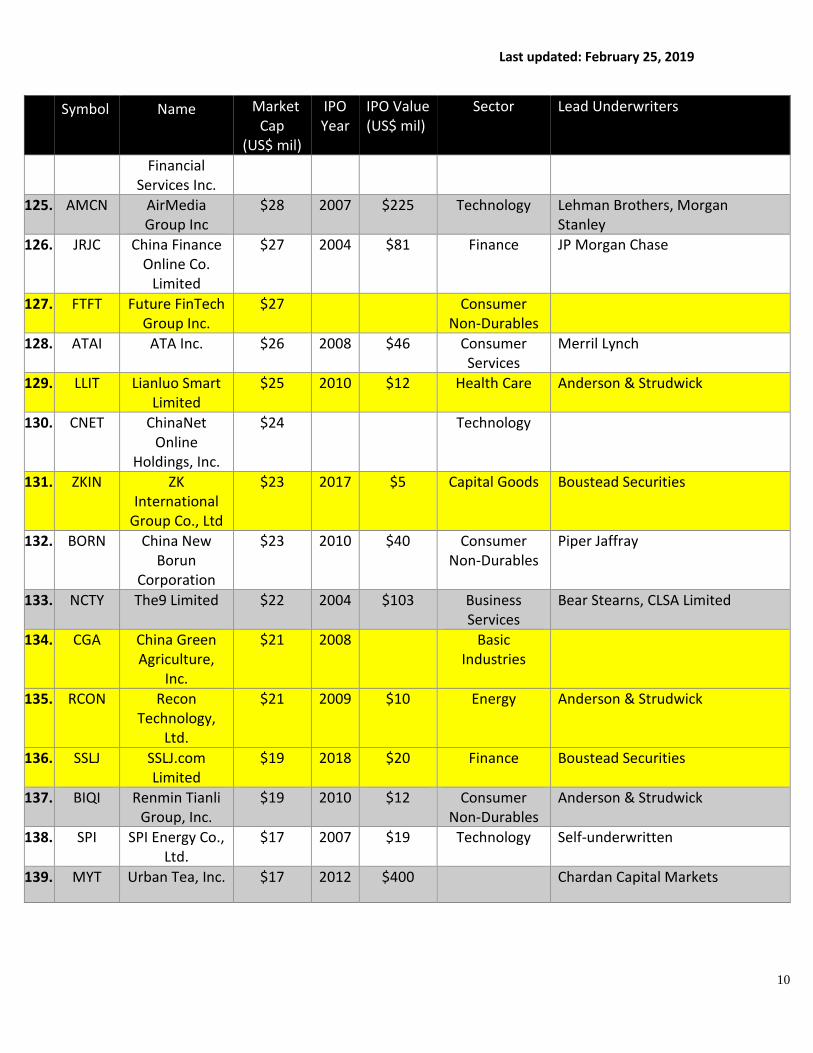
Financial Services Inc.
125. AMCN AirMedia Group Inc
$28 2007 $225 Technology Lehman Brothers, Morgan Stanley
126. JRJC China Finance Online Co.
Limited
$27 2004 $81 Finance JP Morgan Chase
127. FTFT Future FinTech Group Inc.
$27
Consumer Non-Durables
128. ATAI ATA Inc. $26 2008 $46 Consumer Services
Merril Lynch
129. LLIT Lianluo Smart Limited
$25 2010 $12 Health Care Anderson & Strudwick
130. CNET ChinaNet Online
Holdings, Inc.
$24
Technology
131. ZKIN ZK International
Group Co., Ltd
$23 2017 $5 Capital Goods Boustead Securities
132. BORN China New Borun
Corporation
$23 2010 $40 Consumer Non-Durables
Piper Jaffray
133. NCTY The9 Limited $22 2004 $103 Business Services
Bear Stearns, CLSA Limited
134. CGA China Green Agriculture,
Inc.
$21 2008
Basic Industries
135. RCON Recon Technology,
Ltd.
$21 2009 $10 Energy Anderson & Strudwick
136. SSLJ SSLJ.com Limited
$19 2018 $20 Finance Boustead Securities
137. BIQI Renmin Tianli Group, Inc.
$19 2010 $12 Consumer Non-Durables
Anderson & Strudwick
138. SPI SPI Energy Co., Ltd.
$17 2007 $19 Technology Self-underwritten
139. MYT Urban Tea, Inc. $17 2012 $400 Chardan Capital Markets

Last updated: February 25, 2019
11
Symbol Name Market Cap
(US$ mil)
IPO Year
IPO Value (US$ mil)
Sector Lead Underwriters
140. LYL Dragon Victory International
Limited
$17 2017 $9 Finance Boustead Securities, Network 1 Financial Securities
141. CADC China Advanced
Construction Materials
Group, Inc.
$17 Filed 2018
$50 Basic Industries
142. ITP IT Tech Packaging, Inc.
$17
Consumer Durables
143. HEBT Hebron Technology
Co., Ltd.
$14 2016 $20 Capital Goods Spartan Securities Group
144. CPHI China Pharma Holdings, Inc.
$13
Health Care
145. OSN Ossen Innovation Co.,
Ltd.
$12 2010 $23 Basic Industries
Global Hunter Securities, Knight Capital Markets
146. LKCO Luokung Technology
Corp
$12 2010 $16 Technology Roth Capital Partners, INC
147. CNTF China TechFaith Wireless
Communication Technology
Limited
$12 2005 $142 n/a Merrill Lynch
148. TYHT Shineco, Inc. $11 2016 $8 Consumer Non-Durables
Bonwick Capital Partners, Halcyon Cabot Partners, Network 1 Financial Securities
149. CREG China Recycling
Energy Corporation
$11
Business Services
150. CCCL China Ceramics Co., Ltd.
$10 2010 $26 Capital Goods Roth Capital Partners, Inc.
151. KBSF KBS Fashion Group Limited
$9 2012 $50 Consumer Non-Durables
Lazard Capital Markets, Rodman & Renshaw

Last updated: February 25, 2019
12
Symbol Name Market Cap
(US$ mil)
IPO Year
IPO Value (US$ mil)
Sector Lead Underwriters
152. FFHL Fuwei Films (Holdings) Co.,
Ltd.
$7 2006 $31 Capital Goods Maxim Group
153. PETZ TDH Holdings, Inc.
$7 2017 $6 Consumer Non-Durables
ViewTrade Securities
154. GLG China Bat Group, Inc.
$2 2013 $9 Finance Axiom Capital Management
155. SEED Origin Agritech Limited
$1 2004
Consumer Non-Durables
EarlyBirdCapital
156. PLAG Planet Green Holdings Corp
$0 Consumer Non-Durables