China-U.S. Trade Issues: Context and Perspective.
27
-
Upload
theodore-jennings -
Category
Documents
-
view
221 -
download
4
Transcript of China-U.S. Trade Issues: Context and Perspective.


China-U.S. Trade Issues:
Context and Perspective

Overview & Comparison: China and U.S.
2006 China U.S.
Total GDP(US $)
$2.67 trillion $13.20 trillion
5.5% of world 27.4% of world
PPP(international $)
$10.05 trillion $13.20 trillion
15.0% of world 19.8% of world
Per Capita GNI $2,010 – Rank 129
$44,970 – Rank 10
Per Capita PPP $7,740 – Rank 102
$44,240 – Rank 4
See more data on handout

GDP Comparison: China and U.S.
China U.S.
Agriculture 11.9% 1.2%
Industry 47.0% 24.2%
Service 41.1% 74.6%
Agriculture12%
Industry47%
Service41%
Agriculture1% Industry
24%
Service75%
Export, % of GDP 36.8% 11.2%
Import, % of GDP 32.9% 15.1%

U.S. Trade Deficit(in $ billion)
$0
$100
$200
$300
$400
$500
$600
$700
$800
1998 1999 2000 2001 2002 2003 2004 2005 2006 2007
World China

Trade Deficit:Debate and Policy Orientation
Major Market of Trade Flow of China - 2007
Export Value % increase % share US$, billion over 2006 of 2007 EU 245.19 29.2 20.1 USA 232.70 14.4 19.1 Hong Kong 184.43 18.8 15.1 Japan 102.07 11.4 8.4 ASEAN 94.18 32.1 7.7 S. Korea 56.14 26.1 4.6 Russia 28.49 79.9 2.3 India 24.02 64.7 2.0 Taiwan 23.46 13.1 1.9 Canada 19.40 25.0 1.6

Trade Deficit:Debate and Policy Orientation
Major Market of Trade Flow of China - 2007
Import Value % increase % share US$, billion over 2006 of 2007
Japan 133.95 15.8 14.0
EU 110.96 22.4 11.6
ASEAN 108.37 21.0 11.3
S. Korea 103.76 15.6 10.9
Taiwan 101.02 16.0 10.6
USA 69.38 17.2 7.3
Australia 25.85 33.8 2.7
Russia 19.68 12.1 2.1
Brazil 18.33 42.0 1.9
Saudi Arabia 17.56 16.4 1.8
China counts for 4% of NC export, ranking 5th, percentage change was 19.4% increase in the year of 2005

Trade Deficit:Debate and Policy Orientation
Does trade deficit matter?
Impact on overall job and economy: No
U.S. unemployment 4.8%, has decreased
North Carolina unemployment 4.8% (6.5% in 2003)
Employment in T/A industry: decreased, Yes.
It does affect sustainability and stability

Trade Deficit:Debate and Policy Orientation
Is the U.S.-China trade deficit made in China?
The Chinese story: “export processing”Foreign-invested
enterprises- counts for about 50% export from
China
Example: The iPOD AnalysisBilateral trade deficit with China = $150 Components by Japanese company, US
company, etcFinal assembly cost $4 for each unit in China
10% Wal-Mart purchase in China is from Chinese owned firms
Question - Who benefits from this process?

Trade Deficit:Debate and Policy Orientation
Is the U.S.-China trade deficit made in China? The Chinese story: US high-tech export censorship
“China’s rapid military modernization and increases in capabilities have raised important questions about the purposes of this buildup….America’s export controls must support our longstanding arms embargo and not allow exports that would make a direct and significant contribution to China’s military”.
“The United States has noted that China’s military, like many others, is relying on commercial technologies to enhance and enable certain weapons systems. We therefore believe imposing controls on a focused list of technologies … is an appropriate reflection of America’s larger foreign policies.”
C. A. Padilla, Assistant secretary of commerce
Remarks on Jan. 29 of 2007 in China

Trade Deficit:Debate and Policy Orientation Is the U.S.-China trade deficit made in China?
The U.S. story: under-valued Chinese currency Renminbi
U.S. Policy – China should appreciate its currency value
e.g. Schumer-Graham bill – 27.5%
Response from China (effective from 21 June 2005)
Renminbi is no long tied with US$New criteria – tied to a basket of foreign currencies (major trade partners)
Renminbi has appreciated about 10% against US$
Q – Does currency exchange rate matter and how much does it matter?

Trade Deficit:Debate and Policy Orientation
Q – Does currency exchange rate matter and how much does it matter?
Fact: Renminbi has appreciated, but US-China trade deficit increased from 2006 to 2007.
Trade data with major US trade partners show:
When foreign currency appreciated against US$ from 2000 to 2005:
While export from US increased, import into US increased more, thus trade deficit has increased.

Trade Deficit:Debate and Policy Orientation
% Change from 2002-2005
US Currency vs. foreign currency
U.S. Import Value (US $)
U.S. Export Value (US $)
U.S. Trade Balance (US $)
Canada
Euro-12
Mexico
China
Japan
United Kingdom
S. Korea
Taiwan
Malaysia
Brazil
-22.86%
-24.17%
12.73%
-1.00%
-12.08%
-17.49%
-18.10%
-6.94%
-0.34%
-16.74%
37.57%
33.31%
26.31%
94.40%
13.67%
25.91%
22.33%
8.04%
40.66%
56.29%
31.38%
29.80%
23.16%
89.07%
7.70%
16.33%
22.57%
19.95%
1.04%
23.99%
58.27%
39.05%
34.71%
95.55%
18.07%
70.63%
21.92%
-8.04%
70.77%
181.15%
US Trade Pattern with Top Ten Partners from 2002 to 2005: Currency and Trade Flow
Trade Deficit:Debate and Policy Orientation
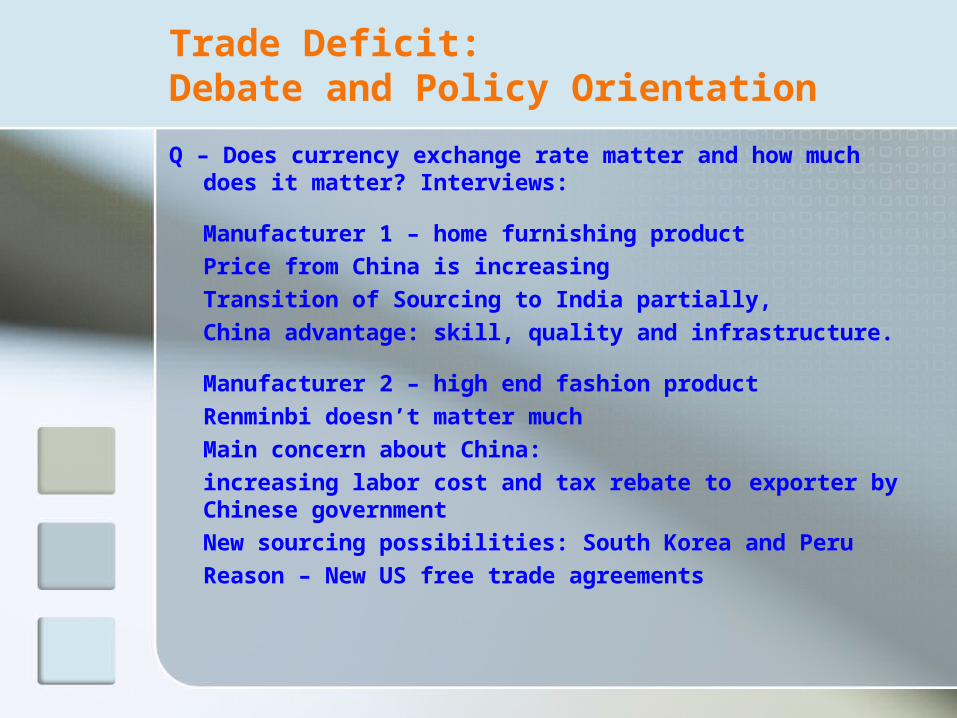
Q – Does currency exchange rate matter and how much does it matter? Interviews:
Manufacturer 1 – home furnishing productPrice from China is increasing Transition of Sourcing to India partially, China advantage: skill, quality and infrastructure.
Manufacturer 2 – high end fashion productRenminbi doesn’t matter muchMain concern about China:
increasing labor cost and tax rebate to exporter by Chinese government
New sourcing possibilities: South Korea and PeruReason – New US free trade agreements

Trade Deficit:US/China macroeconomic condition
Re-valuation of Renminbi can only diverge trade or trade deficit but will not matter to a significant reduction of U.S. trade deficit.
US macroeconomic condition:High budget deficitHigh consumption demand – over 70% of GDPExpenditure increase exceeds income
increaseHigh per capita income, PPP rank 4
China macroeconomic condition:High foreign reserve – 1.53 trillion low consumption demand – about 47% of GDPSaving rate of 30% disposal incomeLower to medium per capita income, PPP
rank 102

Trade Deficit:Debate and Policy Orientation
Is the U.S.-China trade deficit made in China?
The U.S. story: increased import from China is responsible for the job loss in the United States – “Outsourcing America”
Evidence: Closed textile and apparel plants and lost manufacture jobs in North Carolina and in U.S.
Argument from China: Chinese export to the U.S. market mainly displaced third party suppliers rather than increasing the overall T and A import of U.S.
What does the data say?

Trade Deficit and Job: Case of Textile and Apparel industry
2003 2004 2005 2006
Annual % increase of total U.S. T/A import
6.9 7.8 6.8 4.1
Annual % increase of US T/A import from China
22.5 22.5 42.5 16.1
% Share of T & A import from China over total US T/A import
17.7 20.1 26.8 29.9
% Share of US T/A import over total US merchandising import
7.0 6.4 6.0 5.7
Source: Calculated from U.S. International Trade Commission report

U.S. Apparel Import: Share of China = 30.8%
Data in Million $$$ % change %share
2005 2006 2007 06-07 2007
O WORLD 68713.25 71629.54 73923.16 3.2 100.0
O CHINA P 15142.87 18517.43 22745.40 22.8 30.8
O MEXICO 6078.33 5297.11 4523.40 -14.6 6.1
O INDNSIA 2875.419 3670.29 3981.08 8.5 5.4
O VIETNAM 2724.655 3222.06 4358.44 35.3 5.9
O INDIA 2976.175 3186.89 3169.86 -0.5 4.3
O BNGLDSH 2371.734 2914.09 3103.41 6.5 4.2
O HONDURA 2622.31 2440.26 2510.90 2.9 3.4
O HG KONG 3510.573 2810.98 2034.78 -27.6 2.8
O CAMBOD 1712.839 2135.88 2424.93 13.5 3.3
O PHIL R 1830.414 2002.47 1722.21 -14.0 2.3
O THAILND 1807.787 1839.71 1766.31 -4.0 2.4
O SRI LKA 1650.209 1682.42 1573.41 -6.5 2.1
O GUATMAL 1816.24 1666.25 1450.58 -12.9 2.0
O SALVADR 1619.188 1407.73 1486.21 5.6 2.0
O PAKISTN 1258.87 1411.97 1498.60 6.1 2.0 Subtotal of the top 15 78.9

Majority U.S. imported apparel products are from developing countries with cheaper labor
Medical Care +52%
Transportation +48%
Housing +45%
Education/Communications +39%
Food and Beverage +28%
Recreation +21%
Apparel -10%
U.S. Consumer Goods – Price change from 1993 to 2006
Price of apparel decreased 10% while all other consumer goods prices increased
Ref. IIse Metchek, 2007

U.S. Approach to Trade Deficit: Sectoral trade policy – textile and apparel
Why focus on textile and apparel:
U.S. trade policy toward China: Safeguard Actions – quantitative limit on the import of certain Chinese textile and apparel product.
2003 2004 2005 2006
Annual % increase of US T/A import from China
22.5 22.5 42.5 16.1
% Share of T & A import from China over total US T/A import
17.7 20.1 26.8 29.9

U.S. Approach to Trade Deficit: Sectoral trade policy – textile and apparel
• Textile and Apparel Trade Policy:
- Safeguard measures embedded in China’s WTO accession agreement, effective till 2008
- End of quota starting Jan. 2005
- 1995-2004 Agreement on Textiles and Clothing (ATC): Quota phase out in three phases, under WTO
- 1974-1994 Multi-fiber Arrangement (MFA) – Bilateral Agreement to regulate trade of textiles and clothing through quota
- 1960: “Avoidance of Market Disruption” added to GATT. Short-Term Arrangement and Long-Term Arrangement
- 1950s: Voluntary Export Restraint (VER) – response to cotton product export increase from Japan (admitted to GATT in 1955)

U.S. Approach to Trade Deficit: Sectoral trade policy – textile and apparel
I agree…that sweeping changes in our foreign trade policies are not necessary. Nevertheless, we must recognize that the textile and apparel industries are of international scope and are particularly susceptible to competitive pressure from imports. Clearly the problems of the industry will not disappear by neglect nor can we wait for a large scale unemployment and shutdown of the industry to inspire us to action. A comprehensive industry-wide remedy is necessary.
Letter of John F. Kennedy, August 31, 1960[Dickerson, 1999, p.345]

U.S. Approach to Trade Deficit: Sectoral trade policy – textile and apparel
Comments by U.S. Chief Textile Negotiator:
There were strong domestic political pressures urging the U.S. Government to take unilateral action and establish import quotas. As action of this type would be contrary to the generally liberal trade policies of the U.S. in recent years, this government has advanced its proposals for a multilaterally acceptable solutions.
STA negotiation (1961-1962), GATT Document.[Dickerson, 1999, p.346]

Current trend of U.S. trade policy
U.S. Free Trade Agreement with selected partners:
New agreements: South Korea, Peru etc.
Analysis: regional free trade agreement does not create trade but divert trade from one place to another.
Geopolitical factor

Current trend of U.S. trade policy
U.S. Free Trade Agreement with selected partners:
New agreements: South Korea, Peru etc.
Analysis: regional free trade agreement does not create trade but divert trade from one place to another.
Geopolitical factor

Which one is better for the U.S.: a stronger and stable China or a weaker and wobbly China
Trade policy development: Economic concernSocial concern and Geopolitical concern

Questions?