
China retail industry report, 2009 2010
15
China retail industry has taken on a trend of sustainable and rapid development in recent years, growing from RMB4.8 trillion in 2002 to RMB12.5 trillion in 2009. The upbeat industry has started to evolve from a single department store / neighborhood store model to a multi-business model, and a modern retail industry pattern dominated by specialized stores, supermarkets and department stores has already come into being. China Retail Industry Report, 2009-2010
-
Upload
researchinchina -
Category
Documents
-
view
362 -
download
4
Transcript of China retail industry report, 2009 2010

China retail industry has taken on a trend of sustainable and rapid
development in recent years, growing from RMB4.8 trillion in
2002 to RMB12.5 trillion in 2009. The upbeat industry has started
to evolve from a single department store / neighborhood store
model to a multi-business model, and a modern retail industry
pattern dominated by specialized stores, supermarkets and
department stores has already come into being.
China Retail Industry Report, 2009-2010

Total Retail Sales & Growth of Social Consumer Goods, 2002-2009
Source: National Bureau of Statistics of China; ResearchInChina
The total retail sales of social consumer goods rose constantly in the first four months of 2010. The monthly growth
rate of total social retail sales remained above 18% for three successive months and tends to increase month by
month.
From the perspective of industry sectors, after the financial crisis, the general merchandise sector rebounded
remarkably in 2009: the general merchandise was oriented to high-end and individualized consumption in first-tier
cities, while regional general merchandise accelerated the expansion and hence caused a consumption boom
in third-tier cities.
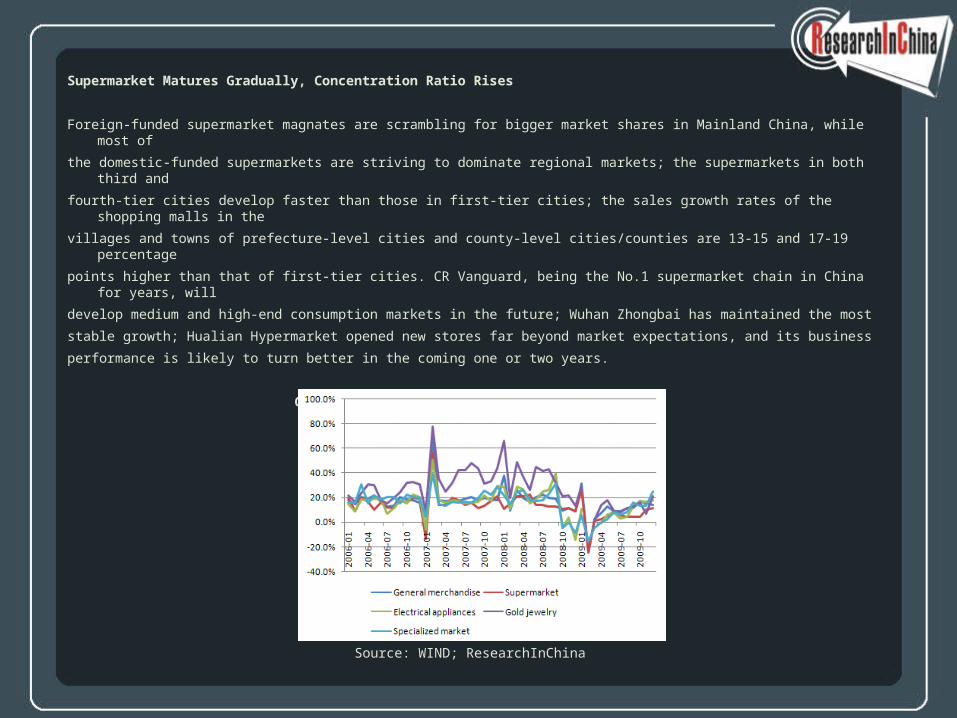
Supermarket Matures Gradually, Concentration Ratio Rises
Foreign-funded supermarket magnates are scrambling for bigger market shares in Mainland China, while most of
the domestic-funded supermarkets are striving to dominate regional markets; the supermarkets in both third and
fourth-tier cities develop faster than those in first-tier cities; the sales growth rates of the shopping malls in the
villages and towns of prefecture-level cities and county-level cities/counties are 13-15 and 17-19 percentage
points higher than that of first-tier cities. CR Vanguard, being the No.1 supermarket chain in China for years, will
develop medium and high-end consumption markets in the future; Wuhan Zhongbai has maintained the most
stable growth; Hualian Hypermarket opened new stores far beyond market expectations, and its business
performance is likely to turn better in the coming one or two years.
Growth of Various Retail Sectors, 2006-2009
Source: WIND; ResearchInChina

Home Appliance Industry Steps Out of the Shadows
Suning Appliance Group has ranked the first of China Top 100 Chain Retailers with the sales of RMB117 billion.
Gome Electrical Appliances, with sales of RMB106.8 billion and 1170 stores, is widening the income gap with
Suning, and reduced the number of stores by 14%. IT chains and mobile phone chains delivered a mediocre
performance: Hisap achieved revenue of RMB15.9 billion, down 11.2%; Dixintong increased its revenue by
4% to RMB6.8 billion, but the growth rate is lower than that of appliance chain enterprises such as Suning, Five-
star, etc.
Jewelry Industry in Rapid Development
The market concentration ratio is relatively low since no brand can dominate the market. Renowned global brands
not only occupy the high-end market, but also distribute channels in low and medium-end markets. The total sales
of gold and jewelry of China in 2009 broke through RMB80 billion, only second to the USA and Japan; promisingly,
Chinese jewelry market will continue to keep the annual growth rate of 15% in the coming years, since the
upgrading of consumption structure and accelerated urbanization resulted from the improved consumption
capacity of Chinese residents have increased the demand for jewelry, sharply enhanced the purchasing power of
female consumers, and raised the wedding market.
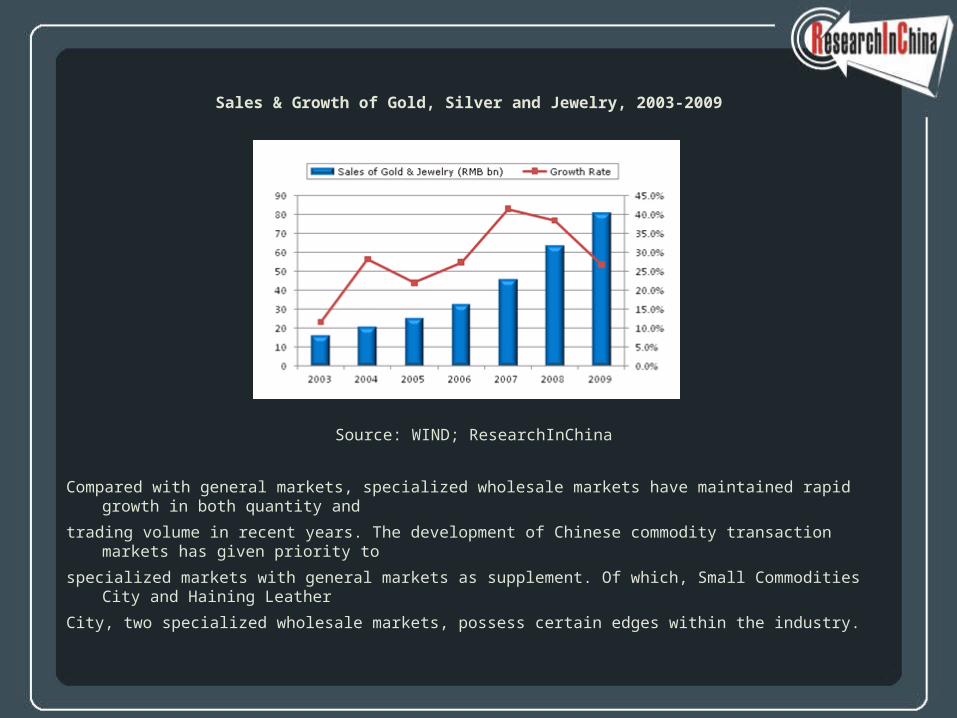
Sales & Growth of Gold, Silver and Jewelry, 2003-2009
Source: WIND; ResearchInChina
Compared with general markets, specialized wholesale markets have maintained rapid growth in both quantity and
trading volume in recent years. The development of Chinese commodity transaction markets has given priority to
specialized markets with general markets as supplement. Of which, Small Commodities City and Haining Leather
City, two specialized wholesale markets, possess certain edges within the industry.

Table of Contents• 1. Economic Environment of China Retail
Industry
• 1.1 Economic Environment
• 1.1.1 Macro-economy
• 1.1.2 Household Consumption
• 1.2 Policy Environment
• 2. Current Development of China Retail Industry
• 2.1 Retail Industry in Rapid Growth
• 2.2 Development Characteristics
• 2.2.1 Top 100 Chain Retailers in Steady Growth
• 2.2.2 Second and Third Tier Cities in Rapid Growth
• 2.2.3 Urban-Rural Development Gap Under Control
• 3. General Merchandise Industry
• 3.1 Current Development
• 3.1.1 First & Second Tier Cities: High Grade
• 3.1.2 Second & Third Tier Cities: Rapid Growth
• 3.2 Bailian Group
• 3.2.1 Profile
• 3.2.2 Operation
• 3.2.3 Strategy
• 3.3 Hefei Department Store Group
• 3.3.1 Profile
• 3.3.2 Operation
• 3.3.3 Strategy
• 3.4 Dashang Group
• 3.4.1 Profile
• 3.4.2 Operation
• 3.4.3 Strategy
• 3.5 Chongqing Department Store
• 3.5.1 Profile
• 3.5.2 Operation
• 3.5.3 Strategy
• 3.6 Silver Plaza Group
• 3.6.1 Profile

• 3.6.2 Operation
• 3.6.3 Strategy
• 3.7 New World Department Store
• 3.7.1 Profile
• 3.7.2 Operation
• 3.7.3 Strategy
• 3.8 Wangfujing Department Store
• 3.8.1 Profile
• 3.8.2 Operation
• 3.8.3 Strategy
• 3.9 Parkson
• 3.9.1 Profile
• 3.9.2 Operation
• 3.9.3 Strategy
• 4. Supermarket Industry
• 4.1 Current Development
• 4.2 Characteristics
• 4.2.1 Foreign-funded Supermarkets Quicken
Distribution in Chinese Market
• 4.2.2 Domestic-funded Supermarkets Give Priority
to Regional Expansion
• 4.2.3 Great Market Space in Third & Fourth Tier
Cities
• 4.3 CR Vanguard
• 4.3.1 Profile
• 4.3.2 Operation
• 4.4 Wuhan Zhongbai
• 4.4.1 Profile
• 4.4.2 Operation
• 4.4.3 Strategy
• 4.5 Hualian Hypermarket
• 4.5.1 Profile
• 4.5.2 Operation
• 4.5.3 Strategy
• 4.6 Wu Mart
• 4.6.1 Profile
• 4.6.2 Operation
• 4.6.3 Strategy
• 4.7 Carrefour
• 4.7.1 Profile

• 4.7.2 Operation
• 4.8 Wal-Mart
• 4.8.1 Profile
• 4.8.2 Operation
• 5. Home Appliance Chain Industry
• 5.1 Current Development
• 5.2 Suning Appliance
• 5.2.1 Profile
• 5.2.2 Operation
• 5.2.3 Strategy
• 5.3 Gome Electrical Appliances
• 5.3.1 Profile
• 5.3.2 Operation
• 5.3.3 Strategy
• 5.4 Jiangsu Five-Star Appliance
• 5.4.1 Profile
• 5.4.2 Operation
• 5.5 Hisap
• 5.5.1 Profile
• 5.5.2 Operation
• 5.5.3 Strategy
• 6. Specialized Wholesale Market
• 6.1 Current Development
• 6.2 Development Trend
• 6.3 Small Commodities City
• 6.3.1 Profile
• 6.3.2 Operation
• 6.4 Haining Leather City
• 6.4.1 Profile
• 6.4.2 Operation
• 6.4.3 Possessing the Features of Specialized Chain
Retailer
• 7. Gold & Jewelry Industry
• 7.1 Current Development
• 7.2 Competition Pattern
• 7.3 Lao Fengxiang
• 7.3.1 Profile
• 7.3.2 Operation
• 7.3.3 Strategy
• 7.4 CHJ Jewellery
• 7.5 TSL Jewellery
• 7.6 Chow Tai Fook Jewellery

Selected Charts • GDP Growth Rate, 2005-2010Q1
• Relativity between Total Retail Sales Growth Rate of Social Consumer Goods and GDP Growth Rate, 2005-2009
• Climate Index of China Retail Industry, Mar.2006 – Mar.2010.
• Change of CPI Jan.2009 – Mar.2010
• Growth Rate of Urban & Rural Resident’s Disposable Income, 2007Q1-2010Q1
• Total Retail Sales & Growth of Social Consumer Goods, 2002-2009
• Monthly Total Retail Sales & Growth of Social Consumer Goods, Jan.2009 – Apr. 2010
• Retail Sales Index of 1000 Core Commercial Enterprises, Mar.2009 – Dec.2009
• Growth of Various Retail Sectors, 2006-2009
• Per Capita Disposable Income of Chinese Urban Residents, 2003-2009
• Quantity of Chain Retail Enterprises above Designated Size in China, 2001-2009
• Sales Proportion of Top 100 Chain Retailers in Total Retail Sales of Social Consumer Goods, 2002-2009
• Sales & Growth of Top 100 Chain Retailers, 2006-2009
• Store Quantity and Increasing Amplitude of Top 100 Chain Retailers, 2003-2009
• Total Retail Sales Growth of Social Consumer Goods of Provincial Capitals & Cities Specifically Designated in the State Plan, 2009
• Retail Sales Growth of Urban-Rural Social Consumer Goods in China, 2001-2009
• Sales Growth Rate of General Merchandise Industry, Jan.2006 – Dec.2009
• Per Capita Disposable Income of First & Second Tier City Residents, 2009
• Brand Positioning of Most Department Stores in Chinese First & Second Tier Cities

• Social Total Retail Sales Growth of Cities, Counties, and Regions below County Level, Jan.2007 – Dec.2009
• Prefecture-level Cities with Higher Consumption Growth in Various Provinces & Cities and Prefecture-level Cities Occupied by Listed Companies
• Operating Income and Net Income of Bailian Group, 2007-2010Q1
• Business Revenue and Growth Rate of Bailian Group (by Industry), 2009
• Profit Growth of Holding Subsidiaries of Bailian Group
• Gross Margin of Bailian Group, 2008Q1-2009Q4
• Operating Income and Growth Rate of Bailian Group (by Region), 2009
• Operating Income and Profit of Hefei Department Store Group, 2007-2010Q1
• Business Revenue and Growth Rate of Hefei Department Store Group (by Industry), 2009
• Revenue Structure of Hefei Department Store Group (by Industry), 2009
• Business Revenue and Growth Rate of Hefei Department Store Group, 2005-2009
• Business Gross Margin of Hefei Department Store Group, 2004-2009
• Quantity of Newly Added Supermarkets of Hefei Department Store Group (Excluding Franchised Outlets), 2006-2009
• Net Income of Home Appliance Business of Hefei Department Store Group, 2005-2009
• Operating Income and Profit of Dashang Group, 2007-2010Q1
• Business Revenue and Growth Rate of Dashang Group (by Industry), 2009
• Revenue Structure of Dashang Group (by Industry), 2009
• Gross Margin of Bailian Supermarket by Business, 2007-2009
• Revenue Structure of Dashang Group (by Region), 2009
• Operating Income and Profit of Chongqing Department Store, 2007-2010Q1
• Business Revenue and Growth Rate of Chongqing Department Store (by Industry), 2009
• Revenue Structure of Chongqing Department Store (by Industry), 2009

• Operating Income and Profit of Silver Plaza Group, 2007-2010Q1
• Main Business Gross Margin of Silver Plaza Group, 2004-2009
• Business Revenue and Growth Rate of Silver Plaza Group (by Region), 2009
• Revenue Structure of Silver Plaza Group (by Region), 2009
• Operating Income and Profit of New World Department Store, 2007-2009
• Revenue Structure of New World Department Store (by Industry), 2009
• Revenue Structure of New World Department Store (by Region), 2009-2010Q1
• Operating Income and Net Income of Wangfujing Department Store, 2007-2010Q1
• Business Revenue and Growth Rate of Wangfujing Department Store (by Industry), 2009
• Operating Income and Growth Rate of Wangfujing Department Store (by Region), 2009
• Revenue Structure of Wangfujing Department Store (by Region), 2009
• Operating Income and Profit of Parkson, 2007-2010Q1
• Revenue Structure of Parkson (by Industry), 2009
• Revenue Structure of Parkson (by Product), 2009
• Revenue Growth Rate of Parkson (by Product), 2009-2010Q1
• Sales Scale and Growth Rate of China Top 20 Supermarkets, 2002-2009
• Store Quantity and Growth Rate of China Top 20 Supermarkets, 2002-2009
• Supermarket & CPI Growth Rate, Jan. 2006 – Apr.2010
• Foreign Capital Sales Scale Proportion of China Top 20 Supermarkets, 2002-2009
• Market Distribution of Wal-Mart in China, 2009
• Market Distribution of Carrefour in China, 2009
• Operating Income and Gross Profit of China Resources, 2007-2009
• Revenue Structure of China Resources (by Industry), 2010Q1
• Sales Scale and Increasing Amplitude of CR Vanguard, 2005-2009
• Store Quantity of CR Vanguard, 2005-2009
• Retail Sales Growth Rate of China Resources, 2007-2009
• Operating Income and Net Income of Wuhan Zhongbai, 2007-2010Q1
• Business Revenue and Growth Rate of Wuhan Zhongbai (by Industry), 2009
• Revenue Structure of Wuhan Zhongbai (by Industry), 2009
• Net Income Structure of Wuhan Zhongbai (by Industry), 2009
• Quantity of Current and Newly Added Zhongbai Warehouse Stores and Zhongbai Convenience Stores, 2007-2009
• Operating Income and Growth Rate of Wuhan Zhongbai (by Region), 2009
• Operating Income and Total Profit of Hualian Hypermarket, 2007-2010Q1
• Net Income of Hualian Hypermarket, 2002-2009
• Business Revenue and Growth Rate of Hualian Hypermarket (by Industry), 2009
• Revenue Structure of Hualian Hypermarket (by Region), 2009
• Quantity of Current Stores and Newly Added Stores of Hualian Hypermarket, 2002-2009
• Operating Income and Net Income of Wu Mart, 2006-2010Q1
• Store Quantity and Distribution of Wu Mart, 2010
• Sales and Growth Rate of Carrefour in China, 2003-2009
• Store Quantity of Carrefour in China, 2003-2009
• Sales and Growth Rate of Wal-Mart in China, 2003-2009
• Store Quantity of Wal-Mart in China, 2003-2009
• Top 5 Home Appliance Chain Retailers in Top 100 Chain Retailers, 2009
• Operating Income and Total Profit of Suning Appliance, 2007-2010Q1
• Suning Chain Stores (by Region), 2009
• Suning Chain Stores (by Store), 2007-2009
• Business Revenue and Growth Rate of Suning Appliance (by Product), 2009
• Suning Chain Stores (by Market), 2008-2009
• Operating Income and Net Income of Gome Electrical Appliances, 2007-2010Q1
• Store Quantity and Growth Rate of Gome, 2003-2009
• Revenue Structure of Gome Electrical Appliances (by Region), 2009
• Revenue Structure of Gome Electrical Appliances (by Product), 2009
• Sales and Growth Rate of Jiangsu Five-Star Appliance, 2003-2009
• Store Quantity of Jiangsu Five-Star Appliance, 2003-2009
• Sales and Growth Rate of Hisap, 2005-2009
• Store Quantity and Growth Rate of Hisap, 2005-2009
• Revenue Structure of Hisap (by Region), 2009
• Revenue Structure of Hisap (by Product), 2009
• Store Characteristics of Hisap VS Competitors
• Chain Business Gross Margin of Hisap, 2005-2009
• China Commodity Transaction Market Quantity, 2003-2008
• Trading Volume of China Commodity Transaction Market, 2003-2008
• Development Mode Comparison, Haining Leather City VS Small Commodities City
• Operating Income and Profit of Small Commodities City, 2007-2010Q1
• Revenue Structure of Small Commodities City (by Business), 2009
• Profit Structure of Small Commodities City (by Business), 2009
• Trading Volume of Small Commodities City, 2006-2009
• Operating Income and Profit of Haining Leather City, 2007-2010Q1
• Business Revenue and Growth Rate of Haining Leather City (by Industry), 2009
• Sales & Growth of Gold, Silver and Jewelry, 2003-2009
• Low Per Capita Possession Rate of Jewelry of Chinese Female
• The Growth of Demand for Ornamental Gold in China Exceeds the World Average Level
• Major Competitive Enterprises of China Jewelry Industry, 2009
• Jewelry Brands among the Most Valuable Brands in China, 2009

• Operating Income and Profit of Lao Fengxiang, 2007-2010Q1
• Revenue Structure of Lao Fengxiang (by Product), 2009
• Business Revenue and Growth Rate of Lao Fengxiang (by Product), 2009
• Revenue of Lao Fengxiang by Product, 2007-2009
• Operating Income and Profit of CHJ Jewellery, 2007-2010Q1
• Business Revenue and Growth Rate of CHJ Jewellery (by Product), 2009
• Revenue Structure of CHJ Jewellery (by Region), 2009
• Direct Stores Proportion of CHJ Jewellery, 2006-2009
• Direct Store Quantity and Net Increased Number of CHJ Jewellery, 2009
• Single Store Revenue and Growth Rate in Direct Channels of CHJ Jewellery, 2009
• Sales Network Construction Scale of CHJ Jewellery
• Operating Income and Net Income of TSL Jewellery, FY2007-FY2010

How to Buy
Product details How to Order
USD File
Single user 2,000 PDF
Enterprisewide 3,000 PDF
Publication date: June 2010
By email: [email protected]
By fax:86-10-82601570
By online:www.researchinchina.com
For more information, call our office in Beijing, China:
Tel: 86-10-82600828
Website: www.researchinchina.com


