China - Peoples Republic of Cotton and Products Annual GAIN Publications/Cotton...continue to...
23
THIS REPORT CONTAINS ASSESSMENTS OF COMMODITY AND TRADE ISSUES MADE BY USDA STAFF AND NOT NECESSARILY STATEMENTS OF OFFICIAL U.S. GOVERNMENT POLICY Date: GAIN Report Number: Approved By: Prepared By: Report Highlights: MY14/15 forecast planting area of 4.41 million hectares (MHa) and production of 6.5 million tons are both down from last year as a support policy change lessens incentives for planting. Government cotton purchases over the past three years have built domestic stocks to a record high 12.3 million tons through MY13/14 which, when coupled with weak consumption growth of 8.2 million tons, further reduces demand for imports which are expected to fall to 1.8 million tons in MY14/15. The U.S., with 1.3 million tons of cotton exported to China in MY12/13, was China's top supplier but faces increasing competition from India and Australia. M. Melinda Meador and Wu Xinping Michael Riedel Cotton and Products Annual China - Peoples Republic of CH14015 4/1/2014 Required Report - public distribution
Transcript of China - Peoples Republic of Cotton and Products Annual GAIN Publications/Cotton...continue to...
THIS REPORT CONTAINS ASSESSMENTS OF COMMODITY AND TRADE ISSUES MADE BY
USDA STAFF AND NOT NECESSARILY STATEMENTS OF OFFICIAL U.S. GOVERNMENT
POLICY
Date:
GAIN Report Number:
Approved By:
Prepared By:
Report Highlights:
MY14/15 forecast planting area of 4.41 million hectares (MHa) and production of 6.5 million tons are
both down from last year as a support policy change lessens incentives for planting. Government cotton
purchases over the past three years have built domestic stocks to a record high 12.3 million tons through
MY13/14 which, when coupled with weak consumption growth of 8.2 million tons, further reduces
demand for imports which are expected to fall to 1.8 million tons in MY14/15. The U.S., with 1.3
million tons of cotton exported to China in MY12/13, was China's top supplier but faces increasing
competition from India and Australia.
M. Melinda Meador and Wu Xinping
Michael Riedel
Cotton and Products Annual
China - Peoples Republic of
CH14015
4/1/2014
Required Report - public distribution

China’s official cotton market information collection system covers cotton and yarn production,
however, the lack of reliable data (production, consumption, and stocks) has been more pronounced in
recent years due to the rapid expansion and diversified scales of production. The numerous players
continue to diversify ownership in the industry chain, including the large number of cotton farmers, gins,
merchants and mills. All these entities contribute to making the collection of reliable production
statistics in China an extremely difficult task.
Executive Summary:
MY14/15 forecast planting area of 4.41 million hectares and production of 6.5 million tons are 7.1
percent and 6.2 percent down, respectively, over the estimated 7 million tons and 4.7 MHa last year. A
change in government support policy for cotton is widely expected to lower farmer payments and
financial incentives for planting. The government’s new cotton production support policy for MY14/15
narrows eligibility to Xinjiang farmers only and pays a direct subsidy based on a target price instead of
price support purchases. In MY14/15, these program changes are expected to prompt a reduction in
cotton planting intentions, particularly in Yangtze and Yellow River regions, due to the loss of
government production support altogether and the option of more profitable, alternative crops.
Government cotton crop purchases at record prices over the past three years have built domestic stocks
to a record high 12.3 million tons through MY13/14. MY 13/14 cotton consumption is forecast at
recover slightly to 8.2 million tons from an estimated 8.04 million tons in MY13/14. China’s ability to
manipulate domestic supply resources through state reserve auctions and tariff rate quotas continues to
impact import demand. The U.S., with 1.3 million tons of cotton exports to China in MY12/13, was
China's top supplier but faces increasing competition from suppliers like India and Australia as China's
imports fall to a projected 1.8 million tons in MY14/15.
Production
MY14/15 domestic production will fall to 6.5 million tons based on planted area of 4.41 MHa, both
down 7.1 percent and 6.2 percent, respectively, over the estimated 7 million tons and 4.7 MHa in the
previous year. A recent change in MY14/15 government policy that supplants a nation-wide price
support policy with a narrower eligibility pool and direct payments based on a target price has lowered
overall profit expectations.
China's policy change reflects a reassessment of its measures to encourage production through ensuring
positive returns by paying artificially high prices to cotton farmers. In retrospect, as a result of this
support policy, the government has absorbed vast expenses for handling and storage, the textile industry
has endured inflated, above market cotton costs and in return, the policy returns in cotton acreage and
production gains have been negligible. Going forward, instead of purchasing cotton at a high floor price
in all cotton-producing regions, the government will provide a direct subsidy based on a target price
only to Xinjiang farmers. Without the government support payments, farmers in the Yangtze and
Yellow River production regions are expected to switch to alternative crops, thus decreasing overall
cotton acreage and production.

Estimates of China’s total cotton production (area and yields) continue to differ among sources. For
MY13/14 example, China’s National Statistics Bureau (NSB) estimates MY13/14 production at 6.31
million tons based on planted area of 4.35 MHa with yields of 1,450 Kg/Ha. Industry sources, however,
estimate MY13/14 production at around 7 million tons, believing Xinjiang planted area remains under-
reported. Further clouding the forecast picture, statistics based on official classification data could be
skewed by the repeated classification of domestic cotton or even classification of imported cotton (to
take advantage of the price difference between imported and domestic cotton). Adding to the difficulty
in accurately forecasting production with data inconsistencies, the changes in government policy for
MY14/15 also muddy the profit picture and impair accurate forecasting by province. Nevertheless,
below is a table of estimates by various sources for MY13/14 and MY14/15 production.
For Xinjiang, in mid-January, the Xinjiang government released estimates that MY13/14 cotton
production was 3.4 million tons (based on planted area of 1.57 MHa, both up slightly by 45,000 Ha and
20,000 tons over the previous year). This figure is significantly below the China Fiber Inspection
Bureau (CFIB) classified volume for Xinjiang, as of March 16th, of 4.68 million tons (out of the
nation’s total 7.28 million tons). (See table 10 and more in GAIN CH10033 on inconsistencies in
Xinjiang’s reported planted area).
For the eastern production regions, MY13/14 production data bears additional explanation. CFIB data
shows MY13/14 classified volume for Henan at 75,000 tons (as of Mid-March). However, industry
sources suggest that a portion of Henan production is likely being reported under Shandong and Hubei
province volume. Large traders/mills purchase seed cotton in Henan which is baled and classified in
Shandong/Hubei provinces and reported under their production figures. Additionally, MY13/14 Hubei’s
stable production seems to be supported by improved profits received in the previous year. Based on all
these factors, Post adjusted MY13/14 production estimates for these provinces accordingly.
The following table reflects production estimates/forecasts for MY13/14 and MY14/15 by major
industry source.
Cotton Production Estimate/Forecast by Various Sources (million tons)
CCA NCMMN CNCE CAAS NSB Post
MY13/14 production 7.0 6.99 6.85 7.0 6.31 7.0
MY14/15 area change -10.5% -14.2% -10% -10.7% -7%** -6.2%
MY14/15 Production NA NA NA NA NA 6.5
[CCA- China Cotton Association, NCMMN- National Cotton Market Monitoring Network,
CNCE- China National Cotton Exchange, CAAS- China Academy of Ag Science]
(**MOA March intention survey results)
Planted Area
Cotton planted area is expected to continue its downward trend as rising production costs, variable
profits and alternative crops influence planting decisions. Post forecasts MY14/15 cotton planted area
will fall to 4.41 MHa from an estimated 4.7 MHa last year.

The Ministry of Agriculture (MOA) estimates MY14/15 planted area will decrease by 7 percent over the
previous year based on its March planting intention survey on farmers.
In addition, a China Academy of Agricultural Science Cotton Research Cotton Institute (CAAS)
January forecast shows a 10.7 percent fall in MY14/15 cotton planting to 4.37 MHa, a drop from its
estimated area of 4.9 MHa in MY13/14, with the Yangtze River region down 12.1 percent, the Yellow
River region down 17.4 percent, and the northwest region down 4.9 percent (with north Xinjiang down
5.8 percent, south Xinjiang down 4.8 percent).
A recent China Cotton Association (CCA) survey also indicates MY14/15 cotton planting intention will
decline by 10.5 percent over last year to 4.17 MHa. The survey showed the Yellow River planting
intentions were down 22 percent with Henan, Shandong both down more than 20 percent and Hebei
down 29 percent as higher profits to competing crops pull acreage from cotton. For example, farmers
planting both wheat and corn had a profit of RMB6, 600/Ha in Shandong compared to farmers planting
cotton who had a negative profit in MY12/13 (chart 2).
More recently, the National Cotton Market Monitoring Network (NCMMN) released a March 27th
forecast that MY14/15 planted area will be down by 14.2 percent to 4.13 MHa and readjusted its
MY13/14 production data to 6.99 million tons. A China National Cotton Exchange (CNCE) forecast
agrees that MY14/15 cotton area will fall by 10 percent over the previous year.
Similar to the national experts, local industry forecasts also show varying forecasts. In Yiyang/Hunan,
farmers expect a 13.3 percent decline in cotton planting intention in MY14/15 following comparatively
low profit as drought and typhoon conditions lowered yield and quality in the previous year. Farmers in
Heze and Liaocheng/Shandong province expect cotton planting intentions to be down 7.7 percent and
25 percent, respectively, in MY14/15.
(See Table 10 for details)
Chart 1- China Cotton Planted Area and Production
(2011-2014, in MHa and million tons)
Source: FAS/Beijing)

In MY13/14, low yield, labor shortages and low profits in both the Yellow River rand Yangtze River
regions further eroded cotton prospects. The withdrawal of government price support in MY14/15 is
expected to further accelerate an eastern region planting decline, as indicated in Chart 2, and exacerbate
profit and labor issues.
For the northwest, the Xinjiang Development and Reform Commission reported a 3 percent decline in
cotton planting intentions in MY14/15 due to uncertainties following changes in government support
policy. Post forecasts, though, that MY14/15 planted area will remain stable at 2.2 MHa. A record of
positive profits, which peaked in MY10/11 due to a surge in world prices, has continued strong at
RMB8,550 (or $1,357)/Ha in MY11/12 and RMB8,820 (or $1,420)/Ha in MY12/13. Furthermore, the
government has reportedly purchased a majority of Xinjiang’s relatively high yielding MY 13/14 crop
(4.6 million tons as of March 9) at above world market prices (RMB20, 400 or $3,290). Thus, Xinjiang
cotton farmers are expected to continue their profitable record which should keep planting intentions
high for MY14/15.
Chart 2 - Comparison of Average Net Profit from Cotton Planting
(2009-2012; RMB/Ha)
Source: NDRC
Yield
China’s average cotton yield varies significantly by individual province/autonomous region, ranging
from 976Kg/Ha in Anhui to 1,815Kg/Ha in Xinjiang (see Chart 3). Overall, MY14/15 cotton yield is
forecast above average at 1,474Kg/Ha with Xinjiang yield forecast at 1,909 Kg/Ha. MY13/14 cotton
yield averaged 1,450 Kg/Ha (NSB total production divided by planted area), with Xinjiang's yield
topping 2,009Kg/Ha, according to the Xinjiang Agricultural Working Conference Report.
Chart 3 – NSB Yield by Province
(Kg/Ha; MY08/09 to MY12/13)

1,815
1,061 1,006 1,039 991 9761,106
1,382 1,3641,283
0
200
400
600
800
1,000
1,200
1,400
1,600
1,800
2,000
Source: NSB
Yellow River provinces of Henan, Hebei, Shandong, and Anhui Provinces could potentially see 100
percent use of Bt variety cotton in the near future which reduces pest-related yield losses. Weather
uncertainties in the Yangtze River and Yellow River region though continue to impact yields.
In Xinjiang’s dry climate, Bt cotton is less prevalent due to fewer pests. Conventional varieties with
specific traits, such as dwarf plant size and early maturity, continue to raise yields in Xinjiang. The
Xinjiang Production and Construction Corp (PCC) farms, which are organized on a larger scale than
other typical cotton farms, incorporate particular agronomic practices, such as high density sowing,
plastic sheet covering, and drip irrigation technology, to improve yields.
Stocks
Government purchases of more than 6.24 million tons of the MY13/14 cotton crop (as of March 24)
raises state-held reserves to a record level approaching 12.3 million tons at the end of MY13/14, a
sizeable increase from an estimated 11 million tons of beginning stocks.
Post forecasts ending stocks could reach 12.4 million tons at the end of MY14/15, depending on the
consumption recovery rate and the price gap between the domestic and world market. The stock to use
ratio remains high at above 150 percent in MY13/14 and 14/15.
Record high stock levels prompted recent government auctions of state reserve cotton but the response
has been lackluster. As of March 24th, the government had only sold 715,000 tons of reserve cotton,
roughly 39 percent of the volume offered for sale at RMB18,000/ton. This reaction reflects stagnation in
cotton demand and/or an unwillingness by the textile sector to pay the inflated price. In an attempt to
stimulate purchases, the government will lower the state cotton release price from RMB18, 000/ton to
RMB17, 250/ton (Grade 328) beginning April 1st, according to the China Cotton Association.
Cotton Trade
Note: Annual import volume is controlled by the government through a tariff rate quota (TRQ) system.
This policy facilitates the government's ability to regulate the supply of cotton imports.
As committed by its WTO agreement, the government allots 894,000 tons of cotton import TRQ
(subject to one percent import tariff) every year and then has the option to allocate additional import
quantities. In 2013, industry sources estimated that the government issued 2.3 million tons of additional
TRQ subject to a variable tariff rate or for processing/re-export. The government has not provided any
additional TRQ distributions for 2014, but some analysts believe the government could add 1 to 1.5
million tons for processing trade or combine a purchase of reserve cotton with the distribution of
additional TRQ to encourage the mill’s purchase of state reserve cotton.
Cotton imports without a TRQ allocation face a stiff 40 percent import duty which normally impedes its
price competitiveness. Recent market conditions, however, including a favorably low world market
price and tight domestic cotton supply, converged to trigger the import of over quota, full duty (40
percent) cotton in 2013. Industry experts believe that, so long as the price gap between domestic and
international markets remains around RMB5,000/ton ($800/ton), Chinese cotton buyers will continue to
pay the duty and import cotton outside the TRQ to meet the needs for various grades/quality of cotton.
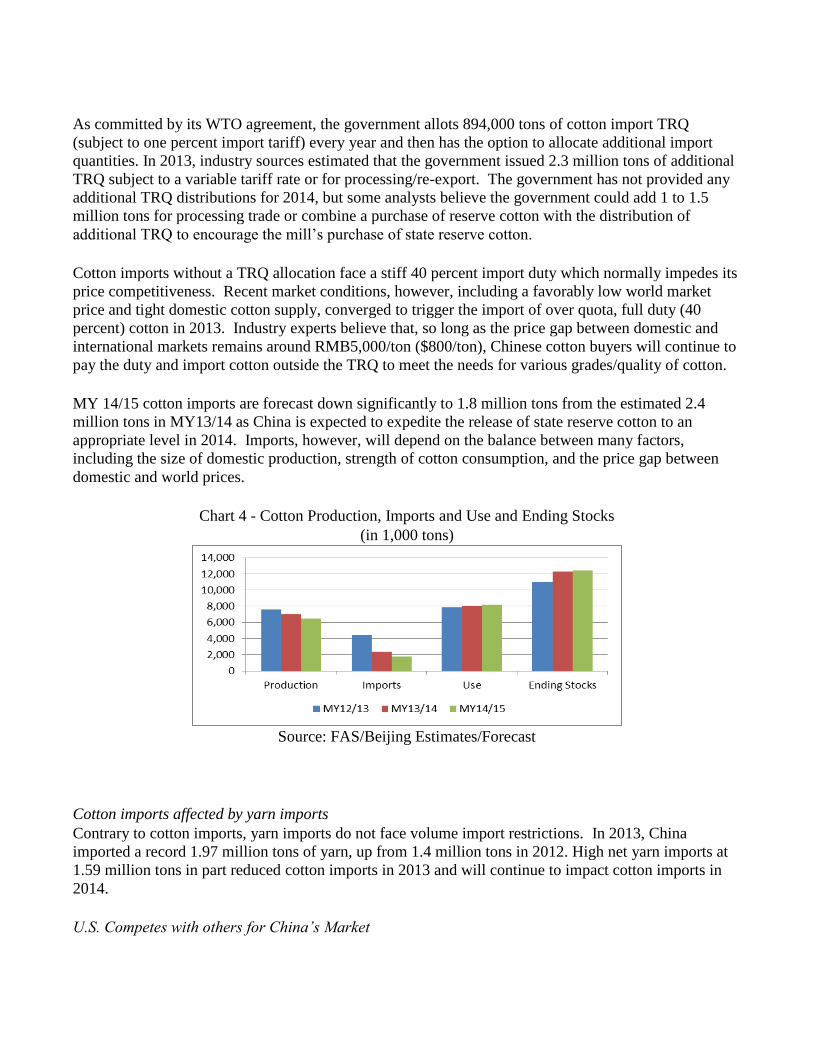
MY 14/15 cotton imports are forecast down significantly to 1.8 million tons from the estimated 2.4
million tons in MY13/14 as China is expected to expedite the release of state reserve cotton to an
appropriate level in 2014. Imports, however, will depend on the balance between many factors,
including the size of domestic production, strength of cotton consumption, and the price gap between
domestic and world prices.
Chart 4 - Cotton Production, Imports and Use and Ending Stocks
(in 1,000 tons)
Source: FAS/Beijing Estimates/Forecast
Cotton imports affected by yarn imports
Contrary to cotton imports, yarn imports do not face volume import restrictions. In 2013, China
imported a record 1.97 million tons of yarn, up from 1.4 million tons in 2012. High net yarn imports at
1.59 million tons in part reduced cotton imports in 2013 and will continue to impact cotton imports in
2014.
U.S. Competes with others for China’s Market

In MY12/13, the United States resumed its status as the number one cotton supplier to China with total
export volume of 1.3 million tons, followed by India and Australia with export volume of 987,000 tons
and 887,000 tons, respectively. While the quality and reliability of U.S. cotton appeals to China’s end-
users, India’s price and transportation advantages provide serious competition. India’s cotton
production is expected to increase as it incorporates new technology, expands Bt cotton dissemination
and actively promotes its product. Competition from India and other suppliers, coupled with expected
low demand for imports, is expected to reduce demand for US cotton exports to China in MY13/14 and
MY14/15.
Consignment Trade
Due to strong demand for alternatives to high-priced domestic cotton since late 2011, consignment trade
has been on the rise. China’s small to medium-sized mills choose consignment purchases due to the
flexibility they offer, including short delivery time, convenient quality verification and lower financial
commitment. However, due to the lack of import TRQ, most mills pay the full duty to take delivery of
the cotton on consignment being held in bonded warehouses. Consignment trade is expected to remain a
viable source until the world cotton price changes making the cost of import plus full duty unattractive
for Chinese mills. Industry sources indicated as of the end of February, total cotton in the bonded zone
of Qingdao and Zhangjiagang/Jiangsu ports was about 205,000 tons.
Cotton exports insignificant
China’s cotton exports average about 10,000 tons annually, insignificant compared to total cotton use.
Yarn exports increased slightly to 387,000 tons, making net yarn imports 1.59 million tons in 2013
showing a significantly rise from 500,000 tons in 2011.
Consumption
MY14/15 cotton consumption is forecast at 8.2 million tons, up from an estimated 8 million tons in
MY13/14. Although demand from developed markets, like the US and EU, remains sluggish due to
recovering economic performance, strengthening demand from developing countries, and especially
China, raises expectations for consumption of apparel and textile products.
On the other hand, industry experts anticipate that the share of synthetic fibers and other fibers in cotton
yarn production may continue to rise in 2014 due to high domestic cotton prices while the price for
synthetic fiber may remain relatively low and competitive. Historically, the price of cotton fiber runs
approximately 20 percent higher than that of synthetic fiber. According to NSB, total chemical fiber
production in 2013 was 41.22 million tons, up 7.9 percent over the previous year.
China's Textile Sector Production/Investment Trends
Year/Item 2010
2011
2012
2013
2013/2012
Change %
Yarn Production (million tons) 27.17 28.7 29.84 32.0 +7.2
Fabrics Production (Million Meters) 800 814 841 883 +4
Chemical Fiber Production (million tons) 30.9 33.9 38 41.2 +7.4
Fixed Asset Investment in Textile Sector (RMB billion) 257 366.9 397.1 NA NA
Source: China Economic and Social Development Report by NSB

(Exchange Rate: 2012-$1=RMB6.3; 2013-$1=RMB6.2)
New Challenges for textile sector impact cotton use
The textile industry in China employs over 23 million people and is considered an economic pillar
industry. In China’s 12th Five Year (2011-2015) Plan, the government confirmed its support to
upgrading this sector. According to NSB, while fixed asset investment in the textile industry in 2012
reached $64 billion, up 8 percent over 2011, this figure is significantly lower than the 30.9 percent
growth in 2011. The investment value in 2013 is not available, but NSB indicated that the fixed asset
investment in general manufacturing industry increased by 18.5 percent over the previous year. Total
profit for the sector in 2013 increased 15.8 percent over 2012. The sector’s marketing profit margins
averaged 5.5 percent, up slightly (0.2 percentage) over the previous year.
Despite this financial influx, the textile industry faces significant challenges, including declining orders
from overseas, appreciating Chinese currency and rising production costs for key inputs such as raw
materials and labor. Industry statistics show that in 2013 mills paid more than RMB 4,000/ton ($645)
above the world price for domestic cotton.
In addition to high prices for raw materials, Chinese Ministry of Labor indicated 27
provinces/municipalities adjusted the minimum wage level in 2013 with average growth up by 18
percent over the previous year. High electricity price coupled with environmental pressure (emission
limit) not only adds to production costs, but also inhibits facility expansion.
To address these ongoing hurdles, textile industry leaders use different approaches. Some mills are
improving efficiency and productivity to maintain profits. Others have moved operations towards
China’s central and western regions (Henan, Sichuan, Anhui, Jiangxi, Xinjiang and Ningxia Provinces)
and foreign countries (Vietnam and Cambodia etc.) in search of lower raw material/labor inputs and a
favorable investment climate. For example, China’s industry reported the construction of a 150,000 ton
annual spinning capacity project in North Carolina in February which is expected to be operational in
October 2014. A Zhejiang Textile Group began a $136 million spinning investment in Vietnam at the
end of 2013 that is expected to reduce costs in raw material, labor, logistics and duties, and facilitate
access to Southeast Asian Markets. China’s industry associations are also organizing trips to Southeast
Asia countries for talks on textile investment.
Recovery of exports support moderate growth of cotton use
According to NSB, total textile and apparel exports were valued at $283.9 billion in 2013, up 11.4
percent over the previous year. Specifically, textile export value increased by 11.7 percent to $106.9
billion, and apparel export value increased by 11.3 percent to $177 billion, both figures reflecting
growth rates in excess of those in 2012. Although total textile and apparel export value in the first two
months of 2014 fell slightly (by four percent) over the previous year (mainly due to China’s Spring
Festival vacation, analysts reported), China’s industry experts remain optimistic regarding export
growth prospects in 2014 given a moderate recovery of overseas markets and lowering of domestic
cotton price due to policy changes.
Chart 5 - Textile and Apparel Exports (Value in $100 million)

Source: NSB
Domestic demand support cotton use
According to the China Textile Industry Association (CTIA), the domestic market accounted for more
than 83 percent of the sector’s total sales value in 2012. However, the general sales trend remained
weak in 2013. The estimated low cotton use of 8.04 million tons in MY13/14, however, is expected to
rebound to a forecast 8.2 million tons in MY14/15. In addition to an anticipated fall in cotton prices,
and constant high GDP growth of 7.7 percent in 2013 and likely 7.5 percent in 2014, higher disposable
income and rising living standards of Chinese consumers are driving retail consumption to the benefit of
cotton products. For example, as indicated in Chart 6, the 2012 per capita expenditures on clothing
increased for both urban and rural residents, with urban resident’s still far outspending rural
counterparts. High urbanization is expected to continue in 2014 (with newly added urban residents at
19.29 million in 2013). The market potential for China’s 629.6 million rural residents to increase textile
related purchases is expected to rise as rural incomes grow as well. This will support continued demand
for domestic cotton products.
Chart 6 - Per Capita Expenditures on Clothing
By Urban and Rural Resident (in RMB/year)
Source: NSB
Misreporting of yarn categories and volume continue
A long standing problem in consumption forecasting is the lack of reliable data to connect cotton
consumption data with finished product numbers. For example, according to NSB, total yarn

production for 2011 was reported at 29 million tons, of which 22 million tons (accounting for 75.4
percent) was reported as pure cotton yarn, with the remainder as blended yarn and synthetic yarn. These
figures are problematic when compared to China’s average cotton consumption of 10 million tons
annually in recent years, plus other fibers available for spinning, which cumulatively cannot produce the
volume of yarn as reported. Over-reporting of total yarn and pure cotton yarn production and under-
reporting of synthetic fiber ratios and cotton consumption, or some combination thereof, distorts
accurate analysis. China’s industry insiders acknowledge misreporting of yarn categories and volume
by mills is the basis of the problem.
Policy
Domestic cotton support policy amended
The State Purchase of Domestic Cotton Program, established three years ago to boost income and
stimulate production through fixed price supports and the cotton TRQ regime (sliding scale and
processing scale quotas) are government programs enacted to maintain domestic cotton supply/demand
balance. The minimum cotton purchase price for domestic cotton started at RMB19, 800/ton in
MY11/12 and rose to RMB20, 400/ton in MY12/13 and MY13/14 (approximately $3,100-3,300 per
ton). During this same period, world cotton prices declined significantly to an average $2,000/ton in
2014 (based on Global Trade Atlas/China import price), far below the internal cotton price set by the
government. The inflated domestic price depressed consumption of domestic cotton thus forcing the
government to purchase the majority of the MY12/13 crop. This massive purchase added 6.46 million
tons of expensive cotton to state reserve storage facilities. In MY13/14, the government purchased
another 6.24 million tons (as of March 24, out of estimated 7 million tons total production in MY13/14)
which will push state reserves levels to a record high 12.3 million tons by the end of MY13/14. The
policy resulted in an unsustainable situation with huge government stocks and limited stimulus to cotton
production.
In 2014, China’s government announced an adjustment in this policy to transition toward less market
distortion and government intervention. Beginning in MY14/15, only Xinjiang cotton farmers will
receive an acreage based subsidy based on a target price (which would exceed world price). The
nationwide fixed purchase price policy will be eliminated.
As of this report, the government target price for cotton remains unknown although information
suggests it will be RMB19, 400/ton. In general, this policy change will have limited impact on Xinjiang
cotton planting intention based on analysis of production costs and yield expectation in this region, but
is likely to reduce planting intentions in other cotton-producing regions where alternative crops are an
option.
As such, China’s total cotton planting area is expected to shrink in the short term (due to the
government’s significant stocks, a moderate small crop in next few years is desirable for policy makers).
However, as an NDRC official hinted, the government’s resumption of the state purchase program is
possible in the future if the government deems it necessary.
Over the next two years, government decision makers will be deciding whether a Xinjiang only support
policy will produce sufficient cotton for domestic needs while staying consistent with its policy of
having imported cotton primarily the domain of textile use for export. Policy leaders are unlikely to

accept a situation where a regionalized support policy puts domestic needs and government stock levels
into a position where they could be perceived to be vulnerable to imports.
Seed Subsidy
Large seed producers/traders currently compete for the $34/Ha subsidy provided for selected “high
quality variety” seeds to improve quality cotton coverage. Total expenditure in 2013, though
unpublished, is believed to exceed $155 million (if based on the NSB’s 5.04 MHa planted area for
MY13/14).
Registration System for Overseas Cotton Suppliers
Overseas cotton suppliers must be registered with China’s General Administration of Quality
Supervision, Inspection and Quarantine (AQSIQ) to export cotton to China (CH8075 and CH9004). On
January 18, 2013, AQSIQ published Decree No.151 on "Supervision and Administration Measures for
Inspection of Import Cotton." The measures took effect on February 1, 2013. Preliminary comparison
between the draft and final versions shows only slight modifications in Article 26 (CH13003). The
impact of the Measures on cotton trade is expected to be limited.
Traders are also recommended to register with AQSIQ to export cotton to China based on these
requirements. AQSIQ keeps updating the newly registered or renewed overseas cotton supplier list on
its website with the latest dated on December 13, 2013. Post received no complaints on this
registration.
Official cotton classification
According to CFIB, as of March 16, 2014, total cotton baled and classed under the new classification
system has reached 7.28 million tons, up from 5.56 million tons in MY11/12. The government
requirement that only classified cotton qualifies for its purchase support program is stimulating the
increase in classified cotton. Although the intent behind requiring classification was to simultaneously
upgrade the quality of China’s ginning sector and facilitate the collection of production data, the reality
is not so clear cut. Industry sources report that some cotton may be presented repeatedly for
classification and purchase and even some imported cotton may also be presented for classification to
take advantage of the import/domestic price difference. The inclusion of multiple repeat purchases or
imported cotton skews the overall production data. The new purchase program for MY14/15 is expected
to eliminate some problems in that without the government purchase program, mills may not request
ginners to provide official classification data.
Targeted Loans
In MY13/14, the Agriculture Development Bank of China (ADBC) continued to provide targeted loans
with favorable terms for the purchase of seed cotton. This program facilitated the marketing of seed
cotton when market prices remained weak and demand for cotton was stagnant. Xinjiang government
information indicated that total loans exceeded RMB66.3 billion in My13/14, up RMB5.7 billion over
the previous year. ADBC will continue to provide financial assistance for domestic cotton marketing in
MY14/15.
Marketing

The government continues to provide a transportation subsidy of RMB500/ton ($80) in MY13/14 (up
from RMB 400/ton in MY11/12) for Xinjiang origin cotton shipped to mills in coastal and southern
cities. Xinjiang province provides 40 percent of China’s domestic cotton production yet there is only
one rail line to move the raw product cross-country to the textile production areas. Harvest time can be
a bottleneck. The shipping congestion improved slightly in MY12/13 and MY13/14 when the
government purchased most of the Xinjiang cotton for reserve and stored it locally, thus reducing the
pressure on rail transportation.
U.S. cotton exporters interested in exporting cotton to China in need of marketing assistance may
contact USDA/FAS’s Agricultural Trade Offices (ATO) in Beijing, Chengdu, Guangzhou, Shanghai
and Shenyang. They can be contacted via email at, [email protected], [email protected],
[email protected], [email protected], and [email protected], respectively.
Cotton Council International (CCI) is also actively involved in promoting U.S. cotton in China and
throughout Asia. CCI serves China regionally from its Hong Kong Office. CCI can be reached via
email at [email protected]. Both CCI and the ATO’s organize events designed to bring U.S.
cotton exporters in close contact with Chinese buyers.
The China International Cotton Conference, a biannual event sponsored by CCA and MOA attracts a
worldwide audience from the cotton/textile industry. The 2013 conference was held in June in Qingdao,
Shandong Province. CCA, in collaboration with China National Cotton Exchange also holds an annual
event, the China Cotton Industry Development Forum, which focuses on analysis and outlook of the
market situation. The 2014 Forum will be held in May in Xiamen, Fijian Province.
Tables
Production, Supply and Demand (PSD)
Table 1. PSD (in 1,000 Bales and 1,000 Ha)
Cotton
China
2012/2013 2013/2014 2014/2015
Market Year
Begin:
Aug 2012
Market Year
Begin:
Aug 2013
Market Year
Begin: Aug 2014
USDA
Official
New
Post
USDA
Official
New
Post
USDA
Official
New
Post
Area Planted 5,300 5,300 5,050 4,700 4,410
Area Harvested 5,300 5,300 5,050 4,700 4,410
Beginning Stocks 31,081 31,081 50,361 50,361 56,566
Production 35,000 35,000 32,000 32,150 29,855
Imports 20,327 20,327 11,000 11,023 8,267
MY Imports from U.S.
Total Supply 86,408 86,408 93,361 93,534 94,688
Exports 47 47 50 38 50
Use 36,000 36,000 35,500 36,930 37,660
Loss 0 0 0 0 0
Total Dom. Cons. 36,000 36,000 35,500 36,930 37,660
Ending Stocks 50,361 50,361 57,811 56,566 56,978
Total Distribution 86,408 86,408 93,361 93,534 94,688
Stock to Use % 140 140 163 153 151
Yield 1,438 1,438 1,380 1,489 1,474
TS=TD 0 0 0
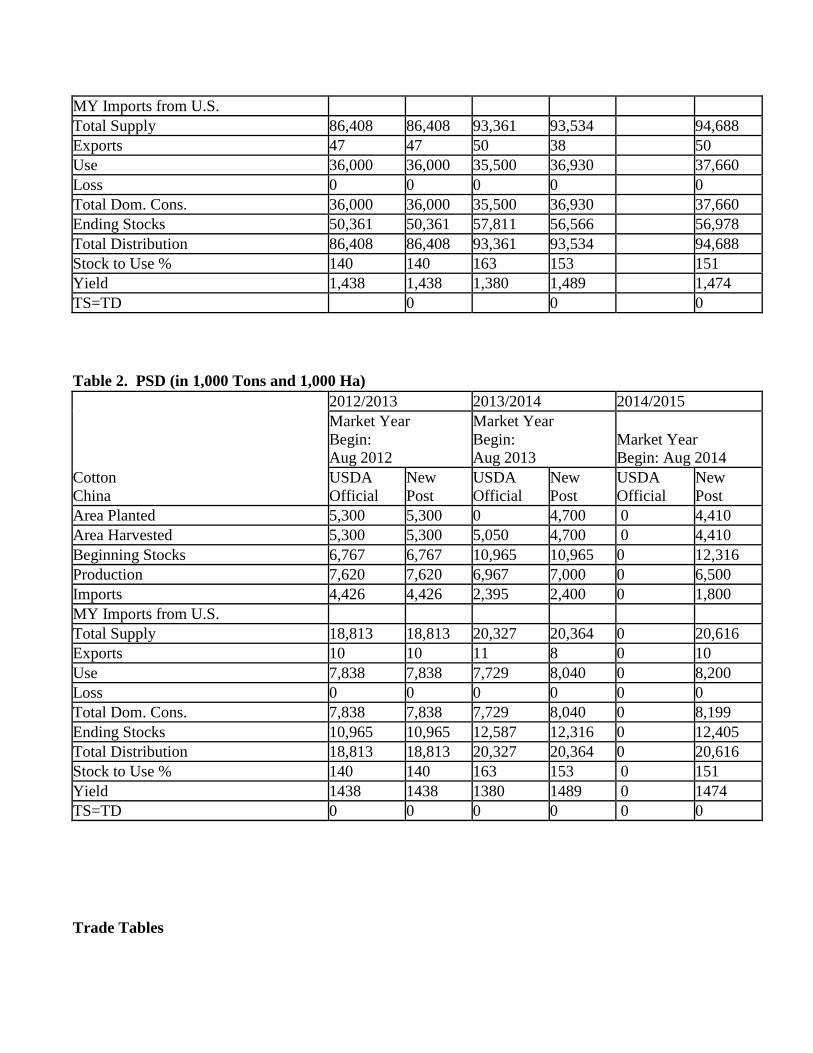
Table 2. PSD (in 1,000 Tons and 1,000 Ha)
Cotton
China
2012/2013 2013/2014 2014/2015
Market Year
Begin:
Aug 2012
Market Year
Begin:
Aug 2013
Market Year
Begin: Aug 2014
USDA
Official
New
Post
USDA
Official
New
Post
USDA
Official
New
Post
Area Planted 5,300 5,300 0 4,700 0 4,410
Area Harvested 5,300 5,300 5,050 4,700 0 4,410
Beginning Stocks 6,767 6,767 10,965 10,965 0 12,316
Production 7,620 7,620 6,967 7,000 0 6,500
Imports 4,426 4,426 2,395 2,400 0 1,800
MY Imports from U.S.
Total Supply 18,813 18,813 20,327 20,364 0 20,616
Exports 10 10 11 8 0 10
Use 7,838 7,838 7,729 8,040 0 8,200
Loss 0 0 0 0 0 0
Total Dom. Cons. 7,838 7,838 7,729 8,040 0 8,199
Ending Stocks 10,965 10,965 12,587 12,316 0 12,405
Total Distribution 18,813 18,813 20,327 20,364 0 20,616
Stock to Use % 140 140 163 153 0 151
Yield 1438 1438 1380 1489 0 1474
TS=TD 0 0 0 0 0 0
Trade Tables

Table 3. China’s Monthly Cotton Imports
Unit: Tons
Month 2009 2010 2011 2012 2013 2014
January 77,993 301,359 391,590 326,468 457,490 292,485
February 93,083 221,046 184,216 616,048 378,842
March 98,763 323,807 276,459 625,196 528,822
April 145,560 323,819 210,453 509,694 430,878
May 151,524 197,955 144,569 501,855 345,779
June 168,619 177,248 120,017 475,971 269,793
July 131,440 168,882 157,087 405,842 337,799
August 109,711 240,172 207,048 305,556 275,885
September 102,162 200,806 252,739 262,924 201,270
October 118,604 96,136 252,315 272,067 141,185
November 112,866 126,203 378,152 303,643 173,122
December 216,776 461,657 790,402 532,187 608,606
TOTAL 1,527,101 2,841,100 3,367,058 5,137,451 4,151,484
Marketing
Year
Aug/09-
Jul/10
Aug/10-
Jul/11
Aug/11-
Jul/12
Aug/11-
Jul/12
Aug/13-
Jul/14
TOTAL 2,374,346 2,609,365 5,341,730 4,425,780
Unit: 480-lb Bales
Month 2009 2010 2011 2012 2013
January 358,222 1,384,142 1,798,573 1,499,468 2,101,252 1,343,384
February 427,529 1,015,264 846,104 2,829,508 1,740,021
March 453,619 1,487,246 1,269,776 2,871,525 2,428,879
April 668,557 1,487,301 966,611 2,341,025 1,979,023
May 695,952 909,207 664,005 2,305,020 1,588,163
June 774,466 814,100 551,238 2,186,135 1,239,159
July 603,702 775,675 721,501 1,864,032 1,551,511
August 503,901 1,103,110 950,971 1,403,419 1,267,140
September 469,232 922,302 1,160,830 1,207,610 924,433
October 544,749 441,553 1,158,883 1,249,604 648,463
November 518,392 579,650 1,736,852 1,394,632 795,149
December 995,653 2,120,391 3,630,316 2,444,335 2,795,327
TOTAL 7,013,974 13,041,950 15,464,897 23,596,312 19,067,766
Marketing
Year
Aug/09-
Jul/10
Aug/10-
Jul/11
Aug/11-
Jul/12
Aug/12-
Jul/13
Aug/13-
Jul/14
TOTAL 10,905,371 11,984,813 24,534,566 20,327,608
Source: Global Trade Atlas
Table 4. China’s Quarterly Cotton Imports by Country of Origin
Unit: Tons

Marketing Year: 2011/2012
Country Jul-Sep /10 Oct-Dec /10 Jan-Mar/11 Apr-Jun/11 TOTAL
India 78,544 602,910 778,250 421,102 1,880,806
United States 98,835 147,563 424,256 584,886 1,255,540
Australia 280,665 208,774 30,258 108,580 628,277
Brazil 17,674 191,260 87,778 46,986 343,698
Uzbekistan 43,257 47,600 111,853 60,442 263,152
Burkina Faso 26,098 22,893 10,397 46,895 106,283
Mali 20,855 10,122 4,774 28,746 64,497
Cameroon 11,153 6,665 5,459 29,973 53,250
Pakistan 7,154 23,471 15,901 24,482 71,008
Other 32,639 159,611 98,785 135,428 426,463
TOTAL 616,874 1,420,869 1,567,711 1,487,520 5,092,974
Marketing Year: 2012/2013
Country Jul-Sep /11 Oct-Dec /11 Jan-Mar/12 Apr-Jun/12 TOTAL
India 91,159 148,171 605,491 173,408 1,018,229
United States 255,847 198,658 398,347 465,747 1,318,599
Uzbekistan 57,670 79,788 93,590 83,863 314,911
Brazil 43,500 188,815 76,950 17,925 327,190
Australia 352,003 327,752 56,454 144,505 880,714
Mexico 5,774 15,875 18,698 12,364 52,711
Tanzania 22 15,180 15,701 3,106 34,009
Zimbabwe 1,608 15,411 15,619 1,646 34,284
Zambia 5,820 21,548 10,056 3,441 40,865
Mali 48,838 25,042 2,202 8,627 84,709
Cameroon 28,942 7,118 1,044 19,733 56,837
Other 83,139 64,540 71,002 112,085 330,766
TOTAL 974,322 1,107,898 1,365,154 1,046,450 4,493,824
Marketing Year: 2013/2014
Country Jul-Sep /12 Oct-Dec /12 Jan-Mar/13 Apr-Jun/13 TOTAL
Australia 391,661 204,232 595,893
India 59,257 355,375 414,632
United States 173,606 114,114 287,720
Uzbekistan 49,661 36,500 86,161
Brazil 10,852 53,862 64,714
Burkina Faso 29,415 21,873 51,288
Mali 23,953 17,981 41,934
Cameroon 25,352 19,658 45,010
Other 51,197 99,317 150,514
TOTAL 814,954 922,912 1,737,866
Source: Global Trade Atlas

Table 5. China’s Monthly Cotton Exports
Unit: Tons
Month 2010 2011 2012 2013 2014
January 86 3,641 0 70 440
February 0 5,108 472 0
March 578 1,908 617 211
April 1,136 5,240 42 990
May 1,474 6,124 1,512 715
June 461 1,058 5,919 495
July 86 820 1,653 507
August 1,052 1,097 1,389 348
September 1,240 456 3,007 959
October 255 0 1,168 1,409
November 55 90 502 717
December 31 157 1,277 313
TOTAL 8,464 27,710 17,558
Marketing Year Aug/10-Jul/11 Aug/11-Jul/12 Aug/12-Jul/13 Aug/13-Jul/14
TOTAL 5,084
Unit: 480-lb Bales
Month 2010 2011 2012 2013 2014
January 395 16,723 0 322 2,021
February 0 23,461 2,168 0
March 2,655 8,763 2,834 969
April 5,218 24,067 193 4,547
May 6,770 28,128 6,945 3,284
June 2,117 4,859 27,186 2,274
July 395 3,766 7,592 2,329
August 4,832 5,039 6,380 1,598
September 5,695 2,094 13,811 4,405
October 1,171 0 5,365 6,472
November 253 413 2,306 3,293
December 142 721 5,865 1,438
TOTAL 38,875 127,272 80,644 40,175
Marketing Year Aug/10-Jul/11 Aug/11-Jul/12 Aug/12-Jul/13 Aug/13-Jul/14
TOTAL 121,861

Source: Global Trade Atlas
Table 6. China’s Monthly Cotton Yarn and Thread Imports
Unit: Tons
Month 2010 2011 2012 2013 2014
January 102,478 90,812 65,637 162,971 172,173
February 58,667 50,986 114,922 94,457
March 103,588 78,041 113,610 185,939
April 93,393 53,412 99,090 151,011
May 85,614 43,123 114,747 158,033
June 74,473 40,781 97,851 136,010
July 75,036 54,851 126,778 187,801
August 80,202 63,562 143,086 194,228
September 82,571 75,369 129,565 193,729
October 75,846 83,269 116,731 176,786
November 94,145 79,225 134,442 168,870
December 102,953 90,537 149,506 163,395
TOTAL 1,030,976 805,979 1,405,965 1,973,230
Marketing Year Aug/10-Jul/11 Aug/11-Jul/12 Aug/12-Jul/13 Aug/13-Jul/14
TOTAL
847,723 1,124,597
1,749,552
Source: Global Trade Atlas
Table 7. China’s Monthly Cotton Yarn and Thread Exports
Unit: Tons
Month 2010 2011 2012 2013 2014
January 39,795 30,243 19,420 44,249 33,120
February 24,800 20,323 24,823 22,549
March 48,377 48,893 41,244 40,903
April 44,305 35,205 28,122 37,983
May 49,254 23,469 27,809 27,927
June 48,430 21,395 24,670 23,431
July 39,325 18,717 19,824 25,594
August 29,464 18,998 23,196 29,836
September 24,584 18,095 29,497 32,314
October 28,400 19,404 31,207 28,577
November 35,875 17,802 31,866 36,263
December 28,083 22,684 41,230 37,459
TOTAL 442,702 297,239 342,908 387,085
Marketing Year Aug/10-Jul/11 Aug/11-Jul/12 Aug/12-Jul/13 Aug/13-Jul/14
TOTAL
344,651
355,118 447,211
Source: Global Trade Atlas
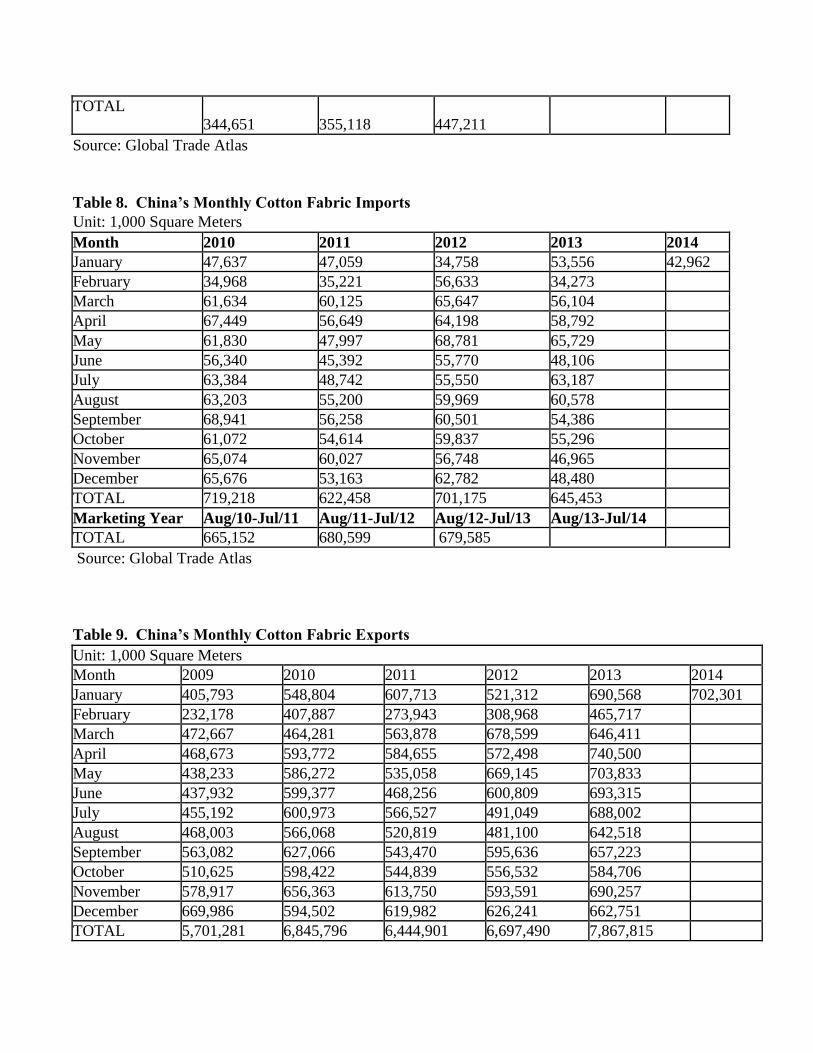
Table 8. China’s Monthly Cotton Fabric Imports
Unit: 1,000 Square Meters
Month 2010 2011 2012 2013 2014
January 47,637 47,059 34,758 53,556 42,962
February 34,968 35,221 56,633 34,273
March 61,634 60,125 65,647 56,104
April 67,449 56,649 64,198 58,792
May 61,830 47,997 68,781 65,729
June 56,340 45,392 55,770 48,106
July 63,384 48,742 55,550 63,187
August 63,203 55,200 59,969 60,578
September 68,941 56,258 60,501 54,386
October 61,072 54,614 59,837 55,296
November 65,074 60,027 56,748 46,965
December 65,676 53,163 62,782 48,480
TOTAL 719,218 622,458 701,175 645,453
Marketing Year Aug/10-Jul/11 Aug/11-Jul/12 Aug/12-Jul/13 Aug/13-Jul/14
TOTAL 665,152 680,599 679,585
Source: Global Trade Atlas
Table 9. China’s Monthly Cotton Fabric Exports
Unit: 1,000 Square Meters
Month 2009 2010 2011 2012 2013 2014
January 405,793 548,804 607,713 521,312 690,568 702,301
February 232,178 407,887 273,943 308,968 465,717
March 472,667 464,281 563,878 678,599 646,411
April 468,673 593,772 584,655 572,498 740,500
May 438,233 586,272 535,058 669,145 703,833
June 437,932 599,377 468,256 600,809 693,315
July 455,192 600,973 566,527 491,049 688,002
August 468,003 566,068 520,819 481,100 642,518
September 563,082 627,066 543,470 595,636 657,223
October 510,625 598,422 544,839 556,532 584,706
November 578,917 656,363 613,750 593,591 690,257
December 669,986 594,502 619,982 626,241 662,751
TOTAL 5,701,281 6,845,796 6,444,901 6,697,490 7,867,815

Marketing
Year
Aug/09-
Jul/10
Aug/10-
Jul/11
Aug/11-
Jul/12
Aug/12-
Jul/13
Aug/13-
Jul/14
TOTAL
6,591,978 6,642,450
6,444,901 7,481,447
Source: Global Trade Atlas
Other Tables
Table 10. Cotton Planted Area and Production by Province
Planted Area (in 1,000 Ha)
Year MY11/12 MY12/13 MY13/14 MY14/15
Xinjiang 1,980 2,160 2,250 2,200
Shandong 766 740 610 525
Hebei 633 550 400 385
Hubei 489 473 450 440
Henan 390 250 220 195
Anhui 340 305 200 180
Jiangsu 220 171 100 88
Hunan 192 202 175 152
Gansu 48 71 70 70
Other 322 353 225 175
Total 5,380 5,275 4,700 4,410
Production (in 1,000 tons)
Year MY11/12 MY12/13 MY13/14 MY14/15
Xinjiang 3,500 4,430 4,450 4,200
Shandong 785 698 650 560
Hebei 653 571 385 395
Hubei 523 571 540 455
Henan 382 269 200 190
Anhui 378 270 180 175
Jiangsu 247 210 95 95
Hunan 227 251 192 180
Gansu 78 107 108 100
Other 429 223 200 150
Total 7,202 7,600 7,000 6,500
Average Yield (Kg/Ha) 1,339 1,441 1,489 1,474
Note: FAS/Beijing estimate and forecast
Table 11. Cotton Tariffs as of January 1, 2014 (continued)

Description HS Code M.F.N.(%) Gen(%) VAT ED Unit
Cotton, not carded or combed 5201-0000 Kg
Cotton, not carded or combed, including
degreased cotton -in quota
5201-
0000.01
1 125
13 13
Cotton, not carded or combed, including
degreased cotton - tariff and out of
quota, interim
5201-
0000.80
40(*) 0
13 13
Cotton, not carded or combed, including
degreased cotton -out of quota
5201-
0000.90
40 125
13 13
Cotton waste, yarn waste 5202-1000 10 30 17 13 Kg
Cotton waste, garnetted stock 5202-9100 10 30 17 13 Kg
Cotton waste, other 5202-9900 10 30 17 13 Kg
Cotton, carded or combed 5203-0000 125 17 13 Kg
Cotton, carded or combed, in quota 5203-
0000.01
1 125
17 13
Cotton, carded or combed, out of quota 5203-
0000.90
40 125
17 13
Cotton sewing thread, containing 5204-1100 5 40 17 16 Kg
85% or more by weight of cotton
Other 5204-1900 5 40 17 16 Kg
Put up for retail sale 5204-2000 5 50 17 16 Kg
Cotton yarn (other than sewing 5205-1100 5 40 17 16 Kg
thread), containing 85% or more to
by weight of cotton, not for retail sale 5205-4800
Cotton yarn (other than sewing thread)
containing less than 85% by weight of
cotton, not put for retail sale
5206-1100
to 5206-
4500
5 40
17 16 Kg
Cotton yarn (other than sewing 5207-1000 6 50 17 16 Kg
thread), containing 85% or more 5207-9000 6 50 17 16 Kg
Note: (*) subject to sliding tariff rate based on a formula; VAT--Value Added Tax; ED--Export
Drawback Rate; Source: PRC Customs Import & Export Tariff, 2014
Table 11. Cotton Tariffs as of January 1, 2014 (continued)
Description HS Code M.F.N.(%) Gen(%) VAT ED Unit
Woven fabrics of cotton,
containing 85% or more by weight of
cotton, weighing not more than 200
g/square meter
5208-
1100
to
5208-
5990*
10
70
17 16 M/Kg
*Except:
5208-2300
12 70
17 16 M/Kg
Woven fabrics of cotton, containing 85% 5209- 10 70 17 16 M/Kg
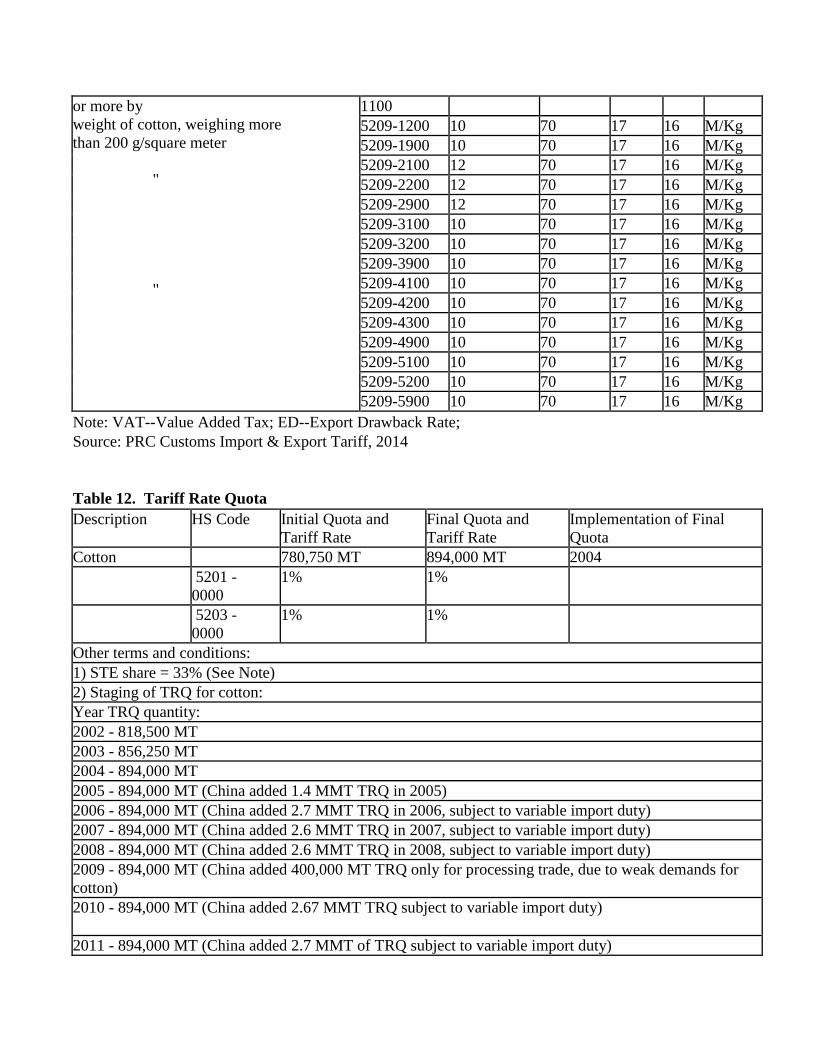
or more by
weight of cotton, weighing more
than 200 g/square meter
"
"
1100
5209-1200 10 70 17 16 M/Kg
5209-1900 10 70 17 16 M/Kg
5209-2100 12 70 17 16 M/Kg
5209-2200 12 70 17 16 M/Kg
5209-2900 12 70 17 16 M/Kg
5209-3100 10 70 17 16 M/Kg
5209-3200 10 70 17 16 M/Kg
5209-3900 10 70 17 16 M/Kg
5209-4100 10 70 17 16 M/Kg
5209-4200 10 70 17 16 M/Kg
5209-4300 10 70 17 16 M/Kg
5209-4900 10 70 17 16 M/Kg
5209-5100 10 70 17 16 M/Kg
5209-5200 10 70 17 16 M/Kg
5209-5900 10 70 17 16 M/Kg
Note: VAT--Value Added Tax; ED--Export Drawback Rate;
Source: PRC Customs Import & Export Tariff, 2014
Table 12. Tariff Rate Quota
Description HS Code Initial Quota and
Tariff Rate
Final Quota and
Tariff Rate
Implementation of Final
Quota
Cotton 780,750 MT 894,000 MT 2004
5201 -
0000
1% 1%
5203 -
0000
1% 1%
Other terms and conditions:
1) STE share = 33% (See Note)
2) Staging of TRQ for cotton:
Year TRQ quantity:
2002 - 818,500 MT
2003 - 856,250 MT
2004 - 894,000 MT
2005 - 894,000 MT (China added 1.4 MMT TRQ in 2005)
2006 - 894,000 MT (China added 2.7 MMT TRQ in 2006, subject to variable import duty)
2007 - 894,000 MT (China added 2.6 MMT TRQ in 2007, subject to variable import duty)
2008 - 894,000 MT (China added 2.6 MMT TRQ in 2008, subject to variable import duty)
2009 - 894,000 MT (China added 400,000 MT TRQ only for processing trade, due to weak demands for
cotton)
2010 - 894,000 MT (China added 2.67 MMT TRQ subject to variable import duty)
2011 - 894,000 MT (China added 2.7 MMT of TRQ subject to variable import duty)

2012 - 894,000 tons (China added 1.32 million tons of TRQ subject to variable import duty)
2013 - 894,000 tons (China added an estimated 2.3 million tons additional TRQ subject to variable duty
or for processing trade)
2014 - 894,000 tons (as of this report, no additional TRQ has been allocated; China’s WTO commitment
does NOT mandate a TRQ for CY05 and after, but China maintained an identical quantity of TRQ as
CY04. In addition to those volumes, based on market demand, China adds TRQs yearly. The added
TRQs are subject to a variable import duty)


![Cipaganti [ whats next ] Focus or Diversify?](https://static.fdocuments.net/doc/165x107/547951b15906b576048b46c1/cipaganti-whats-next-focus-or-diversify.jpg)