China Lodging Group, Limited
25
China Lodging Group, Limited Fourth Quarter and Full Year 2012 Results March 6, 2013
Transcript of China Lodging Group, Limited

China Lodging Group, Limited
Fourth Quarter and Full Year 2012 ResultsMarch 6, 2013

111
Safe Harbor Statement
Statements in this presentation contain "forward-looking" statements within the meaning of Section 27A of the Securities Act of 1933, as
amended, and Section 21E of the Securities Exchange Act of 1934, as amended, and as defined in the Private Securities Litigation
Reform Act of 1995, including, among others, those relating to China Lodging Group, Limited (the “Company”)’s beliefs as to the growth
of the Chinese economy and the hotel industry and the factors driving expected growth, the Company's growth strategy and expansion
plan, and the competitive advantage and expected execution of its hotel pipeline development and business model. These forward-
looking statements are not historical facts but instead represent only the Company’s belief regarding future events, many of which, by
their nature, are inherently uncertain and outside of the Company’s control. The Company’s actual results and financial condition and
other circumstances may differ, possibly materially, from the anticipated results and financial condition indicated in these forward-
looking statements. In particular, the Company’s operating results for any period are impacted significantly by the mix of leased hotels
manachised hotels, and franchised hotels in its chain, causing the Company’s operating results to fluctuate and making them difficult to
predict.
Because forward-looking statements are subject to risks and uncertainties, we caution you not to place undue reliance on any forward-looking statements. All written or oral forward-looking statements by the Company or persons acting on its behalf are qualified by thesecautionary statements.
The Company undertakes no obligation to publicly update or revise any forward-looking statements or other information or datacontained in this presentation, whether to reflect any change in its expectations with respect to such statements or any change inevents, conditions or circumstances on which any such statements are based or otherwise.

222
Agenda
Section I:
Section II:
Section III:
Strategy Overview by CEO
Operating Highlights by COO
Financial Highlights by CFO
Section IV: Q & A

3
Multi-Brand Strategy to Address the Full Range
of Chinese Hotel Market
Hu
a Z
hu
Bra
nd
Po
rtfo
lio

Target Customer
• Knowledge workers
• Value- and quality-conscious
travelers
Typical Price Range
• RMB 150-300 per room night
Hotel Count (12/31/2012)
• 898 hotels
Hanting Hotel: Neat, Concise and Better

Hi Inn: Simple, Happy and Good-Value-for-Money
Target Customer
• Practical, price-conscious
travelers
Typical Price Range
• RMB 100-200 per room night
Hotel Count (12/31/2012)
• 40 hotels

JI Hotel: Quality, Smart and Thoughtful
Target Customer
• Mature and experienced
travelers
• Seek a quality experience in
hotel stays
Typical Price Range
• RMB 250-500 per room night
Hotel Count (12/31/2012)
• 32 hotels

Starway Hotel: Rich in Design and
Guaranteed in Quality
Target Customer
• Middle class travelers
• Seeking a good location,
reasonable price and
guaranteed quality
Typical Price Range
• RMB 250-600 per room night
Hotel Count (12/31/2012)
• 65 hotels

JoyaHotel
Joya Hotel: An Elegant Debut
Target Customer
• Affluent, low-key, and elite
travelers
• Seeking an elegant lifestyle
Typical Price Range
• RMB 500-1,000 per room night
First hotel to be unveiled in
Wuhan City in the 2nd half of
2013

938
97
400~500
2,000~2,100
200~500
Now
1,035
Hotels
2016E
~2,500 Hotels
2021E
~ 5,000 Hotels
Others
3,600~3,900
800~1,000
Economy
Mid-Scale
Multi-brand Strategy to Sustain Long-term Growth…

101010
Agenda
Section I:
Section II:
Section III:
Strategy Overview by CEO
Operating Highlights by COO
Financial Highlights by CFO
Section IV: Q & A

11
145 173243
344465
2263
195
295
516
54
167
236
438
639
1,035
2008 2009 2010 2011 2012
Number of Hotels in Operation
Manachised Hotels
Leased Hotels
Franchised Hotels
(50%)
(45%)
Hotel Openings Exceeded Guidance, with
Accelerated Expansion from Manachise Business
9
3527
5027
43
81
70
36
78
108
120
Q1'12 Q2'12 Q3'12 Q4'12
Number of Hotels Opened (net)

85%
96% 98%95% 94%93%
98%*95%*
87%*
93%
82%
93%97%
93% 92%91%
97% 97%92% 94%
Q1 Q2 Q3 Q4 Full Year
Reported Period
1212
Q4: Occupancy and ADR Slightly Dropped due to Higher
% of New Manachised Hotels and City Mix Change
2011 201220102009
169174 174 177 174173
196*
218*
194* 197
175 182 183 179 180
172 181 183
176 178
Q1 Q2 Q3 Q4 Full Year
ADR (in RMB)
Occupancy (%)
* Favorably impacted by Shanghai Expo in 2010
Figures excluding franchised Starway hotels

144
167 171 168163161
192*
207*
168*
183
143
170177
167 165 156
176 178
162168
Q1 Q2 Q3 Q4 Full Year
Reported Period
RevPAR (in RMB)
1313
Blended RevPAR: Q4 YOY -3%; Full Year +2%,
on a Hotel Room Base Enlarged by 51%
2011 201220102009* Favorably impacted by Shanghai Expo in 2010
23 25 26 2834 38
435054
5966
727684
95
108
Q1 Q2 Q3 Q4
Number of Hotel Rooms in Operation (in 000s, as end of the period)
Figures excluding franchised Starway hotels

1414
-4%1%
4%3%
12% 11%* 12%*
2%*
-2%
3%* 5%* 5%
10%
7%5%
2%
11% 7% 7%3%
-1%
4%6% 7%
8%
All hotels Non-Shanghai hotels
Q1 Q2 Q3 Q4
20102009
Same-hotel RevPAR Growth
Q4 Same-Hotel RevPAR + 2%, Full Year +6%
* Normalized for Shanghai Expo
2011
Q1 Q2 Q3 Q4 Q1 Q2 Q3 Q4
7%5%
3% 3% 3% 3% 3%
1%
Same-hotel ADR Growth
(2011, outside of Shanghai
-7%
-2%
3%4% 5% 4%
2%
1%
Same-hotel Occupancy Change
2011
Q1 Q2 Q3 Q4
2011
Q1 Q2 Q3 Q4
Q1 Q2 Q3 Q4
2012
Q1 Q2 Q3 Q4
2012
Q1 Q2 Q3 Q4
2012
For hotels in operation for at least 18 months
Figures excluding franchised Starway hotels
FY2012: +6%
FY2012: +2% FY2012: +3%

1515
10%
7%
5%
2%1%
0% 0%
Q1'12 Q2'12 Q3'12 Q4'12
China Lodging Group (HTHT)
Home Inns (HMIN)
Same-hotel RevPAR Growth
For hotels in operation for at least 18 months
Source: public filings
Figures excluding franchised Starway hotels
Consistently Leading in Same-hotel RevPAR Growth

1616161616
Agenda
Section I:
Section II:
Strategy Overview by CEO
Operational Highlights by COO
Financial Highlights by CFOSection III:
Section IV: Q & A

2231
37 414051
58 63 62
82
101 106
Q1 Q2 Q3 Q4
339433
498 438 410
530606 627 627
765 847 831
Q1 Q2 Q3 Q4
1717171717
Net Revenues YOY Exceeded Guidance:
Q4:+36%; Full Year:+43%
Net Revenues
(in RMB millions)
Leased Hotels Revenue
(in RMB millions)
2,250
651
3,225
883Manachised and Franchised Hotels Revenue
(in RMB millions)
2010 2011 2012
2010 2011 2012
2011 2012 Q4’11 Q4’12

18
Q4 EBIT Margin Decreased 1.9 Percentage Points
Adjusted Income from Operations (1)
as % of Net Revenues
5.7%
3.8%
Q4'11 Q4'12
Adjusted Hotel Operating Costs (1)
as % of Net Revenues
Pre-opening Expenses
as % of Net Revenues
Adjusted SG&A Expenses (1)
as % of Net Revenues
75.8%
78.6%
Q4'11 Q4'12
7.6% 7.9%
Q4'11 Q4'12
10.9%
9.7%
Q4'11 Q4'12
INCREASE 2.8%
DECREASE 1.9%
INCREASE 0.3% DECREASE 1.2%
(1) Excluding share-based compensation expenses.

19
FY12 EBIT Margin Improved 1.9 Percentage Points
Adjusted Income from Operations (1)
as % of Net Revenues
5.5%
7.4%
2011 2012
Adjusted Hotel Operating Costs (1)
as % of Net Revenues
Pre-opening Expenses
as % of Net Revenues
Adjusted SG&A Expenses (1)
as % of Net Revenues
75.6% 76.0%
2011 2012
8.2%
7.2%
2011 2012
10.7%
9.4%
2011 2012
INCREASE 0.4%
IMPROVE 1.9%
DECREASE 1.0% DECREASE 1.3%
(1) Excluding share-based compensation expenses.
20
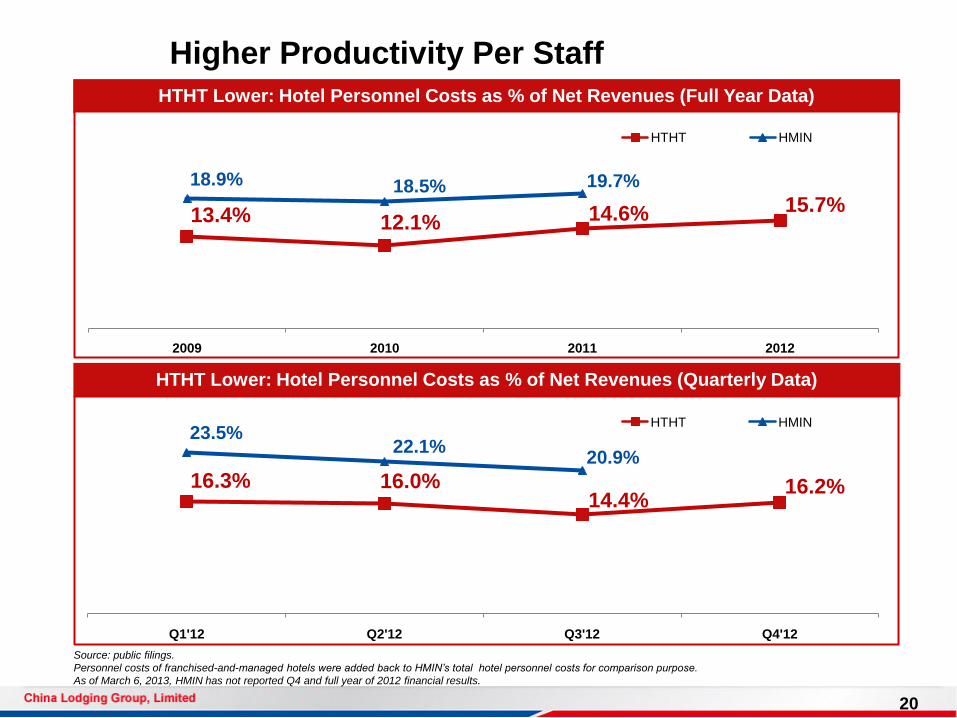
HTHT Lower: Hotel Personnel Costs as % of Net Revenues (Quarterly Data)
Higher Productivity Per Staff
Source: public filings.
Personnel costs of franchised-and-managed hotels were added back to HMIN’s total hotel personnel costs for comparison purpose.
As of March 6, 2013, HMIN has not reported Q4 and full year of 2012 financial results.
HTHT Lower: Hotel Personnel Costs as % of Net Revenues (Full Year Data)
13.4% 12.1% 14.6% 15.7%
18.9% 18.5% 19.7%
2009 2010 2011 2012
HTHT HMIN
16.3% 16.0%14.4%
16.2%
23.5%22.1%
20.9%
Q1'12 Q2'12 Q3'12 Q4'12
HTHT HMIN

39
161
124 135
459
101
181
243
191
716
Q1 Q2 Q3 Q4 Full Year
21
Cash Generated from Operations
(in RMB millions)
2011 2012
Operating Cash Flow Grew 56% Full Year

2222222222
Cash Balance Remained Strong
(1) Calculated as cash and cash equivalent , restricted cash, short-term investment less total debt as of period end. Bank loan=0.
460 (1)
1,260
800
Net Cash Balance Credit Facility Available Total Funding Resource
Abundant Funding Resource for Expansion
(in RMB millions)

23
Guidance
To open 100-110 leased hotels and 230-270 manachised hotels
1 Joya Hotel
55 to 65 mid-scale hotels (JI and Starway)
275 to 315 economy hotels (Hanting and Hi)
Q1’13 net revenues to grow 30% to 32%
FY13 net revenues to grow 26% to 29%

24
Q & A