
China & India: Trading with Asias Giants - Sumon Bhaumik · China & India: Trading with Asias...
14
China & India: Trading with Asia’s Giants (Presentation at a workshop organised by emita, 7 October 2010, Nottingham) Dr. Sumon Bhaumik Aston Business School
Transcript of China & India: Trading with Asias Giants - Sumon Bhaumik · China & India: Trading with Asias...
China & India:Trading with Asia’s Giants
(Presentation at a workshop organised by emita, 7 October 2010, Nottingham)
Dr. Sumon Bhaumik
Aston Business School

Size of the economyHow large is the market?
100%
120%
140%
160%
180%
200%
220%
240%
260%
280%
300%
0
2
4
6
8
10
1220
00
2001
2002
2003
2004
2005
2006
2007
2008
2009
2010
2011
2012
2013
2014
2015
GDP growth (annual %)
GDP, PPP (constant 2005 international $, 2000 = 100)
Linear trend for GDP in constant 2005 international $
100%
120%
140%
160%
180%
200%
220%
240%
260%
280%
300%
0
2
4
6
8
10
12
2000
2001
2002
2003
2004
2005
2006
2007
2008
2009
2010
2011
2012
2013
2014
2015
GDP per capita growth (annual %)
GDP per capita, PPP (constant 2005 international $, 2000 = 100)
Linear trend in per capita GDP in 2005 international $
Income share of highest 10% (2005) = 31.13Income share of highest 20% (2005) = 45.34Gini coefficient (2005) = 36.8
Source: World Development Indicators, The World Bank, Washington, D.C.
Gro
wth
rat
e
Gro
wth
rat
e

Structure of the economyIs it a services driven economy?
0
1
2
3
4
5
6
2000
2001
2002
2003
2004
2005
2006
2007
2008
High-technology exports (% of manufactured exports)
Research and development expenditure (% of GDP)
Source: World Development Indicators, The World Bank, Washington, D.C.
0
10
20
30
40
50
60
70
80
90
2000
2001
2002
2003
2004
2005
2006
2007
2008
Manufacturing, value added (annual % growth)
Manufactures exports (% of merchandise exports)
Manufactures imports (% of merchandise imports)

Value chainIs it all about cheap labour?
• “In the Automotive sector, current capabilities, mainly of medium complexity, include
middleware and application development, sub-assembly design, digital manufacturing and
technical and plant simulation. Indian ESPs are expected to move up the value chain to
offer services around design automation, integrated system design, hardware and chip
design, etc.”
• “Within Telecom, over the last few years, Indian ESPs have moved up from CAD,
conversion services, embedded software design, etc. to high-end services such as system
level capabilities, customised control software and product conceptualisation, etc. Large
service providers have been providing design services for telecom products like mobile
phones, fixed phones, set top boxes, RFID devices, WiFi devices, switches, routers,
cables, etc.”
• “In Consumer Electronics, Indian ESPs have significant coverage of the entire product
development value chain from low, mid to high-end services. ESPs have moved up from
services like user interface design and testing, design evaluation, etc. to complete
development of embedded components, product conceptualisation, chip design, etc. Some
ESPs are mature enough to provide end-to-end services including low volume production.”
Source: Global E&&D: Accelerating Innovation with Indian Engineering (NASSCOM & booz&co, 2010)
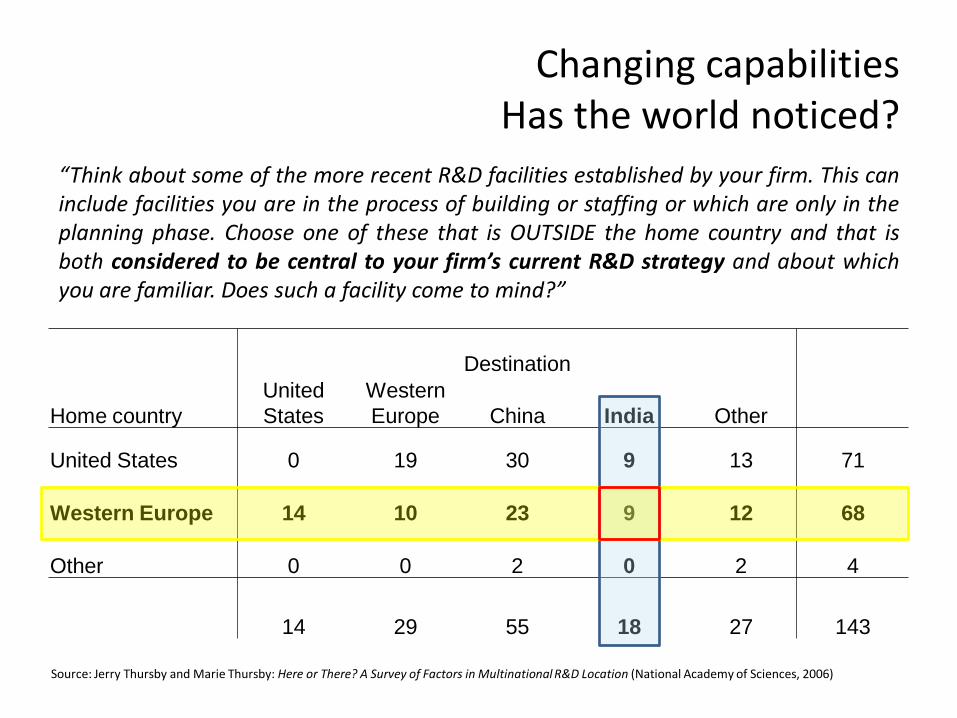
Changing capabilitiesHas the world noticed?
Destination
Home country
United
States
Western
Europe China India Other
United States 0 19 30 9 13 71
Western Europe 14 10 23 9 12 68
Other 0 0 2 0 2 4
14 29 55 18 27 143
“Think about some of the more recent R&D facilities established by your firm. This caninclude facilities you are in the process of building or staffing or which are only in theplanning phase. Choose one of these that is OUTSIDE the home country and that isboth considered to be central to your firm’s current R&D strategy and about whichyou are familiar. Does such a facility come to mind?”
Source: Jerry Thursby and Marie Thursby: Here or There? A Survey of Factors in Multinational R&D Location (National Academy of Sciences, 2006)
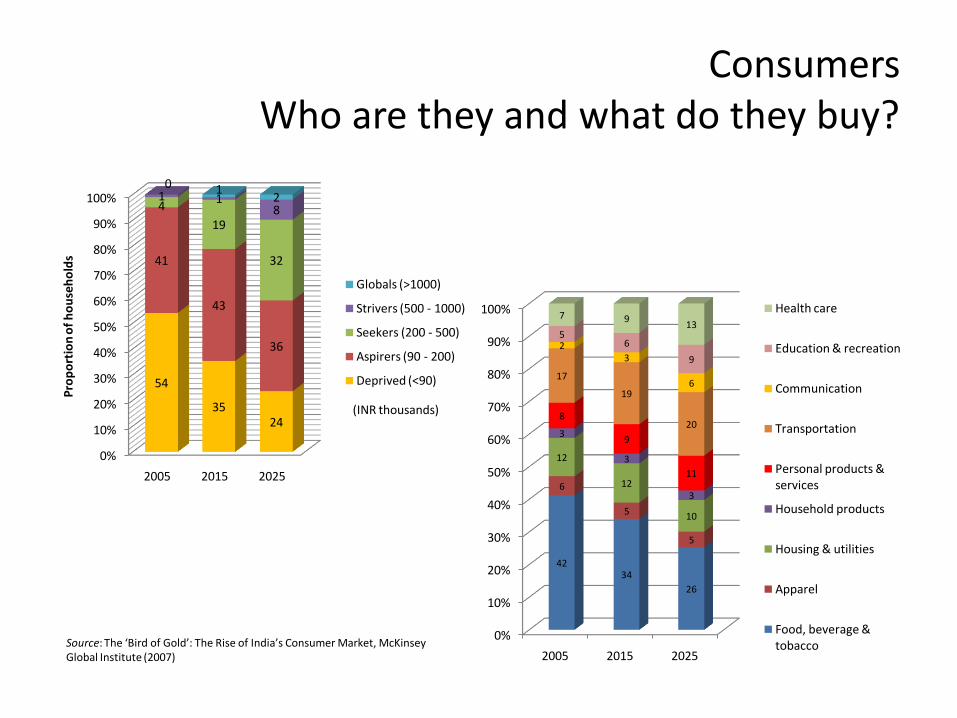
ConsumersWho are they and what do they buy?
0%
10%
20%
30%
40%
50%
60%
70%
80%
90%
100%
2005 2015 2025
54
3524
41
43
36
4
19
32
1 18
0 12
Pro
po
rtio
n o
f h
ou
seh
old
s
Globals (>1000)
Strivers (500 - 1000)
Seekers (200 - 500)
Aspirers (90 - 200)
Deprived (<90)
(INR thousands)
Source: The ‘Bird of Gold’: The Rise of India’s Consumer Market, McKinseyGlobal Institute (2007)
0%
10%
20%
30%
40%
50%
60%
70%
80%
90%
100%
2005 2015 2025
4234
26
6
5
5
12
12
10
3
3
3
8
9
11
17
19
20
23
6
56
9
7 913
Health care
Education & recreation
Communication
Transportation
Personal products & services
Household products
Housing & utilities
Apparel
Food, beverage & tobacco
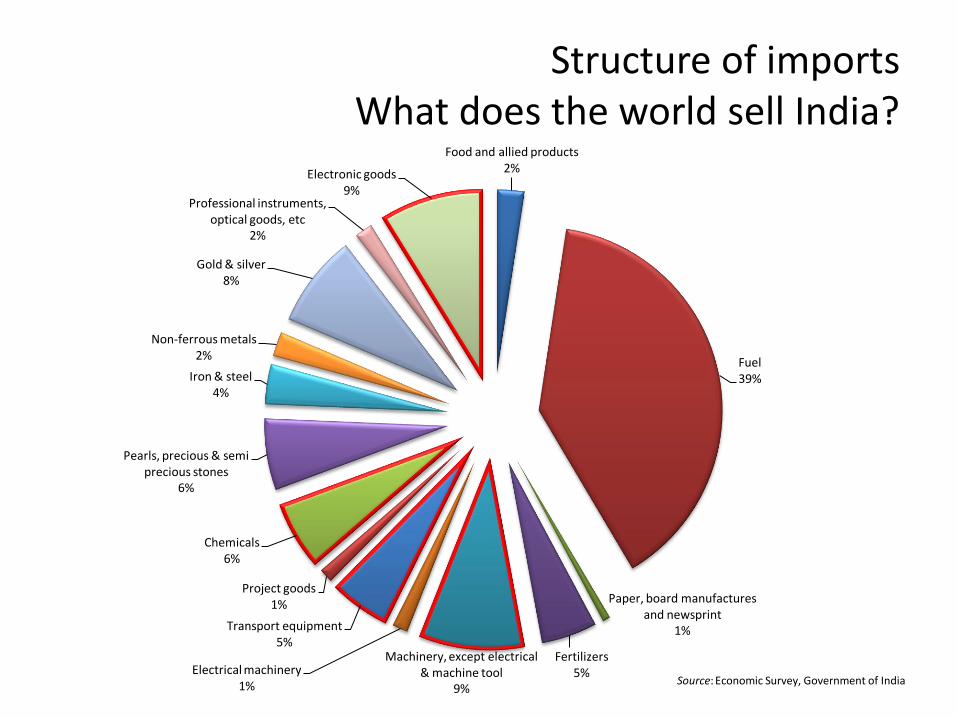
Structure of importsWhat does the world sell India?
Food and allied products2%
Fuel39%
Paper, board manufactures and newsprint
1%
Fertilizers5%
Machinery, except electrical & machine tool
9%
Electrical machinery1%
Transport equipment5%
Project goods1%
Chemicals6%
Pearls, precious & semi precious stones
6%
Iron & steel4%
Non-ferrous metals2%
Gold & silver8%
Professional instruments, optical goods, etc
2%
Electronic goods9%
Source: Economic Survey, Government of India
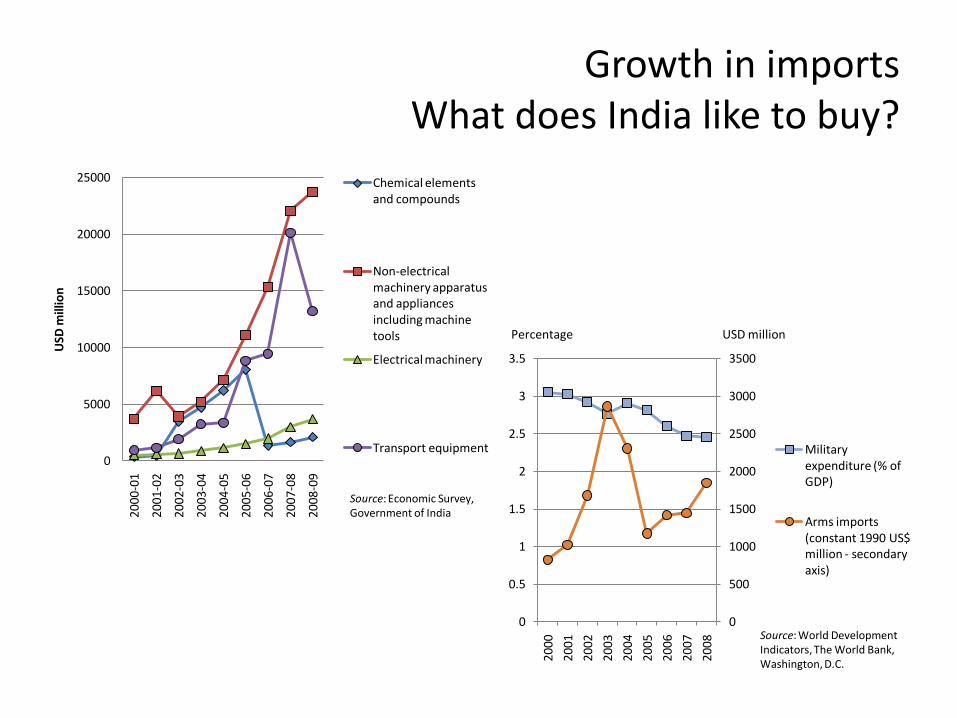
Growth in importsWhat does India like to buy?
0
5000
10000
15000
20000
25000
2000
-01
2001
-02
2002
-03
2003
-04
2004
-05
2005
-06
2006
-07
2007
-08
2008
-09
USD
mill
ion
Chemical elements and compounds
Non-electrical machinery apparatus and appliances including machine tools
Electrical machinery
Transport equipment
Source: Economic Survey, Government of India
0
500
1000
1500
2000
2500
3000
3500
0
0.5
1
1.5
2
2.5
3
3.5
2000
2001
2002
2003
2004
2005
2006
2007
2008
Military expenditure (% of GDP)
Arms imports (constant 1990 US$ million - secondary axis)
Source: World DevelopmentIndicators, The World Bank, Washington, D.C.
USD millionPercentage
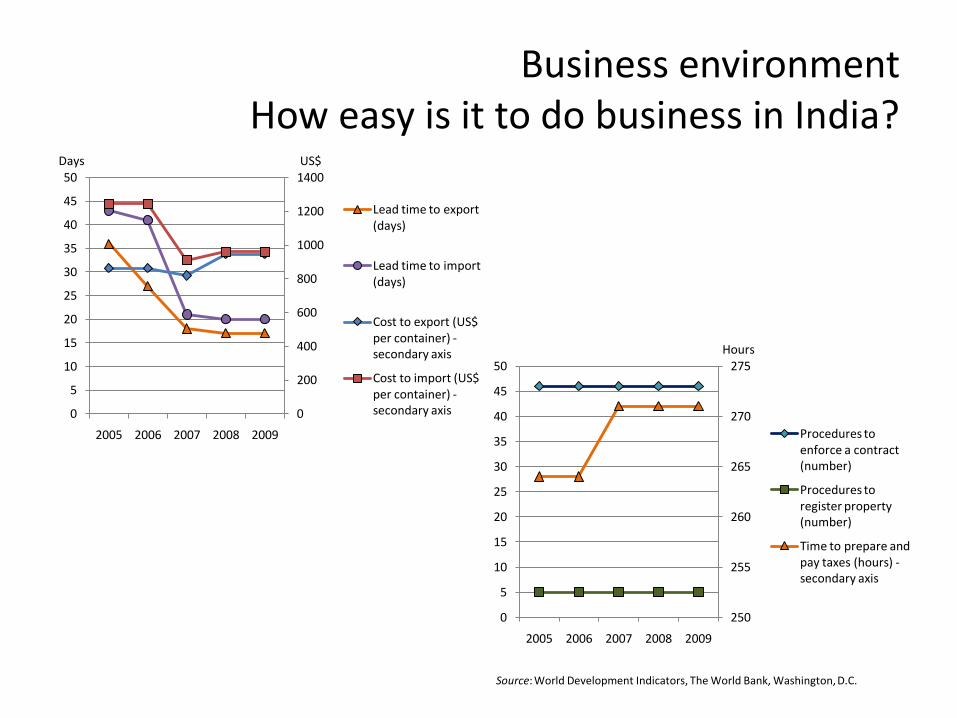
Business environmentHow easy is it to do business in India?
0
200
400
600
800
1000
1200
1400
0
5
10
15
20
25
30
35
40
45
50
2005 2006 2007 2008 2009
Lead time to export (days)
Lead time to import (days)
Cost to export (US$ per container) -secondary axis
Cost to import (US$ per container) -secondary axis
250
255
260
265
270
275
0
5
10
15
20
25
30
35
40
45
50
2005 2006 2007 2008 2009
Procedures to enforce a contract (number)
Procedures to register property (number)
Time to prepare and pay taxes (hours) -secondary axis
Source: World Development Indicators, The World Bank, Washington, D.C.
US$Days
Hours

Business environmentThe politics of land
• “In a meeting held with the Hon’ble Chief Minister of West Bengal, Mr. Buddhadeb Bhattacharjee and Minister in Charge, Department of Commerce & Industries, Mr. Nirupam Sen, Mr. Ratan N. Tata, Chairman, Tata Sons & Tata Motors and Mr. Ravi Kant, Managing Director, Tata Motors, expressed their extreme anguish at the heightened level of agitation and hostility by the opposition parties …….. resulting in a concern for the physical security of their staff, contractors and vendors. Threats, intimidation and instances of assault and general obstruction in one form or the other have been the order of the day. It wastherefore with great regret that Mr. Tata and Mr. Ravi Kant conveyed to the Chief Minister that in the interest of the project’ssuccess and viability and in light of the opposition’s continued agitation, there was no option but to move the project out of the State of West Bengal. Mr. Tata and Mr. Ravi Kant expressed their deep appreciation of the State Government’s efforts to facilitate and support the NANO Project.”
(Source: http://www.tatamotors.com/our_world/press_releases.php?ID=392&action=Pull)
• “The Rs 54,000-crore project, billed as India's single largest FDI, failed to take off due to stiff opposition from farmers to part with their land. The project now delayed for five years as it had signed an agreement with the government in 2005 to set up a plant with an annual production capacity of 12 million tonnes. Recently, the environment ministry had asked the Orissa government to "stall all activities" related to the Posco project citing violation of green norms in land acquisition. The world's third largest steelmaker, Posco, requires a total of 4004 acres of land in the Jagarsinghpur district of mineral rich Orissa. Most of the required land falls under the green cover. The steel minister asked Posco to give adequate compensation, job opportunities, education and annuity to the people from whom land is acquired.”
(Source: http://economictimes.indiatimes.com/news/news-by-industry/indl-goods-/-svs/steel/Posco-to-get-land-soon-for-Rs-54000-cr-project-
Virbhadra-Singh/articleshow/6537335.cms)

Business environmentAvailability of skilled labour
0
5
10
15
20
25
30
35
Percentage distribution of 15-29 population with formal vocational training (2004-05)
Source: India Labour Report 2009 (Table 3), A report by TeamLease (www.teamlease.com) and IIJT (www.iijt.net)

Corporate landscapeWith whom will you do business?
Company Business lines Top executive
Adani EnterprisesPrivate merchant port, Coal trading, Edible oil manufacturing, Power transmission
Gautam Adani
Axis Bank Financial services Shikha SharmaBharat Heavy Electricals1 Electrical equipment K. Ravi KumarDr. Reddy's Laboratories2 Pharmaceuticals G.V. PrasadHCL Technologies3 IT services Vineet NayarHDFC Bank Financial services Aditya PuriHindalco Industries Aluminium, Copper Kumar M. BirlaInfosys Technologies IT services S. GopalkrishnanITC Tobacco, FMCG Yogesh DeveshwarJindal Steel & Power4 Steel Naveen JindalJSL Steel Steel Sajjan JindalKotak Mahindra Bank Financial services Uday KotakLarsen & Toubro Construction, engineering services A.M. NaikMahindra & Mahindra Commercial vehicles Anand G. MahindraSterlite Industries Metals & minerals Anil AgarwalTata Consultancy Services IT services N. Chandrasekharan
1 State ownership 68%, FII ownership 15%, Operates in 23 countries
2 Overseas markets including USA, UK and Germany account for 82% of sales
3 Projects include critical software for flight test of the Boeing 787 Dreamliner
4 Completely integrated vertically, from coal and iron ore mines to steel mills
Source: http://www.forbes.com/lists/2010/37/fab-50-10_Asias-Fab-50-Companies_Company.html

Indian corporatesIn what are they investing overseas?
0
25000
50000
75000
100000
0
5000
10000
15000
20000
1995
1996
1997
1998
1999
2000
2001
2002
2003
2004
2005
2006
2007
2008
2009
Flow (US$ million)
Stock (US$ million) - secondary axis
Source: UNCTAD (http://stats.unctad.org/fdi/ReportFolders/)
Automotive, 26, 7%
Steel, 9, 2%
Metals and minerals,
7, 2%
Petroleum and natural gas, 13, 4%
Information technology,
160, 43%
Telecom, 5, 1%
Chemicals, 24, 7%
Other, 35, 9%
Pharma and health care,
51, 14%
Consumer goods,
41, 11%
Source: Athukorala, Prema-Chandra (2009), “Outward foreign direct investment fromIndia,” Asian Development Review, vol. 26, no. 2, pp. 125-153 (Table 5)
Flow, US$ million Stock, US$ million
(sector, number of deals, proportion of total)

What does all these mean?
• Large and growing consumer base
• Export opportunities for engineering and chemical industries
• Investment opportunities for skill and R&D intensive companies (or units of companies)
• Local experience likely to be quite useful
• Local companies increasingly global and professional, but with strong family ties
• Local companies increasingly investing abroad to develop capabilities and market presence


![[Amarboi.com] Kon Pathe Gelo Gaan - Kabir Sumon](https://static.fdocuments.net/doc/165x107/56d6c0531a28ab301699e63a/amarboicom-kon-pathe-gelo-gaan-kabir-sumon.jpg)


