China / Hong Kong Monthly Chart Book HK Property
32
Page 1 ed TH / sa- AH Hotel supply in focus Hotel inventory concentrated in Yau Tsim Mong Hotel room supply growth to moderate slightly Major hotels in the pipeline located in North Point, Wan Chai & Tsim Sha Tsui Hotel inventory concentrated in Yau Tsim Mong. As at June 2016, there were 259 hotels in Hong Kong with a total of 74,155 rooms. High Tariff A and High Tariff B hotels accounted for 24.4% and 37.3% of total inventory of hotel rooms. Medium Tariff hotels made up 31.6% of the total with the balance made up of unclassified hotels. In terms of locations, Yau Tsim Mong (Yau Ma Tei/Tsim Sha Tsui/Mongkok) is most concentrated hotel district in Hong Kong with 23,200 rooms, representing 31.3% of the total hotel stock as at June 2016. This is followed by Wan Chai (13.3%) and Central and Western districts (11.6%). Moreover, Kowloon City and Eastern Hong Kong account for 9.1% and 6.7% of the total hotel room inventory. Kwai Tsing, Shatin, Tsuen Wan and Island districts each made up of 4-6% of hotel rooms available. Including guesthouses, there are 86,074 rooms available as at June 2016. Hotel room supply growth to moderate slightly Our analysis suggests that hotel room supply will increase at 5-year CAGR of 3.5% between 2015 and 2020. The growth rate is envisaged to be slightly slower than in the past five or ten years. In 2006-2015, hotel supply room increased at 10-year CAGR of 5.3%, with growth stronger during 2006-10 at 6.6%, moderating to 4.1% between 2011-15. Major hotels in the pipeline. Shangri-la Asia will launch Kerry Hotel Hong Kong (546 rooms) on the Hung Hom harbourfront in late-2016, marking the fourth hotel owned by this hotel group in Hong Kong. Two hotels are being built along the North Point waterfront sites acquired via government tender, to provide 1,520 units upon completion in 2018-19, representing c.30% of existing supply in the Eastern Hong Kong. New World Development is constructing a 3m square foot mixed-use project on the Tsim Sha Tsui waterfront. About one-third of the gross floor area will be earmarked for hotel use. Superstructure works are currently underway. This hotel will be launched under the “Rosewood” brand and open for business in 2018. Harbour Centre Development is converting an iconic Murray Building into an urban chic hotel, with total investment of around HK$7bn. Targeted for opening in late 2017, this luxury hotel will operate under the Niccolo brand, offering 336 guest rooms. This hotel will also be the first High Tariff A hotel in Central/Admiralty since the opening of Upper House at Pacific Place in 2009. Hopewell Holdings is developing Hopewell Centre II in Wan Chai, which includes a conference hotel with 1,024 rooms. Targeted to start operations in 2019, this hotel will be the largest conference hotel in Hong Kong with comprehensive conference facilities. HSI: 22,811 ANALYST Jeff YAU CFA +852 2820 4912 [email protected] Andrew LAM Andrewr_lam@ hk.dbsvickers.com Hotel room supply 0 10,000 20,000 30,000 40,000 50,000 60,000 70,000 80,000 90,000 100,000 2006 2007 2008 2009 2010 2011 2012 2013 2014 2015 2016F 2017F 2018F 2019F 2020F Source: HKTB, DBS Vickers estimates Hotel room supply by district (Jun-16) Central/We stern HK 12% Easter HK 7% Souther HK 2% Wan Chai 13% Kowloon city 9% Kwun Tong 2% Sham Shui Po 0% Wong Tai Sin 1% Yau Tsim Mong 31% Kwai Tsing 4% Sai Kung 1% Sha Tin 4% Tsuen Wan 5% Tuen Mun 1% Yuen Long 2% Islands 6% Source: HKTB DBS Group Research . Equity 3 Nov 2016 China / Hong Kong Monthly Chart Book HK Property (Issue No. 81) Refer to important disclosures at the end of this report
Transcript of China / Hong Kong Monthly Chart Book HK Property

Page 1
ed TH / sa- AH
Hotel supply in focus Hotel inventory concentrated in Yau Tsim Mong
Hotel room supply growth to moderate slightly
Major hotels in the pipeline located in North Point, Wan Chai & Tsim Sha Tsui
Hotel inventory concentrated in Yau Tsim Mong. As at June 2016, there were 259 hotels in Hong Kong with a total of 74,155 rooms. High Tariff A and High Tariff B hotels accounted for 24.4% and 37.3% of total inventory of hotel rooms. Medium Tariff hotels made up 31.6% of the total with the balance made up of unclassified hotels. In terms of locations, Yau Tsim Mong (Yau Ma Tei/Tsim Sha Tsui/Mongkok) is most concentrated hotel district in Hong Kong with 23,200 rooms, representing 31.3% of the total hotel stock as at June 2016. This is followed by Wan Chai (13.3%) and Central and Western districts (11.6%). Moreover, Kowloon City and Eastern Hong Kong account for 9.1% and 6.7% of the total hotel room inventory. Kwai Tsing, Shatin, Tsuen Wan and Island districts each made up of 4-6% of hotel rooms available. Including guesthouses, there are 86,074 rooms available as at June 2016. Hotel room supply growth to moderate slightly Our analysis suggests that hotel room supply will increase at 5-year CAGR of 3.5% between 2015 and 2020. The growth rate is envisaged to be slightly slower than in the past five or ten years. In 2006-2015, hotel supply room increased at 10-year CAGR of 5.3%, with growth stronger during 2006-10 at 6.6%, moderating to 4.1% between 2011-15. Major hotels in the pipeline. Shangri-la Asia will launch Kerry Hotel Hong Kong (546 rooms) on the Hung Hom harbourfront in late-2016, marking the fourth hotel owned by this hotel group in Hong Kong. Two hotels are being built along the North Point waterfront sites acquired via government tender, to provide 1,520 units upon completion in 2018-19, representing c.30% of existing supply in the Eastern Hong Kong. New World Development is constructing a 3m square foot mixed-use project on the Tsim Sha Tsui waterfront. About one-third of the gross floor area will be earmarked for hotel use. Superstructure works are currently underway. This hotel will be launched under the “Rosewood” brand and open for business in 2018. Harbour Centre Development is converting an iconic Murray Building into an urban chic hotel, with total investment of around HK$7bn. Targeted for opening in late 2017, this luxury hotel will operate under the Niccolo brand, offering 336 guest rooms. This hotel will also be the first High Tariff A hotel in Central/Admiralty since the opening of Upper House at Pacific Place in 2009. Hopewell Holdings is developing Hopewell Centre II in Wan Chai, which includes a conference hotel with 1,024 rooms. Targeted to start operations in 2019, this hotel will be the largest conference hotel in Hong Kong with comprehensive conference facilities.
HSI: 22,811 ANALYST Jeff YAU CFA +852 2820 4912 [email protected] Andrew LAM Andrewr_lam@ hk.dbsvickers.com
Hotel room supply
0
10,000
20,000
30,000
40,000
50,000
60,000
70,000
80,000
90,000
100,000
2006
2007
2008
2009
2010
2011
2012
2013
2014
2015
2016
F20
17F
2018
F20
19F
2020
F
Source: HKTB, DBS Vickers estimates
Hotel room supply by district (Jun-16)
Central/Western HK
12%
Easter HK7%
Souther HK2%
Wan Chai13%
Kowloon city9%
Kwun Tong2%Sham Shui
Po0%
Wong Tai Sin1%
Yau Tsim Mong31%
Kwai Tsing4%
Sai Kung1%
Sha Tin4%
Tsuen Wan5%
Tuen Mun 1%
Yuen Long2%
Islands6%
Source: HKTB
DBS Group Research . Equity 3 Nov 2016
China / Hong Kong Monthly Chart Book
HK Property (Issue No. 81) Refer to important disclosures at the end of this report

China / Hong Kong Monthly Chart Book
HK Property
Page 2
Hotel Project in North Point Estate Lane/Shu Kuk Street
Hotel Project in Oil Street, North Point
Murray Building Hotel Project
Rosewood Hong Kong, Tsim Sha Tsui
Hopewell Centre II
Kerry Hotel, Hong Kong
Source: DBS Vickers

China / Hong Kong Monthly Chart Book
HK Property
Page 3
TABLE OF CONTENTS
Share price performance 4
What were the transaction trends in primary and secondary markets? 9
What are the factors affecting residential demand and supply? 11
What projects were launched? 13
Where are the upcoming projects? 14
How about the office market? 15
How about the retail market? 16
What did corporates do? 18
Discount to NAV – Property developers & investors 20
Discount to NAV band – Property developers & investors 23
Price to book NAV band - REITs 26
Historical yield band - REITs 27
Any important dates to look out for? 28
Our past publications 29

China / Hong Kong Monthly Chart Book
HK Property
Page 4
Share price performance
Property developer index vs HSI Property developer index vs HSI (6 month)
0
50
100
150
200
250
300
350
Jan/
01
Jan/
02
Jan/
03
Jan/
04
Jan/
05
Jan/
06
Jan/
07
Jan/
08
Jan/
09
Jan/
10
Jan/
11
Jan/
12
Jan/
13
Jan/
14
Jan/
15
Jan/
16
HK property developers share price index HSI
Rebased (01 Jan 01 = 100)
70
80
90
100
110
120
130
Apr
/16
May
/16
Jun/
16
Jul/1
6
Aug
/16
Sep/
16
Oct
/16
HK property developers share price index HSI
Rebased (29 Apr 16 = 100)
Property investor vs HSI Property investor index vs HSI (6 month)
0
100
200
300
400
500
600
Jan/
01
Jan/
02
Jan/
03
Jan/
04
Jan/
05
Jan/
06
Jan/
07
Jan/
08
Jan/
09
Jan/
10
Jan/
11
Jan/
12
Jan/
13
Jan/
14
Jan/
15
Jan/
16
HK property investors share price index HSI
70
80
90
100
110
120
130
140
Apr
/16
May
/16
Jun/
16
Jul/1
6
Aug
/16
Sep/
16
Oct
/16
HK property investors share price index HSI
REIT vs HSI REIT index vs HSI (6 month)
40
90
140
190
240
290
340
Jan/
07Ju
l/07
Jan/
08Ju
l/08
Jan/
09Ju
l/09
Jan/
10Ju
l/10
Jan/
11Ju
l/11
Jan/
12Ju
l/12
Jan/
13Ju
l/13
Jan/
14Ju
l/14
Jan/
15Ju
l/15
Jan/
16Ju
l/16
REITs share price index HSI
Rebased (29 Dec 06 = 100)
70 75 80 85 90 95
100 105 110 115 120
Apr
/16
May
/16
Jun/
16
Jul/1
6
Aug
/16
Sep/
16
Oct
/16
REITs share price index HSI
Rebased (29 Apr 16 = 100)
Source: Thomson Reuters; DBS Vickers

China / Hong Kong Monthly Chart Book
HK Property
Page 5
Valuation – Property developers
Disc. to
Mkt Last 12-m PE PE J ul-17 J ul-17 Y ield Y ieldCompany Code F YE Cap Price target Recom F Y16 F Y17 NA V NA V F Y16 F Y17
HK$bn HK$ HK$ x x HK$ % % %
Henderson Land 12 HK Dec 168 46.25 51.75 Buy 12.2 16.2 79.6 (42) 3.5 3.5
K Wah Int'l 173 HK Dec 13 4.24 4.50 Buy 6.1 8.0 11.2 (62) 4.0 4.0Kerry Props 683 HK Dec 35 24.45 25.70 Buy 9.8 7.1 73.4 (67) 3.7 3.7
Lai Sun Dev 488 HK Jul 3 0.159 0.220 Buy 12.2 14.2 0.6 (75) 1.2 1.2
MTR Corp 66 HK Dec 253 42.90 40.45 Hold 27.0 26.2 46.6 (8) 7.6 7.6New World Dev 17 HK Jun 91 9.73 11.20 Buy 12.9 12.6 22.4 (57) 4.5 4.5
Sino Land 83 HK Jun 78 12.70 15.40 Buy 14.5 15.1 23.7 (46) 4.0 4.0
SHKP 16 HK Jun 340 117.30 132.00 Buy 14.0 13.7 203.1 (42) 3.3 3.3Tai Cheung 88 HK Mar 4 6.58 7.89 Buy 18.0 12.6 19.7 (67) 4.6 4.6
Wheelock & Co. 20 HK Dec 98 48.15 46.35 Buy 9.3 9.1 57.9 (17) 2.5 2.5
Wing Tai Properties 369 HK Dec 6 4.81 5.46 Buy 16.3 15.7 15.8 (70) 3.1 3.1
^ ^
^ Included proposed special dividend Source: Thomson Reuters, DBS Vickers
Valuation – Property investors
Disc . t oM k t Last 12- m PE PE J u l- 17 J u l- 17 Y ield Y ield
Company Code F Y E Cap Price t arget Recom F Y 16 F Y 17 NA V NA V F Y 16 F Y 17
HK $bn HK $ HK $ x x HK $ % % %
Hang Lung Props 101 HK Dec 76 17.00 15.40 Hold 15.1 14.5 34.2 (50) 4.4 4.4
HK Land @ HKL SP Dec 16 6.62 7.87 Buy 18.0 16.7 12.1 (45) 2.9 2.9Hysan Dev 14 HK Dec 37 35.25 35.65 Hold 15.8 15.6 64.8 (46) 3.9 3.9
Swire Props 1972 HK Dec 129 22.00 26.45 Buy 19.0 17.1 40.7 (46) 3.2 3.2Wharf 4 HK Dec 179 59.00 56.00 Hold 14.1 13.7 86.2 (32) 3.5 3.6
@ denominated in USD
Source: Thomson Reuters, DBS Vickers
Valuation – REITs
M k t Last 12- m Y ield Y ield Y ield Price/
REIT Code F Y E Cap Pric e T arget Recom F Y 15A F Y 16F F Y 17F BV
HK $m HK $ HK $ % % % (x )
Champion REIT* 2778 HK Dec 25,512 4.40 4.94 Buy 4.5 5.1 5.1 0.51
J inmao Investments* 6139 HK Dec 7,960 3.98 4.93 Hold 10.9 9.3 9.3 0.99
Langham Hospitality^ 1270 HK Dec 6,388 3.09 n.a. NR 8.1 7.9 7.5 0.54
New Century REIT^ 1275 HK Dec 2,397 2.52 n.a. NR 12.9 7.7 6.9 0.88
Regal REIT^ 1881 HK Dec 6,678 2.05 n.a. NR 7.5 n.a. n.a. 0.50
Spring REIT^ 1426 HK Dec 3,632 3.22 n.a. NR 8.3 7.7 7.5 0.50
Sunlight REIT* 435 HK J un 7,837 4.78 5.22 Buy 4.6 5.1 5.1 0.58
Link REIT* 823 HK Mar 122,166 54.75 60.30 Buy 3.3 3.8 4.1 0.96
Yuexiu REIT^ 405 HK Dec 12,656 4.43 n.a. NR 6.3 6.8 6.6 0.80 @ denominated in RMB ^ DPU based on consensus Source: Thomson Reuters, *DBS Vickers

China / Hong Kong Monthly Chart Book
HK Property
Page 6
Trading range comparison – Property developers and investors
LastPrice
F Y16FP/E atHighPrice
F Y16FP/E at
LowPrice
Discountto NAVat High
Price
Discountto NAVat Low
PriceHighPrice
LowPrice
HighPrice
LowPrice
HighPrice
LowPrice
HK$ x x % % HK$ HK$ HK$ HK$ HK$ HK$
Property dev elopers
Henderson Land 12 HK 46.25 12.5 11.9 -41% -44% 47.40 45.15 47.40 45.15 46.90 45.15
K Wah Int'l 173 HK 4.24 6.3 5.5 -60% -64% 4.38 3.88 4.38 4.10 4.34 4.12
Kerry Properties 683 HK 24.45 10.3 8.5 -65% -71% 25.50 21.05 25.50 22.60 25.40 24.15
Lai Sun Dev 488 HK 0.159 13.0 10.4 -72% -78% 0.17 0.14 0.17 0.15 0.17 0.16
MTR Corp 66 HK 42.90 27.6 26.4 -3% -7% 43.85 41.90 43.85 41.90 43.80 42.10
New World Dev 17 HK 9.73 13.7 11.7 -52% -59% 10.34 8.82 10.34 9.56 10.18 9.56
Sino Land 83 HK 12.70 16.4 14.5 -39% -46% 14.34 12.70 14.34 12.70 14.12 12.70
SHKP 16 HK 117.30 14.4 12.7 -39% -47% 120.90 106.10 120.90 111.90 118.40 113.20
Tai Cheung 88 HK 6.58 18.4 16.7 -66% -69% 6.74 6.11 6.65 6.11 6.65 6.22
Wheelock & Co 20 HK 48.15 9.4 7.8 -18% -32% 48.70 40.35 48.70 43.90 48.70 44.75
Wing Tai Properties 369 HK 4.81 16.8 15.7 -68% -70% 4.98 4.64 4.98 4.78 4.89 4.78
Property inv estors
Hang Lung Props 101 HK 17.00 17.0 14.6 -43% -51% 19.10 16.36 19.10 17.00 17.80 17.00
HK Land^ HKL SP 6.62 19.6 16.6 -37% -46% 7.19 6.12 7.19 6.43 7.15 6.62
Hysan Dev 14 HK 35.25 17.2 15.8 -42% -46% 38.35 35.25 38.35 35.25 37.60 35.25
Swire Properties 1972 HK 22.00 20.4 18.5 -40% -46% 23.70 21.40 23.70 21.80 22.85 21.90
Wharf 4 HK 59.00 14.3 12.1 -33% -43% 59.95 50.75 59.95 54.25 59.95 54.25
Sector Av erage - Dev elopers 14.3 12.8 -34% -39%Sector Av erage - Inv estors 17.7 15.5 -38% -46%Hang Seng Index 13.0 11.8
- - Last 1 month - -- - Last 2 month - -- - Last 3 month - - - - Last 3 month - - - - Last 3 month - -
^ denominated in USD
Source: Thomson Reuters; DBS Vickers

China / Hong Kong Monthly Chart Book
HK Property
Page 7
Trading range comparison – REITs
LastPrice
F Y16FDiv y ield
at HighPrice
F Y16FDiv
y ield atLowPrice
P/BV atHigh Price
P/BV atLow Price
HighPrice
LowPrice
HighPrice
LowPrice
HighPrice
LowPrice
HK$ % % x x HK$ HK$ HK$ HK$ HK$ HK$
REIT s
Champion REIT 2778 HK 4.40 4.5 5.1 0.58 0.51 5.00 4.40 4.98 4.40 4.75 4.40
J inmao Investments 6139 HK 3.98 8.4 9.4 1.10 0.98 4.42 3.95 4.42 3.95 4.24 3.98
Langham Hospitality 1270 HK 3.09 7.5 8.8 0.57 0.49 3.26 2.77 3.26 3.06 3.13 3.07
New Century REIT 1275 HK 2.52 7.5 9.0 0.91 0.75 2.60 2.16 2.60 2.16 2.52 2.22
Regal REIT 1881 HK 2.05 n.a. n.a. 0.53 0.49 2.19 2.04 2.19 2.04 2.08 2.05
Spring REIT 1426 HK 3.22 7.0 7.7 0.56 0.50 3.57 3.22 3.57 3.22 3.45 3.22
Sunlight REIT 435 HK 4.78 4.8 5.1 0.61 0.57 5.02 4.74 5.02 4.74 4.97 4.74
Link REIT 823 HK 54.75 3.6 3.8 1.02 0.96 58.00 54.45 58.00 54.45 58.00 54.45
Yuexiu REIT 405 HK 4.43 5.6 6.6 0.92 0.80 5.14 4.43 5.08 4.43 4.74 4.43
Sector A v erage - REIT s 6.1 6.8 0.74 0.67Hang Seng Index 3.4 3.8
@ denominated in RMB
Source: Thomson Reuters; DBS Vickers

China / Hong Kong Monthly Chart Book
HK Property
Page 8
Share price movement comparison (%)
1- w k 2- w k 1- mt h 3- mt h 6- mth 1- y r Y T D 2012 2013 2014 2015
Henderson Land (0.4) 1.8 0.5 (0.6) 4.9 5.0 7.1 41.7 (11.0) 35.0 (3.8)K Wah Int'l (2.3) 2.4 0.2 7.0 17.8 31.9 32.7 89.3 26.0 (10.0) (15.6)
Kerry Properties (2.2) 0.2 (3.7) 14.5 15.6 7.2 15.6 56.6 (33.2) 4.6 (24.9)
Lai Sun Development (3.0) 0.0 2.6 10.4 37.1 16.1 39.5 192.0 (31.2) (15.9) (32.5)
MTR Corp (0.8) (0.7) 0.5 (1.7) 11.7 22.6 11.7 21.3 (3.8) 8.3 20.8New World Dev (0.2) 0.7 (3.5) 6.5 25.7 19.5 27.0 92.0 (16.3) (3.2) (14.1)
Sino Land (4.4) (2.8) (7.4) (9.8) 3.9 8.5 11.8 26.0 (24.0) 18.1 (9.3)
SHKP 1.6 2.2 0.2 6.1 19.6 16.6 25.3 19.4 (15.4) 20.3 (20.9)
Tai Cheung 0.3 2.7 5.8 1.9 10.8 5.8 6.0 33.7 (7.6) 8.7 (2.7)Wing Tai Properties 0.0 (0.8) (1.4) 3.7 2.3 8.8 7.4 106.1 (5.7) 5.0 (10.4)Wheelock and Co. 1.0 4.0 5.2 16.3 33.8 36.0 47.5 102.7 (8.6) 1.5 (9.8)
Hang Lung Properties (2.3) 0.0 (2.5) (0.2) 9.8 (8.5) (3.6) 39.4 (20.5) (11.2) (18.9)
HK Land (2.4) (3.9) (6.8) 5.9 4.3 (10.5) (5.4) 54.0 (15.6) 14.6 3.6Hysan Development (3.7) (1.4) (3.0) (1.8) 2.6 3.1 11.0 46.1 (10.3) 3.7 (8.4)
Swire Properties (2.7) (1.6) (3.1) 1.9 8.9 (4.3) (1.8) n.a. (24.2) 16.8 (2.2)
Wharf Holdings 1.5 6.2 4.5 9.5 40.1 28.3 37.2 72.6 (2.1) (5.6) (23.2)
Champion REIT (1.6) (2.0) (6.4) (3.3) 5.8 8.9 13.4 27.1 (7.5) 5.0 7.8Yuexiu REIT (1.8) (2.6) (6.1) (5.7) 3.0 7.8 6.5 7.3 2.7 2.9 6.9
Link REIT (2.6) (2.3) (3.9) (3.6) 16.1 16.5 18.0 35.3 (2.8) 29.1 (4.4)
Regal REIT (0.5) 0.0 (0.5) (0.5) 3.0 4.1 5.7 24.0 0.5 (8.1) (5.4)
Sunlight REIT 0.4 (2.2) (3.2) (2.4) 16.9 21.3 24.8 48.6 (9.1) 16.7 9.4Spring REIT (3.0) (4.2) (4.5) (8.3) (4.7) 3.5 6.3 n.a. n.a. 15.5 (17.2)
New Century REIT 3.3 7.2 12.0 (0.8) (6.7) (17.1) (13.1) n.a. n.a. (9.3) (12.1)
Great Eagle 0.4 0.1 (1.2) (4.5) 9.0 35.5 35.8 68.6 3.3 (4.9) 0.2
Far East Consort.Intl. (1.6) (1.9) 1.3 20.9 27.0 16.6 11.5 90.1 40.7 8.9 3.5
HSI Index (2.2) (2.1) (2.1) 3.1 8.3 2.0 4.1 22.9 2.9 1.3 (7.2)
HSP Index 0.3 1.1 (2.3) 0.7 12.4 9.1 11.6 37.6 (9.2) 7.2 (2.1)
Source: Thomson Reuters

China / Hong Kong Monthly Chart Book
HK Property
Page 9
Residential
What were the transaction trends in primary and secondary markets?
Primary market transaction volume
Primary market transaction value
0
500
1,000
1,500
2,000
2,500
3,000
3,500
4,000
Jan-
09A
pr-0
9Ju
l-09
Oct
-09
Jan-
10A
pr-1
0Ju
l-10
Oct
-10
Jan-
11A
pr-1
1Ju
l-11
Oct
-11
Jan-
12A
pr-1
2Ju
l-12
Oct
-12
Jan-
13A
pr-1
3Ju
l-13
Oct
-13
Jan-
14A
pr-1
4Ju
l-14
Oct
-14
Jan-
15A
pr-1
5Ju
l-15
Oct
-15
Jan-
16A
pr-1
6Ju
l-16
No of units Sep-16
113.7% m-o-m
118.7% y-o-y
9M16
-1.7% y-o-y
0
5,000
10,000
15,000
20,000
25,000
30,000
35,000
Jan-
09A
pr-0
9Ju
l-09
Oct
-09
Jan-
10A
pr-1
0Ju
l-10
Oct
-10
Jan-
11A
pr-1
1Ju
l-11
Oct
-11
Jan-
12A
pr-1
2Ju
l-12
Oct
-12
Jan-
13A
pr-1
3Ju
l-13
Oct
-13
Jan-
14A
pr-1
4Ju
l-14
Oct
-14
Jan-
15A
pr-1
5Ju
l-15
Oct
-15
Jan-
16A
pr-1
6Ju
l-16
HK$mSep-16
99.7% y-o-y
85.9% m-o-m
9M16
-5.6% y-o-y
Source: Centaline Property Agency Source: Centaline Property Agency
Secondary market transaction volume
Secondary market transaction value
0
2,000
4,000
6,000
8,000
10,000
12,000
14,000
Jan-
09A
pr-0
9Ju
l-09
Oct
-09
Jan-
10A
pr-1
0Ju
l-10
Oct
-10
Jan-
11A
pr-1
1Ju
l-11
Oct
-11
Jan-
12A
pr-1
2Ju
l-12
Oct
-12
Jan-
13A
pr-1
3Ju
l-13
Oct
-13
Jan-
14A
pr-1
4Ju
l-14
Oct
-14
Jan-
15A
pr-1
5Ju
l-15
Oct
-15
Jan-
16A
pr-1
6Ju
l-16
No of units Sep-16
5.5% m-o-m63% y-o-y
9M16
-24% y-o-y
0 5,000
10,000 15,000 20,000 25,000 30,000 35,000 40,000 45,000 50,000
Jan-
09A
pr-0
9Ju
l-09
Oct
-09
Jan-
10A
pr-1
0Ju
l-10
Oct
-10
Jan-
11A
pr-1
1Ju
l-11
Oct
-11
Jan-
12A
pr-1
2Ju
l-12
Oct
-12
Jan-
13A
pr-1
3Ju
l-13
Oct
-13
Jan-
14A
pr-1
4Ju
l-14
Oct
-14
Jan-
15A
pr-1
5Ju
l-15
Oct
-15
Jan-
16A
pr-1
6Ju
l-16
HK$mSep-16
49.1% y-o-y
10% m-o-m
9M16
-26.1% y-o-y
Source: Centaline Property Agency Source: Centaline Property Agency

China / Hong Kong Monthly Chart Book
HK Property
Page 10
Confirmor – Overall
Confirmor – Over HK$7m
0%1%2%3%4%5%6%7%8%9%10%
0 200 400 600 800
1,000 1,200 1,400 1,600 1,800
Jul-9
5Ju
l-96
Jul-9
7Ju
l-98
Jul-9
9Ju
l-00
Jul-0
1Ju
l-02
Jul-0
3Ju
l-04
Jul-0
5Ju
l-06
Jul-0
7Ju
l-08
Jul-0
9Ju
l-10
Jul-1
1Ju
l-12
Jul-1
3Ju
l-14
Jul-1
5Ju
l-16
No. of cases of confirmor (LHS)
As a % of total secondary registrations (RHS)
Sep-16 0, 0%
Aug-16 0, 0%
0%
5%
10%
15%
20%
25%
30%
0
50
100
150
200
250
300
350
Jul-9
5Ju
l-96
Jul-9
7Ju
l-98
Jul-9
9Ju
l-00
Jul-0
1Ju
l-02
Jul-0
3Ju
l-04
Jul-0
5Ju
l-06
Jul-0
7Ju
l-08
Jul-0
9Ju
l-10
Jul-1
1Ju
l-12
Jul-1
3Ju
l-14
Jul-1
5Ju
l-16
No. of cases of confirmor (LHS)
As a % of over $7m secondary registrations (RHS)
Sep-16 0, 0%
Aug-16 0, 0%
Source: Centaline Property Agency Source: Centaline Property Agency
Centa-City leading index (Secondary market price index)
Residential rents (Based on saleable area)
(4)
(2)
0
2
4
6
8
50
70
90
110
130
150
170
Jan-
09M
ay-0
9Se
p-09
Jan-
10M
a y-1
0Se
p-10
Jan-
11M
a y-1
1Se
p-11
Jan-
12M
a y-1
2Se
p-12
Jan-
13M
a y-1
3Se
p-13
Jan-
14M
a y-1
4Se
p-14
Jan-
15M
a y-1
5Se
p-15
Jan-
16M
a y-1
6Se
p-16
Mom growth (RHS) CCL Index (LHS)
%
3.5% m-o-m
6.1% ytd
Sep-16
5 10 15 20 25 30 35 40 45
Jan-
07Ju
l-07
Jan-
08Ju
l-08
Jan-
09Ju
l-09
Jan-
10Ju
l-10
Jan-
11Ju
l-11
Jan-
12Ju
l-12
Jan-
13Ju
l-13
Jan-
14Ju
l-14
Jan-
15Ju
l-15
Jan-
16Ju
l-16
Hong Kong KowloonNew Territories East New Territories WestOverall
HK$psf Sep-16
Overall: 0.5% m-o-m-3.2% y-o-y
Source: Centaline Property Agency Source: Centaline Property Agency

China / Hong Kong Monthly Chart Book
HK Property
Page 11
What are the factors affecting residential demand and supply?
Real GDP growth
Unemployment rate
(10)
(8)
(6)
(4)
(2)
0
2
4
6
8
10
1Q05
3Q05
1Q06
3Q06
1Q07
3Q07
1Q08
3Q08
1Q09
3Q09
1Q10
3Q10
1Q11
3Q11
1Q12
3Q12
1Q13
3Q13
1Q14
3Q14
1Q15
3Q15
1Q16
%2Q16: 1.7% y-o-y
2
3
4
5
6
7
8
9
Jan-
01
Jan-
02
Jan-
03
Jan-
04
Jan-
05
Jan-
06
Jan-
07
Jan-
08
Jan-
09
Jan-
10
Jan-
11
Jan-
12
Jan-
13
Jan-
14
Jan-
15
Jan-
16
%Jul-16 -Sep-16: 3.4%
Jun-16 -Aug-16: 3.4%
Source: CEIC Source: CEIC
3-mth HIBOR vs Prime rate
Effective mortgage rate
0.0 1.0 2.0 3.0 4.0 5.0 6.0 7.0 8.0 9.0
Jan-
07Ju
l-07
Jan-
08Ju
l-08
Jan-
09Ju
l-09
Jan-
10Ju
l-10
Jan-
11Ju
l-11
Jan-
12Ju
l-12
Jan-
13Ju
l-13
Jan-
14Ju
l-14
Jan-
15Ju
l-15
Jan-
16Ju
l-16
3-mth HIBOR HK Prime rate
% Sep-16
3-mth HIBOR: 0.59%Prime rate: 5%
0
2
4
6
8
10
12
Jan-
96Ja
n-97
Jan-
98Ja
n-99
Jan-
00Ja
n-01
Jan-
02Ja
n-03
Jan-
04Ja
n-05
Jan-
06Ja
n-07
Jan-
08Ja
n-09
Jan-
10Ja
n-11
Jan-
12Ja
n-13
Jan-
14Ja
n-15
Jan-
16
% Sep-16: 1.67%
Aug-16: 1.65%
Source: CEIC Source: CEIC, DBS Vickers

China / Hong Kong Monthly Chart Book
HK Property
Page 12
Housing affordability – private households
Rental yields (mass market projects) (Based on Saleable Area)
0%
20%
40%
60%
80%
100%
120%
Jan-
94Ja
n-95
Jan-
96Ja
n-97
Jan-
98Ja
n-99
Jan-
00Ja
n-01
Jan-
02Ja
n-03
Jan-
04Ja
n-05
Jan-
06Ja
n-07
Jan-
08Ja
n-09
Jan-
10Ja
n-11
Jan-
12Ja
n-13
Jan-
14Ja
n-15
Jan-
16
Prime base HIBOR base
Prime base HIBOR base
Sep-16
Aug-16 50.1
51.6
48.2%
49.4%
3%
4%
5%
6%
7%
Jul-9
5Ju
l-96
Jul-9
7Ju
l-98
Jul-9
9Ju
l-00
Jul-0
1Ju
l-02
Jul-0
3Ju
l-04
Jul-0
5Ju
l-06
Jul-0
7Ju
l-08
Jul-0
9Ju
l-10
Jul-1
1Ju
l-12
Jul-1
3Ju
l-14
Jul-1
5Ju
l-16
Sep-163.34%
Source: Centaline Property Agencys Source: Centaline Property Agency
Yield spread
Housing supply
(10)
(8)
(6)
(4)
(2)
0
2
4
6
Jan-
96Ja
n-97
Jan-
98Ja
n-99
Jan-
00Ja
n-01
Jan-
02Ja
n-03
Jan-
04Ja
n-05
Jan-
06Ja
n-07
Jan-
08Ja
n-09
Jan-
10Ja
n-11
Jan-
12Ja
n-13
Jan-
14Ja
n-15
Jan-
16
%
Jun-03
Max:
3.77%
0 5,000
10,000 15,000 20,000 25,000 30,000 35,000 40,000
1996
1997
1998
1999
2000
2001
2002
2003
2004
2005
2006
2007
2008
2009
2010
2011
2012
2013
2014
2015
2016
E20
17E
2018
E20
19E
2020
E
Completion No of primary units sold
Average
No of units
Average completion (96-15)
17,988 units
Source: CEIC, Centaline Property Agency, DBS Vickers Source: DBS Vickers

China / Hong Kong Monthly Chart Book
HK Property
Page 13
What projects were launched?
Project launches (Oct 2016)
e
Launch Project s Locat ion Dev eloper TotalUnit s
Unit ssold
% sold A SP(HK$psf )
Oct-16 Seven V ictory Avenue Ho Man Tin Henderson Land 250 80 32% 22,000
Oct-16 Island Garden Shau Kei Wan Nan Fung 470 35 7% 19,500
Oct-16 Marina South Ap Lei Chau 114 73 64% 25,000
Oct-16 Zumurud Ho Man Tin 224 51 23% 20,000
Oct-16 Park One Sham Shui Po Henderson Land 129 32 25% 15,200
Oct-16 23-39 Blue Pool Road Happy Valley Hang Lung Props 18 1 6% 63,071
Oct-16 The Met.Bliss Ma On Shan Wang On Group 364 273 75% 15,000
Oct-16 Alto Residences Tseung Kwan O Lai Sun Development/Walter 605 359 59% 14,200
Oct-16 NAPA Tuen Mun Wheelock 460 85 18% 10,500
Oct-16 2Gether Tuen Mun HKR Int'l 222 164 74% 12,800
Note: ASPs are based on saleable area. Source: DBS Vickers
Occupation permits issued (Aug 2016)
Project s Locat ion Locat ion Dev elopers No of unit s
Greenhill Private developer HK Happy Valley 86
Hoi Fung Path, Stanley Private Developer HK Island South 1Heya Crystal HK Housing Society KL Cheung Sha Wan 350
187-191 Portland Street Rise Win Corporation KL Yau Ma Tei 3733 South Lantau Road Swire Properties NT Islands 2
Hung Kiu Lane, Kau To Shan Private developer NT Sha Tin 1
The Wings IIIB SHKP NT Tseung Kwan O 326 Source: Buildings Department

China / Hong Kong Monthly Chart Book
HK Property
Page 14
Where are the upcoming projects?
Pre-sale consent granted (Sep 2016)
Project Dev elopers Locat ion Locat ion No. of unitThe Met. Bliss Wang On-led consortium NT Ma On Shan 364Alto Residences Lai Sun Consortium NT Tseung Kwan O 605Crescendo NT Yuen Long 67
Source: Lands Department
Pre-sale consent pending approval (Sep 2016)
Project Dev elopers Locat ion Locat ion No. of unitIL8949 (Ph1) HK Mid-levels 115IL 2302 Chinese Estates HK Mid-levels 24IL 8920 HK North Point 378IL 9027 RP (Ph1) SHKP HK North Point 355RBL 1190 Nan Fung Group HK Shouson Peak 54Cullinan West SHKP Kln West Kowloon 1,050NKIL 6527 Poly Property Group Kln Kai Tak 930NKIL 6526 K Wah Int'l Kln Kai Tak 900NKIL 6525 K&K Property Kln Kai Tak 822NKIL 6541 Wheelock & Co. Kln Kai Tak 648One Kai Tak II Kln Kai Tak 624STTL 574 NT Ma On Shan 454STTL 581 (ph 1) SHKP NT Ma On Shan 354STTL 581 (ph 2) SHKP NT Ma On Shan 67Lot 1588 in DD 243 V ice Chairman of Agile NT Sai Kung 8STTL 567 Wing Tai Props/Manhattan Realty NT Shatin 158STTL 565 Wing Tai Props/Manhattan Realty NT Shatin 69La Cresta HKR/Nan Fung Group NT Shatin 61STTL 566 SHKP NT Shatin 59Mount V ienna Hanison Construction Holdings Ltd NT Shatin 12Lot 2640 in DD 92 Henderson Land NT Sheung Shui 590TKOKL 126 Wheelock & Co. NT Tseung Kwan O 926TWTL 401 (3A) NT Tsuen Wan 1,436The Pav ilia Bay New World/Vanke NT Tsuen Wan 983TWTL 401 NT Tsuen Wan 970TWTL 417 Chinachem/MTRC NT Tsuen Wan 953NAPA Wheelock & Co. NT Tuen Mun 4602 Tsing Min Path Chun Wo consortium NT Tuen Mun 3562GETHER HKR NT Tuen Mun 222CPTL 18 and TMTL 99 New World NT Tuen Mun 1008 Kwun Fat Street Emperor International NT Tuen Mun 14
14,152
Source: Lands Department

China / Hong Kong Monthly Chart Book
HK Property
Page 15
How about the office market?
Office rentals
Office capital values
0
50
100
150
200
250
Aug
-07
Dec
-07
Apr
-08
Aug
-08
Dec
-08
Apr
-09
Aug
-09
Dec
-09
Apr
-10
Aug
-10
Dec
-10
Apr
-11
Aug
-11
Dec
-11
Apr
-12
Aug
-12
Dec
-12
Apr
-13
Aug
-13
Dec
-13
Apr
-14
Aug
-14
Dec
-14
Apr
-15
Aug
-15
Dec
-15
Apr
-16
Aug
-16
Premium Central Traditional Central
HK$psf/mth P remium Central
Sep-16: 0.2% m-o-m
0
5,000
10,000
15,000
20,000
25,000
30,000
35,000
Sep-
07Ja
n-08
May
-08
Sep-
08Ja
n-09
May
-09
Sep-
09Ja
n-10
May
-10
Sep-
10Ja
n-11
May
-11
Sep-
11Ja
n-12
Ma y
-12
Sep-
12Ja
n-13
Ma y
-13
Sep-
13Ja
n-14
May
-14
Sep-
14Ja
n-15
May
-15
Sep-
15Ja
n-16
Ma y
-16
Overall Central
HK$psf/mth Sep-16
HK$29,252psf, 2.1% m-o-mOverall Ce ntral
Source: Knight Frank Source: Knight Frank
Office vacancy
Expectations to hire
1.5
2.42.0 2.3
7.3
4.1
1.5
2.7 2.7 2.6
7.2
4.2
0.0
1.0
2.0
3.0
4.0
5.0
6.0
7.0
8.0
Cen
tral
Wan
chai
/ C
ause
way
Bay
HK
Eas
t
Tsim
shat
sui
Kow
loon
Eas
t
Ove
rall
Aug-16 Sep-16%
0
10
20
30
40
50
60
70
80
4Q01
2Q02
4Q02
2Q03
4Q03
2Q04
4Q04
2Q05
4Q05
2Q06
4Q06
2Q07
4Q07
2Q08
4Q08
2Q09
4Q09
2Q10
4Q10
2Q11
4Q11
2Q12
4Q12
2Q13
4Q13
2H14
2H15
2H16
%2H16
15.7%
Source: Jones Lang LaSalle Source: Hudson Global Resources (HK)

China / Hong Kong Monthly Chart Book
HK Property
Page 16
How about the retail market?
Private retail rent index
Private retail price index
80
100
120
140
160
180
200
Jan/
93Ja
n/94
Jan/
95Ja
n/96
Jan/
97Ja
n/98
Jan/
99Ja
n/00
Jan/
01Ja
n/02
Jan/
03Ja
n/04
Jan/
05Ja
n/06
Jan/
07Ja
n/08
Jan/
09Ja
n/10
Jan/
11Ja
n/12
Jan/
13Ja
n/14
Jan/
15Ja
n/16
Rental Index (1999=100)
Aug-16-0.6% m-o-m
-4.5% y-o-y
50
150
250
350
450
550
Jan/
93Ja
n/94
Jan/
95Ja
n/96
Jan/
97Ja
n/98
Jan/
99Ja
n/00
Jan/
01Ja
n/02
Jan/
03Ja
n/04
Jan/
05Ja
n/06
Jan/
07Ja
n/08
Jan/
09Ja
n/10
Jan/
11Ja
n/12
Jan/
13Ja
n/14
Jan/
15Ja
n/16
Price Index (1999=100)Aug-16
-0.1% m-o-m-10.2% y-o-y
Source: Rating and Valuation Department Source: Rating and Valuation Department
Overall retail sales growth
Monthly retail sales growth of jewelleries/watches
(30)
(20)
(10)
0
10
20
30
40
Jan-
08Ju
l-08
Jan-
09Ju
l-09
Jan-
10Ju
l-10
Jan-
11Ju
l-11
Jan-
12Ju
l-12
Jan-
13Ju
l-13
Jan-
14Ju
l-14
Jan-
15Ju
l-15
Jan-
16Ju
l-16
Yoy, % Aug-16: -10.5% y-o-y
8M16: -10.2% y-o-y
(40)
(20)
0
20
40
60
80
Jan-
Feb
08Ju
n-08
Oct
-08
Mar
-09
Jul-0
9N
ov-0
9A
pr-1
0A
ug-1
0D
ec-1
0M
ay-1
1Se
p-11
Jan-
Feb
12Ju
n-12
Oct
-12
Mar
-13
Jul-1
3N
ov-1
3A
pr-1
4A
ug-1
4D
ec-1
4M
ay-1
5Se
p-15
Jan-
Feb
16Ju
n-16
Yoy, % Aug-16: -26.6% y-o-y
8M16: -22.5% y-o-y
Source: CEIC Source: CEIC

China / Hong Kong Monthly Chart Book
HK Property
Page 17
Monthly retail sales growth of consumer durable goods
Monthly retail sales growth of supermarket items
(30)
(20)
(10)
0
10
20
30
40
50
Jan-
Feb
08Ju
n-08
Oct
-08
Mar
-09
Jul-0
9N
ov-0
9A
pr-1
0A
ug-1
0D
ec-1
0M
a y-1
1Se
p-11
Jan-
Feb
12Ju
n-12
Oct
-12
Mar
-13
Jul-1
3N
ov-1
3A
pr-1
4A
ug-1
4D
ec-1
4M
ay-1
5Se
p-15
Jan-
Feb
16Ju
n-16
Yoy, % Aug-16: -23.9% y-o-y
8M16: -23.6% y-o-y
(2)0 2 4 6 8
10 12 14 16 18
Jan-
Feb
08Ju
n-08
Oct
-08
Mar
-09
Jul-0
9N
ov-0
9A
pr-1
0A
u g-1
0D
ec-1
0M
a y-1
1Se
p-11
Jan-
Feb
12Ju
n-12
Oct
-12
Mar
-13
Jul-1
3N
ov-1
3A
pr-1
4A
ug-1
4D
ec-1
4M
a y-1
5Se
p-15
Jan-
Feb
16Ju
n-16
Yoy, % Aug-16: -0.9% y-o-y
8M16: 0.9% y-o-y
Source: CEIC Source: CEIC
Visitor arrivals growth – overall
Visitor arrivals growth – China
(30)
(20)
(10)
0
10
20
30
40
50
Jan/
08Ju
l/08
Jan/
09Ju
l/09
Jan/
10Ju
l/10
Jan/
11Ju
l/11
Jan/
12Ju
l/12
Jan/
13Ju
l/13
Jan/
14Ju
l/14
Jan/
15Ju
l/15
Jan/
16Ju
l/16
Yoy, % Sep-16: -3% y-o-y-6.1% y-o-y9M16:
(40)
(30)
(20)
(10)
0
10
20
30
40
50
60
Jan/
08Ju
l/08
Jan/
09Ju
l/09
Jan/
10Ju
l/10
Jan/
11Ju
l/11
Jan/
12Ju
l/12
Jan/
13Ju
l/13
Jan/
14Ju
l/14
Jan/
15Ju
l/15
Jan/
16Ju
l/16
Yoy, %Sep-16: -5% y-o-y
-8.7% y-o-y9M16:
Source: CEIC Source: CEIC

China / Hong Kong Monthly Chart Book
HK Property
Page 18
What did corporates do?
Major corporate actions
Date Ev ent
30-Sep Lands Department announced the sale of a residential site located at Off Sin Fat Road, Kwun Tong, Kowloon through publictender which will close on 11 November. Total permissible gross floor area (GFA) for the residential site is 826,538sf.
30-Sep Lands Department announced the sale of a commercial site located at Kai Tak, Kowloon through public tender which will closeon 18 November. Total permissible GFA for the residential site is 1,097,315sf.
30-Sep Eleven developers submitted tenders for the residential site located at Beacon Hill, Kowloon.30-Sep Lai Sun Dev elopment sold 52 units in 93 Pau Chung Street, To Kwa Wan on the first day of its initial launch. This
represented 39% of the total units offered for sale02-Oct Henderson Land sold 33 units in Seven V ictory Avenue, Homantin on the first day of its initial launch. This represented
49% of the total units offered for sale04-Oct Wharf agreed to sell Wharf T&T to a consortium equally owned by MBK Partners Fund III, L.P. and TPG for HK$9.5bn05-Oct Eleven developers submitted tenders for URA's redevelopment project in Kowloon Road/Kiu Yam Road, Sham Shui Po.05-Oct Kerry Propert ies won the tender for the residential site in Kowloon, Beacon Hill for HK$7.269bn or HK$21,206psf.07-Oct Lands Department announced the sale of a residential site located at Lo Fai Road, Tai Po, New Territories through public tender
which will close on 4 November. Total permissible GFA for the residential site is 336,081sf.07-Oct Lands Department announced the sale of a residential site located at Lo Fai Road, Tai Po, New Territories through public tender
which will close on 4 November. Total permissible GFA for the residential site is 161,211sf.07-Oct Twenty four developers submitted tenders for the commercial site in Wong Chuk Hang11-Oct Three office floors (c.49,554sf) in Convention Office Plaza Tower, Wanchai was sold for a consideration of HK$1.39bn or
c.HK$28,000psf12-Oct A consortium comprising Sino land (60%) and Empire Group (40%) won the tender for the commercial site in Wong Chuk
Hang for a consideration of HK$2,528m or HK$8872psf.18-Oct Henderson Land sold 28 units in Park One, Sham Shui Po in the first day of its initial launch, representing 56% of the total
units on offer.20-Oct An office space (c.8,690sf) at IFC One in Central was leased to The Executive Centre at a monthly rent of HK$1.39m or
HK$160psf.23-Oct Wheelock sold 70 units in NAPA, Tuen Mun in the first day of its initial launch, representing 76% of the total units on offer.25-Oct Lai Sun Dev elopment and Walter Kwok sold 359 units in Alto Residence, Tseung Kwan O in the first two days of its initial
launch, representing 99% of the total units on offer.25-Oct Sino Land wins development rights for URA’s Kowloon Road/Kiu Yum Road redevelopment project in Sham Shui Po28-Oct Twenty developers submitted tenders for the residential site in Kai Tak28-Oct Link REIT intends to dispose five of its existing properties by way of tender which is scheduled to close on 15 Dec 2016.
These five properties comprises of a total internal floor area (IFA) of 420,225sf and an appraised value of HK$2,743m.28-Oct Sw ire Propert ies has agreed to sell its Kowloon Bay office property on en bloc basis for HK$6,528m or HK$11,761psf.29-Oct HKR Int'L sold 164 units in 2GETHER, Tuen Mun in the first day of its initial launch, representing 74% of the total units on
offer.
Source: DBS Vickers
China / Hong Kong Monthly Chart Book
HK Property
Page 19
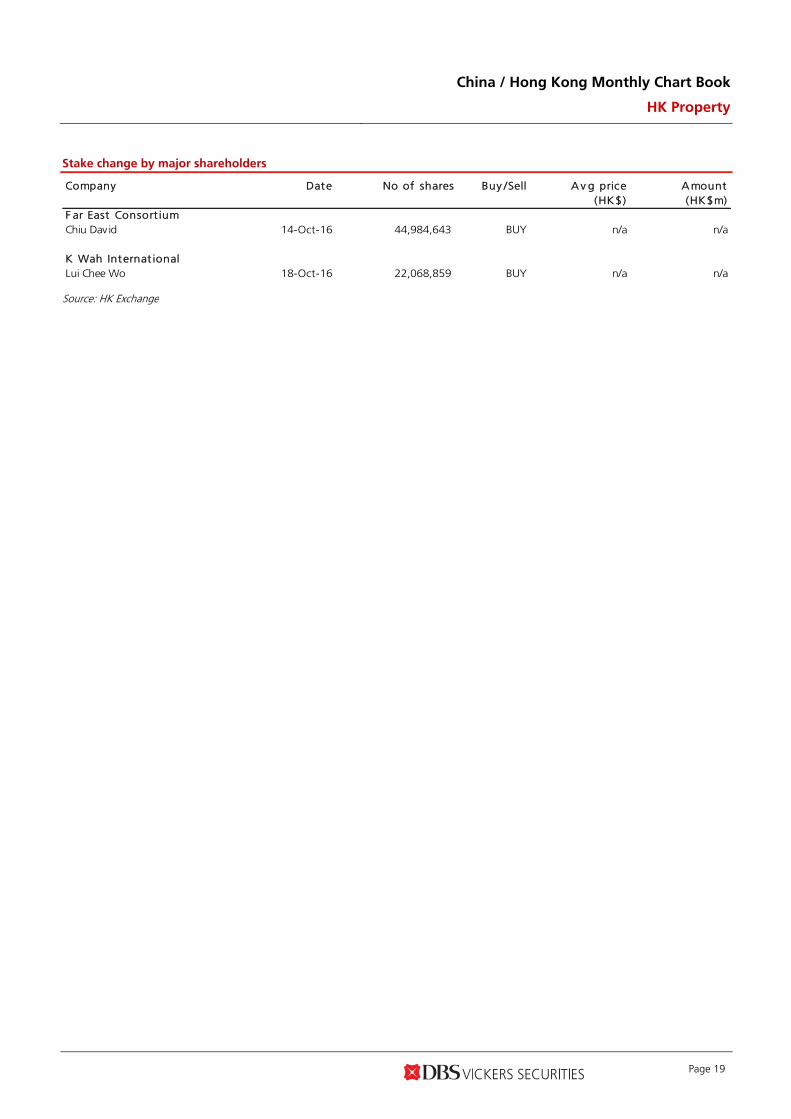
Stake change by major shareholders
Company Date No of shares Buy /Sell A v g price A mount(HK$) (HK$m)
F ar East Consort iumChiu David 14-Oct-16 44,984,643 BUY n/a n/a
K Wah Internat ionalLui Chee Wo 18-Oct-16 22,068,859 BUY n/a n/a
Source: HK Exchange
China / Hong Kong Monthly Chart Book
HK Property
Page 20
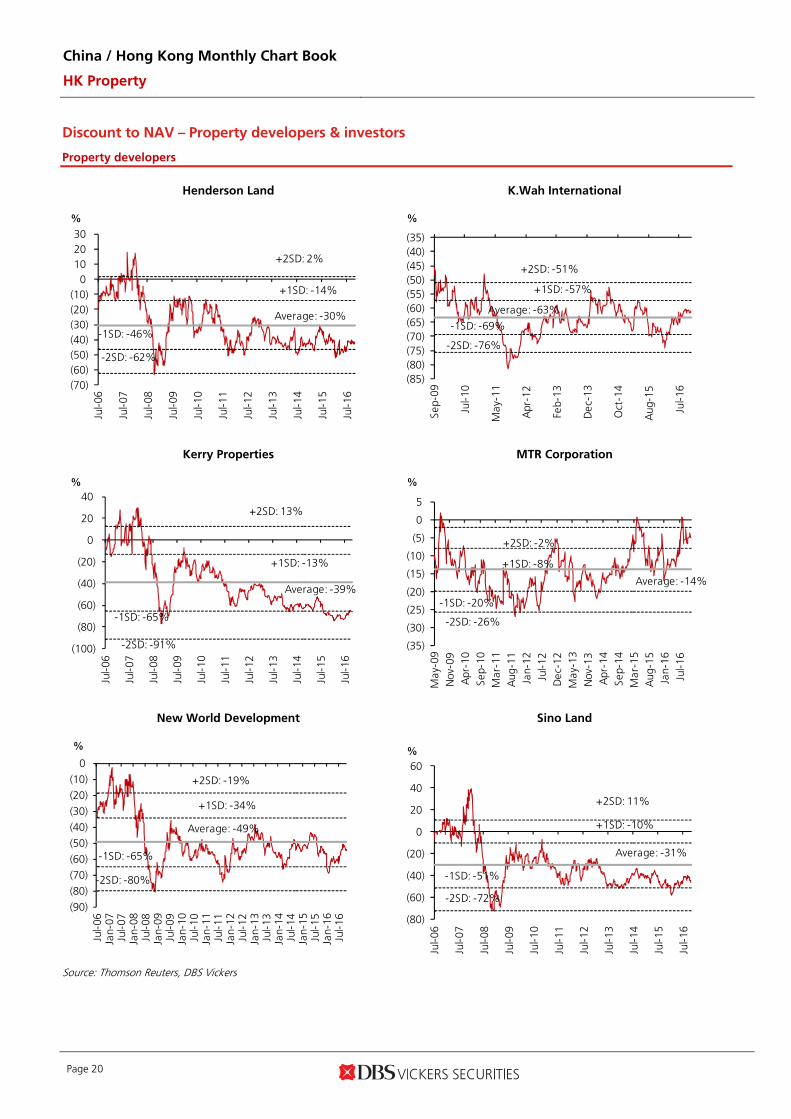
Discount to NAV – Property developers & investors
Property developers
Henderson Land K.Wah International
(70)(60)(50)(40)(30)(20)(10)
0 10 20 30
Jul-0
6
Jul-0
7
Jul-0
8
Jul-0
9
Jul-1
0
Jul-1
1
Jul-1
2
Jul-1
3
Jul-1
4
Jul-1
5
Jul-1
6
%
Average: -30%
+2SD: 2%
+1SD: -14%
-1SD: -46%
-2SD: -62%
(85)(80)(75)(70)(65)(60)(55)(50)(45)(40)(35)
Sep-
09
Jul-1
0
May
-11
Apr
-12
Feb-
13
Dec
-13
Oct
-14
Aug
-15
Jul-1
6
%
Average: -63%
+2SD: -51%
+1SD: -57%
-1SD: -69%
-2SD: -76%
Kerry Properties MTR Corporation
(100)
(80)
(60)
(40)
(20)
0
20
40
Jul-0
6
Jul-0
7
Jul-0
8
Jul-0
9
Jul-1
0
Jul-1
1
Jul-1
2
Jul-1
3
Jul-1
4
Jul-1
5
Jul-1
6
%
Average: -39%
+2SD: 13%
+1SD: -13%
-1SD: -65%
-2SD: -91%
(35)
(30)
(25)
(20)
(15)
(10)
(5)
0
5
May
-09
Nov
-09
Apr
-10
Sep-
10M
ar-1
1A
ug-1
1Ja
n-12
Jul-1
2D
ec-1
2M
ay-1
3N
ov-1
3A
pr-1
4Se
p-14
Mar
-15
Aug
-15
Jan-
16Ju
l-16
%
Average: -14%
+2SD: -2%
+1SD: -8%
-1SD: -20%
-2SD: -26%
New World Development Sino Land
(90)
(80)
(70)
(60)
(50)
(40)
(30)
(20)
(10)
0
Jul-0
6Ja
n-07
Jul-0
7Ja
n-08
Jul-0
8Ja
n-09
Jul-0
9Ja
n-10
Jul-1
0Ja
n-11
Jul-1
1Ja
n-12
Jul-1
2Ja
n-13
Jul-1
3Ja
n-14
Jul-1
4Ja
n-15
Jul-1
5Ja
n-16
Jul-1
6
%
Average: -49%
+2SD: -19%
+1SD: -34%
-1SD: -65%
-2SD: -80%
(80)
(60)
(40)
(20)
0
20
40
60
Jul-0
6
Jul-0
7
Jul-0
8
Jul-0
9
Jul-1
0
Jul-1
1
Jul-1
2
Jul-1
3
Jul-1
4
Jul-1
5
Jul-1
6
%
Average: -31%
+2SD: 11%
+1SD: -10%
-1SD: -51%
-2SD: -72%
Source: Thomson Reuters, DBS Vickers

China / Hong Kong Monthly Chart Book
HK Property
Page 21
Property developers (continued)
Sun Hung Kai Properties Tai Cheung
(80)
(60)
(40)
(20)
0
20
40
Jul-0
6
Jul-0
7
Jul-0
8
Jul-0
9
Jul-1
0
Jul-1
1
Jul-1
2
Jul-1
3
Jul-1
4
Jul-1
5
Jul-1
6
%
Average: -25%
+2SD: 14%
+1SD: -5%
-1SD: -44%
-2SD: -64%
(90)
(80)
(70)
(60)
(50)
(40)
(30)
(20)
Jan-
07Ju
l-07
Feb-
08A
ug-0
8Fe
b-09
Sep-
09M
ar-1
0Se
p-10
Apr
-11
Oct
-11
Apr
-12
Oct
-12
May
-13
Nov
-13
May
-14
Dec
-14
Jun-
15D
ec-1
5Ju
l-16
%
Average: -62%
+2SD: -46%
+1SD: -54%
-1SD: -70%
-2SD: -78%
Wheelock & Co. Sector average
(60)
(50)
(40)
(30)
(20)
(10)
0
10
20
Jul-0
6
Jul-0
7
Jul-0
8
Jul-0
9
Jul-1
0
Jul-1
1
Jul-1
2
Jul-1
3
Jul-1
4
Jul-1
5
Jul-1
6
%
Average: -29%
+2SD: -3%
+1SD: -16%
-1SD: -42%
-2SD: -55%
(60)
(50)
(40)
(30)
(20)
(10)
0
10
20
30
Jul/0
6
Jul/0
7
Jul/0
8
Jul/0
9
Jul/1
0
Jul/1
1
Jul/1
2
Jul/1
3
Jul/1
4
Jul/1
5
Jul/1
6
%
+2SD: 3%
+1SD: -11%
Average: -26%
-1SD: -40%
-2SD: -54%
Source: Thomson Reuters, DBS Vickers

China / Hong Kong Monthly Chart Book
HK Property
Page 22
Property investors
Great Eagle Hang Lung Properties
(90)
(80)
(70)
(60)
(50)
(40)
(30)
(20)
(10)
0
Jul-0
6
Mar
-08
Nov
-09
Aug
-11
Apr
-13
Dec
-14
Aug
-16
%
Average: -56%
-2SD: -76%
-1SD: -66%
+1SD: -45%
+2SD: -35%
(80)
(60)
(40)
(20)
0
20
40
Jul-0
6
Jul-0
7
Jul-0
8
Jul-0
9
Jul-1
0
Jul-1
1
Jul-1
2
Jul-1
3
Jul-1
4
Jul-1
5
Jul-1
6
%
Average: -19%
+2SD: 26%
+1SD: 4%
-1SD: -41%
-2SD: -63%
Hysan Swire Properties
(80)
(70)
(60)
(50)
(40)
(30)
(20)
(10)
0
Jul-0
6
Jul-0
8
Aug
-10
Aug
-12
Aug
-14
Sep-
16
%
Average: -39%
-2SD: -59%
-1SD: -49%
+1SD: -29%
+2SD: -18%
(55)(50)(45)(40)(35)(30)(25)(20)(15)(10)(5)
Jan-
12
Jun-
12
Nov
-12
Apr
-13
Sep-
13
Jan-
14
Jun-
14
Nov
-14
Apr
-15
Sep-
15
Feb-
16
Jul-1
6
%
Average: -34%
-2SD: -52%
-1SD: -43%
+1SD: -25%
+2SD: -16%
Wharf Sector average
(70)
(60)
(50)
(40)
(30)
(20)
(10)
0
Jul-0
6
Jul-0
7
Jul-0
8
Jul-0
9
Jul-1
0
Jul-1
1
Jul-1
2
Jul-1
3
Jul-1
4
Jul-1
5
Jul-1
6
%
Average: -30%
-2SD: -56%
-1SD: -43%
+1SD: -16%
+2SD: -3%
(70)
(60)
(50)
(40)
(30)
(20)
(10)
0
10
20
Jul/0
6
Jul/0
7
Jul/0
8
Jul/0
9
Jul/1
0
Jul/1
1
Jul/1
2
Jul/1
3
Jul/1
4
Jul/1
5
Jul/1
6
%
Average: -26%
+2SD: 4%
+1SD: -10%
-1SD: -37%
-2SD: -51%
Source: Thomson Reuters, DBS Vickers
China / Hong Kong Monthly Chart Book
HK Property
Page 23
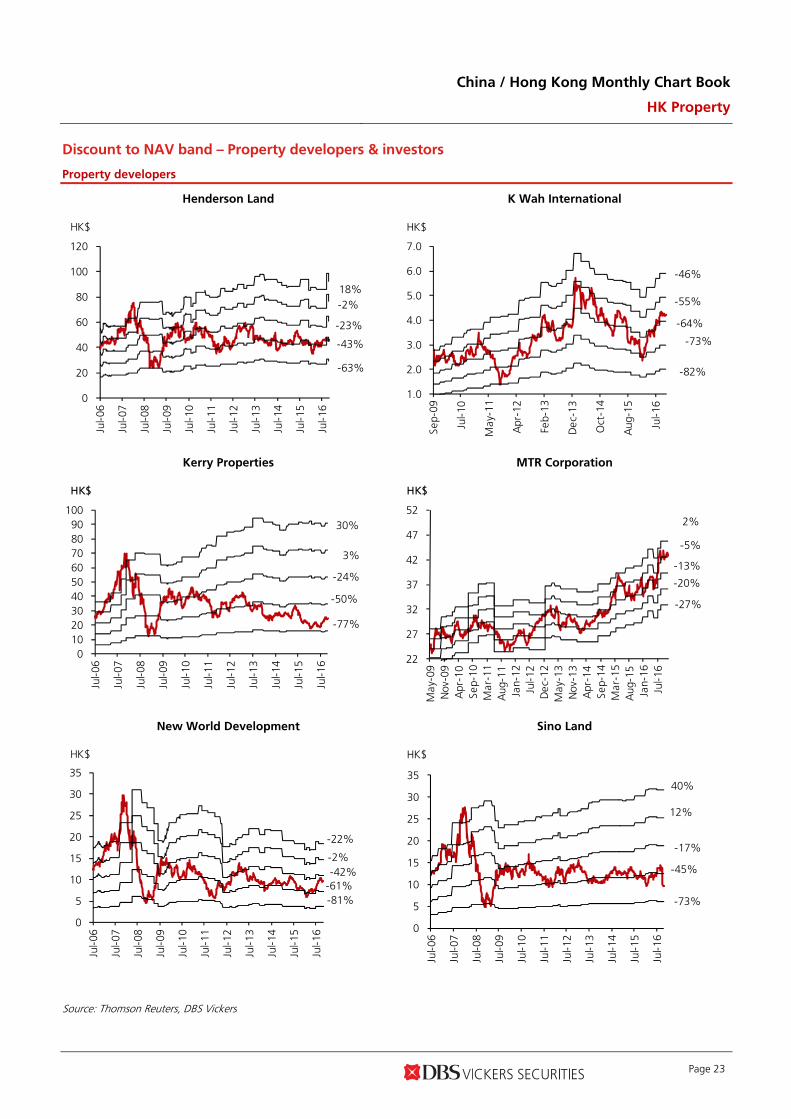
Discount to NAV band – Property developers & investors
Property developers
Henderson Land K Wah International
0
20
40
60
80
100
120
Jul-0
6
Jul-0
7
Jul-0
8
Jul-0
9
Jul-1
0
Jul-1
1
Jul-1
2
Jul-1
3
Jul-1
4
Jul-1
5
Jul-1
6
HK$
-63%
-43%
-23%
-2%18%
1.0
2.0
3.0
4.0
5.0
6.0
7.0
Sep-
09
Jul-1
0
May
-11
Apr
-12
Feb-
13
Dec
-13
Oct
-14
Aug
-15
Jul-1
6
HK$
-82%
-73%
-64%
-55%
-46%
Kerry Properties MTR Corporation
0 10 20 30 40 50 60 70 80 90
100
Jul-0
6
Jul-0
7
Jul-0
8
Jul-0
9
Jul-1
0
Jul-1
1
Jul-1
2
Jul-1
3
Jul-1
4
Jul-1
5
Jul-1
6
HK$
-77%
-24%
3%
30%
-50%
22
27
32
37
42
47
52
May
-09
Nov
-09
Apr
-10
Sep-
10M
ar-1
1A
ug-1
1Ja
n-12
Jul-1
2D
ec-1
2M
ay-1
3N
ov-1
3A
pr-1
4Se
p-14
Mar
-15
Aug
-15
Jan-
16Ju
l-16
HK$
-27%
-20%
-13%
-5%
2%
New World Development Sino Land
0
5
10
15
20
25
30
35
Jul-0
6
Jul-0
7
Jul-0
8
Jul-0
9
Jul-1
0
Jul-1
1
Jul-1
2
Jul-1
3
Jul-1
4
Jul-1
5
Jul-1
6
HK$
-81%-61%-42%
-22%
-2%
0
5
10
15
20
25
30
35
Jul-0
6
Jul-0
7
Jul-0
8
Jul-0
9
Jul-1
0
Jul-1
1
Jul-1
2
Jul-1
3
Jul-1
4
Jul-1
5
Jul-1
6
HK$
-73%
-45%
-17%
12%
40%
Source: Thomson Reuters, DBS Vickers

China / Hong Kong Monthly Chart Book
HK Property
Page 24
Property developers (continued)
Sun Hung Kai Properties Tai Cheung
20
70
120
170
220
270
Jul-0
6
Jul-0
7
Jul-0
8
Jul-0
9
Jul-1
0
Jul-1
1
Jul-1
2
Jul-1
3
Jul-1
4
Jul-1
5
Jul-1
6
HK$
-58%
-14%
8%
30%
-36%
0
2
4
6
8
10
12
14
Jan-
07Ju
l-07
Feb-
08A
ug-0
8Fe
b-09
Sep-
09M
ar-1
0Se
p-10
Apr
-11
Oct
-11
Apr
-12
Oct
-12
May
-13
Nov
-13
May
-14
Dec
-14
Jun-
15D
ec-1
5Ju
l-16
HK$
-83%
-38%
-49%
-61%
-72%
Wheelock & Co.
0
10
20
30
40
50
60
70
80
90
Jul-0
6
Jul-0
7
Jul-0
8
Jul-0
9
Jul-1
0
Jul-1
1
Jul-1
2
Jul-1
3
Jul-1
4
Jul-1
5
Jul-1
6
HK$
-47%-31%-15%
1%17%
Source: Thomson Reuters, DBS Vickers

China / Hong Kong Monthly Chart Book
HK Property
Page 25
Property investors
Great Eagle Hang Lung Properties
0
10
20
30
40
50
60
Jul-0
6Ja
n-07
Jul-0
7Ja
n-08
Jul-0
8Ja
n-09
Jul-0
9Ja
n-10
Jul-1
0Ja
n-11
Jul-1
1Ja
n-12
Jul-1
2Ja
n-13
Jul-1
3Ja
n-14
Jul-1
4Ja
n-15
Jul-1
5Ja
n-16
Jul-1
6
HK$
-82%
-67%
-53%
-39%
-25%
0
10
20
30
40
50
60
Jul-0
6
Jul-0
7
Jul-0
8
Jul-0
9
Jul-1
0
Jul-1
1
Jul-1
2
Jul-1
3
Jul-1
4
Jul-1
5
Jul-1
6
HK$
-61%
-37%
35%
13%
-9%
Hysan Swire Properties
3
13
23
33
43
53
63
Jul-0
6
Mar
-08
Nov
-09
Jul-1
1
Mar
-13
Nov
-14
Aug
-16
HK$
-69%
-54%
-40%
-25%
-10%
15
20
25
30
35
40
Jan-
12
Jun-
12
Nov
-12
Apr
-13
Sep-
13
Jan-
14
Jun-
14
Nov
-14
Apr
-15
Sep-
15
Feb-
16
Jul-1
6
HK$
-51%
-42%
-32%
-23%
-13%
Wharf
0 10 20 30 40 50 60 70 80 90
100
Jul-0
6
Jul-0
7
Jul-0
8
Jul-0
9
Jul-1
0
Jul-1
1
Jul-1
2
Jul-1
3
Jul-1
4
Jul-1
5
Jul-1
6
HK$
-66%
-1%
-17%
-33%
-50%
Source: Thomson Reuters, DBS Vickers
China / Hong Kong Monthly Chart Book
HK Property
Page 26
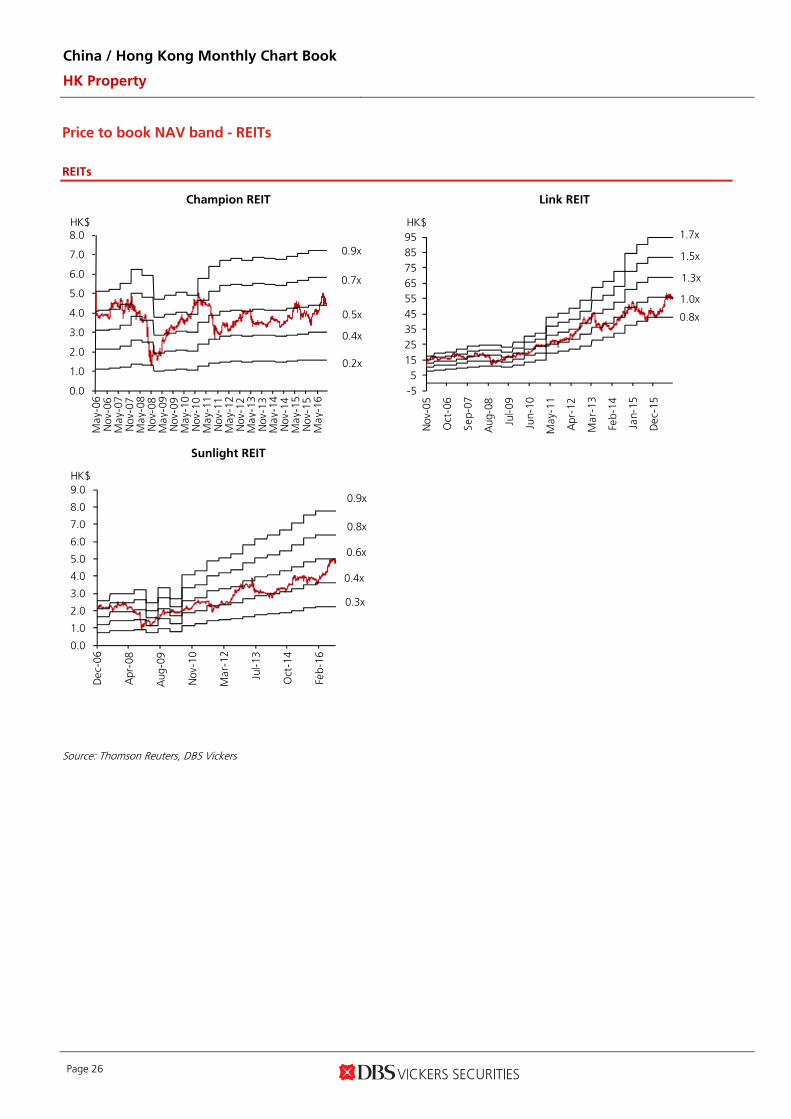
Price to book NAV band - REITs
REITs
Champion REIT Link REIT
0.0
1.0
2.0
3.0
4.0
5.0
6.0
7.0
8.0
May
-06
Nov
-06
Ma y
-07
Nov
-07
Ma y
-08
Nov
-08
Ma y
-09
Nov
-09
Ma y
-10
Nov
-10
May
-11
Nov
-11
Ma y
-12
Nov
-12
Ma y
-13
Nov
-13
Ma y
-14
Nov
-14
Ma y
-15
Nov
-15
May
-16
HK$
0.2x
0.4x
0.5x
0.7x
0.9x
-55
152535455565758595
Nov
-05
Oct
-06
Sep-
07
Aug
-08
Jul-0
9
Jun-
10
May
-11
Apr
-12
Mar
-13
Feb-
14
Jan-
15
Dec
-15
HK$
0.8x
1.0x
1.3x
1.5x
1.7x
Sunlight REIT
0.0
1.0
2.0
3.0
4.0
5.0
6.0
7.0
8.0
9.0
Dec
-06
Apr
-08
Aug
-09
Nov
-10
Mar
-12
Jul-1
3
Oct
-14
Feb-
16
HK$
0.3x
0.4x
0.6x
0.8x
0.9x
Source: Thomson Reuters, DBS Vickers

China / Hong Kong Monthly Chart Book
HK Property
Page 27
Historical yield band - REITs
REITs
Champion REIT Link REIT
0
1
2
3
4
5
6
7
8
9
May
-06
Nov
-06
May
-07
Nov
-07
May
-08
Nov
-08
May
-09
Nov
-09
May
-10
Nov
-10
May
-11
Nov
-11
May
-12
Nov
-12
May
-13
Nov
-13
May
-14
Nov
-14
May
-15
Nov
-15
May
-16
HK$
Floor 24%
Ceiling 4%
Champion REIT
Mid 14%
5
15
25
35
45
55
65
75
Nov
-05
Oct
-06
Sep-
07
Aug
-08
Jul-0
9
Jun-
10
May
-11
Apr
-12
Mar
-13
Feb-
14
Jan-
15
Dec
-15
HK$
Link REIT
Ceiling 3% Mid 5%
Floor 7%
Sunlight REIT
0.0
1.0
2.0
3.0
4.0
5.0
6.0
Dec
-06
Apr
-08
Aug
-09
Nov
-10
Mar
-12
Jul-1
3
Oct
-14
Feb-
16
HK$
Sunlight REIT
Ceiling 5%
Mid 15%
Floor 25%
Source: Thomson Reuters, DBS Vickers

China / Hong Kong Monthly Chart Book
HK Property
Page 28
Any important dates to look out for?
Major upcoming events
3-Nov Retail statistics for Sep 20164-Nov TPTL 223 Tender Close4-Nov TPTL 229 Tender Close11-Nov GDP 3Q1611-Nov NKIL 6584 Tender Close17-Nov Unemployment rate Aug 2016 - Oct 201618-Nov NKIL 6557 Tender Close22-Nov CPI October 2016
1-Dec Retail statistics for Oct 201619-Dec Unemployment rate Sep 2016 - Nov 201620-Dec CPI November 2016
3-Jan Retail statistics for Nov 201619-Jan Unemployment rate Oct 2016 - Dec 201623-Jan CPI December 2016
December 2016
J anuary 2016
Nov ember 2016
Source: Census and Statistics Department, Lands Department, HK Exchange, DBS Vickers

China / Hong Kong Monthly Chart Book
HK Property
Page 29
Our past publications
Date Publicat ion
1 Aug (Hysan Development ) 1H16 result preview 3 Aug (Hysan Development ) Higher dividend amidst challenging retail scene 3 Aug (HK Property) Pak Shek Kok ?a source of residential supply 5 Aug (Champion REIT) 1H16 result preview 8 Aug (MTR Corporation) 1H16 result preview 8 Aug (Wharf Holdings) 1H16 result preview 9 Aug (HK Property Sector) Replenishing land banks 10 Aug (MTR Corporation) Fairly priced 10 Aug (Champion REIT) Harvest time for Three Garden Road 11 Aug (Wharf Holdings) Firm rental performance despite market challenges 12 Aug (Wheelock) 1H16 result preview 15 Aug (Swire Properties ) 1H16 result preview 16 Aug (Great Eagle ) 1H16 result preview 16 Aug (Wheelock) Wheelock & Co 18 Aug (Great Eagle ) Core business operations improving 18 Aug (Kerry Properties ) 1H16 result preview 19 Aug (Swire Properties ) Expanding rental asset base 19 Aug (K Wah International) 1H16 result preview 22 Aug (Henderson Land ) 1H16 result preview 23 Aug (Kerry Properties ) China project sales is a bright spot 23 Aug (K Wah International) Robust development earnings 24 Aug (Henderson Land ) Steady climb 25 Aug (Sino Land ) Enviable balance sheet strength 29 Aug (Wing Tai Properties) 1H16 result preview 31 Aug (Wing Tai Properties) Strong asset backing 31 Aug (HK Property) Growing office supply in Kowloon East
1 Sep (HK Property) Growing office supply in Kowloon East 2 Sep (Sunlight REIT) FY16 Results Preview 6 Sep (Sunlight REIT) Ongoing revitalisation initiatives to unlock hidden value 7 Sep (SHKP ) FY16 results preview 9 Sep (SHKP ) Firing on all cylinders 19 Sep (Lai Sun Development) New project launch to unlock embedded value 19 Sep (Henderson Land ) Windfall profit from property disposal 22 Sep (New World Development) Right direction 28 Sep (Far East Consortium) Encouraging project sales, recovering hotel operations
4 Oct (Hong Kong Property Sector) Retail supply in focus 5 Oct (Wharf Holdings) Realising the value of telecom business 6 Oct (Link REIT) Solid retail leasing performance 13 Oct (Sunlight REIT) Asset enhancement initiative to bear fruit soon 20 Oct (Lai Sun Development) Harvest season is coming 24 Oct (Wharf Holdings) Mount Nicholson apartments well sought after 25 Oct (Lai Sun Development) Overwhelming response to the Alto Residences launch 25 Oct (Tai Cheung) To benefit from robust demand for luxury homes
October 2016
September 2016
August 2016
Source: DBS Vickers

China / Hong Kong Monthly Chart Book
HK Property
Page 30
DBSVHK recommendations are based an Absolute Total Return* Rating system, defined as follows:
STRONG BUY (>20% total return over the next 3 months, with identifiable share price catalysts within this time frame)
BUY (>15% total return over the next 12 months for small caps, >10% for large caps)
HOLD (-10% to +15% total return over the next 12 months for small caps, -10% to +10% for large caps)
FULLY VALUED (negative total return i.e. > -10% over the next 12 months)
SELL (negative total return of > -20% over the next 3 months, with identifiable catalysts within this time frame)
Share price appreciation + dividends Completed Date: 3 Nov 2016 15:03:20 Dissemination Date: 3 Nov 2016 15:22:26
GENERAL DISCLOSURE/DISCLAIMER This report is prepared by DBS Vickers (Hong Kong) Limited (“DBSVHK”). This report is solely intended for the clients of DBS Bank Ltd., DBS Vickers Securities (Singapore) Pte Ltd. (“DBSVS”) and DBSVHK, its respective connected and associated corporations and affiliates only and no part of this document may be (i) copied, photocopied or duplicated in any form or by any means or (ii) redistributed without the prior written consent of DBSVHK. The research set out in this report is based on information obtained from sources believed to be reliable, but we (which collectively refers to DBS Bank Ltd., DBSVS and DBSVHK, its respective connected and associated corporations, affiliates and their respective directors, officers, employees and agents (collectively, the “DBS Group”)) do not make any representation or warranty as to its accuracy, completeness or correctness. Opinions expressed are subject to change without notice. This document is prepared for general circulation. Any recommendation contained in this document does not have regard to the specific investment objectives, financial situation and the particular needs of any specific addressee. This document is for the information of addressees only and is not to be taken in substitution for the exercise of judgement by addressees, who should obtain separate independent legal or financial advice. The DBS Group accepts no liability whatsoever for any direct, indirect and/or consequential loss (including any claims for loss of profit) arising from any use of and/or reliance upon this document and/or further communication given in relation to this document. This document is not to be construed as an offer or a solicitation of an offer to buy or sell any securities. The DBS Group, along with its affiliates and/or persons associated with any of them may from time to time have interests in the securities mentioned in this document. The DBS Group may have positions in, and may effect transactions in securities mentioned herein and may also perform or seek to perform broking, investment banking and other banking services for these companies. Any valuations, opinions, estimates, forecasts, ratings or risk assessments herein constitutes a judgment as of the date of this report, and there can be no assurance that future results or events will be consistent with any such valuations, opinions, estimates, forecasts, ratings or risk assessments. The information in this document is subject to change without notice, its accuracy is not guaranteed, it may be incomplete or condensed, it may not contain all material information concerning the company (or companies) referred to in this report and the DBS Group is under no obligation to update the information in this report. This publication has not been reviewed or authorized by any regulatory authority in Singapore, Hong Kong or elsewhere. There is no planned schedule or frequency for updating research publication relating to any issuer. The valuations, opinions, estimates, forecasts, ratings or risk assessments described in this report were based upon a number of estimates and assumptions and are inherently subject to significant uncertainties and contingencies. It can be expected that one or more of the estimates on which the valuations, opinions, estimates, forecasts, ratings or risk assessments were based will not materialize or will vary significantly from actual results. Therefore, the inclusion of the valuations, opinions, estimates, forecasts, ratings or risk assessments described herein IS NOT TO BE RELIED UPON as a representation and/or warranty by the DBS Group (and/or any persons associated with the aforesaid entities), that: (a) such valuations, opinions, estimates, forecasts, ratings or risk assessments or their underlying assumptions will be achieved, and (b) there is any assurance that future results or events will be consistent with any such valuations, opinions, estimates, forecasts, ratings or risk assessments
stated therein. Please contact the primary analyst for valuation methodologies and assumptions associated with the covered companies or price targets. Any assumptions made in this report that refers to commodities, are for the purposes of making forecasts for the company (or companies) mentioned herein. They are not to be construed as recommendations to trade in the physical commodity or in the futures contract relating to the commodity referred to in this report. DBS Vickers Securities (USA) Inc ("DBSVUSA"), a U.S.-registered broker-dealer, does not have its own investment banking or research department, has not participated in any public offering of securities as a manager or co-manager or in any other investment banking transaction in the past twelve months and does not engage in market-making.

China / Hong Kong Monthly Chart Book
HK Property
Page 31
ANALYST CERTIFICATION The research analyst(s) primarily responsible for the content of this research report, in part or in whole, certifies that the views about the companies and their securities expressed in this report accurately reflect his/her personal views. The analyst(s) also certifies that no part of his/her compensation was, is, or will be, directly or indirectly, related to specific recommendations or views expressed in the report. The DBS Group has procedures in place to eliminate, avoid and manage any potential conflicts of interests that may arise in connection with the production of research reports. As of 3 November 2016, the analyst(s) and his/her spouse and/or relatives who are financially dependent on the analyst(s), do not hold interests in the securities recommended in this report (“interest” includes direct or indirect ownership of securities). The research analyst(s) responsible for this report operates as part of a separate and independent team to the investment banking function of the DBS Group and procedures are in place to ensure that confidential information held by either the research or investment banking function is handled appropriately.
COMPANY-SPECIFIC / REGULATORY DISCLOSURES 1. DBSVHK and its subsidiaries do not have a proprietary position in the securities recommended/mentioned in this report as of 02 Nov
2016.
2. DBS Bank Ltd., DBSVS, DBSVHK, DBSVUSA, their subsidiaries and/or other affiliates have a net long position exceeding 0.5% of the total issued share capital in Jinmao Investments & Jinmao (China) (6139 HK) and Yuexiu Real Estate Investment Trust (405 HK) recommended in this report as of 01 Nov 2016.
3. DBS Bank Ltd., DBSVS, DBSVHK, DBSVUSA, their subsidiaries and/or other affiliates beneficially own a total of 1% of any class of common equity securities of Yuexiu Real Estate Investment Trust (405 HK) as of 01 Nov 2016.
4. Compensation for investment banking services: DBS Bank Ltd., DBSVS, DBSVHK, their subsidiaries and/or other affiliates of DBSVUSA have received compensation, within the past 12 months for investment banking services from Link Real Estate Investment Trust (823 HK), Yuexiu Real Estate Investment Trust (405 HK) and Far East Consortium International Limited (35 HK) as of 30 Sep 2016. DBS Bank Ltd., DBSVS, DBSVHK, their subsidiaries and/or other affiliates of DBSVUSA have managed or co-managed a public offering of securities for Far East Consortium International Limited (35 HK) in the past 12 months, as of 30 Sep 2016. DBSVUSA does not have its own investment banking or research department, nor has it participated in any public offering of securities as a manager or co-manager or in any other investment banking transaction in the past twelve months. Any US persons wishing to obtain further information, including any clarification on disclosures in this disclaimer, or to effect a transaction in any security discussed in this document should contact DBSVUSA exclusively.
RESTRICTIONS ON DISTRIBUTION
General This report is not directed to, or intended for distribution to or use by, any person or entity who is a citizen or resident of or located in any locality, state, country or other jurisdiction where such distribution, publication, availability or use would be contrary to law or regulation.
Australia This report is being distributed in Australia by DBS Bank Ltd. (“DBS”) or DBS Vickers Securities (Singapore) Pte Ltd (“DBSVS”) or DBS Vickers (Hong Kong) Limited (“DBSVHK”), which are exempted from the requirement to hold an Australian Financial Services Licence under the Corporation Act 2001 (“CA”) in respect of financial services provided to the recipients. Both DBS and DBSVS are regulated by the Monetary Authority of Singapore under the laws of Singapore, and DBSVHK is regulated by the Securities and Futures Commission of Hong Kong under the laws of Hong Kong, which differ from Australian laws. Distribution of this report is intended only for “wholesale investors” within the meaning of the CA.
Hong Kong This report is being distributed in Hong Kong by DBSVHK which is licensed and regulated by the Hong Kong Securities and Futures Commission.
Indonesia This report is being distributed in Indonesia by PT DBS Vickers Securities Indonesia.
Malaysia This report is distributed in Malaysia by AllianceDBS Research Sdn Bhd ("ADBSR"). Recipients of this report, received from ADBSR are to contact the undersigned at 603-2604 3333 in respect of any matters arising from or in connection with this report. In addition to the General Disclosure/Disclaimer found at the preceding page, recipients of this report are advised that ADBSR (the preparer of this report), its holding company Alliance Investment Bank Berhad, their respective connected and associated corporations, affiliates, their directors, officers, employees, agents and parties related or associated with any of them may have positions in, and may effect transactions in the securities mentioned herein and may also perform or seek to perform broking, investment banking/corporate advisory and other services for the subject companies. They may also have received compensation and/or seek to obtain compensation for broking, investment banking/corporate advisory and other services from the subject companies.
Wong Ming Tek, Executive Director, ADBSR

China / Hong Kong Monthly Chart Book
HK Property
Page 32
Singapore This report is distributed in Singapore by DBS Bank Ltd (Company Regn. No. 196800306E) or DBSVS (Company Regn No. 198600294G), both of which are Exempt Financial Advisers as defined in the Financial Advisers Act and regulated by the Monetary Authority of Singapore. DBS Bank Ltd and/or DBSVS, may distribute reports produced by its respective foreign entities, affiliates or other foreign research houses pursuant to an arrangement under Regulation 32C of the Financial Advisers Regulations. Where the report is distributed in Singapore to a person who is not an Accredited Investor, Expert Investor or an Institutional Investor, DBS Bank Ltd accepts legal responsibility for the contents of the report to such persons only to the extent required by law. Singapore recipients should contact DBS Bank Ltd at 6327 2288 for matters arising from, or in connection with the report.
Thailand This report is being distributed in Thailand by DBS Vickers Securities (Thailand) Co Ltd. Research reports distributed are only intended for institutional clients only and no other person may act upon it.
United Kingdom
This report is produced by DBSVHK which is regulated by the Securities and Futures Commission of Hong Kong. This report is disseminated in the United Kingdom by DBS Vickers Securities (UK) Ltd (“DBSVUK”). DBSVUK is authorised and regulated by the Financial Conduct Authority in the United Kingdom. In respect of the United Kingdom, this report is solely intended for the clients of DBSVUK, its respective connected and associated corporations and affiliates only and no part of this document may be (i) copied, photocopied or duplicated in any form or by any means or (ii) redistributed without the prior written consent of DBSVUK. This communication is directed at persons having professional experience in matters relating to investments. Any investment activity following from this communication will only be engaged in with such persons. Persons who do not have professional experience in matters relating to investments should not rely on this communication.
Dubai
This research report is being distributed in The Dubai International Financial Centre (“DIFC”) by DBS Bank Ltd., (DIFC Branch) having its office at PO Box 506538, 3rd Floor, Building 3, East Wing, Gate Precinct, Dubai International Financial Centre (DIFC), Dubai, United Arab Emirates. DBS Bank Ltd., (DIFC Branch) is regulated by The Dubai Financial Services Authority. This research report is intended only for professional clients (as defined in the DFSA rulebook) and no other person may act upon it.
United States This report was prepared by DBSVHK. DBSVUSA did not participate in its preparation. The research analyst(s) named on this report are not registered as research analysts with FINRA and are not associated persons of DBSVUSA. The research analyst(s) are not subject to FINRA Rule 2241 restrictions on analyst compensation, communications with a subject company, public appearances and trading securities held by a research analyst. This report is being distributed in the United States by DBSVUSA, which accepts responsibility for its contents. This report may only be distributed to Major U.S. Institutional Investors (as defined in SEC Rule 15a-6) and to such other institutional investors and qualified persons as DBSVUSA may authorize. Any U.S. person receiving this report who wishes to effect transactions in any securities referred to herein should contact DBSVUSA directly and not its affiliate.
Other jurisdictions
In any other jurisdictions, except if otherwise restricted by laws or regulations, this report is intended only for qualified, professional, institutional or sophisticated investors as defined in the laws and regulations of such jurisdictions.
DBS Vickers (Hong Kong) Limited
18th Floor Man Yee building, 68 Des Voeux Road Central, Central, Hong Kong
Tel: (852) 2820-4888, Fax: (852) 2868-1523
Company Regn. No. 31758