
China Economic Quarterly Q1 2018 - PwC...China Economic Quarterly Q1 2018 “Well begun is half...
17
China Economic Quarterly Q1 2018 “Well begun is half done”, stable 2018 Q1 economic figures kick off the 40th anniversary of China’s reform and opening up May 2018 Major economic indicators p1 /Policy updates p10 /Hot topic analysis p12 www.pwccn.com/ceq
Transcript of China Economic Quarterly Q1 2018 - PwC...China Economic Quarterly Q1 2018 “Well begun is half...
China Economic Quarterly Q1 2018
“Well begun is half done”, stable 2018 Q1 economic figures kick off the 40th anniversary of China’s reform and opening up
May 2018
Major economic indicators p1/Policy updates p10 /Hot topic analysis p12
www.pwccn.com/ceq

ContentI. Major economic indicators 1
II. Policy updates
Further opening up of the financial sector is critical and would have a huge impact on other reform measures, as well as China’s overall economy
Policy support related to building free trade port would boost Hainan Island into China’s Hawaii
10
10
11
III. Hot topic analysis
“Life begins at forty” — China’s reform and opening up to reach historic highs in 2018
12
12
Quarterly GDP values and quarterly and annual GDP growth rate
1.70%
1.80%
1.80%
1.80%
2.00%
1.70%
1.80%
1.60%
1.30%
1.90%
1.80%
1.70%
1.50%
1.80%
1.80%
1.60%
1.40%
7.30%6.90% 6.70%
6.90%
0.00%
1.00%
2.00%
3.00%
4.00%
5.00%
6.00%
7.00%
8.00%
0.00
5.00
10.00
15.00
20.00
25.00
Quarterly GDP value Quarterly growth Annual GDP growth
GD
P (T
rillio
ns o
f RM
B)
Major economic indicatorsI
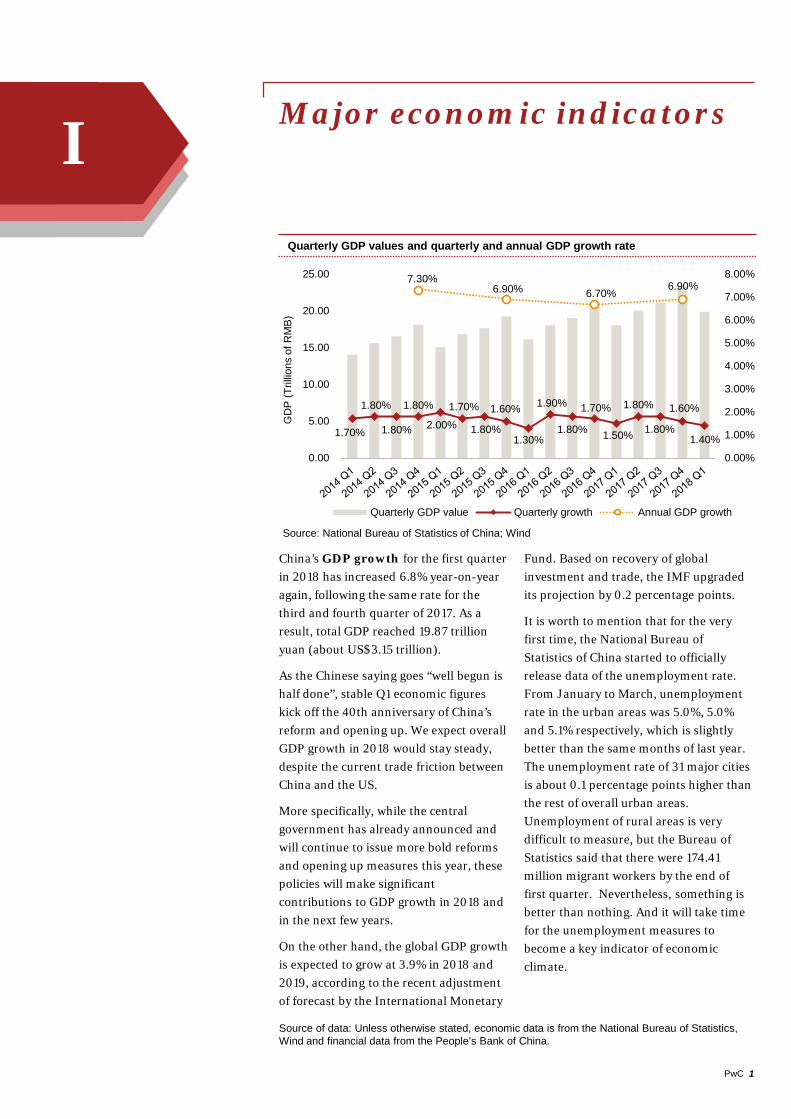
China’s GDP growth for the first quarter in 2018 has increased 6.8% year-on-year again, following the same rate for the third and fourth quarter of 2017. As a result, total GDP reached 19.87 trillion yuan (about US$3.15 trillion).
As the Chinese saying goes “well begun is half done”, stable Q1 economic figures kick off the 40th anniversary of China’s reform and opening up. We expect overall GDP growth in 2018 would stay steady, despite the current trade friction between China and the US.
More specifically, while the central government has already announced and will continue to issue more bold reforms and opening up measures this year, these policies will make significant contributions to GDP growth in 2018 and in the next few years.
On the other hand, the global GDP growth is expected to grow at 3.9% in 2018 and 2019, according to the recent adjustment of forecast by the International Monetary
Fund. Based on recovery of global investment and trade, the IMF upgraded its projection by 0.2 percentage points.
It is worth to mention that for the very first time, the National Bureau of Statistics of China started to officially release data of the unemployment rate. From January to March, unemployment rate in the urban areas was 5.0%, 5.0% and 5.1% respectively, which is slightly better than the same months of last year. The unemployment rate of 31 major cities is about 0.1 percentage points higher than the rest of overall urban areas. Unemployment of rural areas is very difficult to measure, but the Bureau of Statistics said that there were 174.41 million migrant workers by the end of first quarter. Nevertheless, something is better than nothing. And it will take time for the unemployment measures to become a key indicator of economic climate.
PwC 1
Source of data: Unless otherwise stated, economic data is from the National Bureau of Statistics, Wind and financial data from the People’s Bank of China.
Source: National Bureau of Statistics of China; Wind
6.35
%
6.00
%
5.64
%
5.51
%
5.69
%
5.53
%
5.33
%
5.15
%
5.45
%
4.80
%
4.48
%
45.5
5%
43.9
5%
44.9
3%
45.1
0%
44.4
9%
43.0
5%
42.1
2%
40.2
2%
38.0
2%
38.8
5%
38.9
6%
48.1
0%
50.0
5%
49.4
3%
49.3
9%
49.8
2%
51.4
2%
52.5
6%
54.6
4%
56.5
3%
56.3
5%
56.5
6%
0.00%
20.00%
40.00%
60.00%
80.00%
100.00%
primary secondary services
Per
cent
age
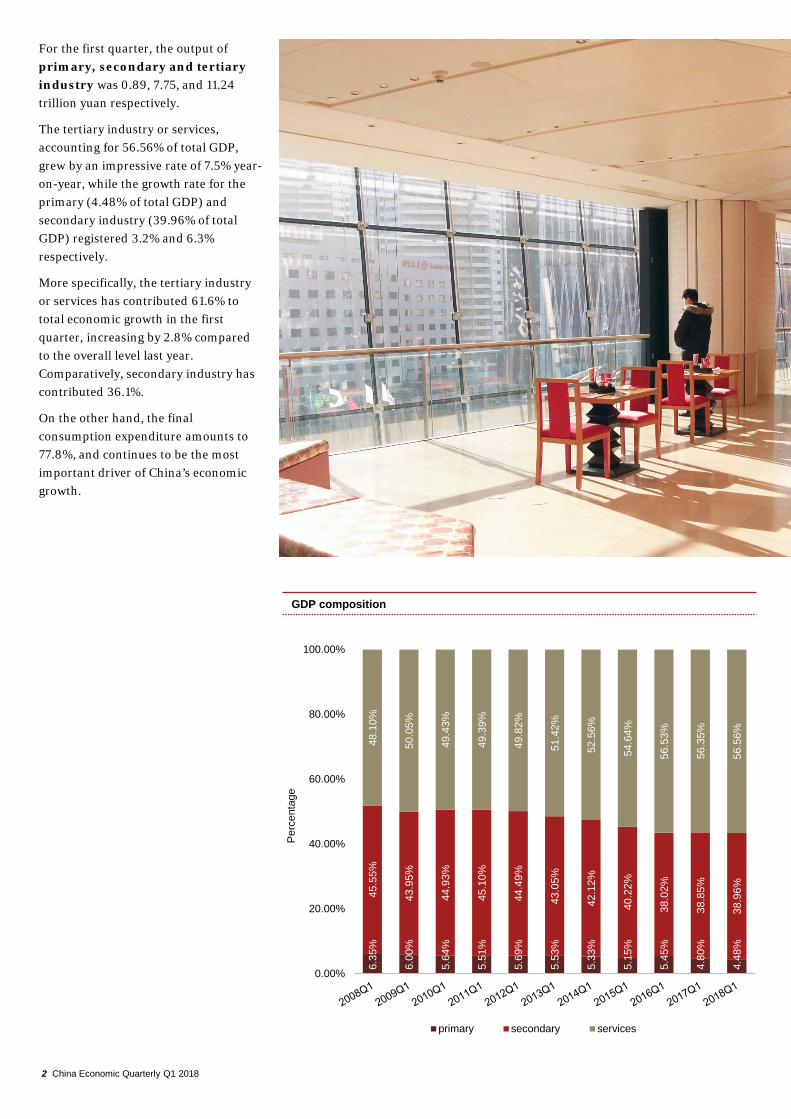
For the first quarter, the output of primary, secondary and tertiary industry was 0.89, 7.75, and 11.24 trillion yuan respectively.
The tertiary industry or services, accounting for 56.56% of total GDP, grew by an impressive rate of 7.5% year-on-year, while the growth rate for the primary (4.48% of total GDP) and secondary industry (39.96% of total GDP) registered 3.2% and 6.3% respectively.
More specifically, the tertiary industry or services has contributed 61.6% to total economic growth in the first quarter, increasing by 2.8% compared to the overall level last year. Comparatively, secondary industry has contributed 36.1%.
On the other hand, the final consumption expenditure amounts to 77.8%, and continues to be the most important driver of China’s economic growth.
GDP composition
2 China Economic Quarterly Q1 2018
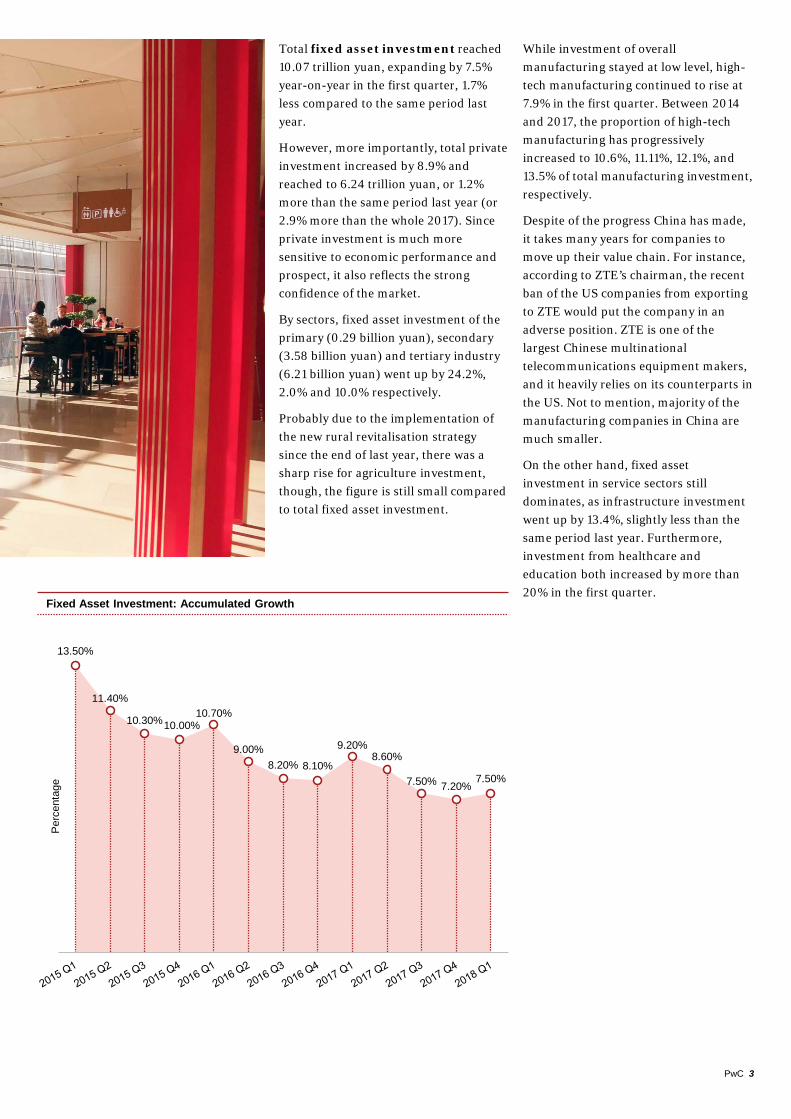
Total fixed asset investment reached 10.07 trillion yuan, expanding by 7.5% year-on-year in the first quarter, 1.7% less compared to the same period last year.
However, more importantly, total private investment increased by 8.9% and reached to 6.24 trillion yuan, or 1.2% more than the same period last year (or 2.9% more than the whole 2017). Since private investment is much more sensitive to economic performance and prospect, it also reflects the strong confidence of the market.
By sectors, fixed asset investment of the primary (0.29 billion yuan), secondary (3.58 billion yuan) and tertiary industry (6.21 billion yuan) went up by 24.2%, 2.0% and 10.0% respectively.
Probably due to the implementation of the new rural revitalisation strategy since the end of last year, there was a sharp rise for agriculture investment, though, the figure is still small compared to total fixed asset investment.
Fixed Asset Investment: Accumulated Growth
13.50%
11.40%
10.30%10.00%10.70%
9.00%8.20% 8.10%
9.20%8.60%
7.50% 7.20%7.50%
Per
cent
age
PwC 3
While investment of overall manufacturing stayed at low level, high-tech manufacturing continued to rise at 7.9% in the first quarter. Between 2014 and 2017, the proportion of high-tech manufacturing has progressively increased to 10.6%, 11.11%, 12.1%, and 13.5% of total manufacturing investment, respectively.
Despite of the progress China has made, it takes many years for companies to move up their value chain. For instance, according to ZTE’s chairman, the recent ban of the US companies from exporting to ZTE would put the company in an adverse position. ZTE is one of the largest Chinese multinational telecommunications equipment makers, and it heavily relies on its counterparts in the US. Not to mention, majority of the manufacturing companies in China are much smaller.
On the other hand, fixed asset investment in service sectors still dominates, as infrastructure investment went up by 13.4%, slightly less than the same period last year. Furthermore, investment from healthcare and education both increased by more than 20% in the first quarter.
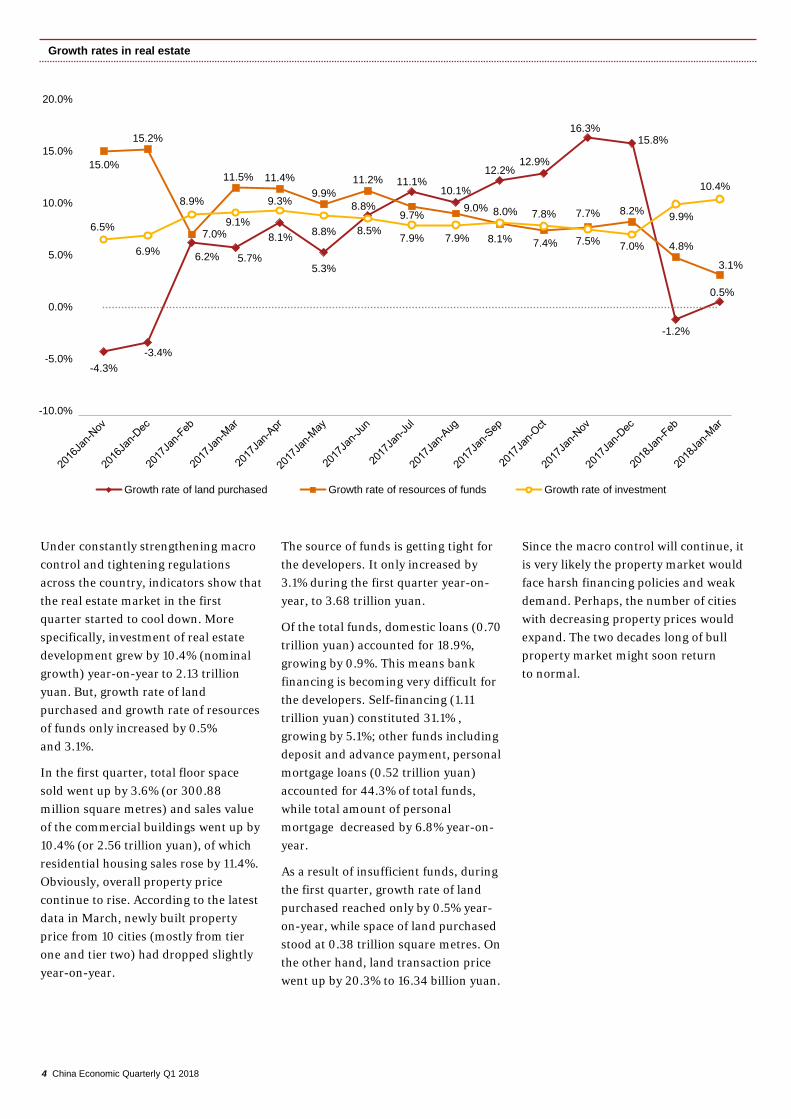
Growth rates in real estate
-4.3%-3.4%
6.2% 5.7%
8.1%
5.3%
8.8%
11.1%10.1%
12.2%12.9%
16.3%15.8%
-1.2%
0.5%
15.0%
15.2%
7.0%
11.5% 11.4%9.9%
11.2%
9.7%9.0% 8.0%
7.4%
7.7% 8.2%
4.8%
3.1%
6.5%
6.9%
8.9%
9.1%
9.3%
8.8% 8.5%7.9% 7.9% 8.1%
7.8%
7.5% 7.0%
9.9%
10.4%
-10.0%
-5.0%
0.0%
5.0%
10.0%
15.0%
20.0%
Growth rate of land purchased Growth rate of resources of funds Growth rate of investment
Under constantly strengthening macro control and tightening regulations across the country, indicators show that the real estate market in the first quarter started to cool down. More specifically, investment of real estate development grew by 10.4% (nominal growth) year-on-year to 2.13 trillion yuan. But, growth rate of land purchased and growth rate of resources of funds only increased by 0.5% and 3.1%.
In the first quarter, total floor space sold went up by 3.6% (or 300.88 million square metres) and sales value of the commercial buildings went up by 10.4% (or 2.56 trillion yuan), of which residential housing sales rose by 11.4%. Obviously, overall property price continue to rise. According to the latest data in March, newly built property price from 10 cities (mostly from tier one and tier two) had dropped slightly year-on-year.
4 China Economic Quarterly Q1 2018
The source of funds is getting tight for the developers. It only increased by 3.1% during the first quarter year-on-year, to 3.68 trillion yuan.
Of the total funds, domestic loans (0.70 trillion yuan) accounted for 18.9%, growing by 0.9%. This means bank financing is becoming very difficult for the developers. Self-financing (1.11 trillion yuan) constituted 31.1% , growing by 5.1%; other funds including deposit and advance payment, personal mortgage loans (0.52 trillion yuan) accounted for 44.3% of total funds, while total amount of personal mortgage decreased by 6.8% year-on-year.
As a result of insufficient funds, during the first quarter, growth rate of land purchased reached only by 0.5% year-on-year, while space of land purchased stood at 0.38 trillion square metres. On the other hand, land transaction price went up by 20.3% to 16.34 billion yuan.
Since the macro control will continue, it is very likely the property market would face harsh financing policies and weak demand. Perhaps, the number of cities with decreasing property prices would expand. The two decades long of bull property market might soon return to normal.
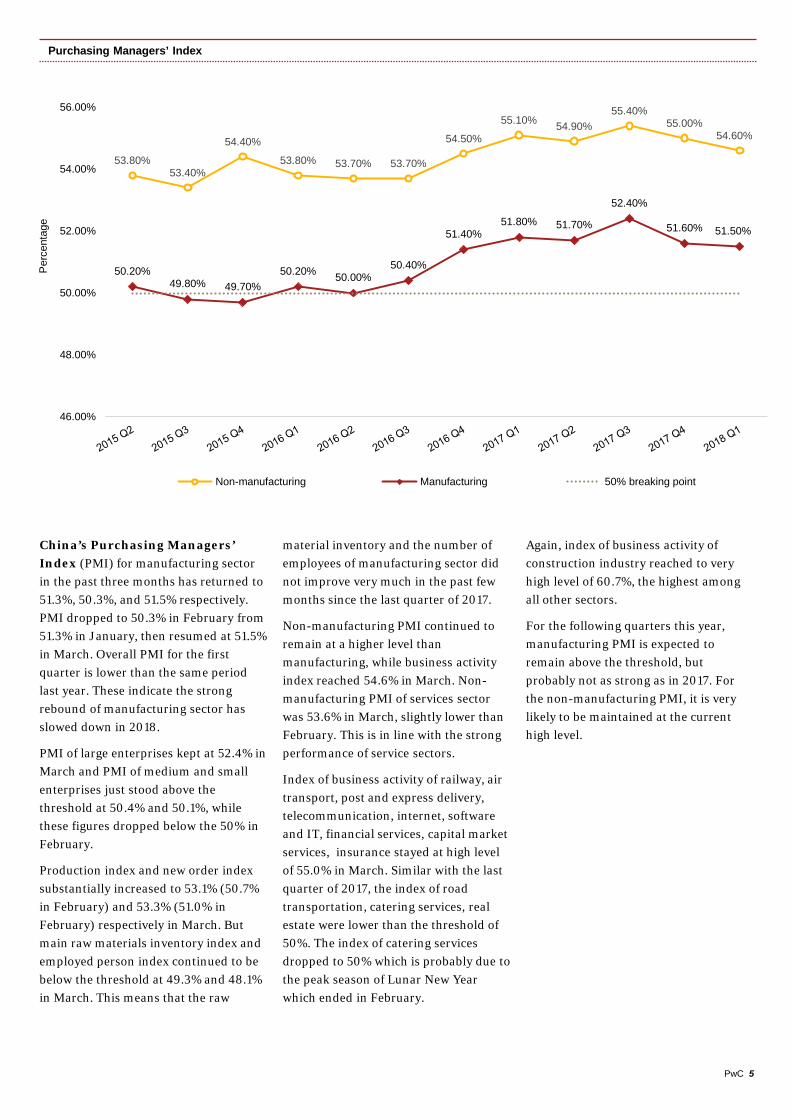
China’s Purchasing Managers’ Index (PMI) for manufacturing sector in the past three months has returned to 51.3%, 50.3%, and 51.5% respectively. PMI dropped to 50.3% in February from 51.3% in January, then resumed at 51.5% in March. Overall PMI for the first quarter is lower than the same period last year. These indicate the strong rebound of manufacturing sector has slowed down in 2018.
PMI of large enterprises kept at 52.4% in March and PMI of medium and small enterprises just stood above the threshold at 50.4% and 50.1%, while these figures dropped below the 50% in February.
Production index and new order index substantially increased to 53.1% (50.7% in February) and 53.3% (51.0% in February) respectively in March. But main raw materials inventory index and employed person index continued to be below the threshold at 49.3% and 48.1% in March. This means that the raw
material inventory and the number of employees of manufacturing sector did not improve very much in the past few months since the last quarter of 2017.
Non-manufacturing PMI continued to remain at a higher level than manufacturing, while business activity index reached 54.6% in March. Non-manufacturing PMI of services sector was 53.6% in March, slightly lower than February. This is in line with the strong performance of service sectors.
Index of business activity of railway, air transport, post and express delivery, telecommunication, internet, software and IT, financial services, capital market services, insurance stayed at high level of 55.0% in March. Similar with the last quarter of 2017, the index of road transportation, catering services, real estate were lower than the threshold of 50%. The index of catering services dropped to 50% which is probably due to the peak season of Lunar New Year which ended in February.
Again, index of business activity of construction industry reached to very high level of 60.7%, the highest among all other sectors.
For the following quarters this year, manufacturing PMI is expected to remain above the threshold, but probably not as strong as in 2017. For the non-manufacturing PMI, it is very likely to be maintained at the current high level.
Purchasing Managers’ Index
PwC 5
53.80%53.40%
54.40%
53.80% 53.70% 53.70%
54.50%
55.10% 54.90%55.40%
55.00%54.60%
50.20%49.80% 49.70%
50.20% 50.00%50.40%
51.40%51.80% 51.70%
52.40%
51.60% 51.50%
46.00%
48.00%
50.00%
52.00%
54.00%
56.00%
Per
cent
age
Non-manufacturing Manufacturing 50% breaking point
Growth of Industrial Added Values (for companies over certain scales)
6.80%
5.70%5.90%
6.80%
6.20% 6.10% 6.00%
7.60% 7.60%
6.60%6.20%
6.00%
Per
cent
age
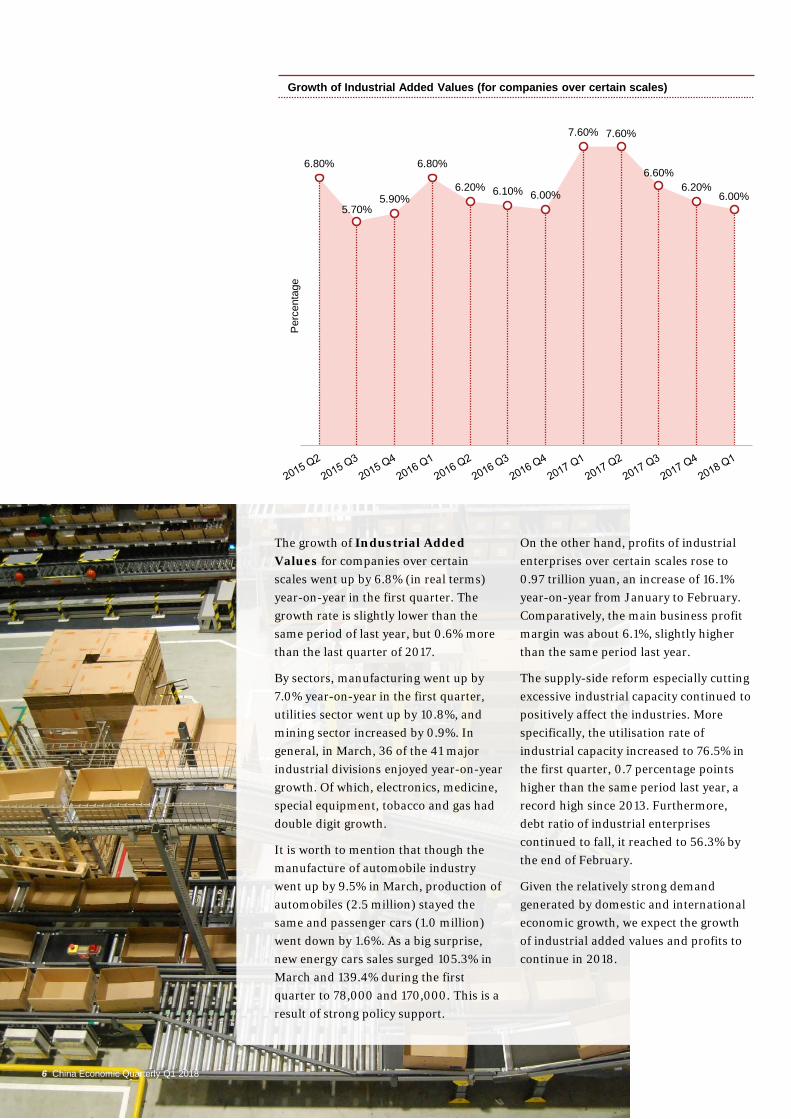
The growth of Industrial Added Values for companies over certain scales went up by 6.8% (in real terms) year-on-year in the first quarter. The growth rate is slightly lower than the same period of last year, but 0.6% more than the last quarter of 2017.
By sectors, manufacturing went up by 7.0% year-on-year in the first quarter, utilities sector went up by 10.8%, and mining sector increased by 0.9%. In general, in March, 36 of the 41 major industrial divisions enjoyed year-on-year growth. Of which, electronics, medicine, special equipment, tobacco and gas had double digit growth.
It is worth to mention that though the manufacture of automobile industry went up by 9.5% in March, production of automobiles (2.5 million) stayed the same and passenger cars (1.0 million) went down by 1.6%. As a big surprise, new energy cars sales surged 105.3% in March and 139.4% during the first quarter to 78,000 and 170,000. This is a result of strong policy support.
6 China Economic Quarterly Q1 2018
On the other hand, profits of industrial enterprises over certain scales rose to 0.97 trillion yuan, an increase of 16.1% year-on-year from January to February. Comparatively, the main business profit margin was about 6.1%, slightly higher than the same period last year.
The supply-side reform especially cutting excessive industrial capacity continued to positively affect the industries. More specifically, the utilisation rate of industrial capacity increased to 76.5% in the first quarter, 0.7 percentage points higher than the same period last year, a record high since 2013. Furthermore, debt ratio of industrial enterprises continued to fall, it reached to 56.3% by the end of February.
Given the relatively strong demand generated by domestic and international economic growth, we expect the growth of industrial added values and profits to continue in 2018.
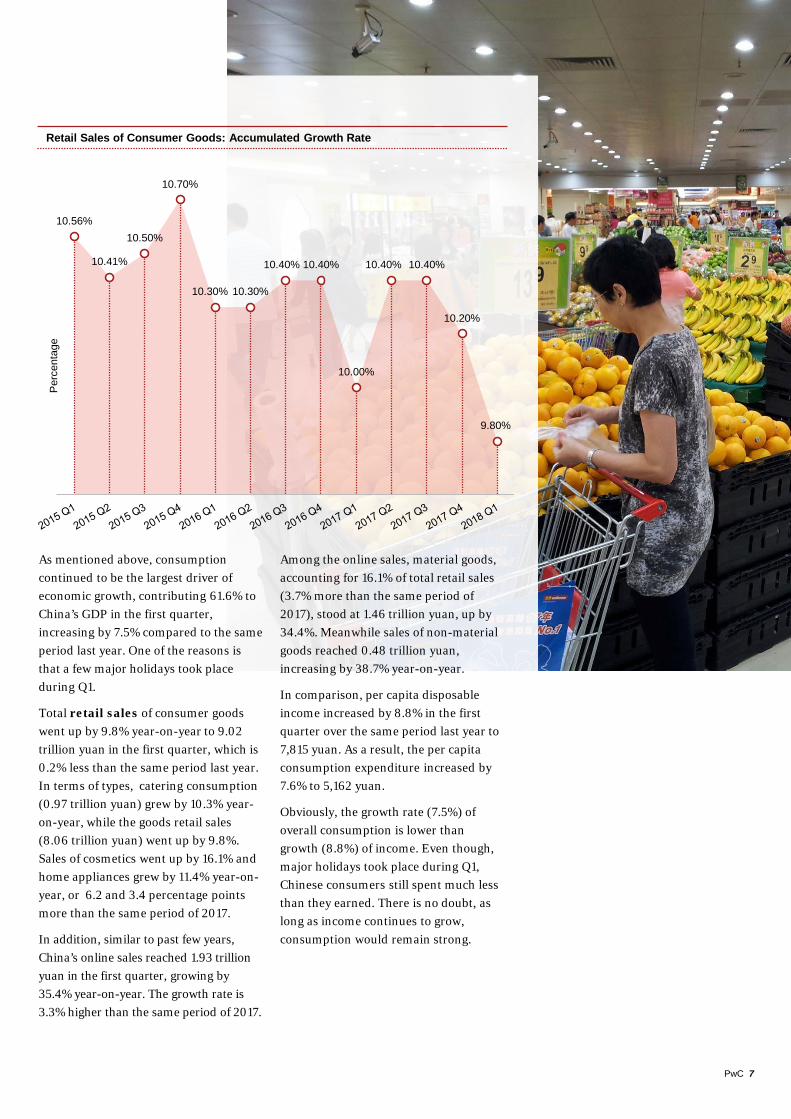
Retail Sales of Consumer Goods: Accumulated Growth Rate
10.56%
10.41%
10.50%
10.70%
10.30% 10.30%
10.40% 10.40%
10.00%
10.40% 10.40%
10.20%
9.80%
Per
cent
age
As mentioned above, consumption continued to be the largest driver of economic growth, contributing 61.6% to China’s GDP in the first quarter, increasing by 7.5% compared to the same period last year. One of the reasons is that a few major holidays took place during Q1.
Total retail sales of consumer goods went up by 9.8% year-on-year to 9.02 trillion yuan in the first quarter, which is 0.2% less than the same period last year. In terms of types, catering consumption (0.97 trillion yuan) grew by 10.3% year-on-year, while the goods retail sales (8.06 trillion yuan) went up by 9.8%. Sales of cosmetics went up by 16.1% and home appliances grew by 11.4% year-on-year, or 6.2 and 3.4 percentage points more than the same period of 2017.
In addition, similar to past few years, China’s online sales reached 1.93 trillion yuan in the first quarter, growing by 35.4% year-on-year. The growth rate is 3.3% higher than the same period of 2017.
PwC 7
Among the online sales, material goods, accounting for 16.1% of total retail sales (3.7% more than the same period of 2017), stood at 1.46 trillion yuan, up by 34.4%. Meanwhile sales of non-material goods reached 0.48 trillion yuan, increasing by 38.7% year-on-year.
In comparison, per capita disposable income increased by 8.8% in the first quarter over the same period last year to 7,815 yuan. As a result, the per capita consumption expenditure increased by 7.6% to 5,162 yuan.
Obviously, the growth rate (7.5%) of overall consumption is lower than growth (8.8%) of income. Even though, major holidays took place during Q1, Chinese consumers still spent much less than they earned. There is no doubt, as long as income continues to grow, consumption would remain strong.
¥100
¥200
¥300
¥400
¥500
¥600
¥700
¥800
¥900
¥1,000
¥1,100
¥1,200
-25.00%
-20.00%
-15.00%
-10.00%
-5.00%
0.00%
5.00%
10.00%
15.00%
20.00%
25.00%
30.00%
35.00%
Net Export( RMB billion) Export Growth Import Growth
Gro
wth
(Billion)
526.62 918.01 861.22 1118.34 933.93 898.77 838.16 880.050.06% -1.50% -13.93% -8.62% -1.17% 8.99% 20.83% 9.74%3.36% 8.64% -2.31% -1.59% 1.25% 0.80% 12.46% 7.08%
101.92 788.11 755.53 1007.20 810.26 967.14 458.51 800.70 330.89-1.07% 0.95% -17.46% -13.83% -7.89% 1.95% 30.27% 16.43% 11.90%-6.05% 12.71% 4.90% -5.44% -4.26% 0.34% 10.47% 7.66% 6.43%
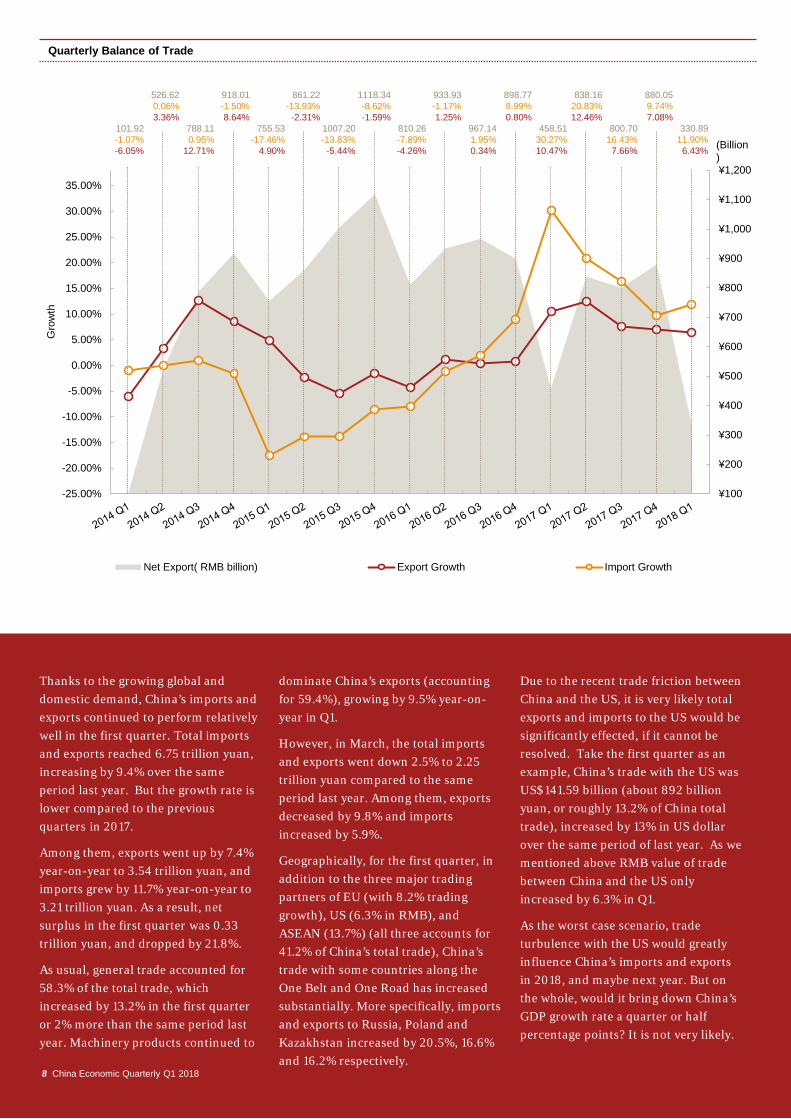
Quarterly Balance of Trade
Thanks to the growing global and domestic demand, China’s imports and exports continued to perform relatively well in the first quarter. Total imports and exports reached 6.75 trillion yuan, increasing by 9.4% over the same period last year. But the growth rate is lower compared to the previous quarters in 2017.
Among them, exports went up by 7.4% year-on-year to 3.54 trillion yuan, and imports grew by 11.7% year-on-year to 3.21 trillion yuan. As a result, net surplus in the first quarter was 0.33 trillion yuan, and dropped by 21.8%.
As usual, general trade accounted for 58.3% of the total trade, which increased by 13.2% in the first quarter or 2% more than the same period last year. Machinery products continued to
8 China Economic Quarterly Q1 2018
dominate China’s exports (accounting for 59.4%), growing by 9.5% year-on-year in Q1.
However, in March, the total imports and exports went down 2.5% to 2.25 trillion yuan compared to the same period last year. Among them, exports decreased by 9.8% and imports increased by 5.9%.
Geographically, for the first quarter, in addition to the three major trading partners of EU (with 8.2% trading growth), US (6.3% in RMB), and ASEAN (13.7%) (all three accounts for 41.2% of China’s total trade), China’s trade with some countries along the One Belt and One Road has increased substantially. More specifically, imports and exports to Russia, Poland and Kazakhstan increased by 20.5%, 16.6% and 16.2% respectively.
Due to the recent trade friction between China and the US, it is very likely total exports and imports to the US would be significantly effected, if it cannot be resolved. Take the first quarter as an example, China’s trade with the US was US$141.59 billion (about 892 billion yuan, or roughly 13.2% of China total trade), increased by 13% in US dollar over the same period of last year. As we mentioned above RMB value of trade between China and the US only increased by 6.3% in Q1.
As the worst case scenario, trade turbulence with the US would greatly influence China’s imports and exports in 2018, and maybe next year. But on the whole, would it bring down China’s GDP growth rate a quarter or half percentage points? It is not very likely.
1.38%1.39%1.60%1.60%2.30%1.88%1.92% 2.08%
0.90%1.50% 1.60%1.80%
2.10%
-4.56% -4.81%-5.95%
-5.90%
-4.30%
-2.60%
0.10%
5.50%
7.60%
5.50%
6.90%
4.90%
3.10%
-8.00%
-6.00%
-4.00%
-2.00%
0.00%
2.00%
4.00%
6.00%
8.00%
CPI PPI
Gro
wth
(con
tract
ion)
rate
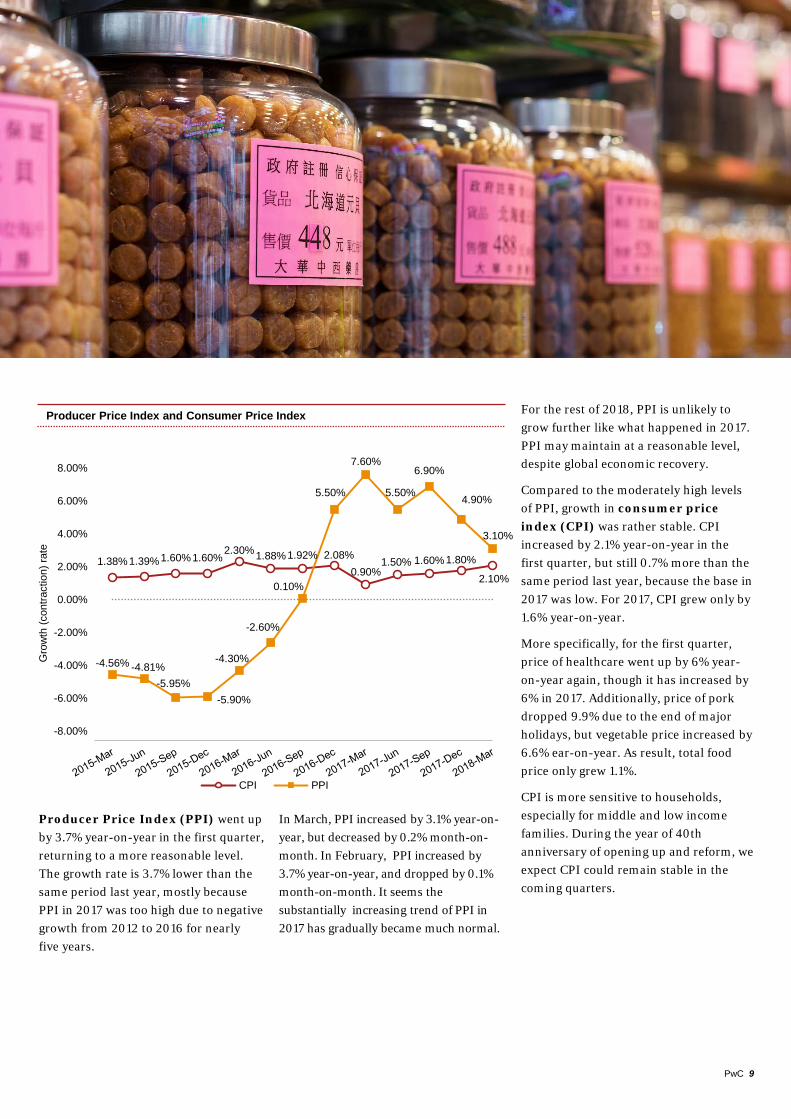
Producer Price Index and Consumer Price Index
PwC 9
Producer Price Index (PPI) went up by 3.7% year-on-year in the first quarter, returning to a more reasonable level. The growth rate is 3.7% lower than the same period last year, mostly because PPI in 2017 was too high due to negative growth from 2012 to 2016 for nearly five years.
In March, PPI increased by 3.1% year-on-year, but decreased by 0.2% month-on-month. In February, PPI increased by 3.7% year-on-year, and dropped by 0.1% month-on-month. It seems the substantially increasing trend of PPI in 2017 has gradually became much normal.
For the rest of 2018, PPI is unlikely to grow further like what happened in 2017. PPI may maintain at a reasonable level, despite global economic recovery.
Compared to the moderately high levels of PPI, growth in consumer price index (CPI) was rather stable. CPI increased by 2.1% year-on-year in the first quarter, but still 0.7% more than the same period last year, because the base in 2017 was low. For 2017, CPI grew only by 1.6% year-on-year.
More specifically, for the first quarter, price of healthcare went up by 6% year-on-year again, though it has increased by 6% in 2017. Additionally, price of pork dropped 9.9% due to the end of major holidays, but vegetable price increased by 6.6% ear-on-year. As result, total food price only grew 1.1%.
CPI is more sensitive to households, especially for middle and low income families. During the year of 40th anniversary of opening up and reform, we expect CPI could remain stable in the coming quarters.
II Policy Updates
10 China Economic Quarterly Q1 2018
As the World Bank states in its website, “resilient, transparent and smooth-functioning financial systems and capital markets contribute to financial stability, job growth and poverty alleviation.” There is no doubt that a sound financial system is crucial to economic growth and development in any country. China has been very cautious to further open up the financial sector to foreign investors, and some
restrictions are applied to the domestic private companies. The state-owned enterprises dominated financial sector lacks competition and efficiency and it is almost like a shackle to prevent optimal allocation of financial resources. This is mainly because the real economy developed very rapidly in the past few decades and the supply of the financial sector does not match the surging demand.
● Further opening up of the financial sector is critical and would have a huge impact on other reform measures, as well as China’s overall economy.
PwC 11
More specifically, taking the banking sector as an example, by the end of 2017, total assets under management of foreign owned banks in China was only a miniscule 1.28% of the banking sector. While competition is very limited, state-owned banks often prefer to lend to other SOEs in order to avoid risk (frequently to be politically correct). Avoidance of risk, is a root cause of the struggle of private companies, to borrow money from the banks.
The recently announced measures by Yi Gang, governor of People’s Bank of China will further open up banking, asset management, securities, mutual fund management, futures, insurance to foreign companies. China’s capital markets is also making progress to be more internationalised. As a result, we expect China’s financial sector would become much more competitive and efficient in the next few years. Ultimately, the financial sector would be getting better at serving the real economy and boosting economic growth and development.
Hainan is the smallest province in the south with a total area of 35,400 square kilometres (compared to Hawaii’s 28,311 square kilometres) and a population of 9 million. In 2017 Hainan attracted about one million international tourists and in order to attract more international visitors, a new 30-day visa-free policy will be adopted in Hainan for citizens from 59 countries starting 1 May this year. This is the extension of a 15-day or 21-day visa waiver policy for group visitors from 26 countries since 2010.
In addition to hospitality (hotel and tourism), enormous business opportunities will emerge from retail (duty free shopping), sports, tropical agriculture, culture (entertainment), pension services and health care. “China welcomes investors worldwide to invest and start business in Hainan and participate in the building of a free trade port there”, President Xi Jinping addressed during a speech at a celebration marking the 30th anniversary of the establishment of Hainan Province. This might be a prelude for the central government to issue more opening up measures for special geographic areas such as Shanghai’s Pudong, Qianhai in Shenzhen.
● Policy support related to building free trade port would boost Hainan Island into China’s Hawaii.

III Hot topic analysis
● “Life begins at forty” — China’s reform and opening up to reach historic highs in 2018
The year 2018 marks the 40th anniversary of China’s reform and opening up which began in 1978. As Confucius said, “At forty, I had no doubts.” In the 19th century, German philosopher Arthur Schopenhauer noted: “The first forty years of life give us the text: the next thirty supply the commentary.” In the West, perhaps the best known use of this aphorism is “Life Begins at Forty”, a 1932 American self-help book by Walter B. Pitkin. No matter how it is stated, the 40th anniversary means a lot in our life, and it is the same for a nation.
12 China Economic Quarterly Q1 2018
To look back over the last four decades, there is no doubt that the process of reform and opening up was the only way to create prosperity for China and its people, and this is certainly the consensus for most of the nation’s residents. A few weeks ago, President Xi Jinping called for boosting China’s opening up during a keynote speech at the opening ceremony of the Boao Forum for Asia annual conference. He said, “Today, the Chinese people can say with great pride that reform and opening up, China’s second revolution, has not only profoundly changed the country but also greatly influenced the whole world”. President Xi used the phrase “China’s second revolution” to describe the reform and opening up, which means its importance can be compared to the founding of the People’s Republic.
PwC 13
The best way to understand this impact is through examples. For instance, the market share of wholly private and foreign owned banks is very small which severely limits competition. In fact, by the end of 2017, total assets of foreign owned banks in China was only about 1.28% of the banking sector. State-owned banks, which dominate the industry, often prefer to lend to other state-owned enterprises in order to avoid risk. As a result, the current banking system is not capable of efficiently allocating financial resources, such as capital, which ultimately holds up economic development and actually increases financial risks.
The recently announced measures by Yi Gang, governor of People’s Bank of China will further open up banking, insurance and other financial service sectors to foreign companies. As a result, further opening up will help the financial service sector to become much more competitive and efficient. Ultimately, it boost economic growth and development.
Additionally, there are many other industries and sectors which face similar problems. For example, China’s general aviation (which includes all civil aviation operations other than scheduled air services) and civil aviation industries. the dominance of state-owned enterprises and government regulation have restrained the expansion of private companies and market competition, although here is room to grow further, especially general aviation.
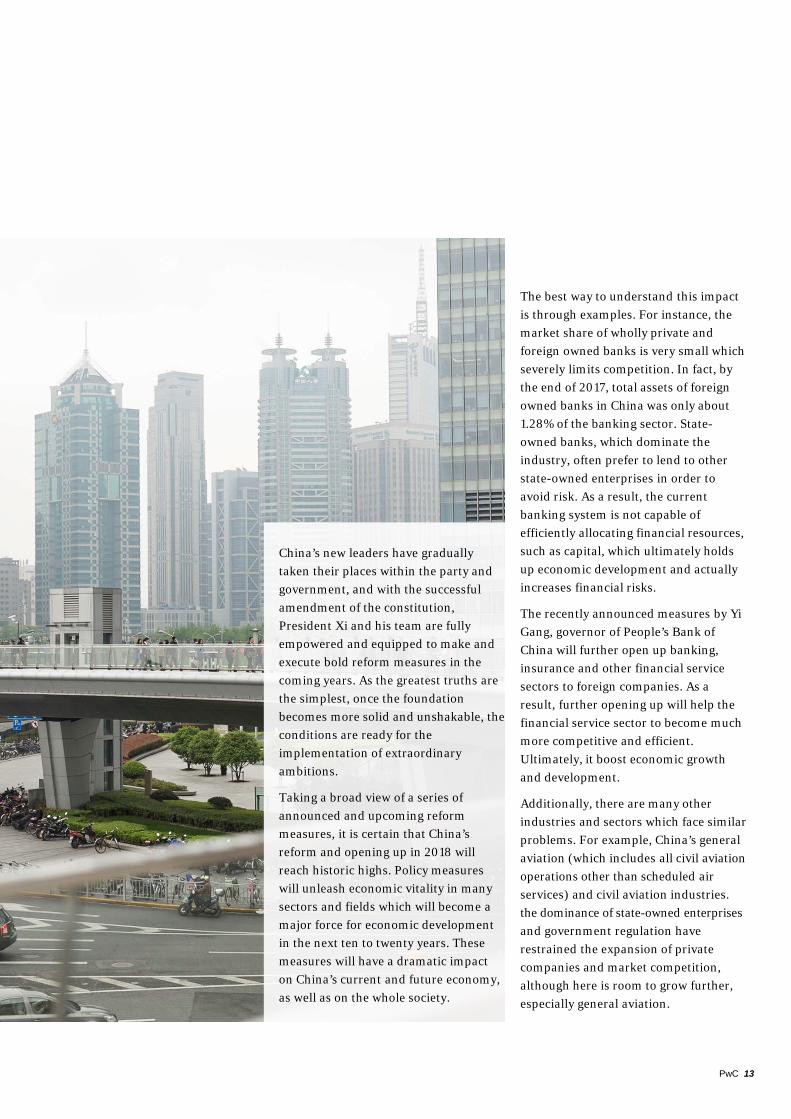
China’s new leaders have gradually taken their places within the party and government, and with the successful amendment of the constitution, President Xi and his team are fully empowered and equipped to make and execute bold reform measures in the coming years. As the greatest truths are the simplest, once the foundation becomes more solid and unshakable, the conditions are ready for the implementation of extraordinary ambitions.
Taking a broad view of a series of announced and upcoming reform measures, it is certain that China’s reform and opening up in 2018 will reach historic highs. Policy measures will unleash economic vitality in many sectors and fields which will become a major force for economic development in the next ten to twenty years. These measures will have a dramatic impact on China’s current and future economy, as well as on the whole society.
For instance, in the US, general aviation is a huge market. According to the General Aviation Manufacturers Association, in 2017, the industry contributed more than $219 billion to the US economy, and generated 1.1 million jobs. In China, based on an industry expert’s estimation, the number of aircraft, airports, and general aviation pilots are only a very small percentage, 1%, 0.5% and 1.5% respectively, of the American totals, with government regulation and control cited as the main barriers to the development of the sector.
China’s overall economic development has reached a high level, and the general aviation sector is ready for take-off. Though the industry has gradually picked up in the last few years, further deregulation would unlock the market creating massive economic value and opening the door for enormous business opportunities.
Furthermore, according to the Federal Aviation Administration in the US, and the Civil Aviation Administration of China, total revenue from China’s civil aviation was 639.3 billion RMB (about
$100 billion) in 2017, or 16% of the US market. Although the calculation methodologies for the two countries might be different, it is obvious that these figures do not coincide with their respective economic scales, since China’s GDP in 2017 was about 63% of the US total.
On the other hand, some might argue, China’s railway system, particularly high speed railway is much more advanced than many countries including the US The market potential of deregulation and increased marketisation of both civil and general aviation industry is vast, as potentially it could add a few million jobs, and enlarge business revenues to a few trillions.
Lastly, continued reform and opening up in China will never be an easy job and it is full of challenges. That is why it is so difficult to enact many urgently needed essential measures. Hence, many people do not understand why it has been so hard to implement the famous policy of “let the market play a decisive role in resource allocation”, which was introduced nearly five years ago.
Without strong leadership to implement reforms from the top, many obstacles will not be resolved in China. Fortunately, the central leadership is now more powerful than in past decades. The numerous ongoing and upcoming measures for further reform and opening up can be fully executed and the results should elevate the country’s economic development to much higher levels in the next few years. Many years from now, when we look back, the year 2018 will be another milestone in the history of modern China.
Last but not least, Confucius also said “at seventy I could follow my heart’s desire without overstepping the boundaries of what was right.” Will China reach that level in 30 years? We look forward to embracing it.
14 China Economic Quarterly Q1 2018

This content is for general information purposes only, and should not be used as a substitute for consultation with professional advisors.
© 2018 PwC. All rights reserved. PwC refers to the China member firm, and may sometimes refer to the PwC network. Each member firm is a separate legal entity. Please see www.pwc.com/structure for further details. CN-20180118-4-C2
www.pwccn.com/ceq
Author
G. Bin ZhaoSenior Economist PwC China+86 (21) 2323 [email protected]
Acknowledgements
Special thanks to Sanjukta Mukherjee, Lan Lan, Liang Shan andResearch teams (led by Tiffany TK Wong) for their contributions to the report.