Children’s Services Strategy
36
Children’s Services Strategy
Transcript of Children’s Services Strategy

Children’s Services Strategy

Contents Introduction 4
A new strategy 5
What are the social benefits of children’s services? 6
What are the economic benefits of children’s services? 7
What services does Council currently provide? 8
How was this strategy prepared? 9
The Strategy 10
Strategy elements 11
Vision 12
Integrated services 14
Accessible services 15
Workforce Planning 16
Valued learning approach 17
The Evidence 19
Population size, structure and growth 20
Household structure, work trends and employment 21
Developmental vulnerability 22
Pre-school attendance, disability and cultural diversity 23
Service concentration 24
Service standards 25
Community-reported strengths of children’s services 26
Community-reported challenges 27
Factors influencing choice 28
Community-reported gaps, needs and priorities 29
References and data sources 30
Appendix A 31


Introduction
Northern Beaches Council is based on Sydney’s Northern Beaches, and administers a 254 square kilometre region for over 270,000 residents. The Council was formed in 2016 with the amalgamation of the former Manly, Pittwater and Warringah Councils. The organisation partners with the community to enhance quality of life, promote sustainable development and protect the environment.
A key focus area for Council is the provision of high quality and affordable child care services. In particular, Council seeks to support children with special needs, as well as families on low income or who are living with disadvantage.
The current children’s services delivered by Council reflect a range of different approaches inherited from the former councils.
This combined, streamlined Children’s Services Strategy is designed to ensure Council’s services best meet the needs of the community. It contains three sections:
• Introduction
• The Strategy
• The Evidence.
As a newly formed Council, it is important that investments and efforts made in relation to any public services are suited for the Council’s vision and resources.
There are also a number of other current and emerging local factors which the Strategy has been prepared to address. These include:
• changing populations
• need for accessible services
• changes in the early child care sector and workforce
• a need to define the role of Council in children’s services.
In this Strategy, the term ‘children’s services’ refers to a wide range of childhood education and care services. These include:
• Long day care: a service that provides an early childhood education program, delivered by a qualified teacher, which provides all-day or part-time care for children aged birth to six who attend on a regular basis.
• Pre-schools: a service that provides an early childhood education program, delivered by a qualified teacher, often but not necessarily on a sessional basis in a dedicated service.
• Outside school hours care: a service that provides care for primary school aged children (typically 5 to 12 years) before and after school and can also operate during school holidays (vacation care) and on pupil free days.
• Family day care: home based early childhood education and care for children aged from six weeks to 12 years.
• Occasional care: care offered on an ad hoc basis from one hour to a whole day for children aged 6 weeks to 6 years.
• Vacation care: services providing education and care during school holidays.
A new strategy for delivery of Council’s Children’s Services
Background
Why is a strategy needed? Definition of Children’s Services
5
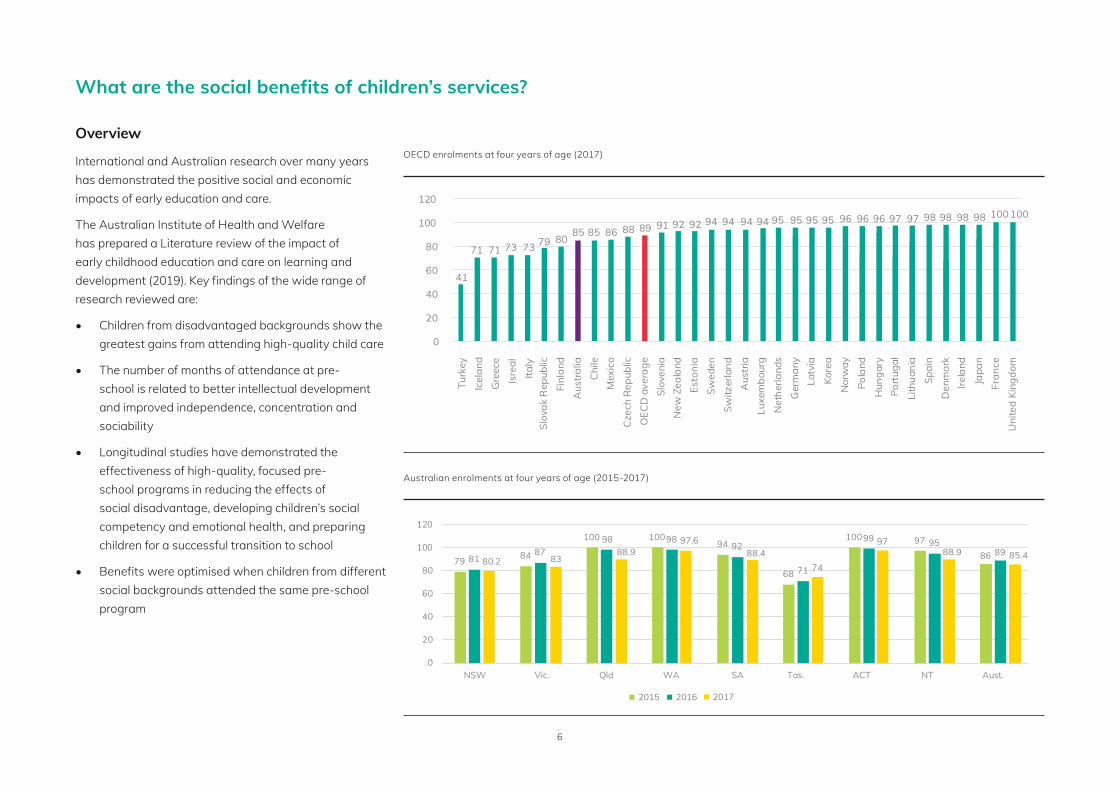
International and Australian research over many years has demonstrated the positive social and economic impacts of early education and care.
The Australian Institute of Health and Welfare has prepared a Literature review of the impact of early childhood education and care on learning and development (2019). Key findings of the wide range of research reviewed are:
• Children from disadvantaged backgrounds show the greatest gains from attending high-quality child care
• The number of months of attendance at pre-school is related to better intellectual development and improved independence, concentration and sociability
• Longitudinal studies have demonstrated the effectiveness of high-quality, focused pre-school programs in reducing the effects of social disadvantage, developing children’s social competency and emotional health, and preparing children for a successful transition to school
• Benefits were optimised when children from different social backgrounds attended the same pre-school program
What are the social benefits of children’s services?
Overview
41
71 71 73 73 79 8085 85 86 88 89 91 92 92 94 94 94 94 95 95 95 95 96 96 96 97 97 98 98 98 98 100 100
0
20
40
60
80
100
120
Turk
eyIc
elan
dG
reec
eIs
real
Italy
Ger
man
y
Swed
en
Den
mar
k
Kore
a
New
Zea
land
Latv
ia
Uni
ted
King
dom
Slov
enia
Japa
n
Net
herla
nds
Hun
gary
Lith
uani
a
Port
ugal
Nor
way
Luxe
mbo
urg
Cze
ch R
epub
lic
Finl
and
Slov
ak R
epub
lic
Aus
tria
Pola
nd
Chi
le
Irela
nd
Fran
ce
Mex
ico
OEC
D a
vera
ge
Aus
tral
ia
Spai
n
Esto
nia
Switz
erla
nd
OECD enrolments at four years of age (2017)
Australian enrolments at four years of age (2015-2017)
2017
79 84
10094
100
68
100 979797.6
86 85.481 80.287
8388.9 88.988.4
9892
98
71 74
99 9589
0
20
40
60
80
100
120
NSW Vic. Qld SAWA Tas. ACT NT Aust.
2015 2016
6

Research into the economic costs of high-intensity and crisis services has identified a range of positive economic impacts of early education and care.
Australian governments spend $15.2 billion per year delivering ‘late intervention’ services to deliver acute or statutory support to children and young people in crisis. This includes spending associated with out-of-home care, the youth justice system, and social security benefits for unemployed young people.
Often, children, young people and their families can avoid crisis if they have earlier access to appropriate or targeted support. This can significantly reduce the demand for late intervention services over time.
Early intervention strategies can provide opportunities to:
• Improve the lives of children and young people, and strengthen communities
• Reduce pressure on government budgets and drive future savings
• Boost workforce skills and capabilities, and build the economy.
High-quality early childhood education are an effective early intervention approach. A PwC report has demonstrated that Australian universal early childhood education programs produce a 1:2 return on investment.
What are the economic benefits of children’s services?
OverviewAnnual cost of late intervention in Australia (2018-2019) prices
Some issues which can be better addressed by early intervention
Sour
ce: W
illia
m T
eage
r, St
acey
Fox
and
Nei
l Sta
ffor
d, H
ow A
ustr
alia
can
inve
st e
arly
and
retu
rn m
ore:
A
new
look
at t
he $
15b
cost
and
opp
ortu
nity
. Ear
ly In
terv
entio
n Fo
unda
tion,
The
Fro
nt P
roje
ct a
nd C
oLab
at t
he T
elet
hon
Kids
Inst
itute
, Aus
tral
ia, 2
019.
$0.3bn
$1.1bn
$1.3bn
$1.4bn
$1.5bn
$2.0bn
$2.7bn
$5.9bn
Family violence
Physical health
Mental health
Youth homelessness
Youth and adult justice
Youth unemployment
Youth crime
Child protection
Physical health, including child and youth obesity
Youth hospotalisation for mental health issues, including suicide
Youth unemployment Youth crime
7

There are 14 Council-owned child care services on the Northern Beaches LGA, providing 880 approved places.
Council provides at least one centre offering each service type:
• seven long day care services
• two pre-school services
• four vacation care services
• one occasional care service
• family day care
Council recruits and supports 50 family day care educators to provide small group care and information to 320 children using this service.
These services support:
• 374 children from an English as a second language background
• 170 children from low income families
• 55 children with a disability.
Northern Beaches Council Children’s Services also develop individual programs for children with additional needs including gifted children.
What services does Council currently provide?
OverviewSuburb Name Centre type Places per day
Balgowlah North Harbour Pre-School Pre-school 40
Belrose Belrose Community and Children’s Centre Long day care 78
Brookvale Brookvale Children’s Centre Long day care 56
Brookvale Brookvale Occasional Care Occasional & Long day care 29
Cromer Cromer Vacation Care Vacation Care 60
Curl Curl Harbord Vacation Care Vacation Care 60
Dee Why Dee Why Children’s Centre Long day care 70
Fairlight The Roundhouse Children’s Centre Long day care 79
Forestville Forestville Vacation Care Vacation Care 60
Manly Manly Community Pre-school Pre-school 60
Manly Vale Manly Vale Vacation Care Vacation Care 45
Narrabeen Narrabeen Children’s Centre Long day care 56
Seaforth Harbour View Children’s Centre Long day care 52
Northern Beaches Council Family Day Care Family Day Care 135
Total 880
8

How was this strategy prepared?
The process for preparing this strategy is shown in this diagram. It commenced with research and analysis, the findings of which are provided in the Introduction section, as well as The Evidence section.
The approach for community engagement was to consult with non-users and current users of Council’s Children’s Services and key stakeholders. The engagement with different types of community and stakeholder groups ensured a range of perspectives were provided to inform this strategy.
Community engagement included:
• Telephone interviews with a private children’s services provider, a service run by another council, and an organisation supporting children with additional needs
• A focus group with community members, held at the Manly Vale Community Centre
• Intercept surveys undertaken with families which do not use Council’s Children’s Services, at Story Time at the Mona Vale Library and a school holiday event at the Glen Street Theatre in Belrose, with 29 surveys completed
• Inclusion of questions in Children’s Services Customer Satisfaction Surveys, with 315 responses.
Findings from this engagement are provided in The Evidence section. The outcomes were used as the basis of many aspects of the document, including the vision, focus areas and strategic actions contained in The Strategy section.
Following the collation of an evidence base, two co-design workshops were held with the Council Children’s Services Team to guide the design of the strategy vision, focus areas and strategic actions. Outputs from the co-design workshop formed the basis of the draft Strategy, which underwent public exhibition and feedback. After the exhibition period, the Children’s Services Strategy was finalised.
Research and analysis
Community engagement
Co-design workshops
Draft strategy prepared
Public exhibition and feedback
Council resolution to exhibit
Final strategy prepared
9

The Strategy

Strategy elements
This Strategy contains three main elements:
• vision and purpose
• focus areas
• strategic actions.
The relationship between these elements is shown in the diagram opposite.
The vision and purpose for children’s services is the centre of the strategy. It was prepared based on the outcomes of engagement with families and Council’s Children’s Services team. The vision is shown on the following page.
The focus areas are the four key areas which Council will prioritise over the next four years to achieve the vision. The focus areas are intended to work together to deliver on the vision and are not provided in any particular order.
The strategic actions are a series of high level activities in each of the focus areas for Council to complete over the next four years. The strategic actions are provided with the relevant focus areas on pages 14-17.
A roadmap showing the interrelationships between the strategic actions and their timing is on page 18.
Overview Relationship between strategy elements
Integrated services
Vision
Strategic actions
Strategic actions
Valued learning
approach
Accessible services
Workforce Planning
11

VisionChildren’s Services are valued as an essential part of Council's commitment to a healthy and engaged community.
Our integrated learning services and play-based approach sets the benchmark for early childhood learning across the Northern Beaches.
Council’s Children’s Services are accessible, equitable, and flexible. They enable community connections and support community values.
12

PurposeNorthern Beaches Council provides children’s services for a number of interconnected reasons, including to:
• Support the area’s diverse communities and families and help meet their needs
• Help address gaps in the services supplied by the market
• Set a quality benchmark for children’s services.
13

Council manages a portfolio of integrated and multi modal services that provide flexibility for families.
This focus area responds to feedback that families are seeking greater flexibility in children’s services. The strategic actions are on developing an innovative ‘multi modal model’ approach which sees many services provided from one location. Dependent on the needs of local families, services in a multi modal model may include long day care, occasional care, pre-schools and outside school hours care. It is planned to trial inclusion of pre-school services at Dee Why Children’s Centre pending state Government funding approval.
Universal access funding to Early Childhood Education is available for all children in the year before full-time school. There is a movement to expanding the Commonwealth funding contribution to include three-year olds, further supporting increasing participation rates in pre-school.
The strategic actions also look at ways in which Children’s Services can collaborate with other services, such as schools, elder care services and allied health to provide community connections.
01 Integrated services
No Strategic action Year
1.1 Develop a business plan to operate a permanent facility at North Harbour offering pre-school and vacation care services aligned to community need.
2021
1.2 Trial the integrated delivery of multiple service types at Dee Why Children’s Centres and report on the learning, customer satisfaction, professional development and financial outcomes.
2021
1.3 Deliver a program collaboratively with one school and one elder care service and report on the outcomes for community connections.
2021
1.4 Develop a cost-neutral operating model for multi modal service delivery that provides flexibility for families and increases service efficiency.
2022
1.5 Introduce an integrated customer management system for Children’s Services to better track family needs, preferences and service satisfaction.
2022
1.6 Develop and implement a prioritised program for appropriate existing centres to operate as multi-modal services.
2023
Vision
Valued learning
approach
Accessible services
Integrated services
Workforce Planning
14

Council provides children’s services to give families choices which cater for their diverse needs, are conveniently located, and are affordable.
Accessibility means different things to different families. For some families it is the ability to afford services at all, for others it means services located close to home, school or work. Some families seek services without long waiting lists and others need services which meet the particular support or programming needs of their child.
All families desire choice. Strategic actions in this focus area allow Council’s services to help provide choice for the families of the Northern Beaches and help meet wider community needs.
02 Accessible services
No Strategic action Year
2.1 Review operational policies and procedures to increase flexibility with an initial focus on reviewing operating hours, maintain affordability and support service cost neutrality.
2021
2.2 Undertake detailed research and engage with the community to determine how Children’s Services can respond to community need and provide a benchmark for service quality in the upper Northern Beaches and/or Frenchs Forest.
2021
2.3 Develop a business case for a new Council-run centre in the upper Northern Beaches and/or Frenchs Forest, with clear prioritisation and staging if more than one new centre is proposed.
2022
2.4 Engage the community and special education experts, on the design of a new Council-run centre on the upper Northern Beaches and/or Frenchs Forest and its potential integration with other Council and non Council services such as allied health.*
2.5 Undertake detailed land use and operational planning for a new Children’s Services centre.*
2.6 Begin construction of a new Children’s Service centre to meet community need.*
2.7 Begin engagement and forward planning for any additional new centres.*
* 2.4-2.7 are dependant on Frenchs Forest Structure Plan timing and funds being available.
Vision
Valued learning
approachWorkforce Planning
Integrated services
Accessible services
15

Integrated services
Council is engaged and committed to fostering Children’s wellbeing and education by providing consistent and quality care.
Highly trained, engaged and committed staff are essential to realising positive long term social and economic outcomes from early childhood education and care.
The programming of activities and establishing nurturing relationships with families and children are important aspects of Council achieving and maintaining its high quality ratings.
03 Workforce Planning
No Strategic action Year
3.1 Engage with and plan for staff to develop appropriate skill sets required to deliver high quality Children’s Services.
2021
3.2 Continue to support the professional development and continuous learning for early childhood educators.
2021
3.3 Facilitate efficient and effective recruitment and onboarding processes to ensure the seamless delivery of high quality service.
2021
3.4 Create opportunities for industry connection, networking and advocacy in the area of Early Childhood education for staff.
2022
3.5 Review and refine employment policies to strengthen the delivery of accessible and integrated services for families.
2022
Vision
Valued learning
approach
Accessible services
Workforce Planning
16

Accessible services
Council communicates its leading educational approach to service delivery so it is understood by all stakeholders.
The evidence is clear: Council provides high quality children’s services which are valued by families and provide a benchmark for private and non government service providers.
However, the educational philosophy behind Council’s approach is not always understood by families, other service providers and the broader community.
Strategic actions in this focus area aim to increase understanding of Council’s approach, to help improve early learning for all children on the Northern Beaches.
04 Valued learning approach
No Strategic action Year
4.1 Develop and implement a communications plan which educates and informs families, partners, other service providers, and the broader community about Council’s leading approach to children’s services.
2021
4.2 Empower and support educators to feel confident in articulating Council’s early learning approach and the importance of early learning.
2022
4.3 Develop and implement a community engagement and outreach program that showcases how Council’s approach to its delivery of children’s services helps to grow the future leaders of the Northern Beaches community.
2023
4.4 Evaluate the extent to which the community and stakeholders understand the educational approach of Council’s Children’s Services.
2024
Vision
Integrated services
Valued learning
approachWorkforce Planning
17

Integrated services
This roadmap shows how the 20 strategic actions will be staged over the timeframe of the Children’s Services Strategy.
The strategic actions delivered in the first two years of the Workforce Planning and Valued Learning Approach focus areas will set a foundation for ongoing improvements to service delivery.
Early actions in these focus areas will enable innovations in the Integrated Services and Accessible Services focus areas, in particular the delivery of the multi modal service model. This will provide the accessibility and flexibility sought by families, help future proof Council’s services and establish the Northern Beaches as a leader in children’s services.
Roadmap to a city-leading multi modal approach
Vision
Valued learning
approach
Accessible services
Focus Area 2021 2022 2023 2024+
Integrated Services 1.1 1.2 1.3 1.4 1.5 1.6
Accessible Services 2.1 2.2 2.3
Workforce Planning 3.1 3.2 3.3 3.4
Valued Learning Approach
4.1 4.2 4.3 4.4
Workforce Planning
• Integrated Services: A multi modal service operates at North Harbour offering pre-school and vacation care services aligned to community need in 2022
• Accessible Services: Children’s Services operating as a cost neutral service by 2022/2023 and ongoing
• Workforce Planning: Reduce the recruitment timeframe for successfully onboarding staff to under 12 weeks
• Valued Learning Approach: Maintain high customer satisfaction levels, the current measure is >90% parent satisfaction
Measures of Success
18

The Evidence

3,675 more children aged 0-9 will live in the area by 2041
In 2021, the Northern Beaches is home to 270,642 people, representing 5.2% of the Greater Sydney population. Over the next 20 years, the population of the LGA is expected to increase by 15.5% to 312,503 people.
Compared to Greater Sydney, the Northern Beaches has an older population with a median age of 40 years compared to the median of 36 years in Greater Sydney. Children aged 0-9 years on the Northern Beaches account for 12.5% of the population. This proportion is not expected to increase significantly between 2021 and 2041, however the number of children aged 0-9 years is expected to increase by 10.9% to 37,523. In particular, the number of children aged 0-4 is expected to increase by 12.3%.
.idcommunity 2021
The populations of Ingleside and Frenchs Forest are also expected to increase significantly (297.0% and 98.9% respectively), with an increase in the number of medium density apartment buildings predominantly driving population growth in these areas.
.idcommunity 2021
Population size and structure Expected population growth
Population pyramid 2021 Projected population growth 2016-2041
0-4
10-14
20-24
30-34
40-44
50-54
60-64
70-74
80-84
Percentage
Five
-yea
r age
gro
up
Northern Beaches Greater Sydney
0
500
1,000
1,500
2,000
2,500
3,000
3,500
4,000
4,500
5,000
0 to
4
5 to
9
10 to
14
15 to
19
20 to
24
25 to
29
30 to
34
35 to
39
40 to
44
45 to
49
50 to
54
55 to
59
60 to
64
65 to
69
70 to
74
75 to
79
80 to
84
85 +
Popu
latio
n in
crea
se
Five -year age group
-5%-10% 0% 5% 10%
20

Many families with high levels of advantage
The Northern Beaches has a high proportion of family households (including couples without children, as well as parents living with their children). By 2041, the largest increase in families with children will be in Ingleside and Frenchs Forest.
In 2016, half of the Northern Beaches population worked within the LGA, with the City of Sydney the second most common destination for work. In addition, more Northern Beaches residents worked from home (7.1%) compared to residents of Greater Sydney (4.4%). It is likely that these proportions have changed in the past year due to the impacts of COVID-19.
The majority of Northern Beaches residents travel to work by car (57.9%).Australian Bureau of Statistics, 2016 Census
The Northern Beaches has relatively high socio-economic advantage. According to the Index of Relative Socio-economic Advantage and Disadvantage (IRSAD), the Northern Beaches is in the top 10% of LGAs in NSW.
The median weekly household income on the Northern Beaches is $2,178, which is higher compared to the Greater Sydney average ($1,750). Furthermore, the Northern Beaches has a greater proportion of households in the highest income quartile and lesser proportion in the lowest income quartile compared to Greater Sydney.
In 2016, unemployment on the Northern Beaches was significantly lower than in Greater Sydney (3.5% and 6.0% respectively). As of December 2020, a significantly lower proportion of the Northern Beaches population aged 15-64 years received job seeker and youth allowance compared to Greater Sydney (3.8% and 6.9% respectively).Australian Bureau of Statistics, 2016 Census and .idcommunity 2021.
Household structure and work trends Household income and unemployment
16%19%
24%
41%
21%22%
26%31%
0%
5%
10%
15%
20%
25%
30%
35%
40%
45%
$0 - $750* $751 - $1,481* $1,482 - $2,544* $2,555 +*
Northern Beaches Greater Sydney* income per week
74%
22%
4%
73%
22%
5%
0%
10%
20%
30%
40%
50%
60%
70%
80%
Family households Lone person households Group households
Northern Beaches Greater Sydney
Household structure 2021 Household income quartiles 2016
21
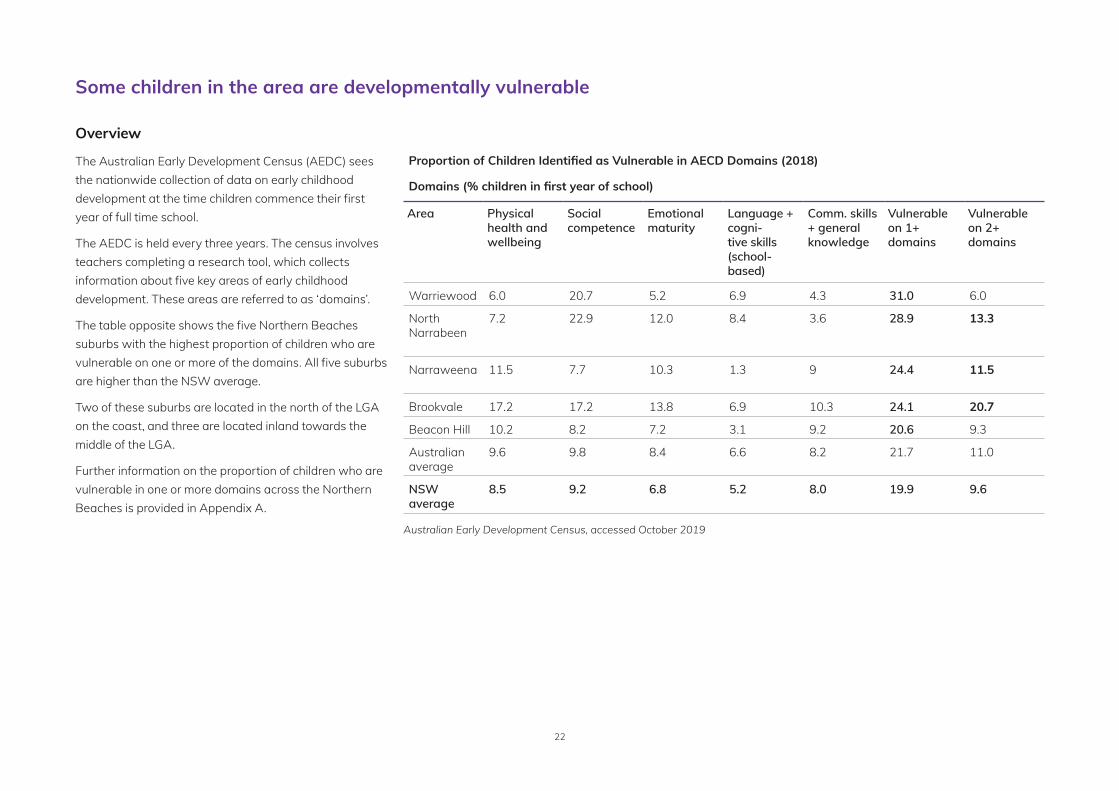
Some children in the area are developmentally vulnerable
Overview
The Australian Early Development Census (AEDC) sees the nationwide collection of data on early childhood development at the time children commence their first year of full time school.
The AEDC is held every three years. The census involves teachers completing a research tool, which collects information about five key areas of early childhood development. These areas are referred to as ‘domains’.
The table opposite shows the five Northern Beaches suburbs with the highest proportion of children who are vulnerable on one or more of the domains. All five suburbs are higher than the NSW average.
Two of these suburbs are located in the north of the LGA on the coast, and three are located inland towards the middle of the LGA.
Further information on the proportion of children who are vulnerable in one or more domains across the Northern Beaches is provided in Appendix A.
Proportion of Children Identified as Vulnerable in AECD Domains (2018)
Domains (% children in first year of school)
Area Physical health and wellbeing
Social competence
Emotional maturity
Language + cogni-tive skills (school-based)
Comm. skills + general knowledge
Vulnerable on 1+ domains
Vulnerable on 2+ domains
Warriewood 6.0 20.7 5.2 6.9 4.3 31.0 6.0
North Narrabeen
7.2 22.9 12.0 8.4 3.6 28.9 13.3
Narraweena 11.5 7.7 10.3 1.3 9 24.4 11.5
Brookvale 17.2 17.2 13.8 6.9 10.3 24.1 20.7
Beacon Hill 10.2 8.2 7.2 3.1 9.2 20.6 9.3
Australian average
9.6 9.8 8.4 6.6 8.2 21.7 11.0
NSW average
8.5 9.2 6.8 5.2 8.0 19.9 9.6
Australian Early Development Census, accessed October 2019
22

Pre-school attendance and diversity
Pre-school attendance
Children with disability
Cultural diversity
As at 2016, there were 5,263 children attending pre-school on the Northern Beaches which was 2% of the total population. This was slightly higher than the Greater Sydney average (1.7%).
There were 6,587 children aged 3-4 years on the Northern Beaches in 2016 and therefore a 79% participation rate in pre-school. This is lower than the OECD average of 89% in 2017 and similar to the NSW average of 79% - 81% in 2015 – 2017.
The increasing number of children aged 0-4 years between 2021 and 2041 will result in a greater demand for children’s services. There is also an opportunity to increase enrolment rates of children aged 3-4 years old in pre-school to meet or exceed the OECD average.
Further information on the proportion of children who attend pre-school programs across the Northern Beaches is provided in Appendix A.
400 children aged 0-9 years on the Northern Beaches currently require assistance due to disability, representing 1.3% of all children in this age group.
Australian Bureau of Statistics, 2016 Census and OECD 2019
In 2016, the Northern Beaches had a lower level of cultural diversity compared to Greater Sydney. 0.6% of the Northern Beaches population were Aboriginal and/ or Torres Strait Islander, compared to 1.5% in Greater Sydney.
There were fewer people born overseas on the Northern Beaches compared to Greater Sydney (28.8% and 36.7% respectively). The top three overseas countries of birth were the United Kingdom (9.1%), New Zealand (2.4%) and China (1.4%).
On the Northern Beaches, one in five people speak a language other than English at home, compared to one in three in Greater Sydney. The top three languages other than English spoken in the area were Italian (1.3%), Mandarin (1.3%) and Portuguese (1.0%).
Australian Bureau of Statistics, 2016 Census
Language spoken at home 2016
19%
38%
80%
58%
0% 20% 40% 60% 80% 100%
Northern Beaches
Greater Sydney
Non-English speaking English speaking
23

Existing services are concentrated in the south
Number of places
There is a total of 14,027 approved places at all existing children’s services on the Northern Beaches.
For some facilities, the approved number of places provide multiple services (i.e. long day care and before and after school care).
The table opposite shows the suburbs with the largest number of approved places. This shows that Brookvale, Frenchs Forest, Freshwater, Dee Why and Warriewood have 33% of the total number of places available on the Northern Beaches.
Brookvale and Frenchs Forest have the most centres and approved places for long day care, pre-school, before and after school care, and vacation care.
Freshwater only has seven facilities, however has 780 places available. This is due to Harbord OOSH Centre which provides 350 approved places for before and after school and vacation care.
Further information on the number of places of long day care across the Northern Beaches is provided in Appendix A.
Suburbs with the highest number of approved places
Suburb Number of centres Number of places
Brookvale 16 1,361
Frenchs Forest 12 1,018
Freshwater 7 780
Dee Why 10 779
Warriewood 9 716
Suburbs with the lowest number of approved places
Suburb Number of centres Number of places
Palm Beach – Whale Beach 1 29
Wheeler Heights 1 48
North Manly 2 47
Avalon Beach - Clareville 3 92
Bilgola – B. Plateau 2 116
Australian Children’s Education and Care Quality Authority, 2019
24
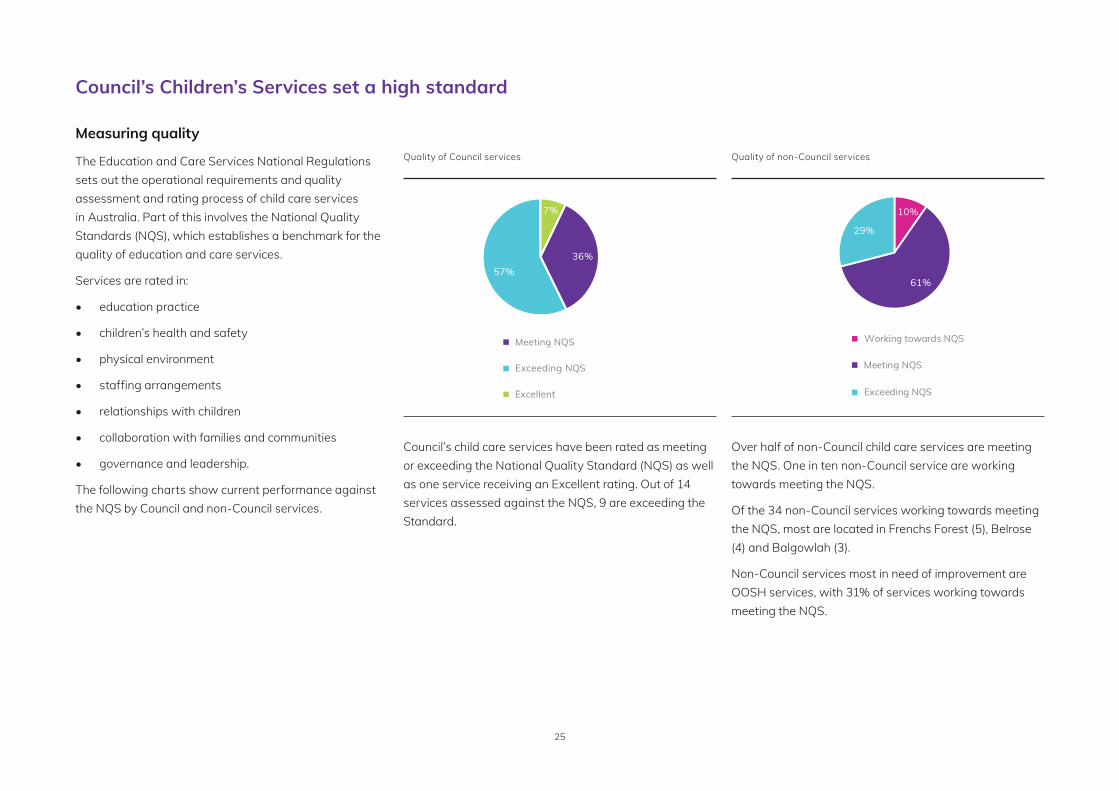
Council’s Children’s Services set a high standard
Measuring quality
The Education and Care Services National Regulations sets out the operational requirements and quality assessment and rating process of child care services in Australia. Part of this involves the National Quality Standards (NQS), which establishes a benchmark for the quality of education and care services.
Services are rated in:
• education practice
• children’s health and safety
• physical environment
• staffing arrangements
• relationships with children
• collaboration with families and communities
• governance and leadership.
The following charts show current performance against the NQS by Council and non-Council services.
Quality of Council services Quality of non-Council services
Council’s child care services have been rated as meeting or exceeding the National Quality Standard (NQS) as well as one service receiving an Excellent rating. Out of 14 services assessed against the NQS, 9 are exceeding the Standard.
Over half of non-Council child care services are meeting the NQS. One in ten non-Council service are working towards meeting the NQS.
Of the 34 non-Council services working towards meeting the NQS, most are located in Frenchs Forest (5), Belrose (4) and Balgowlah (3).
Non-Council services most in need of improvement are OOSH services, with 31% of services working towards meeting the NQS.
Exceeding NQS
Excellent
Meeting NQS
57%
7%
36%
10%
61%
29%
Exceeding NQS
Working towards NQS
Meeting NQS
25

“The ability (for Council educators) to identify specific children’s needs is so much more superior”- Stakeholder
“Good quality educators are not swayed by money or the parent body and they are able to stay strong with their planned programming.”- Focus group participant
There are many strengths on which to build
Community and key informant stakeholders participated in interviews, focus groups and surveys to provide their perspectives on the existing strengths of all children’s services on the Northern Beaches – including Council, private and not-for profit. The identified strengths are shown below.
Community-reported strengths of children’s services on the Northern Beaches
Affordable and high quality
Majority of the stakeholders and the community reflected on the importance of Council offering affordable services that do not compromise on quality of programs or staff. It was also noted that Council educators have a superior ability to cater for children with special needs.
Achieving quality standards
Some stakeholders noted that most children’s services (Council, private and not-for-profit) are achieving or above achieving on the NQS ratings.
Staff engagementMajority of the stakeholders and the community noted that a major strength of Council operated Children’s Services is the availability of well trained staff who are highly engaged with children in their care which is considered highly important for parents.
Accessible locations Majority of the community reflected that the main strength of all children’s services on the Northern Beaches is that they have close proximity to home.
Community values Some of the community reflected that a key strength of Council operated Children’s Services is the embedding of community values in the everyday learning experience for children accessing the services.
26

“One of the biggest challenges is for children in the community who have needs and are in long-day care centres who need therapy support”. - Stakeholder
The big centres offer no say, no philosophy and no autonomy”- Focus group participant
Some gaps, needs and priorities to be addressed
Community and key informant stakeholders were asked to reflect on the challenges relating to all children’s services on the Northern Beaches LGA. The following key themes were identified.
Community-reported challenges of children’s services on the Northern Beaches
Undersupply
Some of the community felt that there is an undersupply of Council operated Children’s Services across the Northern Beaches. One stakeholder felt as though there was an oversupply of all children’s services in the Northern Beaches. With the exception of the upper northern suburbs.
Waitlist barriers
Some community members reflected that there are extensive waiting lists for each of Council’s Children’s Services, with no ability to be placed on a combined list. Mid-year allocations were noted as more difficult at Council operated services which presents a challenge for parents to plan when they go back to work.
Complex role of councilOne stakeholder and some community members reflected that Council has three key and complex roles – providers of children’s services, approvers of new children’s services and leaders in the sector development space to increase quality and professional development for all children’s services.
Affordability The affordability of private sector children’s services is a major challenge noted by most of the community and stakeholders. In many cases, this is an influencing factor in choosing a Council run service, especially for families with lower socio-economic status and/or children with special needs.
Lack of council control
One stakeholder reflected that due to changes to the SEPP for Educational Establishments and Child Care Facilities, councils have less control over approvals for private children’s services. This can result in oversupply in some locations and undersupply in others, creating uneven distribution across the LGA.
27

11%
12%
10%
23%
20%
24%
Costs, proximity to home and programs influence choice
Community and key informant stakeholders were asked to provide their perspectives on what factors they consider when choosing a children’s service. The following key factors were identified.
Responses to survey question - What factors did you consider when choosing a provider?
In percent:
Community-reported factors influencing choice
Cost Majority of the community and stakeholders strongly believe that cost is an influencing factor when choosing any children’s service.
Proximity to homeMajority of the community and stakeholders reflected on the need for all children’s services to be located in very close proximity to home or on the direct transport route to place of work or primary school drop-off for older children in the family.
No frills child care
Some community members perceived Council-run Children’s Services as providing a ‘no frills’ approach. In contrast, some private sector children’s services are perceived as looking ‘too perfect’ creating an impression that children would be limited to play and learn in an organic environment.
Flexibility
Some community members placed emphasis on the importance of flexibility offered at children’s services e.g. flexibility in hours, days of the week that parents need care, and options to vary days during school holidays are important factors when choosing any children’s service.
Community focused
Community and stakeholders reflected on the importance for children’s services to cater for the needs of families in the community such as accommodating CALD communities and children with special needs. They noted that many parents chose Council’s services because of the holistic community feel and approach.
“We (parents) are having too much say on programs that are academic rather than organic, natural play… (new child care services) are ‘Instagram kindies’… too clean, neat and shiny.”- Focus group participant
Cost
Programs
Proximity to home
Reputation
Physical play space
Quality of equipment and resource
28

Some challenges to be addressed
Community and key informant stakeholders were asked to provide their perspectives on the current gaps, needs and future priorities for children’s services on the Northern Beaches. The following key gaps, needs and priorities were identified.
Community-reported gaps, needs and priorities for children’s services
More vacation care and long day care
Some of the community reported that there is a need for more vacation care and long day care services on the Northern Beaches. It was also noted that there is greater need for services that cater for children aged 0 – 2 years.
More services on the upper Northern Beaches
Majority of the community and stakeholders have identified the need for more children’s services in Balgowlah and Manly and the upper Northern Beaches.
Flexible service deliveryMajority of the community and stakeholders reflected on the need to provide more flexible options at all children’s services to cater for families with differ-ent needs which can vary throughout the year.
Sector improvement
Some of the community and stakeholders expect Council to be a leader in delivering best-practice approaches to children’s services. Council could con-sider working with private and not-for-profit operators to facilitate continual sector improvements.
Innovative programs
A small portion of the community and stakeholders identified opportunities for innovation in the delivery of Council Children’s Services such as combined child care and aged care programs, co-locating pre-schools with primary schools and including a therapy specialist for children with special needs.
Community surveys identified service gaps in Balgowlah and Manly and in the upper Northern Beaches – particularly Mona Vale, Palm Beach and Church Point.
29
Australian Bureau of Statistics (2016)
Australian Children’s Education & Care Quality Authority (ACECQA), The Guide to the National Quality Framework: Section 7 – Glossary, Australia, 2018.
Australian Early Development Census (webpage), retrieved from http://www.aedc.org.gov.au
Australian Government, National report: National Partnership Agreement on Universal Access to Early Childhood Education – 2013-2013, 2017(a).
Australian Government, National report: National Partnership Agreement on Universal Access to Early Childhood Education – 2015, 2017(b).
Australian Institute of Health and Welfare Literature review of the impact of early childhood education and care on learning and development , 2017.
Early Childhood Australia, State of Early Learning in Australia 2019, Canberra, 2019.
Forecast i.d., Northern Beaches Council (webpage), retrieved from https://forecast.id.com.au/northern-beaches, 2021.
Northern Beaches Council, Child care (webpage), retrieved from https://www.northernbeaches.nsw.gov.au/services/children/child care.
Organisation for Economic Co-operation and Development (OECD), Education at a glance 2019, France, 2019.
References and data sources
References
William Teager, Stacey Fox and Neil Stafford, How Australia can invest early and return more: A new look at the $15b cost and opportunity. Early Intervention Foundation, The Front Project and CoLab at the Telethon Kids Institute, Australia, 2019.
Community engagement
Children’s Services Customer Satisfaction Survey (n=315)
Focus groups with community members (n=8)
Intercept surveys with families not using Council Children’s Services (n=29)
Telephone interview with a private children’s services provider (n=1)
Telephone interview with a children’s service run by another council (n=1)
Telephone interview with an organisation supporting children with additional needs (n=1)
30

Appendix A: Key metrics
31

The table on the following pages shows key metrics for children across the Northern Beaches, as well as for the provision of long day care. The information shown at (5) includes children accessing early learning programs through long day care and preschools.
Metrics shown in bold for (3) show where there is more than 3.0 children for every one place of long day care available, which is often used as a benchmark for acceptable provision. Metrics shown in bold for (4) and (5) are higher than the NSW average.
Data sources:
1. Australian Bureau of Statistics (2016 data)
2. Australian Children’s Education & Care Quality Authority (2019 data)
3. Calculated using (1) and (2)
4. Australian Early Development Census (2018 data)
5. Australian Early Development Census (2018 data)
Notes for this page:
• Data for Balgowlah Heights and Clontarf at (4) and (5) has been averaged (*).
Suburb (1) No. children aged 0-4
(2) No. long day care places
(3) No. children 0-4 for every long day care place
(4) % children aged 0-4 developmentally vulnerable in one more domains
(5) Children who attended a pre-school program (%)
Allambie Heights 469 107 4.38 10.3 90.8
Avalon Beach - Clareville 561 104 5.39 9.3 96.2
Balgowlah 615 342 1.80 7.0 97.5
Balgowlah Heights - Clontarf 266 24 11.08 *7.7 *94.7
Bayview 113 0 20+ 16.1 90.3
NSW average - - - 19.9 83.4
32

Suburb (1) No. children aged 0-4
(2) No. long day care places
(3) No. children 0-4 for every long day care place
(4) % children aged 0-4 developmentally vulnerable in one more domains
(5) Children who attended a pre-school program (%)
Beacon Hill 456 40 11.40 20.6 86.3
Belrose – Oxford Falls 453 323 1.40 9.2 94.6
Bilgola 206 56 3.68 15.9 95.7
Brookvale 228 1,361 0.17 24.1 86.2
Church Point 55 20 2.75 Not available Not available
Collaroy 445 0 20+ 14.0 92.8
Collaroy Plateau 307 107 2.87 Not available Not available
Cromer 465 259 1.80 12.5 93.1
Curl Curl – North Curl Curl 395 0 20+ *6.1 *76.4
Davidson 147 0 20+ 15.9 88.6
Dee Why 1,569 525 2.99 21.0 79.5
NSW average - - - 19.9 83.4
Notes for this page:
• The suburb information for Church Point also includes Scotland Island and Ku-ring-gai Chase.
• Data for Curl Curl and North Curl Curl at (4) and (5) has been averaged (*).
33

Suburb (1) No. children aged 0-4
(2) No. long day care places
(3) No. children 0-4 for every long day care place
(4) % children aged 0-4 developmentally vulnerable in one more domains
(5) Children who attended a pre-school program (%)
Elanora Heights 298 90 3.31 15.1 91.0
Fairlight 415 254 1.63 4.2 98.6
Forestville 461 91 5.07 12.7 95.9
Frenchs Forest 895 778 1.15 8.8 91.8
Freshwater 669 370 1.81 Not available Not available
Killarney Heights 197 109 1.81 8.6 90.3
Manly 857 89 9.63 7.0 90.5
Manly Vale 495 180 2.75 13.0 93.9
Mona Vale 563 407 1.38 9.7 95.7
Narrabean 493 187 2.64 9.5 93.8
Narraweena 368 172 2.14 24.4 85.9
Newport 508 40 12.70 8.8 90.6
North Balgowlah 295 0 20+ 14.4 98.9
NSW average - - - 19.9 83.4
34

Suburb (1) No. children aged 0-4
(2) No. long day care places
(3) No. children 0-4 for every long day care place
(4) % children aged 0-4 developmentally vulnerable in one more domains
(5) Children who attended a pre-school program (%)
North Manly 207 47 4.40 14.6 92.7
North Narrabeen 444 0 20+ 28.9 94.0
Palm Beach – Whale Beach 74 0 20+ Not available Not available
Seaforth 478 395 1.21 10.5 96.9
Terrey Hills – Duffys Forrest 191 361 0.53 9.3 95.3
Warriewood - Ingleside 594 566 1.05 31.0 92.4
Wheeler Heights 197 48 4.10 Not available Not available
NSW average - - - 19.9 83.4
35