Children and Young People PERFORMA NACE REPORT 2015-16 · Children and Young People NACE REPORT...
17
www.gwynedd.gov.wales/performance 1 GWYNEDD PERFORMANACE REPORT 2015-16 Children and Young People Ref. Description 2013/14 2014/15 2015/16 Trend Wales (2015/16) Family (2015/16) Performance against Wales Adn28 Percentage of empty places within the schools of the county 28 26 25 Improve - - - CSP3 Percentage of the progress made by families following the intervention of the Team Around the Family, Gyda’n Gilydd Team 15 30.8 25.3 Worsen - - - Comment The percentage of progress has reduced, because the nature of the families with which we work has become far more complex and at a higher level in the care continuum. Fewer cases which require early intervention are dealt with; cases that have been a cause for concern for a number of agencies for a number of years are dealt with more. DANS08 Percentage of pupils aged 16 who achieve the Level 2 Threshold (5 A* – C Grades) or equivalent 81.55 87.7 88.9 Improve - - - DGD17 Percentage of young people 16-18 not in education, work or training 3 1.7 1.8 Worsen - - - Comment The Welsh Government's official figures for the NEET group in Gwynedd for 2015 is 1.8%, a total of 24 young people. This is being addressed in the Council's strategic plan.
Transcript of Children and Young People PERFORMA NACE REPORT 2015-16 · Children and Young People NACE REPORT...

www.gwynedd.gov.wales/performance 1
GWYNEDD PERFORMANACE REPORT 2015-16 Children and Young People
Ref. Description 2013/14 2014/15 2015/16 Trend Wales (2015/16)
Family (2015/16)
Performance
against Wales
Adn28 Percentage of empty places within the schools of the
county 28 26 25 Improve - - -
CSP3
Percentage of the progress made by families
following the intervention of the Team Around
the Family, Gyda’n Gilydd Team
15 30.8 25.3 Worsen - - -
Comment
The percentage of progress has reduced, because the nature of the families with which we work has become far more complex and at a higher level in
the care continuum. Fewer cases which require early intervention are dealt with; cases that have been a cause for concern for a number of agencies for
a number of years are dealt with more.
DANS08 Percentage of pupils aged 16 who achieve the Level 2
Threshold (5 A* – C Grades) or equivalent 81.55 87.7 88.9 Improve - - -
DGD17 Percentage of young people 16-18 not in education,
work or training 3 1.7 1.8 Worsen - - -
Comment
The Welsh Government's official figures for the NEET group in Gwynedd for 2015 is 1.8%, a total of 24 young people. This is being addressed in the
Council's strategic plan.

www.gwynedd.gov.wales/performance 2
GWYNEDD PERFORMANACE REPORT 2015-16 Children and Young People
Ref. Description 2013/14 2014/15 2015/16 Trend Wales (2015/16)
Family (2015/16)
Performance
against Wales
EDU/008aN The number of permanent exclusions in primary
schools during the academic year 0 0 3 Worsen - - -
Comment
For the first time, pupils from Gwynedd primary schools have been permanently excluded. One of the specific projects of the strategy to change the
field of Additional Learning Needs is to put new arrangements in place for the behaviour maintenance provision.
EDU/008bN The number of pupils permanent excluded in
secondary schools during the academic year 4 4 3 Improve - - -
EDU/016a Percentage of pupil attendance in primary schools
during the academic year 94.3 95.1 95.0 Worsen 95.0 94.7 Equal
Comment
During the 2014/15 academic year, pupil attendance within the primary sector decreased by 0.1% to 95%. Nationally, the figure increased by 0.1% to
94.9%. Attendance in Gwynedd's primary schools fell from the 5th position in 2013/14 to the joint 8th position in Wales. Eight schools were in the
lowest quartile for three successive years with these schools are being targeted in order to improve their attendance. 15 schools have succeeded in
remaining in the first quartile over three successive years. In 2014/15, 26 schools succeeded in reaching the highest quartile.
EDU/016b Percentage of pupil attendance in secondary schools
during the academic year 93.6 94.2 94.6 Improve 93.9 93.5 Better

www.gwynedd.gov.wales/performance 3
GWYNEDD PERFORMANACE REPORT 2015-16 Children and Young People
Ref. Description 2013/14 2014/15 2015/16 Trend Wales (2015/16)
Family (2015/16)
Performance
against Wales
SCC/021
The percentage of looked after children
reviews carried out within statutory timescales
during the year
94.3 93.8 91 Worsen - - -
Comment
The Independent Review Officers have succeeded in holding 599 reviews in 2015/16. From these 544 have been completed within the statutory
timetable. By comparing this to 2014/15 where 544 of reviews were undertaken with 510 on time, the officers have succeeded in responding to demand
where there was a 10% increase in the number of reviews due during the year. This corresponds with the increase of 7% there has been in the numbers
of children looked after since March 2015, with 207 children looked after on 31 March 2016.
SCC/025
The percentage of statutory visits to looked after
children due in the year that took place in accordance
with regulations
83.7 89 86.9 Worsen 88.1 88.0 Worse
Comment
There is an increase of 14% in the number of statutory reviews that have been undertaken over the last three years with 1852 of reviews were
completed in 2015/16 and 1619 were completed in 2013/14. While performance has decreased somewhat in 2015/16, the demand for statutory visits
continues to increase. During 2015/16 42% of the children that came into the Councils care were located at home with parents or family. These
children are given weekly visits compared to 6 week visits for children in other placements.
SCC/039
The percentage of health assessments for looked
after children due in the year that have been
undertaken
35.8 50.6 60 Improve - - -

www.gwynedd.gov.wales/performance 4
GWYNEDD PERFORMANACE REPORT 2015-16 Children and Young People
Ref. Description 2013/14 2014/15 2015/16 Trend Wales (2015/16)
Family (2015/16)
Performance
against Wales
SCC/041b
The percentage of eligible, relevant and former
relevant children that have pathway plans as
required
100 100 100 Maintain - - -
National Strategic Indicators
Ref. Description 2013/14 2014/15 2015/16 Trend Wales (2015/16)
Family (2015/16)
Performance
against
Wales
EDU/002i
The percentage of Pupils in local authority care,
in any local authority maintained school, aged 15 as at
the preceding 31 August that leave compulsory
education, training or work based learning without an
approved external qualification
0.0 0.1 0.2 Worsen 0.2 0.1 Equal
Comment
The number of pupils that leave full-time education without a qualification that do not continue in education or training has increased from 1 to 2
pupils.
EDU/002ii
The percentage of Pupils in local authority care, in any
local authority maintained school, aged 15 as at the
preceding 31 August that leave compulsory education, training or work based learning without an approved
external qualification
6.3 0.0 0.0 Maintain 0.5 0.0 Better

www.gwynedd.gov.wales/performance 5
GWYNEDD PERFORMANACE REPORT 2015-16 Children and Young People
Ref. Description 2013/14 2014/15 2015/16 Trend Wales (2015/16)
Family (2015/16)
Performance
against Wales
EDU/003
The percentage of pupils assessed at the end of Key
Stage 2, in schools maintained by the local authority,
achieving the Core Subject Indicator, as determined
by Teacher Assessment
86.6 86 89.5 Improve 88.1 89.2 Better
EDU/006ii
The percentage of pupils assessed, in schools
maintained by the local authority, receiving a Teacher
Assessment in Welsh (first language) at the end of
Key Stage 3
82.5 81.2 83.2 Improve 17.8 35.3 Better
EDU/011
The average point score for pupils aged 15 at the
preceding 31 August, in schools maintained by the
local authority
578.2 616 617.2 Improve 538.6 523.0 Better
EDU/015
(a)
The percentage of final statements of special
education need issued within 26 weeks Including
exceptions
43.1 57.4 42.4 Worsen 68.1 60.4 Worse
Comment
The performance of Gwynedd and Anglesey Council continues to be low in the Special Educational Needs area, which is associated with capacity
issues in the health service to assess young people in Ysbyty Gwynedd. Following a local strategic review within the Additional Educational Needs field
and a legal change on a national level, we foresee a significant change to the existing procedure that will allow us to respond sooner to the needs of
pupils within a less bureaucratic regime. The new regime will not be reliant on a prompt response by the health service.
EDU/015
(b)
The percentage of final statements of special
education need issued within 26 weeks not excluding
exceptions
96.3 100 100 Maintain 94.5 95.7 Better

www.gwynedd.gov.wales/performance 6
GWYNEDD PERFORMANACE REPORT 2015-16 Children and Young People
Ref. Description 2013/14 2014/15 2015/16 Trend Wales (2015/16)
Family (2015/16)
Performance
against Wales
EDU/017
The percentage of pupils aged 15 at the preceding 31
August, in schools maintained by the local authority
who achieved the Level 2 threshold including a GCSE
grade A*-C in English or Welsh first language and
mathematics
58 61.1 63.3 Improve 58.3 59.9 Better
LCS/002b Number of visits to leisure and sports centres
during the year per 1,000 of the population 12906 13790 10278 Worsen 8409 8152 Better
Comment
Gwynedd's performance remains good on a national level, even when considering the reduction in the number of visits to leisure centres following the
transfer of Harlech swimming pool to the community and Bangor being closed for six months to renovate the centre.
SCC/002
The percentage of children looked after at 31 March
who have experienced one or more changes of
school, during a period or periods of being looked
after, which were not due to transitional
arrangements, in the 12 months to 31 March
22.8 18.7 18.1 Improve 11.9 12.3 Worse
SCC/004
The percentage of children looked after on 31 March
who have had three or more placements during the
year
4.9 6.2 7.7 Worsen 9.8 9.9 Better
Comment
Performance is within the target. 16 children were in at least three locations during the year.
SCC/011b
The percentage of initial assessments that were
completed during the year where there is evidence
that the child has been seen alone by the Social
Worker
47.2 50.6 59.1 Improve 49.5 60.9 Better

www.gwynedd.gov.wales/performance 7
GWYNEDD PERFORMANACE REPORT 2015-16 Children and Young People
Ref. Description 2013/14 2014/15 2015/16 Trend Wales (2015/16)
Family (2015/16)
Performance
against Wales
SCC/033d
The percentage of young people formerly looked
after with whom the authority is in contact at the age
of 19
100 85 80 Worsen 93.2 91.3 Worse
Comment
A small cohort in 2015/16 with 20 of young people receiving after-care and having their 19th birthday during the year. Four young people have refused
to keep in touch with the service within the specific time even though every effort has been made by social workers.
SCC/033e
The Percentage of young people formerly looked
after with whom the authority is in contact, who are
known to be in suitable, non-emergency
accommodation at the age of 19
86.7 88.2 93.8 Improve 93.5 93.9 Better
SCC/033f
The percentage of young people formerly looked
after and the authority is in contact with them, and
know that they receive education, training or are
employed at the age of 19
66.7 52.9 75 Improve 60.7 65.2 Better
SCC/037
The average external qualifications point score for 16
year old looked after children in any local authority
maintained learning setting
439 428 456 Improve 269 294.4 Better
SCC/041a The percentage of eligible, relevant and former
relevant children that have pathway plans as required 100 100 100 Maintain 93.5 98.0 Better

www.gwynedd.gov.wales/performance 8
GWYNEDD PERFORMANACE REPORT 2015-16 Safeguarding
Ref. Description 2013/14 2014/15 2015/16 Trend Wales (2015/16)
Family (2015/16)
Performance
against Wales
BUS07 Percentage of all Gwynedd staff will have received
training in Level 1 protection and safeguarding - -
Corporate
arrangements
being
established
- - - -
Diogelu2
The percentage of risk assessments presented to
Case Conferences which were considered to
illustrate quality in decision making
95 97 97 Maintain - - -
Diogelu7
Percentage of case conferences where the voice/the
child was heard (and excluding children under the age
of 7)
81 83 85 Improve - - -
PEN14
Percentage of all staff working directly with children,
young people and vulnerable adults with a current
Disclosure and Barring Service (DBS) check
- 100 100 Maintain - - -

www.gwynedd.gov.wales/performance 9
GWYNEDD PERFORMANACE REPORT 2015-16 Care
Ref. Description 2013/14 2014/15 2015/16 Trend Wales (2015/16)
Family (2015/16)
Performance
against Wales
OED03
Enablement - Percentage of cases that have received a
period of enablement who leave without a care
package
54 45 64 Improve - - -
SCA/002b
LLEOL
Rate of older people (65 or over) the authority
supports in care homes per 1,000 population ages 65
or over at 31 March – excluding self-funders
20.08 18.48 17.1 Improve - - -
National Strategic Indicators
Ref. Description 2013/14 2014/15 2015/16 Trend Wales (2015/16)
Family (2015/16)
Performance
against
Wales
PSR/002 The average number of calendar days taken to deliver
a Disabled Facilities Grant 242 316 271 Improve 241 226 Worse
SCA/001 The rate of delayed transfers of care for social care
reasons per 1,000 population aged 75 years or over 1.55 1.05 2.38 Worsen 4.87 4.1 Better
www.gwynedd.gov.wales/performance 10
GWYNEDD PERFORMANACE REPORT 2015-16 Care
Ref. Description 2013/14 2014/15 2015/16 Trend Wales (2015/16)
Family (2015/16)
Performance
against Wales
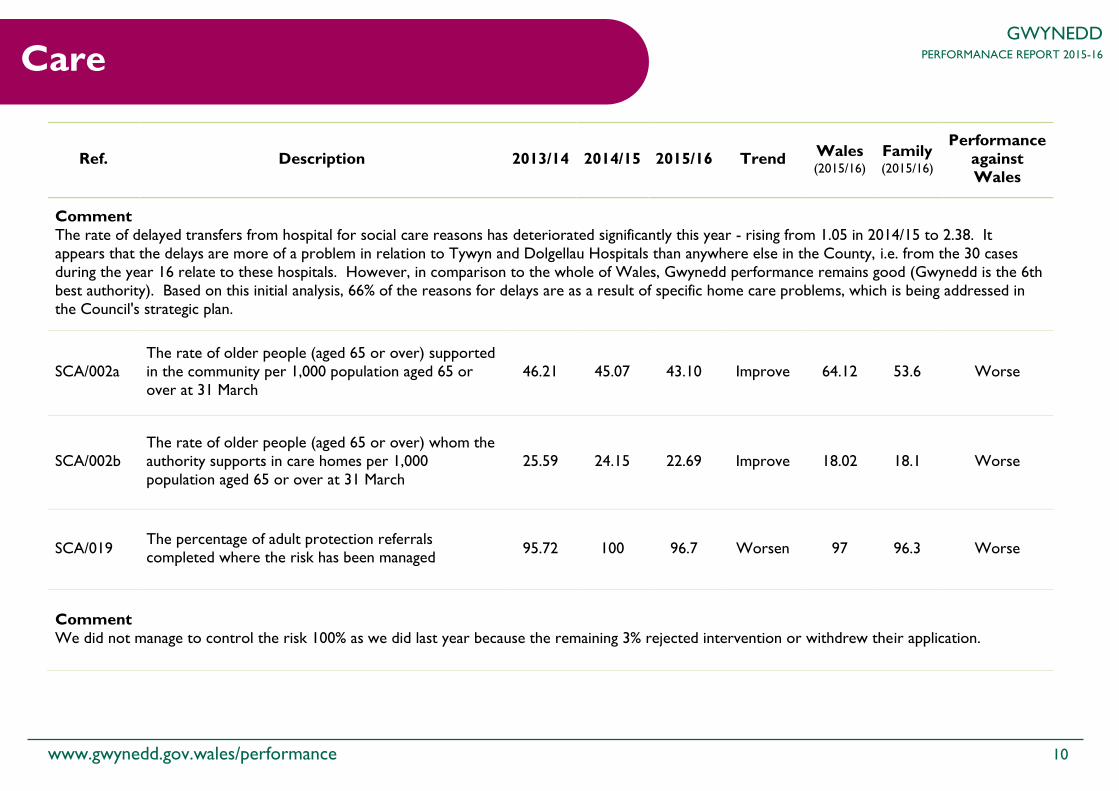
Comment
The rate of delayed transfers from hospital for social care reasons has deteriorated significantly this year - rising from 1.05 in 2014/15 to 2.38. It
appears that the delays are more of a problem in relation to Tywyn and Dolgellau Hospitals than anywhere else in the County, i.e. from the 30 cases
during the year 16 relate to these hospitals. However, in comparison to the whole of Wales, Gwynedd performance remains good (Gwynedd is the 6th
best authority). Based on this initial analysis, 66% of the reasons for delays are as a result of specific home care problems, which is being addressed in
the Council's strategic plan.
SCA/002a
The rate of older people (aged 65 or over) supported
in the community per 1,000 population aged 65 or
over at 31 March
46.21 45.07 43.10 Improve 64.12 53.6 Worse
SCA/002b
The rate of older people (aged 65 or over) whom the
authority supports in care homes per 1,000
population aged 65 or over at 31 March
25.59 24.15 22.69 Improve 18.02 18.1 Worse
SCA/019 The percentage of adult protection referrals completed where the risk has been managed
95.72 100 96.7 Worsen 97 96.3 Worse
Comment
We did not manage to control the risk 100% as we did last year because the remaining 3% rejected intervention or withdrew their application.

www.gwynedd.gov.wales/performance 11
GWYNEDD PERFORMANACE REPORT 2015-16 Poverty, Deprivation, Economy, Housing
Ref. Description 2013/14 2014/15 2015/16 Trend Wales (2015/16)
Family (2015/16)
Performance
against Wales
CAFF06d Percentage Council spending with local businesses 40.33 40.42 38 Worsen - - -
Comment
From the analysis of Council spending with local businesses, the reduction is mainly related to the fact that providers outside of Gwynedd have succeeded to
attain a high percentage of substantial projects in the building field. It can be seen that Wynne Construction (located in Denbighshire) has won the majority
of contracts building "21st Century Schools" and the only company from Gwynedd on the procurement framework has pulled out and therefore have excluded themselves from competing for work through the "21st Century Schools" project.
GD01 Number of communities (geographical/of interest)
using technology in a new/pioneering way - - 5 - - - -
GD02 Number of individuals have received assistance to
go on-line / internet use for personal gain - - 141 - - - -
HHA/008 Percentage of homeless referrals decided within 33
working days - 80.57
Has been
deleted
nationally - - - -
PENECON
1
Number of new jobs created with the support of
the Council 123.5 234.5 81 Worsen - - -
Comment
With a number of the principal programmes which supported job creation (such as the Local Investment Fund) now having come to an end, the number of
jobs created with direct assistance from the Council has reduced as expected; despite this, the result of 81 new jobs supported is substantial in the context
of the resources currently available.

www.gwynedd.gov.wales/performance 12
GWYNEDD PERFORMANACE REPORT 2015-16 Poverty, Deprivation, Economy, Housing
Ref. Description 2013/14 2014/15 2015/16 Trend Wales (2015/16)
Family (2015/16)
Performance
against Wales
PENECON
2
Number of businesses supported by the Gwynedd
Economic and Community department 92 67 28 Worsen - - -
Comment
The number of businesses supported has reduced because various grant packages which had been planned to support businesses have come to an end.
Strat6 Number of affordable units secured in Gwynedd 70 144 48 Worsen - - -
Comment
The performance is significantly lower compared with 2014/15 (48 compared with 144). We diverted money from the Social Housing Grant to develop
Hafod y Gest during 2015/16 and the number of units that are reported in 2014/15 includes 42 Cae Garnedd units, which therefore explains the substantial
variation from year to year.
TMGC4 Benefit to the local economy from supporting strategic and high-profile events
£4,666,662 £4,814,867 £5,928,034 Improve - - -
Uchel07 Number of high value jobs that have been created - 34 35 Improve - - -
YRE1
Number of County businesses reporting their use
of technology (e.business/e.commerce) as a result
of Digital Gwynedd’s intervention
- - 36 - - - -

www.gwynedd.gov.wales/performance 13
GWYNEDD PERFORMANACE REPORT 2015-16 Poverty, Deprivation, Economy, Housing
National Strategic Indicators
Ref. Description 2013/14 2014/15 2015/16 Trend Wales (2015/16)
Family (2015/16)
Performance
against
Wales
LCL/001
(b)
The number of visits to Public Libraries during the
year, per 1,000 population 5301 4199 4309 Improve 5374 5520 Worse
PLA/006
(b)
The number of additional affordable housing units
provided during the year as a percentage of all
additional housing units provided during the year
41 50 96 Improve 36 34 Better
PSR/004
The percentage of private sector dwellings that had
been vacant for more than 6 months at 1 April that
were returned to occupation during the year through
direct action by the local authority
5.24 5.70 5.13 Worsen 11.08 6.8 Worse
Comment
Although there is a slight dip in performance, the service has succeeded in reaching its ambition and has brought 61 empty houses back into use. The
service is trying to target and prioritise those empty houses which are located in places where there is demand for social housing.

www.gwynedd.gov.wales/performance 14
GWYNEDD PERFORMANACE REPORT 2015-16 The Welsh Language
Ref. Description 2013/14 2014/15 2015/16 Trend Wales (2015/16)
Family (2015/16)
Performance
against Wales
Iaith05 Percentage of primary schools that can demonstrate
increase in the children's social use of Welsh - - 75 - - - -
Iaith13
Percentage of secondary schools that have established
a baseline of young people's social use of Welsh Year
7
- - 100 - - - -
Iaith14
Percentage of public bodies that have adopted
Gwynedd and Anglesey standard definition of a
bilingual workplace
- -
Has been
deleted
because
of a
change in
direction
by the
project
- - - -

www.gwynedd.gov.wales/performance 15
GWYNEDD PERFORMANACE REPORT 2015-16 The Environment
Ref. Description 2013/14 2014/15 2015/16 Trend Wales (2015/16)
Family (2015/16)
Performance
against Wales
PAM9a
The percentage of food establishments that are in the
system, which achieve a score of 4/5 with food
hygiene standards
91 93 93 Maintain - - -
National Strategic Indicators
Ref. Description 2013/14 2014/15 2015/16 Trend Wales (2015/16)
Family (2015/16)
Performance
against
Wales
STS/006 The percentage of reported fly tipping incidents
cleared within 5 working days 97.67 96.53 96.28 Maintain 95.26 95.2 Better
THS/007 The percentage of adults aged 60 or over who hold a
concessionary bus pass 84.6 80.3 79.0 Worsen 85.6 77.3 Worse
Comment
The performance has deteriorated 1% since last year, because of a reduction of 148 in the number of adults over 60 years old that hold a bus pass on 1
April.
WMT/004
(b)
The percentage of municipal waste collected by local
authorities sent to landfill 45.88 44.09 34.33 Improve 18.14 19.5 Worse
WMT/009(b)
The percentage of municipal waste collected by local
authorities and prepared for reuse and/or recycled,
including source segregated biowastes that are
composted or treated biologically in another way
54.01 55.14 58.70 Improve 60.19 64.7 Worse

www.gwynedd.gov.wales/performance 16
GWYNEDD PERFORMANACE REPORT 2015-16 Efficient and Effective Council
Ref. Description 2013/14 2014/15 2015/16 Trend Wales (2015/16)
Family (2015/16)
Performance against Wales
CD6.01 Percentage of invoices paid within 30 days (across the
Council) 94 94 93 Worsen - - -
Comment
We have looked at the performance of this measure and have understood that the figures of some departments have an effect on the measure's
performance. The need to respond to this situation was discussed whilst holding the departments accountable for their performance. As a first step, the
Cabinet Member will raise the matter with the rest of the members. We will continue to keep an eye on the situation in order to decide if there needs to
be further action.
CHR/002
The number of working days/shifts per full-time
equivalent (FTE) local authority employee lost due to
sickness absence
8.2 8.62 8.44 Improve 10.19 9.96 Better
FfG01 The percentage of work units within the Council who
have received a "Ffordd Gwynedd" charter mark - -
The charter
mark
continues to
be developed
- - - -
FfG02
Percentage of measures established in pursuing the
Putting "Ffordd Gwynedd" Project To Work which
shows improvement
- -
Has been
deleted.
Not an
appropriate
measure for
the project
- - - -
www.gwynedd.gov.wales/performance 17
GWYNEDD PERFORMANACE REPORT 2015-16 Financial Planning
Ref. Description 2013/14 2014/15 2015/16 Trend Wales (2015/16)
Family (2015/16)
Performance
against Wales
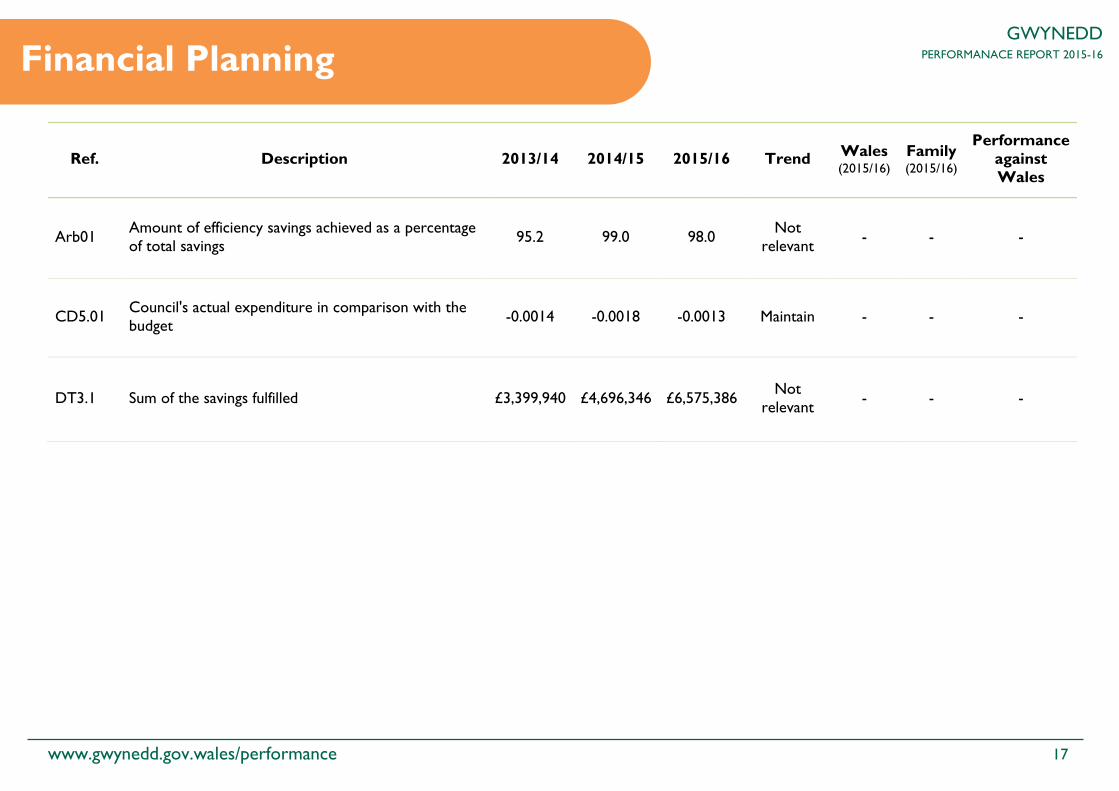
Arb01 Amount of efficiency savings achieved as a percentage
of total savings 95.2 99.0 98.0
Not
relevant - - -
CD5.01 Council's actual expenditure in comparison with the
budget -0.0014 -0.0018 -0.0013 Maintain - - -
DT3.1 Sum of the savings fulfilled £3,399,940 £4,696,346 £6,575,386 Not
relevant - - -