Childhood Poverty, Early Motherhood and Adult Social...
41
Childhood Poverty, Early Motherhood and Adult Social Exclusion John Hobcraft and Kathleen Kiernan Contents 1. Introduction ................................................................................................................... 1 2. Data Sources and Information Used .......................................................................... 1 3. Tabular analysis............................................................................................................. 5 4. Does age at motherhood affect adverse adult outcomes?..................................... 10 5. Consequences of early motherhood and childhood poverty ............................... 15 6 Summary ..................................................................................................................... 26 7. Conclusion.................................................................................................................... 35 References .............................................................................................................................. 36 CASEpaper Centre for Analysis of Social Exclusion CASE/28 London School of Economics July 1999 Houghton Street London WC2A 2AE CASE enquiries – tel: 020 7955 6679
Transcript of Childhood Poverty, Early Motherhood and Adult Social...
Childhood Poverty, Early Motherhood and AdultSocial Exclusion
John Hobcraft and Kathleen Kiernan
Contents1. Introduction ................................................................................................................... 12. Data Sources and Information Used .......................................................................... 13. Tabular analysis............................................................................................................. 54. Does age at motherhood affect adverse adult outcomes?..................................... 105. Consequences of early motherhood and childhood poverty ............................... 156 Summary ..................................................................................................................... 267. Conclusion.................................................................................................................... 35References.............................................................................................................................. 36
CASEpaper Centre for Analysis of Social ExclusionCASE/28 London School of EconomicsJuly 1999 Houghton Street
London WC2A 2AECASE enquiries – tel: 020 7955 6679
Centre for Analysis of Social Exclusion
The ESRC Research Centre for Analysis of Social Exclusion (CASE) wasestablished in October 1997 with funding from the Economic and SocialResearch Council. It is located within the Suntory and ToyotaInternational Centres for Economics and Related Disciplines (STICERD)at the London School of Economics and Political Science, and benefitsfrom support from STICERD. It is directed by Howard Glennerster, JohnHills, Kathleen Kiernan, Julian Le Grand, Anne Power and CarolPropper.
Our Discussion Paper series is available free of charge. We also producesummaries of our research in CASEbriefs, and reports from variousconferences and activities in CASEreports. To subscribe to theCASEpaper series, or for further information on the work of the Centreand our seminar series, please contact the Centre Administrator, JaneDickson, on:
Telephone: UK+20 7955 6679Fax: UK+20 7955 6951Email: [email protected] site: http://sticerd.lse.ac.uk/Case/
John HobcraftKathleen Kiernan
All rights reserved. Short sections of text, not to exceed two paragraphs,may be quoted without explicit permission provided that full credit,including notice, is given to the source.
Editorial Note
John Hobcraft is Professor of Population Studies in the Department ofSocial Policy, London School of Economics and Political Science, and aResearch Associate in the Centre for Analysis of Social Exclusion.Kathleen Kiernan is Reader in Social Policy and Demography in theDepartment of Social Policy, London School of Economics and PoliticalScience, and Co-Director of the Centre for Analysis of Social Exclusion.
Acknowledgements
We would like to thank Louise Dominian and Moira Wallace of theSocial Exclusion Unit for inspiring this research and the Department ofHealth for funding the project. The NCDS data used in this study weresupplied by the ESRC Data Archive at Essex University.
Abstract
Childhood poverty and early parenthood are both high on the politicalagenda. The key new issue addressed in this research is the relativeimportance of childhood poverty and of early motherhood as correlatesof outcomes later in life. How far are the ‘effects’ of early motherhood onlater outcomes due to childhood precursors, especially experience ofchildhood poverty? If there are powerful associations of both childhoodpoverty and early parenthood with later adult outcomes, there are anumber of subsidiary questions relating to the magnitude of theseassociations, the particular threshold levels of childhood poverty thatprove most critical, and whether it is, as often assumed, only teenagemothers who are subsequently disadvantaged, or also those who havetheir first birth in their early twenties? The source of data for this studyis the National Child Development Study.
We examine a range of outcomes at age 33 in a number of domainsrepresenting different aspects of adult social exclusion, including:welfare, socio-economic, physical health, and emotional well-being, aswell as demographic behaviour. We control for a wide range ofchildhood factors: poverty; social class of origin and of father; mother’sand father’s school leaving age; family structure; housing tenure;
mother’s and father’s interest in education; personality attributes;performance on educational tests; and contact with the police by age 16.
We show that there are clear associations for the adult outcomeswith age at first birth, even after controlling for childhood poverty and awide range of other childhood background factors. Moreover, wedemonstrate that the widest gulf in adult outcomes occurs for those whoenter motherhood early (before age 23), though further reinforced forteenage motherhood for most adult outcomes. We also show that it isany experience of childhood poverty that is most clearly associated withadverse outcomes in adulthood, with additional reinforcement forhigher levels of childhood poverty only being significant for a fewoutcomes. Becoming a mother before age 23 and any experience ofchildhood poverty are clear dividing points in differentiating risks ofadverse outcomes in later adulthood. Although the effects of childhoodpoverty are generally weaker, they nevertheless reinforce the effects ofage at first birth to generate sizeable odds ratios for the combination:early mothers who were poor sometime during childhood are over fourtimes as likely to have been a lone parent and to lack a telephone in theirhousehold; over three times as likely to live in social housing and tohave no qualifications; more than twice as likely to have had an extra-marital birth, be claiming non-universal benefits, to be cigarettesmokers, and to have high malaise scores.
1. Introduction
Childhood poverty and early parenthood are both high on the currentpolitical agenda (HM Treasury 1999; Social Exclusion Unit 1999). Thereis now a considerable body of evidence from British longitudinal studiesthat shows that poor girls and those from generally less advantageousbackgrounds are more likely to become teenage mothers (Kiernan 1980,1995, and 1997; Hobcraft 1998). There is also much evidence that thosewho become teenage mothers have less advantageous outcomes later inadult life (Kiernan 1980, and 1995); and that children with lessadvantaged backgrounds have poorer outcomes as adults (Wadsworth1991; Hobcraft 1998; Gregg et al 1999; CASE and HM Treasury 1999).
The key new issue that this research addresses is to try todisentangle the relative importance of childhood poverty and of earlymotherhood as correlates of outcomes later in life. How far are the‘effects’ of early motherhood on later outcomes due to childhoodprecursors, especially experience of childhood poverty? If there arepowerful associations of both childhood poverty and early parenthoodwith later adult outcomes, there are a number of subsidiary questionsrelating to the magnitude of these associations, the particular thresholdlevels of childhood poverty that prove most critical, and whether it is, asoften assumed, only teenage mothers who are subsequentlydisadvantaged, or also those who have their first birth in their earlytwenties?
2. Data Sources and Information Used
The source of data for this study is the National Child DevelopmentStudy (NCDS). The NCDS is a longitudinal study of children born in thefirst week in March 1958 for whom a great deal of information wascollected during childhood at ages 0, 7, 11, and 16 and information onexperiences adulthood has been collected on two occasions at ages 23and 33 (for further details see Ferri et al 1993).
2.1 Levels of childhood povertyThe poverty variable used in the analyses is a cumulative measure offive items drawn from waves one to three of NCDS, as used in an earlierstudy (Hobcraft 1998). At each of these waves it was reported whetherthe family was ‘in financial difficulties’. At age 7 this was one of a series
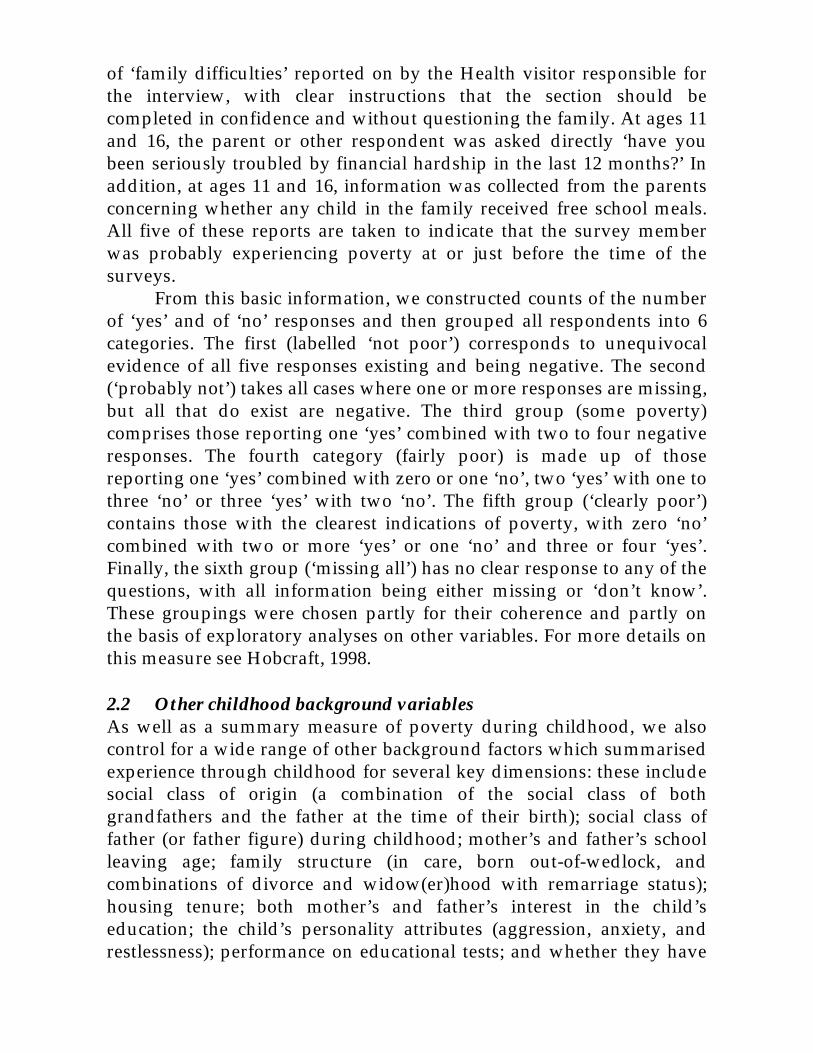
of ‘family difficulties’ reported on by the Health visitor responsible forthe interview, with clear instructions that the section should becompleted in confidence and without questioning the family. At ages 11and 16, the parent or other respondent was asked directly ‘have youbeen seriously troubled by financial hardship in the last 12 months?’ Inaddition, at ages 11 and 16, information was collected from the parentsconcerning whether any child in the family received free school meals.All five of these reports are taken to indicate that the survey memberwas probably experiencing poverty at or just before the time of thesurveys.
From this basic information, we constructed counts of the numberof ‘yes’ and of ‘no’ responses and then grouped all respondents into 6categories. The first (labelled ‘not poor’) corresponds to unequivocalevidence of all five responses existing and being negative. The second(‘probably not’) takes all cases where one or more responses are missing,but all that do exist are negative. The third group (some poverty)comprises those reporting one ‘yes’ combined with two to four negativeresponses. The fourth category (fairly poor) is made up of thosereporting one ‘yes’ combined with zero or one ‘no’, two ‘yes’ with one tothree ‘no’ or three ‘yes’ with two ‘no’. The fifth group (‘clearly poor’)contains those with the clearest indications of poverty, with zero ‘no’combined with two or more ‘yes’ or one ‘no’ and three or four ‘yes’.Finally, the sixth group (‘missing all’) has no clear response to any of thequestions, with all information being either missing or ‘don’t know’.These groupings were chosen partly for their coherence and partly onthe basis of exploratory analyses on other variables. For more details onthis measure see Hobcraft, 1998.
2.2 Other childhood background variablesAs well as a summary measure of poverty during childhood, we alsocontrol for a wide range of other background factors which summarisedexperience through childhood for several key dimensions: these includesocial class of origin (a combination of the social class of bothgrandfathers and the father at the time of their birth); social class offather (or father figure) during childhood; mother’s and father’s schoolleaving age; family structure (in care, born out-of-wedlock, andcombinations of divorce and widow(er)hood with remarriage status);housing tenure; both mother’s and father’s interest in the child’seducation; the child’s personality attributes (aggression, anxiety, andrestlessness); performance on educational tests; and whether they have

had been in contact with the police by age 16 (see Hobcraft, 1998 fordetails on the derivation of these variables) .
2.3 Age at first birthWe have adopted a simple classification of age at motherhood into thosewho became mothers as teenagers, when aged 20-22, aged 23-32, and,where relevant, those who had not had a first birth by age 33. Thesecategorisations were adopted after some exploratory work, whichsuggested that there was not enough information to support a furtherdivision of teenage mothers into those aged under 18 and 18-19; equally,there was little evidence that a further sub-division of the older mothers,into age groups 23-26 and 27-32, gave any additional explanatory powerto the models. Thus, we consider teenage mothers, early mothers (underage 23), later mothers (23-32), and a no birth by age 33 group.
2.4 Adult outcomesWe examine a range of outcomes at age 33 in a number of domainsrepresenting different aspects of adult social exclusion, including:welfare, socio-economic, physical health, and emotional well-being, aswell as demographic behaviour. The specific outcomes and thepercentages of women experiencing each outcome according to the ageat which they became mothers are shown in Table 1.
First, we examined two demographic factors: these were whetherthe woman had ever been a lone-mother by age 33 (19 per cent of allwomen) and whether her first child was born outside of marriage (12per cent of all women). These factors, unlike most of the other outcomemeasures, are not current status variables.
Welfare position was broadly assessed by whether the woman wasliving in social housing at age 33 (17 per cent of all women) and whethershe was in receipt of any non-universal state benefits at age 33 including:income support, family credit, housing benefit, unemployment benefitsand one parent family premium (21 per cent of all women).
The socio-economic characteristics considered are whether thewomen had not attained any qualifications by age 33 (14 per cent of thewomen had no qualifications) and whether or they were in the lowestquartile of the household income distribution at this age (26 per cent ofall women). We also included under this umbrella whether there was atelephone in the household: only 7 per cent of the women fell into thisgroup. Lack of a telephone could be viewed not only as a measure ofpoverty but also of social isolation.
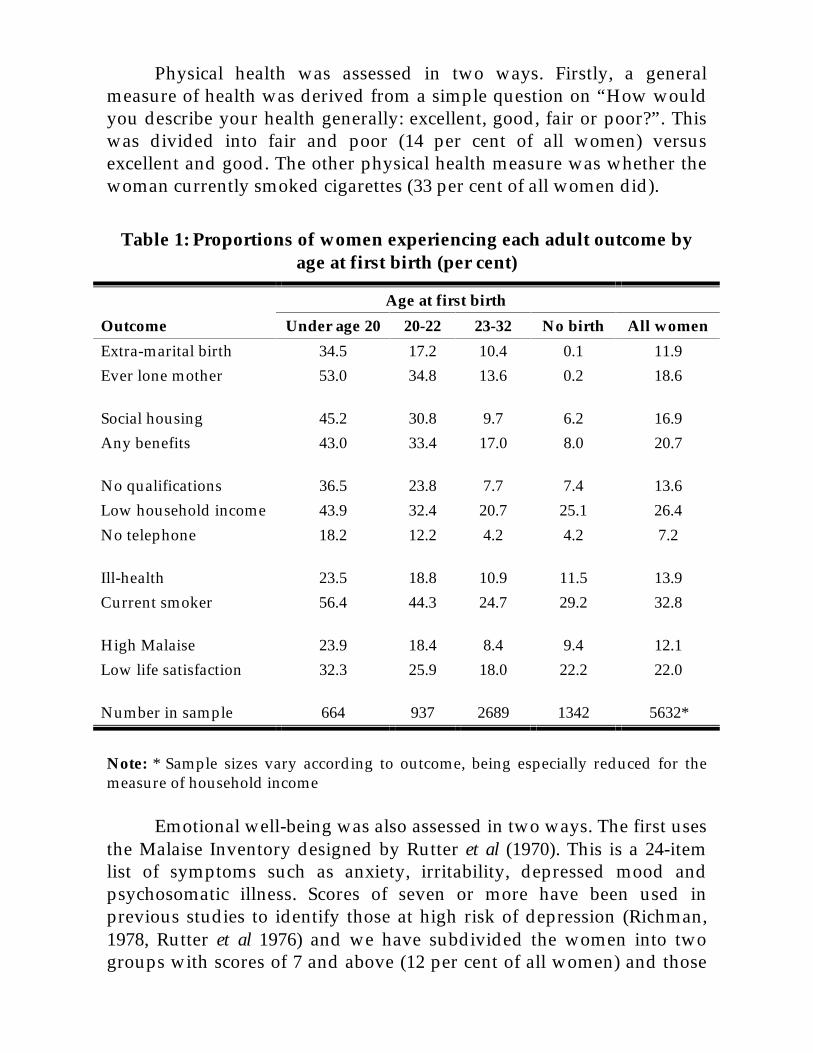
Physical health was assessed in two ways. Firstly, a generalmeasure of health was derived from a simple question on “How wouldyou describe your health generally: excellent, good, fair or poor?”. Thiswas divided into fair and poor (14 per cent of all women) versusexcellent and good. The other physical health measure was whether thewoman currently smoked cigarettes (33 per cent of all women did).
Table 1: Proportions of women experiencing each adult outcome byage at first birth (per cent)
Age at first birth
Outcome Under age 20 20-22 23-32 No birth All women
Extra-marital birth 34.5 17.2 10.4 0.1 11.9
Ever lone mother 53.0 34.8 13.6 0.2 18.6
Social housing 45.2 30.8 9.7 6.2 16.9
Any benefits 43.0 33.4 17.0 8.0 20.7
No qualifications 36.5 23.8 7.7 7.4 13.6
Low household income 43.9 32.4 20.7 25.1 26.4
No telephone 18.2 12.2 4.2 4.2 7.2
Ill-health 23.5 18.8 10.9 11.5 13.9
Current smoker 56.4 44.3 24.7 29.2 32.8
High Malaise 23.9 18.4 8.4 9.4 12.1
Low life satisfaction 32.3 25.9 18.0 22.2 22.0
Number in sample 664 937 2689 1342 5632*
Note: * Sample sizes vary according to outcome, being especially reduced for themeasure of household income
Emotional well-being was also assessed in two ways. The first usesthe Malaise Inventory designed by Rutter et al (1970). This is a 24-itemlist of symptoms such as anxiety, irritability, depressed mood andpsychosomatic illness. Scores of seven or more have been used inprevious studies to identify those at high risk of depression (Richman,1978, Rutter et al 1976) and we have subdivided the women into twogroups with scores of 7 and above (12 per cent of all women) and those
with lower scores. The second mental health measure came fromresponses on a scale from zero to 10 “to show how dissatisfied orsatisfied you are about the way your life has turned out so far” with 0representing completely dissatisfied and 10 completely satisfied. Justover 20 per cent of all women gave responses in the 0-6 range and werefer to this group as those dissatisfied with life.
3. Tabular analysis
3.1 Age at first birth and outcomesIt is apparent from Table 1 that women who became mothers in theirteens had the highest proportions with negative outcomes at age 33.Across all these domains teenage mothers were more likely than theirpeers to have these adverse adult experiences. Exploratory analysesshowed that the breakdown of age at motherhood used here capturesmost of the variation in the timing of motherhood with respect to lateroutcomes. Women who had their child after age 23 were similar in termsof experiencing these outcomes whether they became mothers earlier orlater in this age range. We see that across the age groups shown in Table1 there tends to be a gradient with age at motherhood, in that the soonerwomen become mothers the more likely are they to have experiencednegative outcomes.
3.2 Poverty in childhood and outcomesOur central concern is to try to discover the relative importance ofchildhood poverty and of early parenthood in relation to the range ofadult outcomes considered. As a background to the subsequentmultivariate analyses, we commence with an overview and broaddescription of the bivariate associations of childhood poverty and earlyparenthood with later outcomes.
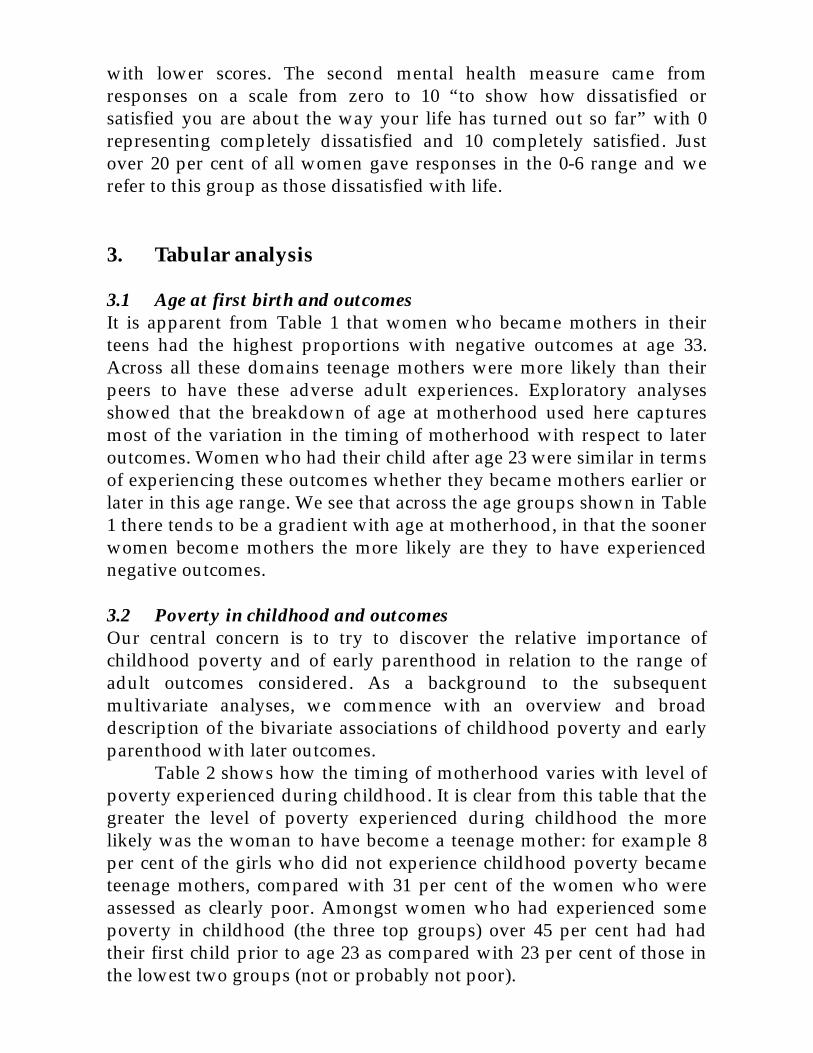
Table 2 shows how the timing of motherhood varies with level ofpoverty experienced during childhood. It is clear from this table that thegreater the level of poverty experienced during childhood the morelikely was the woman to have become a teenage mother: for example 8per cent of the girls who did not experience childhood poverty becameteenage mothers, compared with 31 per cent of the women who wereassessed as clearly poor. Amongst women who had experienced somepoverty in childhood (the three top groups) over 45 per cent had hadtheir first child prior to age 23 as compared with 23 per cent of those inthe lowest two groups (not or probably not poor).
Table 2: Percentage distribution of age at first birth amongst womenaccording to level of poverty in childhood
Poverty Underage 20
20-22years
23-32years
Nochild
Number in sample
Total=100%
Not poor 7.9 14.0 52.0 26.1 2252
Probably not poor 9.5 15.6 50.1 24.8 1955
Some poverty 18.1 21.8 40.1 20.0 639
Fairly poor 24.3 24.3 35.8 15.7 453
Clearly poor 31.0 23.9 34.8 10.3 184
Missing 12.8 14.8 38.3 34.2 149
3.3 Poverty, age at first birth and outcomesIn Table 3 we move a stage further and examine the extent to whichwomen experience each outcome according to the level of poverty inchildhood and the age at which the women had their first child. Anumber of general observations emerge from this table.
Table 3: Proportions of women experiencing each outcome accordingto level of poverty in childhood by age at first birth (per cent)
Age at first birth Extra-maritalbirth
Everlone-
mother
Socialhousing
Anybenefits
Noqualific-
ations
Lowhousehold
income
Notelephone
Under age 20
Not poor 27.1 50.9 38.9 38.6 29.7 35.1 13.1
Probably not poor 37.3 56.6 37.9 40.4 26.9 40.9 13.7
Some poverty 30.2 51.7 43.4 49.1 38.4 48.8 20.2
Fairly poor 39.1 49.1 58.3 42.7 45.4 43.2 25.4
Clearly poor 43.9 54.5 67.9 57.1 68.5 70.4 31.6
Missing 47.4 63.2 38.9 31.6 35.3 45.4 15.9
20-22
Not poor 12.7 30.8 23.9 29.2 16.7 28.3 6.7
Probably not poor 15.4 35.8 31.2 31.6 17.9 31.6 9.9
Some poverty 20.8 32.6 34.1 38.2 30.9 30.0 12.9
Fairly poor 27.3 41.7 40.6 43.1 41.7 44.4 27.5
Clearly poor 20.5 43.2 51.2 40.9 41.9 51.6 25.6
Missing 27.3 40.9 18.2 27.3 38.1 18.8 18.2

23-32
Not poor 7.4 11.2 6.5 13.9 3.6 17.3 2.8
Probably not poor 10.9 13.8 8.4 17.1 5.8 19.0 3.1
Some poverty 13.2 15.5 14.9 20.2 14.5 26.5 9.0
Fairly poor 22.8 21.6 27.6 24.8 24.4 37.0 11.1
Clearly poor 17.2 28.6 24.2 34.4 32.8 38.3 9.5
Missing 7.0 12.3 7.0 24.6 16.4 23.3 5.4
No child
Not poor 0.0 0.0 4.0 7.0 3.8 22.6 2.6
Probably not poor 0.0 0.0 5.8 6.8 8.3 22.2 3.8
Some poverty 0.0 0.0 11.3 11.0 9.5 35.1 6.4
Fairly poor 0.0 0.0 16.1 15.5 18.3 41.9 8.4
Clearly poor 0.0 0.0 6.2 15.8 21.1 37.5 15.8
Missing 0.0 0.0 6.8 9.8 16.3 24.1 9.8
All women
Not poor 7.8 14.1 11.1 16.2 7.5 21.6 4.1
Probably not poor 11.4 17.9 14.3 19.0 10.2 23.9 5.3
Some poverty 15.5 22.9 23.6 27.5 21.3 33.0 11.3
Fairly poor 24.3 29.7 36.8 32.2 32.7 40.9 18.2
Clearly poor 25.0 37.6 42.9 41.0 44.4 51.4 20.9
Missing 12.8 18.8 12.8 20.8 21.8 25.2 10.1
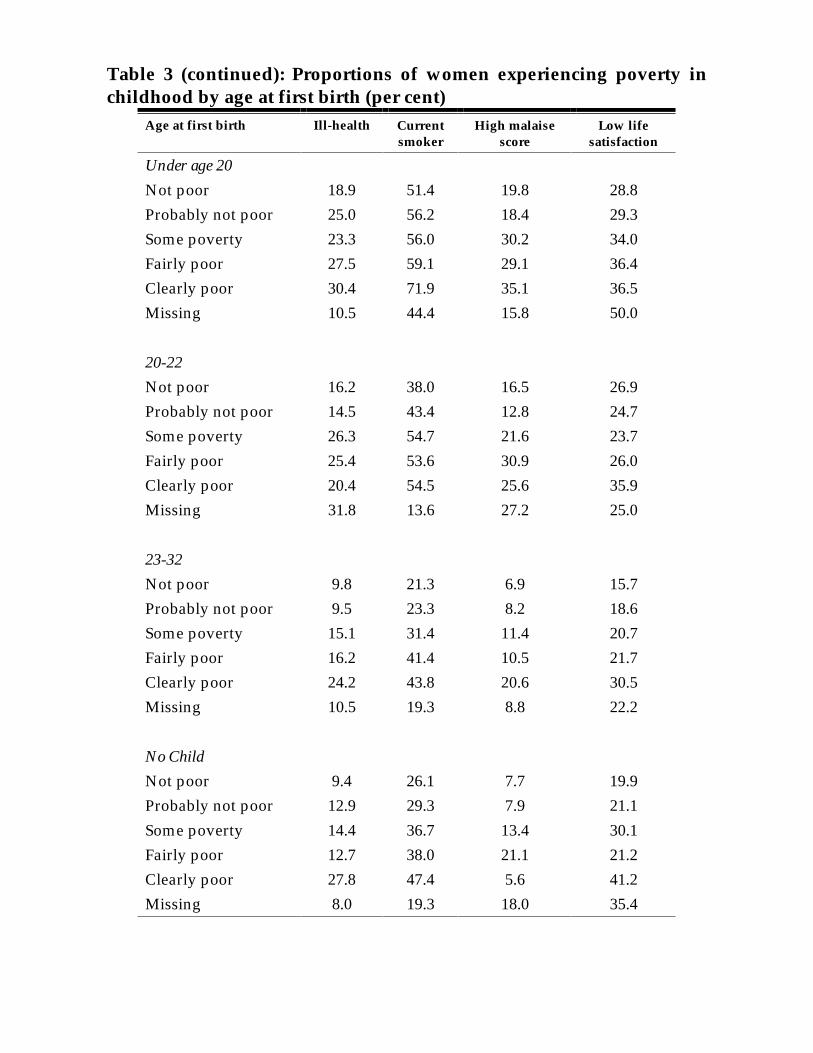
Table 3 (continued): Proportions of women experiencing poverty inchildhood by age at first birth (per cent)
Age at first birth Ill-health Currentsmoker
High malaisescore
Low lifesatisfaction
Under age 20
Not poor 18.9 51.4 19.8 28.8
Probably not poor 25.0 56.2 18.4 29.3
Some poverty 23.3 56.0 30.2 34.0
Fairly poor 27.5 59.1 29.1 36.4
Clearly poor 30.4 71.9 35.1 36.5
Missing 10.5 44.4 15.8 50.0
20-22
Not poor 16.2 38.0 16.5 26.9
Probably not poor 14.5 43.4 12.8 24.7
Some poverty 26.3 54.7 21.6 23.7
Fairly poor 25.4 53.6 30.9 26.0
Clearly poor 20.4 54.5 25.6 35.9
Missing 31.8 13.6 27.2 25.0
23-32
Not poor 9.8 21.3 6.9 15.7
Probably not poor 9.5 23.3 8.2 18.6
Some poverty 15.1 31.4 11.4 20.7
Fairly poor 16.2 41.4 10.5 21.7
Clearly poor 24.2 43.8 20.6 30.5
Missing 10.5 19.3 8.8 22.2
No Child
Not poor 9.4 26.1 7.7 19.9
Probably not poor 12.9 29.3 7.9 21.1
Some poverty 14.4 36.7 13.4 30.1
Fairly poor 12.7 38.0 21.1 21.2
Clearly poor 27.8 47.4 5.6 41.2
Missing 8.0 19.3 18.0 35.4
All women
Not poor 11.3 27.2 9.5 19.3
Probably not poor 12.6 31.1 9.8 21.2
Some poverty 18.9 42.0 17.4 25.6
Fairly poor 20.7 48.1 21.6 26.1
Clearly poor 25.6 55.4 24.9 34.7
Missing 12.8 23.6 15.5 30.7
Initially let us focus on the two extreme groups of the povertydistribution: the “not poor” and the “clearly poor”. Across all theoutcomes the not poor group of women are more likely to have adverseadult experiences the younger the age at motherhood and the “clearlypoor” group have lower probabilities of adverse outcomes the later theybecome mothers. These relationships are noticeably strong with respectto the demographic behaviours of having a child outside of marriage orbecoming a lone parent, as well as with the socio-economic and welfareoutcomes, with somewhat weaker relationships for ill-health (but notsmoking) and the two emotional well-being measures. The strongrelationship with the demographic behaviours is not unexpected giventhat the extra-marital childbearing is more common for those who entermotherhood early and the chances of becoming a lone-mother reflecthigher propensities for early births to occur outside partnerships, forearly partnerships to subsequently break down and a longer exposure torisk amongst the younger mothers.
There is also a tendency for the chances of an adverse outcome tobe more weakly related to the level of poverty during childhoodamongst the teenage mothers than is the case for older mothers,particularly those who delayed having a child to after age 23. Amongstthis delayed motherhood group, we see higher proportions experiencingnegative outcomes with increasing childhood poverty in most of thedomains; but this is the case for a more limited number of domainsamongst the teenage mothers. For example, amongst the teenagemothers the proportions who have ever been lone parents are invariantwith childhood poverty, and there is only a weak association withsmoking and life-satisfaction, but there is an increasing association withlevel of childhood poverty for social housing and having noqualifications. These findings suggest that degree of childhood povertymay be a more important discriminator at older ages of motherhood inaffecting how these mothers lives subsequently unfold but thatbecoming a teenage mother regardless of degree of childhood poverty
has a more general negative impact on subsequent life experiences. Ourmultivariate analyses will address and assess these issues morerigorously.
4. Does age at motherhood affect adverse adult outcomes?
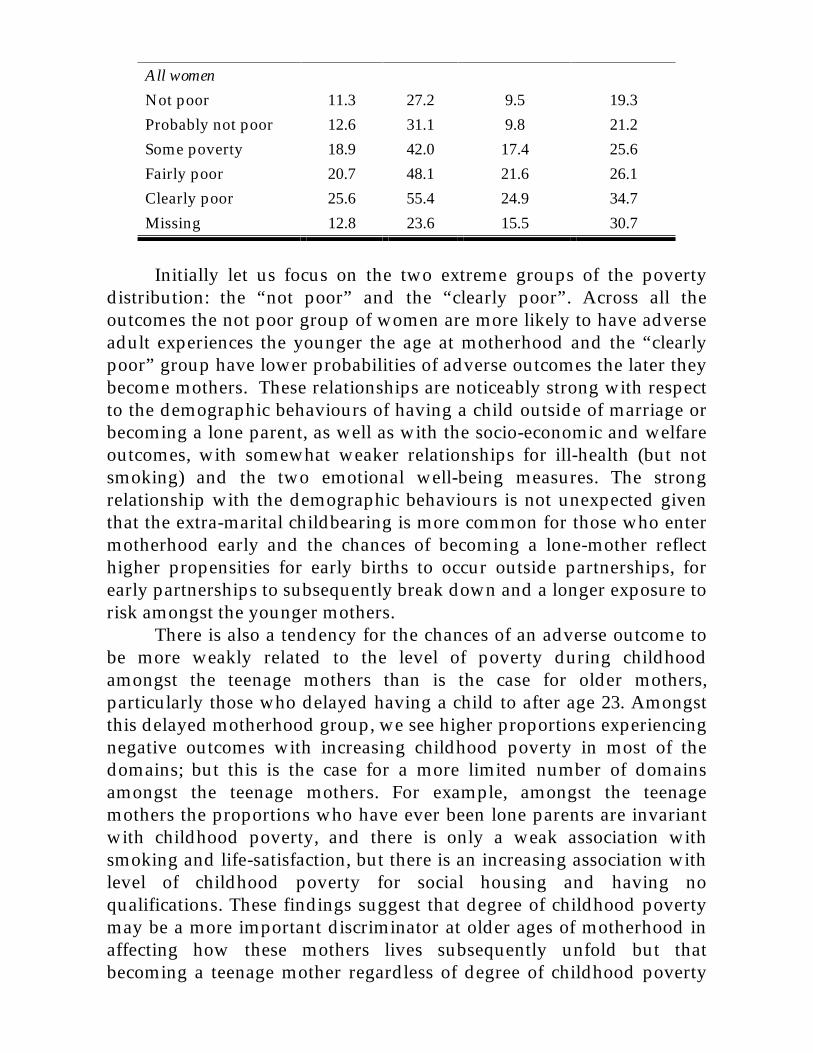
One of our main aims was to test the hypothesis as to whether age atmotherhood has a significant association with adverse adult outcomes atage 33 over and above the impact of childhood poverty, as well as awide range of other childhood background factors. In order to assessthis we tried a range of different regression models, each designed witha particular idea in mind, as portrayed in Figure 1.
4.1 A conceptualisation of the issues
These concerns are illustrated in their essence in the top left-hand panelof Figure 1. In this diagram, there is a solid line connecting the pathwayfrom childhood poverty to adult outcomes. The most naïve modelwould see the ‘effects’ of childhood poverty on the various adultoutcomes that we consider as working along this pathway, without anyother controls (we refer to this as Model 1). We can then pose thequestion as to whether introduction of additional controls for age at firstbirth (termed Model 1A) add any explanatory power to this simpleaccount – in other words, do the dashed lines indicate significantrelationships? If they do, we can then examine the extent of therelationships and their magnitude.
A second way of conceptualising the question is shown in theupper right-hand portion of Figure 1. We now recognise that there are arange of other factors reflecting childhood experiences which arethemselves likely to be inter-related with childhood poverty, with earlyparenthood, and with subsequent adult outcomes. But we here givechildhood poverty pride of place among the childhood factors, becauseit is a focus of special interest. We thus insist that childhood povertylevels are included in our Model 2 (‘poverty forced’), but pose thequestion (through a step-wise regression procedure) as to whether andhow many of the other childhood factors are relevant to each adultoutcome in turn (so that we choose a different Model 2 for every adultoutcome). Once we have chosen the appropriate Model 2 for eachoutcome, we then pose the question as to whether the addition of termsfor age at first birth add explanatory power (in Model 2A), whilst
keeping all of the elements of the relevant Model 2 (‘Model 2 forced’).Once again, the pathways included in Model 2 are shown as solid linesand the possible additional pathways for Model 2A are shown as dashedlines. Do the dashed lines in this panel represent significantrelationships? If they do, the magnitude of the pathway from earlyparenthood to the adult outcomes and the magnitudes of the pathwaysfrom childhood poverty to adult outcomes, both before and aftercontrolling for age at first birth are of interest.
An alternative conceptualisation would place childhood povertyand the other childhood factors on an equal footing and simply askwhich of these childhood precursors were significantly related to eachadult outcome in turn (Model 3 – lower left-hand panel of Figure 1). Ofparticular interest would still be the size of the relationships forchildhood poverty. Once Model 3 has been chosen for each outcome, theelements of that model are again ‘forced’ into Model 3A, to which isadded any significant relationships with categories of age at first birth(again effectively capturing the pathways indicated by the dashed lines).
The final, and most elaborate, conceptualisation is illustrated in thelower right-hand panel of Figure 1. This begins by examining apreliminary model (essentially Model 2) for teenage motherhood as apost-childhood outcome, with childhood poverty levels being forcedinto the model and relevant other childhood factors selected forinclusion. The terms of this preliminary model are then ‘forced’ intolater models, with the object of trying to ensure the models capture themaximum possible explanatory power for teenage motherhood, thustrying to make the final test for inclusion of age at first birth ‘effects’(over and above childhood precursors) as stringent as possible. Model 4is then derived for each outcome in turn, by asking which otherchildhood factors add explanatory power (over and above childhoodpoverty and the other childhood factors that are already included in thepreliminary model). We can then again pose the question as to whethermoving from Model 4 for each outcome to Model 4A adds furtherexplanatory power – are there additional age at first birth effects?
4.2 Testing the hypothesis of first birth effectsThe first model we considered is shown as Models 1 and 1A in Figure 1.This is the simplest model considered and is quite close to summarisingthe information shown in Table 3. Model 1 simply includes the levels ofchildhood poverty in a logistic regression for each of the 11 adverseoutcomes in turn. Model 1A retains all of the terms for the levels ofchildhood poverty (these are forced into the model) and asks whether
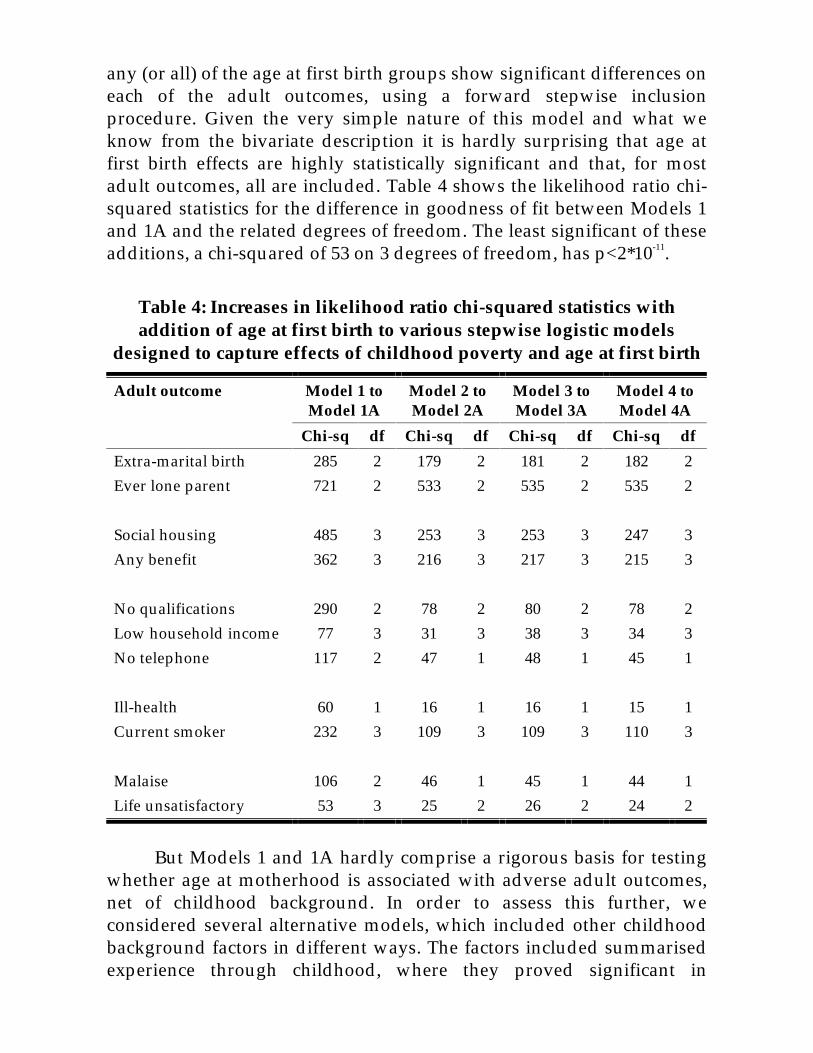
any (or all) of the age at first birth groups show significant differences oneach of the adult outcomes, using a forward stepwise inclusionprocedure. Given the very simple nature of this model and what weknow from the bivariate description it is hardly surprising that age atfirst birth effects are highly statistically significant and that, for mostadult outcomes, all are included. Table 4 shows the likelihood ratio chi-squared statistics for the difference in goodness of fit between Models 1and 1A and the related degrees of freedom. The least significant of theseadditions, a chi-squared of 53 on 3 degrees of freedom, has p<2*10-11.
Table 4: Increases in likelihood ratio chi-squared statistics withaddition of age at first birth to various stepwise logistic models
designed to capture effects of childhood poverty and age at first birth
Adult outcome Model 1 toModel 1A
Model 2 toModel 2A
Model 3 toModel 3A
Model 4 toModel 4A
Chi-sq df Chi-sq df Chi-sq df Chi-sq df
Extra-marital birth 285 2 179 2 181 2 182 2
Ever lone parent 721 2 533 2 535 2 535 2
Social housing 485 3 253 3 253 3 247 3
Any benefit 362 3 216 3 217 3 215 3
No qualifications 290 2 78 2 80 2 78 2
Low household income 77 3 31 3 38 3 34 3
No telephone 117 2 47 1 48 1 45 1
Ill-health 60 1 16 1 16 1 15 1
Current smoker 232 3 109 3 109 3 110 3
Malaise 106 2 46 1 45 1 44 1
Life unsatisfactory 53 3 25 2 26 2 24 2
But Models 1 and 1A hardly comprise a rigorous basis for testingwhether age at motherhood is associated with adverse adult outcomes,net of childhood background. In order to assess this further, weconsidered several alternative models, which included other childhoodbackground factors in different ways. The factors included summarisedexperience through childhood, where they proved significant in
stepwise forward models, and were to recap: family type, contact withthe police by age 16, grandfathers’ and father’s social class at birth, andfather’s social class during the survey member’s childhood, housingtenure during childhood, mother’s and father’s terminal age ofeducation, mother’s and father’s interest in schooling, results of testscores, and three behavioural indicators (aggression, anxiety, andrestlessness).
Model 2 (shown in Figure 1) forces inclusion of childhood poverty,as a variable of focal interest, and then selects the other childhoodfactors which were statistically significant using a stepwise forwardinclusion procedure. All the elements of Model 2 are then forced into afurther logistic regression model and the age at first birth effects areadded using a stepwise forward selection procedure to provide Model2A. Again, the improvement in fit of Model 2A, compared with Model 2,is shown in terms of the differences between the relevant likelihood-ratio chi-squared statistics in Table 4. Although the measures ofimprovement in fit have attenuated, compared with Models 1 and 1A,the age at first motherhood elements are still highly statisticallysignificant, with that for poor or fair health having p=0.00006 and allothers having even smaller p-values.
A more parsimonious version of model 2 was usually found if thechildhood poverty categories were not all forced into the model. Thus,Model 3 permits the stepwise forward selection procedure to choosefreely among all childhood factors. The elements of Model 3 are thenforced into a further logistic regression (Model 3A) and the inclusion ofthe age at first birth effects is again tested using a stepwise forwardinclusion procedure. The results of comparing Models 3 and 3A are alsoshown in Table 4 and are virtually identical to those obtained for Models2 and 2A.
Our final, and most elaborate, model to test for significant effectsof early parenthood on adverse adult outcomes net of childhoodbackground was derived to try to ensure greater potential control for thechildhood determinants of teenage motherhood. This began by fitting apreliminary model, which forced the inclusion of the childhood povertycategories and then chose all other significant childhood correlates ofteenage motherhood. The elements of this model of teenage motherhoodwere then forced into Model 4 and any further significant childhoodcorrelates of each adult outcome were also added through a stepwiseforward selection procedure. All elements of Model 4 were then forcedinto a further logistic regression which tested for the addition of the ageat first birth effects (Model 4A). Once again, we show comparisons of the
additional explanatory power of Model 4A compared with Model 4 inTable 4. Despite Model 4 containing many more parameters than theearlier models (though with little, if any, significant improvement inoverall fit), the results are again virtually identical to those fromcomparing Models 2 and 2A or Models 3 and 3A. For every adultoutcome, there remains a strongly significant association of the age atfirst birth net of the childhood controls; moreover, the estimatedparameters for these associations were also remarkably robust to thediffering specifications, ranging from the parsimonious approach ofModel 3 through to the much more elaborate approach of Model 4.
In view of this, here we shall only consider in detail the odds ratiosfrom one of the pairs of models used to assess the net effects of age atfirst birth after controls for a wide range of childhood backgroundfactors, including experience of childhood poverty. The models we havechosen to examine in more detail are Models 3 and 3A, since these areparsimonious (containing fewest parameters) and lead to very similarconclusions to the more complex, but generally no better fitting, models– whilst allowing some noise and over-control is arguably desirable for arigorous test of the need to include age at first birth effects, modelscontaining several insignificant parameters are much more problematicfor interpretation of the results.
5. Consequences of early motherhood and childhoodpoverty
Having demonstrated that highly significant associations of age at firstbirth with a wide range of adverse adult outcomes still persist aftercontrol for a multitude of childhood background factors, we now turn toan examination of the magnitude of the net effects of age at first birth andof levels of childhood poverty on each adult outcome, after controls forthe other childhood factors.
The models were fitted using a series of contrasts of entry intomotherhood below a particular age, specifically before age 33, before age23, and before age 20; these are termed ‘hierarchical’ odds ratios,because the successive restrictions of ages at childbearing form ahierarchy. The levels of childhood poverty were contrasted in a similarhierarchical way. The levels of childhood poverty were contrasted in asimilar hierarchical way; not poor, any poverty or probably not poor,any poverty, fairly or clearly poor, and clearly poor.
The actual estimates of the odds ratios and the associated z-scoresfor age at first birth are shown in Table 6 and those for childhoodpoverty in Tables 8A and B. These estimated hierarchical odds ratioswere then multiplied together to provide the estimated odds ratioswhich are shown in Table 5 for age at first birth and Table 7 forchildhood poverty. With respect to age at first birth there was a furthermodification that age at birth 23-32 was set as the reference group, witha base odds ratio of one. For example, the odd ratio for the risk of havingan extra-marital birth for a teenage mother of 4.51:1 (in Table 5) isderived by multiplying the odds for having a birth before age 23 (2.17:1,from Table 6) by the additional odds ratio for having a birth before age20 (2.08:1, from Table 6).
5.1 Consequences of age at first birthWe begin by examining the estimated odds ratios for age at first birth.The most dramatic contrasts in adult outcomes arise from comparing allthose women who had their first birth before age 23 with those who firstbecame mothers between ages 23 and 32 years (most clearly seen fromTable 6, where the hierarchical odds ratios are frequently largest for thiscontrast). These differences are often, but not always, further reinforcedwhen the early birth occurred during the woman’s teens, as shown inTable 6. In view of this, we begin by looking at the odds ratios for earlymotherhood (before age 23).
Early mothers (under age 23) are (see Table 5 or 6):� 4.4 times as likely to have ever been a lone parent by age 33;� about 3 times more likely to be resident in social housing at age 33;� about twice as likely to have had an extra-marital birth, to be in
receipt of non-universal benefits at age 33, to have noqualifications at age 33, to not have a telephone in their householdat age 33, to be a cigarette smoker at age 33, and to experience ahigh malaise score at age 33;
� and about 40 per cent more likely to have a low household incomeat age 33, to report general poor or fair health at age 33, and to ratelife as unsatisfactory.For teenage mothers, these effects are often higher still (compared
with early mothers in their twenties), being further (see Table 6):� about doubled for extra-marital births, and experience of lone
parenthood;� increased by about 50% for social housing;� up by about another 40% for benefit receipt, lack of qualifications,
and low household income;
� and up by another 30% for smoking.But there is no additional impact of a teenage birth (compared with onein the early 20s) on lack of access to a telephone, general ill health,malaise, or life dissatisfaction.
Teenage mothers consequently have odds of adverse adultoutcomes (compared with those who first become mothers at ages 23-32)of (see Table 5):� over 8:1 of having experienced lone parenthood by age 33;� over 4:1 of having had an extra-marital birth and of being in social
housing at age 33;� about 2.5:1 of being in receipt of non-universal benefits at age 33
(over 13 years after the first birth), and of having no qualifications,and being current cigarette smokers at age 33;
� about 2:1 of not having a telephone, being in a low incomehousehold, and experiencing malaise at age 33;
� and about 1.5:1 of saying life is unsatisfactory, and of reportingtheir general health as poor or fair.We also see in Table 5 that women who had not had a birth by age
32 were: the least likely to be in social housing or in receipt of non-universal benefits; as likely as those who had a first birth between ages23 and 32 (and thus jointly least likely) to have no qualifications, to nothave access to a telephone, to report poor or fair general health, and toexperience malaise; but were more likely than those who had a birthbetween age 23 and 32 to have low household income, to smokecigarettes, and to be dissatisfied with their lives; and, of course, loneparenthood and extra-marital births are not relevant outcomes for thosewho have not yet had a birth.
We emphasise that care must be taken in interpreting these oddsratios by age at entry into motherhood too literally as being an ‘effect’ ofage at first birth. These odds ratios remain statistically significant in theface of a wide range of controls for childhood background factors andthus address the question as to whether there are ‘effects’ of age at firstbirth net of these controls. But it must be stressed that no other factors inadulthood are included in the models, so that we are not trying to‘explain’ how these often strong associations of adverse adult outcomeswith age at first birth arise. It is entirely plausible, and indeed probable,that early motherhood is fairly directly linked with reducing choices andopportunities in ways that have profound and lasting effects, but thereare of course likely to be other factors associated with early motherhoodwhich partly determine adverse outcomes later in life.

Table 5: Odds ratios for experiencing adult outcomes by age at firstbirth, net of childhood poverty and other childhood controls
(Model 3A)
Age at first birth
Adult outcome Teenage 20-22 23-32 No birth
Extra-marital birth 4.51 2.17 1.00
Ever lone parent 8.32 4.43 1.00
Social housing 4.28 2.89 1.00 0.74
Any benefits 2.42 1.90 1.00 0.45
No qualifications 2.73 1.99 1.00 1.00
Low household income 1.92 1.39 1.00 1.45
No telephone 2.21 2.21 1.00 1.00
General ill-health 1.42 1.42 1.00 1.00
Current smoker 2.45 1.86 1.00 1.40
Malaise 1.86 1.86 1.00 1.00
Life unsatisfactory 1.46 1.46 1.00 1.34
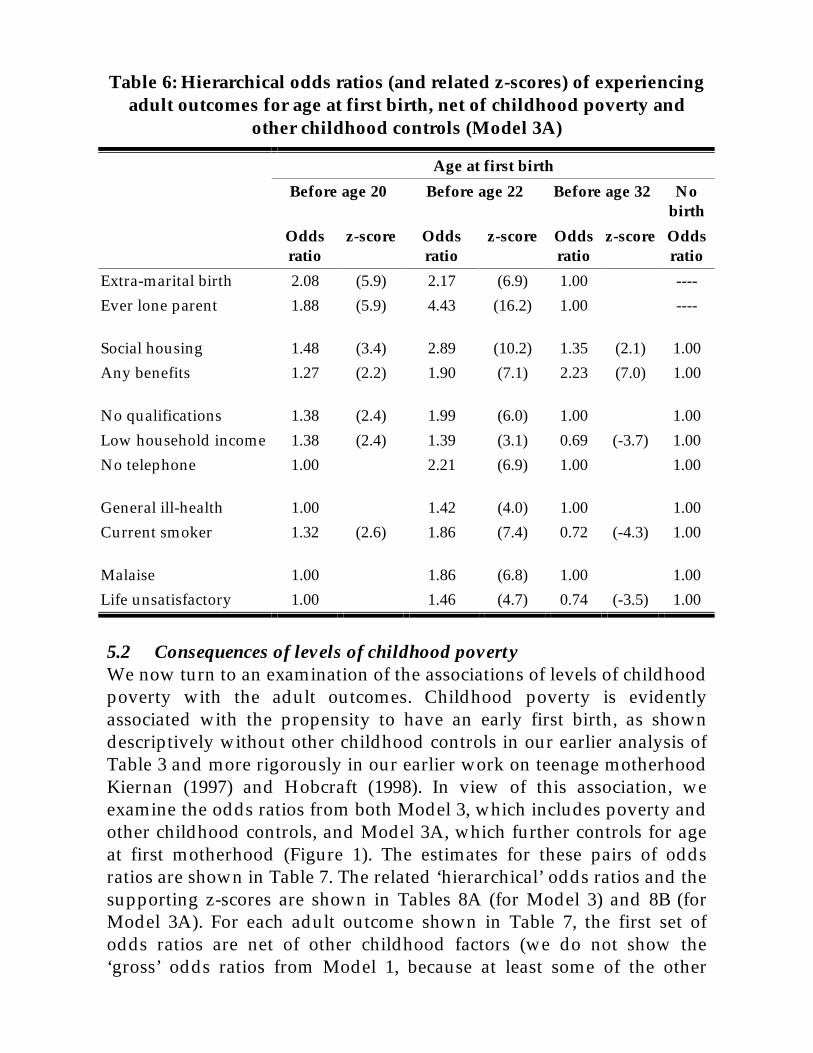
Table 6: Hierarchical odds ratios (and related z-scores) of experiencingadult outcomes for age at first birth, net of childhood poverty and
other childhood controls (Model 3A)
Age at first birth
Before age 20 Before age 22 Before age 32 Nobirth
Oddsratio
z-score Oddsratio
z-score Oddsratio
z-score Oddsratio
Extra-marital birth 2.08 (5.9) 2.17 (6.9) 1.00 ----
Ever lone parent 1.88 (5.9) 4.43 (16.2) 1.00 ----
Social housing 1.48 (3.4) 2.89 (10.2) 1.35 (2.1) 1.00
Any benefits 1.27 (2.2) 1.90 (7.1) 2.23 (7.0) 1.00
No qualifications 1.38 (2.4) 1.99 (6.0) 1.00 1.00
Low household income 1.38 (2.4) 1.39 (3.1) 0.69 (-3.7) 1.00
No telephone 1.00 2.21 (6.9) 1.00 1.00
General ill-health 1.00 1.42 (4.0) 1.00 1.00
Current smoker 1.32 (2.6) 1.86 (7.4) 0.72 (-4.3) 1.00
Malaise 1.00 1.86 (6.8) 1.00 1.00
Life unsatisfactory 1.00 1.46 (4.7) 0.74 (-3.5) 1.00
5.2 Consequences of levels of childhood povertyWe now turn to an examination of the associations of levels of childhoodpoverty with the adult outcomes. Childhood poverty is evidentlyassociated with the propensity to have an early first birth, as showndescriptively without other childhood controls in our earlier analysis ofTable 3 and more rigorously in our earlier work on teenage motherhoodKiernan (1997) and Hobcraft (1998). In view of this association, weexamine the odds ratios from both Model 3, which includes poverty andother childhood controls, and Model 3A, which further controls for ageat first motherhood (Figure 1). The estimates for these pairs of oddsratios are shown in Table 7. The related ‘hierarchical’ odds ratios and thesupporting z-scores are shown in Tables 8A (for Model 3) and 8B (forModel 3A). For each adult outcome shown in Table 7, the first set ofodds ratios are net of other childhood factors (we do not show the‘gross’ odds ratios from Model 1, because at least some of the other
childhood factors are as likely to be causes of childhood poverty aseffects). The second set of odds ratios for each adult outcome are net ofboth the other childhood factors and the age at first birth, thus showingthe extent to which these associations are captured by the inclusion ofage at first birth, which is itself related to childhood poverty (in essence,any experience of childhood poverty increases the odds of a teenagebirth to 1.6:1 and the odds of a birth under age 23 to 1.45:1).
From Table 7 (and even more clearly from Tables 8A and 8B) it isevident that the biggest ‘divide’ in the odds ratios for adult outcomesoccurs with any evidence of childhood poverty: the hierarchical oddsratios for this group are statistically significant for every outcome exceptdissatisfaction with life in Model 3 and only become insignificant inModel 3A for lone parenthood. There is no evidence to suggest that thegroup who were ‘probably not poor’ during childhood experiencedifferences in any of the adult outcomes (see Tables 8A and 8B). Whereno information was available on childhood poverty at any of thechildhood waves of NCDS (All missing), there is no statisticallysignificant relationship with any of the adverse outcomes, exceptdissatisfaction with life at age 33. Moreover, there are only very fewindications of any reinforcement of the effects of any experience ofchildhood poverty by greater intensity of such poverty: having beenclearly or fairly poor during childhood further increases the odds ofbeing in social housing at age 33; and having been clearly poor duringchildhood is associated with a further increase in the odds of having noqualifications, of having a low household income, and of reporting lowlevels of satisfaction with life, all at age 33.
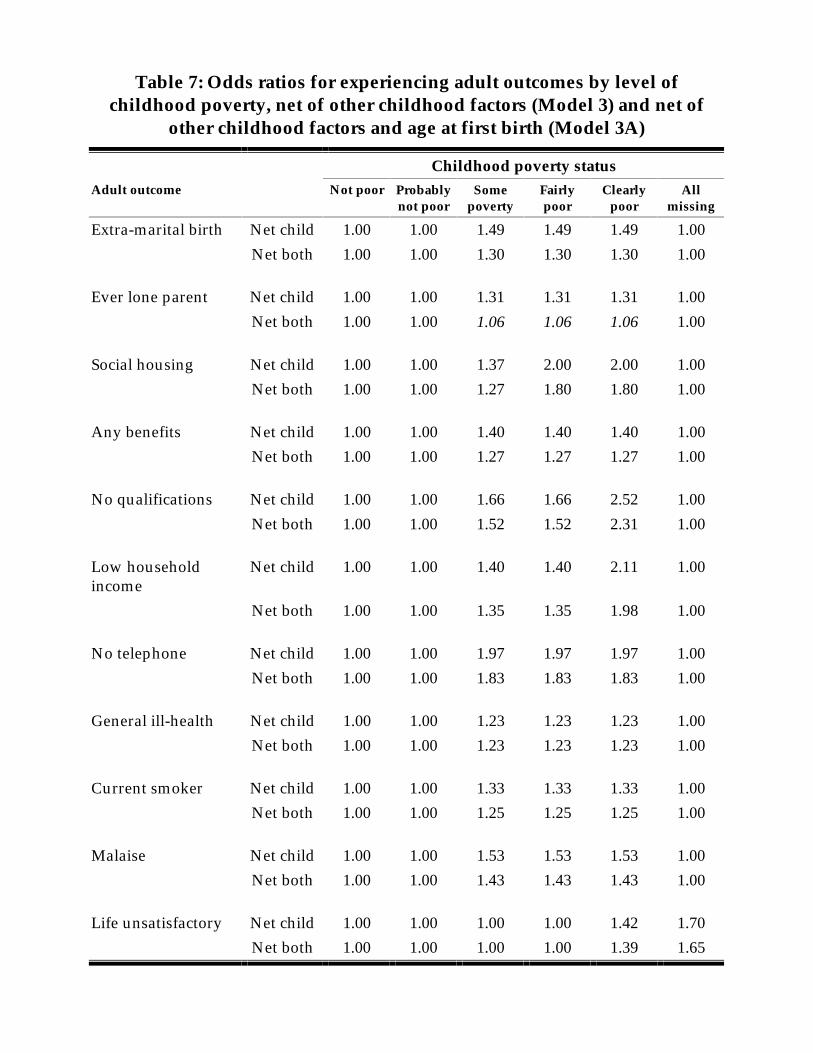
Table 7: Odds ratios for experiencing adult outcomes by level ofchildhood poverty, net of other childhood factors (Model 3) and net of
other childhood factors and age at first birth (Model 3A)
Childhood poverty statusAdult outcome Not poor Probably
not poorSome
povertyFairlypoor
Clearlypoor
Allmissing
Extra-marital birth Net child 1.00 1.00 1.49 1.49 1.49 1.00
Net both 1.00 1.00 1.30 1.30 1.30 1.00
Ever lone parent Net child 1.00 1.00 1.31 1.31 1.31 1.00
Net both 1.00 1.00 1.06 1.06 1.06 1.00
Social housing Net child 1.00 1.00 1.37 2.00 2.00 1.00
Net both 1.00 1.00 1.27 1.80 1.80 1.00
Any benefits Net child 1.00 1.00 1.40 1.40 1.40 1.00
Net both 1.00 1.00 1.27 1.27 1.27 1.00
No qualifications Net child 1.00 1.00 1.66 1.66 2.52 1.00
Net both 1.00 1.00 1.52 1.52 2.31 1.00
Low householdincome
Net child 1.00 1.00 1.40 1.40 2.11 1.00
Net both 1.00 1.00 1.35 1.35 1.98 1.00
No telephone Net child 1.00 1.00 1.97 1.97 1.97 1.00
Net both 1.00 1.00 1.83 1.83 1.83 1.00
General ill-health Net child 1.00 1.00 1.23 1.23 1.23 1.00
Net both 1.00 1.00 1.23 1.23 1.23 1.00
Current smoker Net child 1.00 1.00 1.33 1.33 1.33 1.00
Net both 1.00 1.00 1.25 1.25 1.25 1.00
Malaise Net child 1.00 1.00 1.53 1.53 1.53 1.00
Net both 1.00 1.00 1.43 1.43 1.43 1.00
Life unsatisfactory Net child 1.00 1.00 1.00 1.00 1.42 1.70
Net both 1.00 1.00 1.00 1.00 1.39 1.65
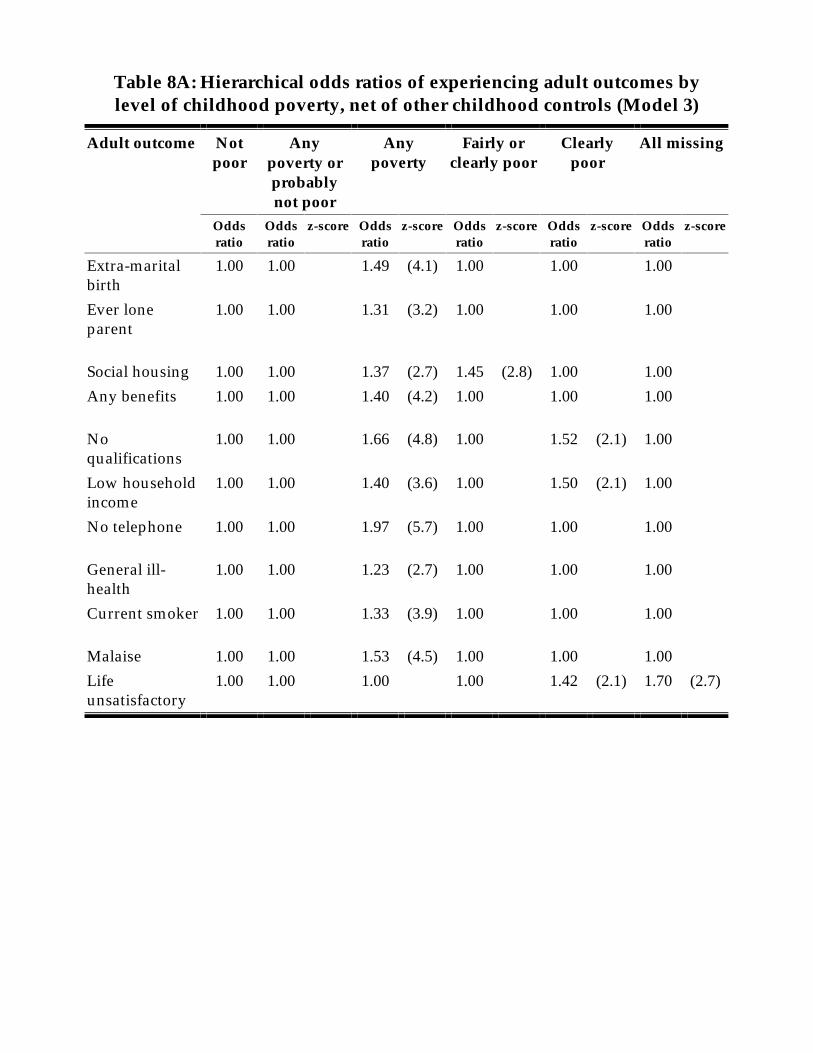
Table 8A: Hierarchical odds ratios of experiencing adult outcomes bylevel of childhood poverty, net of other childhood controls (Model 3)
Adult outcome Notpoor
Anypoverty orprobablynot poor
Anypoverty
Fairly orclearly poor
Clearlypoor
All missing
Oddsratio
Oddsratio
z-score Oddsratio
z-score Oddsratio
z-score Oddsratio
z-score Oddsratio
z-score
Extra-maritalbirth
1.00 1.00 1.49 (4.1) 1.00 1.00 1.00
Ever loneparent
1.00 1.00 1.31 (3.2) 1.00 1.00 1.00
Social housing 1.00 1.00 1.37 (2.7) 1.45 (2.8) 1.00 1.00
Any benefits 1.00 1.00 1.40 (4.2) 1.00 1.00 1.00
Noqualifications
1.00 1.00 1.66 (4.8) 1.00 1.52 (2.1) 1.00
Low householdincome
1.00 1.00 1.40 (3.6) 1.00 1.50 (2.1) 1.00
No telephone 1.00 1.00 1.97 (5.7) 1.00 1.00 1.00
General ill-health
1.00 1.00 1.23 (2.7) 1.00 1.00 1.00
Current smoker 1.00 1.00 1.33 (3.9) 1.00 1.00 1.00
Malaise 1.00 1.00 1.53 (4.5) 1.00 1.00 1.00
Lifeunsatisfactory
1.00 1.00 1.00 1.00 1.42 (2.1) 1.70 (2.7)
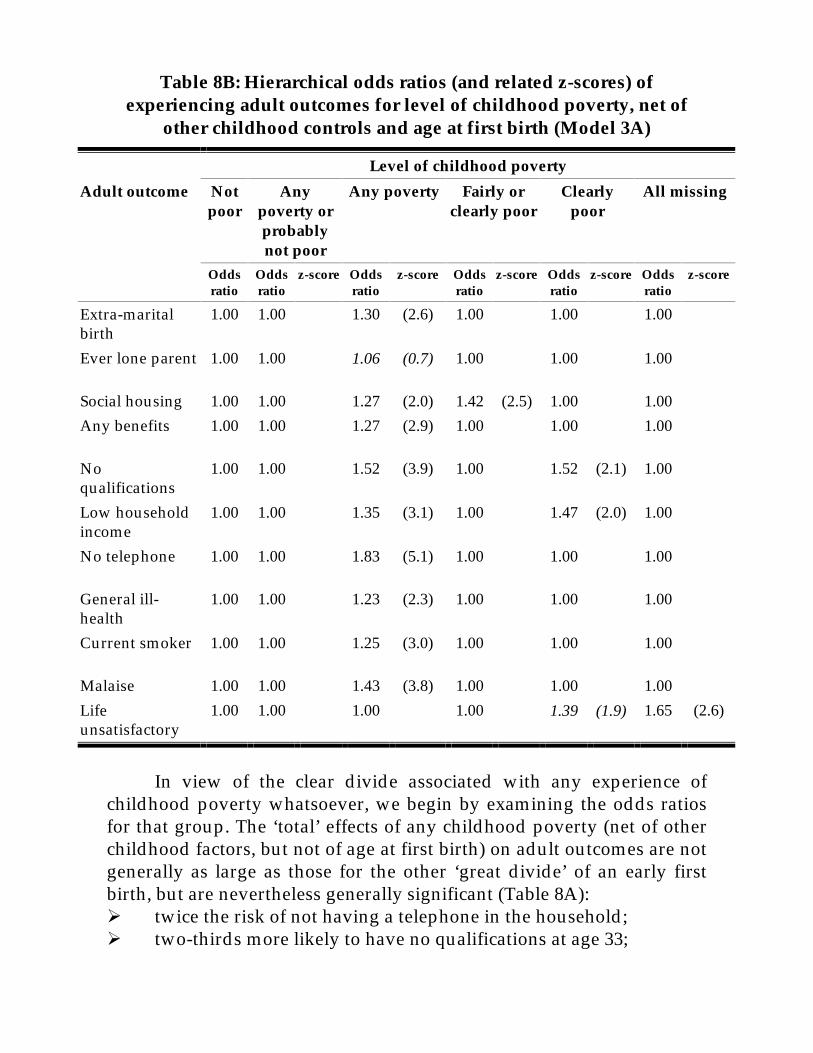
Table 8B: Hierarchical odds ratios (and related z-scores) ofexperiencing adult outcomes for level of childhood poverty, net of
other childhood controls and age at first birth (Model 3A)
Level of childhood poverty
Adult outcome Notpoor
Anypoverty orprobablynot poor
Any poverty Fairly orclearly poor
Clearlypoor
All missing
Oddsratio
Oddsratio
z-score Oddsratio
z-score Oddsratio
z-score Oddsratio
z-score Oddsratio
z-score
Extra-maritalbirth
1.00 1.00 1.30 (2.6) 1.00 1.00 1.00
Ever lone parent 1.00 1.00 1.06 (0.7) 1.00 1.00 1.00
Social housing 1.00 1.00 1.27 (2.0) 1.42 (2.5) 1.00 1.00
Any benefits 1.00 1.00 1.27 (2.9) 1.00 1.00 1.00
Noqualifications
1.00 1.00 1.52 (3.9) 1.00 1.52 (2.1) 1.00
Low householdincome
1.00 1.00 1.35 (3.1) 1.00 1.47 (2.0) 1.00
No telephone 1.00 1.00 1.83 (5.1) 1.00 1.00 1.00
General ill-health
1.00 1.00 1.23 (2.3) 1.00 1.00 1.00
Current smoker 1.00 1.00 1.25 (3.0) 1.00 1.00 1.00
Malaise 1.00 1.00 1.43 (3.8) 1.00 1.00 1.00
Lifeunsatisfactory
1.00 1.00 1.00 1.00 1.39 (1.9) 1.65 (2.6)
In view of the clear divide associated with any experience ofchildhood poverty whatsoever, we begin by examining the odds ratiosfor that group. The ‘total’ effects of any childhood poverty (net of otherchildhood factors, but not of age at first birth) on adult outcomes are notgenerally as large as those for the other ‘great divide’ of an early firstbirth, but are nevertheless generally significant (Table 8A):� twice the risk of not having a telephone in the household;� two-thirds more likely to have no qualifications at age 33;
� about 50% more likely to have had an extra-marital birth, or tohave high malaise score;
� about 40% more likely to be resident in social housing, to be inreceipt of non-universal benefits, and to have a low householdincome;
� a third more likely to be a cigarette smoker at age 33;� and a quarter more likely to report general poor or fair health at
33.Once the additional controls for age at first birth are introduced
these odds ratios are usually attenuated further, though the reductionsare often quite small (see Table 7). Only the association with experienceof lone parenthood with childhood poverty becomes statisticallyinsignificant (along with the life dissatisfaction, where the ‘total’ effectwas already not significant). The generally partial attenuation indicatesthat little of the childhood poverty association operates through age atfirst birth, but rather remains as a direct effect on the adult outcomes.Once age at first birth has been controlled, these residual ‘direct’ effectsof any experience of childhood poverty are(Table 8B):� an 83% excess risk of not having a telephone in the household at
age 33;� 50% more likely to have no qualifications at age 33;� about 40% more likely to experience malaise at age 33;� roughly one-third more likely to have had an extra-marital birth,
and to have low household income;� about one-quarter more likely to be in social housing, to be in
receipt of non-universal benefits, to be a cigarette smoker, and toreport poor or fair general health at age 33.The few additional associations with more intense levels of
childhood poverty, being fairly and clearly poor, further increase thelikelihood of (Table 7):� being in social housing at age 33 to a doubling for the ‘total’ effect
of having been fairly or clearly poor as a child, and 80% excess forthe net effect;
� having no qualifications at age 33 to two and a half times for the‘total’ effect of having been clearly poor during childhood, and 2.3times for the net effect;
� having a low household income at age 33 to about double for boththe total and net effects of having been clearly poor duringchildhood;
� and produce an odds ratio of borderline statistical significance (atthe 5% level) of about 1.4:1 (total and net) of those who were
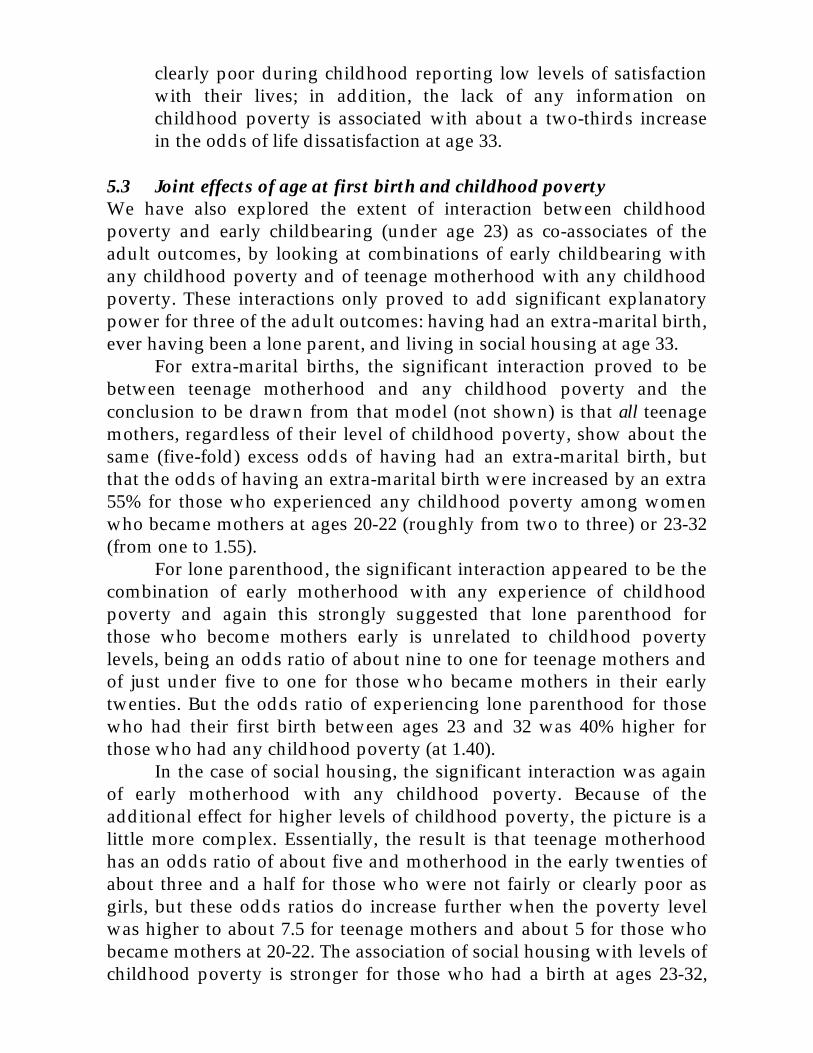
clearly poor during childhood reporting low levels of satisfactionwith their lives; in addition, the lack of any information onchildhood poverty is associated with about a two-thirds increasein the odds of life dissatisfaction at age 33.
5.3 Joint effects of age at first birth and childhood povertyWe have also explored the extent of interaction between childhoodpoverty and early childbearing (under age 23) as co-associates of theadult outcomes, by looking at combinations of early childbearing withany childhood poverty and of teenage motherhood with any childhoodpoverty. These interactions only proved to add significant explanatorypower for three of the adult outcomes: having had an extra-marital birth,ever having been a lone parent, and living in social housing at age 33.
For extra-marital births, the significant interaction proved to bebetween teenage motherhood and any childhood poverty and theconclusion to be drawn from that model (not shown) is that all teenagemothers, regardless of their level of childhood poverty, show about thesame (five-fold) excess odds of having had an extra-marital birth, butthat the odds of having an extra-marital birth were increased by an extra55% for those who experienced any childhood poverty among womenwho became mothers at ages 20-22 (roughly from two to three) or 23-32(from one to 1.55).
For lone parenthood, the significant interaction appeared to be thecombination of early motherhood with any experience of childhoodpoverty and again this strongly suggested that lone parenthood forthose who become mothers early is unrelated to childhood povertylevels, being an odds ratio of about nine to one for teenage mothers andof just under five to one for those who became mothers in their earlytwenties. But the odds ratio of experiencing lone parenthood for thosewho had their first birth between ages 23 and 32 was 40% higher forthose who had any childhood poverty (at 1.40).
In the case of social housing, the significant interaction was againof early motherhood with any childhood poverty. Because of theadditional effect for higher levels of childhood poverty, the picture is alittle more complex. Essentially, the result is that teenage motherhoodhas an odds ratio of about five and motherhood in the early twenties ofabout three and a half for those who were not fairly or clearly poor asgirls, but these odds ratios do increase further when the poverty levelwas higher to about 7.5 for teenage mothers and about 5 for those whobecame mothers at 20-22. The association of social housing with levels ofchildhood poverty is stronger for those who had a birth at ages 23-32,
with the baseline odds of 1.00 rising to 1.59 for any experience ofchildhood poverty and further to 2.27 for those who were fairly orclearly poor as children.
6 Summary
6.1 Main findingsWe have shown that there are clear and statistically strongly significantassociations for a range of adult outcomes with age at first birth, evenafter controlling for levels of childhood poverty and a very wide rangeof other childhood background factors. Moreover, we havedemonstrated that the widest gulf in adult outcomes occurs for thosewho enter motherhood early (before age 23), though further reinforcedfor teenage motherhood for most adult outcomes. We have also shownthat it is any experience of childhood poverty that is most clearlyassociated with adverse outcomes in adulthood, with additionalreinforcement for higher levels of childhood poverty only beingsignificant for a few outcomes.
In broad terms and given the limitations of sample size, we foundlittle evidence to suggest that there were further differences in the oddsof adult outcomes for more detailed sub-division of ages at birth(explicitly 23-26 and 27-32, and under 18). We also find some evidence ofinteractions of any experience of childhood poverty with earlychildbearing for three outcomes (extra-marital birth, lone parenthood,and living in social housing), with the results pointing towards age atfirst birth effects dominating childhood poverty effects for earlier ages atfirst birth, but with childhood poverty effects having an impact for thosewho entered motherhood later; these results correspond quite well withthose shown in raw form, without other childhood controls, in Table 3.
Much discussion of consequences of early motherhood focuses onteenage mothers. The results presented here show a clear contrastbetween those who become mothers before age 23 with those who donot. For young women in particular, it is probable that early parenthoodis directly implicated in the genesis of adverse outcomes later in life,through limiting opportunities and choices. Early births are more likelyto have taken place outside marriage and there is also ample evidencethat early partnerships are much more likely to break down. Both ofthese factors are clearly implicated in much higher risks of havingexperienced lone parenthood by age 33. It is generally young mothers,rather than young fathers, who are the lone parents. Early parenthood is
also more likely to precipitate an entry into social housing and to limitemployment and career opportunities. Teenage motherhood is clearlyeven more strongly related to these factors.
Early motherhood is also closely associated with lack ofqualifications, although we fully realise that failure at school (surely wellcaptured by the combined test scores) often occurs before entry intomotherhood; what is perhaps surprising, in view of the explanatorypower of the childhood variables for lack of qualifications at age 33, isthat there still remains a clear association with early parenthood.
In addition, we find that early mothers are also more likely to be inreceipt of non-universal benefits, even at age 33 – at least ten years afterthe first birth for all early mothers and more than 13 years later forteenage mothers. Young mothers are also shown to be considerablymore likely to have low household income at age 33, and to lack atelephone in the household: both are probably important elements ofbeing socially excluded. Moreover, early childbearing is also clearlyassociated with poorer physical and mental health at age 33, which iswell after the entry into motherhood. We cannot claim that all of theseassociations with early parenthood are directly or only the result of earlychildbearing, since no other adult pathways are included in our models,but we can be reasonably confident that these associations arose duringadulthood, given the powerful range of childhood controls used in ourmodels.
6.2 Across the ‘Great Divides’: early motherhood and any childhoodpoverty
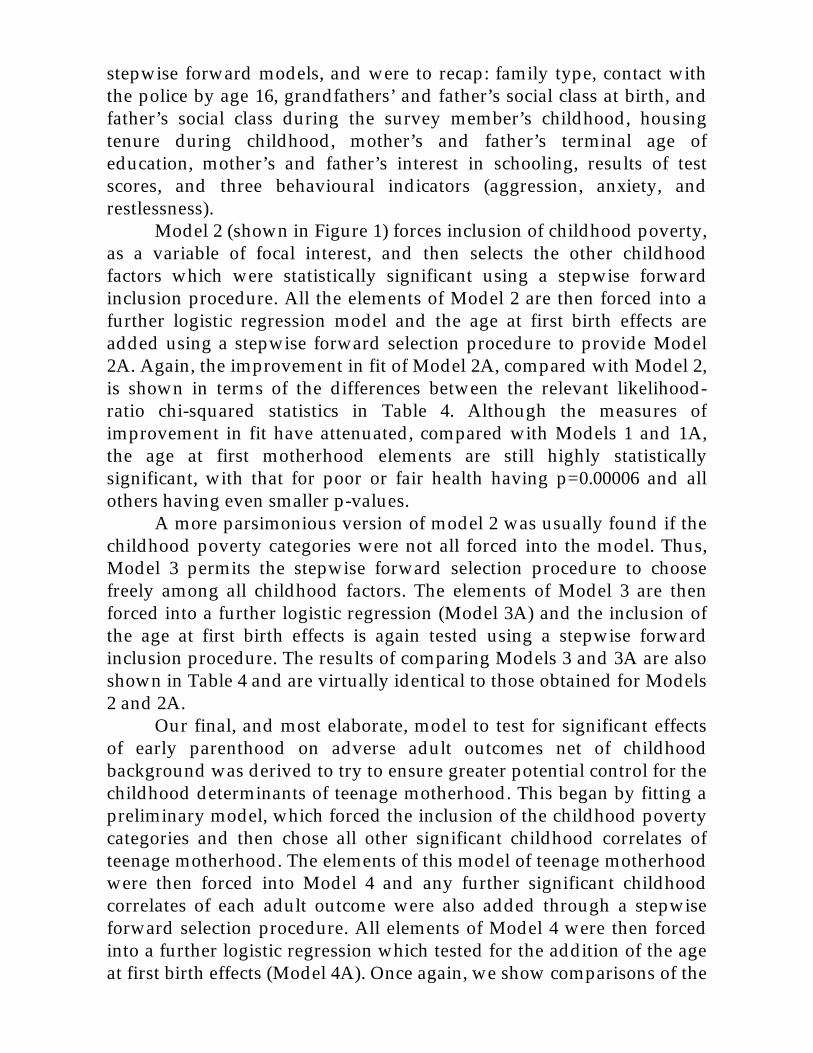
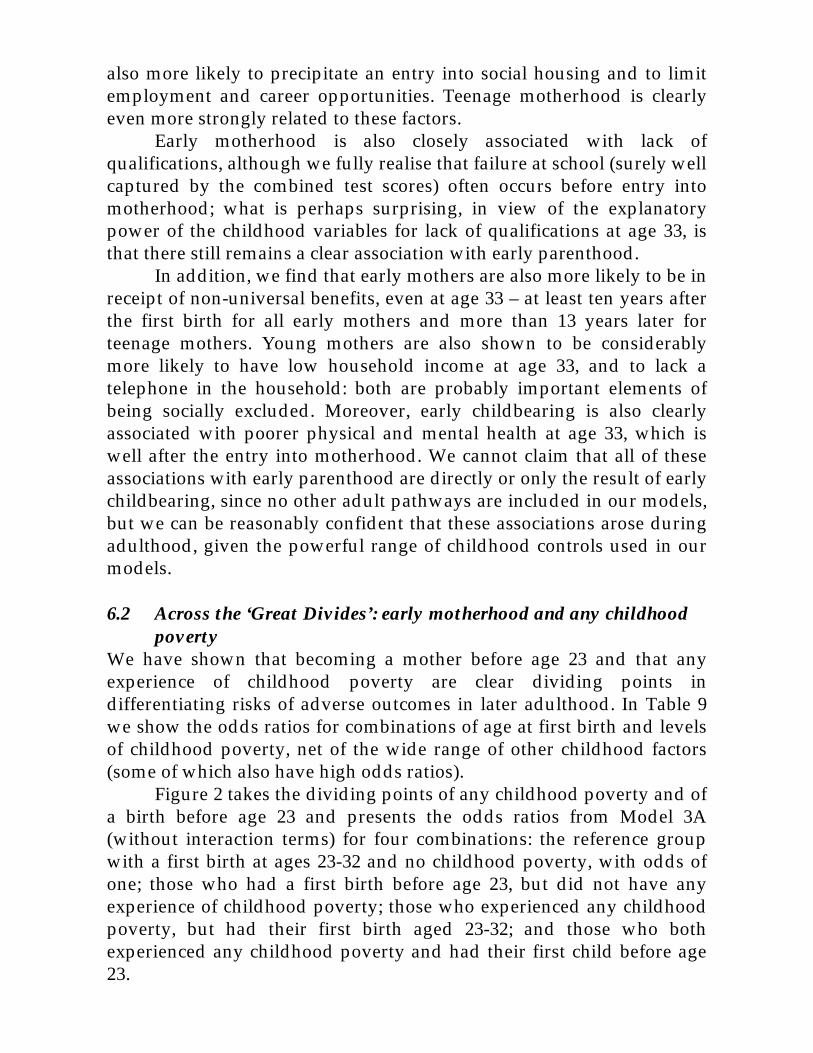
We have shown that becoming a mother before age 23 and that anyexperience of childhood poverty are clear dividing points indifferentiating risks of adverse outcomes in later adulthood. In Table 9we show the odds ratios for combinations of age at first birth and levelsof childhood poverty, net of the wide range of other childhood factors(some of which also have high odds ratios).
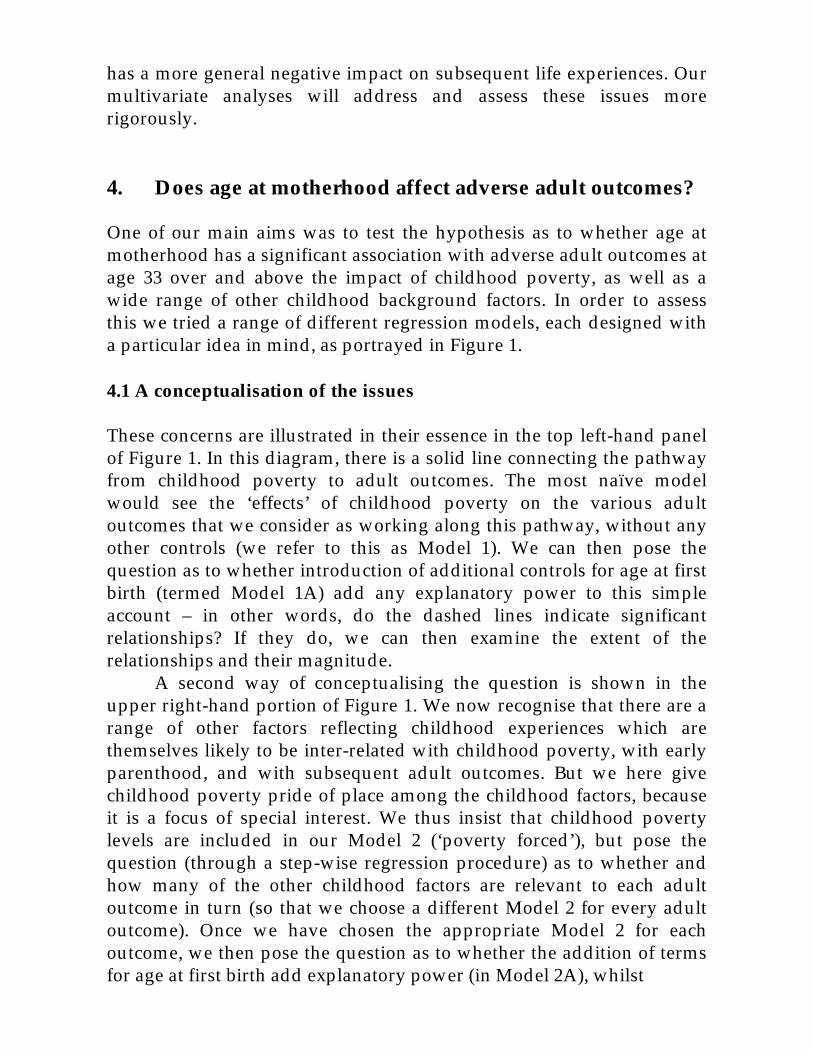
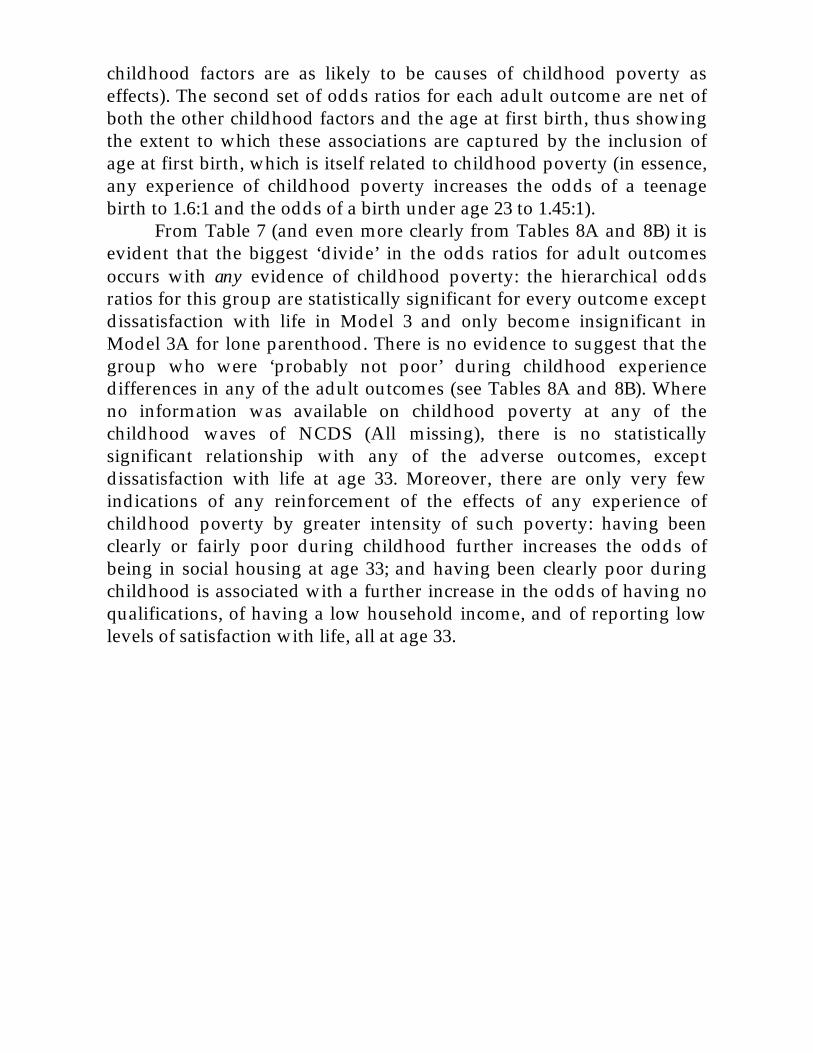
Figure 2 takes the dividing points of any childhood poverty and ofa birth before age 23 and presents the odds ratios from Model 3A(without interaction terms) for four combinations: the reference groupwith a first birth at ages 23-32 and no childhood poverty, with odds ofone; those who had a first birth before age 23, but did not have anyexperience of childhood poverty; those who experienced any childhoodpoverty, but had their first birth aged 23-32; and those who bothexperienced any childhood poverty and had their first child before age23.
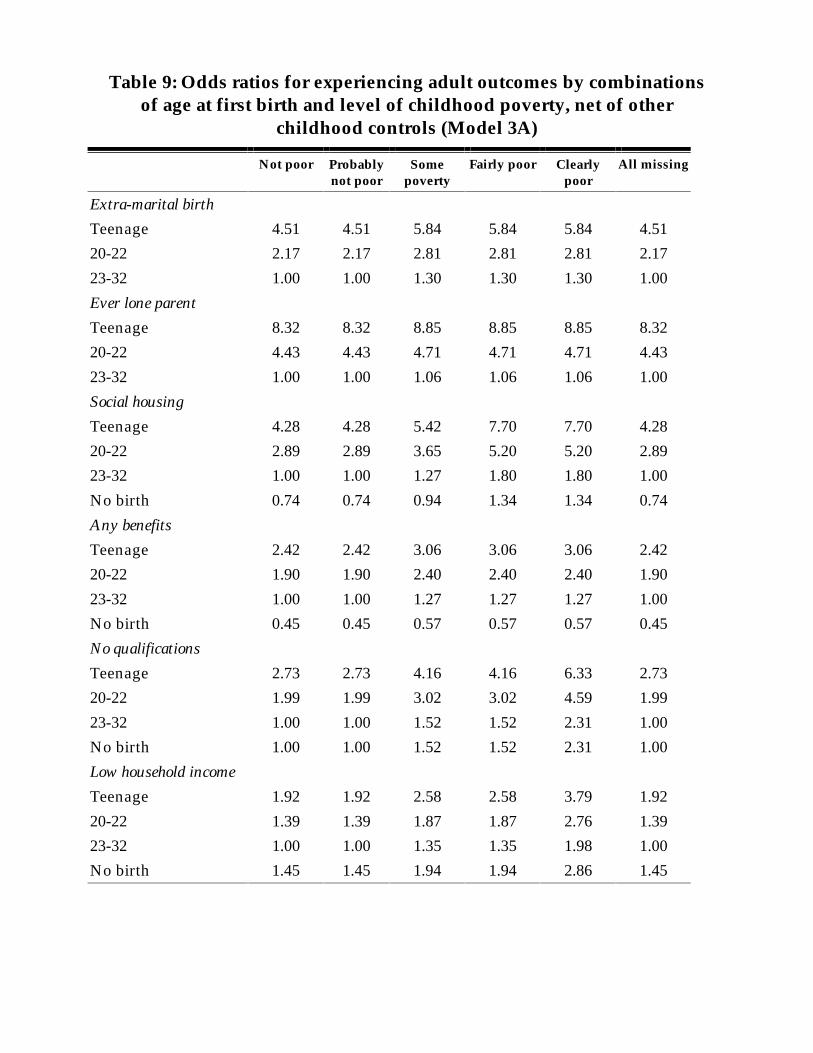
Table 9: Odds ratios for experiencing adult outcomes by combinationsof age at first birth and level of childhood poverty, net of other
childhood controls (Model 3A)
Not poor Probablynot poor
Somepoverty
Fairly poor Clearlypoor
All missing
Extra-marital birth
Teenage 4.51 4.51 5.84 5.84 5.84 4.51
20-22 2.17 2.17 2.81 2.81 2.81 2.17
23-32 1.00 1.00 1.30 1.30 1.30 1.00
Ever lone parent
Teenage 8.32 8.32 8.85 8.85 8.85 8.32
20-22 4.43 4.43 4.71 4.71 4.71 4.43
23-32 1.00 1.00 1.06 1.06 1.06 1.00
Social housing
Teenage 4.28 4.28 5.42 7.70 7.70 4.28
20-22 2.89 2.89 3.65 5.20 5.20 2.89
23-32 1.00 1.00 1.27 1.80 1.80 1.00
No birth 0.74 0.74 0.94 1.34 1.34 0.74
Any benefits
Teenage 2.42 2.42 3.06 3.06 3.06 2.42
20-22 1.90 1.90 2.40 2.40 2.40 1.90
23-32 1.00 1.00 1.27 1.27 1.27 1.00
No birth 0.45 0.45 0.57 0.57 0.57 0.45
No qualifications
Teenage 2.73 2.73 4.16 4.16 6.33 2.73
20-22 1.99 1.99 3.02 3.02 4.59 1.99
23-32 1.00 1.00 1.52 1.52 2.31 1.00
No birth 1.00 1.00 1.52 1.52 2.31 1.00
Low household income
Teenage 1.92 1.92 2.58 2.58 3.79 1.92
20-22 1.39 1.39 1.87 1.87 2.76 1.39
23-32 1.00 1.00 1.35 1.35 1.98 1.00
No birth 1.45 1.45 1.94 1.94 2.86 1.45
No telephone
Teenage 2.21 2.21 4.04 4.04 4.04 2.21
20-22 2.21 2.21 4.04 4.04 4.04 2.21
23-32 1.00 1.00 1.83 1.83 1.83 1.00
No birth 1.00 1.00 1.83 1.83 1.83 1.00
General ill-health
Teenage 1.42 1.42 1.74 1.74 1.74 1.42
20-22 1.42 1.42 1.74 1.74 1.74 1.42
23-32 1.00 1.00 1.23 1.23 1.23 1.00
No birth 1.00 1.00 1.23 1.23 1.23 1.00
Current smoker
Teenage 2.45 2.45 3.07 3.07 3.07 2.45
20-22 1.86 1.86 2.33 2.33 2.33 1.86
23-32 1.00 1.00 1.25 1.25 1.25 1.00
No birth 1.40 1.40 1.75 1.75 1.75 1.40
Malaise
Teenage 1.86 1.86 2.66 2.66 2.66 1.86
20-22 1.86 1.86 2.66 2.66 2.66 1.86
23-32 1.00 1.00 1.43 1.43 1.43 1.00
No birth 1.00 1.00 1.43 1.43 1.43 1.00
Unsatisfactory life
Teenage 1.46 1.46 1.46 1.46 2.03 2.42
20-22 1.46 1.46 1.46 1.46 2.03 2.42
23-32 1.00 1.00 1.00 1.00 1.39 1.65
No birth 1.34 1.34 1.34 1.34 1.86 2.22

30
Figure 2: Across the Great Divides: Early Motherhood and Any Childhood Poverty
0.00 0.50 1.00 1.50 2.00 2.50 3.00 3.50 4.00 4.50 5.00
Extra-marital Birth
Ever Lone Parent
Living in Social Housing
Claiming Benefits
No Qualifications
Low Household Income
No Telephone
General Ill Health
Current Smoker
Malaise
Life Unsatisfactory
Adu
lt O
utco
mes
Odds of experiencing
Some Childhood Poverty &First Birth Before 23
Some Childhood Poverty,First Birth 23-32
First Birth Before 23, NoChildhood Poverty
Linear (No ChildhoodPoverty, First Birth 23-32)
31
Figure 3: At the Extremes: Teenage Motherhood and Clear Childhood Poverty
0.00 1.00 2.00 3.00 4.00 5.00 6.00 7.00 8.00 9.00 10.00
Extra-marital Birth
Ever Lone Parent
Living in Social Housing
Claiming Benefits
No Qualifications
Low Household Income
No Telephone
General Ill Health
Current Smoker
Malaise
Life Unsatisfactory
Adu
lt O
utco
mes
Odds of Experiencing
Clear Childhood Poverty &Teenage Mother
Clear Childhood Poverty, FirstBirth 23-32
Teenage Mother, NoChildhood Poverty
Linear (No Childhood Poverty,First Birth 23-32)

32
The first striking feature of Figure 2 is that an early first birthwithout childhood poverty has a higher odds ratio for every adultoutcome than does experience of any childhood poverty with a laterbirth: this is especially true for the demographic outcomes, the welfareoutcomes, and current smoking; the differences are smaller forhousehold income and access to a telephone.
Although the effects of childhood poverty are generally weaker,they nevertheless reinforce the effects of age at first birth to generatequite sizeable odds ratios for the combination: early mothers who werepoor sometime during childhood are over four times as likely to havebeen a lone parent and to lack a telephone in their household; over threetimes as likely to live in social housing and to have no qualifications;more than twice as likely to have had an extra-marital birth, be claimingnon-universal benefits, to be cigarette smokers, and to have high malaisescores.
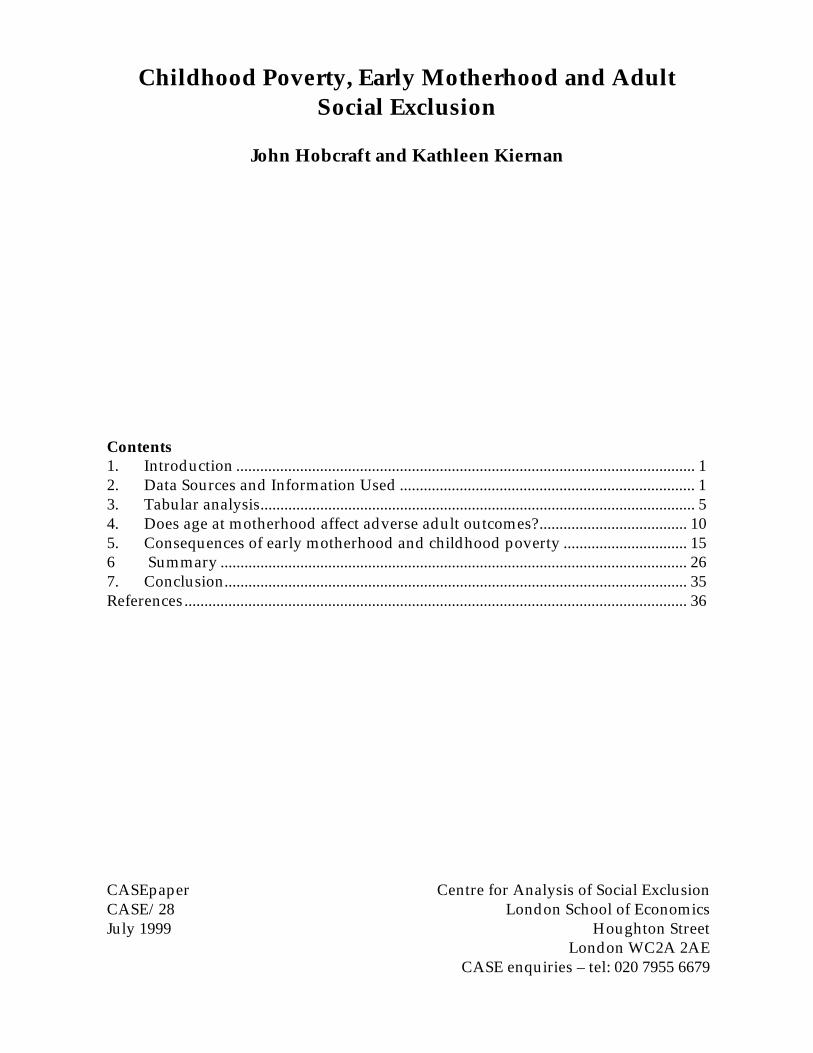
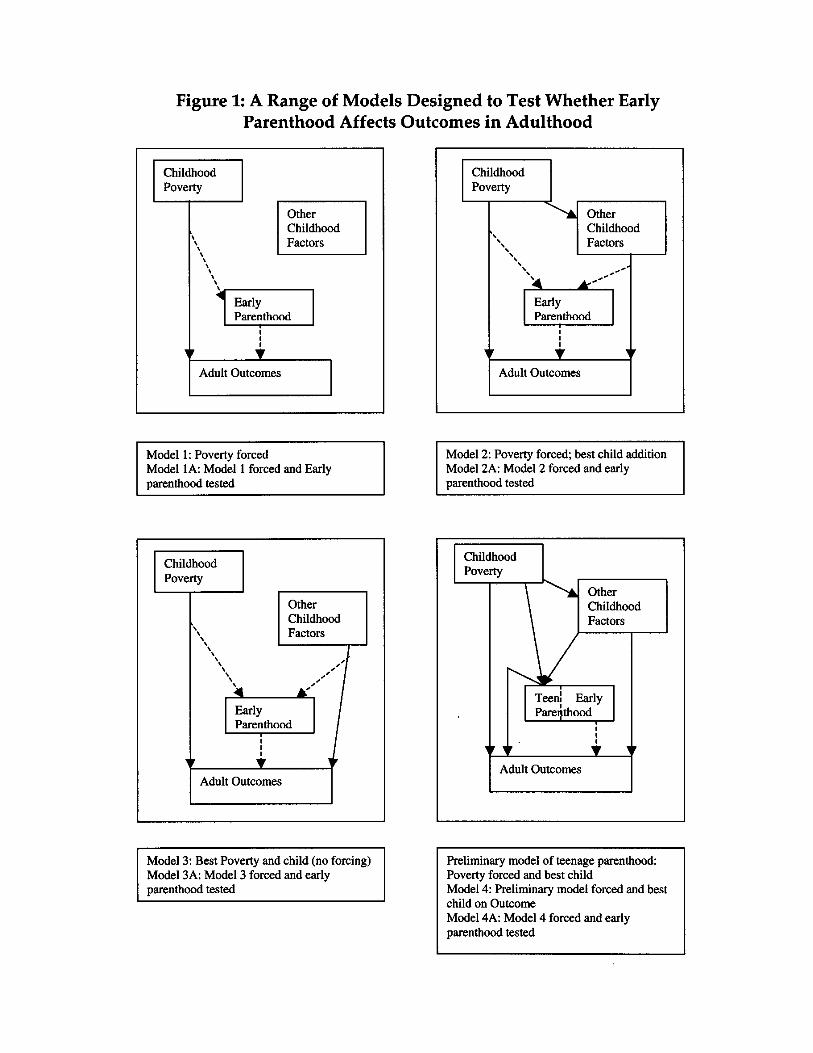
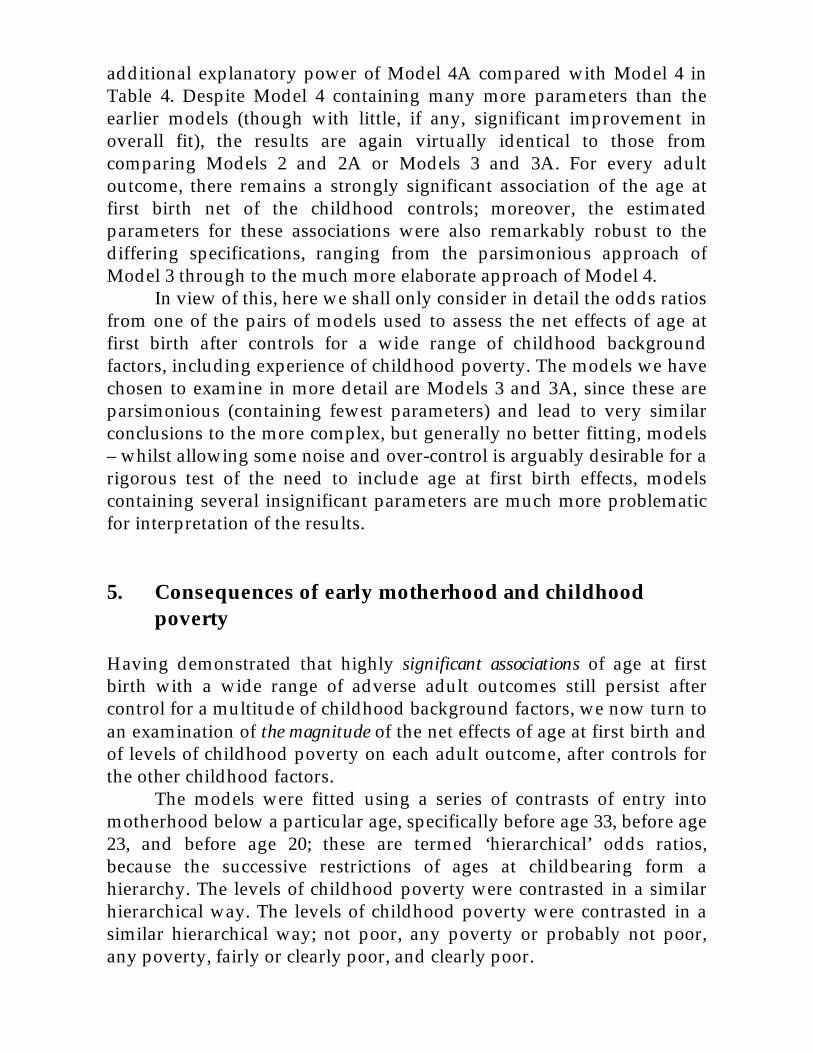
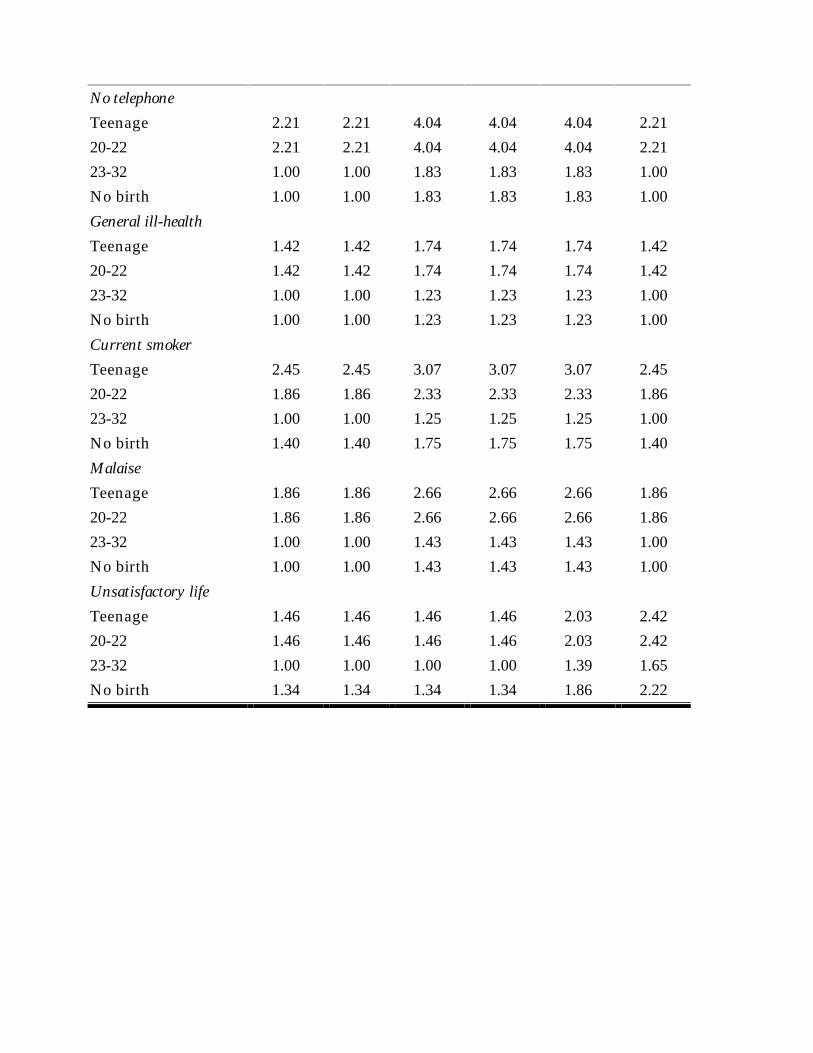
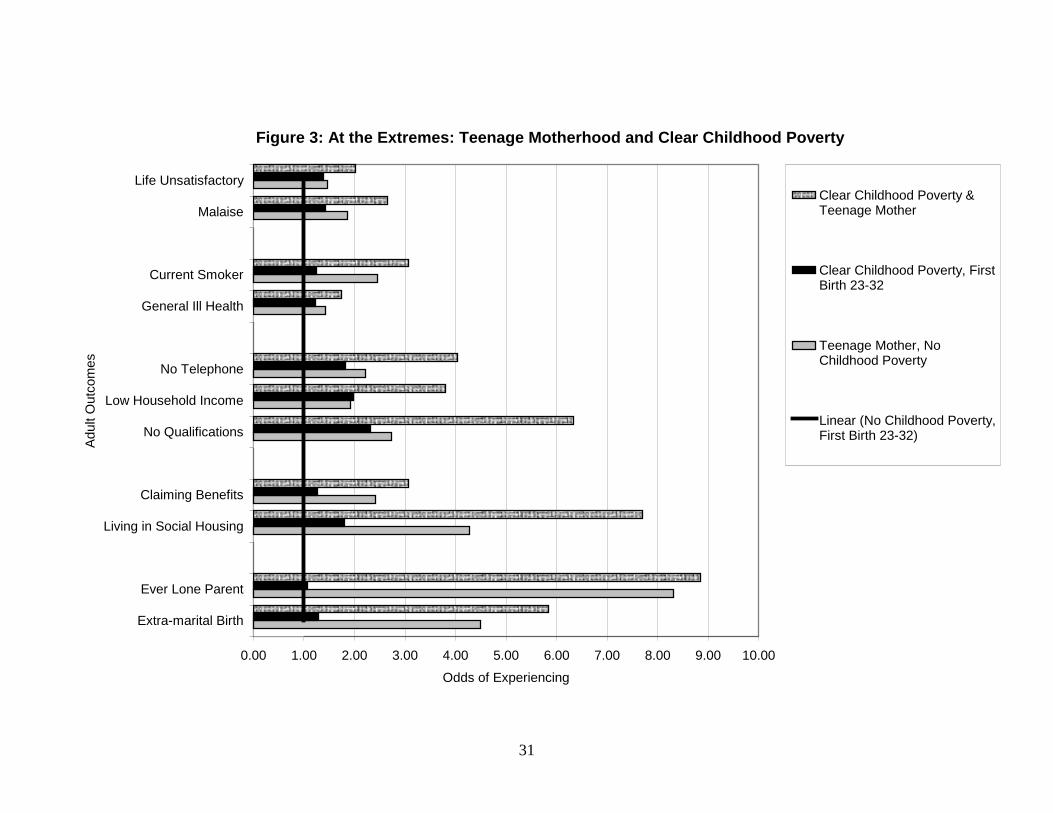
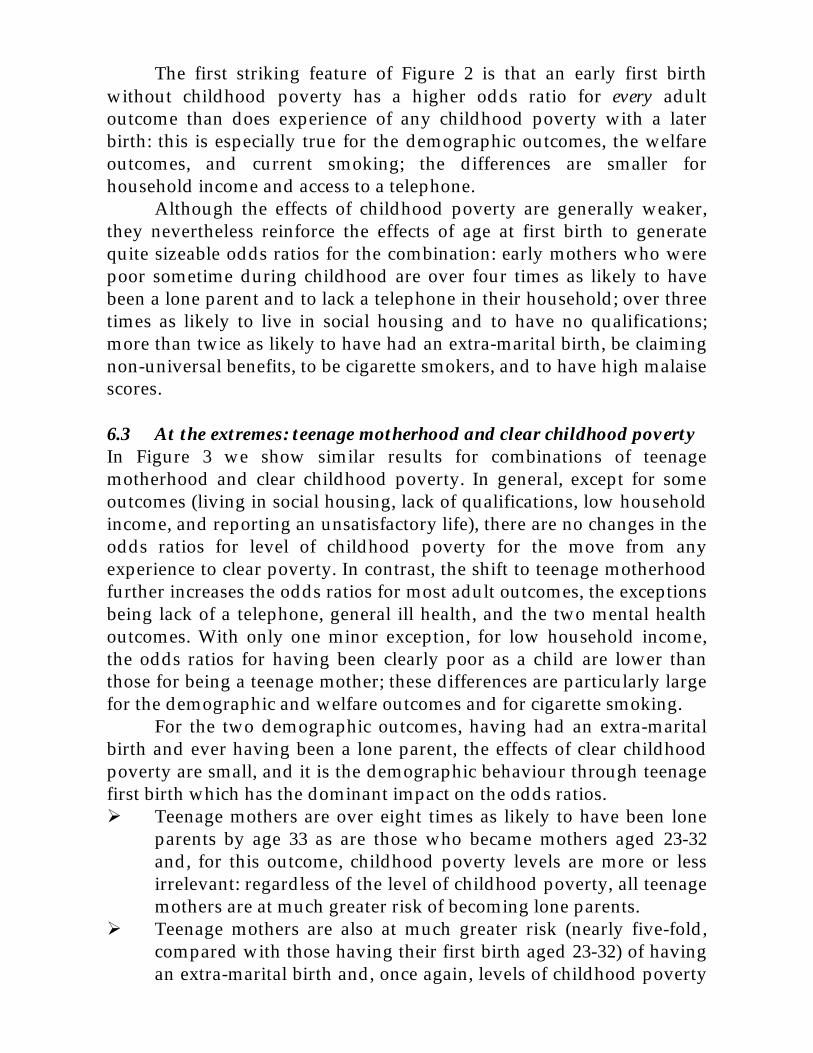
6.3 At the extremes: teenage motherhood and clear childhood povertyIn Figure 3 we show similar results for combinations of teenagemotherhood and clear childhood poverty. In general, except for someoutcomes (living in social housing, lack of qualifications, low householdincome, and reporting an unsatisfactory life), there are no changes in theodds ratios for level of childhood poverty for the move from anyexperience to clear poverty. In contrast, the shift to teenage motherhoodfurther increases the odds ratios for most adult outcomes, the exceptionsbeing lack of a telephone, general ill health, and the two mental healthoutcomes. With only one minor exception, for low household income,the odds ratios for having been clearly poor as a child are lower thanthose for being a teenage mother; these differences are particularly largefor the demographic and welfare outcomes and for cigarette smoking.
For the two demographic outcomes, having had an extra-maritalbirth and ever having been a lone parent, the effects of clear childhoodpoverty are small, and it is the demographic behaviour through teenagefirst birth which has the dominant impact on the odds ratios.� Teenage mothers are over eight times as likely to have been lone
parents by age 33 as are those who became mothers aged 23-32and, for this outcome, childhood poverty levels are more or lessirrelevant: regardless of the level of childhood poverty, all teenagemothers are at much greater risk of becoming lone parents.
� Teenage mothers are also at much greater risk (nearly five-fold,compared with those having their first birth aged 23-32) of havingan extra-marital birth and, once again, levels of childhood poverty

are relatively unimportant, as became especially clear wheninteraction terms were included in our models.For the welfare related outcomes, it is again a teenage first birth
which dominates the effects of childhood poverty, with particularlystrong associations for social housing.� In Figure 3, we see that having been a teenage mother, but not
poor during childhood raises the risk of being in social housing atage 33 more than four-fold (compared with a first birth aged 23-32); having been clearly poor as a child almost doubles the risk ofbeing in social housing at age 33 (compared with no experience ofchildhood poverty); the combination of clear poverty duringchildhood and teenage motherhood is thus associated with a neareight-fold risk of being in social housing, many years after theteenage birth.
� Moreover, teenage motherhood is also associated with two-and-a-half times the risk of claiming non-universal benefits at least 13years later; once again, this is only mildly reinforced by experienceof childhood poverty (a 27%) increase, leading to tripling of risk ofbeing on benefits at age 33 for the poorest girls who also becameteenage mothers.The next cluster of outcomes at age 33 that we consider are lack of
qualifications, low household income, and lack of a telephone in thehousehold; these thus represent lack of human capital, adult poverty,and a combination of poverty and social isolation, respectively. For allthree of these outcomes the excess risks associated with clear childhoodpoverty and with teenage motherhood are of similar magnitude,involving an approximate doubling of risk for either (compared with thebaseline groups of no childhood poverty and of having a first birth aged23-32), though slightly higher for lack of qualifications.� Given that the results are net of educational test scores during
childhood and parental interest in education, among othercontrols, it is remarkable that strong associations of lack ofqualifications at age 33 persist both for those who experiencedclear childhood poverty and for those who became teenagemothers. Teenage mothers were 2.7 times as likely to lackqualifications at age 33, though this may cause as much as effect;the poorest girls were 2.3 times as likely to lack qualifications; incombination, these two factors were associated with over six timesthe risk of being unqualified at age 33.
� Net of all other childhood factors, teenage mothers or girls whogrew up in poverty are both about twice as likely (as those who
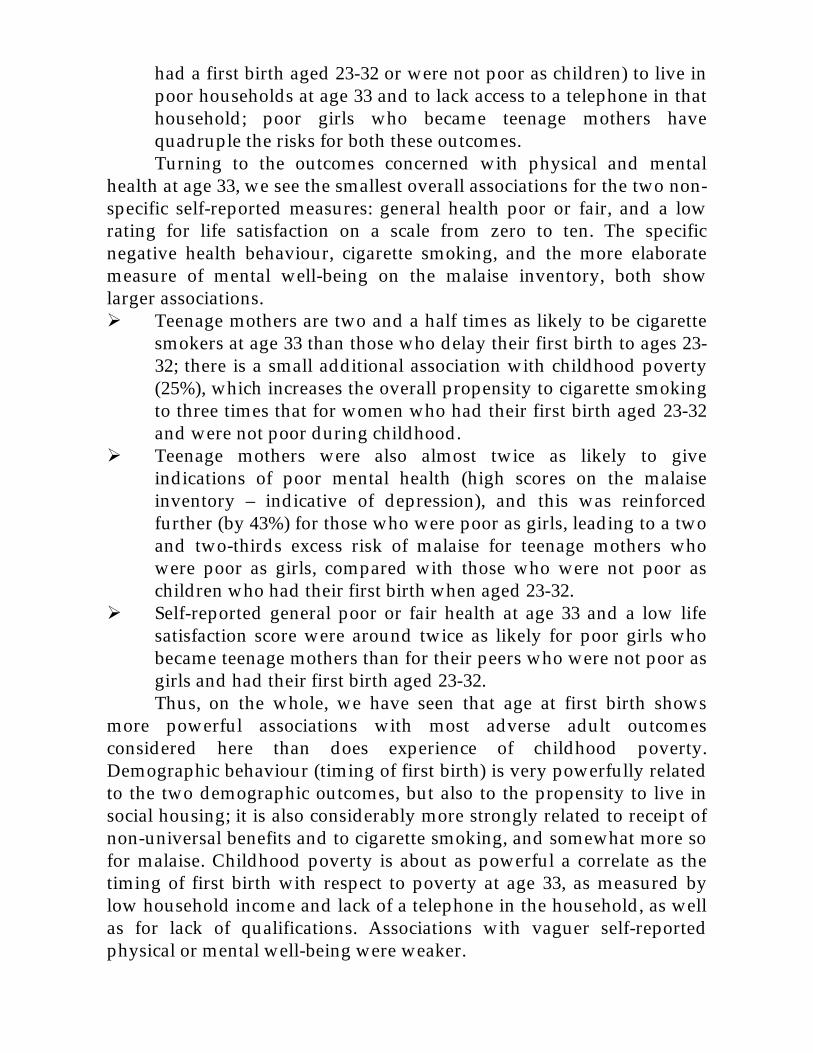
had a first birth aged 23-32 or were not poor as children) to live inpoor households at age 33 and to lack access to a telephone in thathousehold; poor girls who became teenage mothers havequadruple the risks for both these outcomes.Turning to the outcomes concerned with physical and mental
health at age 33, we see the smallest overall associations for the two non-specific self-reported measures: general health poor or fair, and a lowrating for life satisfaction on a scale from zero to ten. The specificnegative health behaviour, cigarette smoking, and the more elaboratemeasure of mental well-being on the malaise inventory, both showlarger associations.� Teenage mothers are two and a half times as likely to be cigarette
smokers at age 33 than those who delay their first birth to ages 23-32; there is a small additional association with childhood poverty(25%), which increases the overall propensity to cigarette smokingto three times that for women who had their first birth aged 23-32and were not poor during childhood.
� Teenage mothers were also almost twice as likely to giveindications of poor mental health (high scores on the malaiseinventory – indicative of depression), and this was reinforcedfurther (by 43%) for those who were poor as girls, leading to a twoand two-thirds excess risk of malaise for teenage mothers whowere poor as girls, compared with those who were not poor aschildren who had their first birth when aged 23-32.
� Self-reported general poor or fair health at age 33 and a low lifesatisfaction score were around twice as likely for poor girls whobecame teenage mothers than for their peers who were not poor asgirls and had their first birth aged 23-32.Thus, on the whole, we have seen that age at first birth shows
more powerful associations with most adverse adult outcomesconsidered here than does experience of childhood poverty.Demographic behaviour (timing of first birth) is very powerfully relatedto the two demographic outcomes, but also to the propensity to live insocial housing; it is also considerably more strongly related to receipt ofnon-universal benefits and to cigarette smoking, and somewhat more sofor malaise. Childhood poverty is about as powerful a correlate as thetiming of first birth with respect to poverty at age 33, as measured bylow household income and lack of a telephone in the household, as wellas for lack of qualifications. Associations with vaguer self-reportedphysical or mental well-being were weaker.
Although the effects of childhood poverty are generally weaker,they nevertheless reinforce the effects of age at first birth to generatequite sizeable odds ratios for the combination. Teenage mothers whowere clearly poor during childhood are: over eight times as likely tohave been a lone parent; over seven times as likely to live in socialhousing; about six times as likely to have no qualifications and to havehad an extra-marital birth; about four times as likely to lack a telephonein their household and to have low household income; over three timesas likely to be in receipt of non-universal benefits and to be currentsmokers ; and more than twice as likely to have high malaise scores andto report their lives as unsatisfactory.
7. Conclusion
From our analyses it is tempting to draw the conclusion that childhoodpoverty begets adult poverty (including lack of human capital) and thatdemography begets demography. However, the power of theassociations of age at first birth with both living in social housing andreceipt of non-universal benefits at age 33, as well as the equality of theodds ratios for age at first birth with those for childhood poverty onadult poverty, no telephone, and lack of qualifications, does suggest thatearly childbearing has more profound and far-reaching consequences forthe lives of the women involved. Early parenthood for young women islikely to have much more direct implications for lack of opportunity andchoice than for young men. Whilst we have not here examined thesubsequent pathways into adult social exclusion for early mothers, theassociations found in this study are often very powerful indeed.
References
CASE and HM Treasury (1999), Persistent Poverty and Lifetime Inequality:The Evidence, CASEreport 5 and HM Treasury Occasional Paper,No.10. London: CASE and HM Treasury.
Ferri, E (ed) (1993), Life at 33: The fifth follow-up of the National ChildDevelopment Study. London: National Children’s Bureau.
Gregg, P, Harkness, S, Machin, S and Thomas, J (1999), Child Developmentand Family Income. York: Joseph Rowntree Foundation.
HM Treasury (1999), Tackling Poverty and Extending Opportunity. London:HM Treasury.
Hobcraft, JN (1998), Intergenerational and Life-Course Transmission of SocialExclusion: Influences of Childhood Poverty, Family Disruption, andContact with the Police, CASEpaper 15, Centre for Analysis of SocialExclusion. London: London School of Economics.
Kiernan, KE (1980), “Teenage motherhood: Associated factors andconsequences”, Journal of Biosocial Science, 12(4).
Kiernan, KE (1995), Transition to parenthood: Young mothers, young fathers:associated factors and later life experiences, STICERD DiscussionPaper WSP/113. London: London School of Economics.
Kiernan, KE (1997), “Becoming a Young Parent: A longitudinal study ofassociated factors”, British Journal of Sociology, 48(3).
Richman, N (1978), “Depression in mothers of young children”, Journal ofthe Royal Society of Medicine, 71: 489-493.
Rutter, M, Tizard, J and Whitmore, K (1970), Education, Health andBehaviour. London: Longman.
Rutter, M, Tizard, J and Graham, P (1976), “Isle of Wight Studies: 1964-1974”, Psychological Medicine, 16: 689-700.
Social Exclusion Unit (1999), Teenage Pregnancy, Cm 4342. London: TSO.
Wadsworth, MEJ (1991), The Imprint of Time: Childhood History and AdultLife. Oxford: Clarendon Press.