Child poverty transitions · NatCen Social Research, working on quantitative analysis projects....
159
Child poverty transitions Exploring the routes into and out of child poverty, 2009–2012 June 2015
Transcript of Child poverty transitions · NatCen Social Research, working on quantitative analysis projects....
Child poverty transitionsExploring the routes into and out of child poverty, 2009–2012
June 2015

Research Report No 900
A report of research carried out by City University London and NatCen on behalf of the Department for Work and Pensions
© Crown copyright 2015.
You may re-use this information (not including logos) free of charge in any format or medium, under the terms of the Open Government Licence. To view this licence, visit http://www.nationalarchives.gov.uk/doc/open-government-licence/ or write to the Information Policy Team, The National Archives, Kew, London TW9 4DU, or email: [email protected].
This document/publication is also available on our website at: https://www.gov.uk/government/organisations/department-for-work-pensions/about/research#research-publications
If you would like to know more about DWP research, please email: [email protected]
First published 2015
ISBN 978 1 910219 75 1
Views expressed in this report are not necessarily those of the Department for Work and Pensions or any other Government Department.
3
Child poverty transitions
ContentsAcknowledgements ................................................................................................................. 9
The Authors ........................................................................................................................... 10
Executive summary ...............................................................................................................11
1 Introduction ...................................................................................................................... 19
1.1 Background ........................................................................................................... 19
1.2 Existing evidence .................................................................................................. 19
1.3 Aims and objectives .............................................................................................. 22
2 Methodology .................................................................................................................... 23
2.1 The data ................................................................................................................ 23
2.2 Measuring poverty ................................................................................................. 24
2.2.1 Estimating child poverty in USoc ............................................................ 24
2.2.2 Poverty transitions .................................................................................. 26
2.3 Risk events and risk factors .................................................................................. 28
2.4 Statistical analysis ................................................................................................. 30
3 Entries into child poverty ................................................................................................. 33
3.1 Income changes on entering poverty .................................................................... 33
3.2 Which children are most likely to enter poverty? ................................................... 34
3.2.1 Does poverty entry vary by ethnicity? ..................................................... 43
3.3 Entering poverty from employment ....................................................................... 44
3.3.1 Type of work ........................................................................................... 46
3.3.2 Having multiple poverty risks .................................................................. 50
3.4 The risk of poverty for new families: Evidence from the Millennium Cohort Study ....................................................................................... 52
3.4.1 Rates of poverty ...................................................................................... 53
3.4.2 New lone parent families......................................................................... 55
3.4.3 Family work patterns in new families ...................................................... 55
3.4.4 Mothers’ plans for future work ................................................................. 57
3.4.5 Did mothers return to work?.................................................................... 57
3.5 Summary ............................................................................................................... 59
4
Child poverty transitions
4 Exits out of poverty .......................................................................................................... 60
4.1 Income changes on exiting poverty ....................................................................... 60
4.2 Which children are most likely to exit poverty? ..................................................... 61
4.2.1 Does poverty exit vary by ethnicity? ....................................................... 69
4.3 Exiting poverty through employment ..................................................................... 71
4.3.1 Working families and poverty exits ......................................................... 71
4.3.2 Gaining employment and exiting poverty ................................................ 75
4.4 What is the childcare use of families that exit poverty? ......................................... 77
4.4.1 Findings .................................................................................................. 78
4.5 Summary ............................................................................................................... 80
5 Conclusions ..................................................................................................................... 81
5.1 Summary of main findings ..................................................................................... 81
5.1.1 Poverty entry and exit rates and income changes .................................. 81
5.1.2 Labout market events ............................................................................. 81
5.1.3 Household events ................................................................................... 83
5.1.4 Ethnicity .................................................................................................. 84
5.2 What has changed since before the recession? ................................................... 85
5.2.1 Further research ..................................................................................... 86
Appendix A Imputing Understanding Society income data .................................................. 88
Appendix B Analysis tables ............................................................................................... 106
References .......................................................................................................................... 158
List of tablesTable 2.1 Income poverty threshold for different family types .......................................... 25
Table 3.1 Child poverty entry rate by economic risk factors and events .......................... 36
Table 3.2 Child poverty entry rate by household characteristics and events ................... 41
Table 3.3 Child poverty entry rate by economic characteristics for families initially in work .................................................................................................. 48
Table 3.4 Multiple risk events/factors associated with child poverty entry for families initially in work .................................................................................................. 50
Table 4.1 Poverty exit rate by economic risk factors and events ..................................... 63
5
Child poverty transitions
Table 4.2 Poverty exit rate by household risk factors and events .................................... 66
Table 4.3 Multiple risk factors and events associated with poverty ................................. 68
Table 4.4 Economic factors for families initially in work ................................................... 75
Table A.1 The USoc income data ..................................................................................... 91
Table A.2 Comparison of USoc with FRS ........................................................................ 92
Table A.3 Option 1 – Reverse dependent interviewing imputation ................................... 93
Table A.4 Option 2 – Full reverse imputation ................................................................... 94
Table A.5 Eligibility rules .................................................................................................. 95
Table A.6 Option 3 – Targeted reverse imputation ........................................................... 97
Table A.7 Comparing the results of the different imputation methods .............................. 98
Table A.8 Number and % of adults affected ..................................................................... 99
Table A.9 Monetary amount ........................................................................................... 102
Table A.10 Income distribution ......................................................................................... 104
Table A.11 Two-wave transitions, NOT including 10 per cent rule ................................... 104
Table A.12 Two-wave transitions, including 10 per cent rule ........................................... 104
Table A.13 Two-wave transitions using absolute poverty measure, including 10% rule .......................................................................................... 105
Table A.14 Three-wave count .......................................................................................... 105
Table A.15 Child characteristics (wave one) .................................................................... 106
Table A.16 Cross-sectional poverty rate (first wave) by child characteristics (first wave) ...................................................................................................... 108
Table A.17 Two-year poverty status by child characteristics (first wave) ......................... 109
Table A.18 Income changes on entering poverty by work status ......................................111
Table A.19 Poverty risk and poverty entry rate by child characteristics ............................ 111
Table A.20 Conditional entry rate, prevalence, share of entries by family type (d-dynamic), number of children (d), age of youngest child (d), ethnicity .......114
Table A.21 Conditional entry rate, prevalence, share of entries by economic activity status (d), long-term worklessness, income sources (d), tenure .....................115
Table A.22 Conditional entry rate, prevalence, share of entries by highest qualification, health (d) ....................................................................................117
Table A.23 Conditional entry rate, prevalence, share of entries mirrors LID table 11.1 ..................................................................................................118
6
Child poverty transitions
Table A.24 Conditional entry rate, prevalence, share of entries by count of significant factors and selected combinations of significant factors ................119
Table A.25 Conditional entry rate, prevalence, share of entries by risk events and number of risk events .............................................................................. 120
Table A.26 Regression model of poverty entry for all children ......................................... 122
Table A.27 Regression model of poverty entry for children in each ethnic group ............ 125
Table A.28 Poverty risk and poverty entry rate by SIC, SOC, contract type, children in families in work in first wave ......................................................... 126
Table A.29 Conditional entry rate, prevalence, share of entries by SIC, SOC, contract type, children in families in work in first wave ................................... 127
Table A.30 Conditional entry rate, prevalence, share of entries by risk events and number of risk events, for children in working families in the first wave ......... 128
Table A.31 Regression model of poverty entry for all children initially in in-work families .............................................................................................. 129
Table A.32 Risk of poverty by family characteristics (MCS) ............................................. 132
Table A.33 Characteristics of new lone parent families (MCS) ........................................ 133
Table A.34 Poverty rate among new families by change in family work situation since pregnancy (MCS) .................................................................................. 134
Table A.35 Reasons for mother not working at 9 months (MCS) ..................................... 134
Table A.36 Age of child when plan to return to work (MCS) ............................................. 135
Table A.37 Age of child when actually returned to work, by poverty rate at 9 months and whether had a subsequent new birth (MCS) ........................... 135
Table A.38 Conditional entry rate, prevalence, share of entries by risk events and number of risk events, for children in workless families in both waves ... 136
Table A.39 Income transitions for workless families who entered poverty ....................... 137
Table A.40 Type of benefit fall, for workless families who had a fall in benefit income .... 137
Table A.41 Income changes on exiting poverty by work status ........................................ 139
Table A.42 Conditional exit rate, prevalence, share of exits by family type (d), number of children (d), age of youngest child (d), ethnicity ........................... 140
Table A.43 Conditional exit rate, prevalence, share of exits by economic activity status (d), long-term worklessness, income sources (d), tenure ........ 141
Table A.44 Conditional exit rate, prevalence, share of exits by highest qualification, health (d) ................................................................................... 143
Table A.45 Conditional exit rate, prevalence, share of exits mirrors LID table 10.1 ......... 144
7
Child poverty transitions
Table A.46 Conditional exit rate, prevalence, share of exits by count of significant factors and selected combinations of significant factors ............... 144
Table A.47 Regression model of poverty exit for all children ........................................... 146
Table A.48 Regression model of poverty exit for children in each ethnic group ............... 148
Table A.49 Conditional exit rate, prevalence, share of exits by SIC, SOC, contract type ................................................................................................... 150
Table A.50 Regression model of poverty exit for all children initially in in-work families .............................................................................................. 151
Table A.1 Regression model of poverty exit for all children whose family move into work (base is all children initially in workless families and in poverty) .... 154
Table A.52 Use of childcare for children whose family exit poverty and move into work ......................................................................................................... 156
List of figuresFigure 1 Key events related to entering child poverty .................................................... 14
Figure 2 Key events related to exiting child poverty ....................................................... 15
Figure 1.1 Percentage of children in child poverty ............................................................ 20
Figure 2.1 Percentage of children in USoc with key family characteristics associated with a higher risk of poverty ........................................................... 24
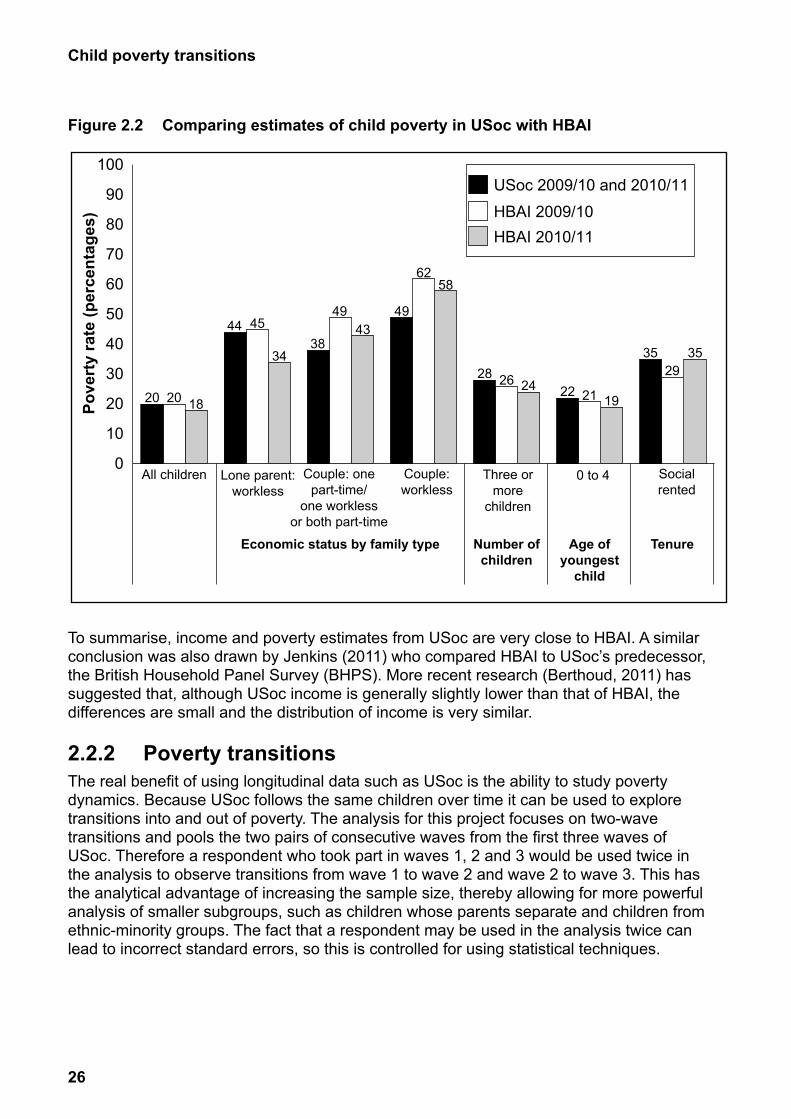
Figure 2.2 Comparing estimates of child poverty in USoc with HBAI ................................ 26
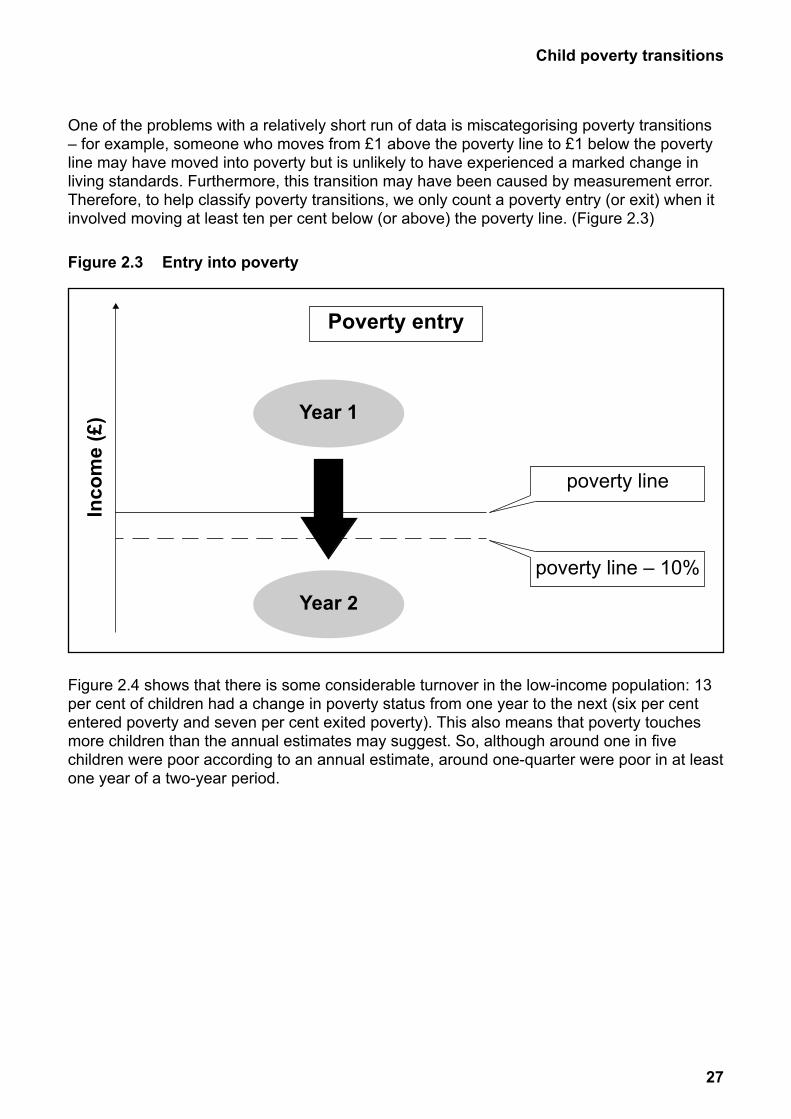
Figure 2.3 Entry into poverty ............................................................................................. 27
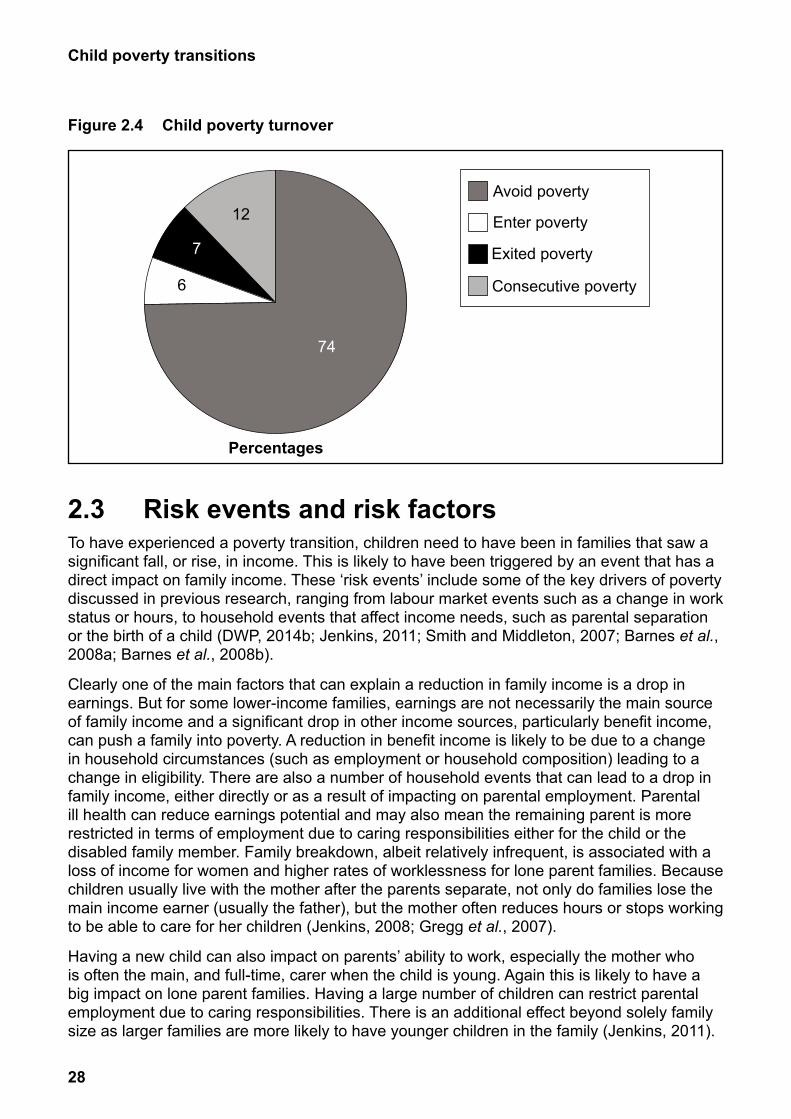
Figure 2.4 Child poverty turnover ...................................................................................... 28
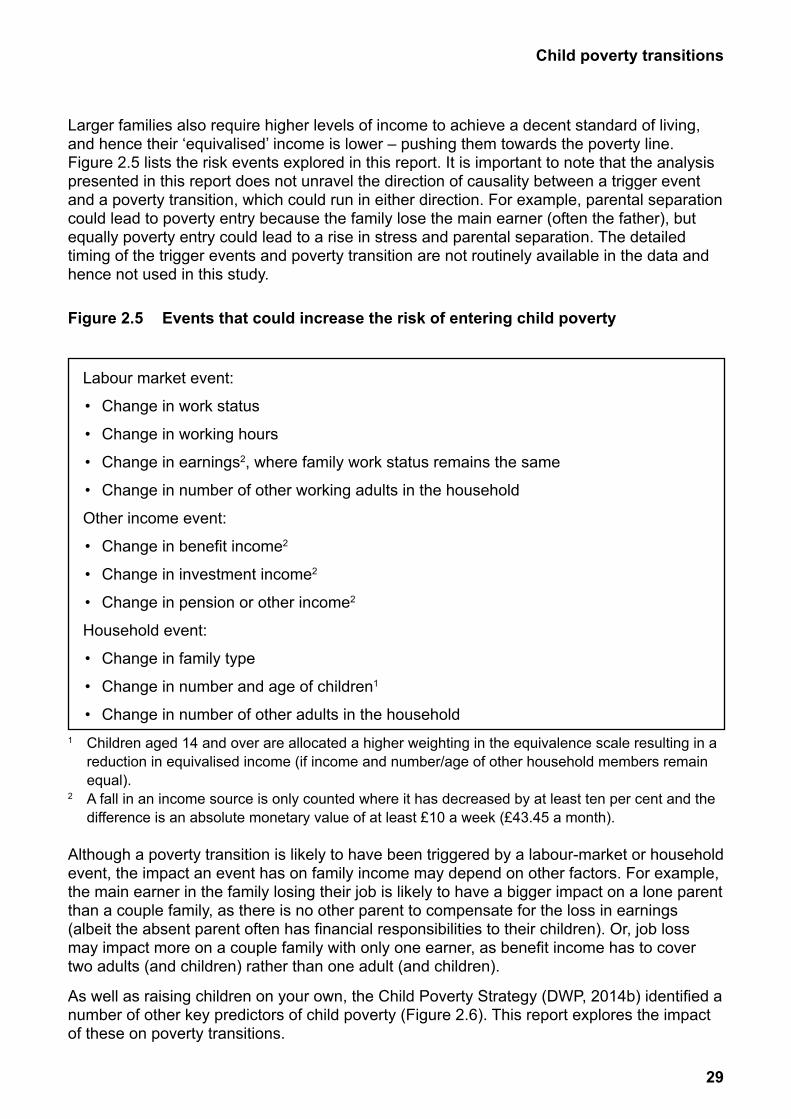
Figure 2.5 Events that could increase the risk of entering child poverty ........................... 29
Figure 2.6 Key predictors of child poverty ......................................................................... 30
Figure 2.7 Logistic regression model for child poverty transition ...................................... 31
Figure 3.1 Prior income distribution for children who enter poverty .................................. 33
Figure 3.2 Child poverty entry rate by selected household characteristics ....................... 39
Figure 3.3 Child poverty entry rate by ethnicity ................................................................. 43
Figure 3.4 Working families prior household income distributionfor children who entered poverty ......................................................................................... 45
Figure 3.5 Child poverty entry rate by selected job characteristics, for families initially in work .................................................................................................. 47
Figure 3.6 Poverty rate among new families ..................................................................... 54
8
Child poverty transitions
Figure 3.7 Poverty rate among new families by change in family employment status since pregnancy .................................................................................... 56
Figure 3.8 Percentage of mothers returning to work, by age of child when mother started work, by whether there was an additional sibling ..................... 58
Figure 4.1 Subsequent income distribution for children who exit poverty ......................... 60
Figure 4.2 Child poverty exit rate by employment events ................................................. 61
Figure 4.3 Child poverty exit rate by selected household characteristics .......................... 65
Figure 4.4 Poverty exit rate by ethnicity ............................................................................ 70
Figure 4.5 Working families subsequent income distribution for children who exit poverty ............................................................................................... 72
Figure 4.6 Poverty exit rate by selected job characteristics, for families initially in work .................................................................................................. 73
Figure 4.7 Families who gained employment and exited poverty subsequent income distribution ........................................................................................... 76
Figure 4.8 Childcare use by family type, employment status and income group .............. 79
9
Child poverty transitions
AcknowledgementsThe authors would like to thank Will Farbrother, Peter Matejic, Paul March, James Arthur, Karin Bosveld, and Jessie Evans (all of or formerly at CPU) for their support and guidance throughout the study. We would also like to thank Nick Buck and his ISER colleagues who provided help with the USoc net income data.
Thanks also goes to Kevin Pickering (formerly of NatCen) for providing statistical advice.
A final thanks goes to all the respondents who participated in the surveys used for this research. Without their contributions, this work would not have been possible.
10
Child poverty transitions
The AuthorsDr Matt Barnes is a lecturer, and member of the City Q-Step Centre, in the Department of Sociology at City University London. He specialises in the secondary analysis of survey data and his research focuses on poverty, disadvantage and social exclusion. Matt has over 15 years’ experience in social research, including over ten years at NatCen Social Research.
Chris Lord is a Senior Researcher (Analyst) in the Children, Families & Work team at NatCen Social Research, working on quantitative analysis projects. Chris has experience in social policy research over a number of years, including two years spent working at DWP. His main research and policy interest area is poverty and disadvantage.
Jenny Chanfreau is a Senior Researcher (Analyst) in the Children, Families & Work team at NatCen Social Research and works on quantitative analysis projects. Jenny’s main research and policy interest area relates to parents’ labour market participation and associated family income, work-life balance and wellbeing.
11
Child poverty transitions
Executive summary IntroductionThere is a large volume of evidence on how living in poverty can be detrimental for children. Hence much government policy has been aimed at getting households out of poverty; whether through income transfers, reducing worklessness or increasing earnings for those in work. Attempts have also been made to prevent households moving into poverty in the first place, as any spell of poverty can lead to an increased risk of recurrent or persistent poverty in the future. This study uses data from 2009/2010–2011/2012 to provide new evidence on child poverty transitions since the onset of the recent recession. Its aim is to better understand the patterns of, and drivers behind, moves into and out of poverty for families with children, thereby providing vital new evidence for policy makers tasked with preventing and alleviating child poverty.
MethodologyThis report uses data from large-scale social surveys to explore child poverty transitions. It draws mainly on Understanding Society (USoc), a household-tracking study repeated annually with a panel of 40,000 households from across all four countries of the UK. Millennium Cohort Study (MCS) data is also used to explore poverty among ‘new families’ at the start of the new Millennium. The MCS is the most recent of Britain’s world-renowned national longitudinal birth cohort studies and follows the lives of around 19,000 children born in the UK in 2000/1.
In this research the poverty line is drawn at 60 per cent of median equivalised net household income before housing costs. According to USoc data from 2009/10 this equates to around £1,547 per month for a couple with two children, and means that approximately one in five children were living below the poverty line. Poverty transitions measure a change in household income that shifts a family across the poverty line – either into or out of poverty – from one year to the next. To help identify genuine poverty transitions a poverty entry (or exit) is only counted when it involved moving at least ten per cent below (or above) the poverty line.
A number of different analyses were undertaken to help describe poverty transitions and to make comparisons across different types of children. Children were compared according to the characteristics of their family, including work status, ethnicity and education level of parents. The research was also able to explore the importance of key events that could trigger a poverty transition, such as a parent losing work or working fewer hours, parental separation and the birth of a new baby.
Poverty entry and exit rates were used to show how the likelihood of experiencing a poverty transition can vary for different children:
• The poverty entry rate identifies individuals moving into poverty between one year and the following year (and moving at least ten per cent below the poverty line), expressed as a percentage of the total number of individuals who were above the poverty line in the first year.
12
Child poverty transitions
• The poverty exit rate identifies individuals moving out of low income between one year and the following year (and moving at least ten per cent above the poverty line), expressed as a percentage of the total number of individuals who were below the poverty line in the first year.
For example, a poverty entry rate of ten per cent would mean that ten per cent (or one in ten) of children not in poverty in one year would have moved into poverty a year later.
The report also profiles the children who made a poverty transition (the ‘share of poverty entries’). For example, although the risk of entering poverty may be higher for children whose parents separated, parental separation is actually relatively rare, so not many children who entered poverty would have experienced that event.
The report also uses multivariate analysis (logistic regression) to explore the factors that may be driving poverty transitions; identifying which are independently associated with a poverty transition after taking other factors into account.
Poverty entry and exit rates and income changesAround one in 14 (seven per cent) children initially not in poverty had moved into poverty in the next year. Nearly two in five (38 per cent) poor children had moved out of poverty by the following year. The poverty exit rate is higher than the entry rate because at any one time there are much fewer children in poverty than out of poverty. The number of children who move into poverty is actually very similar to the number who move out of poverty.
Most children who entered poverty came from low-middle income households – two-thirds of children who entered poverty had been living in a household with income between the poverty line and median income. Likewise, children who exited poverty did not tend to make huge leaps up the income distribution. Entering poverty was associated with a (median) average income drop of £406 per month, while the change in income for a poverty exit was over £100 higher, with a (median) average income rise of £542. These figures include earnings and non-earnings. For those who experienced a benefit income fall the median average drop in monthly benefit income was £256. For those who experienced a benefit income rise the median average rise in monthly benefit income was £296.
Labour market eventsEarnings is a major source of income for many families and hence labour-market events, such as finding work or increasing hours of work, can have a particularly strong impact on poverty transitions. Families who changed the hours they worked had particularly high poverty transition rates. Children living in a family who went from part employment to full employment1 had the highest poverty exit rate (75 per cent), whereas a transition from full
1 We measured family work patterns which in couple families took into account the number of hours both parents worked. The following definition of full and part employment were derived: Full employment: lone parent working 30 or more hours per week, or couples where both parents are working and at least one of them is working 30 or more hours per week Part employment: lone parent working fewer than 30 hours per week, couples both working fewer than 30 hours per week, couples one parent working the other workless
13
Child poverty transitions
employment to part employment had only the fifth highest poverty entry rate (14 per cent). This suggests that enabling working families to increase the hours they work can play an important part in helping them to escape poverty. This has implications for policies designed to ‘make work pay’, including the financial incentives for families to work longer hours in the current and future tax-benefit system, such as Universal Credit.
The largest poverty entry rates were for families that became workless – either from being in full employment (entry rate of 38 per cent) or from part employment (entry rate of 42 per cent). Helping working families to remain in work is crucial to protect them from entering poverty.
Some families saw a rise or fall in their earnings, either due to a small change in the number of hours worked or a change in rates of pay. Children in families who experienced a rise in earnings while in full employment had an exit rate of 73 per cent. However, for children in families who had a fall in earnings while in full employment in both waves, the poverty entry rate was only six per cent. This suggests that even a fall in earnings for families in full employment is unlikely to lead to a large increase in the chance of them moving into poverty.
In-work familiesIt is clear that work plays a major role in determining families’ poverty status – two-thirds of children who entered poverty came from families initially in work, and four-fifths of children who escaped poverty came from families who either remained in or entered work. The survey data allowed for further exploration of poverty transitions according to industry, occupation and contract type of the main earner. Children living in families where the main earner works in the public administration and health industry, or a professional occupation, had particularly low poverty entry rates and high poverty exit rates, even when controlling for other factors. This suggests that these sectors can provide more stable and better-paid work. Interestingly, children living in families where the main earner works in the construction industry had both a higher than average poverty entry rate and poverty exit rate, and this remained the case even after controlling for other factors. This may be a result of the unstable and low-paid work associated with many jobs in this sector, meaning that households experienced fluctuations in their levels of income.
The type of contract employees have can also be an indicator of job security. The poverty entry rate was much higher for children whose parent (main earner) was employed in casual type of work than those in a permanent job (26 per cent compared to six per cent, although these only made up a very small proportion of all poverty entrees as only one per cent had this type of contract). When controlling for other factors, having a non-permanent job contract remained an independent predictor of poverty exit – perhaps because those on non-permanent contracts having less opportunity for promotion or wage progression (a finding found in research by Ray et al. 2010; Metcalf and Dhudwar 2010; Tomlinson and Walker 2010).
14
Child poverty transitions
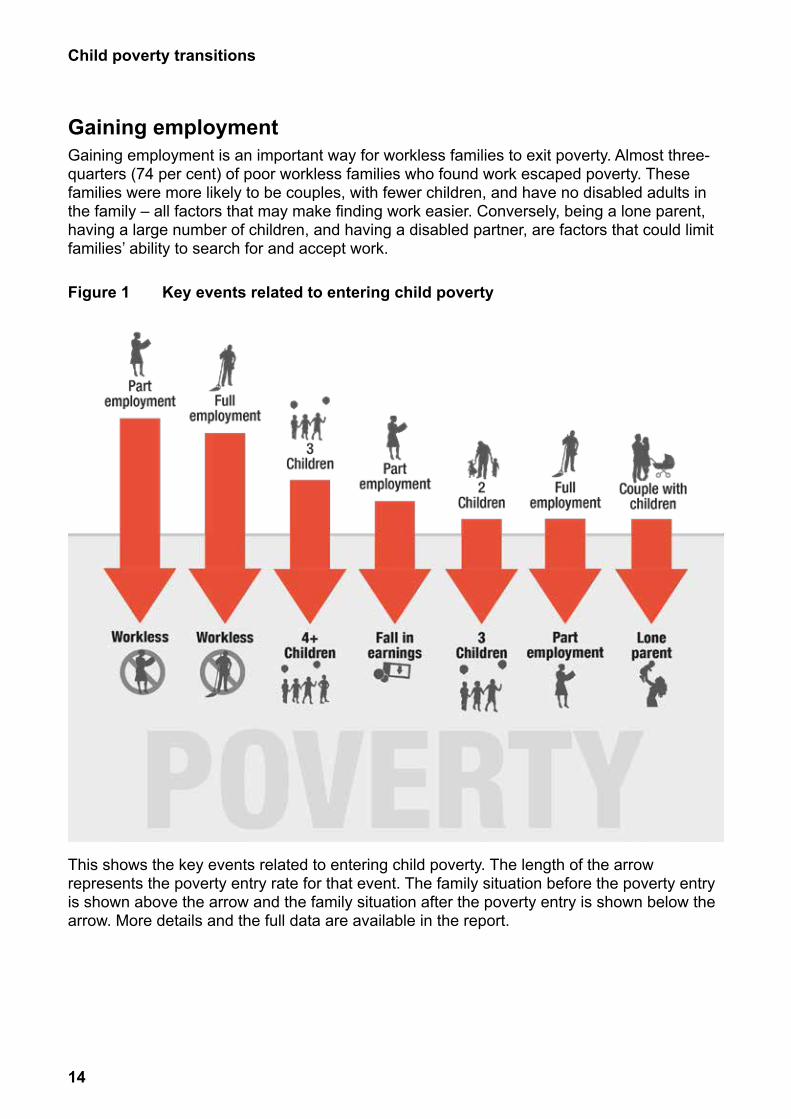
Gaining employmentGaining employment is an important way for workless families to exit poverty. Almost three-quarters (74 per cent) of poor workless families who found work escaped poverty. These families were more likely to be couples, with fewer children, and have no disabled adults in the family – all factors that may make finding work easier. Conversely, being a lone parent, having a large number of children, and having a disabled partner, are factors that could limit families’ ability to search for and accept work.
Figure 1 Key events related to entering child poverty
This shows the key events related to entering child poverty. The length of the arrow represents the poverty entry rate for that event. The family situation before the poverty entry is shown above the arrow and the family situation after the poverty entry is shown below the arrow. More details and the full data are available in the report.
15
Child poverty transitions
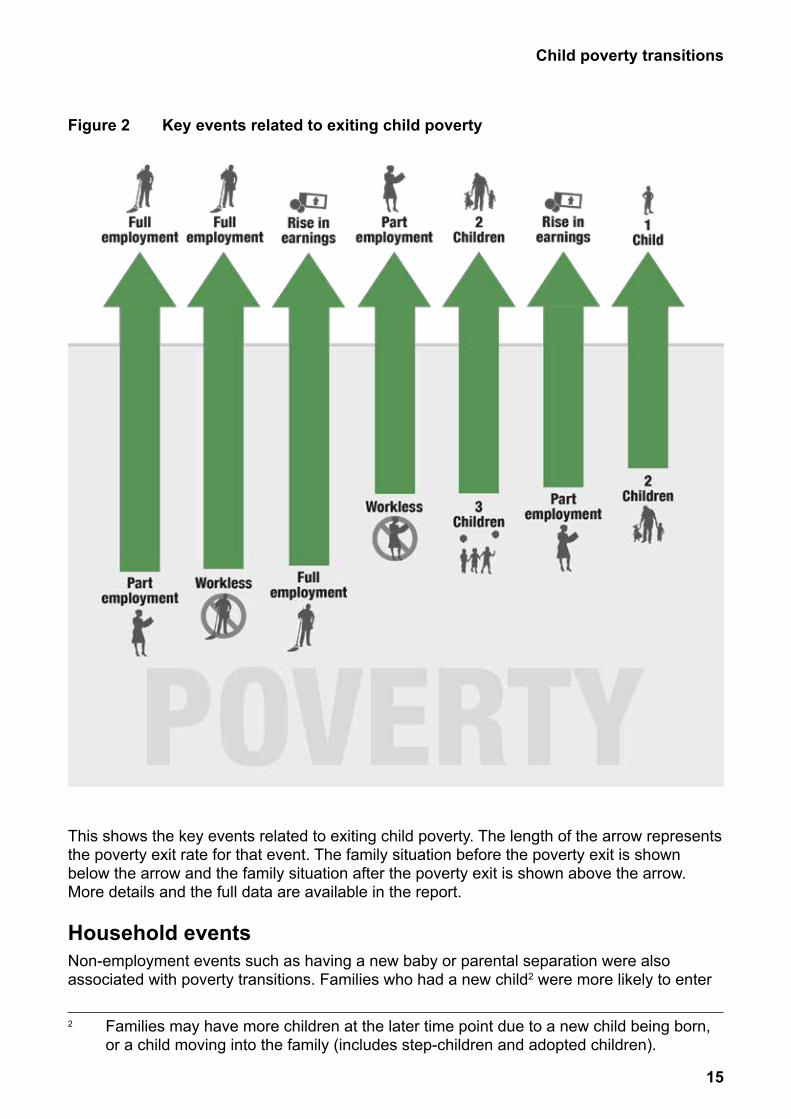
Figure 2 Key events related to exiting child poverty
This shows the key events related to exiting child poverty. The length of the arrow represents the poverty exit rate for that event. The family situation before the poverty exit is shown below the arrow and the family situation after the poverty exit is shown above the arrow. More details and the full data are available in the report.
Household eventsNon-employment events such as having a new baby or parental separation were also associated with poverty transitions. Families who had a new child2 were more likely to enter
2 Families may have more children at the later time point due to a new child being born, or a child moving into the family (includes step-children and adopted children).
16
Child poverty transitions
poverty even when controlling for other factors, and families with a child reaching adulthood or leaving home3 were more likely to exit poverty, even after controlling for other factors.
Parents’ educational qualifications were also independently linked to poverty transitions, with those with at least a degree-level qualification less likely to enter poverty and more likely to exit (than those with A-levels). Higher levels of educational qualifications are likely to mean families are better able to find employment and for that work to be more secure and better paid (Lawton 2009, and Tomlinson and Walker 2010). When controlling for other factors, children with parents with no qualifications or with GCSEs were no more or less likely to enter poverty than those with A-levels, suggesting that all else being equal it is only those with the very highest qualification levels who are protected from entering poverty.
Children in lone parent families had higher poverty entry rates (12 per cent) and lower poverty exit rates (30 per cent) than average. Parental separation between the two waves was uncommon, affecting only one per cent of children, but this was linked to a higher poverty entry rate (14 per cent). Interestingly, parental separation was not independently associated with poverty entry after controlling for other predictors, which is likely to be because employment status has a more direct impact on family income and therefore outweighs the effect of parental separation. However, changing from a lone parent to a couple family was independently associated with a lower poverty entry rate. Having an additional adult in the family to contribute to household income, and share childcare duties can be an important protector against poverty.
Non-earnings incomeChanges to non-earnings income4 were also associated with poverty transitions. A fall in benefit income was associated with a higher poverty entry rate (13 per cent) and a rise in benefit income was associated with a higher exit rate (48 per cent), and this remained true when controlling for other factors5.
3 Families may have fewer children at the later time point due to a child becoming an adult (whether they move out or stay at home), a child moving out (e.g. to live with another family member), or a child dying.
4 Rises and falls in income sources were measured when there had been a change of at least ten per cent and the difference was an absolute monetary value of at least £10 a week (£43.45 a month).
5 A rise or fall in benefit income is likely to be due to a change in household circumstances (such as employment or household composition) leading to a change in eligibility.
17
Child poverty transitions
New familiesPoverty can be a particular concern for families who have their first child, given the impact on parents’ ability to work and the added demand on family income. Using data from the start of the millennium this research shows that around a quarter (26 per cent) of ‘new families’ were in poverty in the year after having their first child. New lone parents were particularly likely to be poor (79 per cent in poverty). New families that were out of work, where the parent(s) had no formal qualifications or where the mother was young, had a high risk of poverty in the baby’s first year.
Poverty status at the birth of the first child was also linked to later working patterns. Mothers in poor new families were less likely than those in non-poor new families to have returned to work by the time their firstborn child was seven years old.
ChildcareMany families who work whilst having young children are reliant on the use of childcare, and the amount of childcare families use is related to the number of hours families work. A similar proportion of working families reported using childcare, whether they were in poverty or had recently exited poverty. The exception to this was employed lone parents. A large proportion of working lone parents who exited poverty used childcare (particularly formal childcare), in comparison to working lone parents who remained poor (43 per cent compared with 22 per cent). This is a reflection of the longer hours that lone parents worked to escape poverty and hence the greater need for childcare – as well as being more able to afford to pay for it.
EthnicityChildren from ethnic-minority groups are particularly vulnerable to poverty, and in general they had higher poverty entry rates and lower poverty exit rates than white children:• White – entry rate of five per cent; exit rate of 40 per cent.
• Indian – entry rate of ten per cent; exit rate of 41 per cent.
• Pakistani – entry rate of 19 per cent; exit rate of 30 per cent.
• Bangladeshi – entry rate of 16 per cent; exit rate of 36 per cent.
• Black Caribbean – entry rate of 11 per cent; exit rate of 51 per cent.
• Black African – entry rate of 15 per cent; exit rate of 31 per cent.
Black African, Bangladeshi, and Pakistani children had higher poverty entry rates, and lower exit rates, than white children, even after controlling for other factors. Indian and black Caribbean children also had high poverty entry rates, but coupled with high exit rates, suggesting higher risk of short-term or recurrent poverty.
Low sample sizes meant some ethnic groupings had to be combined in order to explore these issues. Findings tended to mirror those described above, although some interesting differences between ethnic groupings did emerge. South Asian children (Indian, Pakistani, and Bangladeshi combined) from lone parent families and white children in social housing were particularly at risk of entering poverty, while black children (Caribbean and African combined) in families where a child reached adulthood or left home, and South Asian children in families where the youngest child was of secondary school age were particularly likely to exit poverty.

18
Child poverty transitions
Changes since the recessionIn general the findings from this study are consistent with earlier studies that took place before the recession (for example, Jenkins 2011 and DWP 2010). Employment activities are most strongly linked to poverty transitions, and the strength of these relationships are close to that found in previous work. Previous research found that changes in household earnings accounted for the largest shares of poverty entries and exits. We found that this is still true for families with children:• In 2009/2010-2011/2012 52 per cent of children who entered poverty lived in families
whose earnings had fallen, in 1991-2008 this was 52 per cent (of all individuals).
• In 2009/2010-2011/2012 53 per cent of children who exited poverty lived in families whose earnings had risen, in 1991-2008 this was 53 per cent (of all individuals).
19
Child poverty transitions
1 IntroductionThis study uses data from 2009/10 to 2011/12 to provide new evidence on child poverty transitions since the onset of the recent recession. Its aim is to better understand the patterns of, and drivers behind, moves into and out of poverty for families with children.
1.1 BackgroundThere is a large volume of evidence on how growing up in poverty can be detrimental for children’s outcomes during childhood and further into adulthood. Children born into poverty are more likely to have a lower birth weight, higher infant mortality and poorer health than better-off children (Barnes et al., 2010; Barnes et al., 2008a; DWP, 2007). Poverty in childhood is linked to lower income as adults, demonstrating that child poverty can leave a damaging long-term legacy regardless of other family circumstances (Blanden and Gibbons, 2006).
Much government policy has been aimed at getting households out of poverty whether through income transfers, reducing worklessness or increasing earnings for those in work. However, it is also important to prevent households moving into poverty in the first place, as any spell of poverty can lead to an increased risk of recurrent or persistent poverty.
Changes in household composition and labour-market transitions (such as loss of employment) can negatively impact household income and thus cause a household to move into poverty6. Intervening in these transitions can be an effective way of preventing households with children entering poverty. Likewise, recognising what enables poor families to escape their situation gives important clues to policy makers tasked with helping families to exit poverty. Therefore understanding how and why households move into, and out of, poverty is crucial for the formulation of successful anti-poverty strategies.
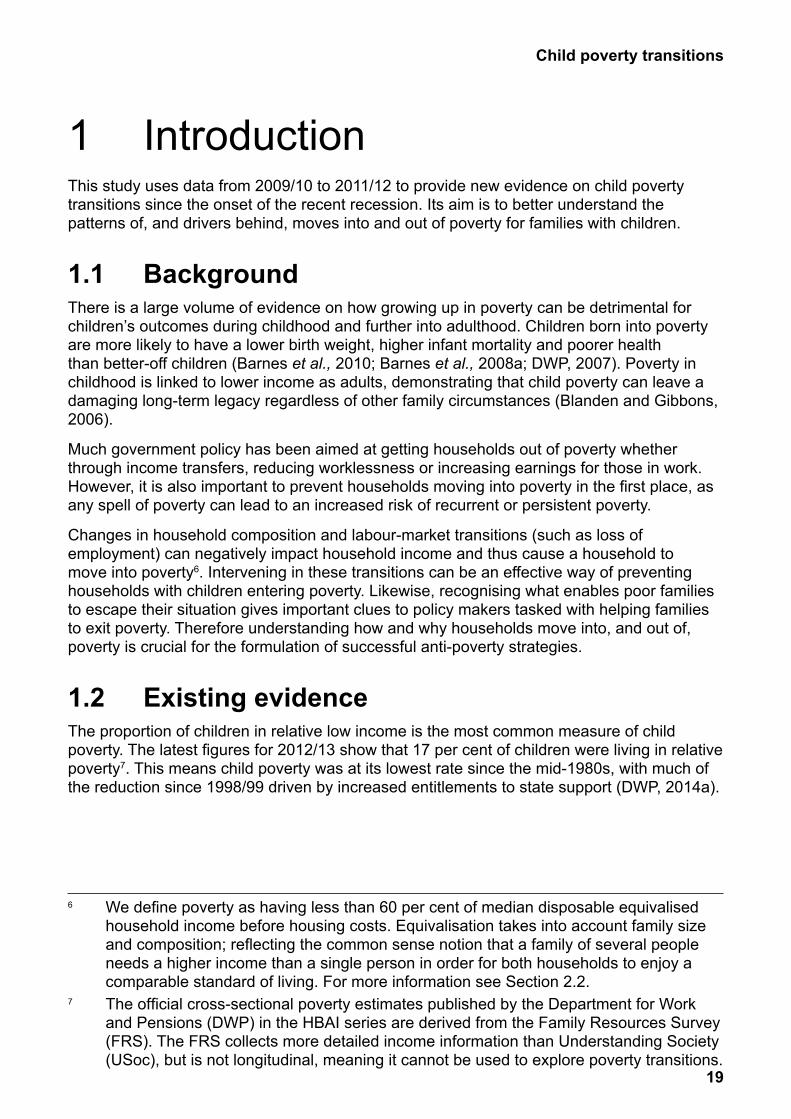
1.2 Existing evidenceThe proportion of children in relative low income is the most common measure of child poverty. The latest figures for 2012/13 show that 17 per cent of children were living in relative poverty7. This means child poverty was at its lowest rate since the mid-1980s, with much of the reduction since 1998/99 driven by increased entitlements to state support (DWP, 2014a).
6 We define poverty as having less than 60 per cent of median disposable equivalised household income before housing costs. Equivalisation takes into account family size and composition; reflecting the common sense notion that a family of several people needs a higher income than a single person in order for both households to enjoy a comparable standard of living. For more information see Section 2.2.
7 The official cross-sectional poverty estimates published by the Department for Work and Pensions (DWP) in the HBAI series are derived from the Family Resources Survey (FRS). The FRS collects more detailed income information than Understanding Society (USoc), but is not longitudinal, meaning it cannot be used to explore poverty transitions.
20
Child poverty transitions
Perc
enta
ges
26
17
0
5
10
15
20
25
30
35
40
2012/13
2011/12
2010/11
2009/10
2008/09
2007/08
2006/07
2005/06
2004/05
2003/04
2002/03
2001/02
2000/01
1999/00
1998/99
18 18
Source: Households Below Average Income data (DWP, 2014a) p5.
Relative low income(BHC, 60% median)
Figure 1.1 Percentage of children in child poverty
The latest Households Below Average Income (HBAI) report (DWP, 2014a) identifies a number of factors associated with child poverty:• Work status: Children in workless families were much more likely to live in low-income
households than those in families with at least one adult in work. Despite their lower poverty risk, children living in families where at least one adult was in work made up around two-thirds of the total number of children in poverty. This is because over four-fifths of children lived in families where at least one adult was in work.
• Family type: Children in lone parent families were more likely to live in poverty. Since 1998/99, there has been a reduction in the proportion of children in lone parent families in poverty, mainly due to lone parent employment rates having increased over this period.
• Family size: Children in large families – those with three or more children – were more likely to live in poverty, although the risk has decreased since 1998/99
• Disability8: Children in families containing one or more disabled member were more likely to live in poverty than those in families with no disabled member – even more so if no-one is in receipt of disability benefits.
• Ethnicity: Children living in households headed by someone from an ethnic minority were more likely to live in poverty, compared with households headed by someone of white ethnicity. This was partly due to higher rates of worklessness among certain ethnic groups (DWP, 2014a).
8 No adjustment is made to disposable household income to take into account any additional costs that may be incurred due to a disability. This means that the position in the income distribution of these groups may be somewhat upwardly biased.
21
Child poverty transitions
Poverty dynamicsMost of the published statistics on poverty take a snapshot view of people living in poverty at a particular time point. But like many other social phenomena, poverty is not a static state. Family income and circumstances change, and children can live in families that move into and out of poverty throughout their lives. By using longitudinal data to explore changes in household income it is possible to observe these poverty transitions, and to identify the factors associated with them.
The Government produce annual statistics on family income change – Low Income Dynamics (LID), a longitudinal complement to the point-in-time poverty estimates provided by the Households Below Average Income (HBAI) report. The latest version of LID was published in 2010, covering the period 1991-2008 (DWP, 20109) – meaning that much of the work on this subject is dated and specifically does not cross the recession. The report shows a relatively large degree of movement in and out of poverty, with a third (33 per cent) of couples with children in low income exiting poverty from one year to the next, and seven per cent entering poverty.
LID shows that the largest proportions of entries into poverty were due to a reduction in earnings (DWP, 201010). This could be because of job loss, or loss of labour earnings due to reducing hours worked or a lowering of wages (Smith and Middleton, 2007, p 3811). In addition, changes to in-work benefit payments and tax can also have an impact on net earnings12. Other events associated with poverty transitions include changes in other sources of income such as benefits, investments and pensions, changes in partnership status, and changes to the number and ages of children which increase the income ‘need’ of the family.
However, there are a number of issues that LID fails to address; partly because of the restricted sample size of its data source (the British Household Panel Survey https://www.iser.essex.ac.uk/bhps). It does not look at poverty transitions solely for children, and hence the events mentioned above relate to the population as a whole rather than children (and their parents). Nor does LID look more closely at labour market activities, other than changes in the number of earners in the household or their earnings. To get more understanding of the role of the labour market it is important to examine which industries, occupations and contract types are associated with poverty transitions. Furthermore, LIDs only report major demographic events; it is also important to address whether, for example, size of household or ethnic group are associated with moves into child poverty.
9 Department of Work and Pensions, (2010) Low Income Dynamics: 1991 – 2008 (Great Britain), London: Department of Work and Pensions. http://statistics.dwp.gov.uk/asd/hbai/low_income/low_income_dynamics_1991-2008.pdf
10 Ibid pg 25.11 Smith, N. & Middleton, S., 2007. A Review of Poverty Dynamics Research in the UK ,
York: Joseph Rowntree Foundation. http://www.jrf.org.uk/sites/files/jrf/2040-poverty-dynamics-review.pdf
12 Changes in benefit income may happen and are likely to be due to a change in household circumstances (such as employment or household composition) leading to a change in eligibility.

22
Child poverty transitions
1.3 Aims and objectivesThe main aim of this research is to identify which employment and household characteristics increase the risk of children moving into or out of poverty. The detailed research objectives are:• Provide a comprehensive and up-to-date picture of transitions into and out of poverty for
families with children.
• Identify which household characteristics are most associated with entry into, and out of, poverty. This should include particular reference to:
– The impact of having an additional child (both first and subsequent children) on poverty entries. And after how many children does poverty entry become most likely?
– What is the impact (if any) of ethnicity in the risk of entering, and exiting, poverty? And why are some groups more likely to make a poverty transition?
• Which labour market characteristics are most associated with entry into, and out of, poverty? Are the risks of entering poverty greater for those in certain industries, occupations and contract types?
– Is it job loss, reduced hours, reduced hourly pay, increased living costs or a change to unstable pay that is the main driver behind the reduction in earnings of those that enter poverty?
– What is the impact of long-term worklessness?
• To explore whether families have multiple drivers of poverty transitions,
• Is there a significant difference in the characteristics of those more likely to make a poverty transition before the 2008 recession and more recently? And are there any future policy implications arising from any difference?

23
Child poverty transitions
2 Methodology2.1 The dataThis report uses data from large-scale social surveys to explore child-poverty transitions. There is a wealth of surveys that capture different aspects of childhood poverty. The main survey used in this report is Understanding Society (USoc). USoc is a household-tracking study, repeated annually with a panel of 40,000 households from across all four countries of the UK. Responses are collected over a two-year period (a ‘wave’) through face-to-face interviews, and questions cover a broad range of areas, including income, work, family composition, health and education. The first wave of the survey was carried out in 2009-10, with data from the third wave (2011-12) being made available in October 2013. USoc incorporates and expands the British Household Panel Survey, which ran for 18 years from 1991 to 2008.
The advantages of using USoc are its large sample size, the wide range of information it collects, including quite detailed income data, and that it is longitudinal so allows the exploration of income transitions. Because USoc follows the same children over time it can be used to explore movements into and out of poverty. All surveys have limitations, and for USoc these include currently being limited to only three waves, and having some issues with the quality of the income data (more on this below).13
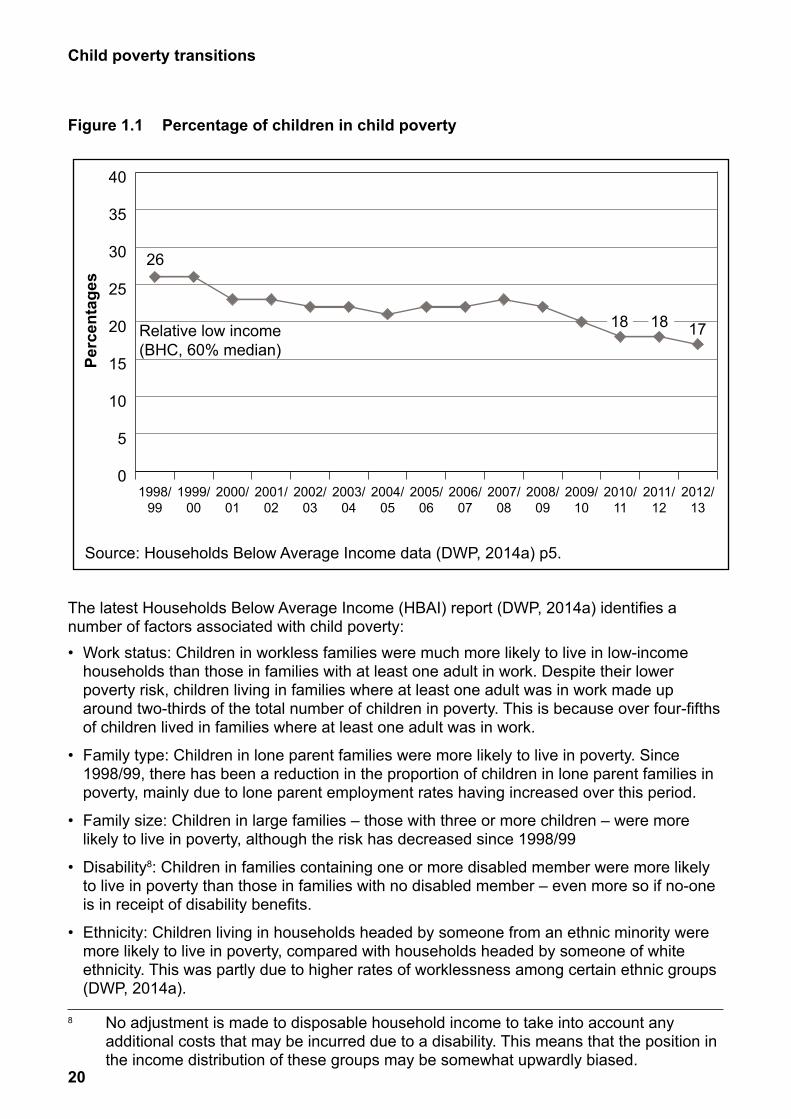
Profile of children in the UK (from USoc)Given what is already known from previous research about the family characteristics and factors associated with a higher risk of poverty, it is helpful to note the profile of children in USoc for these factors.
13 More details on USoc can be found at https://www.understandingsociety.ac.uk/
24
Child poverty transitions
0
5
10
15
20
25
30
35
At least oneparent
has ill health
Parents haveno educationalqualifications
Worklessfamily
Lone parentfamily
4 or morechildren
3 or morechildren
Characteristic
Understanding Society wave 1 (2009/10).See Table A.15 for more information.
33
12
26
21
7
25
Prop
ortio
n of
chi
ldre
n
Figure 2.1 Percentage of children in USoc with key family characteristics associated with a higher risk of poverty
2.2 Measuring poverty2.2.1 Estimating child poverty in USocThe Child Poverty Act includes a set of four indicators of child poverty. The most commonly used, including in this research, takes a relative approach, creating a poverty line in relation to the middle (median) income in the population. This defines the poverty line at 60 per cent of contemporary median disposable equivalised household income before housing costs. Equivalisation takes into account family size and composition; reflecting the common sense notion that a family of several people needs a higher income than a single person in order for both households to enjoy a comparable standard of living.

25
Child poverty transitions
Issues with the income data in USocUSoc collects detailed current income information from all adults in the household allowing for calculation of disposable household income. That is to say the sum, across all household members, of current income (after the deduction of Income Tax and National Insurance contributions) from employment and self-employment, investments and savings, private and occupational pensions, Social Security benefits and tax credits.
However, it is not always possible to interview all adults in the household and in these instances an available interviewee will provide income information for the non-present adult. Understandably, it is sometimes difficult to collect accurate information about another person’s income, and this missing or inaccurate information could lead to biased estimates of household income. Hence only households where all adults were interviewed were used in the analysis.
During data preparation it was noticed that the amount of income households received from benefits and pensions in wave 1 was markedly lower than in wave 2. These differences were not seen in other sources of income collected by USoc and did not appear in other surveys covering a similar period. The cause of the discrepancy was likely to be due to people not recalling all of their benefit and pension receipt at wave 1 (a mechanism was included in the survey from wave 2 that improved this process). Hence a procedure was applied to the wave 1 data that imputed the wave 2 benefit and pension data for those who received that source in wave 2, but did not mention it in wave 1 and were eligible to receive it in wave 1. For more information see Appendix A.
Although the imputation went some way to rectifying the problems with the income data, some issues will still remain and this should be born in mind when interpreting the findings in this report.
Hence the poverty line is set at a different income level for different families. For example, a couple with two children is below the poverty line if they have income less than £1,547 pounds per month whereas, for a lone parent with two children, the poverty line is £1,178 pounds per month (Table 2.1).
Table 2.1 Income poverty threshold1 for different family types
Family typeNumber of children Lone parent Couple1 (under 14) £957 £1,3262 (1 under 14, 1 over 14) £1,178 £1,5473 (1 under 14, 2 over 14) £1,399 £1,7684 (2 under 14, 2 over 14) £1,620 £1,989
1 Calculated from USoc wave 1
Despite USoc not being a specialist income survey, its estimates of child poverty are comparable to those from HBAI (Figure 2.2). For example, USoc estimates 20 per cent of children were in poverty in 2009/2010 to 2010/2011. HBAI estimates were 20 per cent for 2009/2010 and 18 per cent for 2010/2011. The main differences between survey estimates were by economic status and this is likely to be due to how the surveys ask about full- and part-time work. USoc asks people how many hours they work and anyone who works for 30 hours or more per week is defined as full time, whereas HBAI asks people to decide whether they are working full or part time.
26
Child poverty transitions
Pove
rty
rate
(per
cent
ages
) HBAI 2009/10
USoc 2009/10 and 2010/11
HBAI 2010/11
0
10
20
30
40
50
60
70
80
90
100
Socialrented
0 to 4Three ormore
children
Couple:workless
Couple: onepart-time/
one worklessor both part-time
Lone parent:workless
All children
2020 18
4544
34
49
3843
62
49
58
262824
212219
2935 35
Economic status by family type Number of children
Age of youngest
child
Tenure
Figure 2.2 Comparing estimates of child poverty in USoc with HBAI
To summarise, income and poverty estimates from USoc are very close to HBAI. A similar conclusion was also drawn by Jenkins (2011) who compared HBAI to USoc’s predecessor, the British Household Panel Survey (BHPS). More recent research (Berthoud, 2011) has suggested that, although USoc income is generally slightly lower than that of HBAI, the differences are small and the distribution of income is very similar.
2.2.2 Poverty transitionsThe real benefit of using longitudinal data such as USoc is the ability to study poverty dynamics. Because USoc follows the same children over time it can be used to explore transitions into and out of poverty. The analysis for this project focuses on two-wave transitions and pools the two pairs of consecutive waves from the first three waves of USoc. Therefore a respondent who took part in waves 1, 2 and 3 would be used twice in the analysis to observe transitions from wave 1 to wave 2 and wave 2 to wave 3. This has the analytical advantage of increasing the sample size, thereby allowing for more powerful analysis of smaller subgroups, such as children whose parents separate and children from ethnic-minority groups. The fact that a respondent may be used in the analysis twice can lead to incorrect standard errors, so this is controlled for using statistical techniques.
27
Child poverty transitions
One of the problems with a relatively short run of data is miscategorising poverty transitions – for example, someone who moves from £1 above the poverty line to £1 below the poverty line may have moved into poverty but is unlikely to have experienced a marked change in living standards. Furthermore, this transition may have been caused by measurement error. Therefore, to help classify poverty transitions, we only count a poverty entry (or exit) when it involved moving at least ten per cent below (or above) the poverty line. (Figure 2.3)
Figure 2.3 Entry into poverty
Figure 2.4 shows that there is some considerable turnover in the low-income population: 13 per cent of children had a change in poverty status from one year to the next (six per cent entered poverty and seven per cent exited poverty). This also means that poverty touches more children than the annual estimates may suggest. So, although around one in five children were poor according to an annual estimate, around one-quarter were poor in at least one year of a two-year period.
Poverty entry
Inco
me
(£) Year 1
Year 2
poverty line
poverty line – 10%
28
Child poverty transitions
Consecutive poverty
Exited poverty
Enter poverty
Avoid poverty
74
12
7
6
Percentages
Figure 2.4 Child poverty turnover
2.3 Risk events and risk factorsTo have experienced a poverty transition, children need to have been in families that saw a significant fall, or rise, in income. This is likely to have been triggered by an event that has a direct impact on family income. These ‘risk events’ include some of the key drivers of poverty discussed in previous research, ranging from labour market events such as a change in work status or hours, to household events that affect income needs, such as parental separation or the birth of a child (DWP, 2014b; Jenkins, 2011; Smith and Middleton, 2007; Barnes et al., 2008a; Barnes et al., 2008b).
Clearly one of the main factors that can explain a reduction in family income is a drop in earnings. But for some lower-income families, earnings are not necessarily the main source of family income and a significant drop in other income sources, particularly benefit income, can push a family into poverty. A reduction in benefit income is likely to be due to a change in household circumstances (such as employment or household composition) leading to a change in eligibility. There are also a number of household events that can lead to a drop in family income, either directly or as a result of impacting on parental employment. Parental ill health can reduce earnings potential and may also mean the remaining parent is more restricted in terms of employment due to caring responsibilities either for the child or the disabled family member. Family breakdown, albeit relatively infrequent, is associated with a loss of income for women and higher rates of worklessness for lone parent families. Because children usually live with the mother after the parents separate, not only do families lose the main income earner (usually the father), but the mother often reduces hours or stops working to be able to care for her children (Jenkins, 2008; Gregg et al., 2007).
Having a new child can also impact on parents’ ability to work, especially the mother who is often the main, and full-time, carer when the child is young. Again this is likely to have a big impact on lone parent families. Having a large number of children can restrict parental employment due to caring responsibilities. There is an additional effect beyond solely family size as larger families are more likely to have younger children in the family (Jenkins, 2011).
29
Child poverty transitions
Larger families also require higher levels of income to achieve a decent standard of living, and hence their ‘equivalised’ income is lower – pushing them towards the poverty line. Figure 2.5 lists the risk events explored in this report. It is important to note that the analysis presented in this report does not unravel the direction of causality between a trigger event and a poverty transition, which could run in either direction. For example, parental separation could lead to poverty entry because the family lose the main earner (often the father), but equally poverty entry could lead to a rise in stress and parental separation. The detailed timing of the trigger events and poverty transition are not routinely available in the data and hence not used in this study.
Figure 2.5 Events that could increase the risk of entering child poverty
Labour market event:
• Change in work status
• Change in working hours
• Change in earnings2, where family work status remains the same
• Change in number of other working adults in the household
Other income event:
• Change in benefit income2
• Change in investment income2
• Change in pension or other income2
Household event:
• Change in family type
• Change in number and age of children1
• Change in number of other adults in the household1 Children aged 14 and over are allocated a higher weighting in the equivalence scale resulting in a
reduction in equivalised income (if income and number/age of other household members remain equal).
2 A fall in an income source is only counted where it has decreased by at least ten per cent and the difference is an absolute monetary value of at least £10 a week (£43.45 a month).
Although a poverty transition is likely to have been triggered by a labour-market or household event, the impact an event has on family income may depend on other factors. For example, the main earner in the family losing their job is likely to have a bigger impact on a lone parent than a couple family, as there is no other parent to compensate for the loss in earnings (albeit the absent parent often has financial responsibilities to their children). Or, job loss may impact more on a couple family with only one earner, as benefit income has to cover two adults (and children) rather than one adult (and children).
As well as raising children on your own, the Child Poverty Strategy (DWP, 2014b) identified a number of other key predictors of child poverty (Figure 2.6). This report explores the impact of these on poverty transitions.
30
Child poverty transitions
Figure 2.6 Key predictors of child poverty
• Long-term worklessness
• Having low qualifications
• Raising children on your own
• Having three or more children to care for
• Experiencing ill health
2.4 Statistical analysisThe report uses a range of analyses to explore which children made a poverty transition. Descriptive statistics illustrate how poverty transitions can vary for different types of children, with a focus on the events that may trigger such transitions. A variety of statistics are produced to illustrate these findings:• The prevalence of each event, for example the proportion of children whose parents
separated.
• Rates of entering, and exiting, poverty:
– The poverty entry rate identifies children moving into low income between one year and the following year (and moving at least ten per cent below the poverty line), expressed as a percentage of the total number of individuals who were above the poverty line in the first year.
– The poverty exit rate identifies children moving out of low income between one year and the following year (and moving at least ten per cent above the poverty line), expressed as a percentage of the total number of individuals who were below the poverty line in the first year.
• The entry and exit rate for children who have experienced the event in question, for example, the poverty entry rate for children whose parents have separated.
• The proportion, or share, of all poverty transitions that are accounted for by the event, for example the proportion of all children who entered poverty whose parents separated.
Multivariate analysis (logistic regression) is used to explore what may be driving poverty transitions. The strength of this technique is that it can show what has an independent association with a poverty transition when other key predictors have been accounted for. This is because the predictors of a poverty transition do not necessarily occur in isolation – for example, a family losing an earner could be the result of parents separating, or a parent becoming ill. The report explores the multiplicity of risk events and factors, identifying which children are most vulnerable to poverty triggers.

31
Child poverty transitions
Figure 2.7 Logistic regression model for child poverty transition14
A focus on childrenThe analysis presented in this report is based on children, rather than all individuals (children and parents) or households. A child is defined as an individual aged under 16. A person will also be defined as a child if they are 16 to 19-years old and they are:• not married nor in a civil partnership nor living with a partner; and
• living with parents; and
• in full-time non-advanced education15 or in unwaged government training.16
The characteristics of the household, such as income or parental relationship status, are assigned to the children in that household.
14 Because we do not have information on children’s prior experience of poverty we cannot account for the fact that the experience of poverty in the past affects chances of being poor in the future (Jenkins, 2011). This should be born in mind when interpreting the results.
15 Non-advanced education is of A-level standard or below.16 If a 16 to 19-year-old matches the other criteria and is on a non-paid government
training programme then they are defined as a child.
Outcome
i) Entered poverty versus Avoided poverty
ii) Exited poverty versus Remained in poverty
Predictors
Labour
• Change in work status
• Change in number of working hours
• Change in earnings (not covered above)
• Change in number of other working adults in
household
• Long-term worklessness
Non-labour income
• Change in benefit income
• Change in investments, pension and other income
• Initial income deciles
Household
• Change in family type
• Change in age of youngest child
• Change in number of children
• Age of parent
• Ethnicity of parent
• Change in self-reported health of parent/s
• Change in number of other adults in hhold
• Highest educational qualification of parent/s
• Tenure
• Region
• Rurality

32
Child poverty transitions
The analysis was carried out on a particular subset of the USoc sample – children who were in consecutive waves of USoc and who lived in households where all adults completed an interview in both waves. New weights were constructed to correct for differential survey response and attrition. Regression analysis was used to construct the weights, which took into account the following characteristics of children (and their family): whether parents were working; child’s age and sex; whether the child lived in an ethnic minority boost household;17 number of individuals in household; number of adults in household; whether the child lives in private rented accommodation; and whether the child lives in social-rented accommodation. This built on work carried out by ISER, at the University of Essex, for a previous project for Child Poverty Unit (CPU). Contact CPU for more details.18
This report now goes on to explore poverty entries and poverty exits in more detail. It looks separately at poverty entries (Chapter 3) and poverty exits (Chapter 4), as they are not necessarily two sides of the same coin. Policies designed to prevent poverty entry are primarily aimed at people above the poverty line.19 These people may already be in work and so policies may be centred on stabilising employment or dealing with potential triggers of poverty entry, such as the birth of a new baby or parental separation. Policies designed to enable people to escape poverty, however, are aimed at those already below the poverty line, and may be more focused on enabling people to find work and preparing them for employment – or providing income transfers to ensure families have an adequate income to provide a decent standard of living.
All differences discussed in the text are statistically significant unless stated otherwise.
17 USoc includes an ethnic minority boost sample, which was undertaken to produce enough cases (1,000) to analyse households and individuals from five major ethnic groups in the UK: Indian, Pakistani, Bangladeshi, Caribbean, and African.
18 [email protected] It is well know that people can cycle in and out of poverty, so policies aimed at
preventing people falling back into poverty could be relevant for those at any point of this cycle.
33
Child poverty transitions
3 Entries into child povertyThis chapter explores entries into child poverty. Previous research has shown that poverty has a detrimental impact on child development and later life outcomes, and it is well known that children who experience poverty are likely to become poor again as adults. This means that it is crucial to prevent children from entering poverty in the first place.
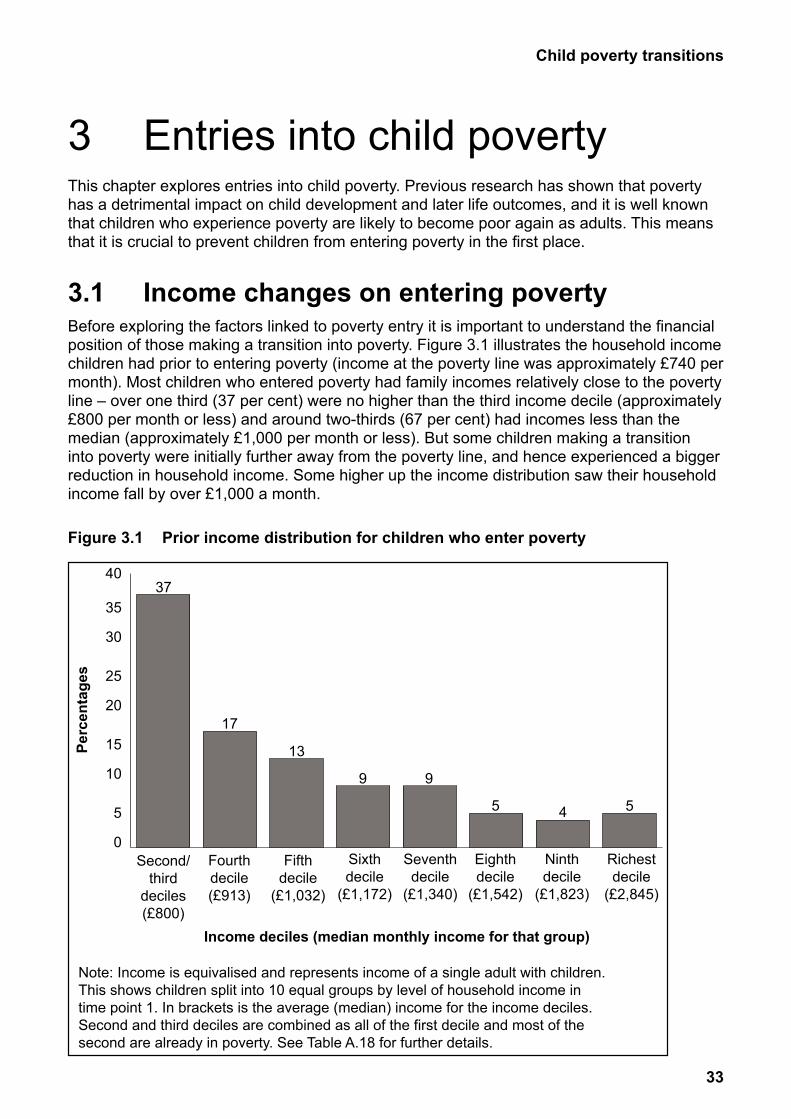
3.1 Income changes on entering povertyBefore exploring the factors linked to poverty entry it is important to understand the financial position of those making a transition into poverty. Figure 3.1 illustrates the household income children had prior to entering poverty (income at the poverty line was approximately £740 per month). Most children who entered poverty had family incomes relatively close to the poverty line – over one third (37 per cent) were no higher than the third income decile (approximately £800 per month or less) and around two-thirds (67 per cent) had incomes less than the median (approximately £1,000 per month or less). But some children making a transition into poverty were initially further away from the poverty line, and hence experienced a bigger reduction in household income. Some higher up the income distribution saw their household income fall by over £1,000 a month.
Figure 3.1 Prior income distribution for children who enter poverty
0
5
10
15
20
25
30
35
40
Richestdecile
(£2,845)
Ninthdecile
(£1,823)
Eighthdecile
(£1,542)
Seventhdecile
(£1,340)
Sixthdecile
(£1,172)
Fifthdecile
(£1,032)
Fourthdecile(£913)
Second/third
deciles(£800)
Income deciles (median monthly income for that group)
Note: Income is equivalised and represents income of a single adult with children. This shows children split into 10 equal groups by level of household income in time point 1. In brackets is the average (median) income for the income deciles. Second and third deciles are combined as all of the first decile and most of the second are already in poverty. See Table A.18 for further details.
13
9 9
5 4 5
17
37
Perc
enta
ges
34
Child poverty transitions
Having given some flavour of the changes in income that families who enter poverty can face, the report moves on to focus on reasons why children enter poverty, and to identify the children most at risk.
3.2 Which children are most likely to enter poverty?
A mixture of descriptive and multivariate statistics to help understand which children are most likely to enter poverty are presented in Table 3.1. The table shows that the child poverty entry rate was seven per cent. This means that seven per cent of children initially not in poverty moved into poverty in the following year (and moved at least ten per cent below the poverty line). Table 3.1 and Table 3.2 also present a number of statistics that help explain why children enter poverty.• The second column shows how likely each event is for children initially not in poverty. For
example, only one per cent of children not in poverty were in a couple family where the parents separated.
• The third column shows how likely children who experienced the event were to enter poverty. For example, 14 per cent of children not in poverty whose parents separated entered poverty. So although separation is a rare event, for children whose parents did separate, their risk of poverty was twice as high as average.
• The fourth column shows the proportion of children who entered poverty who also experienced the event. So this combines the previous information on how likely the event is to occur and the likelihood of entering poverty for those who did experience the event. For example, given that parental separation was so rare, we would not expect many children who entered poverty to have experienced that event. Indeed, only one per cent of children who entered poverty had experienced parental separation over the same period.
• The final column shows the number of children in the survey who are not in poverty and who have that event or factor.
Each of these statistics is important. The poverty entry rate often receives attention because it shows the ‘risk’ of entering poverty for children who have experienced that event. So looking down the table it is clear to see that the risk of entering poverty was particularly high for children whose parents lost work and the family became workless. However, because relatively few children lived in families that went from working to workless, the proportion of children who entered poverty from these families (i.e. ‘share of all entries’) was relatively low (13 per cent of all children entering poverty).
Economic characteristics linked to poverty entryTo make a transition into poverty, children need to have been living in families that experienced a non-trivial drop in (equivalised) income. Unsurprisingly it was children living in families with income closest to the poverty line that were at most risk of entering poverty. Many of these families would only have had one earner, and so any change in circumstance would have a big impact on the family income. Families higher up the income distribution are more likely to have dual earners; thereby if one experiences a reduction in earnings the other’s earnings can protect the family from poverty (Barnes and Lord, 2013).
35
Child poverty transitions
Most of the income received by low-income families, whether in or near to the poverty line, is made up from earnings and benefits. Hence families who enter poverty were likely to have experienced a drop in earnings and/or a drop in benefits. Approximately half (53 per cent) of poverty entries involved a fall in earnings and a similar proportion (63 per cent) involved a drop in benefits.
Those who experienced a drop in earnings could have done so for a number of reasons; such as parents who stayed in work but with reduced hours/earnings,20 or parents who become workless. Of children who entered poverty and were initially in work:• Sixteen per cent had parents in part employment who saw a fall in earnings.
• Eleven per cent had parents in full employment who saw a fall in earnings.
• Ten per cent had parents who changed from full to part employment.
• Nine per cent had parents who became workless having been in part employment.
• Four per cent had parents who became workless having been in full employment.
Defining family work statusFull employment: lone parent working 30 or more hours per week, or couples where both parents are working and at least one of them is working 30 or more hours per week.
Part employment: lone parent working fewer than 30 hours per week, couples both working fewer than 30 hours per week, couples one parent working the other workless.
Workless: no parent is in work.
The regression analysis confirms that a ‘negative’ change in the economic status of the family (i.e. losing work) was the biggest independent predictor of a child entering poverty.21
• Children living in a family that went from full employment to workless had around 24 times the odds of entering poverty compared with children whose parents were in part employment in both time points and had no change in earnings.
• Children living in a family that went from part employment to workless had around 20 times the odds of entering poverty compared with children whose parents were in part employment in both time points and had no change in earnings.
20 Some children who entered poverty had parents who remained in work and did not see a fall in earnings (at least not a fall above ten per cent), and these families were likely to have been closer to the poverty line and experienced another event such a new child.
21 A number of children who entered poverty came from families that had been workless in both years. These families were not affected by a change in earnings – they were not in work – and hence were likely to have experienced a reduction in benefit income, or have a demographic event, such as a new child, that would increase the family’s needs. These families may also have misreported their benefit income, for example reducing the amount of benefit they receive by a relatively small amount, but enough to push them over the poverty line. See Table A38 to Table A40 in the annex for more information.

36
Child poverty transitions
• Children living in a family that went from full employment to part employment had around five times the odds of entering poverty compared with children whose parents were in part employment in both time points and had no change in earnings.
• Children living in a family who remained in the same employment status but had a fall in earnings were more likely to enter poverty, with those in part employment having around five times the odds of entering poverty, and those in full employment having around twice the odds of entering poverty, compared with children whose parents were in part employment in both time points and had no change in earnings.
A reduction in benefit income was another independent predictor of poverty entry. This did not only affect workless families. In-work families, especially those close to the poverty line, were also likely to receive benefit income and hence a reduction in benefit income could risk pushing them over the poverty line. A fall in benefit income is likely to be due to a change in household circumstances (such as employment or household composition) leading to a change in eligibility.• Children living in a family who had experienced at least a ten per cent fall in benefit income
had around 4.5 times the odds of entering poverty, compared with children in families who did not have this fall in benefit income.22
Having another working adult in the same household but not in the family unit (for example, a grandparent) was independently associated with poverty entry. Children who lived with another working adult in time point 1, but no other adults in time point 2, had around twice the odds of entering poverty compared to children who lived with no other adults in either time point.
Having a parent who was long-term workless (currently workless and had been for more than one year) was not independently associated with poverty entry.
Table 3.1 Child poverty entry rate by economic risk factors and events
Entry rate of all children = 7% Prevalence of event/factor1
(col %)
Entry rate, conditional on event2
(%)
Share of all entries3
(col %)
Base
(n)
16,433
Income sources4
Change: Fall in earnings 27 15 52 4,297Change: Fall in benefit income 35 13 63 5,711Change: Fall in non-benefit, non-earnings income 9 7 9 1,418Change: Fall in investment income 6 5 4 878Income deciles2nd 2 23 5 2423rd 13 19 32 2,1434th 13 10 17 2,100
(Continued)
22 To help identify genuine poverty transitions a poverty entry or exit is only counted when it involved moving at least ten per cent below or above the poverty line. Therefore a fall in an income source is only counted where it has decreased by at least ten per cent and the difference is an absolute monetary value of at least £10 a week (£43.45 a month).
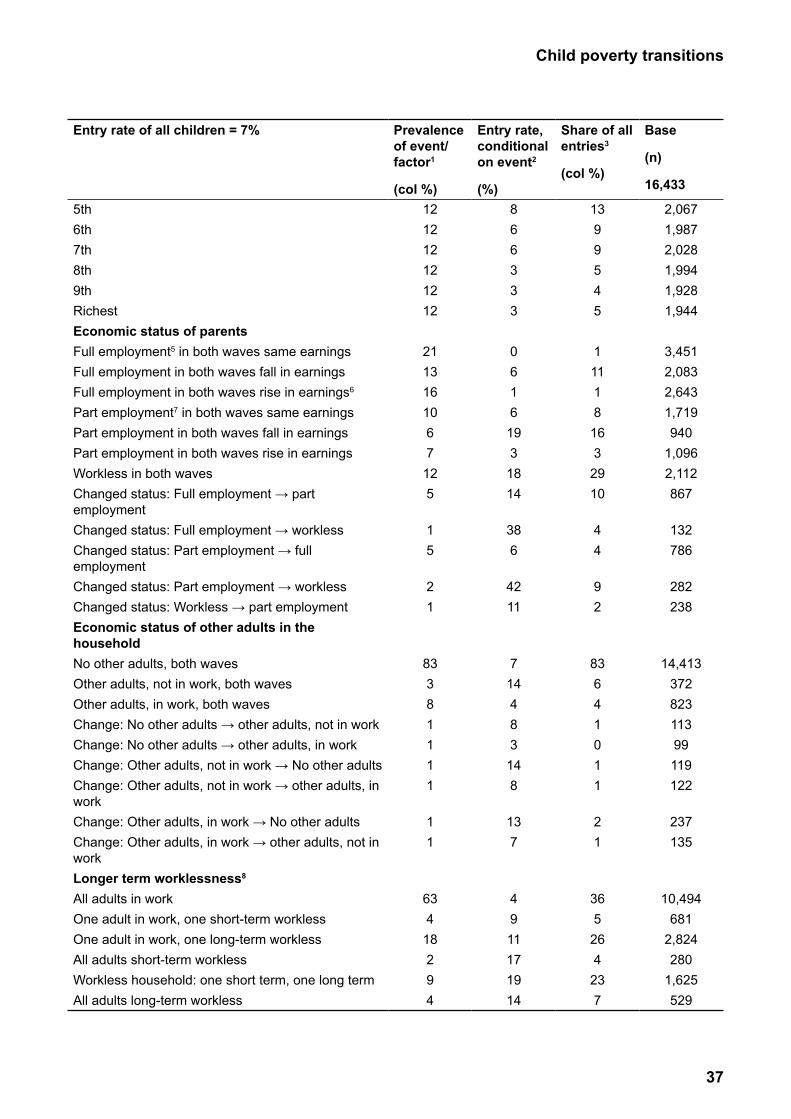
37
Child poverty transitions
Entry rate of all children = 7% Prevalence of event/factor1
(col %)
Entry rate, conditional on event2
(%)
Share of all entries3
(col %)
Base
(n)
16,433
5th 12 8 13 2,0676th 12 6 9 1,9877th 12 6 9 2,0288th 12 3 5 1,9949th 12 3 4 1,928Richest 12 3 5 1,944Economic status of parentsFull employment5 in both waves same earnings 21 0 1 3,451Full employment in both waves fall in earnings 13 6 11 2,083Full employment in both waves rise in earnings6 16 1 1 2,643Part employment7 in both waves same earnings 10 6 8 1,719Part employment in both waves fall in earnings 6 19 16 940Part employment in both waves rise in earnings 7 3 3 1,096Workless in both waves 12 18 29 2,112Changed status: Full employment → part 5 14 10 867employmentChanged status: Full employment → workless 1 38 4 132Changed status: Part employment → full 5 6 4 786employmentChanged status: Part employment → workless 2 42 9 282Changed status: Workless → part employment 1 11 2 238Economic status of other adults in the householdNo other adults, both waves 83 7 83 14,413Other adults, not in work, both waves 3 14 6 372Other adults, in work, both waves 8 4 4 823Change: No other adults → other adults, not in work 1 8 1 113Change: No other adults → other adults, in work 1 3 0 99Change: Other adults, not in work → No other adults 1 14 1 119Change: Other adults, not in work → other adults, in 1 8 1 122workChange: Other adults, in work → No other adults 1 13 2 237Change: Other adults, in work → other adults, not in 1 7 1 135workLonger term worklessness8
All adults in work 63 4 36 10,494One adult in work, one short-term workless 4 9 5 681One adult in work, one long-term workless 18 11 26 2,824All adults short-term workless 2 17 4 280Workless household: one short term, one long term 9 19 23 1,625All adults long-term workless 4 14 7 529
38
Child poverty transitions
1. This shows the proportion of children not in poverty in the first wave with the characteristic.2. This shows the poverty entry rate for children with this characteristic.3. This shows the proportion of children who entered poverty who have this characteristic.4. A fall in an income source is where it has decreased by at least ten per cent and the difference is an absolute monetary value of at least £10 a week (£43.45 a month).5. Couple: both in full-time work, Couple: one parent in full-time work and one parent in part-time work, Lone parent in full-time work.6. A rise in an income source is where it has increased by at least ten per cent and the difference is an absolute monetary value of at least £10 a week (£43.45 a month).7. Couple: one parent in full-time work, Couple: one parent in part-time work, Couple: both in part-time work, Lone parent in part-time work.8. Long-term workless is either never having worked or having not having worked for a year or longer, short-term workless is having last worked less than a year previously.
Household characteristicsNon-economic events can also be associated with families entering poverty. This could either happen directly, through an increase in income needs such as having a new child, or indirectly, such as parents separating and leaving the family with fewer full-time workers. Interestingly, parental separation does not appear to be independently associated with poverty entry after controlling for other predictors. This is likely to be because, as suggested previously, when families separate the children tend to live with the mother who was often previously not the main earner. Going from full- to part-employment, or becoming workless, has a more direct impact on family income and therefore outweighs the effect of parental separation.
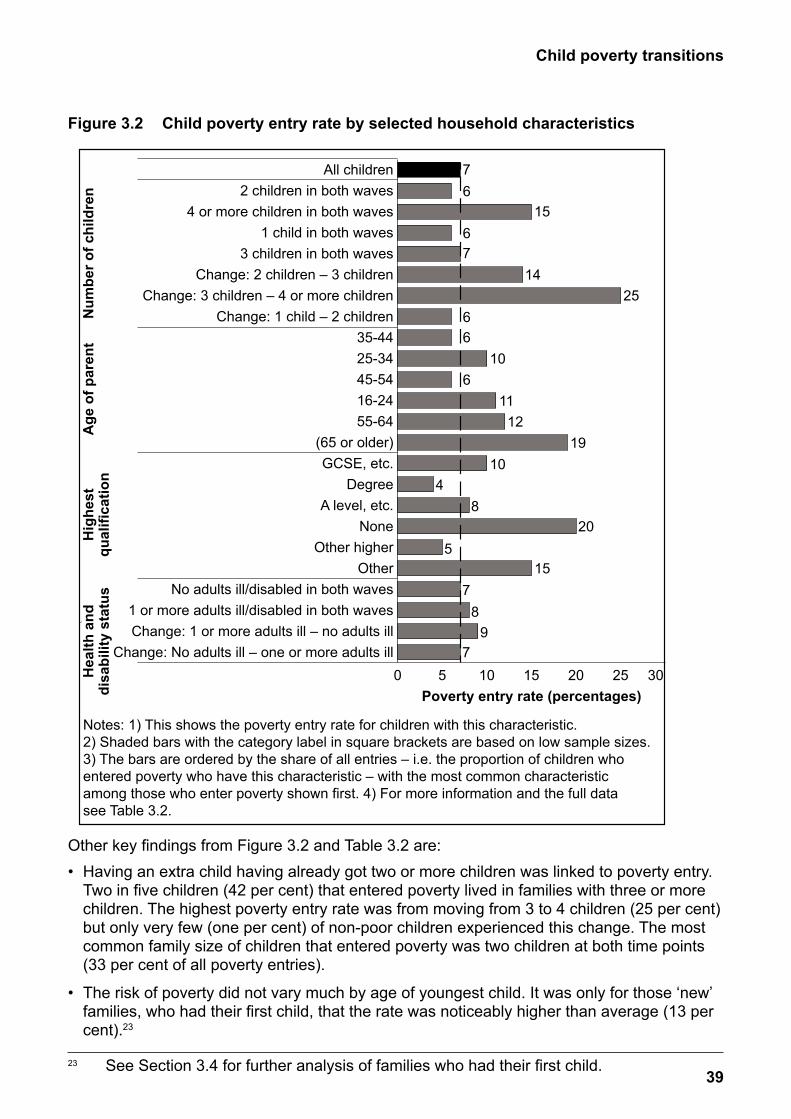
39
Child poverty transitions
Figure 3.2 Child poverty entry rate by selected household characteristics
Other key findings from Figure 3.2 and Table 3.2 are:• Having an extra child having already got two or more children was linked to poverty entry.
Two in five children (42 per cent) that entered poverty lived in families with three or more children. The highest poverty entry rate was from moving from 3 to 4 children (25 per cent) but only very few (one per cent) of non-poor children experienced this change. The most common family size of children that entered poverty was two children at both time points (33 per cent of all poverty entries).
• The risk of poverty did not vary much by age of youngest child. It was only for those ‘new’ families, who had their first child, that the rate was noticeably higher than average (13 per cent).23
23 See Section 3.4 for further analysis of families who had their first child.
Num
ber o
f chi
ldre
nA
ge o
f par
ent
Poverty entry rate (percentages)
Notes: 1) This shows the poverty entry rate for children with this characteristic.2) Shaded bars with the category label in square brackets are based on low sample sizes. 3) The bars are ordered by the share of all entries – i.e. the proportion of children who entered poverty who have this characteristic – with the most common characteristic among those who enter poverty shown first. 4) For more information and the full datasee Table 3.2.
0 5 10 15 20 25 30Change: No adults ill – one or more adults ill
Change: 1 or more adults ill – no adults ill1 or more adults ill/disabled in both waves
No adults ill/disabled in both wavesOther
Other higherNone
A level, etc.Degree
GCSE, etc.(65 or older)
55-6416-2445-5425-3435-44
Change: 1 child – 2 childrenChange: 3 children – 4 or more children
Change: 2 children – 3 children3 children in both waves
1 child in both waves4 or more children in both waves
2 children in both wavesAll children 7
6
67
66
6
48
5
78
97
15
1425
10
1112
1910
20
15
Hig
hest
qu
alifi
catio
nH
ealth
and
di
sabi
lity
stat
us
40
Child poverty transitions
• The risk of poverty entry was higher for children whose parents had no educational qualifications (20 per cent). Again there was a lot of variation of children who entered poverty – there were just as many children in degree-level families entering poverty as those whose highest qualification was A-Level – although children in degree-level families were also the most prevalent group among those not in poverty.
• Children with younger or older parents were most at risk of entering poverty. However, relatively few children had parents under 25 or over 55.
• Although poverty entry rates were highest for children who lived in social rented accommodation (16 per cent compared to five per cent for owner occupied), a similar proportion of children who entered poverty came from owner occupied accommodation (42 per cent from social rented and 44 per cent from owner occupied).
• Most children that entered poverty were white. However, a disproportionate number were from ethnic minorities. The highest rates of poverty were found among Pakistani (19 per cent), Bangladeshi (16 per cent) and black African (15 per cent) children.24
• A change in parental health status had an inverse impact on poverty entry, with children with parents who became ill or disabled less likely to enter poverty than children with parents who were no longer ill or disabled. This could be linked to higher incomes in the form of health-related benefits25 combined with the fact the income definition used does not take account of extra costs associated with disability.
24 We have defined this by taking the ethnicity of the mother. Where information on ethnicity of the mother is not available, ethnicity of the father is used instead. How poverty entry varies for children from different ethnic minority groups is explored in more detail in the next section.
25 Note the health was self-reported and not diagnosed by a medical professional.
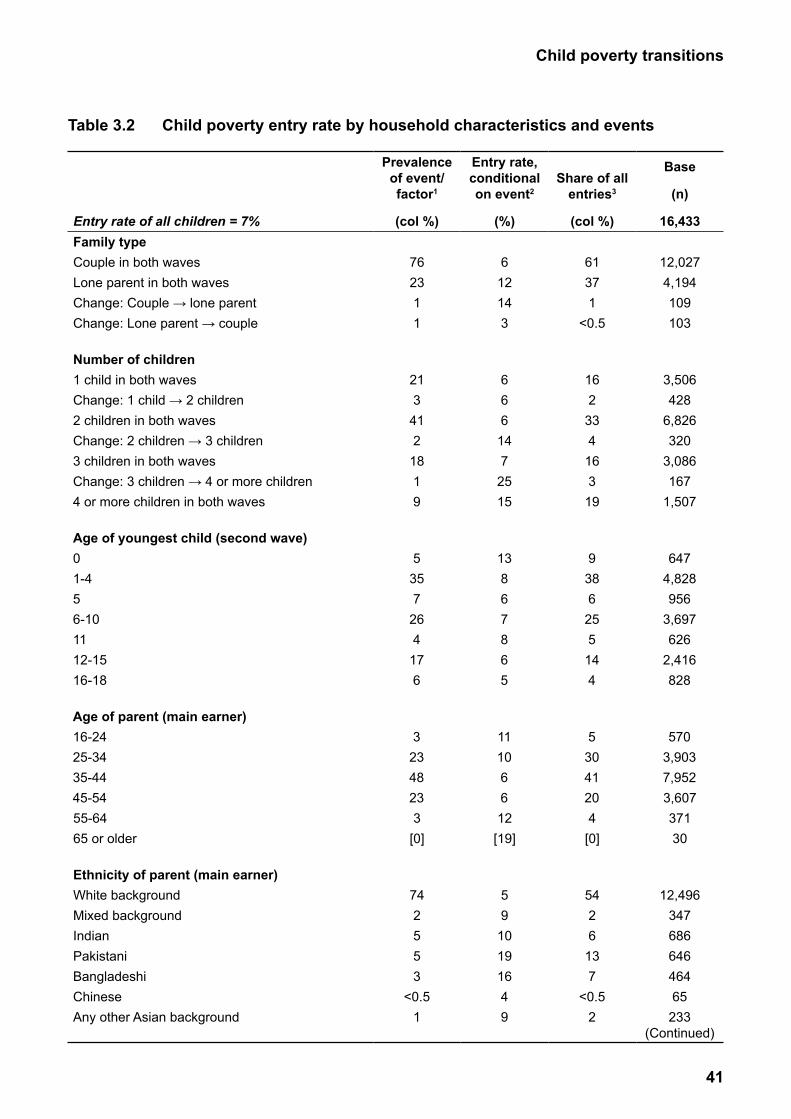
41
Child poverty transitions
Table 3.2 Child poverty entry rate by household characteristics and events
Entry rate of all children = 7%
Prevalence of event/factor1
(col %)
Entry rate, conditional on event2
(%)
Share of all entries3
(col %)
Base
(n)
16,433Family typeCouple in both waves 76 6 61 12,027Lone parent in both waves 23 12 37 4,194Change: Couple → lone parent 1 14 1 109Change: Lone parent → couple 1 3 <0.5 103 Number of children1 child in both waves 21 6 16 3,506Change: 1 child → 2 children 3 6 2 4282 children in both waves 41 6 33 6,826Change: 2 children → 3 children 2 14 4 3203 children in both waves 18 7 16 3,086Change: 3 children → 4 or more children 1 25 3 1674 or more children in both waves 9 15 19 1,507 Age of youngest child (second wave)0 5 13 9 6471-4 35 8 38 4,8285 7 6 6 9566-10 26 7 25 3,69711 4 8 5 62612-15 17 6 14 2,41616-18 6 5 4 828 Age of parent (main earner)16-24 3 11 5 57025-34 23 10 30 3,90335-44 48 6 41 7,95245-54 23 6 20 3,60755-64 3 12 4 37165 or older [0] [19] [0] 30 Ethnicity of parent (main earner)White background 74 5 54 12,496Mixed background 2 9 2 347Indian 5 10 6 686Pakistani 5 19 13 646Bangladeshi 3 16 7 464Chinese <0.5 4 <0.5 65Any other Asian background 1 9 2 233
(Continued)
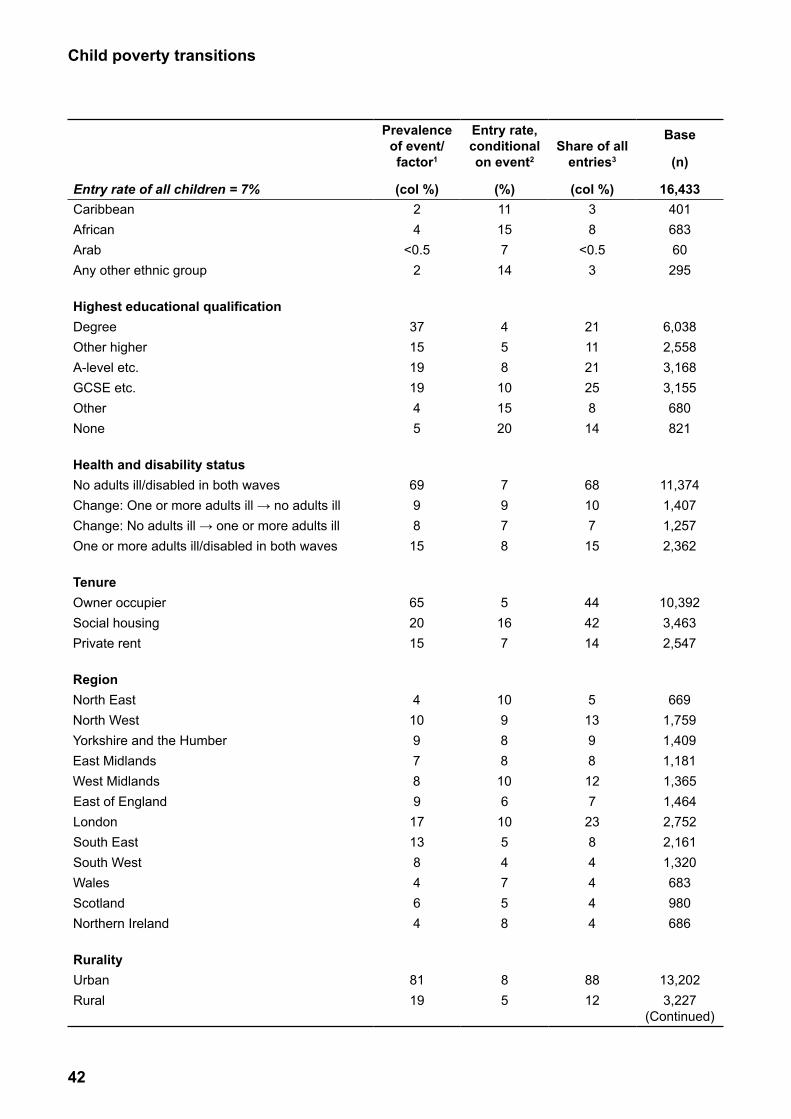
42
Child poverty transitions
Entry rate of all children = 7%
Prevalence of event/factor1
(col %)
Entry rate, conditional on event2
(%)
Share of all entries3
(col %)
Base
(n)
16,433Caribbean 2 11 3 401African 4 15 8 683Arab <0.5 7 <0.5 60Any other ethnic group 2 14 3 295 Highest educational qualificationDegree 37 4 21 6,038Other higher 15 5 11 2,558A-level etc. 19 8 21 3,168GCSE etc. 19 10 25 3,155Other 4 15 8 680None 5 20 14 821 Health and disability statusNo adults ill/disabled in both waves 69 7 68 11,374Change: One or more adults ill → no adults ill 9 9 10 1,407Change: No adults ill → one or more adults ill 8 7 7 1,257One or more adults ill/disabled in both waves 15 8 15 2,362 TenureOwner occupier 65 5 44 10,392Social housing 20 16 42 3,463Private rent 15 7 14 2,547 RegionNorth East 4 10 5 669North West 10 9 13 1,759Yorkshire and the Humber 9 8 9 1,409East Midlands 7 8 8 1,181West Midlands 8 10 12 1,365East of England 9 6 7 1,464London 17 10 23 2,752South East 13 5 8 2,161South West 8 4 4 1,320Wales 4 7 4 683Scotland 6 5 4 980Northern Ireland 4 8 4 686
Rurality Urban 81 8 88 13,202Rural 19 5 12 3,227
(Continued)
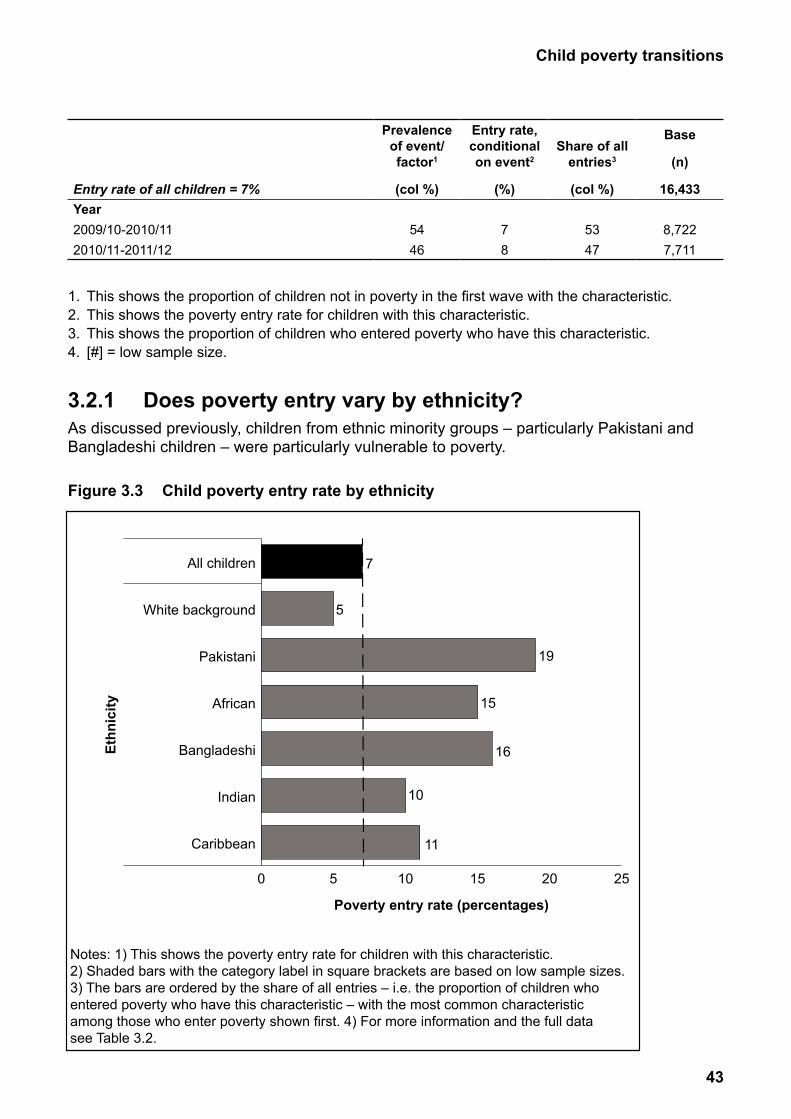
43
Child poverty transitions
Entry rate of all children = 7%
Prevalence of event/factor1
(col %)
Entry rate, conditional on event2
(%)
Share of all entries3
(col %)
Base
(n)
16,433Year 2009/10-2010/11 54 7 53 8,7222010/11-2011/12 46 8 47 7,711
1. This shows the proportion of children not in poverty in the first wave with the characteristic.2. This shows the poverty entry rate for children with this characteristic.3. This shows the proportion of children who entered poverty who have this characteristic.4. [#] = low sample size.
3.2.1 Does poverty entry vary by ethnicity?As discussed previously, children from ethnic minority groups – particularly Pakistani and Bangladeshi children – were particularly vulnerable to poverty.
Figure 3.3 Child poverty entry rate by ethnicity
Ethn
icity
Poverty entry rate (percentages)
Notes: 1) This shows the poverty entry rate for children with this characteristic.2) Shaded bars with the category label in square brackets are based on low sample sizes. 3) The bars are ordered by the share of all entries – i.e. the proportion of children who entered poverty who have this characteristic – with the most common characteristic among those who enter poverty shown first. 4) For more information and the full datasee Table 3.2.
7
5
19
15
16
10
11
0 5 10 15 20 25
Caribbean
Indian
Bangladeshi
African
Pakistani
White background
All children
44
Child poverty transitions
The causes of poverty for ethnic-minority families are complex, but there is already some evidence that ethnicity is linked to low income even when other factors are accounted for (Longhi and Platt, 2008; Barnes et al., 2008a; Hills et al., 2010). In the recent Child Poverty Strategy (DWP, 2014b) the Government has committed to monitor poverty amongst these groups and to consider the likely impact of anti-poverty policies. However, in general there is relatively little analysis of why the poverty risks are so high for black and minority ethnic (BME) children, usually because of the small number of ethnic respondents in panel surveys. The ethnic minority boost sample in USoc allows for such investigations to be reported here.
The aforementioned regression analysis to identify predictors of entering child poverty was repeated for children from each ethnic group (albeit recategorised into ‘South Asian’ and ‘black’ to provide robust sample sizes). The main findings are:• Again, work transitions played a large role in predicting poverty entry for all ethnic groups.
• Being long-term workless seemed a particular problem for both South Asian and black families.
However, some interesting differences between ethnic groups emerged. For example, children particularly at risk of entering poverty were: • South Asian children from lone parent families.
• South Asian children living with a workless additional adult (for example, a grandparent).
• White children living in social housing.
These findings are worthy of further analysis given that the number of ethnic minority children in some of these sub-groups is still low. In time further pairs of waves of USoc can be combined to increase the sample size of these sub-groups.
3.3 Entering poverty from employmentOur earlier analysis showed that although there were a large number of factors linked to poverty entry, the most strongly linked were associated with labour market transitions. This section explores further some of the main routes into poverty for children whose parents were initially in work.
Figure 3.4 illustrates the income distribution of children who entered poverty from families initially in work. Many families were initially quite close to the poverty line (31 per cent of entrants had household income no higher than the third income decile, and 62 per cent had incomes less than the median (approximately £1,000 pm)). However, some entered poverty from further up the income distribution (29 per cent had family income greater than around £1,300).
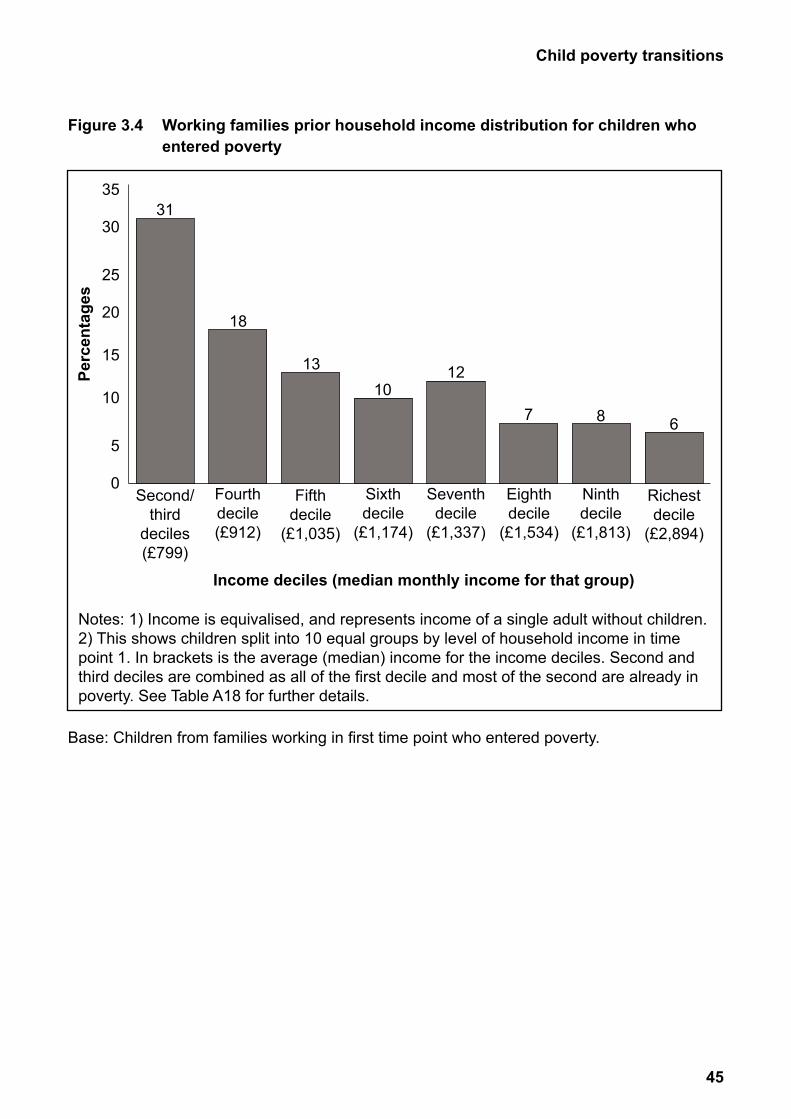
45
Child poverty transitions
Figure 3.4 Working families prior household income distribution for children who entered poverty
Base: Children from families working in first time point who entered poverty.
Income deciles (median monthly income for that group)
Notes: 1) Income is equivalised, and represents income of a single adult without children. 2) This shows children split into 10 equal groups by level of household income in time point 1. In brackets is the average (median) income for the income deciles. Second and third deciles are combined as all of the first decile and most of the second are already in poverty. See Table A18 for further details.
0
5
10
15
20
25
30
35
Richestdecile
(£2,894)
Ninthdecile
(£1,813)
Eighthdecile
(£1,534)
Seventhdecile
(£1,337)
Sixthdecile
(£1,174)
Fifthdecile
(£1,035)
Fourthdecile(£912)
Second/third
deciles(£799)
31
18
1310
12
7 8 6
Perc
enta
ges

46
Child poverty transitions
3.3.1 Type of work Previous research has generally not gone into great detail on the labour market characteristics of those who enter poverty and what exists is somewhat old. Other studies26 which have examined employment and poverty dynamically have tended to focus on recurrent poverty, i.e. repeated poverty entries and exits, rather than just entries or exits per se.
Stewart (2008)27 conducted a study into single mothers in low-skilled work and discovered that those in the manual and catering industries are more susceptible to unstable jobs, whilst those working in construction are more susceptible to low pay and in-work poverty.
26 McQuaid, R., Fuertes, V. and Richard, A. (2010) How can Parents Escape from Recurrent Poverty?, York: Joseph Rowntree Foundation http://www.jrf.org.uk/sites/files/jrf/parents-escaping-poverty-full.pdf Ray, K., Hoggart, L., Vegris, S. and Taylor, R. (2010) Better off Working? Work, Poverty and Benefit Cycling? York: Joseph Rowntree Foundation http://www.jrf.org.uk/sites/files/jrf/work-poverty-benefits-full.pdf Shildrick, T., MacDonald, R., Webster, C. and Garthwaite, K. (2010). The Low-Pay, No-Pay Cycle: Understanding Recurrent Poverty, York: Joseph Rowntree Foundation http://www.jrf.org.uk/publications/understanding-recurrent-poverty Tomlinson, M. and Walker, R., (2010). Recurrent Poverty: The Impact of Family and Labour Market Changes, York: Joseph Rowntree Foundation. http://www.jrf.org.uk/sites/files/jrf/recurrent-poverty-impacts-full.pdf
27 Stewart, K. (2008). Employment Trajectories for Mothers in Low-skilled Work: Evidence From the British Lone Parent Cohort. CASE. Discussion paper 122, London: London School of Economics and Political Science http://eprints.lse.ac.uk/6215/
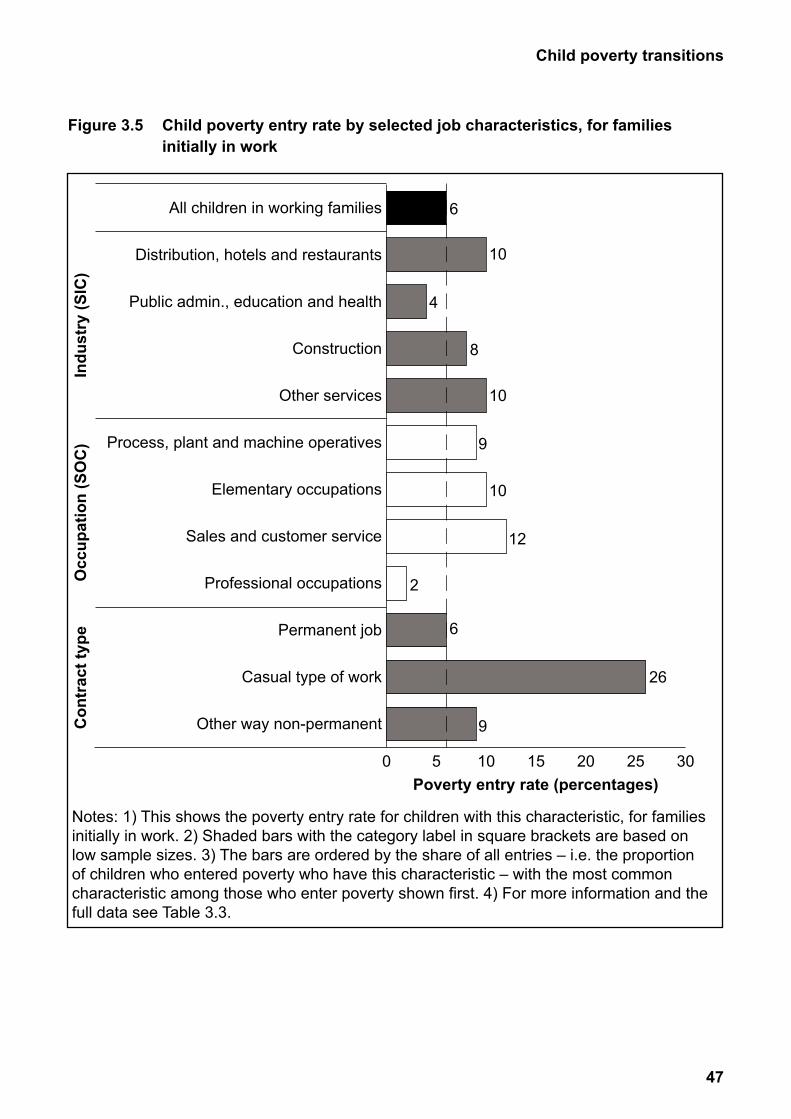
47
Child poverty transitions
Figure 3.5 Child poverty entry rate by selected job characteristics, for families initially in work
Indu
stry
(SIC
)O
ccup
atio
n (S
OC
)C
ontr
act t
ype
Poverty entry rate (percentages)
Notes: 1) This shows the poverty entry rate for children with this characteristic, for families initially in work. 2) Shaded bars with the category label in square brackets are based on low sample sizes. 3) The bars are ordered by the share of all entries – i.e. the proportion of children who entered poverty who have this characteristic – with the most common characteristic among those who enter poverty shown first. 4) For more information and the full data see Table 3.3.
0 5 10 15 20 25 30
Other way non-permanent
Casual type of work
Permanent job
Professional occupations
Sales and customer service
Elementary occupations
Process, plant and machine operatives
Other services
Construction
Public admin., education and health
Distribution, hotels and restaurants
All children in working families 6
4
8
9
2
6
9
10
10
12
10
26

48
Child poverty transitions
Figure 3.5 and Table 3.3 illustrate the impact of occupation, contract type and industry type on poverty entry. The main findings are:• The propensity to enter poverty varied according to the industry of the main earner. When
taking into account the impact of all the predictors, there was an independent association between sector and the risk of entering poverty – children in working families were more likely to enter poverty if the main earner worked in the construction sector. Other industries with high poverty rates were:
– Distribution, hotels and restaurants (ten per cent)
– Other services (ten per cent), although very few families were in this latter group
• Almost half (45 per cent) of children who entered poverty had a parent who worked in either distribution, hotels and restaurants (25 per cent), or, public admin, education and health (20% per cent) (it is worth noting that of all children not in poverty, public admin, education and health was the most common industry (32 per cent) over twice as prevalent as any other industry).
• When taking into account the impact of all predictors, there was an independent association between occupation and the risk of entering poverty. Children with parents who worked in professional occupations were less likely to enter poverty (than skilled trades). In general, poverty entry rates were slightly higher than average for families with workers from lower grade occupations:
– Sales and customer service (12 per cent).
– Process, plant and machine operatives (nine per cent).
– Elementary occupations (ten per cent).
• Poverty rates were also high for children in families with workers on casual contracts, although there were only 107 of these children in the survey (one per cent). Around a quarter (26 per cent) of these 107 children in the survey whose parents worked on a casual contract entered poverty, although these only made up a very small proportion of all poverty entrees (three per cent) as very few had this type of contract. There was no independent link between contract type and poverty entry risk, although this may have been due to the low numbers of people with non-permanent contracts in the survey.
Table 3.3 Child poverty entry rate by economic characteristics for families initially in work
Entry rate of all children in working families in the first wave = 6%
Prevalence of event/factor1
(col %)
Entry rate, conditional on event2
(%)
Share of all entries3
(col %)
Base
(n)
13,999
Income sourcesFall in benefit income 33 9 53 4,631Fall in non-benefit, non-earnings income 9 6 9 1,207Fall in investment income 6 4 4 842Fall in private and occupational pension income [0] [4] [0] 49
(Continued)
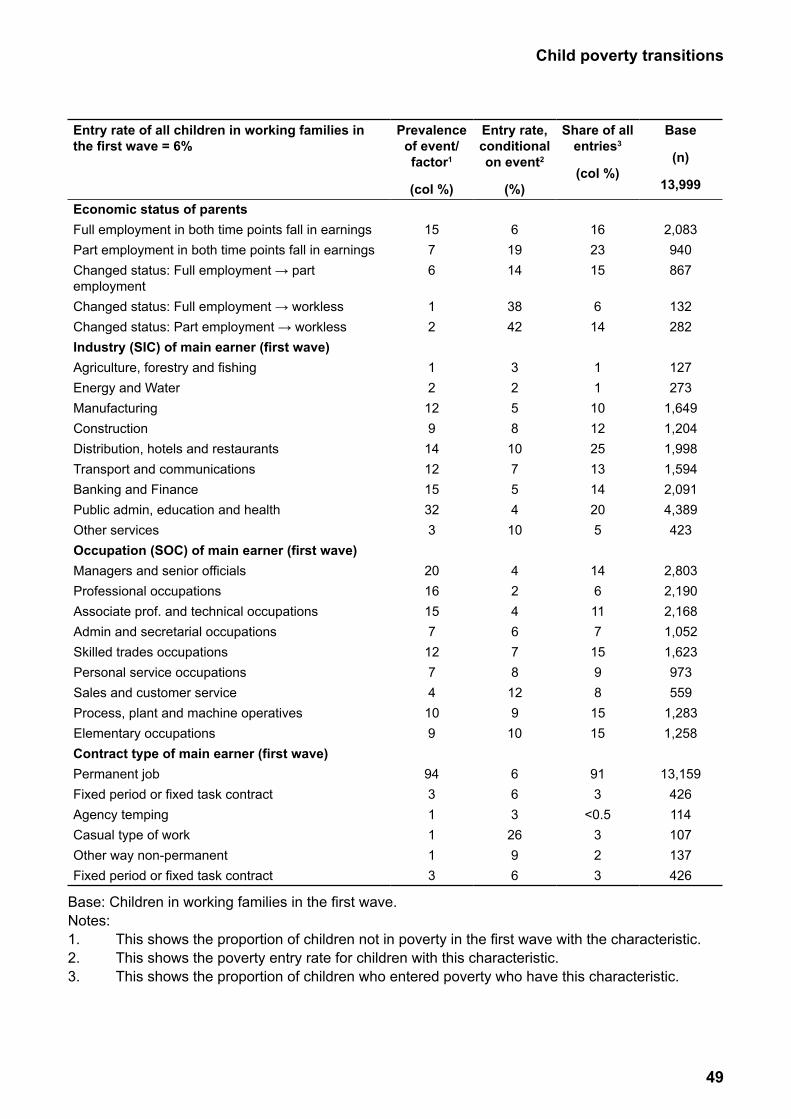
49
Child poverty transitions
Entry rate of all children in working families in the first wave = 6%
Prevalence of event/factor1
(col %)
Entry rate, conditional on event2
(%)
Share of all entries3
(col %)
Base
(n)
13,999
Economic status of parentsFull employment in both time points fall in earnings 15 6 16 2,083Part employment in both time points fall in earnings 7 19 23 940Changed status: Full employment → part employment
6 14 15 867
Changed status: Full employment → workless 1 38 6 132Changed status: Part employment → workless 2 42 14 282Industry (SIC) of main earner (first wave)Agriculture, forestry and fishing 1 3 1 127Energy and Water 2 2 1 273Manufacturing 12 5 10 1,649Construction 9 8 12 1,204Distribution, hotels and restaurants 14 10 25 1,998Transport and communications 12 7 13 1,594Banking and Finance 15 5 14 2,091Public admin, education and health 32 4 20 4,389Other services 3 10 5 423Occupation (SOC) of main earner (first wave)Managers and senior officials 20 4 14 2,803Professional occupations 16 2 6 2,190Associate prof. and technical occupations 15 4 11 2,168Admin and secretarial occupations 7 6 7 1,052Skilled trades occupations 12 7 15 1,623Personal service occupations 7 8 9 973Sales and customer service 4 12 8 559Process, plant and machine operatives 10 9 15 1,283Elementary occupations 9 10 15 1,258Contract type of main earner (first wave)Permanent job 94 6 91 13,159Fixed period or fixed task contract 3 6 3 426Agency temping 1 3 <0.5 114Casual type of work 1 26 3 107Other way non-permanent 1 9 2 137Fixed period or fixed task contract 3 6 3 426
Base: Children in working families in the first wave.Notes:1. This shows the proportion of children not in poverty in the first wave with the characteristic.2. This shows the poverty entry rate for children with this characteristic.3. This shows the proportion of children who entered poverty who have this characteristic.
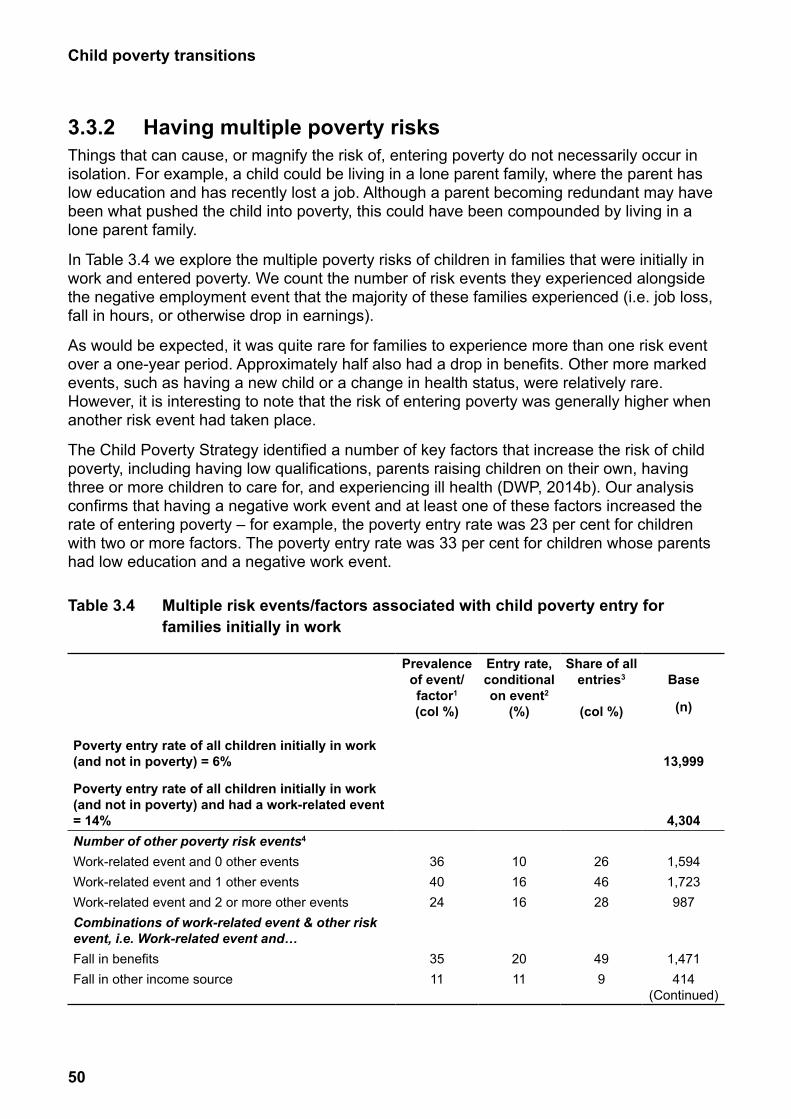
50
3.3.2 Having multiple poverty risksThings that can cause, or magnify the risk of, entering poverty do not necessarily occur in isolation. For example, a child could be living in a lone parent family, where the parent has low education and has recently lost a job. Although a parent becoming redundant may have been what pushed the child into poverty, this could have been compounded by living in a lone parent family.
In Table 3.4 we explore the multiple poverty risks of children in families that were initially in work and entered poverty. We count the number of risk events they experienced alongside the negative employment event that the majority of these families experienced (i.e. job loss, fall in hours, or otherwise drop in earnings).
As would be expected, it was quite rare for families to experience more than one risk event over a one-year period. Approximately half also had a drop in benefits. Other more marked events, such as having a new child or a change in health status, were relatively rare. However, it is interesting to note that the risk of entering poverty was generally higher when another risk event had taken place.
The Child Poverty Strategy identified a number of key factors that increase the risk of child poverty, including having low qualifications, parents raising children on their own, having three or more children to care for, and experiencing ill health (DWP, 2014b). Our analysis confirms that having a negative work event and at least one of these factors increased the rate of entering poverty – for example, the poverty entry rate was 23 per cent for children with two or more factors. The poverty entry rate was 33 per cent for children whose parents had low education and a negative work event.
Table 3.4 Multiple risk events/factors associated with child poverty entry for families initially in work
Prevalence Entry rate, Share of all of event/ conditional entries3 Basefactor1 on event2 (col %) (%) (col %) (n)
Poverty entry rate of all children initially in work (and not in poverty) = 6% 13,999
Poverty entry rate of all children initially in work (and not in poverty) and had a work-related event = 14% 4,304Number of other poverty risk events4
Work-related event and 0 other events 36 10 26 1,594Work-related event and 1 other events 40 16 46 1,723Work-related event and 2 or more other events 24 16 28 987Combinations of work-related event & other risk event, i.e. Work-related event and…Fall in benefits 35 20 49 1,471Fall in other income source 11 11 9 414
(Continued)
Child poverty transitions
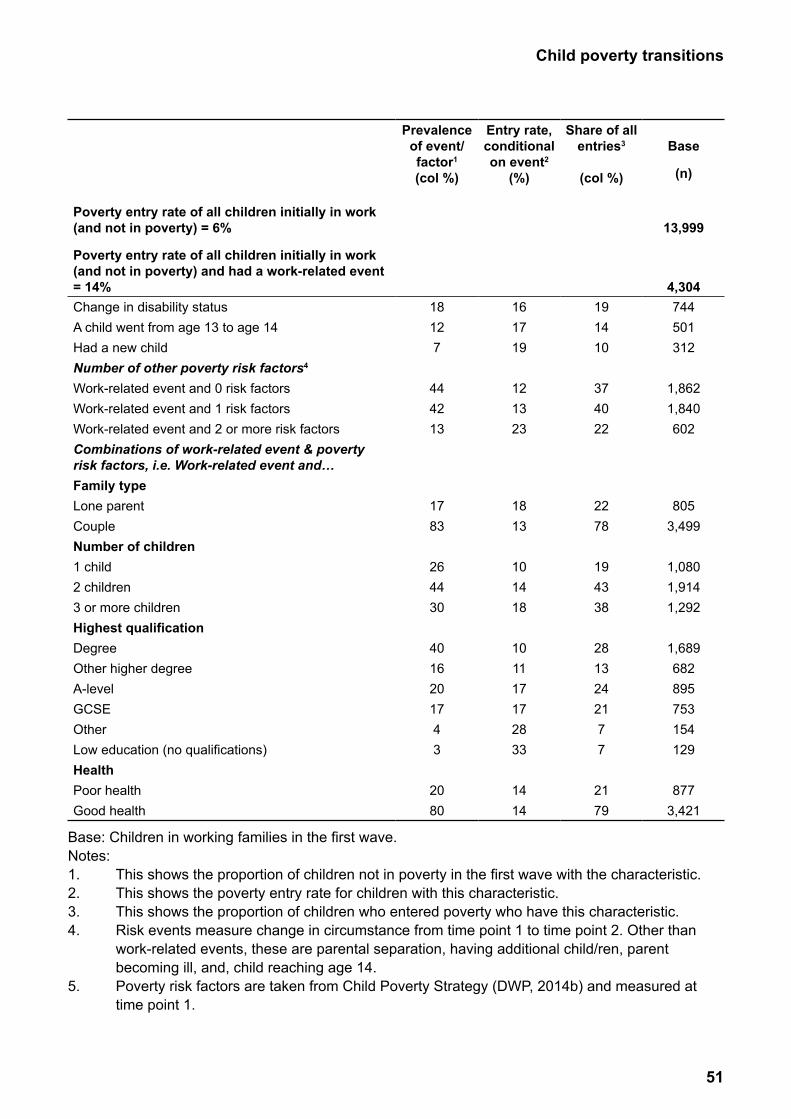
51
Child poverty transitions
Prevalence Entry rate, Share of all of event/ conditional entries3 Basefactor1 on event2 (col %) (%) (col %) (n)
Poverty entry rate of all children initially in work (and not in poverty) = 6% 13,999
Poverty entry rate of all children initially in work (and not in poverty) and had a work-related event = 14% 4,304Change in disability status 18 16 19 744A child went from age 13 to age 14 12 17 14 501Had a new child 7 19 10 312Number of other poverty risk factors4
Work-related event and 0 risk factors 44 12 37 1,862Work-related event and 1 risk factors 42 13 40 1,840Work-related event and 2 or more risk factors 13 23 22 602Combinations of work-related event & poverty risk factors, i.e. Work-related event and…Family typeLone parent 17 18 22 805Couple 83 13 78 3,499Number of children1 child 26 10 19 1,0802 children 44 14 43 1,9143 or more children 30 18 38 1,292Highest qualificationDegree 40 10 28 1,689Other higher degree 16 11 13 682A-level 20 17 24 895GCSE 17 17 21 753Other 4 28 7 154Low education (no qualifications) 3 33 7 129HealthPoor health 20 14 21 877Good health 80 14 79 3,421
Base: Children in working families in the first wave.Notes:1. This shows the proportion of children not in poverty in the first wave with the characteristic.2. This shows the poverty entry rate for children with this characteristic.3. This shows the proportion of children who entered poverty who have this characteristic.4. Risk events measure change in circumstance from time point 1 to time point 2. Other than work-related events, these are parental separation, having additional child/ren, parent becoming ill, and, child reaching age 14.5. Poverty risk factors are taken from Child Poverty Strategy (DWP, 2014b) and measured at time point 1.

52
Child poverty transitions
3.4 The risk of poverty for new families: Evidence from the Millennium Cohort Study
This section draws on Millennium Cohort Study (MCS) data to focus on poverty among ‘new families’ at the start of the new millennium. It looks in detail at the characteristics and circumstances of children who start their life in poverty. New families are defined here as families where the firstborn child28 is around nine months old. In 2001/02 Statutory Maternity leave lasted for 18-29 weeks (depending on the duration of employment prior to pregnancy)29 and hence only three per cent of mothers in the MCS were on maternity leave nine months after giving birth.
The MCS is the most recent of Britain’s world-renowned national longitudinal birth cohort studies and follows the lives of around 19,000 children born in the UK in 2000/1. The families were first interviewed when the cohort child was aged nine months and have since been followed up at ages three, five, seven and 11 years to build up a uniquely detailed portrait of the children of the new century. The analysis in this section is based on just those cohort children who had no older siblings, to provide a picture of new families.
While the MCS data on new families is now out of date, the much larger sample size allows us to look in much more detail at the characteristics of new families in poverty than is possible using more recent data. For example, despite its large sample size, Understanding Society includes a relatively small sample of new families because it is representative of all households rather than focused on specifically tracking families with a new baby. As elsewhere in the report, income poverty is defined as below 60 per cent of median equivalised income.
It is important to note that in this section we do not look at poverty transitions, as the MCS does not collect information on family income prior to the birth of the first child. Hence we focus on whether a new family was in poverty around nine months after the birth of the first child.
28 Or children in the case of families with twins or triplets.29 The Maternity and Parental Leave etc. Regulations (1999).

53
Child poverty transitions
3.4.1 Rates of povertyAround a quarter (26 per cent) of new families were income poor. This is similar to the poverty rate for all children (23 per cent) but far higher than for working-age adults without children (nine per cent for couples and 17 per cent for singles) in 2000/01 (DWP, 2014a)30. Having your first child can clearly mean an increase in the risk of being in poverty for many families.
Certain types of new family were disproportionately at risk of poverty (Figure 3.6), including:• Young mothers (73 per cent of teenage mothers and 40 per cent of those aged 20-24 were
income poor).
• Lone parents (79 per cent).
• Ethnic minorities; most notably Pakistani (65 per cent), Bangladeshi (58 per cent), black Caribbean (51 per cent) and black African (48 per cent)
• Parents with low education, for example where no parent had any formal qualifications (79 per cent).
• Parents with poor health, for example families where both parents (or the single parent in lone parent families) reported having an illness or disability that limited their activities (71 per cent).
• Workless families, not including parental leave (92 per cent of workless couple families and 94 per cent of workless lone parent families).
30 These estimates come from Households Below Average Income (HBAI) and may not be strictly comparable to MCS estimates because of the more detailed way HBAI collects income information.
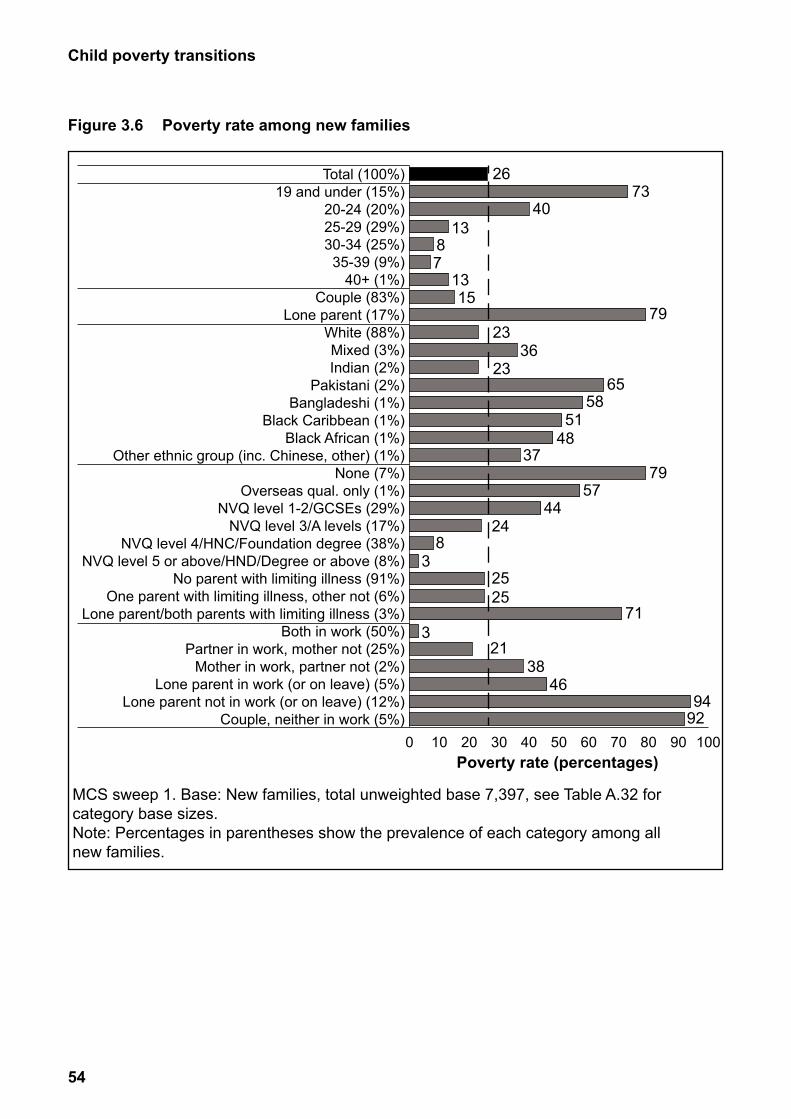
54
Child poverty transitions
Poverty rate (percentages)
MCS sweep 1. Base: New families, total unweighted base 7,397, see Table A.32 for category base sizes.Note: Percentages in parentheses show the prevalence of each category among allnew families.
87
4
3
3
8
46
21
26
13
13
7340
10
15
6558
5148
37
3623
23
7957
44
79
71
9492
24
38
0 10 20 30 40 50 60 70 80 90 100Couple, neither in work (5%)
Lone parent not in work (or on leave) (12%)Lone parent in work (or on leave) (5%)
Mother in work, partner not (2%)Partner in work, mother not (25%)
Both in work (50%)Lone parent/both parents with limiting illness (3%)
One parent with limiting illness, other not (6%)No parent with limiting illness (91%)
NVQ level 5 or above/HND/Degree or above (8%)NVQ level 4/HNC/Foundation degree (38%)
NVQ level 3/A levels (17%)NVQ level 1-2/GCSEs (29%)
Overseas qual. only (1%)None (7%)
Other ethnic group (inc. Chinese, other) (1%)Black African (1%)
Black Caribbean (1%)Bangladeshi (1%)
Pakistani (2%)Indian (2%)Mixed (3%)
White (88%)Lone parent (17%)
Couple (83%)40+ (1%)
35-39 (9%)30-34 (25%)25-29 (29%)20-24 (20%)
19 and under (15%)Total (100%)
2525
Figure 3.6 Poverty rate among new families
55
Child poverty transitions
3.4.2 New lone parent familiesThe poverty rate at the turn of the millennium among new lone parent families was very high, at four in five (79 per cent). This highlights the high risk of poverty among lone parent families with very young children. The particularly high poverty risk for new lone parent families is in part explained by the fact that they have other characteristics linked to poverty. New lone parents were disproportionately likely to be:• Younger: 42 per cent were teenage mothers compared with ten per cent of mothers in new
couple families.
• Less well educated: 21 per cent had no qualifications, compared with four per cent of new couple families.
• Less likely to be working: 31 per cent were in work, compared with 63 per cent of mothers in new couple families.
3.4.3 Family work patterns in new familiesThe MCS did not collect any income information relating to a time point prior to the birth, so it is not possible to look at poverty entry rates for new families. However, parents were asked about whether they were in work at the time of the pregnancy. Most families reported stable working patterns between pregnancy and after the baby was born, but where family working arrangements changed, the most common transition was that one parent had stopped working.• Almost a quarter (23 per cent) of all new couple families reported having gone from a dual
earner household to a one earner family.
• Around a third (34 per cent) of lone parents reported having worked in pregnancy but not after having their baby.
The vast majority of families that had not had a parent in work at either time point, or that had become workless around the time of the birth, were income poor at the time when the baby was nine months old. However, families with one parent in work at both time points also had higher than average risk of poverty. These were mainly couple families where being in work (with one worker) was not guaranteed protection from poverty. (Figure 3.7)
While overall, couple families that moved from a two earner household to a single earner family had a lower than average risk of poverty, this differed significantly by the ethnic group of the mother: 41 per cent of such new families where the mother was from an ethnic minority background were income poor, compared with 12 per cent of families where the mother was white.
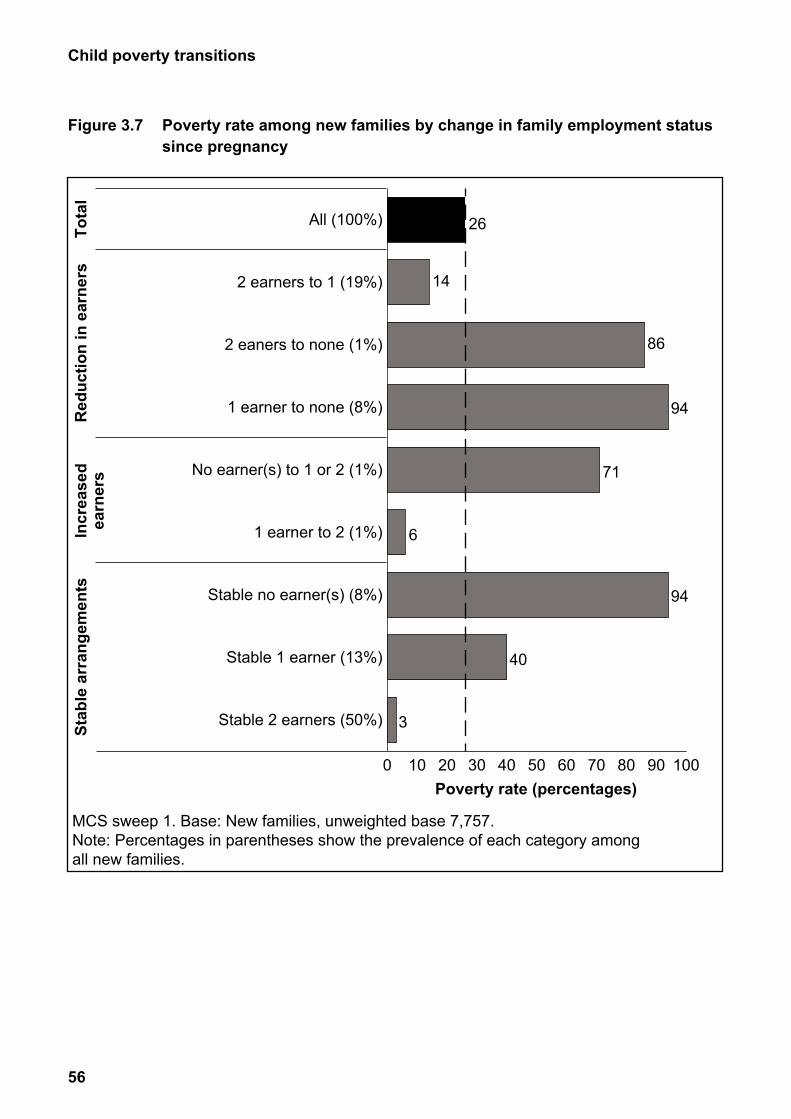
56
Child poverty transitionsTo
tal
Red
uctio
n in
ear
ners
Incr
ease
d ea
rner
sSt
able
arr
ange
men
ts
Poverty rate (percentages)
MCS sweep 1. Base: New families, unweighted base 7,757.Note: Percentages in parentheses show the prevalence of each category amongall new families.
6
3
26
0 10 20 30 40 50 60 70 80 90 100
Stable 2 earners (50%)
Stable 1 earner (13%)
Stable no earner(s) (8%)
1 earner to 2 (1%)
No earner(s) to 1 or 2 (1%)
1 earner to none (8%)
2 eaners to none (1%)
2 earners to 1 (19%)
All (100%)
86
94
71
94
40
14
Figure 3.7 Poverty rate among new families by change in family employment status since pregnancy
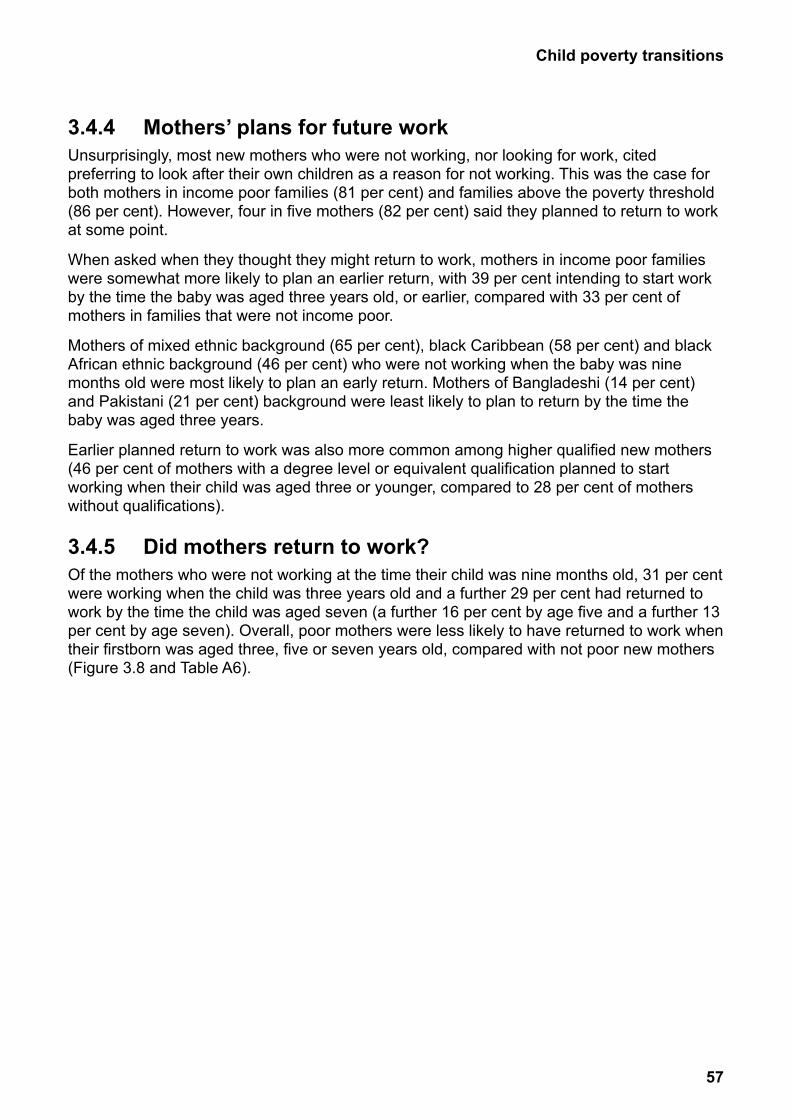
57
Child poverty transitions
3.4.4 Mothers’ plans for future workUnsurprisingly, most new mothers who were not working, nor looking for work, cited preferring to look after their own children as a reason for not working. This was the case for both mothers in income poor families (81 per cent) and families above the poverty threshold (86 per cent). However, four in five mothers (82 per cent) said they planned to return to work at some point.
When asked when they thought they might return to work, mothers in income poor families were somewhat more likely to plan an earlier return, with 39 per cent intending to start work by the time the baby was aged three years old, or earlier, compared with 33 per cent of mothers in families that were not income poor.
Mothers of mixed ethnic background (65 per cent), black Caribbean (58 per cent) and black African ethnic background (46 per cent) who were not working when the baby was nine months old were most likely to plan an early return. Mothers of Bangladeshi (14 per cent) and Pakistani (21 per cent) background were least likely to plan to return by the time the baby was aged three years.
Earlier planned return to work was also more common among higher qualified new mothers (46 per cent of mothers with a degree level or equivalent qualification planned to start working when their child was aged three or younger, compared to 28 per cent of mothers without qualifications).
3.4.5 Did mothers return to work?Of the mothers who were not working at the time their child was nine months old, 31 per cent were working when the child was three years old and a further 29 per cent had returned to work by the time the child was aged seven (a further 16 per cent by age five and a further 13 per cent by age seven). Overall, poor mothers were less likely to have returned to work when their firstborn was aged three, five or seven years old, compared with not poor new mothers (Figure 3.8 and Table A6).
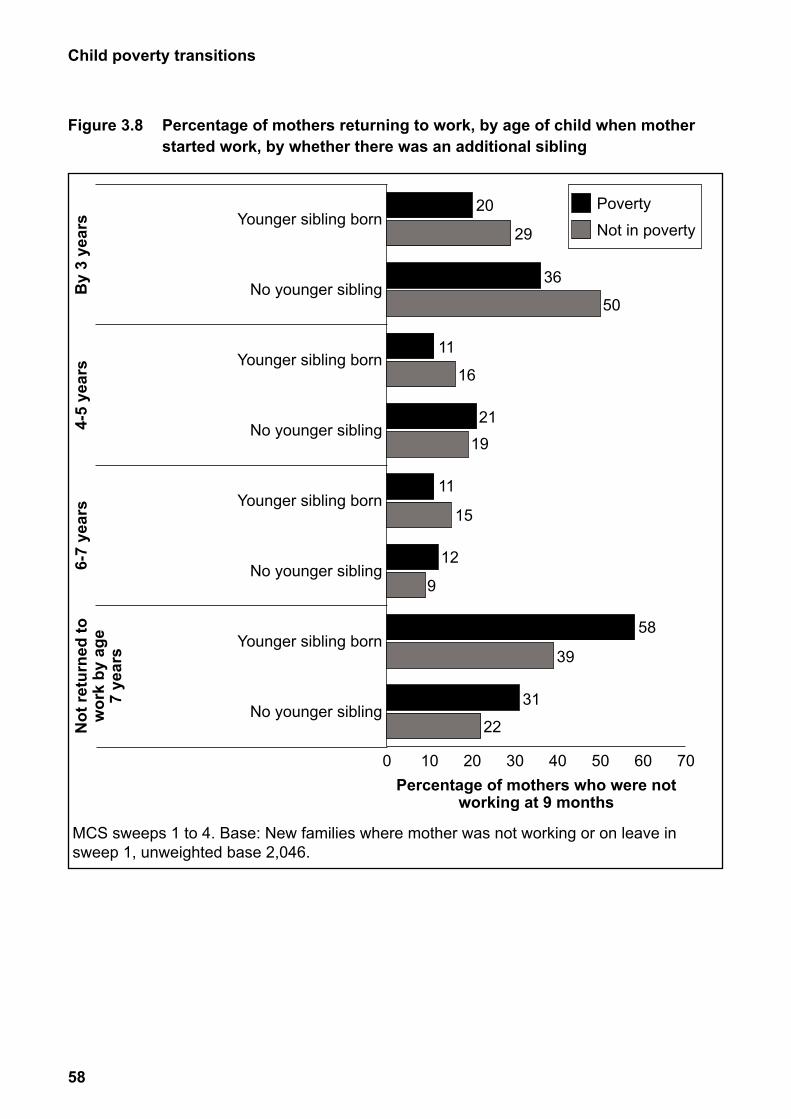
58
Child poverty transitionsB
y 3
year
s4-
5 ye
ars
6-7
year
sN
ot re
turn
ed to
w
ork
by a
ge7
year
s
Percentage of mothers who were not working at 9 months
MCS sweeps 1 to 4. Base: New families where mother was not working or on leave in sweep 1, unweighted base 2,046.
9
20
0 10 20 30 40 50 60 70
No younger sibling
Younger sibling born
No younger sibling
Younger sibling born
No younger sibling
Younger sibling born
No younger sibling
Younger sibling born29
50
36
12
15
11
39
31
22
58
11
16
21
19
Not in poverty
Poverty
Figure 3.8 Percentage of mothers returning to work, by age of child when mother started work, by whether there was an additional sibling
59
Child poverty transitions
3.5 SummaryThis chapter has focused on children who entered poverty. As found in other research (which often summarises the whole population rather than just families with children) there is considerable movement in family incomes from one year to the next. This is because some people experience poverty only once, whereas others move in and out of poverty more regularly. We have found that around seven per cent of children enter poverty each year.
The report is focused on understanding poverty transitions and hence much of the analysis identifies what employment and household changes accompanied a drop in family income. Around one in 14 children initially not in poverty had moved into poverty a year later (meaning the poverty entrance rate was seven per cent). This rate varied for different types of children and employment events, such as the family becoming workless (entry rate of 38 per cent from full employment, 42 per cent from part employment), were most strongly associated with poverty entries. But entering poverty was not solely about becoming workless. A significant proportion of families remained in work and children fell into poverty because of a fall in family earnings, sometimes caused by working fewer hours or one parent in a couple losing work.
The propensity to enter poverty varied according to industry, occupation and sector – and by contract type (although very few parents in the study had non-permanent contracts). Parents most likely to work in those industries, for example, with low educational qualifications, were also more likely to enter poverty.
Certain family circumstances and events meant they were more likely to enter poverty. These included having an extra child having already got two or more. Ethnic minorities were also more likely to enter poverty – the highest rates of poverty were found among Pakistani (19 per cent), Bangladeshi (16 per cent) and black African (15 per cent) children.
New families, i.e. those who had just had their first child, were at higher risk of poverty – particularly lone parents, who tended to be young mothers with low educational qualifications. Overall, mothers in poor new families were less likely to have returned to work by the time their firstborn child was age seven years old than non-poor mothers.
As discussed earlier, although some families move in and out of poverty, the factors linked to entering and exiting poverty are not necessarily the same. Hence policy should not assume that what works for preventing poverty entry will work to help already-poor families to escape poverty. Having explored issues for families that enter poverty the next chapter focuses on understanding what happened to families that were initially poor, but managed to escape poverty.
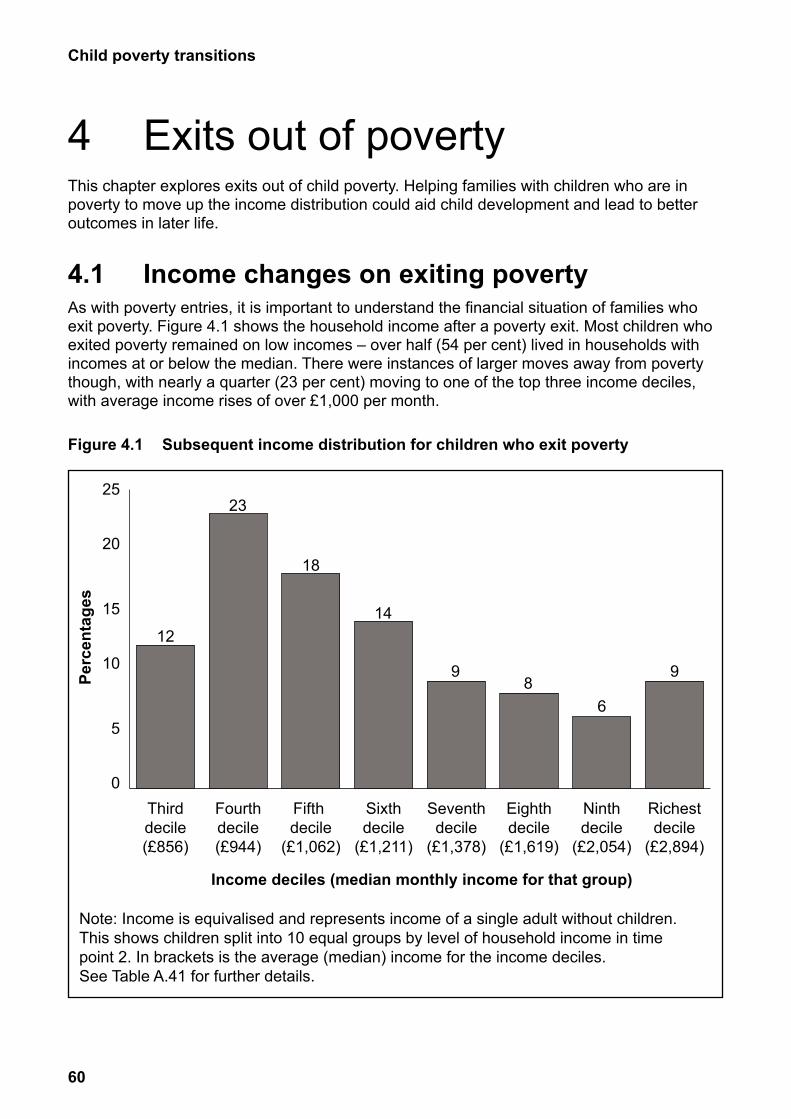
60
0
5
10
15
20
25
Richestdecile
(£2,894)
Ninthdecile
(£2,054)
Eighthdecile
(£1,619)
Seventhdecile
(£1,378)
Sixthdecile
(£1,211)
Fifth decile
(£1,062)
Fourthdecile(£944)
Thirddecile(£856)
Income deciles (median monthly income for that group)
Note: Income is equivalised and represents income of a single adult without children. This shows children split into 10 equal groups by level of household income in time point 2. In brackets is the average (median) income for the income deciles.See Table A.41 for further details.
18
14
98
6
9
23
12
Perc
enta
ges
Child poverty transitions
4 Exits out of povertyThis chapter explores exits out of child poverty. Helping families with children who are in poverty to move up the income distribution could aid child development and lead to better outcomes in later life.
4.1 Income changes on exiting povertyAs with poverty entries, it is important to understand the financial situation of families who exit poverty. Figure 4.1 shows the household income after a poverty exit. Most children who exited poverty remained on low incomes – over half (54 per cent) lived in households with incomes at or below the median. There were instances of larger moves away from poverty though, with nearly a quarter (23 per cent) moving to one of the top three income deciles, with average income rises of over £1,000 per month.
Figure 4.1 Subsequent income distribution for children who exit poverty
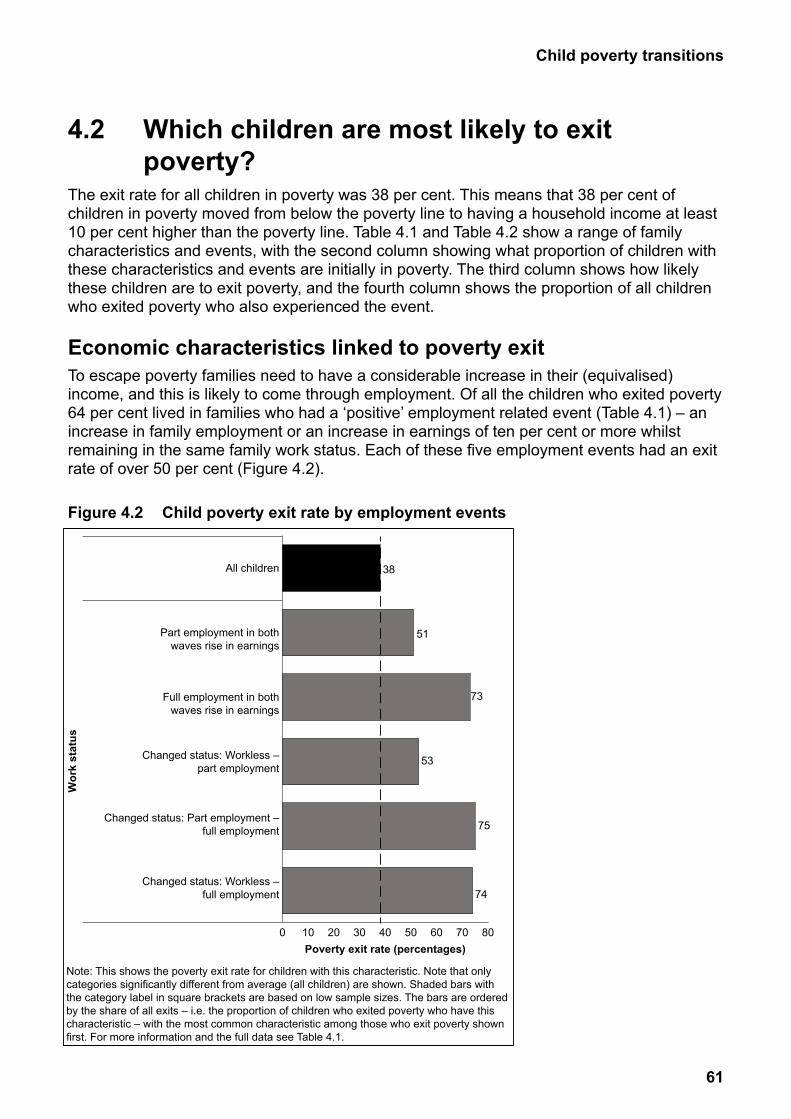
61
Child poverty transitions
4.2 Which children are most likely to exit poverty?
The exit rate for all children in poverty was 38 per cent. This means that 38 per cent of children in poverty moved from below the poverty line to having a household income at least 10 per cent higher than the poverty line. Table 4.1 and Table 4.2 show a range of family characteristics and events, with the second column showing what proportion of children with these characteristics and events are initially in poverty. The third column shows how likely these children are to exit poverty, and the fourth column shows the proportion of all children who exited poverty who also experienced the event.
Economic characteristics linked to poverty exitTo escape poverty families need to have a considerable increase in their (equivalised) income, and this is likely to come through employment. Of all the children who exited poverty 64 per cent lived in families who had a ‘positive’ employment related event (Table 4.1) – an increase in family employment or an increase in earnings of ten per cent or more whilst remaining in the same family work status. Each of these five employment events had an exit rate of over 50 per cent (Figure 4.2).
Figure 4.2 Child poverty exit rate by employment events
0 10 20 30 40 50 60 70 80
Changed status: Workless –full employment
Changed status: Part employment –full employment
Changed status: Workless –part employment
Full employment in bothwaves rise in earnings
Part employment in bothwaves rise in earnings
All children
Wor
k st
atus
Poverty exit rate (percentages)
Note: This shows the poverty exit rate for children with this characteristic. Note that only categories significantly different from average (all children) are shown. Shaded bars with the category label in square brackets are based on low sample sizes. The bars are ordered by the share of all exits – i.e. the proportion of children who exited poverty who have this characteristic – with the most common characteristic among those who exit poverty shown first. For more information and the full data see Table 4.1.
26
51
73
53
75
74
38

62
Child poverty transitions
The bottom two bars in Figure 4.2 show the importance of full-time work for poverty exit. Approximately three-quarters of children living in families that moved into full employment exited poverty. However, moving from being a workless to a full employment household was relatively rare among families initially in poverty (two per cent of children); therefore this only made up four per cent of all poverty exits. The top two green bars show that some families exited poverty having increased earnings (whilst remaining within the same employment category) – either due to an increase in hours31 or an increase in pay. These were the two most common positive employment related events, with a third of children exiting poverty this way.
Defining family work statusFull employment:
• lone parent working 30 or more hours per week; or
• couples where both parents are working and at least one of them is working 30 or more hours per week.
Part employment:
• lone parent working fewer than 30 hours per week; or
• couples both working fewer than 30 hours per week, couples one parent working the other workless.
Workless:
• no parent is in work.
As these families are all initially in poverty, even amongst those in employment earnings are likely to be relatively low and benefit receipt an important part of household income. An increase in benefit income of ten per cent or more had an exit rate of 48 per cent, and 57 per cent of children who exited poverty had this event32. A rise in income from other sources was rarer, with 14 per cent of children who exited poverty having this event with an exit rate of 44 per cent. An increase in investment income was rarer still (five per cent of children who exited poverty) but had a very high exit rate of 67 per cent among those who did (Table 4.1).
The regression analysis confirms that a change in the economic status of the family was the biggest independent predictor of a child exiting poverty, compared with children whose parents were in part employment in both time points and had no change in earnings. Again full employment was highly related to poverty exit, with children in families who either moved into full employment (nine to ten times the odds) or were in full employment and had a rise in earnings (seven times the odds) having particularly high odds of exiting poverty. Children living in a family that went from being workless to part employment had around four times
31 For those part employed one or both parents could have a small increase in hours that would not push them into the full employment category, whilst for full employed families this could be any increase in hours.
32 Twenty-nine per cent of children in families who exited poverty experienced a rise in both earnings and benefit income. There were various reasons why this occurred, including increases in tax credits due to working more hours, plus increases in housing benefit and due to changes in family size.
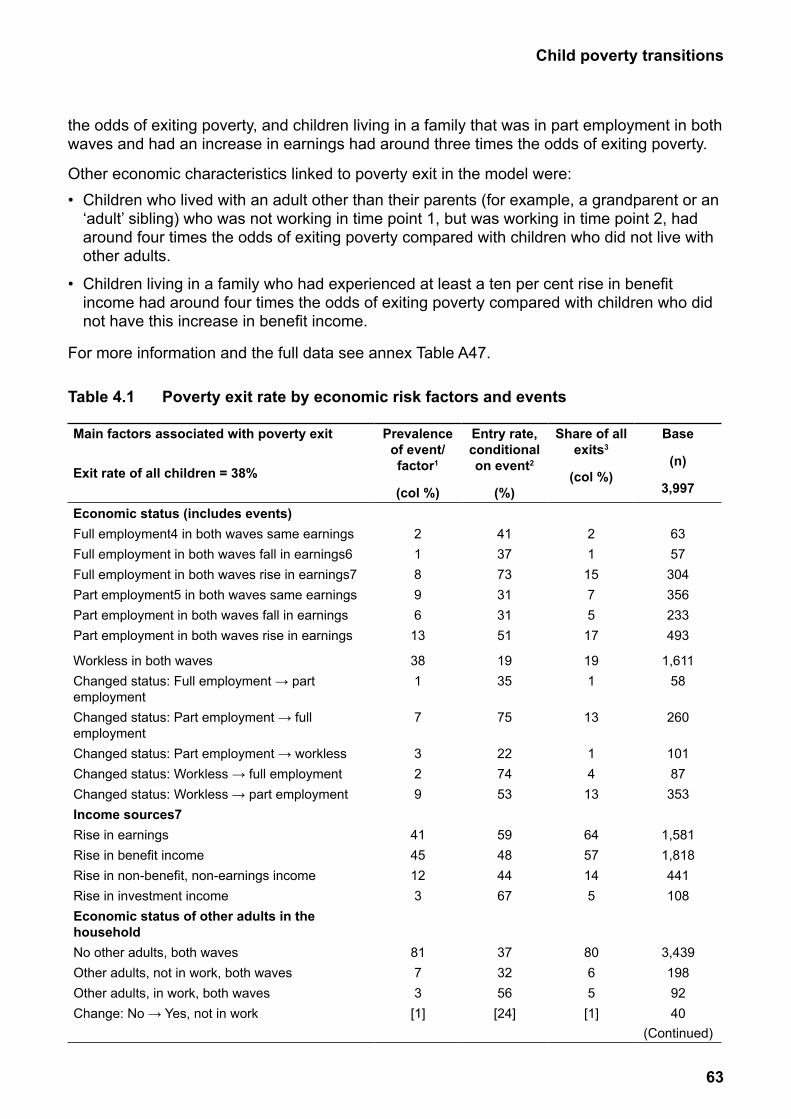
63
Child poverty transitions
the odds of exiting poverty, and children living in a family that was in part employment in both waves and had an increase in earnings had around three times the odds of exiting poverty.
Other economic characteristics linked to poverty exit in the model were:• Children who lived with an adult other than their parents (for example, a grandparent or an
‘adult’ sibling) who was not working in time point 1, but was working in time point 2, had around four times the odds of exiting poverty compared with children who did not live with other adults.
• Children living in a family who had experienced at least a ten per cent rise in benefit income had around four times the odds of exiting poverty compared with children who did not have this increase in benefit income.
For more information and the full data see annex Table A47.
Table 4.1 Poverty exit rate by economic risk factors and events
Main factors associated with poverty exit
Exit rate of all children = 38%
Prevalence of event/factor1
(col %)
Entry rate, conditional on event2
(%)
Share of all exits3
(col %)
Base
(n)
3,997
Economic status (includes events)Full employment4 in both waves same earnings 2 41 2 63Full employment in both waves fall in earnings6 1 37 1 57Full employment in both waves rise in earnings7 8 73 15 304Part employment5 in both waves same earnings 9 31 7 356Part employment in both waves fall in earnings 6 31 5 233Part employment in both waves rise in earnings 13 51 17 493
Workless in both waves 38 19 19 1,611Changed status: Full employment → part 1 35 1 58employmentChanged status: Part employment → full 7 75 13 260employmentChanged status: Part employment → workless 3 22 1 101Changed status: Workless → full employment 2 74 4 87Changed status: Workless → part employment 9 53 13 353Income sources7Rise in earnings 41 59 64 1,581Rise in benefit income 45 48 57 1,818Rise in non-benefit, non-earnings income 12 44 14 441Rise in investment income 3 67 5 108Economic status of other adults in the householdNo other adults, both waves 81 37 80 3,439Other adults, not in work, both waves 7 32 6 198Other adults, in work, both waves 3 56 5 92Change: No → Yes, not in work [1] [24] [1] 40
(Continued)
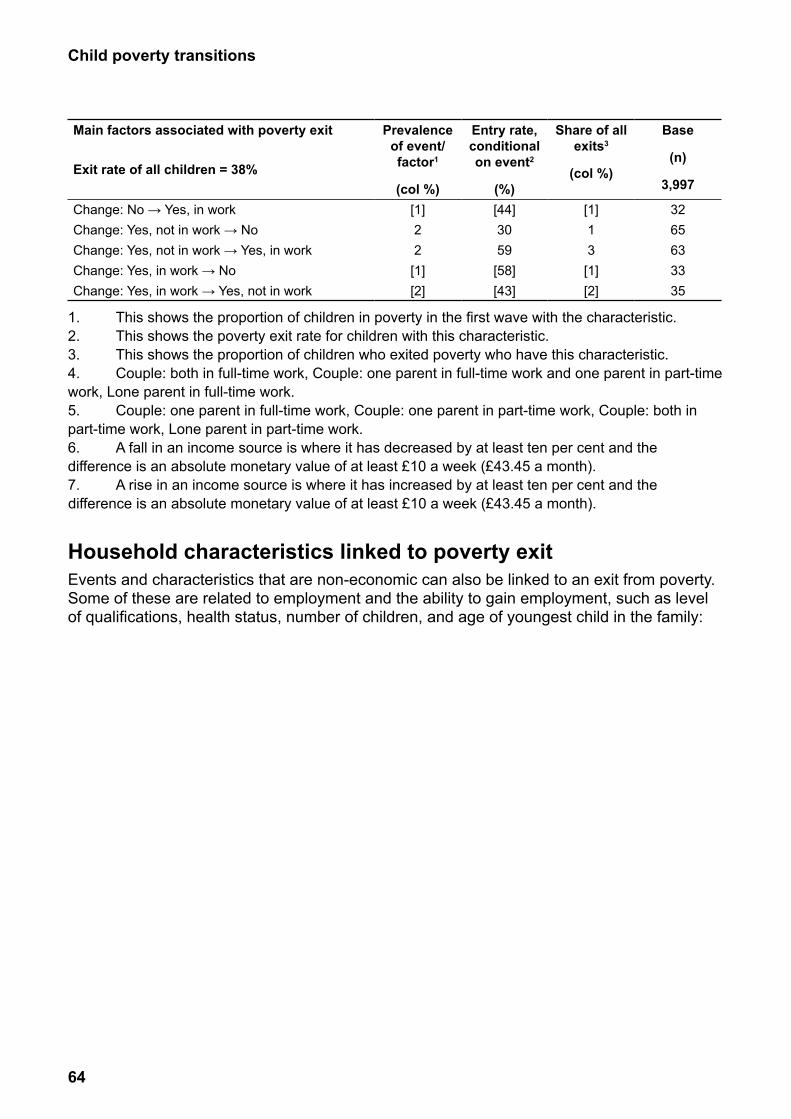
64
Child poverty transitions
Main factors associated with poverty exit
Exit rate of all children = 38%
Prevalence of event/factor1
(col %)
Entry rate, conditional on event2
(%)
Share of all exits3
(col %)
Base
(n)
3,997
Change: No → Yes, in work [1] [44] [1] 32Change: Yes, not in work → No 2 30 1 65Change: Yes, not in work → Yes, in work 2 59 3 63Change: Yes, in work → No [1] [58] [1] 33Change: Yes, in work → Yes, not in work [2] [43] [2] 35
1. This shows the proportion of children in poverty in the first wave with the characteristic.2. This shows the poverty exit rate for children with this characteristic.3. This shows the proportion of children who exited poverty who have this characteristic.4. Couple: both in full-time work, Couple: one parent in full-time work and one parent in part-time work, Lone parent in full-time work.5. Couple: one parent in full-time work, Couple: one parent in part-time work, Couple: both in part-time work, Lone parent in part-time work.6. A fall in an income source is where it has decreased by at least ten per cent and the difference is an absolute monetary value of at least £10 a week (£43.45 a month).7. A rise in an income source is where it has increased by at least ten per cent and the difference is an absolute monetary value of at least £10 a week (£43.45 a month).
Household characteristics linked to poverty exitEvents and characteristics that are non-economic can also be linked to an exit from poverty. Some of these are related to employment and the ability to gain employment, such as level of qualifications, health status, number of children, and age of youngest child in the family:

65
Child poverty transitions
Figure 4.3 Child poverty exit rate by selected household characteristics
• The exit rate for children living in families where the highest earner had at least degree level qualifications was 50 per cent, and 24 per cent of exits were among children in these families.
• Families with four or more children had the lowest poverty exit rate.
• Going from three to two children in the family had an exit rate of 53 per cent.
• Going from two children to one child in the family had an exit rate of 46 per cent.
0 10 20 30 40 50 60
Change: No adults ill – one or more adults ill
Change: 1 or more adults ill – no adults ill
1 or more adults ill/disabled in both waves
No adults ill/disabled in both waves
Other qualification
No qualification
Other higher degree
A level or equivalent
Degree level or equivalent
GCSE or equivalent
16-19
11-15
5-10
0-4
Change: 2 children – 1 child
Change: 3 children – 2 children
4 or more children in both waves
1 child in both waves
3 children in both waves
2 children in both waves
All children
Num
ber o
f chi
ldre
nA
ge o
f yo
unge
st
child
Poverty exit rate (percentages)
Notes: This shows the poverty exit rate for children with this characteristic. Shaded bars with the category label in square brackets are based on low sample sizes. The bars are ordered by the share of all exits – i.e. the proportion of children who exited poverty who have this characteristic – with the most common characteristic among those who exit poverty shown first. For more information and the full data see Table 4.2.
7 38
41
5346
30
40
42
42
41
50
38
28
28
49
40
31
43
33
Hig
hest
qua
lific
atio
nH
ealth
and
di
sabi
lity
stat
us
(incl
udes
ev
ents
)
3536
35
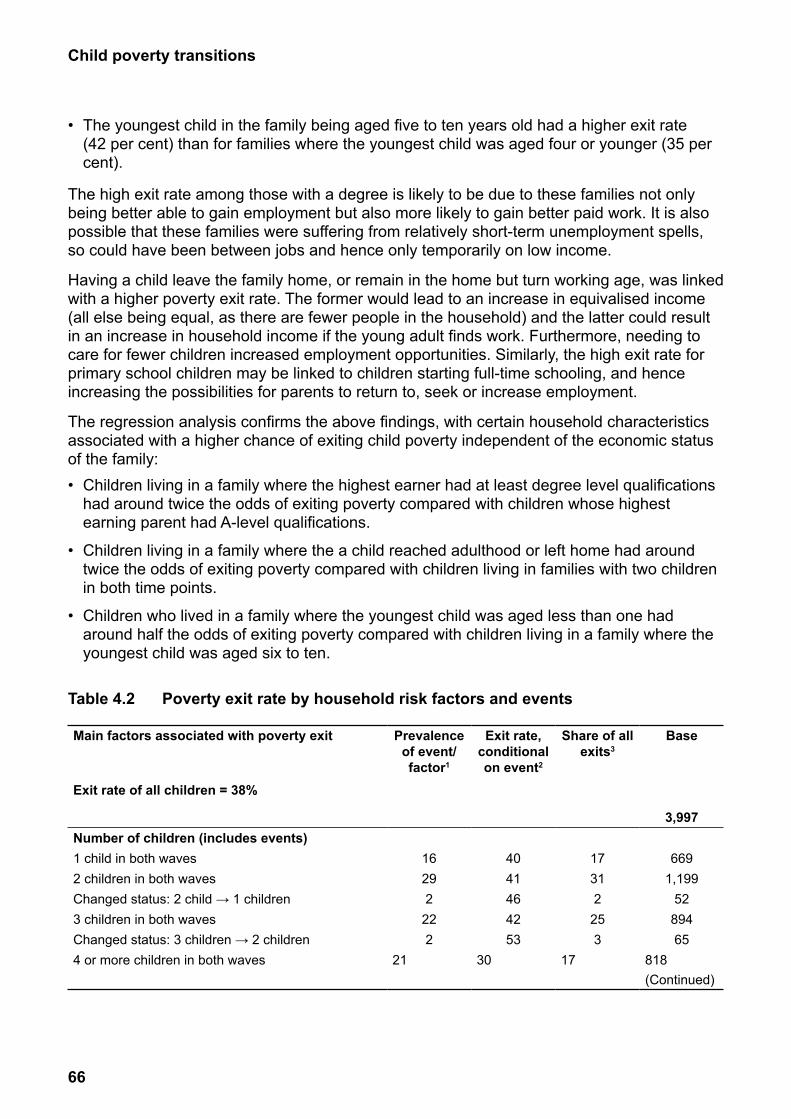
66
Child poverty transitions
• The youngest child in the family being aged five to ten years old had a higher exit rate (42 per cent) than for families where the youngest child was aged four or younger (35 per cent).
The high exit rate among those with a degree is likely to be due to these families not only being better able to gain employment but also more likely to gain better paid work. It is also possible that these families were suffering from relatively short-term unemployment spells, so could have been between jobs and hence only temporarily on low income.
Having a child leave the family home, or remain in the home but turn working age, was linked with a higher poverty exit rate. The former would lead to an increase in equivalised income (all else being equal, as there are fewer people in the household) and the latter could result in an increase in household income if the young adult finds work. Furthermore, needing to care for fewer children increased employment opportunities. Similarly, the high exit rate for primary school children may be linked to children starting full-time schooling, and hence increasing the possibilities for parents to return to, seek or increase employment.
The regression analysis confirms the above findings, with certain household characteristics associated with a higher chance of exiting child poverty independent of the economic status of the family:• Children living in a family where the highest earner had at least degree level qualifications
had around twice the odds of exiting poverty compared with children whose highest earning parent had A-level qualifications.
• Children living in a family where the a child reached adulthood or left home had around twice the odds of exiting poverty compared with children living in families with two children in both time points.
• Children who lived in a family where the youngest child was aged less than one had around half the odds of exiting poverty compared with children living in a family where the youngest child was aged six to ten.
Table 4.2 Poverty exit rate by household risk factors and events
Main factors associated with poverty exit Prevalence Exit rate, Share of all Baseof event/ conditional exits3
factor1 on event2
Exit rate of all children = 38%
3,997Number of children (includes events)1 child in both waves 16 40 17 6692 children in both waves 29 41 31 1,199Changed status: 2 child → 1 children 2 46 2 523 children in both waves 22 42 25 894Changed status: 3 children → 2 children 2 53 3 654 or more children in both waves 21 30 17 818
(Continued)
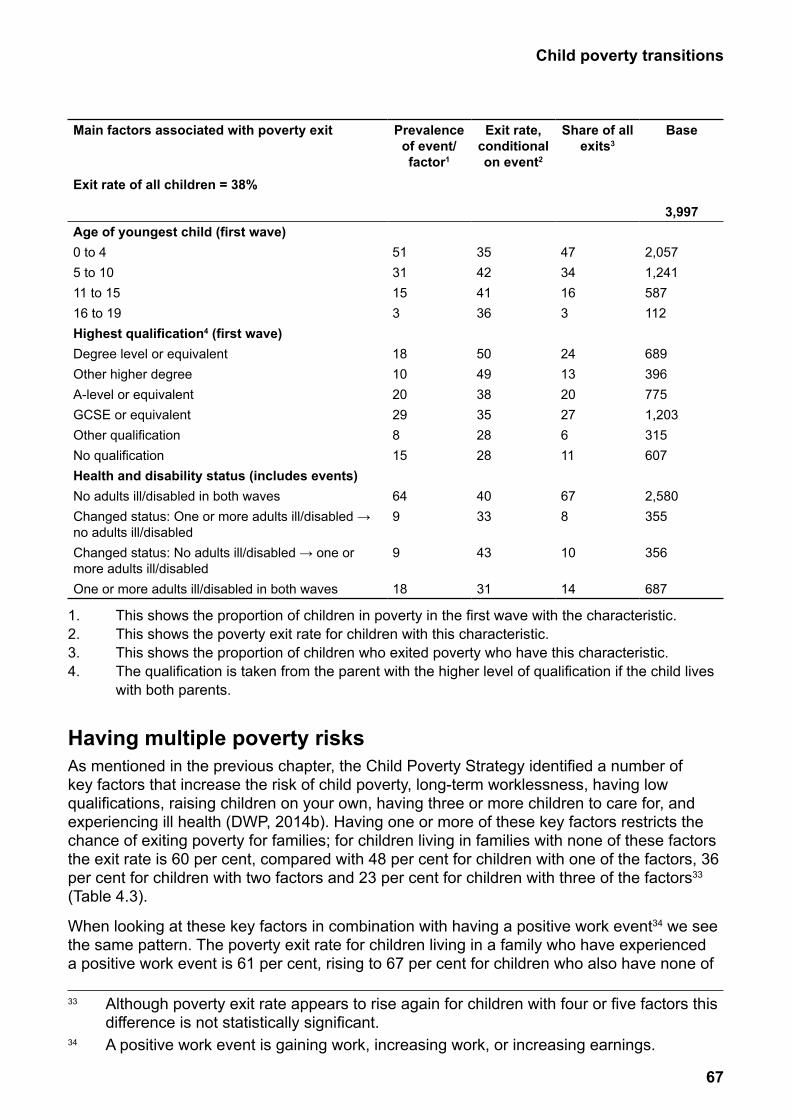
67
Child poverty transitions
Main factors associated with poverty exit
Exit rate of all children = 38%
Prevalence of event/factor1
Exit rate, conditional on event2
Share of all exits3
Base
3,997Age of youngest child (first wave)0 to 4 51 35 47 2,0575 to 10 31 42 34 1,24111 to 15 15 41 16 58716 to 19 3 36 3 112Highest qualification4 (first wave)Degree level or equivalent 18 50 24 689Other higher degree 10 49 13 396A-level or equivalent 20 38 20 775GCSE or equivalent 29 35 27 1,203Other qualification 8 28 6 315No qualification 15 28 11 607Health and disability status (includes events)No adults ill/disabled in both waves 64 40 67 2,580Changed status: One or more adults ill/disabled → no adults ill/disabled
9 33 8 355
Changed status: No adults ill/disabled → one or more adults ill/disabled
9 43 10 356
One or more adults ill/disabled in both waves 18 31 14 687
1. This shows the proportion of children in poverty in the first wave with the characteristic.2. This shows the poverty exit rate for children with this characteristic.3. This shows the proportion of children who exited poverty who have this characteristic.4. The qualification is taken from the parent with the higher level of qualification if the child lives with both parents.
Having multiple poverty risksAs mentioned in the previous chapter, the Child Poverty Strategy identified a number of key factors that increase the risk of child poverty, long-term worklessness, having low qualifications, raising children on your own, having three or more children to care for, and experiencing ill health (DWP, 2014b). Having one or more of these key factors restricts the chance of exiting poverty for families; for children living in families with none of these factors the exit rate is 60 per cent, compared with 48 per cent for children with one of the factors, 36 per cent for children with two factors and 23 per cent for children with three of the factors33 (Table 4.3).
When looking at these key factors in combination with having a positive work event34 we see the same pattern. The poverty exit rate for children living in a family who have experienced a positive work event is 61 per cent, rising to 67 per cent for children who also have none of
33 Although poverty exit rate appears to rise again for children with four or five factors this difference is not statistically significant.
34 A positive work event is gaining work, increasing work, or increasing earnings.
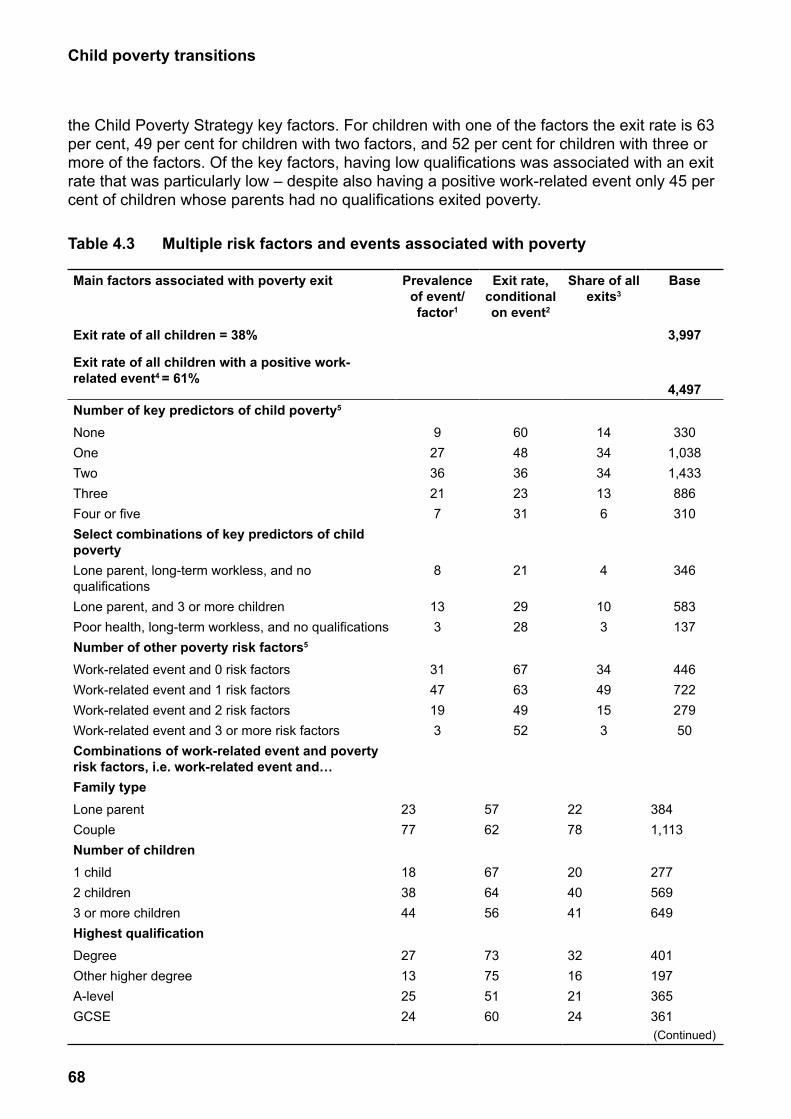
68
Child poverty transitions
the Child Poverty Strategy key factors. For children with one of the factors the exit rate is 63 per cent, 49 per cent for children with two factors, and 52 per cent for children with three or more of the factors. Of the key factors, having low qualifications was associated with an exit rate that was particularly low – despite also having a positive work-related event only 45 per cent of children whose parents had no qualifications exited poverty.
Table 4.3 Multiple risk factors and events associated with poverty
Main factors associated with poverty exit Prevalence Exit rate, Share of all Baseof event/ conditional exits3
factor1 on event2
Exit rate of all children = 38% 3,997
Exit rate of all children with a positive work-related event4 = 61%
4,497Number of key predictors of child poverty5
None 9 60 14 330One 27 48 34 1,038Two 36 36 34 1,433Three 21 23 13 886Four or five 7 31 6 310Select combinations of key predictors of child povertyLone parent, long-term workless, and no 8 21 4 346qualificationsLone parent, and 3 or more children 13 29 10 583Poor health, long-term workless, and no qualifications 3 28 3 137Number of other poverty risk factors5
Work-related event and 0 risk factors 31 67 34 446Work-related event and 1 risk factors 47 63 49 722Work-related event and 2 risk factors 19 49 15 279Work-related event and 3 or more risk factors 3 52 3 50Combinations of work-related event and poverty risk factors, i.e. work-related event and…Family typeLone parent 23 57 22 384Couple 77 62 78 1,113Number of children1 child 18 67 20 2772 children 38 64 40 5693 or more children 44 56 41 649Highest qualificationDegree 27 73 32 401Other higher degree 13 75 16 197A-level 25 51 21 365GCSE 24 60 24 361
(Continued)

69
Child poverty transitions
Main factors associated with poverty exit Prevalence Exit rate, Share of all Baseof event/ conditional exits3
factor1 on event2
Exit rate of all children = 38% 3,997
Exit rate of all children with a positive work-related event4 = 61%
Other4,497
5 46 3 68Low education (no qualifications) 6 45 5 98HealthPoor health 20 58 19 299Good health 80 61 81 1,191
Understanding Society waves 1, 2 and 3 (2009/10, 2010/11 and 2011/12).1. This shows the proportion of children in poverty in the first wave with the characteristic.2. This shows the poverty exit rate for children with this characteristic.3. This shows the proportion of children who exited poverty who have this characteristic.4. A work-related event is gaining work, increasing work, or increasing earnings.5. These are the five key predictors of child poverty identified by the Child Poverty Strategy: long-term worklessness, having low qualifications, raising children on your own, having three or more children to care for, and experiencing ill health (DWP, 2014b).
4.2.1 Does poverty exit vary by ethnicity?As mentioned in the previous chapter, certain ethnic minority groups are particularly at risk of poverty and of entry into poverty. However, although differences in poverty exit rate vary by ethnicity the pattern is less clear than for poverty entries.

70
Child poverty transitions
Figure 4.4 Poverty exit rate by ethnicity
Children of white ethnicity had a poverty exit rate of 40 per cent, compared with 41 per cent for children of Indian ethnicity, 30 per cent for children of Pakistani ethnicity, 36 per cent for children of Bangladeshi ethnicity, 51 per cent for children of black Caribbean ethnicity and 31 per cent for children of black African ethnicity. So unlike for poverty entry rates there was more divergence in exit rates among those of South Asian ethnicity (Indian, Pakistani, and Bangladeshi) and among those of black ethnicity (Caribbean and African). This is further shown by the regression analysis, with no statistically significant difference in exiting poverty between Indian and white ethnicity children, Pakistani, Bangladeshi and African ethnicity children having lower odds of poverty exit than white ethnicity children, and Caribbean ethnicity children having approximately twice the odds of poverty exit compared with white ethnicity children.
0 10 20 30 40 50 60
Caribbean
African
Indian
Bangladeshi
Pakistani
White background
All children
Ethn
icity
Poverty exit rate (percentages)
This shows the poverty exit rate for children with this characteristic. Shaded bars with the category label in square brackets are based on low sample sizes. The bars are ordered by the share of all exits – i.e. the proportion of children who exited poverty who have this characteristic – with the most common characteristic among those who exit poverty shown first. For more information and the full data see Table A.42.
7 38
40
30
41
51
31
36
71
Child poverty transitions
• As with the exit chapter, the regression analysis was repeated separately for three of the ethnic groups, white, South Asian (Indian, Pakistani, and Bangladeshi), and black (Caribbean and African)35. Again, work transitions played a large role in predicting poverty exit for all ethnic groups, with gaining or increasing employment or a rise in earnings having high odds for all ethnic groups.
However some interesting differences between ethnic groups emerged. For example, children particularly likely to exit poverty were: • White children in couple families.
• Black children in families where a child reached adulthood or left home.
• Black children in private rented homes.
• South Asian children in families where the youngest child was of secondary school age in the second time point (either age 11 or aged 12-15).
4.3 Exiting poverty through employmentThe earlier analysis demonstrated the strong association between labour market transitions and poverty exits. Poverty exits rates were particularly high for children in working families who either increased the amount they worked (75 per cent exit rate for those who went from part to full employment) or increased earnings whilst remaining in the same family work status (73 per cent exit rate for those who in full employment and 51 per cent exit rate for those in part employment). Gaining employment for initially workless families had similarly high poverty exit rates (74 per cent exit rate for those moving into full employment and 53 per cent exit rate for those moving into part employment). This section further explores how employment enables families to escape poverty.
4.3.1 Working families and poverty exitsMany view paid employment as the main solution to poverty, and while getting families into work has been a key policy goal in attempting to eradicate child poverty, the existence of in-work poverty, and people trapped in the low-pay, no-pay cycle, means that reducing worklessness alone will not be sufficient (Goulden, 2010; Shildrick et al., 2010). Furthermore, more children in poverty are in working families rather than workless families (despite their lower poverty risk because there are more of them originally – DWP, 2014a), meaning that understanding this group and what is associated with an exit from working poverty is key. In this section we focus on how working families escape poverty.
When looking at the financial situation of working families who exit poverty (Figure 4.5), it is notable how similar it is to the overall situation of all families who exit poverty. This underlines the above point that the majority of families in poverty are working.
35 The reason these larger ethnic groups were maintained was that sample sizes did not allow for splitting them further.
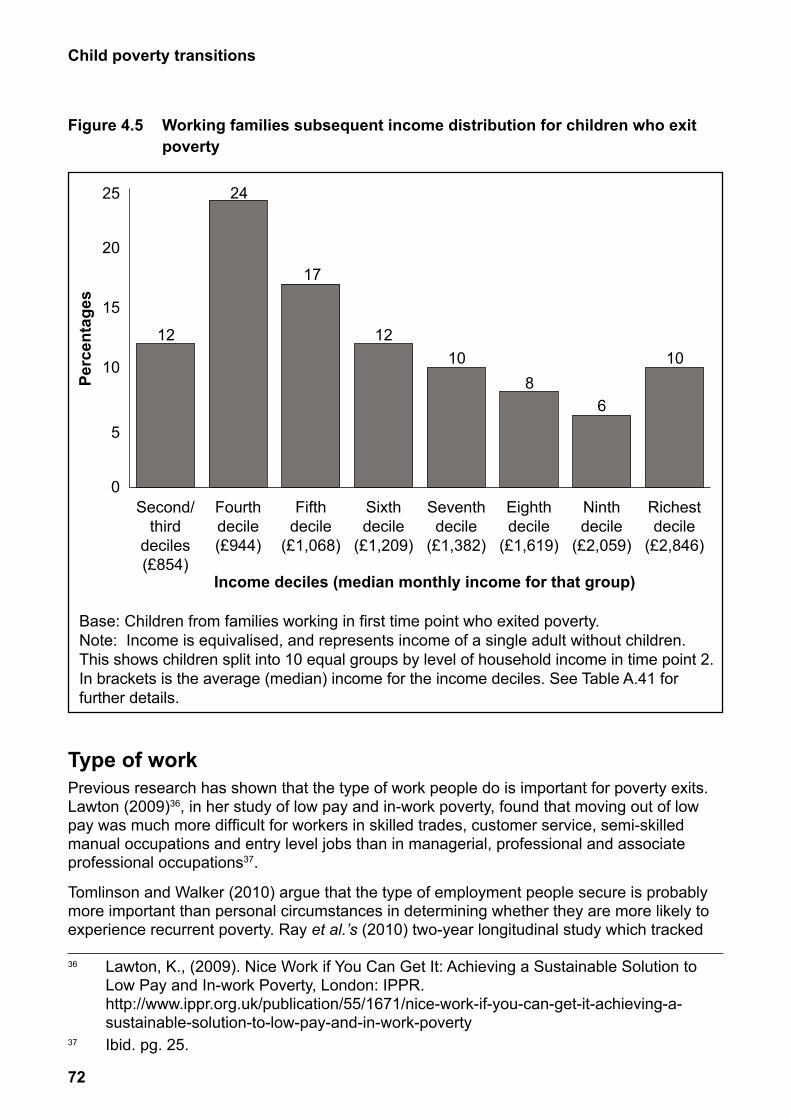
72
Child poverty transitions
Figure 4.5 Working families subsequent income distribution for children who exit poverty
Type of workPrevious research has shown that the type of work people do is important for poverty exits. Lawton (2009)36, in her study of low pay and in-work poverty, found that moving out of low pay was much more difficult for workers in skilled trades, customer service, semi-skilled manual occupations and entry level jobs than in managerial, professional and associate professional occupations37.
Tomlinson and Walker (2010) argue that the type of employment people secure is probably more important than personal circumstances in determining whether they are more likely to experience recurrent poverty. Ray et al.’s (2010) two-year longitudinal study which tracked
36 Lawton, K., (2009). Nice Work if You Can Get It: Achieving a Sustainable Solution to Low Pay and In-work Poverty, London: IPPR. http://www.ippr.org.uk/publication/55/1671/nice-work-if-you-can-get-it-achieving-a-sustainable-solution-to-low-pay-and-in-work-poverty
37 Ibid. pg. 25.
0
5
10
15
20
25
Richestdecile
(£2,846)
Ninthdecile
(£2,059)
Eighthdecile
(£1,619)
Seventhdecile
(£1,382)
Sixthdecile
(£1,209)
Fifthdecile
(£1,068)
Fourthdecile(£944)
Second/third
deciles(£854)
Income deciles (median monthly income for that group)
Base: Children from families working in first time point who exited poverty.Note: Income is equivalised, and represents income of a single adult without children.This shows children split into 10 equal groups by level of household income in time point 2. In brackets is the average (median) income for the income deciles. See Table A.41 for further details.
12
24
17
1210
86
10
Perc
enta
ges
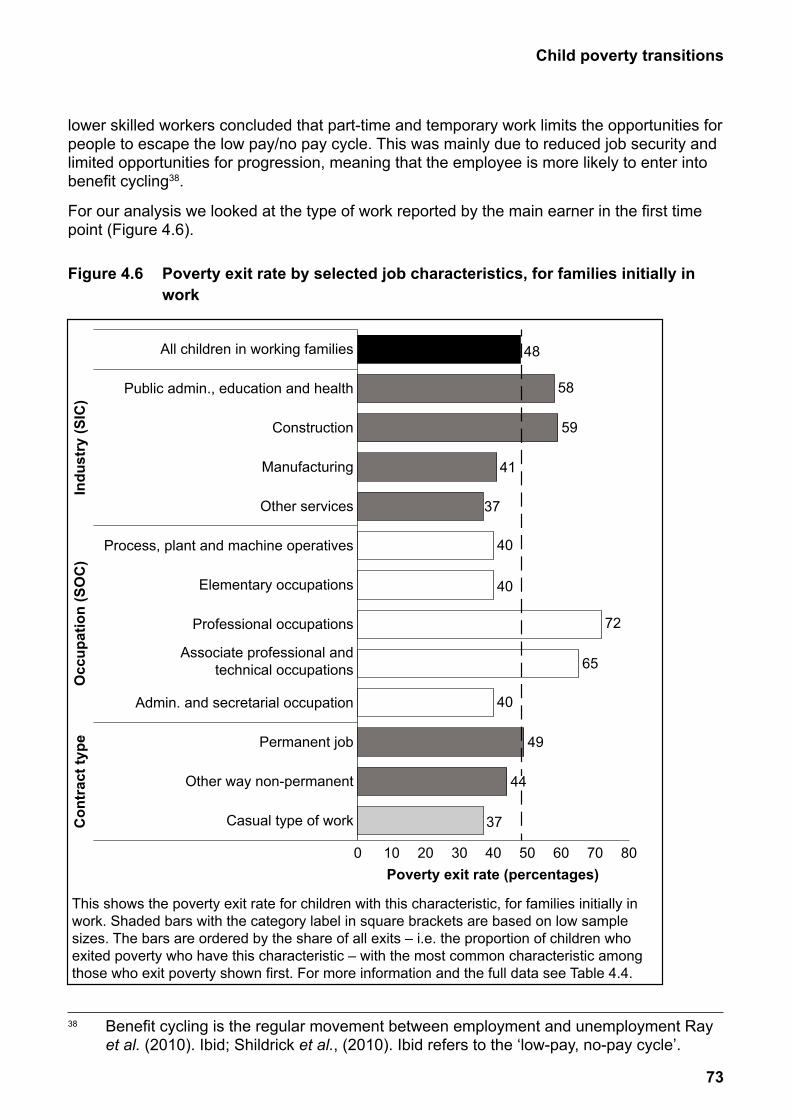
73
Child poverty transitions
lower skilled workers concluded that part-time and temporary work limits the opportunities for people to escape the low pay/no pay cycle. This was mainly due to reduced job security and limited opportunities for progression, meaning that the employee is more likely to enter into benefit cycling38.
For our analysis we looked at the type of work reported by the main earner in the first time point (Figure 4.6).
Figure 4.6 Poverty exit rate by selected job characteristics, for families initially in work
38 Benefit cycling is the regular movement between employment and unemployment Ray et al. (2010). Ibid; Shildrick et al., (2010). Ibid refers to the ‘low-pay, no-pay cycle’.
0 10 20 30 40 50 60 70 80
Casual type of work
Other way non-permanent
Permanent job
Admin. and secretarial occupation
Associate professional andtechnical occupations
Professional occupations
Elementary occupations
Process, plant and machine operatives
Other services
Manufacturing
Construction
Public admin., education and health
All children in working families
Indu
stry
(SIC
)O
ccup
atio
n (S
OC
)C
ontr
act t
ype
Poverty exit rate (percentages)
This shows the poverty exit rate for children with this characteristic, for families initially in work. Shaded bars with the category label in square brackets are based on low sample sizes. The bars are ordered by the share of all exits – i.e. the proportion of children who exited poverty who have this characteristic – with the most common characteristic among those who exit poverty shown first. For more information and the full data see Table 4.4.
48
72
40
65
58
59
41
37
49
37
40
40
44
74
Child poverty transitions
The type of work with particularly high poverty exit rates included:• those in the construction industry (59 per cent);
• those in the public admin, education and health industry (58 per cent);
• those in a professional occupation (72 per cent);
• those in an associate professional/technical occupation (65 per cent).
The type of work with particularly low poverty exit rates included:• those in the manufacturing industry (41 per cent);
• those in the other services industry (37 per cent);
• those in an admin/secretarial occupation (40 per cent);
• those in an elementary occupation (40 per cent).
The majority of people reported a permanent contract, and they had a poverty exit rate of 49 per cent, with the few workers reporting non-permanent contracts having slightly lower exits rates: 42 per cent for those on fixed period or fixed task contracts; 37 per cent for those reporting casual work; and 44 per cent exit rate for those who reported their contract was non-permanent in some other way.
The regression analysis also found differences in poverty exit rates for different types of work:• Those in the construction industry had 1.5 times the odds of exiting poverty compared with
those in the banking or finance industry.
• Those in the public admin, education and health industry had 1.3 times the odds of exiting poverty compared with those in the banking or finance industry.
• Those in a professional occupation had three times the odds of exiting poverty compared with those in a skilled trades occupation.
• Those in a non-permanent job had about half the odds of exiting poverty compared with those with a permanent contract.
• Those who went from part to full employment had around nine times the odds of exiting poverty compared with those in part employment in both time points and had no change in earnings.
• Those who were in full employment in both time points and increased earnings had about eight times the odds of exiting poverty compared with those in part employment in both time points and had no change in earnings.
• Those who were in part employment in both time points and increased earnings had around three times the odds of exiting poverty compared with those in part employment in both time points and had no change in earnings.
• Those who had an additional adult in the household (for example, a grandparent) who went from workless to working had around five times the odds of exiting poverty compared with families who were not living with an additional adult.
For more information and the full data see annex Table A50.
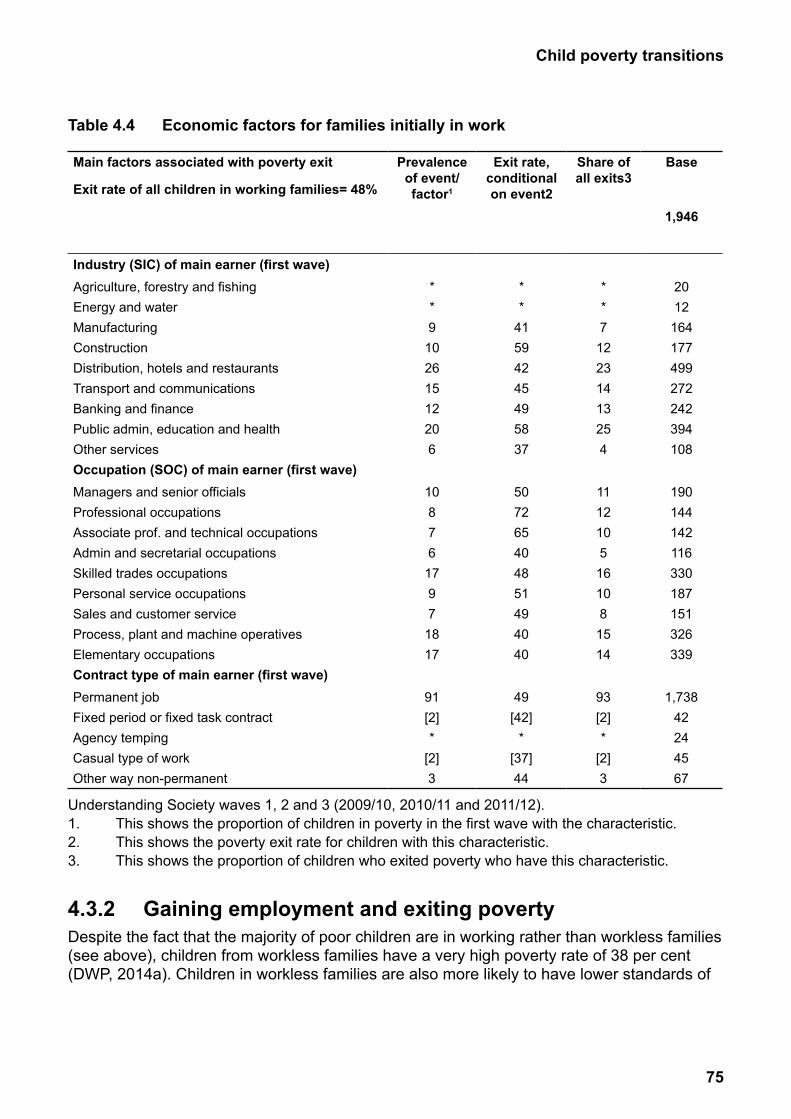
75
Child poverty transitions
Table 4.4 Economic factors for families initially in work
Main factors associated with poverty exit
Exit rate of all children in working families= 48%
Prevalence of event/factor1
Exit rate, conditional on event2
Share of all exits3
Base
1,946
Industry (SIC) of main earner (first wave)Agriculture, forestry and fishing * * * 20Energy and water * * * 12Manufacturing 9 41 7 164Construction 10 59 12 177Distribution, hotels and restaurants 26 42 23 499Transport and communications 15 45 14 272Banking and finance 12 49 13 242Public admin, education and health 20 58 25 394Other services 6 37 4 108Occupation (SOC) of main earner (first wave)Managers and senior officials 10 50 11 190Professional occupations 8 72 12 144Associate prof. and technical occupations 7 65 10 142Admin and secretarial occupations 6 40 5 116Skilled trades occupations 17 48 16 330Personal service occupations 9 51 10 187Sales and customer service 7 49 8 151Process, plant and machine operatives 18 40 15 326Elementary occupations 17 40 14 339Contract type of main earner (first wave)Permanent job 91 49 93 1,738Fixed period or fixed task contract [2] [42] [2] 42Agency temping * * * 24Casual type of work [2] [37] [2] 45Other way non-permanent 3 44 3 67
Understanding Society waves 1, 2 and 3 (2009/10, 2010/11 and 2011/12).1. This shows the proportion of children in poverty in the first wave with the characteristic.2. This shows the poverty exit rate for children with this characteristic.3. This shows the proportion of children who exited poverty who have this characteristic.
4.3.2 Gaining employment and exiting povertyDespite the fact that the majority of poor children are in working rather than workless families (see above), children from workless families have a very high poverty rate of 38 per cent (DWP, 2014a). Children in workless families are also more likely to have lower standards of
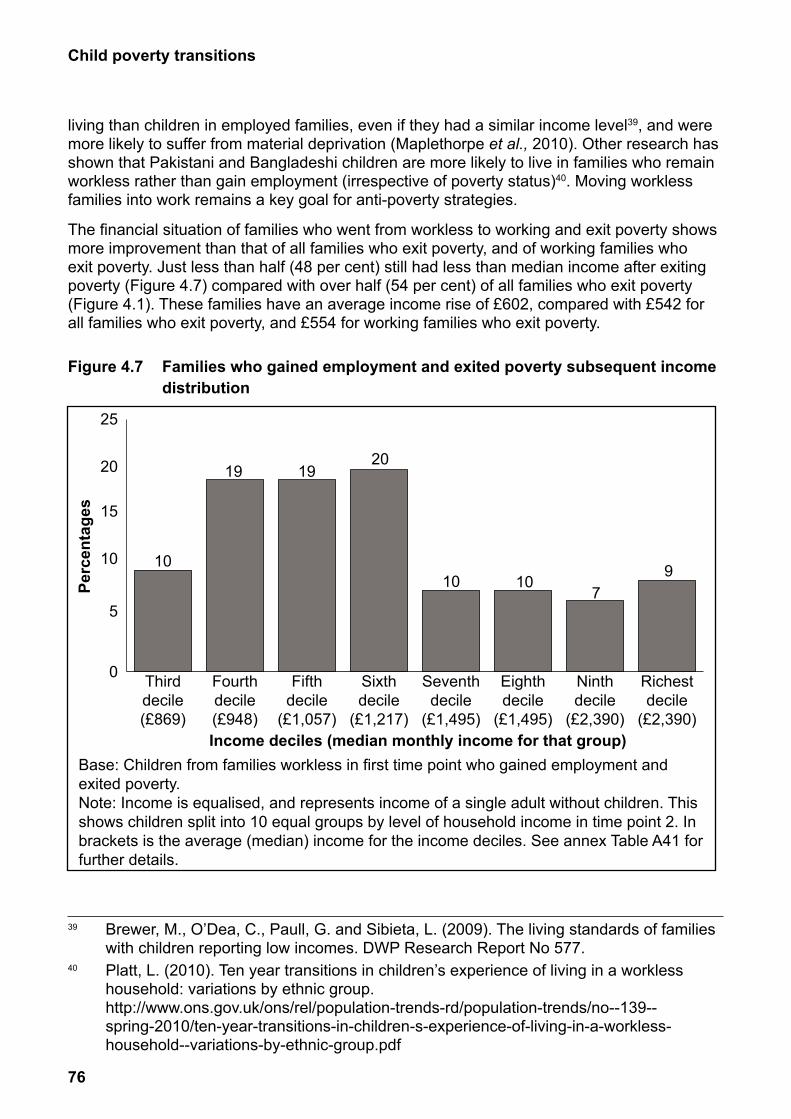
76
Child poverty transitions
living than children in employed families, even if they had a similar income level39, and were more likely to suffer from material deprivation (Maplethorpe et al., 2010). Other research has shown that Pakistani and Bangladeshi children are more likely to live in families who remain workless rather than gain employment (irrespective of poverty status)40. Moving workless families into work remains a key goal for anti-poverty strategies.
The financial situation of families who went from workless to working and exit poverty shows more improvement than that of all families who exit poverty, and of working families who exit poverty. Just less than half (48 per cent) still had less than median income after exiting poverty (Figure 4.7) compared with over half (54 per cent) of all families who exit poverty (Figure 4.1). These families have an average income rise of £602, compared with £542 for all families who exit poverty, and £554 for working families who exit poverty.
Figure 4.7 Families who gained employment and exited poverty subsequent income distribution
39 Brewer, M., O’Dea, C., Paull, G. and Sibieta, L. (2009). The living standards of families with children reporting low incomes. DWP Research Report No 577.
40 Platt, L. (2010). Ten year transitions in children’s experience of living in a workless household: variations by ethnic group. http://www.ons.gov.uk/ons/rel/population-trends-rd/population-trends/no--139--spring-2010/ten-year-transitions-in-children-s-experience-of-living-in-a-workless-household--variations-by-ethnic-group.pdf
0
5
10
15
20
25
Richestdecile
(£2,390)
Ninthdecile
(£2,390)
Eighthdecile
(£1,495)
Seventhdecile
(£1,495)
Sixthdecile
(£1,217)
Fifthdecile
(£1,057)
Fourthdecile(£948)
Thirddecile(£869)
Income deciles (median monthly income for that group)Base: Children from families workless in first time point who gained employment and exited poverty.Note: Income is equalised, and represents income of a single adult without children. Thisshows children split into 10 equal groups by level of household income in time point 2. Inbrackets is the average (median) income for the income deciles. See annex Table A41 forfurther details.
10
19 1920
10 107
9
Perc
enta
ges
77
Child poverty transitions
Note: Income is equivalised, and represents income of a single adult without children. This shows children split into 10 equal groups by level of household income in time point 2. In brackets is the average (median) income for the income deciles. See annex Table A41 for further details.
The analysis in Section 4.2 has shown that children living in workless families who gained work had high poverty exit rates, 74 per cent for those who found full-time work and 53 per cent for those who found part-time work. In order to explore this further, we conducted regression analysis among initially poor workless families which compared those who remained workless and in poverty with those who gained employment and exited poverty.
Children in families who obtained employment and moved out of poverty were more likely to have the following characteristics:• White ethnicity compared with Pakistani, Bangladeshi, or Black African ethnicities.
• Couple family compared with lone parent family.
• Have one child in the family compared with two children families.
• Have no adults ill or disabled in both time points compared with having at least one adult ill or disabled in both time points.
• To also have a rise in benefit income of ten per cent or more.
For more information and the full data see annex Table A51.
This suggests that certain types of family are in a better position to find work more easily. For lone parents it may be harder to find work and exit poverty due to childcare issues, whereas for couples this can be managed between the two of them. Similarly, for families with numerous children or an adult with a health issue, managing caring responsibilities and employment may be difficult, restricting the prospect of moving out of poverty.
4.4 What is the childcare use of families that exit poverty?
The cost, suitability and quality of childcare are issues that parents have to consider when weighing up the pros and cons of working whilst their children are still young. For working families in poverty or just above the poverty line, such issues are particularly important given the economic difficulties of paying for childcare whilst receiving low earnings. This is despite a number of policies designed to help families with the cost of childcare, such as Childcare Tax Credits, free childcare for three and four-year-olds, and tax-free childcare vouchers.
For families who exit poverty through finding work or increasing hours of work, decisions around childcare use are just as important. This report has already shown that families who escape poverty tend to remain on low to middle incomes. Therefore how families manage their childcare responsibilities can affect their ability to stay in work and not slip back below the poverty line.
The analysis in this section explores the childcare use of poor and low-middle income families, including those who exited poverty. It also looks at how patterns of childcare use,
78
Child poverty transitions
both formal and informal41, vary according to the employment status of the family, particularly whether there was a parent not working or working part-time who could have performed the childcare role.
Understanding Society (USoc) contains a number of questions about childcare use, including types of childcare, and hours used in term and holiday time. Because children in the same family could use different types of childcare, questions are asked separately about each child aged 14 and under. The analysis presented below attempts to summarise the childcare use of the family, for example, whether the family uses only formal or informal childcare or whether it uses both, and the total number of hours used across all children.
4.4.1 FindingsUnsurprisingly, families who worked more were more likely to use childcare. For couples childcare was used by six per cent of workless families, 12 per cent of part employed families, and 33 per cent of full employed families. Similarly, for lone parents childcare was used by 17 per cent of workless families and 31 per cent of employed families42. The fact that childcare use was similar among fully employed couples and employed lone parents was presumably driven by the fact that both sets of families would have no one at home to look after the children. Part-employed couples (i.e. likely to have one parent at home some of the time) were less than half as likely to use childcare as full-employed couples, irrespective of income. However, low-middle income families were more likely to use childcare than families in poverty – whether in work or not (Figure 4.8).
41 Formal childcare included nursery schools, child-minders, and nannies or au pairs. Informal childcare included playgroup or pre-school, the child’s non-resident parent, and other family members such as the child’s grandparents or elder sibling. Some families used formal or informal childcare, while others used both.
42 Sample sizes were too small to split part employed and full employed lone parents.
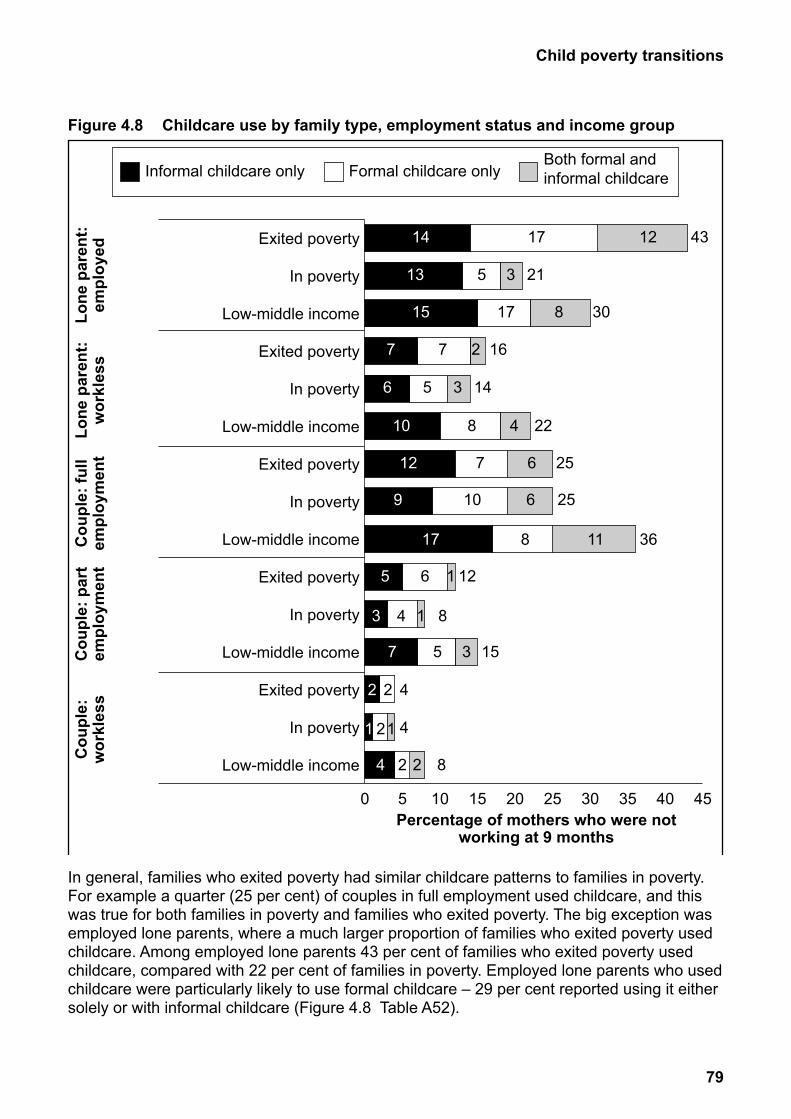
79
Child poverty transitions
Figure 4.8 Childcare use by family type, employment status and income group
In general, families who exited poverty had similar childcare patterns to families in poverty. For example a quarter (25 per cent) of couples in full employment used childcare, and this was true for both families in poverty and families who exited poverty. The big exception was employed lone parents, where a much larger proportion of families who exited poverty used childcare. Among employed lone parents 43 per cent of families who exited poverty used childcare, compared with 22 per cent of families in poverty. Employed lone parents who used childcare were particularly likely to use formal childcare – 29 per cent reported using it either solely or with informal childcare (Figure 4.8 Table A52).
0 5 10 15 20 25 30 35 40 45
Low-middle income
In poverty
Exited poverty
Low-middle income
In poverty
Exited poverty
Low-middle income
In poverty
Exited poverty
Low-middle income
In poverty
Exited poverty
Low-middle income
In poverty
Exited poverty
Lone
par
ent:
empl
oyed
Lone
par
ent:
wor
kles
sC
oupl
e: fu
ll em
ploy
men
tC
oupl
e: p
art
empl
oym
ent
Cou
ple:
w
orkl
ess
Percentage of mothers who were not working at 9 months
This shows childcare use by family type, employment status and income group. For more information and the full data see Table A.52.
14 17 12 43
13 5 3 21
15 17 8 30
7 7 2 16
6 5 3 14
10 8 4 22
12 7 6 25
9 10 6 25
17 8 11 36
5 6 1 12
3 4 1 8
7 5 3 15
2 2
2
4
1 1 4
4 2 2 8
Informal childcare only Formal childcare onlyBoth formal andinformal childcare
80
Child poverty transitions
The fact that the highest childcare use was among employed lone parents may be a reflection of the longer hours that lone parents need to work to escape poverty (hours that could be shared across couple parents), and hence the requirement to use childcare to enable such work patterns. Even couples in full employment may be able to cover childcare duties between them to a certain extent, whereas this is less true for employed lone parents. Interestingly employed lone parents who escaped poverty were more likely to use formal childcare than low-middle income employed lone parents (29 per cent compared with 15 per cent) – suggesting that formal childcare played an important role in them being able to find or increase work.
4.5 SummaryThis chapter has focused on children exiting poverty. Nearly four in ten (38 per cent) initially poor children exited poverty a year later. Work-related events were particularly key to this, with 64 per cent of poverty exits being associated with either gaining or increasing employment or families increasing their earnings. The majority of poverty exits came from initially working families, and poverty exit varied according to industry, occupation, and contract type – suggesting that certain employment types are more likely to lead to higher earnings and movement out of poverty.
For poor out-of -work families, gaining employment is likely to be the key way to exit poverty. In comparison to families who remained workless and stayed poor, families who gained work and exited poverty were more likely to be couples, have fewer and older children, and have neither parent ill or disabled. This probably reflects that these characteristics make caring for children and finding employment more straight forward.
Ethnic minorities were less likely to exit poverty – the lowest rates of poverty exit were found among Pakistani (30 per cent), black African (31 per cent) and Bangladeshi (36 per cent) children. For particular ethnic minorities certain characteristics and events were associated with an increased chance of poverty exit. Alongside employment related events black children with a smaller family size and South Asian families with older children were particularly likely to exit poverty.
Use of childcare can enable parents to work and to work more hours, which can enable movement out of poverty. Families who exited poverty generally had similar childcare use as families in poverty, with the exception of employed lone parents. A large proportion of working lone parents who exited poverty used childcare (particularly formal childcare), in comparison to working lone parents who remained poor. The ability to find affordable childcare is likely to be particularly important for lone parents to gain employment and exit poverty, as they do not live with a partner with whom they can split looking after the children.
The next chapter summarises the findings from this chapter and the previous chapter on poverty entries.
81
Child poverty transitions
5 ConclusionsThis study used Understanding Society (USoc) data from 2009/2010 to 2011/2012 to provide new evidence on transitions children make into and out of income poverty over a two-year period. Children most likely to make a move into or out of poverty were identified, using information on socio-economic characteristics.
This chapter summarises the main findings of this study, and relates the findings to previous studies on poverty transitions. It also discusses some of the implications for policy, before concluding with recommendations for further research.
5.1 Summary of main findingsSome events are strongly associated with both poverty entries and poverty exits, e.g. labour market events. However, the same factors do not completely explain both transitions. This suggests that policies required to prevent families from entering poverty need to differ from policies targeted at helping them escape.
5.1.1 Poverty entry and exit rates and income changesAlthough a similar number of children entered poverty that exited poverty (around six to seven per cent of children), rates of exiting poverty were much higher than rates of entering poverty (38 per cent exited compared to seven per cent entered). This is due to there being fewer children in poverty than out of poverty at any one time.
There were differences between families entering and exiting poverty in terms of how close their income was to the poverty line prior to the poverty transition, and by how much their income changed as a result:• Two-thirds of children who entered poverty were previously living in a household with
income between the poverty line and median income, and hence were already relatively close to the poverty line.
• Children who moved out of poverty had, on average, a larger change in income than those who moved into poverty.
• Nearly half (46 per cent) of children exiting poverty moved over the median income line.
• Entering poverty was associated with a (median) average income drop of £406, while the change in income for a poverty exit was higher, with a (median) average income rise of £542. These figures include earnings and non-earnings. For those who experienced a benefit income fall the median average drop in monthly benefit income was £256. For those who experienced a benefit income rise the median average rise in monthly benefit income was £296.
5.1.2 Labour market eventsLabour market events played a large role in describing both poverty entries and poverty exits. Movements into or out of employment, and increases and decreases in employment had particularly high poverty exit and entry rates.
82
Child poverty transitions
Preventing families from becoming workless is a key protector from poverty. The labour market events with the largest entry rates involved moving from working to worklessness – either from being in full employment (entry rate of 38 per cent) or from part employment (entry rate of 42 per cent). A transition from full employment to part employment had a lower poverty entry rate (14 per cent), but one still twice the average, suggesting that in some situations full employment can help protect families against poverty, particularly when one partner is a reasonably high earner. Yet low earning families are likely to be at risk of poverty when one parent reduces their hours.
Gaining or increasing work was a key factor in families exiting poverty, especially when this left the family in full employment. Children living in a family who went from worklessness to full employment and from part employment to full employment had the highest poverty exit rates (74 per cent and 75 per cent respectively), although relatively few families actually made the leap from workless to full employment. This suggests that moving families into work – including both parents in couple families – and then increasing the number of hours they work, plays a key role in reducing poverty.
Some families did not have a change in employment status but did have either a rise or fall in their earnings, either due to a small change in hours worked or a change in rates of pay. For children in families who experienced a rise in earnings while in full employment there was an associated poverty exit rate of 73 per cent. Progressing in work leading to higher rates of pay is another route out of poverty for working families.
Working familiesUnderstanding the poverty transitions made by working families is particularly important. Of special interest is understanding how working families can escape poverty. Poverty exit rates were found to vary by industry, occupation and contract type (of the main earner). For example, children living in families where the main earner works in public administration or the health industry, or has a professional occupation, had particularly high poverty exit rates (and low poverty entry rates), even when controlling for other factors. Having a permanent contract also increased the chances of exiting poverty. This mirrors previous research which has shown that those in a professional occupation are less likely than those in other occupations to have unstable work (Stewart, 2008) and that low-paid professionals are particularly likely to move out of low pay due to more progression opportunities (Lawton, 2009).
Some families move in and out of poverty due to the irregular nature of their work or other factors that can impact on the amount of work they can do. The poverty entry rate was 26 per cent where the main earner was in casual type of work43. Children living in families where the main earner works in the construction industry had both a higher than average poverty entry rate and poverty exit rate, and this remained the case even after controlling for other factors. These findings chime with previous research which suggested that those in such industries can cycle in and out of poverty due to reduced job security and limited opportunities for progression (for example, see (Stewart, 2008) and (Lawton, 2009)).
43 Where respondents said that their job was non-permanent they were asked whether it was: seasonal work; under contract for a fixed period or a fixed task; agency temping; casual type of work; not permanent in another way.
83
Child poverty transitions
Gaining employmentReducing worklessness is an important policy goal and families who moved from workless to full employment had high poverty exit rates (74 per cent). However, less than one in five children who exited poverty did so because their family found work having been workless. Workless families who moved into work and escaped poverty were more likely to be couples, have fewer children and have no disabled adults in the household. Those that remained workless and poor were more likely to have characteristics that could limit their ability to search for and accept work, including being a lone parent, having numerous children or having a disabled adult in the family. • Certain types of workless family may find it easier to work than others. Those families
whose circumstances make it harder to find work may need extra support and incentives.
5.1.3 Household eventsVarious household events were also independently associated with families entering and exiting poverty. Having a new baby can push some families into poverty. This is more likely to be the case when it corresponds with a parent reducing their hours of work or stopping work altogether. Similarly, families with a child reaching adulthood or leaving home were more likely to exit poverty44 even after controlling for other factors.
Parents’ qualifications were also related to poverty transitions, with those with the very highest level qualifications appearing to be protected from entering poverty. Those with degree level qualifications were less likely to enter poverty, and more likely to exit, than those with A-levels and below. Higher levels of educational qualifications are likely to mean families are better able to find employment that is secure and well paid.
Parental separation, although a relatively uncommon event, can push some families into poverty. Moving into poverty is more likely to happen if the absent parent does not provide maintenance and the remaining parent is not in work or works few hours. Although children in lone parent families had higher poverty entry rates and lower poverty exit rates than those from couple families, parental separation was not independently associated with poverty entry after controlling for other predictors. This is likely to be because employment status has a more direct impact on family income and therefore outweighs the effect of parental separation.
Changing from a lone parent to a couple family was independently associated with a lower poverty entry rate. This additional adult in the family is not only an additional potential worker to contribute to household income, but may also allow the family to share childcare duties.
New familiesPoverty can be of particular concern for families having their first child. These ‘new families’ had a higher than average child poverty rate. The rate was particularly high for lone parent families, workless families where the parent(s) had no formal qualifications or where the mother was young. The majority of new families where no parent was in work, whether while expecting their first child or when the baby was nine months old, were income poor at the time when the baby was nine months old.
44 Families may have fewer children at the later time point due to a child becoming an adult (whether they move out or stay at home), a child moving out (e.g. to live with another family member), or a child dying.
84
Child poverty transitions
Overall, mothers in poor new families were less likely to have returned to work by the time their firstborn child was age seven-years-old, than mothers in families that were not poor when their (first) baby was nine months old.• Certain families are vulnerable to poverty on the birth of their first child; particularly those
with poor connections to the labour market. Single people and those who separate when the baby is young are at high risk of poverty.
ChildcareAffordable, flexible and high quality childcare can be an aide for families looking to find or maintain work – although the cost of childcare can be a disincentive for poorer parents. Childcare use tends to increase with longer hours worked, for obvious reasons, and the amount of childcare used by fully employed couples was similar to that used by fully employed lone parents – presumably driven by the fact that both sets of families would have no one at home to look after the children. Families who exited poverty generally had similar childcare use as families in poverty, with the exception of employed lone parents. A large proportion (43 per cent) of working lone parents who exited poverty used childcare (particularly formal childcare), in comparison to working lone parents who remained poor (22 per cent).• The cost of childcare can keep poor families in poverty by disincentivising parents to find
work. Childcare needs to be affordable, flexible and high quality and should not be an obstacle to finding or maintaining work.
Benefit incomeChanges to benefit amounts and benefit eligibility can push families across the poverty line (in either direction).45 Sources of income other than earnings are likely to be important for families in poverty or at risk of poverty, and rises and falls in these were associated with movements into and out of poverty. Benefit income was the most prevalent non-earnings income source, and a fall in benefit income was associated with a higher than average entry rate (13 per cent) and a rise in benefit income was associated with a higher than average exit rate (48 per cent) and this remained true when controlling for other factors.
5.1.4 EthnicityChildren from ethnic minority groups are particularly vulnerable to poverty. Compared with children of white ethnicity, children of black African, Bangladeshi, and Pakistani ethnicities all had higher poverty entry rates and lower poverty exit rates, even after controlling for other factors. • Certain ethnic groups (black African, Bangladeshi, and Pakistani) are more likely to enter
poverty and remain poor, so likely to be at risk of persistent poverty.
Indian and black Caribbean children had both high poverty entry rates and high poverty exit rates, compared with white children, even after controlling for other factors.• This suggests that these children may experience more temporary spells of poverty, as
higher poverty entry rates are offset by higher poverty exit rates as well.
45 A rise or fall in benefit income is likely to be due to a change in household circumstances (such as employment or household composition) leading to a change in eligibility.
85
Child poverty transitions
Low sample sizes meant ethnicities needed to be grouped in order to explore these issues further. Separate analysis was run exploring poverty entries and poverty exits among those of South Asian ethnicity (Indian, Pakistani, and Bangladeshi) and among those of black ethnicity (Caribbean and African), as well as for children of white ethnicity. Although findings tended to be similar to those for all children, interesting differences between ethnic groups did emerge. South Asian children from lone parent families and white children in social housing were particularly at risk of entering poverty, while black children in families where a child reached adulthood or left home, and South Asian children in families where the youngest child turned secondary school age were particularly likely to exit poverty.• The evidence points to particular subgroups of ethnic minority families at high risk of
poverty transitions. These subgroups are worthy of more in-depth (qualitative) investigation to explore the reasons for high poverty risks. Areas for further research are discussed in Section 5.3.
5.2 What has changed since before the recession?
Both the Low Income Dynamics (LID) report (DWP, 2010) and Jenkins (2011) analysed poverty transitions during years up to the recent recession in 2008 using data from the British Household Panel Survey (BHPS). In this section we compare the findings in our report, based on data after the recession (2009/10-2011/12), to the findings from those two pre-recession studies. In particular we discuss findings based on similar analysis of poverty transitions presented in LID (see annex tables; Table A23 and Table A45).
Clearly it is difficult to make direct comparisons between the studies as they use different data sources, and hence there are slight variations in some of the measures used. Furthermore, because of the lower sample size of the BHPS neither the LID or Jenkins studies focused solely on families with children. Although both studies made reference to child poverty transitions, the bulk of their findings relate to all individuals (whether living with children or not, and including pensioners).
Despite these caveats to the approach, in general the findings from this study appear to suggest similar findings to earlier studies. Again employment activities are most strongly linked to poverty transitions and the strength of these relationships seem close to that found in LID and the Jenkins work. These and other main findings are discussed in more detail below.
Poverty entriesBoth LID and Jenkins found that changes in a household’s labour earnings accounted for the largest shares of entries to poverty. We found that this is still true for families with children – 52 per cent of children who entered poverty lived in families whose earnings had fallen in 2009/10 to 2011/12, compared to 53 per cent of all individuals in 1991 to 2008.
86
Child poverty transitions
LID found that a reduction in benefits accounted for 27 per cent of poverty entries (household size remaining the same)46. Our analysis of children found this to be higher (41 per cent), as benefit receipt was more common among families with children than the population as a whole. Other types of income – such as investment income and pensions – were less common for families with children.
Other changes such as demographic events accounted for a negligible fraction of poverty transitions. Both our research and LID found lone parents to have the highest entry rate into poverty at around one in seven. LID analysis actually picked up more households changing to become lone parents, mainly because we focused on families that had children at both waves and hence missed ‘new families’ (although we did look at these families separately, and found that new lone parents had a very high rate of being poor).
Poverty exits
Changes in a household’s labour earnings also accounted for the largest share of exits out of poverty – 53 per cent of children who exited poverty lived in families whose earnings had risen in 2009/10 to 2011/12, as did the same proportion all individuals in 1991 to 2008. Similar findings were found across the studies for the rise in the number of workers.
Again, changes to benefit income appeared to have a bigger impact on children than all individuals (50 per cent of children who exited poverty lived in families whose benefit income had risen in 2009/10 to 2011/12 compared to 35 per cent of all individuals in 1991 to 2008).47
5.2.1 Further researchUsing data from panel surveys to explore income transitions provides crucial evidence to policy makers trying to eradicate child poverty. It helps them understand why people move into poverty, and what helps them to escape. This information simply is not available from the standard cross-sectional surveys. Furthermore, cross-sectional research can ignore the fact that poverty at a point in time is the net outcome of movements into and out of poverty, and that the different factors that drive poverty entry and poverty exit can easily get overlooked.
More research that explores poverty transitions, and what drives them, is welcomed. This study has uncovered some important findings that are worthy of more in-depth investigation, whether through further analysis of longitudinal data or other methods such as qualitative research. Many of the findings would benefit from more waves of longitudinal data to further explore longer term patterns. For example, to measure how long families manage to escape poverty, how long families that enter poverty remain poor, and whether families cycle in and out of poverty.
46 A reduction in benefit income is likely to be due to a change in household circumstances (such as employment or household composition) leading to a change in eligibility. Household composition may change while household size remains the same due to differences in the number of children and adults, which may affect benefit eligibility.
47 A reduction in benefit income is likely to be due to a change in household circumstances (such as employment or household composition) leading to a change in eligibility. Household composition may change while household size remains the same due to differences in the number of children and adults, which may affect benefit eligibility.
87
Child poverty transitions
Moving into, and progressing in, work is clearly a key way for poorer families to increase their incomes. Tracking families for longer periods would enable us to observe whether parents who move into work, particularly low-paid work, manage to sustain their jobs, and if so whether they are able to increase their earnings. This is likely to vary according to family circumstances and type of job, so new research would look to understand the different enablers and barriers.
Childcare is a key factor that enables parents to work, and more research is needed to understand how families manage work and family life, particularly at key transition points such as the birth of a child, children reaching school age and leaving home, and as parents change job roles or employer.
Surveys such as USoc capture various aspects of children’s development and wellbeing. It would be useful to explore how changes in family income, particularly those that push children above, or below, the poverty line have a direct impact on various child outcomes.
This research has identified differential rates of poverty transitions across ethnic groups. Despite boosting the number of ethnic minority respondents in the USoc survey, the ability to understand the role of ethnicity is still limited by the small sample sizes. Collating respondents across more pairs of waves will enlarge sample sizes and allow for further analysis. Of particular interest will be to explore how ethnicity interacts with other factors linked to poverty transitions, such as family type and family size.
Other aspects of poverty transitions that this study did not cover include defining poverty in different ways, for example, according to material deprivation rather than solely by income, looking further at the depth of poverty, and understanding how poverty relates to other economic measures such as debts, the amount of savings, and spending patterns.
Finally, exploring poverty dynamics, collecting detailed information on people’s incomes, and deciding if and why incomes have changed is not straightforward. People receive income from a variety of sources and it is relatively easy for people to forget what and how much they get. This can be compounded when calculating household, rather than individual, income as under or misreporting can happen from different people in the same household. So research to continue to improve the quality of income information in panel surveys is of paramount importance. That the events that can trigger a change in income did not perfectly align with the poverty transitions investigated in this study is not surprising. Although panel surveys are designed to be able to measure change, often this is only achieved by piecing together information from different time points (for example, consecutive surveys) – and observing how circumstances, behaviours and attitudes differ from one time point to another. More research could be done to help verify changes, such as income transitions and events that may cause them, within the survey interview. This would not only help explain why a poverty transition has taken place, but also verify whether it took place at all.
88
Child poverty transitions
Appendix A Imputing Understanding Society income dataIntroductionWhen researching poverty transitions using a measure of income poverty, consistency in income collection across the waves48 is essential. This is because of the focus on changes in income, and any events or characteristics associated with this change. Therefore confidence is needed that any change in income is ‘real’ and not due to measurement error. As incomes are skewed towards the lower end of the income scale this issue is particularly important, as a small change in income can result in a large movement along the income distribution. Where problems with the data occur, imputation methods can be used to try to correct the data.
In this annex we describe a number of steps taken to correct the problems with the Understanding Society (USoc) income data:• How income data is collected in USoc.
• The problem with wave 1 USoc income data.
• The different imputation options.
• The method we used.
How income data is collected in Understanding SocietyUSoc is a large-scale longitudinal survey that tracks the circumstances, behaviours and attitudes of the British population. The first wave of the survey took place in 2009-10 (a wave spans two calendar years) and respondents are surveyed every year (wave two spans 2010-2011 and so on). The survey collects information on a wide range of topics, including detailed income information. All respondents who are aged 16 or over are asked to report all their personal income:
Labour income:• Wages;
• Self-employment earnings; and
• Second job earnings.
48 In surveys where the same households are interviewed at regular time points (for example annually) each interview period is referred to as a ‘wave’.
89
Child poverty transitions
Benefits• benefits (National Insurance/State Retirement Pension, Widow’s or War Widow’s Pension,
Widowed Mother’s Allowance or Widowed Pension, Pension Credit, Severe Disablement Allowance, Disability Living Allowance, War Disablement Pension, Attendance Allowance, Carer’s Allowance, Incapacity Benefit,Income Support, Jobseeker’s Allowance, National Insurance credits, Child Benefit, Child Tax Credit, Working Tax Credit, Maternity Allowance, Housing Benefit, Council Tax Benefit, Foster Allowance/Guardian Allowance/rent rebate, rate rebate, Employment and Support Allowance, Return to Work Credit, sickness and accident insurance, in-work credit for lone parents).
Saving and investment income:• interest and dividends from savings and assets.
Other sources:• pension from a previous employer, pension from a spouse’s previous employer,
private pension/annuity, educational grant, trades union and friendly society payment, maintenance or alimony, payments from a family member not living together, amount for rent from boarders or lodgers, rent from any other property.
Summing the total incomes of all household members gives the total gross household income. Net income is the gross household income with deductions made for income tax payments, National Insurance contributions, domestic rates/council tax, contributions to occupational pension schemes, and child support payments. The analysis presented below focuses on net household income, i.e. after deductions.
Respondents don’t always know the amount of income they receive, just that they know they receive something. For example, a respondent may know that they receive a particular benefit, but not how much they receive. These amounts get imputed into the dataset by taking an average amount from similar respondents receiving that same benefit49. Imputation such as this is not carried out for those who do not report an income source at all, for example, a respondent who does receive Child Benefit, but forgets to mention this in the interview. For the Family Resources Survey50 (FRS), the Department for Work and Pensions’ (DWP’s) specialist income series, imputation is carried out so that there is no missing information for “components of key derived variables, such as total household income and housing costs, and areas key to the work of the Department, such as benefit receipt”51. On top of this, validation work is carried out on the FRS dataset where income amounts have been reported. This includes examining zero and near-zero income amounts, assessing
49 For more on this see https://www.understandingsociety.ac.uk/d/82/MS_UserManual.pdf?1388678212
50 The FRS, made available by the UK Data Archive, provides a comparison with USoc based on a well-established specialist income survey. Figures labelled in this chapter are derived from the FRS based on direct analysis of the FRS dataset, not the results reported in the official FRS publications. All FRS money figures are adjusted to make them more directly comparable with USoc, by converting weekly to monthly amounts. FRS data are restricted to adults with children in that year, as the FRS interviews different households each year. Due to this and other differences between the surveys, figures may not be directly comparable.
51 See https://www.gov.uk/government/uploads/system/uploads/attachment_data/file/206887/frs_2011_12_report.pdf
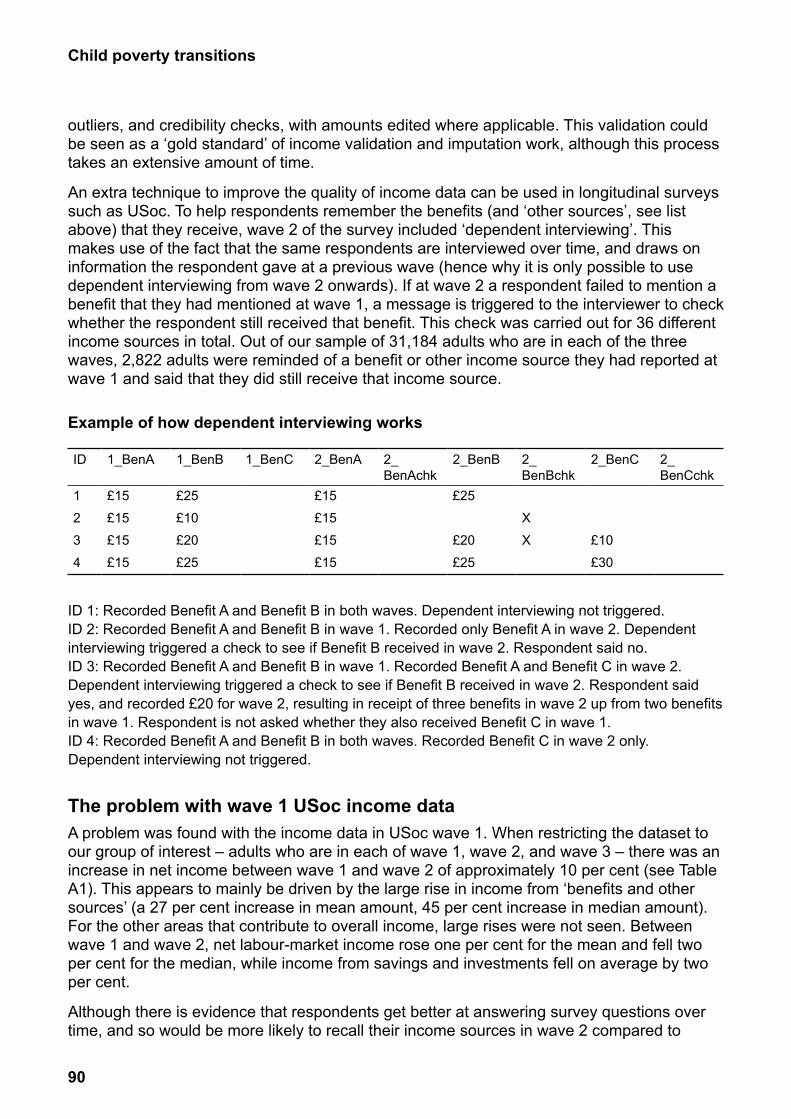
90
Child poverty transitions
outliers, and credibility checks, with amounts edited where applicable. This validation could be seen as a ‘gold standard’ of income validation and imputation work, although this process takes an extensive amount of time.
An extra technique to improve the quality of income data can be used in longitudinal surveys such as USoc. To help respondents remember the benefits (and ‘other sources’, see list above) that they receive, wave 2 of the survey included ‘dependent interviewing’. This makes use of the fact that the same respondents are interviewed over time, and draws on information the respondent gave at a previous wave (hence why it is only possible to use dependent interviewing from wave 2 onwards). If at wave 2 a respondent failed to mention a benefit that they had mentioned at wave 1, a message is triggered to the interviewer to check whether the respondent still received that benefit. This check was carried out for 36 different income sources in total. Out of our sample of 31,184 adults who are in each of the three waves, 2,822 adults were reminded of a benefit or other income source they had reported at wave 1 and said that they did still receive that income source.
Example of how dependent interviewing works
ID 1_BenA 1_BenB 1_BenC 2_BenA 2_BenAchk
2_BenB 2_BenBchk
2_BenC 2_BenCchk
1 £15 £25 £15 £25
2 £15 £10 £15 X
3 £15 £20 £15 £20 X £10
4 £15 £25 £15 £25 £30
ID 1: Recorded Benefit A and Benefit B in both waves. Dependent interviewing not triggered.ID 2: Recorded Benefit A and Benefit B in wave 1. Recorded only Benefit A in wave 2. Dependent interviewing triggered a check to see if Benefit B received in wave 2. Respondent said no.ID 3: Recorded Benefit A and Benefit B in wave 1. Recorded Benefit A and Benefit C in wave 2. Dependent interviewing triggered a check to see if Benefit B received in wave 2. Respondent said yes, and recorded £20 for wave 2, resulting in receipt of three benefits in wave 2 up from two benefits in wave 1. Respondent is not asked whether they also received Benefit C in wave 1.ID 4: Recorded Benefit A and Benefit B in both waves. Recorded Benefit C in wave 2 only. Dependent interviewing not triggered.
The problem with wave 1 USoc income dataA problem was found with the income data in USoc wave 1. When restricting the dataset to our group of interest – adults who are in each of wave 1, wave 2, and wave 3 – there was an increase in net income between wave 1 and wave 2 of approximately 10 per cent (see Table A1). This appears to mainly be driven by the large rise in income from ‘benefits and other sources’ (a 27 per cent increase in mean amount, 45 per cent increase in median amount). For the other areas that contribute to overall income, large rises were not seen. Between wave 1 and wave 2, net labour-market income rose one per cent for the mean and fell two per cent for the median, while income from savings and investments fell on average by two per cent.
Although there is evidence that respondents get better at answering survey questions over time, and so would be more likely to recall their income sources in wave 2 compared to
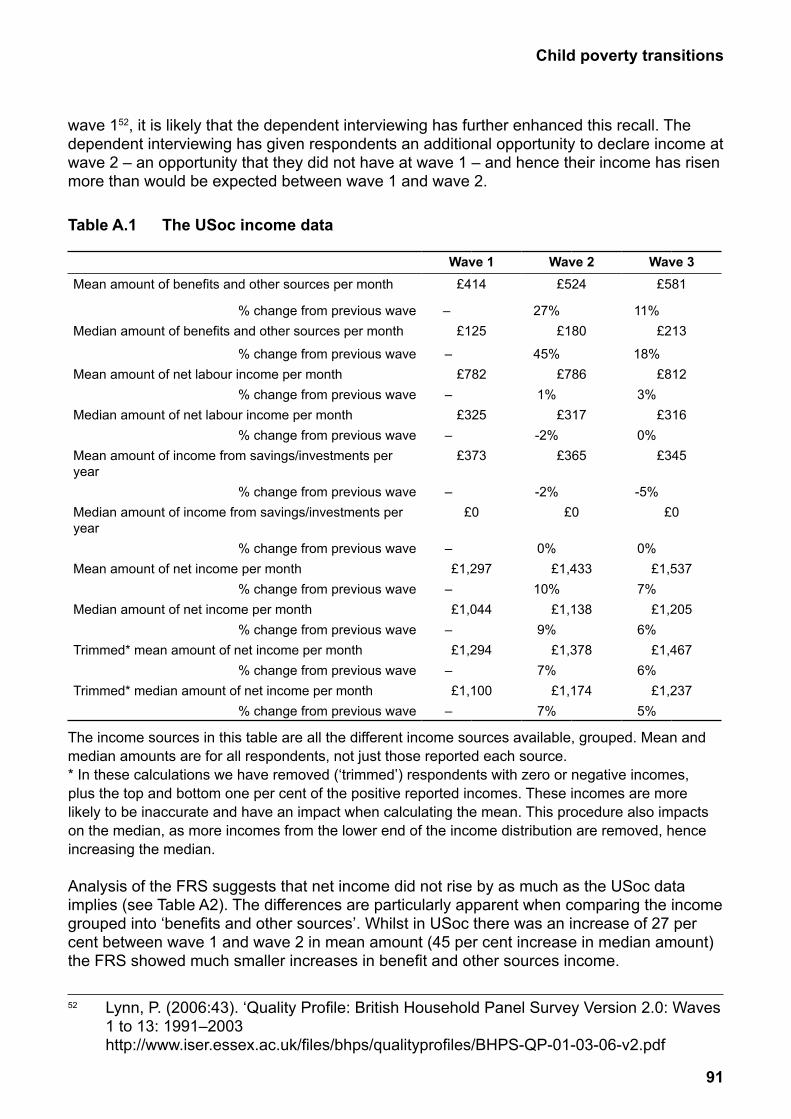
91
Child poverty transitions
wave 152, it is likely that the dependent interviewing has further enhanced this recall. The dependent interviewing has given respondents an additional opportunity to declare income at wave 2 – an opportunity that they did not have at wave 1 – and hence their income has risen more than would be expected between wave 1 and wave 2.
Table A.1 The USoc income data
Wave 1 Wave 2 Wave 3Mean amount of benefits and other sources per month £414 £524 £581
% change from previous wave – 27% 11%Median amount of benefits and other sources per month £125 £180 £213
% change from previous wave – 45% 18%Mean amount of net labour income per month £782 £786 £812
% change from previous wave – 1% 3%Median amount of net labour income per month £325 £317 £316
% change from previous wave – -2% 0%Mean amount of income from savings/investments per year
£373 £365 £345
% change from previous wave – -2% -5%Median amount of income from savings/investments per year
£0 £0 £0
% change from previous wave – 0% 0%Mean amount of net income per month £1,297 £1,433 £1,537
% change from previous wave – 10% 7%Median amount of net income per month £1,044 £1,138 £1,205
% change from previous wave – 9% 6%Trimmed* mean amount of net income per month £1,294 £1,378 £1,467
% change from previous wave – 7% 6%Trimmed* median amount of net income per month £1,100 £1,174 £1,237
% change from previous wave – 7% 5%
The income sources in this table are all the different income sources available, grouped. Mean and median amounts are for all respondents, not just those reported each source.* In these calculations we have removed (‘trimmed’) respondents with zero or negative incomes, plus the top and bottom one per cent of the positive reported incomes. These incomes are more likely to be inaccurate and have an impact when calculating the mean. This procedure also impacts on the median, as more incomes from the lower end of the income distribution are removed, hence increasing the median.
Analysis of the FRS suggests that net income did not rise by as much as the USoc data implies (see Table A2). The differences are particularly apparent when comparing the income grouped into ‘benefits and other sources’. Whilst in USoc there was an increase of 27 per cent between wave 1 and wave 2 in mean amount (45 per cent increase in median amount) the FRS showed much smaller increases in benefit and other sources income.
52 Lynn, P. (2006:43). ‘Quality Profile: British Household Panel Survey Version 2.0: Waves 1 to 13: 1991–2003 http://www.iser.essex.ac.uk/files/bhps/qualityprofiles/BHPS-QP-01-03-06-v2.pdf
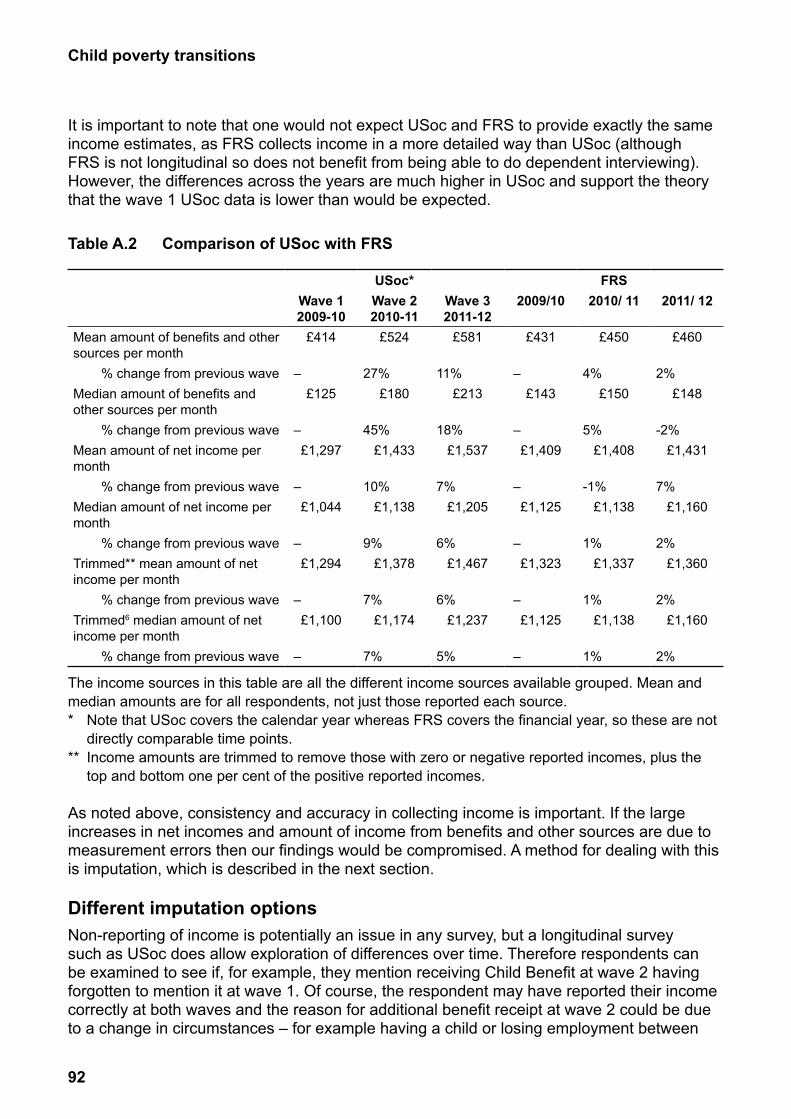
92
Child poverty transitions
It is important to note that one would not expect USoc and FRS to provide exactly the same income estimates, as FRS collects income in a more detailed way than USoc (although FRS is not longitudinal so does not benefit from being able to do dependent interviewing). However, the differences across the years are much higher in USoc and support the theory that the wave 1 USoc data is lower than would be expected.
Table A.2 Comparison of USoc with FRS
USoc* FRSWave 1 2009-10
Wave 2 2010-11
Wave 3 2011-12
2009/10 2010/ 11 2011/ 12
Mean amount of benefits and other sources per month
£414 £524 £581 £431 £450 £460
% change from previous wave – 27% 11% – 4% 2%Median amount of benefits and other sources per month
£125 £180 £213 £143 £150 £148
% change from previous wave – 45% 18% – 5% -2%Mean amount of net income per month
£1,297 £1,433 £1,537 £1,409 £1,408 £1,431
% change from previous wave – 10% 7% – -1% 7%Median amount of net income per month
£1,044 £1,138 £1,205 £1,125 £1,138 £1,160
% change from previous wave – 9% 6% – 1% 2%Trimmed** mean amount of net income per month
£1,294 £1,378 £1,467 £1,323 £1,337 £1,360
% change from previous wave – 7% 6% – 1% 2%Trimmed6 median amount of net income per month
£1,100 £1,174 £1,237 £1,125 £1,138 £1,160
% change from previous wave – 7% 5% – 1% 2%
The income sources in this table are all the different income sources available grouped. Mean and median amounts are for all respondents, not just those reported each source.* Note that USoc covers the calendar year whereas FRS covers the financial year, so these are not
directly comparable time points.** Income amounts are trimmed to remove those with zero or negative reported incomes, plus the
top and bottom one per cent of the positive reported incomes.
As noted above, consistency and accuracy in collecting income is important. If the large increases in net incomes and amount of income from benefits and other sources are due to measurement errors then our findings would be compromised. A method for dealing with this is imputation, which is described in the next section.
Different imputation optionsNon-reporting of income is potentially an issue in any survey, but a longitudinal survey such as USoc does allow exploration of differences over time. Therefore respondents can be examined to see if, for example, they mention receiving Child Benefit at wave 2 having forgotten to mention it at wave 1. Of course, the respondent may have reported their income correctly at both waves and the reason for additional benefit receipt at wave 2 could be due to a change in circumstances – for example having a child or losing employment between
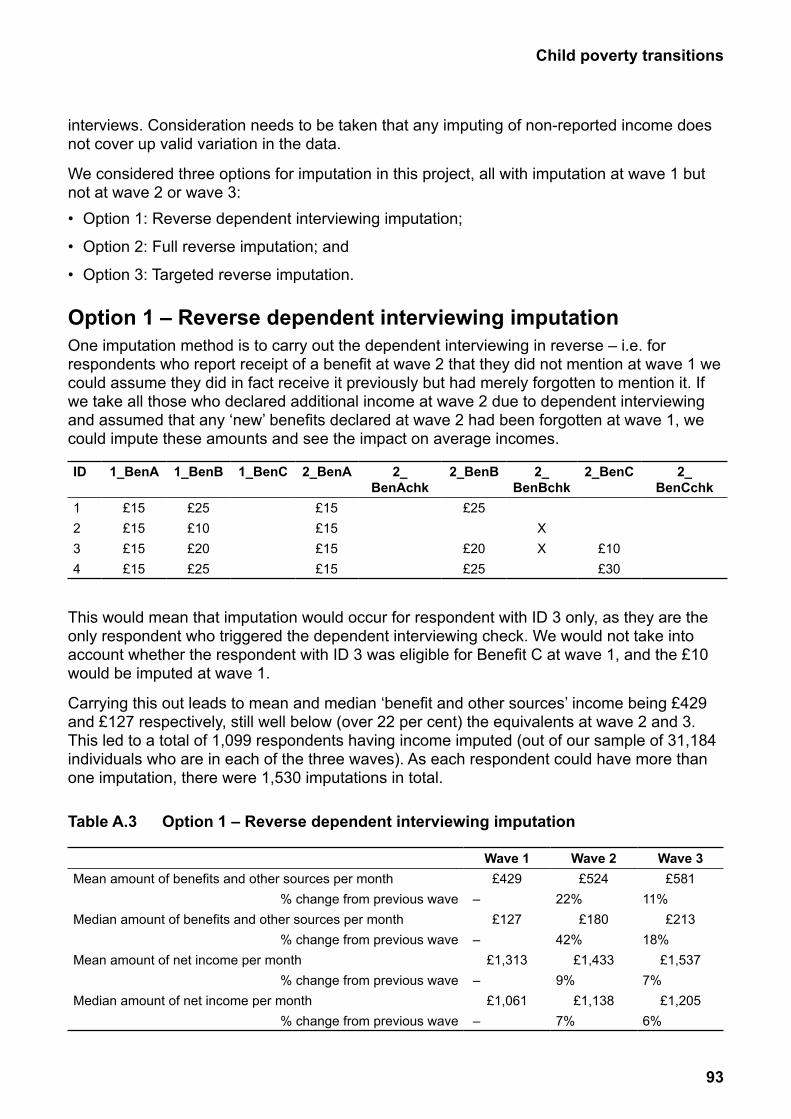
93
Child poverty transitions
interviews. Consideration needs to be taken that any imputing of non-reported income does not cover up valid variation in the data.
We considered three options for imputation in this project, all with imputation at wave 1 but not at wave 2 or wave 3:• Option 1: Reverse dependent interviewing imputation;
• Option 2: Full reverse imputation; and
• Option 3: Targeted reverse imputation.
Option 1 – Reverse dependent interviewing imputationOne imputation method is to carry out the dependent interviewing in reverse – i.e. for respondents who report receipt of a benefit at wave 2 that they did not mention at wave 1 we could assume they did in fact receive it previously but had merely forgotten to mention it. If we take all those who declared additional income at wave 2 due to dependent interviewing and assumed that any ‘new’ benefits declared at wave 2 had been forgotten at wave 1, we could impute these amounts and see the impact on average incomes.
ID 1_BenA 1_BenB 1_BenC 2_BenA 2_ BenAchk
2_BenB 2_ BenBchk
2_BenC 2_ BenCchk
1 £15 £25 £15 £252 £15 £10 £15 X3 £15 £20 £15 £20 X £104 £15 £25 £15 £25 £30
This would mean that imputation would occur for respondent with ID 3 only, as they are the only respondent who triggered the dependent interviewing check. We would not take into account whether the respondent with ID 3 was eligible for Benefit C at wave 1, and the £10 would be imputed at wave 1.
Carrying this out leads to mean and median ‘benefit and other sources’ income being £429 and £127 respectively, still well below (over 22 per cent) the equivalents at wave 2 and 3. This led to a total of 1,099 respondents having income imputed (out of our sample of 31,184 individuals who are in each of the three waves). As each respondent could have more than one imputation, there were 1,530 imputations in total.
Table A.3 Option 1 – Reverse dependent interviewing imputation
Wave 1 Wave 2 Wave 3Mean amount of benefits and other sources per month £429 £524 £581
% change from previous wave – 22% 11%Median amount of benefits and other sources per month £127 £180 £213
% change from previous wave – 42% 18%Mean amount of net income per month £1,313 £1,433 £1,537
% change from previous wave – 9% 7%Median amount of net income per month £1,061 £1,138 £1,205
% change from previous wave – 7% 6%
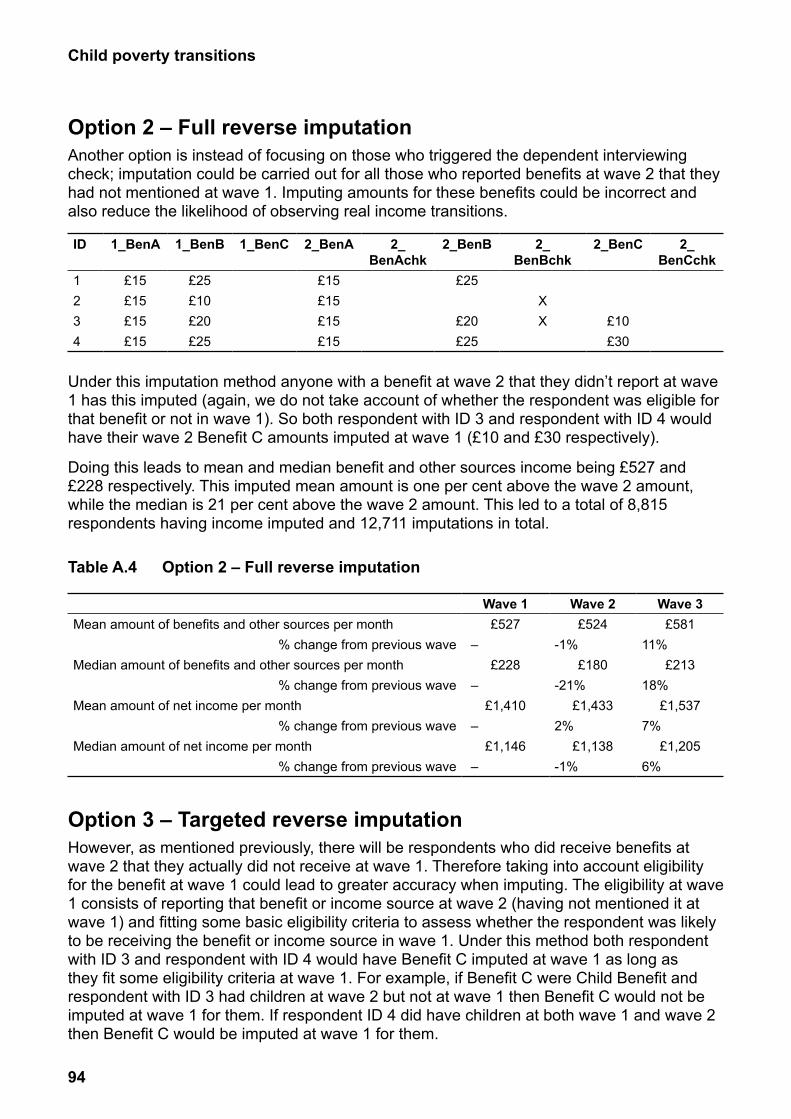
94
Child poverty transitions
Option 2 – Full reverse imputationAnother option is instead of focusing on those who triggered the dependent interviewing check; imputation could be carried out for all those who reported benefits at wave 2 that they had not mentioned at wave 1. Imputing amounts for these benefits could be incorrect and also reduce the likelihood of observing real income transitions.
ID 1_BenA 1_BenB 1_BenC 2_BenA 2_BenAchk
2_BenB 2_ BenBchk
2_BenC 2_ BenCchk
1 £15 £25 £15 £252 £15 £10 £15 X3 £15 £20 £15 £20 X £104 £15 £25 £15 £25 £30
Under this imputation method anyone with a benefit at wave 2 that they didn’t report at wave 1 has this imputed (again, we do not take account of whether the respondent was eligible for that benefit or not in wave 1). So both respondent with ID 3 and respondent with ID 4 would have their wave 2 Benefit C amounts imputed at wave 1 (£10 and £30 respectively).
Doing this leads to mean and median benefit and other sources income being £527 and £228 respectively. This imputed mean amount is one per cent above the wave 2 amount, while the median is 21 per cent above the wave 2 amount. This led to a total of 8,815 respondents having income imputed and 12,711 imputations in total.
Table A.4 Option 2 – Full reverse imputation
Wave 1 Wave 2 Wave 3Mean amount of benefits and other sources per month £527 £524 £581
% change from previous wave – -1% 11%Median amount of benefits and other sources per month £228 £180 £213
% change from previous wave – -21% 18%Mean amount of net income per month £1,410 £1,433 £1,537
% change from previous wave – 2% 7%Median amount of net income per month £1,146 £1,138 £1,205
% change from previous wave – -1% 6%
Option 3 – Targeted reverse imputationHowever, as mentioned previously, there will be respondents who did receive benefits at wave 2 that they actually did not receive at wave 1. Therefore taking into account eligibility for the benefit at wave 1 could lead to greater accuracy when imputing. The eligibility at wave 1 consists of reporting that benefit or income source at wave 2 (having not mentioned it at wave 1) and fitting some basic eligibility criteria to assess whether the respondent was likely to be receiving the benefit or income source in wave 1. Under this method both respondent with ID 3 and respondent with ID 4 would have Benefit C imputed at wave 1 as long as they fit some eligibility criteria at wave 1. For example, if Benefit C were Child Benefit and respondent with ID 3 had children at wave 2 but not at wave 1 then Benefit C would not be imputed at wave 1 for them. If respondent ID 4 did have children at both wave 1 and wave 2 then Benefit C would be imputed at wave 1 for them.
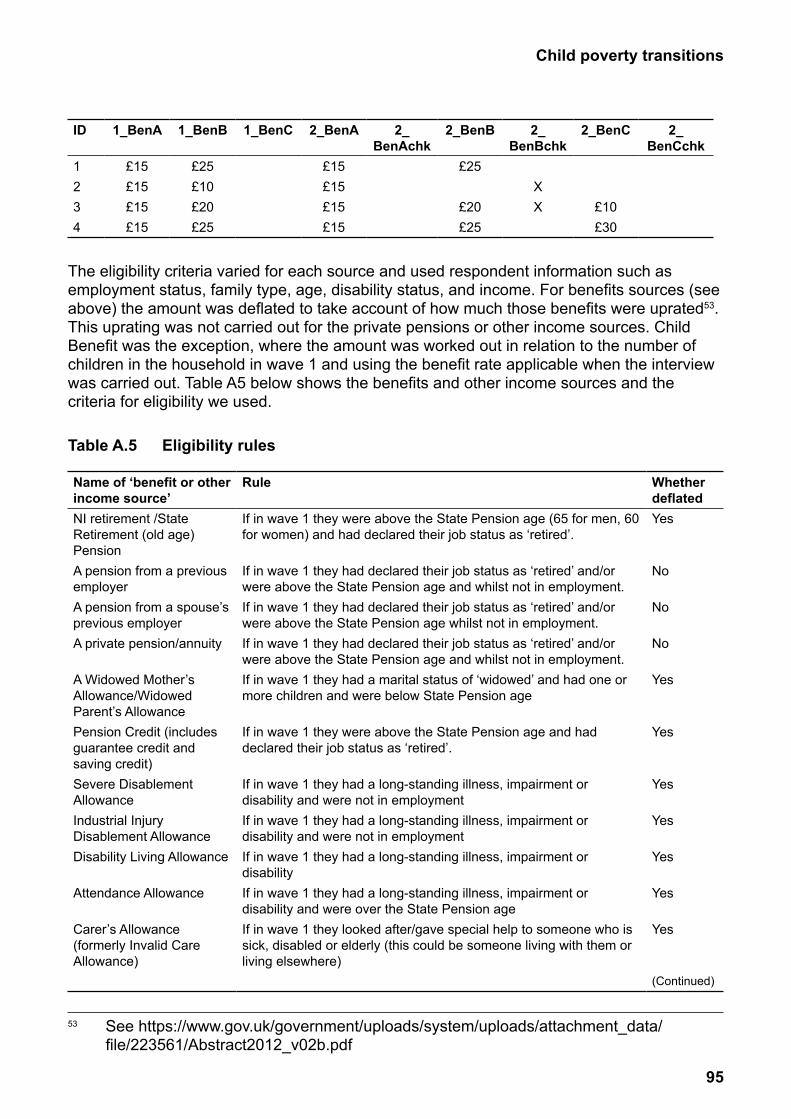
95
Child poverty transitions
ID 1_BenA 1_BenB 1_BenC 2_BenA 2_ 2_BenB 2_ 2_BenC 2_BenAchk BenBchk BenCchk
1 £15 £25 £15 £252 £15 £10 £15 X3 £15 £20 £15 £20 X £104 £15 £25 £15 £25 £30
The eligibility criteria varied for each source and used respondent information such as employment status, family type, age, disability status, and income. For benefits sources (see above) the amount was deflated to take account of how much those benefits were uprated53. This uprating was not carried out for the private pensions or other income sources. Child Benefit was the exception, where the amount was worked out in relation to the number of children in the household in wave 1 and using the benefit rate applicable when the interview was carried out. Table A5 below shows the benefits and other income sources and the criteria for eligibility we used.
Table A.5 Eligibility rules
Name of ‘benefit or other Rule Whether income source’ deflatedNI retirement /State If in wave 1 they were above the State Pension age (65 for men, 60 YesRetirement (old age) for women) and had declared their job status as ‘retired’.PensionA pension from a previous If in wave 1 they had declared their job status as ‘retired’ and/or Noemployer were above the State Pension age and whilst not in employment.A pension from a spouse’s If in wave 1 they had declared their job status as ‘retired’ and/or Noprevious employer were above the State Pension age whilst not in employment.A private pension/annuity If in wave 1 they had declared their job status as ‘retired’ and/or
were above the State Pension age and whilst not in employment.No
A Widowed Mother’s If in wave 1 they had a marital status of ‘widowed’ and had one or YesAllowance/Widowed more children and were below State Pension ageParent’s AllowancePension Credit (includes If in wave 1 they were above the State Pension age and had Yesguarantee credit and declared their job status as ‘retired’.saving credit)Severe Disablement If in wave 1 they had a long-standing illness, impairment or YesAllowance disability and were not in employmentIndustrial Injury If in wave 1 they had a long-standing illness, impairment or YesDisablement Allowance disability and were not in employmentDisability Living Allowance If in wave 1 they had a long-standing illness, impairment or
disabilityYes
Attendance Allowance If in wave 1 they had a long-standing illness, impairment or disability and were over the State Pension age
Yes
Carer’s Allowance If in wave 1 they looked after/gave special help to someone who is Yes(formerly Invalid Care sick, disabled or elderly (this could be someone living with them or Allowance) living elsewhere)
(Continued)
53 See https://www.gov.uk/government/uploads/system/uploads/attachment_data/file/223561/Abstract2012_v02b.pdf
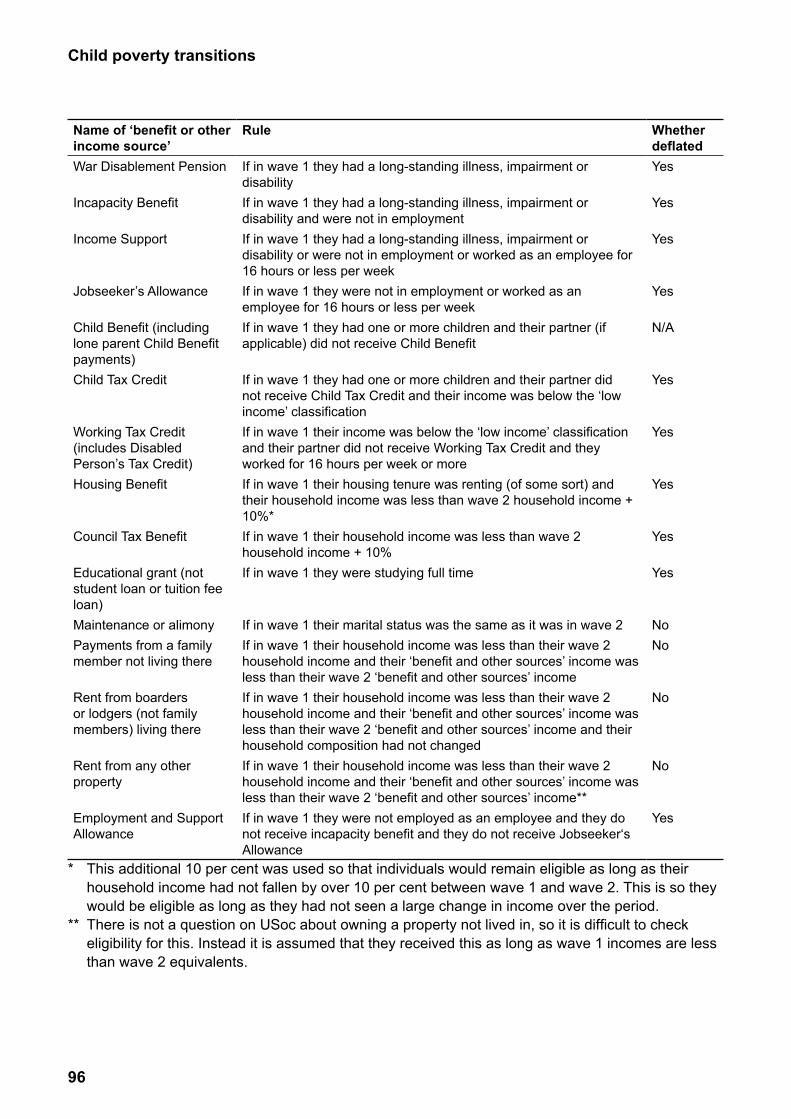
96
Child poverty transitions
Name of ‘benefit or other income source’
Rule Whether deflated
War Disablement Pension If in wave 1 they had a long-standing illness, impairment or disability
Yes
Incapacity Benefit If in wave 1 they had a long-standing illness, impairment or disability and were not in employment
Yes
Income Support If in wave 1 they had a long-standing illness, impairment or disability or were not in employment or worked as an employee for 16 hours or less per week
Yes
Jobseeker’s Allowance If in wave 1 they were not in employment or worked as an employee for 16 hours or less per week
Yes
Child Benefit (including lone parent Child Benefit payments)
If in wave 1 they had one or more children and their partner (if applicable) did not receive Child Benefit
N/A
Child Tax Credit If in wave 1 they had one or more children and their partner did not receive Child Tax Credit and their income was below the ‘low income’ classification
Yes
Working Tax Credit (includes Disabled Person’s Tax Credit)
If in wave 1 their income was below the ‘low income’ classification and their partner did not receive Working Tax Credit and they worked for 16 hours per week or more
Yes
Housing Benefit If in wave 1 their housing tenure was renting (of some sort) and their household income was less than wave 2 household income + 10%*
Yes
Council Tax Benefit If in wave 1 their household income was less than wave 2 household income + 10%
Yes
Educational grant (not student loan or tuition fee loan)
If in wave 1 they were studying full time Yes
Maintenance or alimony If in wave 1 their marital status was the same as it was in wave 2 NoPayments from a family member not living there
If in wave 1 their household income was less than their wave 2 household income and their ‘benefit and other sources’ income was less than their wave 2 ‘benefit and other sources’ income
No
Rent from boarders or lodgers (not family members) living there
If in wave 1 their household income was less than their wave 2 household income and their ‘benefit and other sources’ income was less than their wave 2 ‘benefit and other sources’ income and their household composition had not changed
No
Rent from any other property
If in wave 1 their household income was less than their wave 2 household income and their ‘benefit and other sources’ income was less than their wave 2 ‘benefit and other sources’ income**
No
Employment and Support Allowance
If in wave 1 they were not employed as an employee and they do not receive incapacity benefit and they do not receive Jobseeker‘s Allowance
Yes
* This additional 10 per cent was used so that individuals would remain eligible as long as their household income had not fallen by over 10 per cent between wave 1 and wave 2. This is so they would be eligible as long as they had not seen a large change in income over the period.
** There is not a question on USoc about owning a property not lived in, so it is difficult to check eligibility for this. Instead it is assumed that they received this as long as wave 1 incomes are less than wave 2 equivalents.
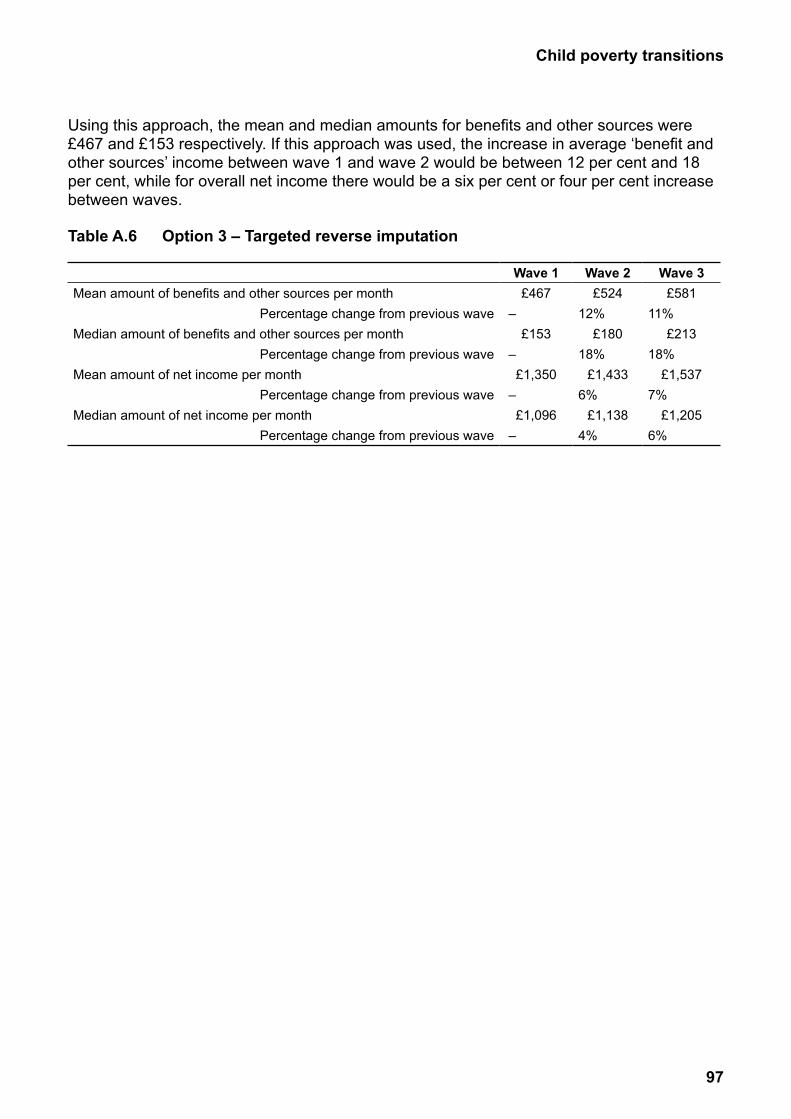
97
Child poverty transitions
Using this approach, the mean and median amounts for benefits and other sources were £467 and £153 respectively. If this approach was used, the increase in average ‘benefit and other sources’ income between wave 1 and wave 2 would be between 12 per cent and 18 per cent, while for overall net income there would be a six per cent or four per cent increase between waves.
Table A.6 Option 3 – Targeted reverse imputation
Wave 1 Wave 2 Wave 3Mean amount of benefits and other sources per month £467 £524 £581
Percentage change from previous wave – 12% 11%Median amount of benefits and other sources per month £153 £180 £213
Percentage change from previous wave – 18% 18%Mean amount of net income per month £1,350 £1,433 £1,537
Percentage change from previous wave – 6% 7%Median amount of net income per month £1,096 £1,138 £1,205
Percentage change from previous wave – 4% 6%
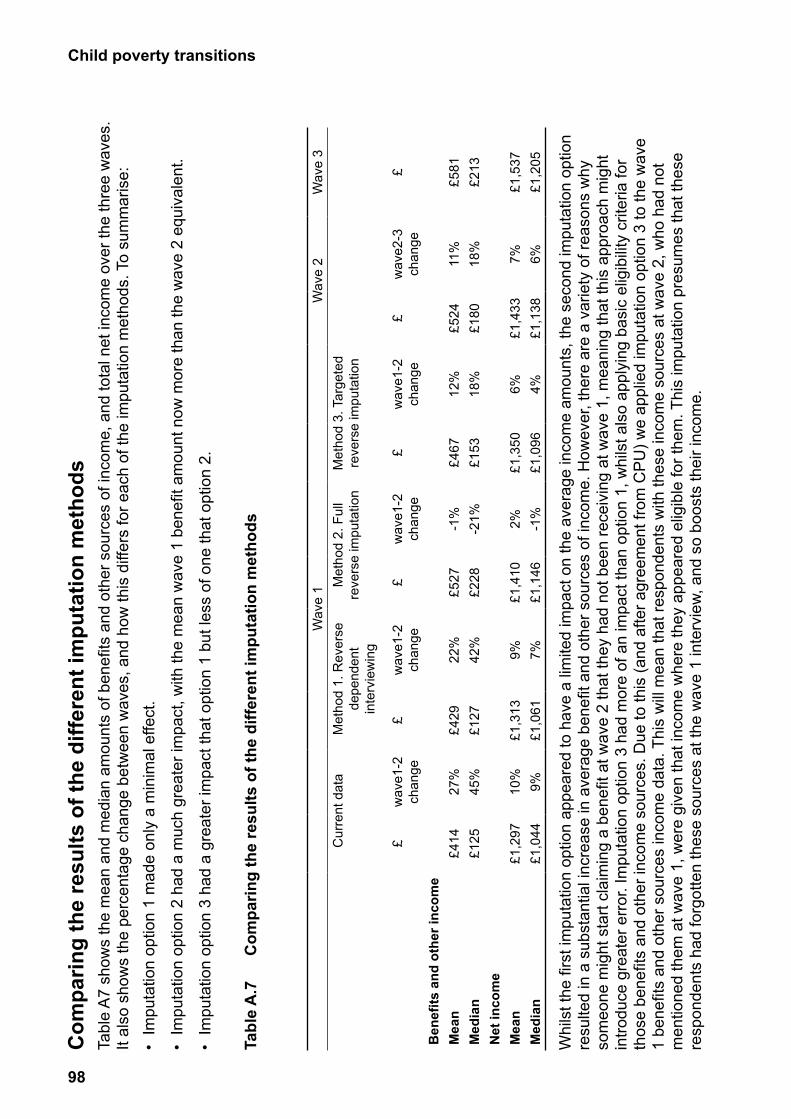
98
Child poverty transitionsC
ompa
ring
the
resu
lts o
f the
diff
eren
t im
puta
tion
met
hods
Tabl
e A
7 sh
ows
the
mea
n an
d m
edia
n am
ount
s of
ben
efits
and
oth
er s
ourc
es o
f inc
ome,
and
tota
l net
inco
me
over
the
thre
e w
aves
. It
also
sho
ws
the
perc
enta
ge c
hang
e be
twee
n w
aves
, and
how
this
diff
ers
for e
ach
of th
e im
puta
tion
met
hods
. To
sum
mar
ise:
• Im
puta
tion
optio
n 1
mad
e on
ly a
min
imal
effe
ct.
• Im
puta
tion
optio
n 2
had
a m
uch
grea
ter i
mpa
ct, w
ith th
e m
ean
wav
e 1
bene
fit a
mou
nt n
ow m
ore
than
the
wav
e 2
equi
vale
nt.
• Im
puta
tion
optio
n 3
had
a gr
eate
r im
pact
that
opt
ion
1 bu
t les
s of
one
that
opt
ion
2.
Tabl
e A
.7
Com
parin
g th
e re
sults
of t
he d
iffer
ent i
mpu
tatio
n m
etho
ds
Wav
e 1
Wav
e 2
Wav
e 3
Cur
rent
dat
aM
etho
d 1.
Rev
erse
de
pend
ent
inte
rvie
win
g
Met
hod
2. F
ull
reve
rse
impu
tatio
nM
etho
d 3.
Tar
gete
d re
vers
e im
puta
tion
£w
ave1
-2
chan
ge£
wav
e1-2
ch
ange
£w
ave1
-2
chan
ge£
wav
e1-2
ch
ange
£w
ave2
-3
chan
ge£
Ben
efits
and
oth
er in
com
eM
ean
£414
27%
£429
22%
£527
-1%
£467
12%
£524
11%
£581
Med
ian
£125
45%
£127
42%
£228
-21%
£153
18%
£180
18%
£213
Net
inco
me
Mea
n£1
,297
10%
£1,3
139%
£1,4
102%
£1,3
506%
£1,4
337%
£1,5
37M
edia
n£1
,044
9%£1
,061
7%£1
,146
-1%
£1,0
964%
£1,1
386%
£1,2
05
Whi
lst t
he fi
rst i
mpu
tatio
n op
tion
appe
ared
to h
ave
a lim
ited
impa
ct o
n th
e av
erag
e in
com
e am
ount
s, th
e se
cond
impu
tatio
n op
tion
resu
lted
in a
sub
stan
tial i
ncre
ase
in a
vera
ge b
enefi
t and
oth
er s
ourc
es o
f inc
ome.
How
ever
, the
re a
re a
var
iety
of r
easo
ns w
hy
som
eone
mig
ht s
tart
clai
min
g a
bene
fit a
t wav
e 2
that
they
had
not
bee
n re
ceiv
ing
at w
ave
1, m
eani
ng th
at th
is a
ppro
ach
mig
ht
intro
duce
gre
ater
err
or. I
mpu
tatio
n op
tion
3 ha
d m
ore
of a
n im
pact
than
opt
ion
1, w
hils
t als
o ap
plyi
ng b
asic
elig
ibili
ty c
riter
ia fo
r th
ose
bene
fits
and
othe
r inc
ome
sour
ces.
Due
to th
is (a
nd a
fter a
gree
men
t fro
m C
PU
) we
appl
ied
impu
tatio
n op
tion
3 to
the
wav
e 1
bene
fits
and
othe
r sou
rces
inco
me
data
. Thi
s w
ill m
ean
that
resp
onde
nts
with
thes
e in
com
e so
urce
s at
wav
e 2,
who
had
not
m
entio
ned
them
at w
ave
1, w
ere
give
n th
at in
com
e w
here
they
app
eare
d el
igib
le fo
r the
m. T
his
impu
tatio
n pr
esum
es th
at th
ese
resp
onde
nts
had
forg
otte
n th
ese
sour
ces
at th
e w
ave
1 in
terv
iew
, and
so
boos
ts th
eir i
ncom
e.
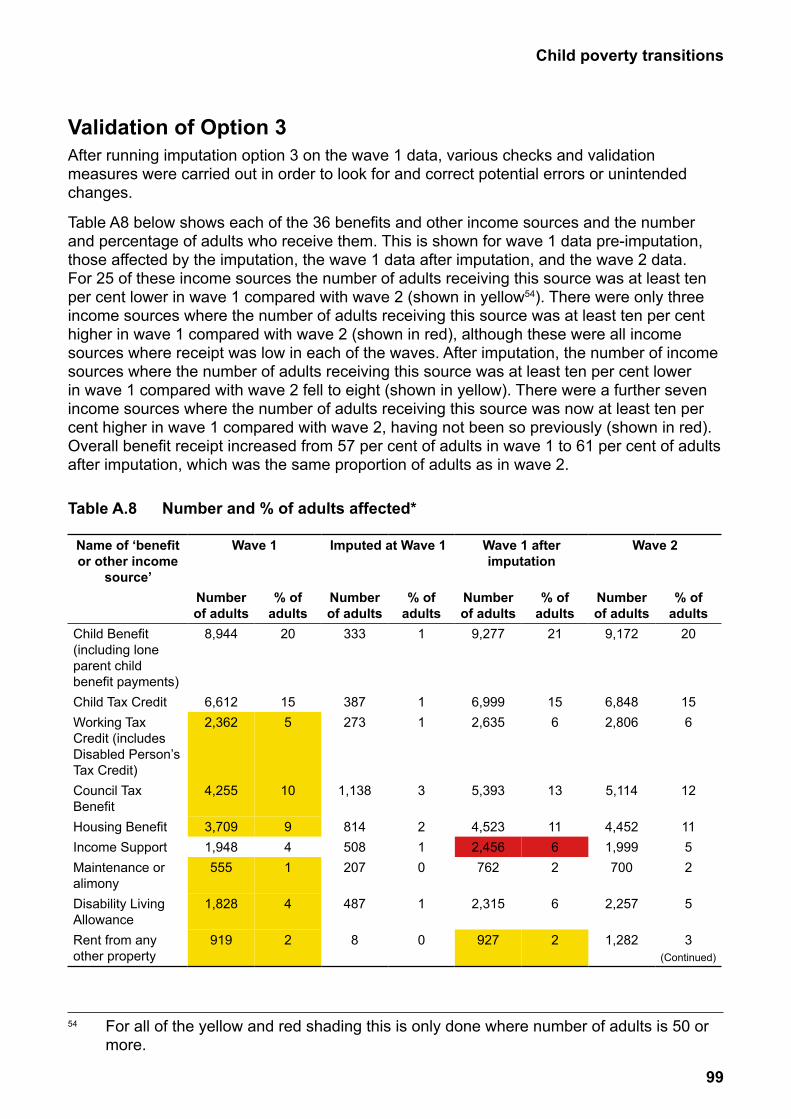
99
Child poverty transitions
Validation of Option 3After running imputation option 3 on the wave 1 data, various checks and validation measures were carried out in order to look for and correct potential errors or unintended changes.
Table A8 below shows each of the 36 benefits and other income sources and the number and percentage of adults who receive them. This is shown for wave 1 data pre-imputation, those affected by the imputation, the wave 1 data after imputation, and the wave 2 data. For 25 of these income sources the number of adults receiving this source was at least ten per cent lower in wave 1 compared with wave 2 (shown in yellow54). There were only three income sources where the number of adults receiving this source was at least ten per cent higher in wave 1 compared with wave 2 (shown in red), although these were all income sources where receipt was low in each of the waves. After imputation, the number of income sources where the number of adults receiving this source was at least ten per cent lower in wave 1 compared with wave 2 fell to eight (shown in yellow). There were a further seven income sources where the number of adults receiving this source was now at least ten per cent higher in wave 1 compared with wave 2, having not been so previously (shown in red). Overall benefit receipt increased from 57 per cent of adults in wave 1 to 61 per cent of adults after imputation, which was the same proportion of adults as in wave 2.
Table A.8 Number and % of adults affected*
Name of ‘benefit Wave 1 Imputed at Wave 1 Wave 1 after Wave 2or other income imputation
source’Number % of Number % of Number % of Number % of of adults adults of adults adults of adults adults of adults adults
Child Benefit 8,944 20 333 1 9,277 21 9,172 20(including lone parent child benefit payments)Child Tax Credit 6,612 15 387 1 6,999 15 6,848 15Working Tax 2,362 5 273 1 2,635 6 2,806 6Credit (includes Disabled Person’s Tax Credit)Council Tax 4,255 10 1,138 3 5,393 13 5,114 12BenefitHousing Benefit 3,709 9 814 2 4,523 11 4,452 11Income Support 1,948 4 508 1 2,456 6 1,999 5Maintenance or 555 1 207 0 762 2 700 2alimonyDisability Living 1,828 4 487 1 2,315 6 2,257 5AllowanceRent from any 919 2 8 0 927 2 1,282 3other property (Continued)
54 For all of the yellow and red shading this is only done where number of adults is 50 or more.
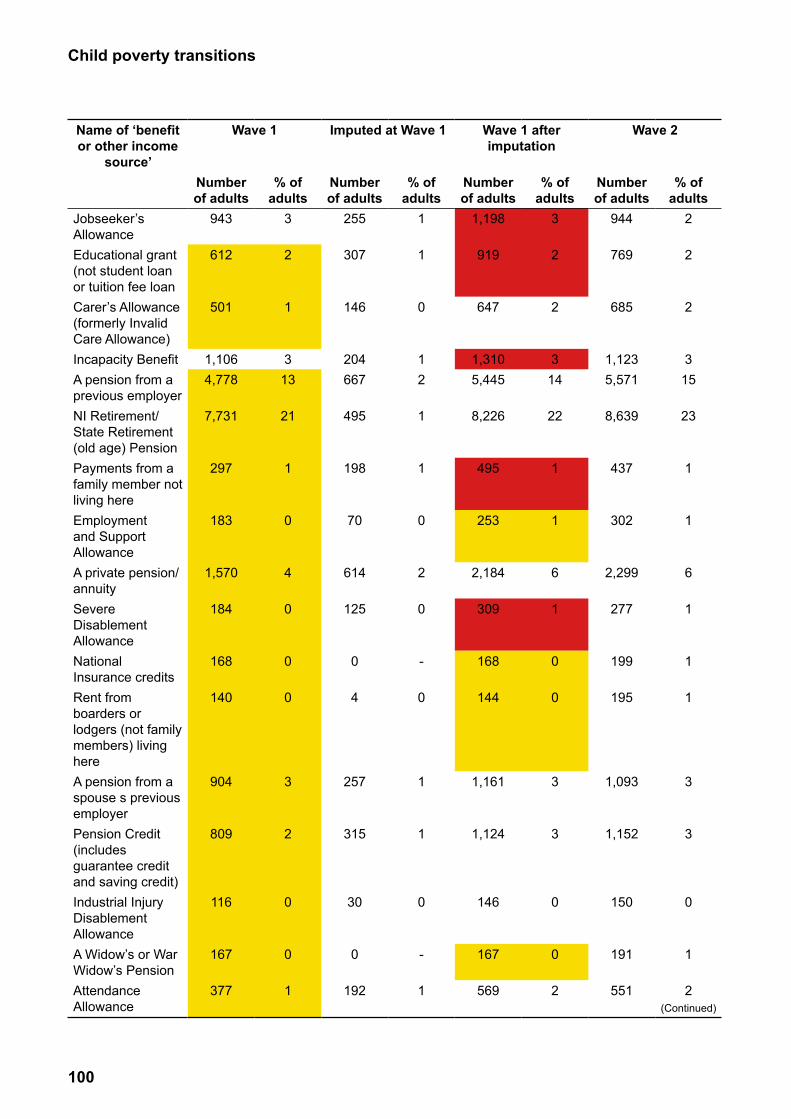
100
Child poverty transitions
Name of ‘benefit or other income
source’
Wave 1 Imputed at Wave 1 Wave 1 after imputation
Wave 2
Number of adults
% of adults
Number of adults
% of adults
Number of adults
% of adults
Number of adults
% of adults
Jobseeker’s Allowance
943 3 255 1 1,198 3 944 2
Educational grant (not student loan or tuition fee loan
612 2 307 1 919 2 769 2
Carer’s Allowance (formerly Invalid Care Allowance)
501 1 146 0 647 2 685 2
Incapacity Benefit 1,106 3 204 1 1,310 3 1,123 3A pension from a previous employer
4,778 13 667 2 5,445 14 5,571 15
NI Retirement/State Retirement (old age) Pension
7,731 21 495 1 8,226 22 8,639 23
Payments from a family member not living here
297 1 198 1 495 1 437 1
Employment and Support Allowance
183 0 70 0 253 1 302 1
A private pension/annuity
1,570 4 614 2 2,184 6 2,299 6
Severe Disablement Allowance
184 0 125 0 309 1 277 1
National Insurance credits
168 0 0 - 168 0 199 1
Rent from boarders or lodgers (not family members) living here
140 0 4 0 144 0 195 1
A pension from a spouse s previous employer
904 3 257 1 1,161 3 1,093 3
Pension Credit (includes guarantee credit and saving credit)
809 2 315 1 1,124 3 1,152 3
Industrial Injury Disablement Allowance
116 0 30 0 146 0 150 0
A Widow’s or War Widow’s Pension
167 0 0 - 167 0 191 1
Attendance Allowance
377 1 192 1 569 2 551 2(Continued)
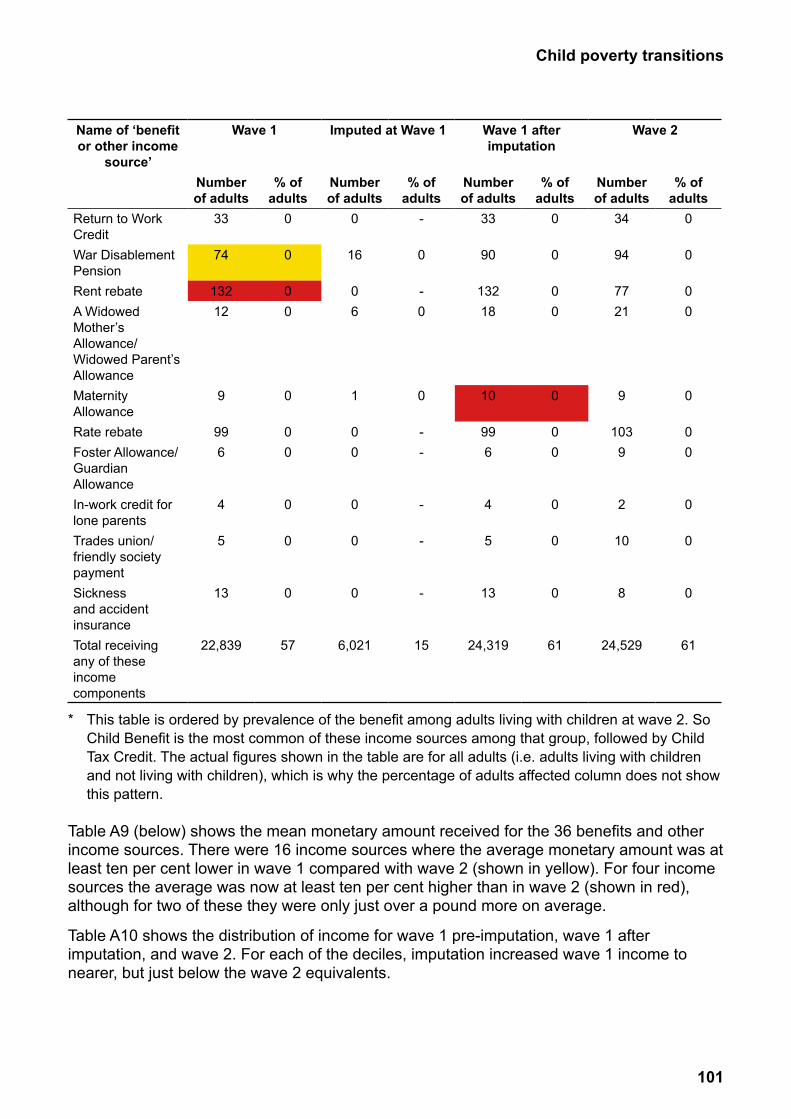
101
Child poverty transitions
Name of ‘benefit or other income
source’
Wave 1 Imputed at Wave 1 Wave 1 after imputation
Wave 2
Number of adults
% of adults
Number of adults
% of adults
Number of adults
% of adults
Number of adults
% of adults
Return to Work Credit
33 0 0 - 33 0 34 0
War Disablement Pension
74 0 16 0 90 0 94 0
Rent rebate 132 0 0 - 132 0 77 0A Widowed Mother’s Allowance/Widowed Parent’s Allowance
12 0 6 0 18 0 21 0
Maternity Allowance
9 0 1 0 10 0 9 0
Rate rebate 99 0 0 - 99 0 103 0Foster Allowance/Guardian Allowance
6 0 0 - 6 0 9 0
In-work credit for lone parents
4 0 0 - 4 0 2 0
Trades union/friendly society payment
5 0 0 - 5 0 10 0
Sickness and accident insurance
13 0 0 - 13 0 8 0
Total receiving any of these income components
22,839 57 6,021 15 24,319 61 24,529 61
* This table is ordered by prevalence of the benefit among adults living with children at wave 2. So Child Benefit is the most common of these income sources among that group, followed by Child Tax Credit. The actual figures shown in the table are for all adults (i.e. adults living with children and not living with children), which is why the percentage of adults affected column does not show this pattern.
Table A9 (below) shows the mean monetary amount received for the 36 benefits and other income sources. There were 16 income sources where the average monetary amount was at least ten per cent lower in wave 1 compared with wave 2 (shown in yellow). For four income sources the average was now at least ten per cent higher than in wave 2 (shown in red), although for two of these they were only just over a pound more on average.
Table A10 shows the distribution of income for wave 1 pre-imputation, wave 1 after imputation, and wave 2. For each of the deciles, imputation increased wave 1 income to nearer, but just below the wave 2 equivalents.
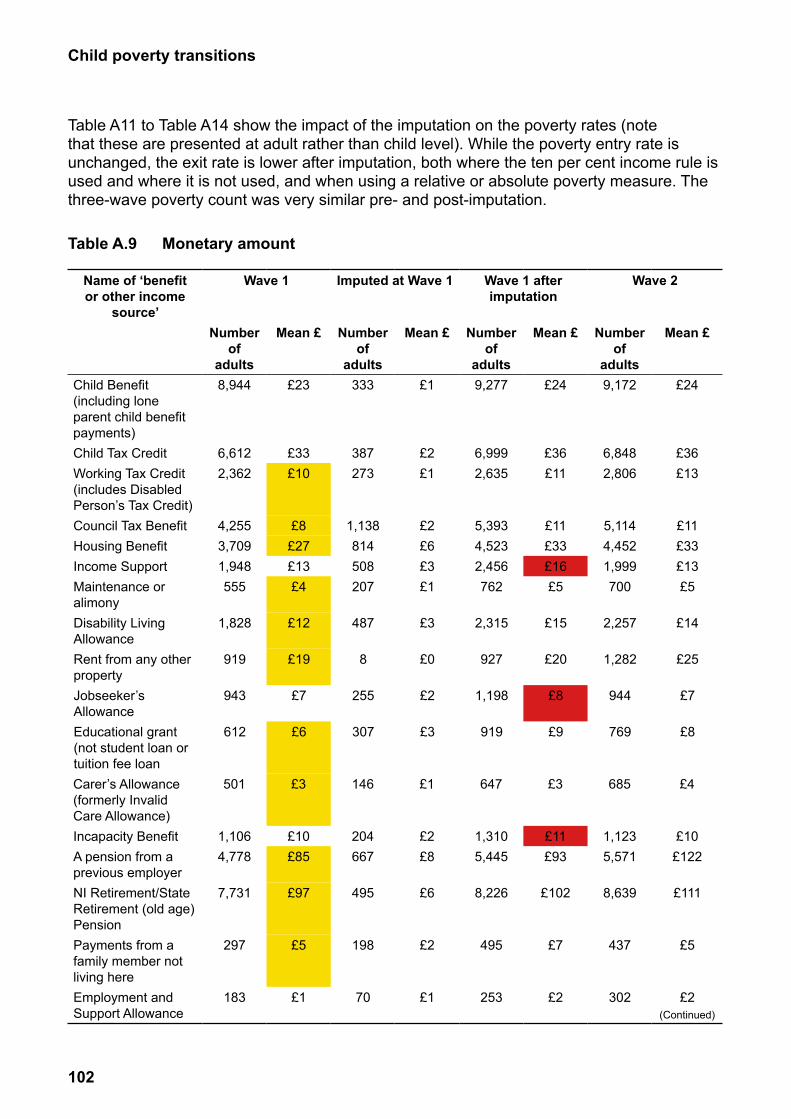
102
Child poverty transitions
Table A11 to Table A14 show the impact of the imputation on the poverty rates (note that these are presented at adult rather than child level). While the poverty entry rate is unchanged, the exit rate is lower after imputation, both where the ten per cent income rule is used and where it is not used, and when using a relative or absolute poverty measure. The three-wave poverty count was very similar pre- and post-imputation.
Table A.9 Monetary amount
Name of ‘benefit Wave 1 Imputed at Wave 1 Wave 1 after Wave 2or other income imputation
source’Number Mean £ Number Mean £ Number Mean £ Number Mean £
of of of of adults adults adults adults
Child Benefit 8,944 £23 333 £1 9,277 £24 9,172 £24(including lone parent child benefit payments)Child Tax Credit 6,612 £33 387 £2 6,999 £36 6,848 £36Working Tax Credit 2,362 £10 273 £1 2,635 £11 2,806 £13(includes Disabled Person’s Tax Credit)Council Tax Benefit 4,255 £8 1,138 £2 5,393 £11 5,114 £11Housing Benefit 3,709 £27 814 £6 4,523 £33 4,452 £33Income Support 1,948 £13 508 £3 2,456 £16 1,999 £13Maintenance or 555 £4 207 £1 762 £5 700 £5alimonyDisability Living 1,828 £12 487 £3 2,315 £15 2,257 £14AllowanceRent from any other 919 £19 8 £0 927 £20 1,282 £25propertyJobseeker’s 943 £7 255 £2 1,198 £8 944 £7AllowanceEducational grant 612 £6 307 £3 919 £9 769 £8(not student loan or tuition fee loanCarer’s Allowance 501 £3 146 £1 647 £3 685 £4(formerly Invalid Care Allowance)Incapacity Benefit 1,106 £10 204 £2 1,310 £11 1,123 £10A pension from a 4,778 £85 667 £8 5,445 £93 5,571 £122previous employerNI Retirement/State 7,731 £97 495 £6 8,226 £102 8,639 £111Retirement (old age) PensionPayments from a 297 £5 198 £2 495 £7 437 £5family member not living hereEmployment and 183 £1 70 £1 253 £2 302 £2Support Allowance (Continued)
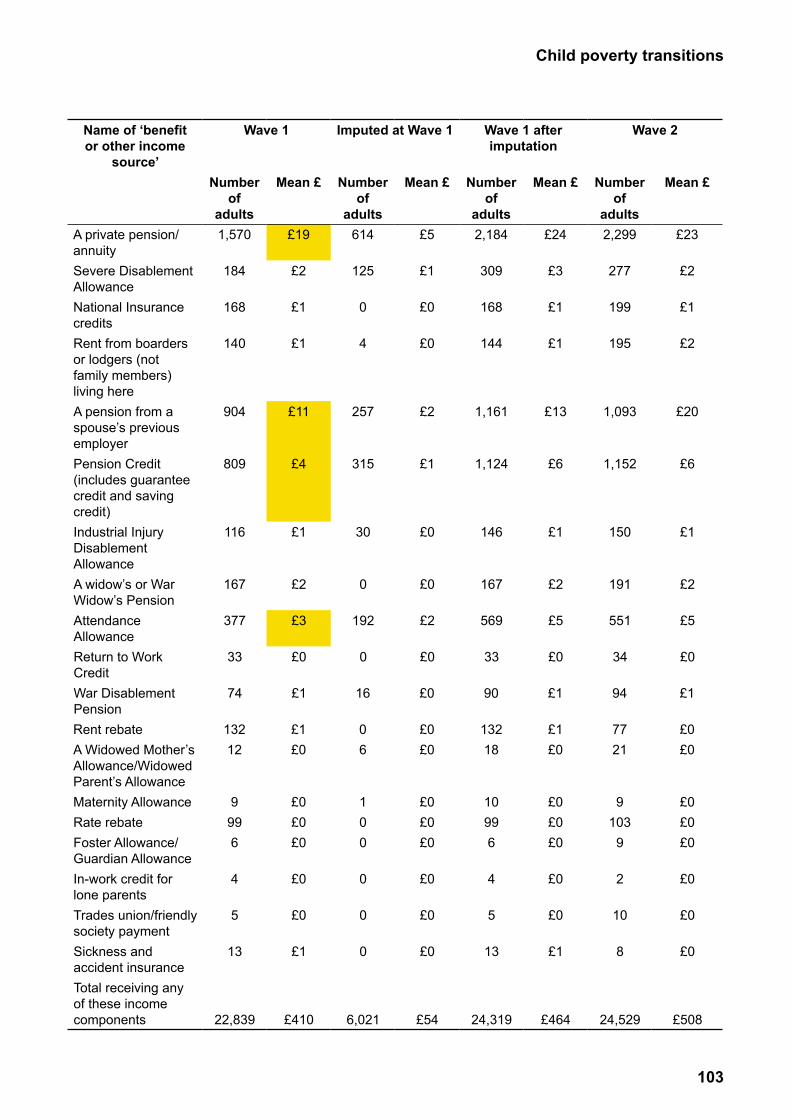
103
Child poverty transitions
Name of ‘benefit or other income
source’
Wave 1 Imputed at Wave 1 Wave 1 after imputation
Wave 2
Number of
adults
Mean £ Number of
adults
Mean £ Number of
adults
Mean £ Number of
adults
Mean £
A private pension/annuity
1,570 £19 614 £5 2,184 £24 2,299 £23
Severe Disablement Allowance
184 £2 125 £1 309 £3 277 £2
National Insurance credits
168 £1 0 £0 168 £1 199 £1
Rent from boarders or lodgers (not family members) living here
140 £1 4 £0 144 £1 195 £2
A pension from a spouse’s previous employer
904 £11 257 £2 1,161 £13 1,093 £20
Pension Credit (includes guarantee credit and saving credit)
809 £4 315 £1 1,124 £6 1,152 £6
Industrial Injury Disablement Allowance
116 £1 30 £0 146 £1 150 £1
A widow’s or War Widow’s Pension
167 £2 0 £0 167 £2 191 £2
Attendance Allowance
377 £3 192 £2 569 £5 551 £5
Return to Work Credit
33 £0 0 £0 33 £0 34 £0
War Disablement Pension
74 £1 16 £0 90 £1 94 £1
Rent rebate 132 £1 0 £0 132 £1 77 £0A Widowed Mother’s Allowance/Widowed Parent’s Allowance
12 £0 6 £0 18 £0 21 £0
Maternity Allowance 9 £0 1 £0 10 £0 9 £0Rate rebate 99 £0 0 £0 99 £0 103 £0Foster Allowance/Guardian Allowance
6 £0 0 £0 6 £0 9 £0
In-work credit for lone parents
4 £0 0 £0 4 £0 2 £0
Trades union/friendly society payment
5 £0 0 £0 5 £0 10 £0
Sickness and accident insurance
13 £1 0 £0 13 £1 8 £0
Total receiving any of these income components 22,839 £410 6,021 £54 24,319 £464 24,529 £508
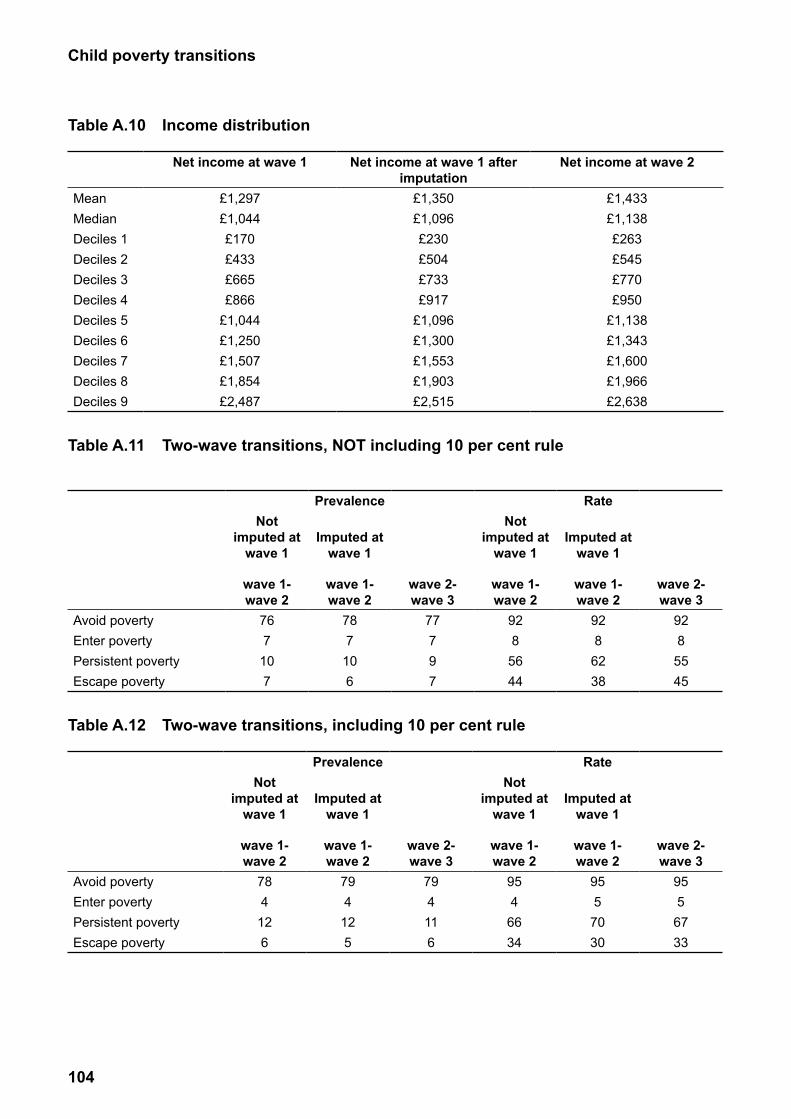
104
Child poverty transitions
Table A.10 Income distribution
Net income at wave 1 Net income at wave 1 after imputation
Net income at wave 2
Mean £1,297 £1,350 £1,433Median £1,044 £1,096 £1,138Deciles 1 £170 £230 £263Deciles 2 £433 £504 £545Deciles 3 £665 £733 £770Deciles 4 £866 £917 £950Deciles 5 £1,044 £1,096 £1,138Deciles 6 £1,250 £1,300 £1,343Deciles 7 £1,507 £1,553 £1,600Deciles 8 £1,854 £1,903 £1,966Deciles 9 £2,487 £2,515 £2,638
Table A.11 Two-wave transitions, NOT including 10 per cent rule
Prevalence Rate
Not imputed at
wave 1
wave 1- wave 2
Imputed at wave 1
wave 1- wave 2
wave 2- wave 3
Not imputed at
wave 1
wave 1- wave 2
Imputed at wave 1
wave 1- wave 2
wave 2- wave 3
Avoid poverty 76 78 77 92 92 92Enter poverty 7 7 7 8 8 8Persistent poverty 10 10 9 56 62 55Escape poverty 7 6 7 44 38 45
Table A.12 Two-wave transitions, including 10 per cent rule
Prevalence RateNot
imputed at wave 1
wave 1- wave 2
Imputed at wave 1
wave 1- wave 2
wave 2- wave 3
Not imputed at
wave 1
wave 1- wave 2
Imputed at wave 1
wave 1- wave 2
wave 2- wave 3
Avoid poverty 78 79 79 95 95 95Enter poverty 4 4 4 4 5 5Persistent poverty 12 12 11 66 70 67Escape poverty 6 5 6 34 30 33
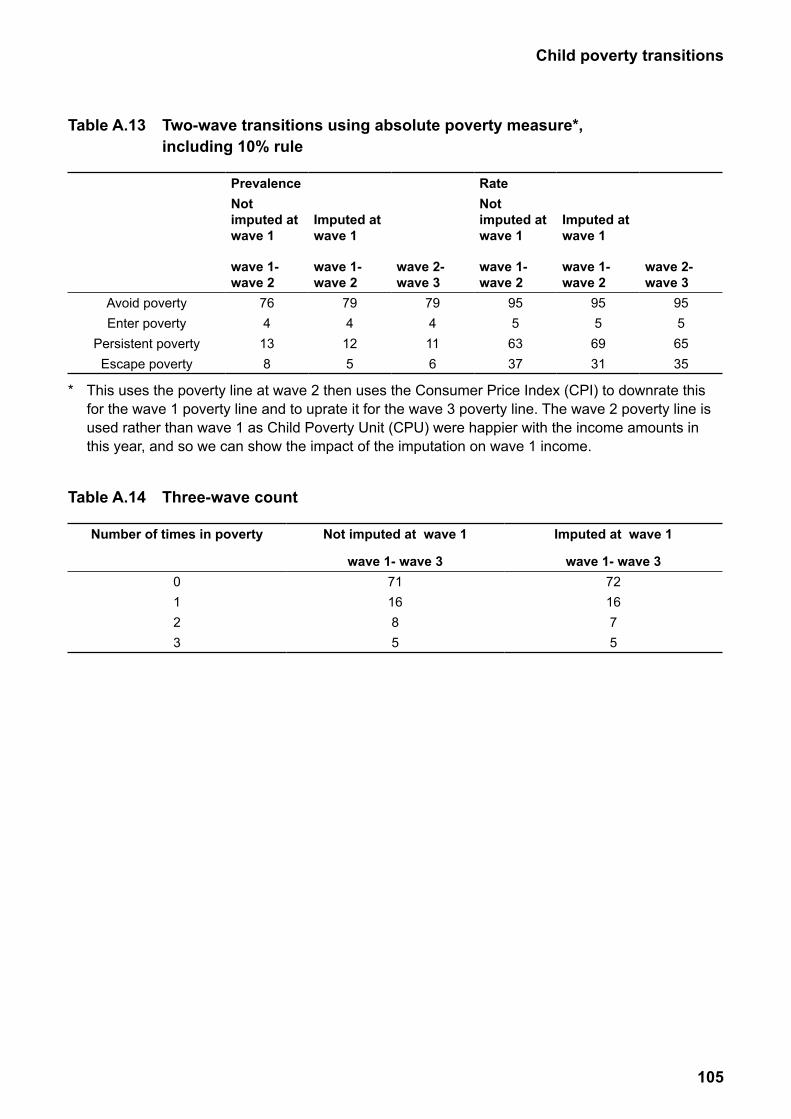
105
Child poverty transitions
Table A.13 Two-wave transitions using absolute poverty measure*, including 10% rule
Prevalence RateNot imputed at wave 1
wave 1- wave 2
Imputed at wave 1
wave 1- wave 2
wave 2- wave 3
Not imputed at wave 1
wave 1- wave 2
Imputed at wave 1
wave 1- wave 2
wave 2- wave 3
Avoid poverty 76 79 79 95 95 95Enter poverty 4 4 4 5 5 5
Persistent poverty 13 12 11 63 69 65Escape poverty 8 5 6 37 31 35
* This uses the poverty line at wave 2 then uses the Consumer Price Index (CPI) to downrate this for the wave 1 poverty line and to uprate it for the wave 3 poverty line. The wave 2 poverty line is used rather than wave 1 as Child Poverty Unit (CPU) were happier with the income amounts in this year, and so we can show the impact of the imputation on wave 1 income.
Table A.14 Three-wave count
Number of times in poverty Not imputed at wave 1
wave 1- wave 3
Imputed at wave 1
wave 1- wave 30 71 721 16 162 8 73 5 5
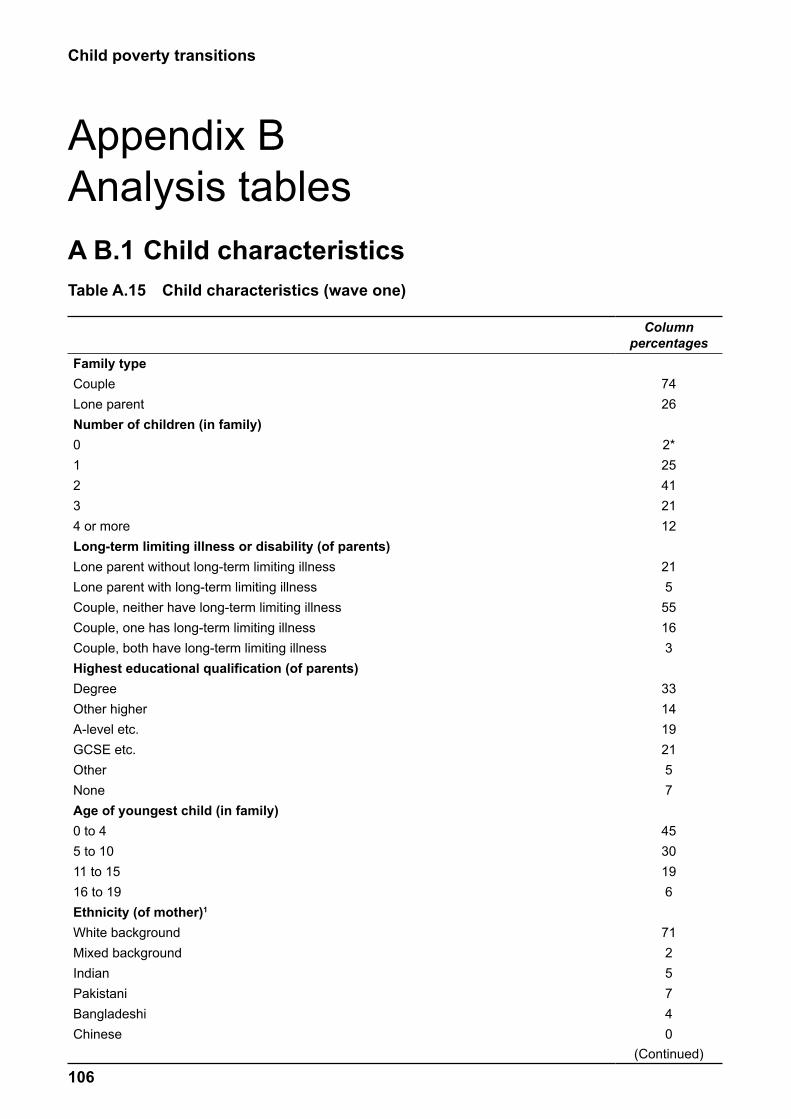
106
Child poverty transitions
Appendix B Analysis tablesA B.1 Child characteristicsTable A.15 Child characteristics (wave one)
Column percentages
Family typeCouple 74Lone parent 26Number of children (in family)0 2* 1 252 413 214 or more 12Long-term limiting illness or disability (of parents)Lone parent without long-term limiting illness 21Lone parent with long-term limiting illness 5Couple, neither have long-term limiting illness 55Couple, one has long-term limiting illness 16Couple, both have long-term limiting illness 3Highest educational qualification (of parents)Degree 33Other higher 14A-level etc. 19GCSE etc. 21Other 5None 7Age of youngest child (in family)0 to 4 455 to 10 3011 to 15 1916 to 19 6Ethnicity (of mother)1
White background 71Mixed background 2Indian 5Pakistani 7Bangladeshi 4Chinese 0
(Continued)
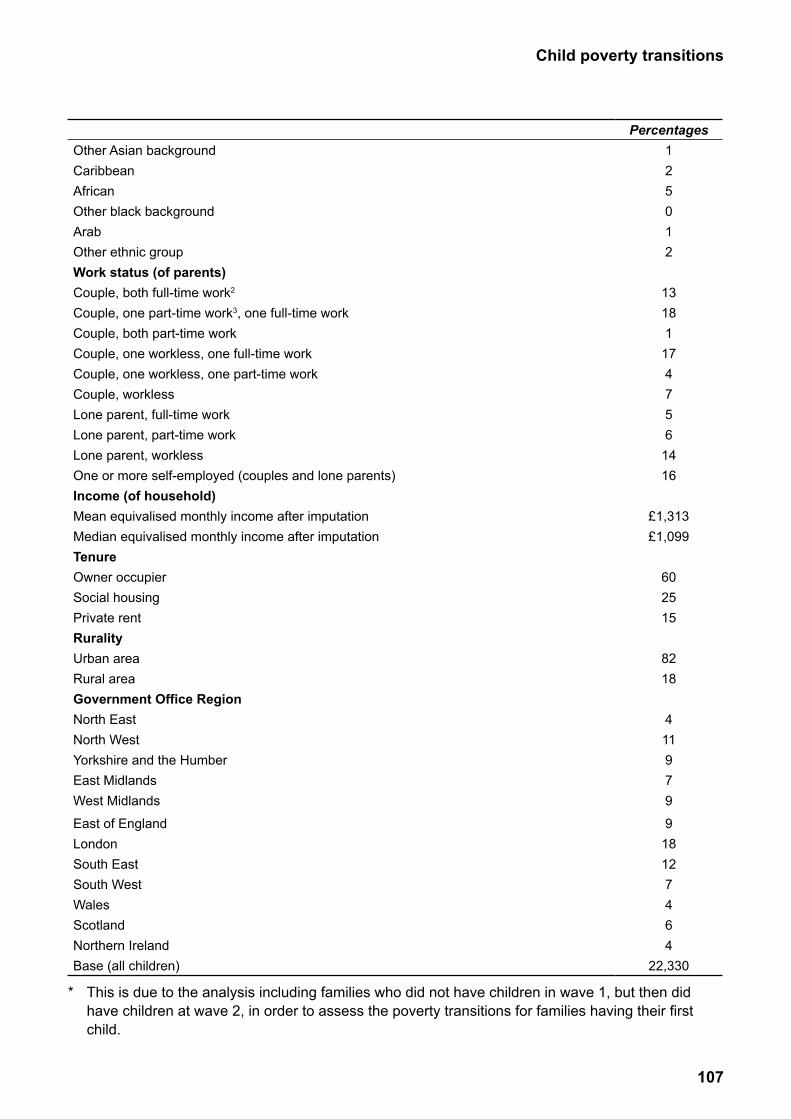
107
Child poverty transitions
PercentagesOther Asian background 1Caribbean 2African 5Other black background 0Arab 1Other ethnic group 2Work status (of parents)Couple, both full-time work2 13Couple, one part-time work3, one full-time work 18Couple, both part-time work 1Couple, one workless, one full-time work 17Couple, one workless, one part-time work 4Couple, workless 7Lone parent, full-time work 5Lone parent, part-time work 6Lone parent, workless 14One or more self-employed (couples and lone parents) 16Income (of household)Mean equivalised monthly income after imputation £1,313Median equivalised monthly income after imputation £1,099TenureOwner occupier 60Social housing 25Private rent 15RuralityUrban area 82Rural area 18Government Office RegionNorth East 4North West 11Yorkshire and the Humber 9East Midlands 7West Midlands 9
East of England 9London 18South East 12South West 7Wales 4Scotland 6Northern Ireland 4Base (all children) 22,330
* This is due to the analysis including families who did not have children in wave 1, but then did have children at wave 2, in order to assess the poverty transitions for families having their first child.
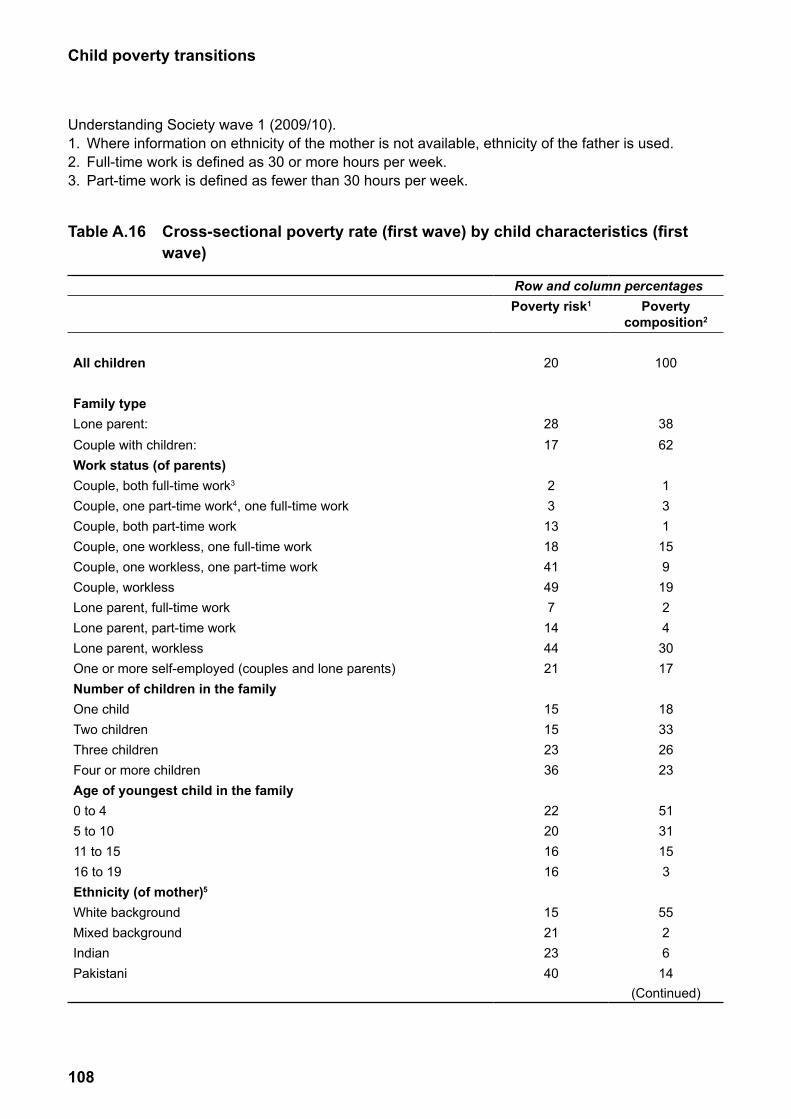
108
Child poverty transitions
Understanding Society wave 1 (2009/10).1. Where information on ethnicity of the mother is not available, ethnicity of the father is used.2. Full-time work is defined as 30 or more hours per week.3. Part-time work is defined as fewer than 30 hours per week.
Table A.16 Cross-sectional poverty rate (first wave) by child characteristics (first wave)
Row and column percentagesPoverty risk1 Poverty
composition2
All children
Family typeLone parent:Couple with children:Work status (of parents)Couple, both full-time work3
Couple, one part-time work4, one full-time workCouple, both part-time workCouple, one workless, one full-time workCouple, one workless, one part-time workCouple, worklessLone parent, full-time workLone parent, part-time workLone parent, worklessOne or more self-employed (couples and lone parents)Number of children in the familyOne childTwo childrenThree childrenFour or more childrenAge of youngest child in the family0 to 45 to 1011 to 1516 to 19Ethnicity (of mother)5
White backgroundMixed backgroundIndianPakistani
20
2817
23131841497144421
15152336
22201616
15212340
100
3862
13115919243017
18332623
5131153
552614
(Continued)
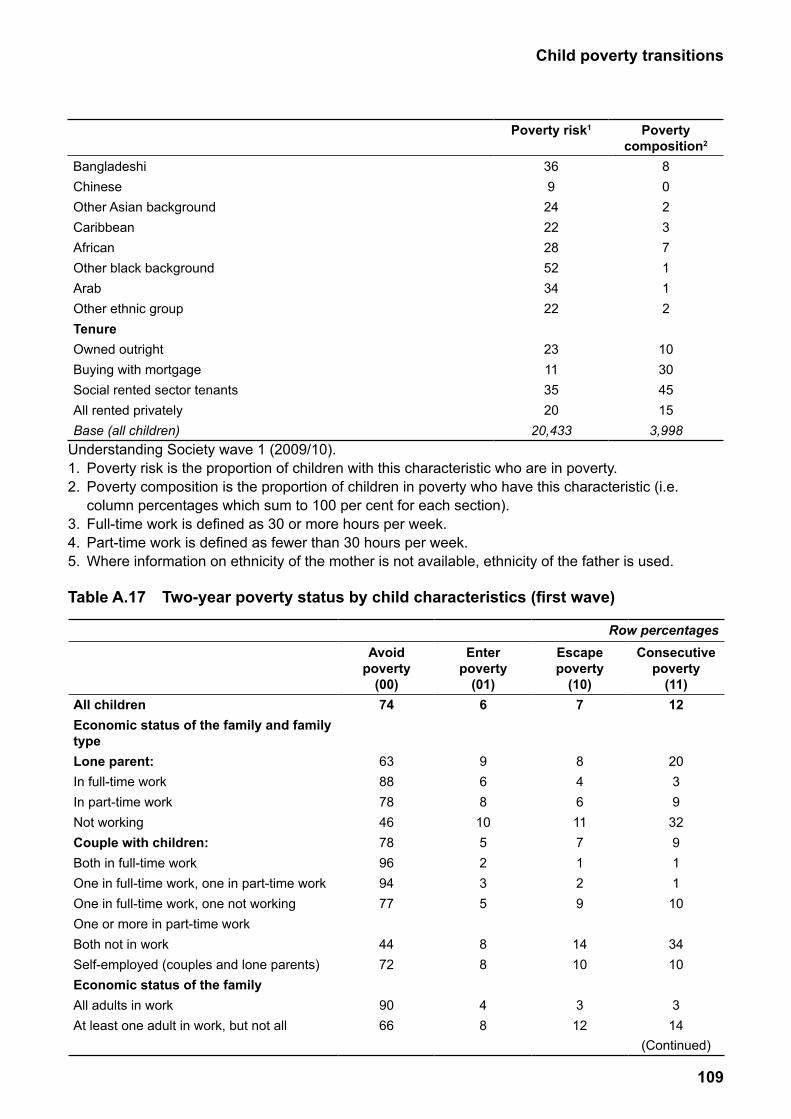
109
Child poverty transitions
Poverty risk1 Poverty composition2
Bangladeshi 36 8Chinese 9 0Other Asian background 24 2Caribbean 22 3African 28 7Other black background 52 1Arab 34 1Other ethnic group 22 2TenureOwned outright 23 10Buying with mortgage 11 30Social rented sector tenants 35 45All rented privately 20 15Base (all children) 20,433 3,998
Understanding Society wave 1 (2009/10).1. Poverty risk is the proportion of children with this characteristic who are in poverty.2. Poverty composition is the proportion of children in poverty who have this characteristic (i.e.
column percentages which sum to 100 per cent for each section).3. Full-time work is defined as 30 or more hours per week.4. Part-time work is defined as fewer than 30 hours per week.5. Where information on ethnicity of the mother is not available, ethnicity of the father is used.
Table A.17 Two-year poverty status by child characteristics (first wave)
Row percentagesAvoid
poverty (00)
Enter poverty
(01)
Escape poverty
(10)
Consecutive poverty
(11)All childrenEconomic status of the family and family typeLone parent:In full-time workIn part-time workNot workingCouple with children:Both in full-time workOne in full-time work, one in part-time workOne in full-time work, one not workingOne or more in part-time workBoth not in workSelf-employed (couples and lone parents)Economic status of the familyAll adults in workAt least one adult in work, but not all
74
6388784678969477
4472
9066
6
968
105235
88
48
7
846117129
1410
312
12
2039
32911
10
3410
314
(Continued)
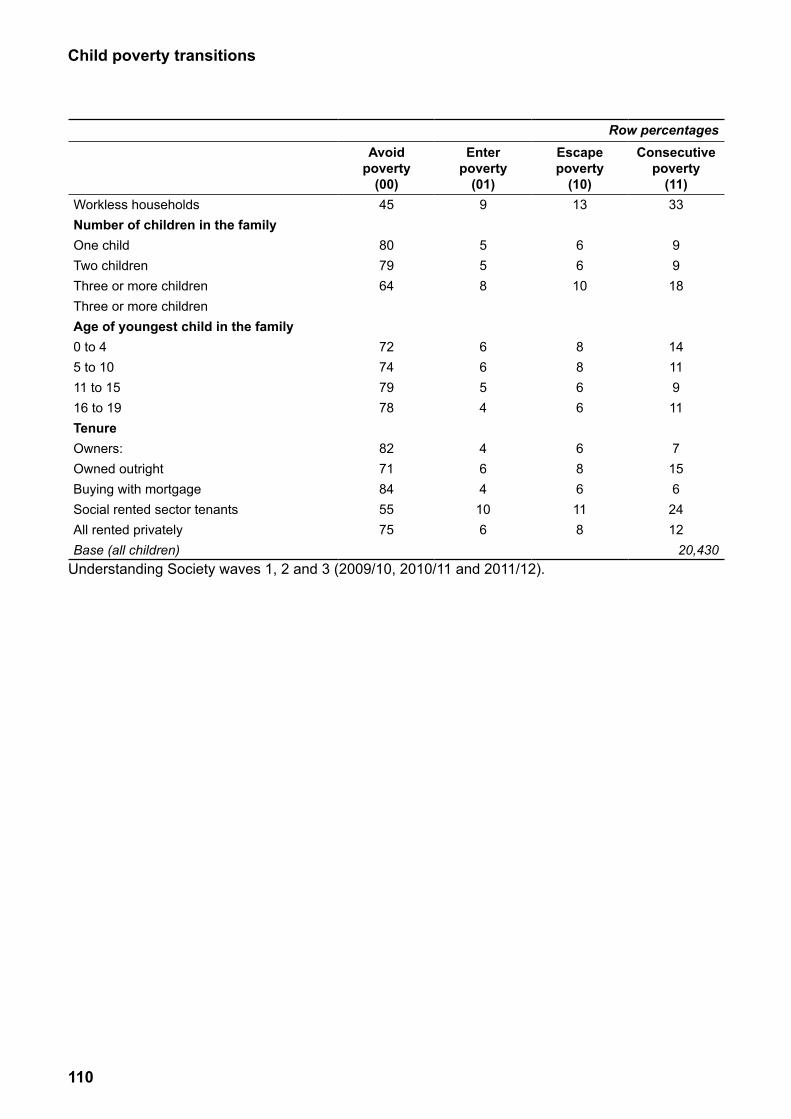
110
Child poverty transitions
Row percentagesAvoid
poverty (00)
Enter poverty
(01)
Escape poverty
(10)
Consecutive poverty
(11)Workless householdsNumber of children in the familyOne childTwo childrenThree or more childrenThree or more childrenAge of youngest child in the family0 to 45 to 1011 to 1516 to 19TenureOwners:Owned outrightBuying with mortgageSocial rented sector tenantsAll rented privatelyBase (all children)
45
807964
72747978
8271845575
9
558
6654
464
106
13
66
10
8866
686118
33
99
18
1411911
7156
2412
20,430Understanding Society waves 1, 2 and 3 (2009/10, 2010/11 and 2011/12).
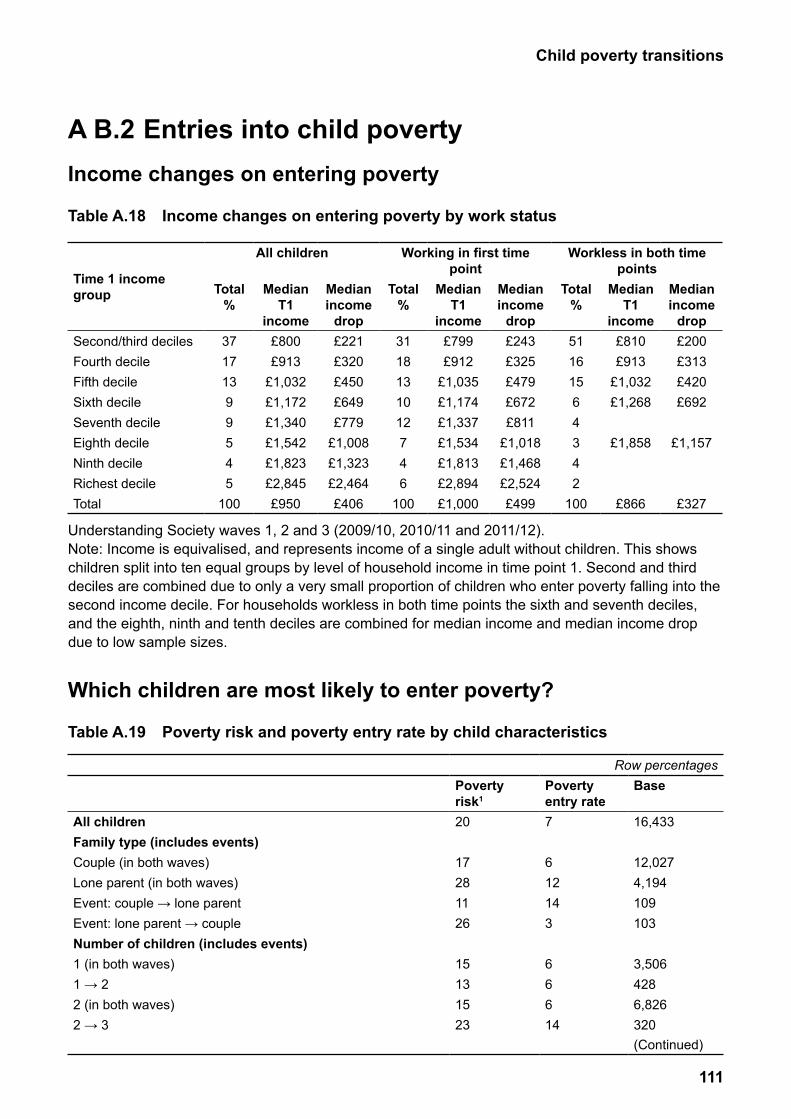
111
Child poverty transitions
A B.2 Entries into child povertyIncome changes on entering poverty
Table A.18 Income changes on entering poverty by work status
Time 1 income group Total
%
All children
Median Median T1 income
income drop
Working in first time point
Total Median Median % T1 income
income drop
Workless in both time points
Total Median Median % T1 income
income dropSecond/third deciles 37 £800 £221 31 £799 £243 51 £810 £200Fourth decile 17 £913 £320 18 £912 £325 16 £913 £313Fifth decile 13 £1,032 £450 13 £1,035 £479 15 £1,032 £420Sixth decile 9 £1,172 £649 10 £1,174 £672 6 £1,268 £692Seventh decile 9 £1,340 £779 12 £1,337 £811 4Eighth decile 5 £1,542 £1,008 7 £1,534 £1,018 3 £1,858 £1,157Ninth decile 4 £1,823 £1,323 4 £1,813 £1,468 4Richest decile 5 £2,845 £2,464 6 £2,894 £2,524 2Total 100 £950 £406 100 £1,000 £499 100 £866 £327
Understanding Society waves 1, 2 and 3 (2009/10, 2010/11 and 2011/12).Note: Income is equivalised, and represents income of a single adult without children. This shows children split into ten equal groups by level of household income in time point 1. Second and third deciles are combined due to only a very small proportion of children who enter poverty falling into the second income decile. For households workless in both time points the sixth and seventh deciles, and the eighth, ninth and tenth deciles are combined for median income and median income drop due to low sample sizes.
Which children are most likely to enter poverty?
Table A.19 Poverty risk and poverty entry rate by child characteristics
Row percentagesPoverty risk1
Poverty entry rate
Base
All childrenFamily type (includes events)Couple (in both waves)Lone parent (in both waves)Event: couple → lone parentEvent: lone parent → coupleNumber of children (includes events)1 (in both waves)1 → 22 (in both waves)2 → 3
20
17281126
15131523
7
612143
66614
16,433
12,0274,194109103
3,5064286,826320(Continued)
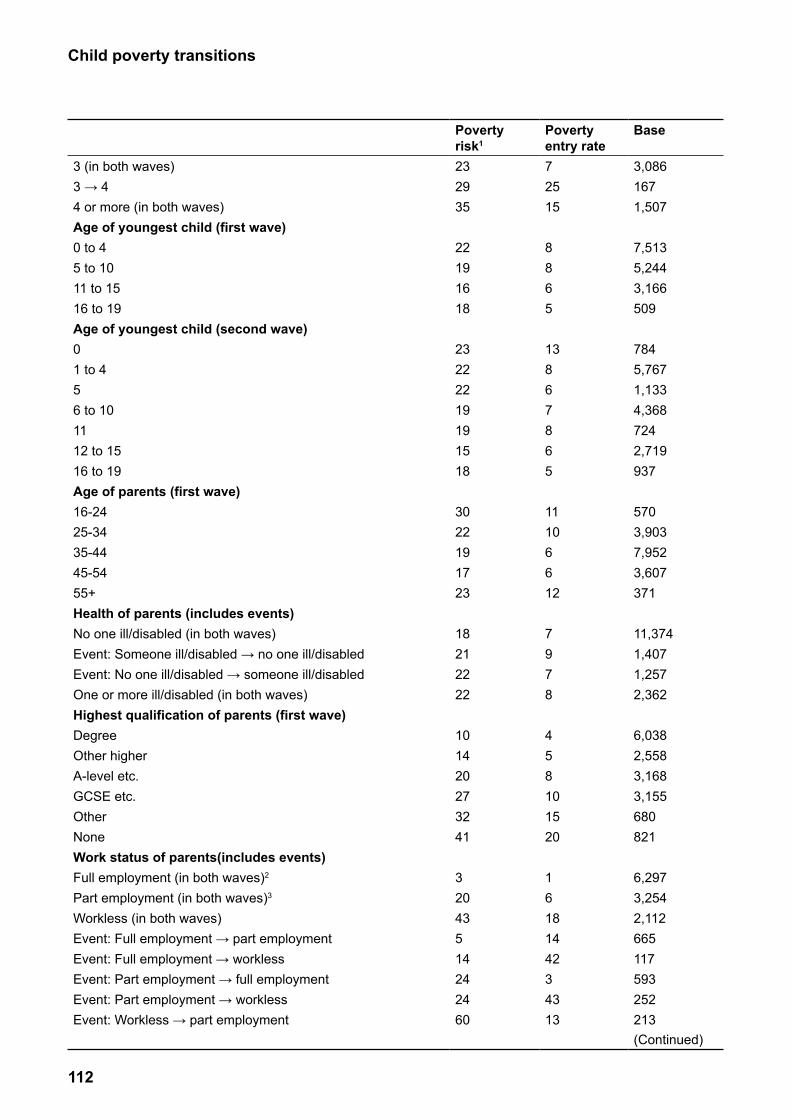
112
Child poverty transitions
Poverty risk1
Poverty entry rate
Base
3 (in both waves) 23 7 3,0863 → 4 29 25 1674 or more (in both waves) 35 15 1,507Age of youngest child (first wave)0 to 4 22 8 7,5135 to 10 19 8 5,24411 to 15 16 6 3,16616 to 19 18 5 509Age of youngest child (second wave)0 23 13 7841 to 4 22 8 5,7675 22 6 1,1336 to 10 19 7 4,36811 19 8 72412 to 15 15 6 2,71916 to 19 18 5 937Age of parents (first wave)16-24 30 11 57025-34 22 10 3,90335-44 19 6 7,95245-54 17 6 3,60755+ 23 12 371Health of parents (includes events)No one ill/disabled (in both waves) 18 7 11,374Event: Someone ill/disabled → no one ill/disabled 21 9 1,407Event: No one ill/disabled → someone ill/disabled 22 7 1,257One or more ill/disabled (in both waves) 22 8 2,362Highest qualification of parents (first wave)Degree 10 4 6,038Other higher 14 5 2,558A-level etc. 20 8 3,168GCSE etc. 27 10 3,155Other 32 15 680None 41 20 821Work status of parents(includes events)Full employment (in both waves)2 3 1 6,297Part employment (in both waves)3 20 6 3,254Workless (in both waves) 43 18 2,112Event: Full employment → part employment 5 14 665Event: Full employment → workless 14 42 117Event: Part employment → full employment 24 3 593Event: Part employment → workless 24 43 252Event: Workless → part employment 60 13 213
(Continued)
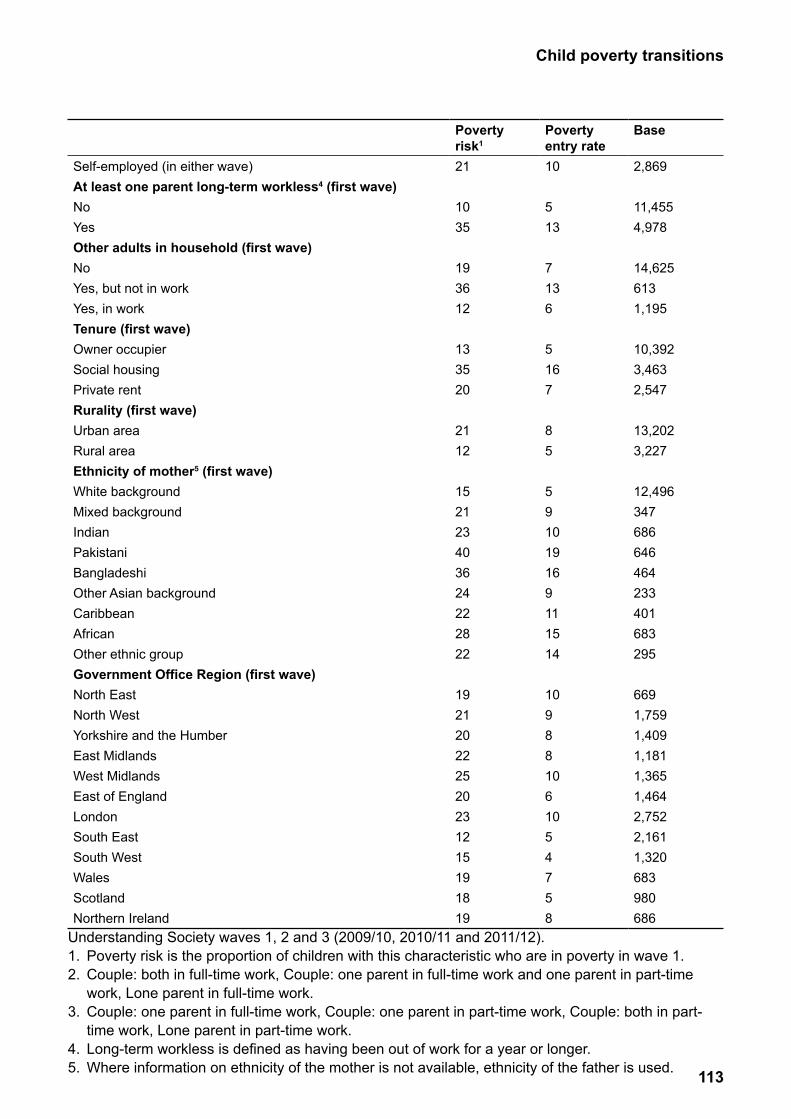
113
Child poverty transitions
Poverty Poverty Baserisk1 entry rate
Self-employed (in either wave) 21 10 2,869At least one parent long-term workless4 (first wave)No 10 5 11,455Yes 35 13 4,978Other adults in household (first wave)No 19 7 14,625Yes, but not in work 36 13 613Yes, in work 12 6 1,195Tenure (first wave)Owner occupier 13 5 10,392Social housing 35 16 3,463Private rent 20 7 2,547Rurality (first wave)Urban area 21 8 13,202Rural area 12 5 3,227Ethnicity of mother5 (first wave)White background 15 5 12,496Mixed background 21 9 347Indian 23 10 686Pakistani 40 19 646Bangladeshi 36 16 464Other Asian background 24 9 233Caribbean 22 11 401African 28 15 683Other ethnic group 22 14 295Government Office Region (first wave)North East 19 10 669North West 21 9 1,759Yorkshire and the Humber 20 8 1,409East Midlands 22 8 1,181West Midlands 25 10 1,365East of England 20 6 1,464London 23 10 2,752South East 12 5 2,161South West 15 4 1,320Wales 19 7 683Scotland 18 5 980Northern Ireland 19 8 686
Understanding Society waves 1, 2 and 3 (2009/10, 2010/11 and 2011/12).1. Poverty risk is the proportion of children with this characteristic who are in poverty in wave 1.2. Couple: both in full-time work, Couple: one parent in full-time work and one parent in part-time
work, Lone parent in full-time work.3. Couple: one parent in full-time work, Couple: one parent in part-time work, Couple: both in part-
time work, Lone parent in part-time work.4. Long-term workless is defined as having been out of work for a year or longer.5. Where information on ethnicity of the mother is not available, ethnicity of the father is used.
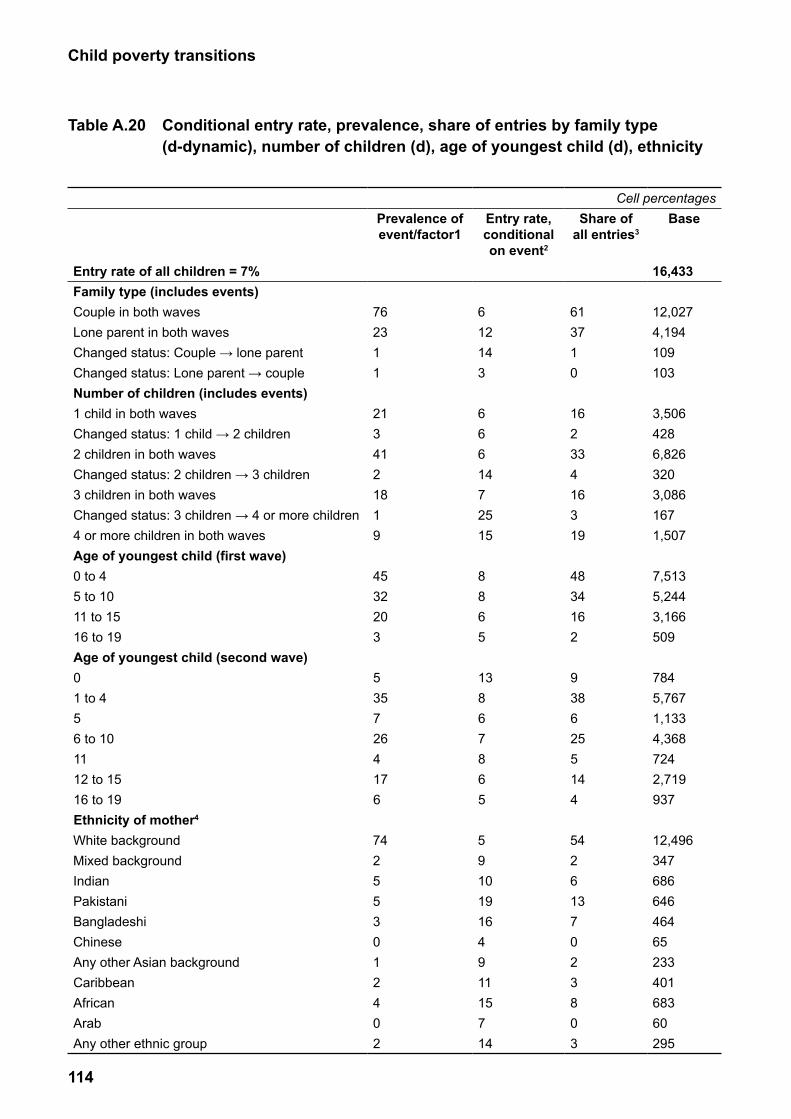
114
Child poverty transitions
Table A.20 Conditional entry rate, prevalence, share of entries by family type (d-dynamic), number of children (d), age of youngest child (d), ethnicity
Cell percentages
Prevalence of event/factor1
Entry rate, conditional on event2
Share of all entries3
Base
Entry rate of all children = 7% 16,433Family type (includes events)Couple in both waves 76 6 61 12,027Lone parent in both waves 23 12 37 4,194Changed status: Couple → lone parent 1 14 1 109Changed status: Lone parent → couple 1 3 0 103Number of children (includes events)1 child in both waves 21 6 16 3,506Changed status: 1 child → 2 children 3 6 2 4282 children in both waves 41 6 33 6,826Changed status: 2 children → 3 children 2 14 4 3203 children in both waves 18 7 16 3,086Changed status: 3 children → 4 or more children 1 25 3 1674 or more children in both waves 9 15 19 1,507Age of youngest child (first wave)0 to 4 45 8 48 7,5135 to 10 32 8 34 5,24411 to 15 20 6 16 3,16616 to 19 3 5 2 509Age of youngest child (second wave)0 5 13 9 7841 to 4 35 8 38 5,7675 7 6 6 1,1336 to 10 26 7 25 4,36811 4 8 5 72412 to 15 17 6 14 2,71916 to 19 6 5 4 937Ethnicity of mother4
White background 74 5 54 12,496Mixed background 2 9 2 347Indian 5 10 6 686Pakistani 5 19 13 646Bangladeshi 3 16 7 464Chinese 0 4 0 65Any other Asian background 1 9 2 233Caribbean 2 11 3 401African 4 15 8 683Arab 0 7 0 60Any other ethnic group 2 14 3 295
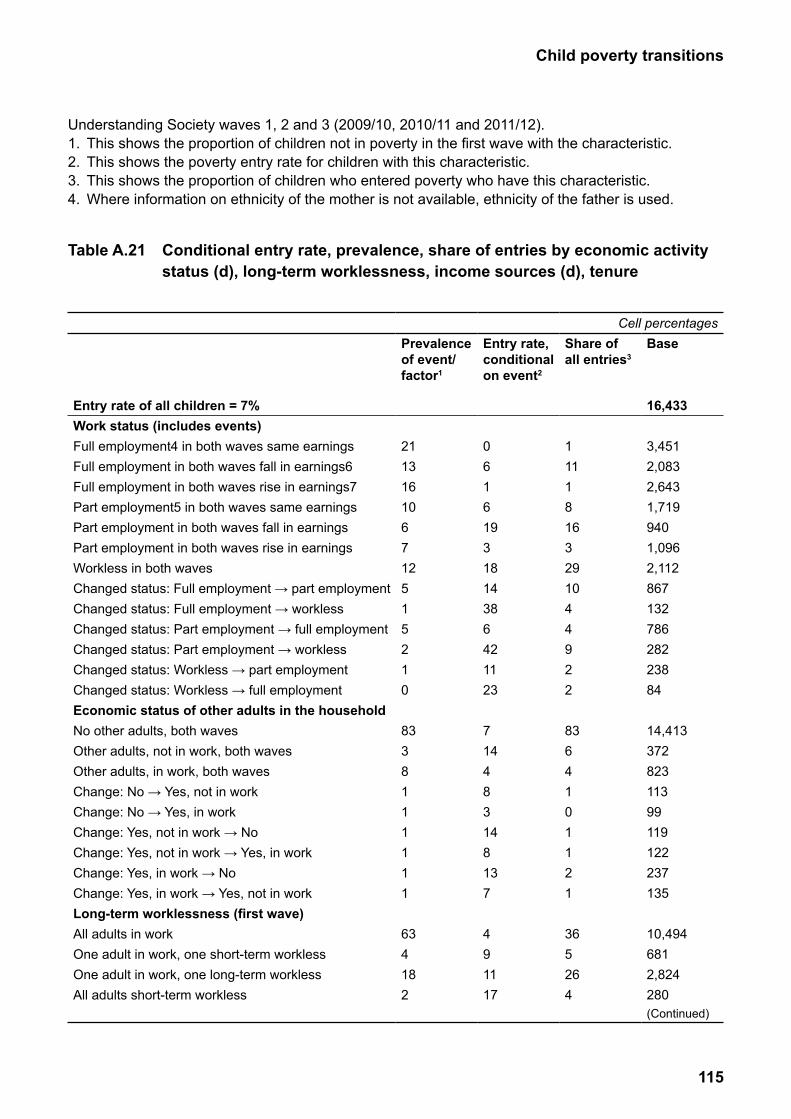
115
Child poverty transitions
Understanding Society waves 1, 2 and 3 (2009/10, 2010/11 and 2011/12).1. This shows the proportion of children not in poverty in the first wave with the characteristic.2. This shows the poverty entry rate for children with this characteristic.3. This shows the proportion of children who entered poverty who have this characteristic.4. Where information on ethnicity of the mother is not available, ethnicity of the father is used.
Table A.21 Conditional entry rate, prevalence, share of entries by economic activity status (d), long-term worklessness, income sources (d), tenure
Cell percentages
Entry rate of all children = 7%
Prevalence of event/factor1
Entry rate, conditional on event2
Share of all entries3
Base
16,433Work status (includes events)Full employment4 in both waves same earningsFull employment in both waves fall in earnings6Full employment in both waves rise in earnings7Part employment5 in both waves same earningsPart employment in both waves fall in earningsPart employment in both waves rise in earningsWorkless in both wavesChanged status: Full employment → part employmentChanged status: Full employment → worklessChanged status: Part employment → full employmentChanged status: Part employment → worklessChanged status: Workless → part employmentChanged status: Workless → full employmentEconomic status of other adults in the householdNo other adults, both wavesOther adults, not in work, both wavesOther adults, in work, both wavesChange: No → Yes, not in workChange: No → Yes, in workChange: Yes, not in work → NoChange: Yes, not in work → Yes, in workChange: Yes, in work → NoChange: Yes, in work → Yes, not in workLong-term worklessness (first wave)All adults in workOne adult in work, one short-term worklessOne adult in work, one long-term worklessAll adults short-term workless
211316106712515210
8338111111
634182
06161931814386421123
714483148137
491117
11118163291044922
8364101121
365264
3,4512,0832,6431,7199401,0962,11286713278628223884
14,41337282311399119122237135
10,4946812,824280(Continued)
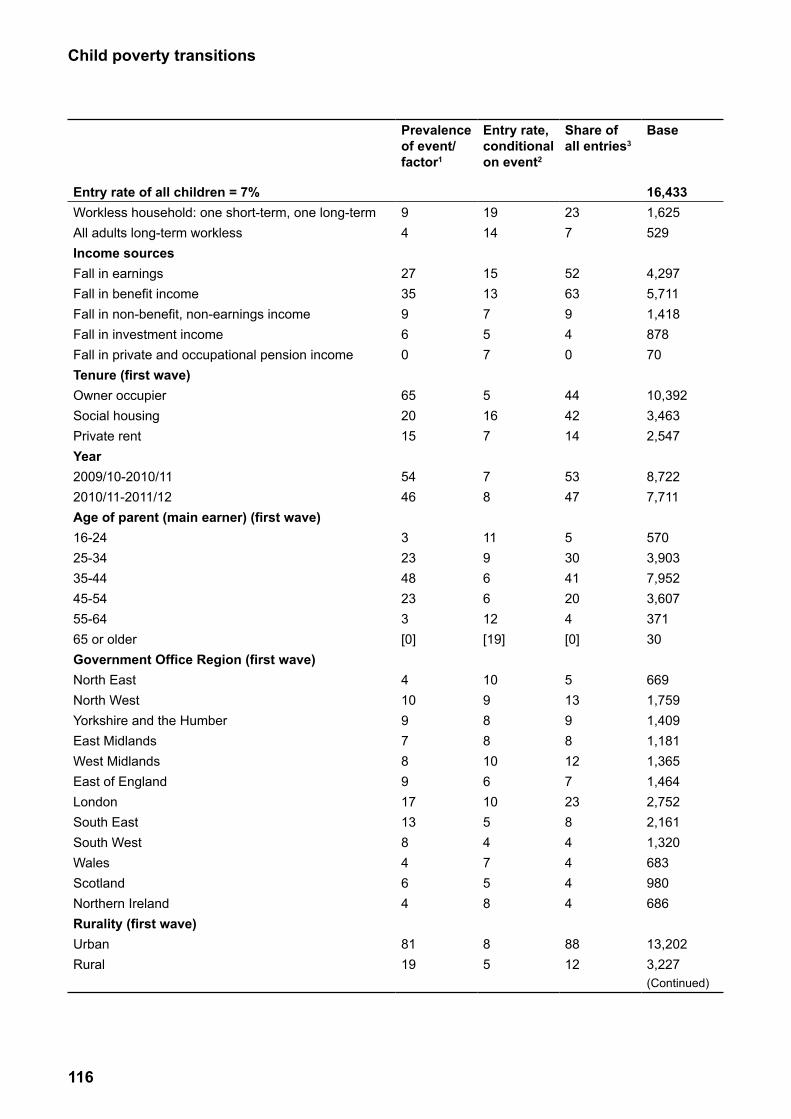
116
Child poverty transitions
Prevalence Entry rate, Share of Baseof event/ conditional all entries3
factor1 on event2
Entry rate of all children = 7% 16,433Workless household: one short-term, one long-term 9 19 23 1,625All adults long-term workless 4 14 7 529Income sourcesFall in earnings 27 15 52 4,297Fall in benefit income 35 13 63 5,711Fall in non-benefit, non-earnings income 9 7 9 1,418Fall in investment income 6 5 4 878Fall in private and occupational pension income 0 7 0 70Tenure (first wave)Owner occupier 65 5 44 10,392Social housing 20 16 42 3,463Private rent 15 7 14 2,547Year2009/10-2010/11 54 7 53 8,7222010/11-2011/12 46 8 47 7,711Age of parent (main earner) (first wave)16-24 3 11 5 57025-34 23 9 30 3,90335-44 48 6 41 7,95245-54 23 6 20 3,60755-64 3 12 4 37165 or older [0] [19] [0] 30Government Office Region (first wave)North East 4 10 5 669North West 10 9 13 1,759Yorkshire and the Humber 9 8 9 1,409East Midlands 7 8 8 1,181West Midlands 8 10 12 1,365East of England 9 6 7 1,464London 17 10 23 2,752South East 13 5 8 2,161South West 8 4 4 1,320Wales 4 7 4 683Scotland 6 5 4 980Northern Ireland 4 8 4 686Rurality (first wave)Urban 81 8 88 13,202Rural 19 5 12 3,227
(Continued)
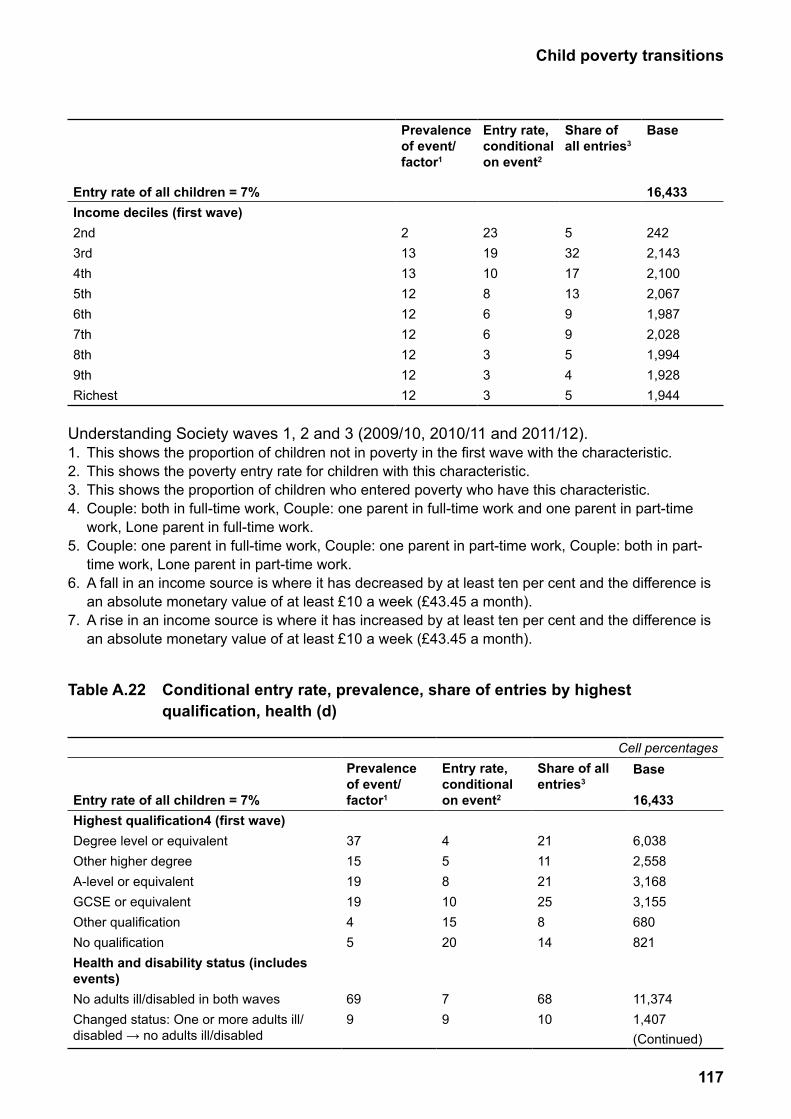
117
Child poverty transitions
Prevalence Entry rate, Share of Baseof event/ conditional all entries3
factor1 on event2
Entry rate of all children = 7% 16,433Income deciles (first wave)2nd 2 23 5 2423rd 13 19 32 2,1434th 13 10 17 2,1005th 12 8 13 2,0676th 12 6 9 1,9877th 12 6 9 2,0288th 12 3 5 1,9949th 12 3 4 1,928Richest 12 3 5 1,944
Understanding Society waves 1, 2 and 3 (2009/10, 2010/11 and 2011/12).1. This shows the proportion of children not in poverty in the first wave with the characteristic.2. This shows the poverty entry rate for children with this characteristic.3. This shows the proportion of children who entered poverty who have this characteristic.4. Couple: both in full-time work, Couple: one parent in full-time work and one parent in part-time
work, Lone parent in full-time work.5. Couple: one parent in full-time work, Couple: one parent in part-time work, Couple: both in part-
time work, Lone parent in part-time work.6. A fall in an income source is where it has decreased by at least ten per cent and the difference is
an absolute monetary value of at least £10 a week (£43.45 a month).7. A rise in an income source is where it has increased by at least ten per cent and the difference is
an absolute monetary value of at least £10 a week (£43.45 a month).
Table A.22 Conditional entry rate, prevalence, share of entries by highest qualification, health (d)
Cell percentages
Entry rate of all children = 7%
Prevalence of event/factor1
Entry rate, conditional on event2
Share of all entries3
Base
16,433Highest qualification4 (first wave)Degree level or equivalentOther higher degreeA-level or equivalentGCSE or equivalentOther qualificationNo qualificationHealth and disability status (includes events)No adults ill/disabled in both wavesChanged status: One or more adults ill/disabled → no adults ill/disabled
3715191945
699
458101520
79
21112125814
6810
6,0382,5583,1683,155680821
11,3741,407(Continued)
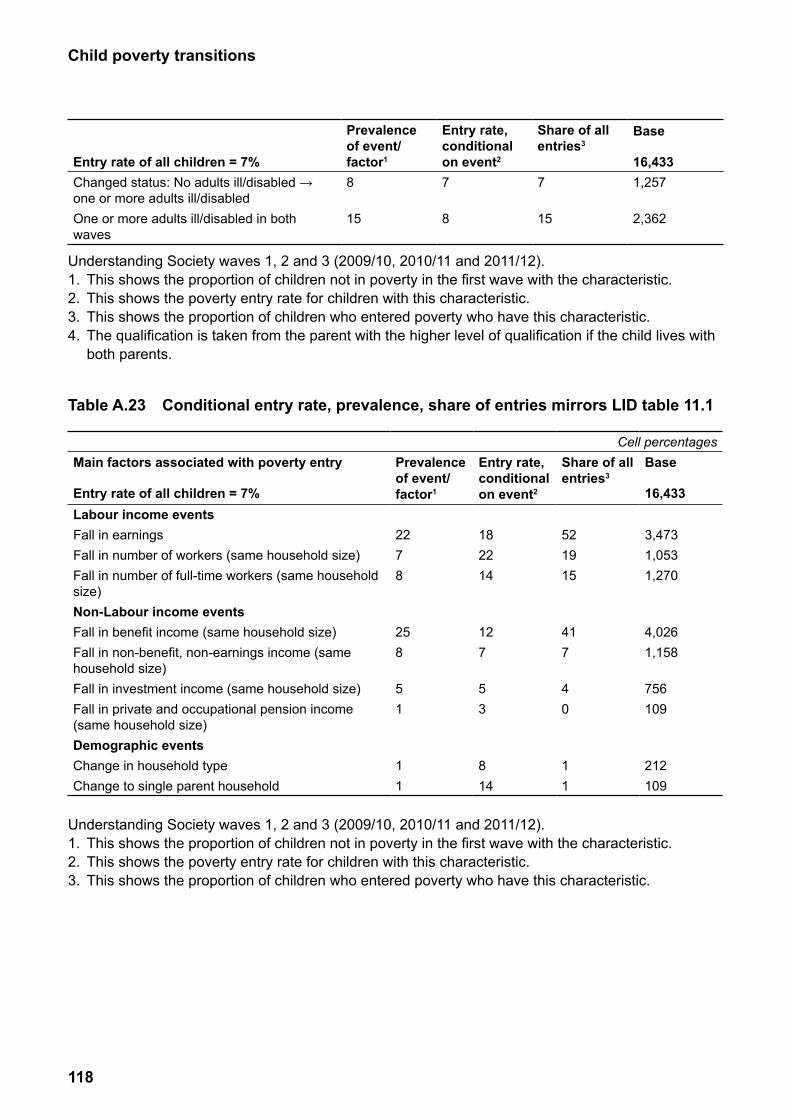
118
Child poverty transitions
Entry rate of all children = 7%
Prevalence of event/factor1
Entry rate, conditional on event2
Share of all entries3
Base
16,433Changed status: No adults ill/disabled → one or more adults ill/disabled
8 7 7 1,257
One or more adults ill/disabled in both waves
15 8 15 2,362
Understanding Society waves 1, 2 and 3 (2009/10, 2010/11 and 2011/12).1. This shows the proportion of children not in poverty in the first wave with the characteristic.2. This shows the poverty entry rate for children with this characteristic.3. This shows the proportion of children who entered poverty who have this characteristic.4. The qualification is taken from the parent with the higher level of qualification if the child lives with
both parents.
Table A.23 Conditional entry rate, prevalence, share of entries mirrors LID table 11.1
Cell percentagesMain factors associated with poverty entry
Entry rate of all children = 7%
Prevalence of event/factor1
Entry rate, conditional on event2
Share of all entries3
Base
16,433Labour income eventsFall in earnings 22 18 52 3,473Fall in number of workers (same household size) 7 22 19 1,053Fall in number of full-time workers (same household size)
8 14 15 1,270
Non-Labour income eventsFall in benefit income (same household size) 25 12 41 4,026Fall in non-benefit, non-earnings income (same household size)
8 7 7 1,158
Fall in investment income (same household size) 5 5 4 756Fall in private and occupational pension income (same household size)
1 3 0 109
Demographic eventsChange in household type 1 8 1 212Change to single parent household 1 14 1 109
Understanding Society waves 1, 2 and 3 (2009/10, 2010/11 and 2011/12).1. This shows the proportion of children not in poverty in the first wave with the characteristic.2. This shows the poverty entry rate for children with this characteristic.3. This shows the proportion of children who entered poverty who have this characteristic.

119
Child poverty transitions
Table A.24 Conditional entry rate, prevalence, share of entries by count of significant factors and selected combinations of significant factors
Cell percentagesMain factors associated with poverty entry
Entry rate of all children = 7%
Prevalence of event/factor1
Entry rate, conditional on event2
Share of all entries3
Base
16,433Number of key predictors of child poverty4
None 34 4 17 5,357One 36 6 29 5,987Two 20 12 31 3,304Three 8 15 16 1,390Four or five 2 21 7 395Select combinations of key predictors of child povertyLone parent, long-term workless, and no qualifications
2 22 6 335
Lone parent, and 3 or more children 6 18 15 1,159Poor health, long-term workless, and no qualifications
1 19 3 196
Understanding Society waves 1, 2 and 3 (2009/10, 2010/11 and 2011/12).1. This shows the proportion of children not in poverty in the first wave with the characteristic.2. This shows the poverty entry rate for children with this characteristic.3. This shows the proportion of children who entered poverty who have this characteristic.4. These are the five key predictors of child poverty identified by the Child Poverty Strategy: long-
term worklessness, having low qualifications, raising children on your own, having three or more children to care for, and experiencing ill health (DWP, 2014b).
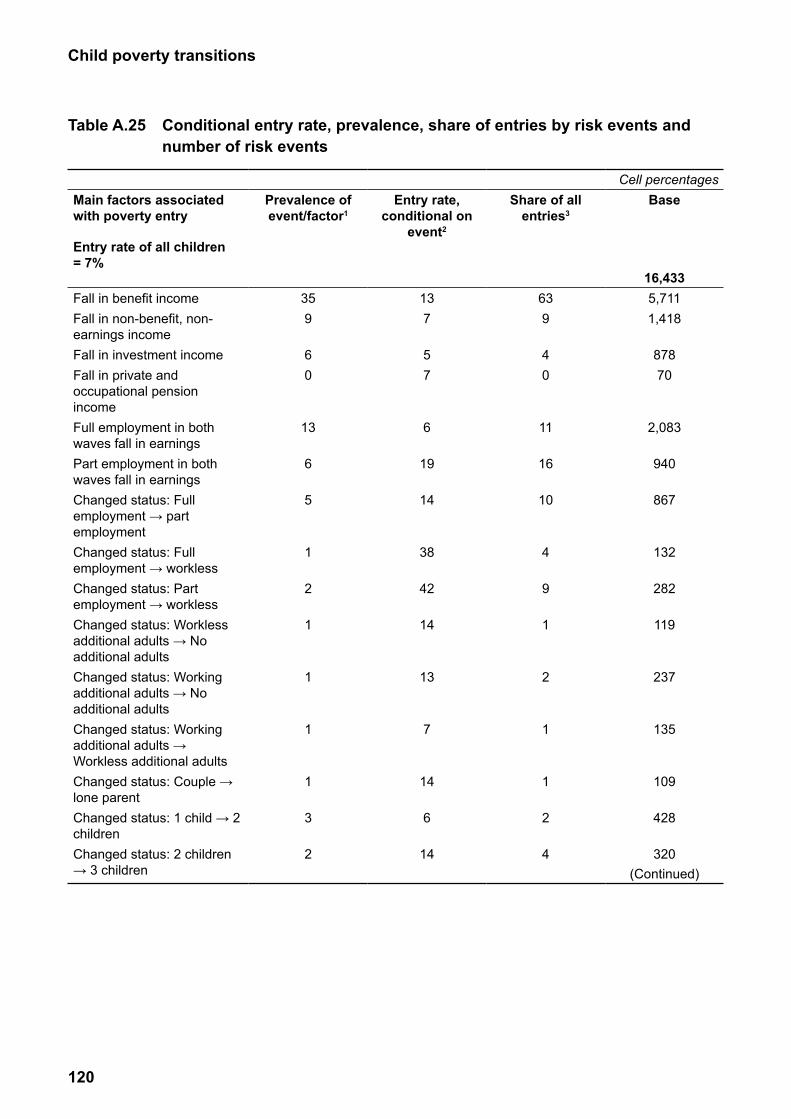
120
Child poverty transitions
Table A.25 Conditional entry rate, prevalence, share of entries by risk events and number of risk events
Cell percentagesMain factors associated with poverty entry
Entry rate of all children = 7%
Prevalence of event/factor1
Entry rate, conditional on
event2
Share of all entries3
Base
16,433Fall in benefit incomeFall in non-benefit, non-earnings incomeFall in investment incomeFall in private and occupational pension incomeFull employment in both waves fall in earningsPart employment in both waves fall in earningsChanged status: Full employment → part employmentChanged status: Full employment → worklessChanged status: Part employment → worklessChanged status: Workless additional adults → No additional adultsChanged status: Working additional adults → No additional adultsChanged status: Working additional adults → Workless additional adultsChanged status: Couple → lone parentChanged status: 1 child → 2 childrenChanged status: 2 children → 3 children
359
60
13
6
5
1
2
1
1
1
1
3
2
137
57
6
19
14
38
42
14
13
7
14
6
14
639
40
11
16
10
4
9
1
2
1
1
2
4
5,7111,418
87870
2,083
940
867
132
282
119
237
135
109
428
320(Continued)

121
Child poverty transitions
Main factors associated with poverty entry
Entry rate of all children = 7%
Prevalence of event/factor1
Entry rate, conditional on
event2
Share of all entries3
Base
16,433Changed status: 3 children → 4 or more children
1 25 3 167
Changed status: One or more adults ill/disabled → no adults ill/disabled
9 9 10 1,407
Changed status: No adults ill/disabled → one or more adults ill/disabled
8 7 7 1,257
Child in the benefit unit went from age 13 to age 14
12 8 13 1,982
Number of risk events4
0 30 1 6 4,9651 39 8 40 6,3672 21 13 36 3,4793 or more 10 13 18 1,622
Understanding Society waves 1, 2 and 3 (2009/10, 2010/11 and 2011/12).1. This shows the proportion of children not in poverty in the first wave with the characteristic.2. This shows the poverty entry rate for children with this characteristic.3. This shows the proportion of children who entered poverty who have this characteristic.4. The risk events are: Fall in benefit income; Fall in non-benefit, non-earnings income; Fall in investment income; Fall in private and occupational pension income; Fall in work status or earnings (Full employment in both waves fall in earnings, Part employment
in both waves fall in earnings, Changed status: Full employment → part employment, Changed status: Full employment → workless, or Changed status: Part employment → workless);
Additional adult status changed (Changed status: Workless additional adults → No additional adults, Changed status: Working additional adults → No additional adults, or Changed status: Working additional adults → Workless additional adults);
Went from couple to lone parent; Increased number of children; Changed disability status (Changed status: One or more adults ill/disabled → no adults ill/
disabled, or Changed status: No adults ill/disabled → one or more adults ill/disabled); A child in the benefit unit went from age 13 to age 14.
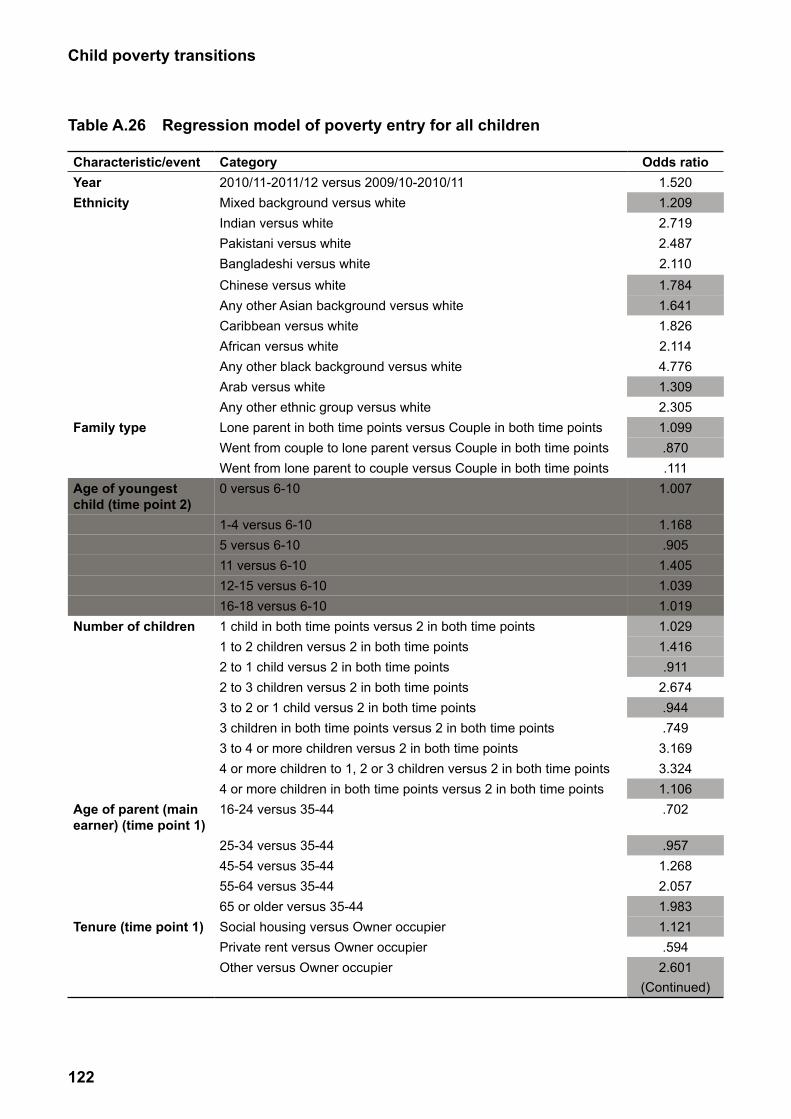
122
Child poverty transitions
Table A.26 Regression model of poverty entry for all children
Characteristic/event Category Odds ratioYear 2010/11-2011/12 versus 2009/10-2010/11 1.520Ethnicity Mixed background versus white 1.209
Indian versus white 2.719Pakistani versus white 2.487Bangladeshi versus white 2.110Chinese versus white 1.784Any other Asian background versus white 1.641Caribbean versus white 1.826African versus white 2.114Any other black background versus white 4.776Arab versus white 1.309Any other ethnic group versus white 2.305
Family type Lone parent in both time points versus Couple in both time points 1.099Went from couple to lone parent versus Couple in both time points .870Went from lone parent to couple versus Couple in both time points .111
Age of youngest child (time point 2)
0 versus 6-10 1.007
1-4 versus 6-10 1.1685 versus 6-10 .90511 versus 6-10 1.40512-15 versus 6-10 1.03916-18 versus 6-10 1.019
Number of children 1 child in both time points versus 2 in both time points 1.0291 to 2 children versus 2 in both time points 1.4162 to 1 child versus 2 in both time points .9112 to 3 children versus 2 in both time points 2.6743 to 2 or 1 child versus 2 in both time points .9443 children in both time points versus 2 in both time points .7493 to 4 or more children versus 2 in both time points 3.1694 or more children to 1, 2 or 3 children versus 2 in both time points 3.3244 or more children in both time points versus 2 in both time points 1.106
Age of parent (main earner) (time point 1)
16-24 versus 35-44 .702
25-34 versus 35-44 .95745-54 versus 35-44 1.26855-64 versus 35-44 2.05765 or older versus 35-44 1.983
Tenure (time point 1) Social housing versus Owner occupier 1.121Private rent versus Owner occupier .594Other versus Owner occupier 2.601
(Continued)
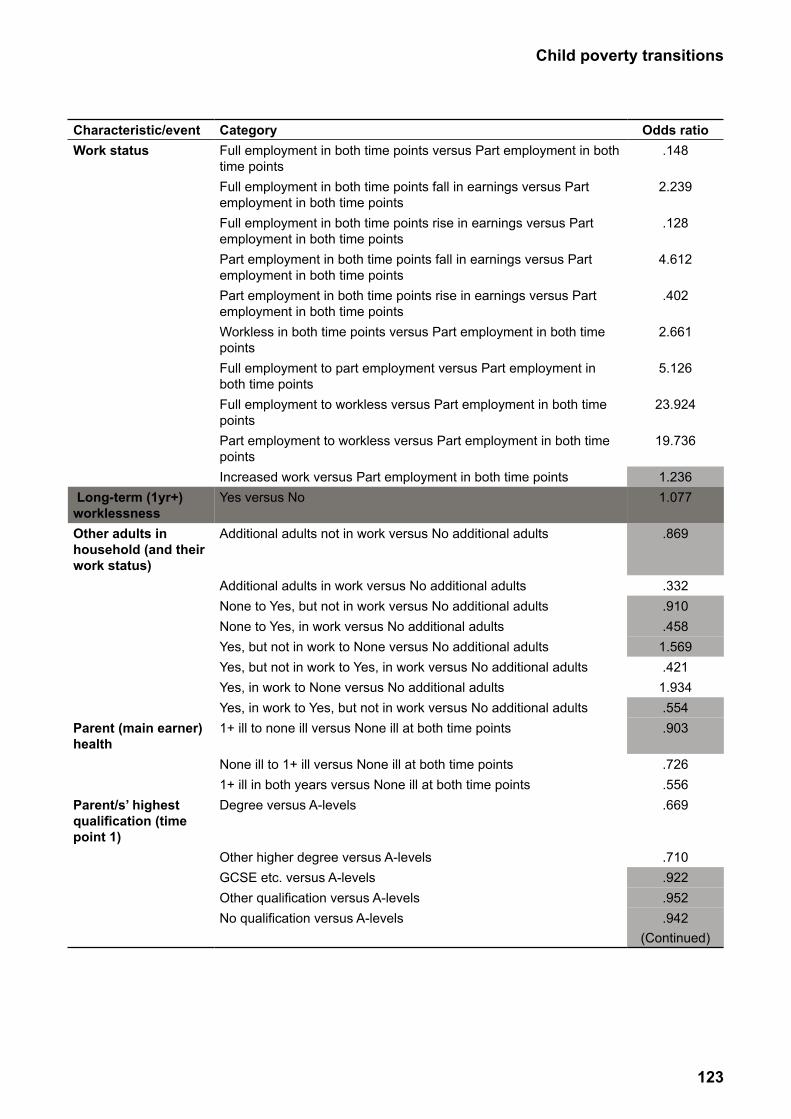
123
Child poverty transitions
Characteristic/event Category Odds ratioWork status Full employment in both time points versus Part employment in both
time points.148
Full employment in both time points fall in earnings versus Part employment in both time points
2.239
Full employment in both time points rise in earnings versus Part employment in both time points
.128
Part employment in both time points fall in earnings versus Part employment in both time points
4.612
Part employment in both time points rise in earnings versus Part employment in both time points
.402
Workless in both time points versus Part employment in both time points
2.661
Full employment to part employment versus Part employment in both time points
5.126
Full employment to workless versus Part employment in both time points
23.924
Part employment to workless versus Part employment in both time points
19.736
Increased work versus Part employment in both time points 1.236 Long-term (1yr+) worklessness
Yes versus No 1.077
Other adults in Additional adults not in work versus No additional adults .869household (and their work status)
Additional adults in work versus No additional adults .332None to Yes, but not in work versus No additional adults .910None to Yes, in work versus No additional adults .458Yes, but not in work to None versus No additional adults 1.569Yes, but not in work to Yes, in work versus No additional adults .421Yes, in work to None versus No additional adults 1.934Yes, in work to Yes, but not in work versus No additional adults .554
Parent (main earner) health
1+ ill to none ill versus None ill at both time points .903
None ill to 1+ ill versus None ill at both time points .7261+ ill in both years versus None ill at both time points .556
Parent/s’ highest qualification (time point 1)
Degree versus A-levels .669
Other higher degree versus A-levels .710GCSE etc. versus A-levels .922Other qualification versus A-levels .952No qualification versus A-levels .942
(Continued)
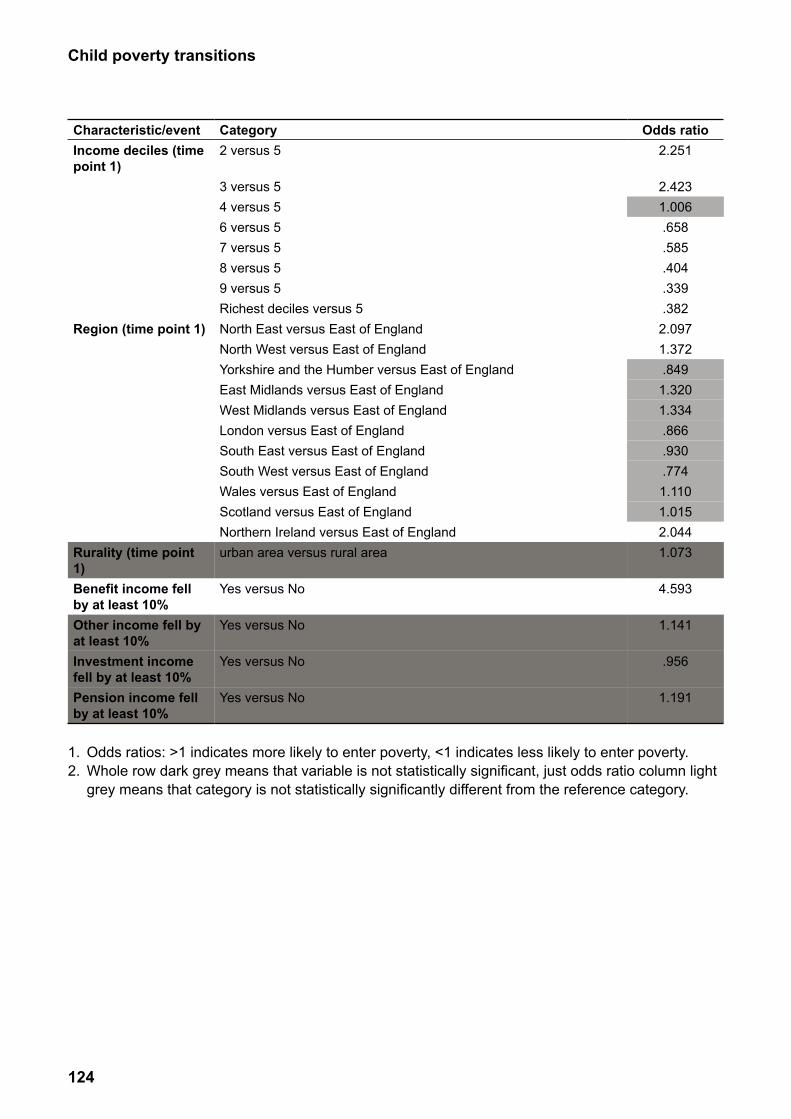
124
Child poverty transitions
Characteristic/event Category Odds ratioIncome deciles (time 2 versus 5 2.251point 1)
3 versus 5 2.4234 versus 5 1.0066 versus 5 .6587 versus 5 .5858 versus 5 .4049 versus 5 .339Richest deciles versus 5 .382
Region (time point 1) North East versus East of England 2.097North West versus East of England 1.372Yorkshire and the Humber versus East of England .849East Midlands versus East of England 1.320West Midlands versus East of England 1.334London versus East of England .866South East versus East of England .930South West versus East of England .774Wales versus East of England 1.110Scotland versus East of England 1.015Northern Ireland versus East of England 2.044
Rurality (time point urban area versus rural area 1.0731)Benefit income fell Yes versus No 4.593by at least 10%Other income fell by Yes versus No 1.141at least 10%Investment income Yes versus No .956fell by at least 10%Pension income fell Yes versus No 1.191by at least 10%
1. Odds ratios: >1 indicates more likely to enter poverty, <1 indicates less likely to enter poverty.2. Whole row dark grey means that variable is not statistically significant, just odds ratio column light
grey means that category is not statistically significantly different from the reference category.
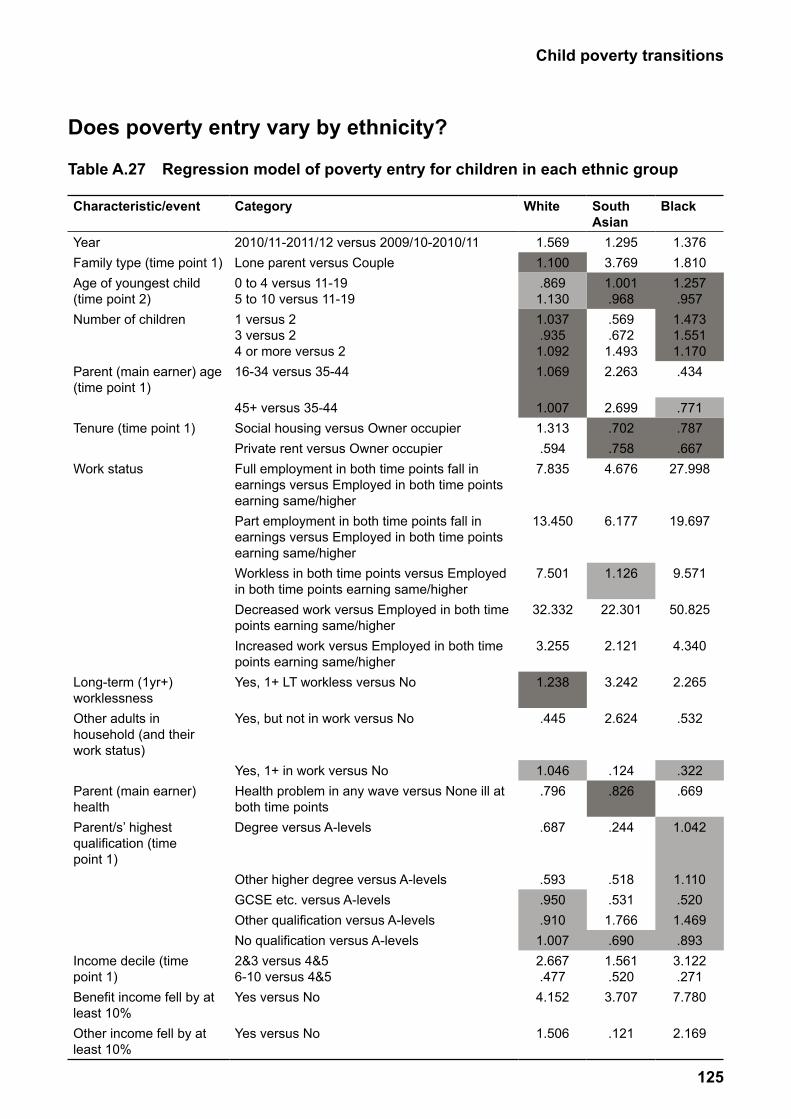
125
Child poverty transitions
Does poverty entry vary by ethnicity?
Table A.27 Regression model of poverty entry for children in each ethnic group
Characteristic/event Category White South Asian
Black
Year 2010/11-2011/12 versus 2009/10-2010/11 1.569 1.295 1.376Family type (time point 1) Lone parent versus Couple 1.100 3.769 1.810Age of youngest child (time point 2)
0 to 4 versus 11-19 5 to 10 versus 11-19
.869 1.130
1.001 .968
1.257 .957
Number of children 1 versus 2 3 versus 2 4 or more versus 2
1.037 .935 1.092
.569
.672 1.493
1.473 1.551 1.170
Parent (main earner) age (time point 1)
16-34 versus 35-44 1.069 2.263 .434
45+ versus 35-44 1.007 2.699 .771Tenure (time point 1) Social housing versus Owner occupier 1.313 .702 .787
Private rent versus Owner occupier .594 .758 .667Work status Full employment in both time points fall in
earnings versus Employed in both time points earning same/higher
7.835 4.676 27.998
Part employment in both time points fall in earnings versus Employed in both time points earning same/higher
13.450 6.177 19.697
Workless in both time points versus Employed in both time points earning same/higher
7.501 1.126 9.571
Decreased work versus Employed in both time points earning same/higher
32.332 22.301 50.825
Increased work versus Employed in both time points earning same/higher
3.255 2.121 4.340
Long-term (1yr+) worklessness
Yes, 1+ LT workless versus No 1.238 3.242 2.265
Other adults in household (and their work status)
Yes, but not in work versus No .445 2.624 .532
Yes, 1+ in work versus No 1.046 .124 .322Parent (main earner) health
Health problem in any wave versus None ill at both time points
.796 .826 .669
Parent/s’ highest qualification (time point 1)
Degree versus A-levels
.687 .244 1.042
Other higher degree versus A-levels .593 .518 1.110GCSE etc. versus A-levels .950 .531 .520Other qualification versus A-levels .910 1.766 1.469No qualification versus A-levels 1.007 .690 .893
Income decile (time point 1)
2&3 versus 4&5 6-10 versus 4&5
2.667 .477
1.561 .520
3.122 .271
Benefit income fell by at least 10%
Yes versus No 4.152 3.707 7.780
Other income fell by at least 10%
Yes versus No 1.506 .121 2.169
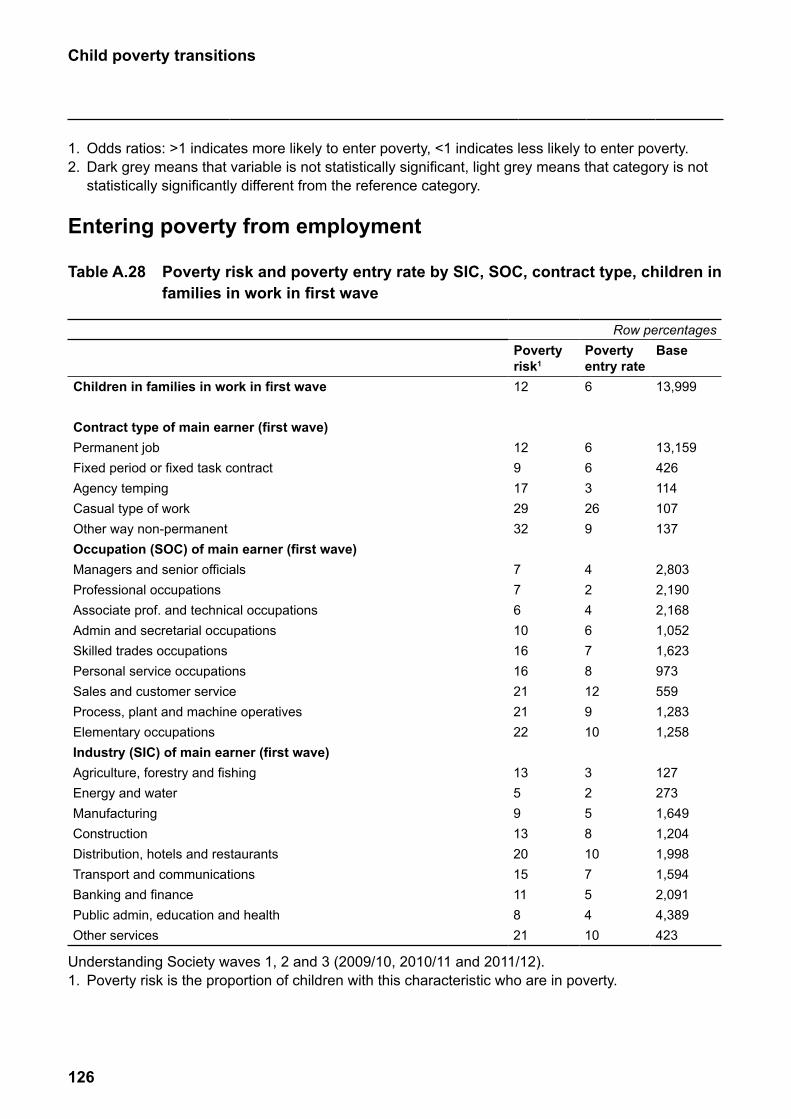
126
Child poverty transitions
1. Odds ratios: >1 indicates more likely to enter poverty, <1 indicates less likely to enter poverty.2. Dark grey means that variable is not statistically significant, light grey means that category is not
statistically significantly different from the reference category.
Entering poverty from employment
Table A.28 Poverty risk and poverty entry rate by SIC, SOC, contract type, children in families in work in first wave
Row percentagesPoverty risk1
Poverty entry rate
Base
Children in families in work in first wave 12 6 13,999
Contract type of main earner (first wave)Permanent job 12 6 13,159Fixed period or fixed task contract 9 6 426Agency temping 17 3 114Casual type of work 29 26 107Other way non-permanent 32 9 137Occupation (SOC) of main earner (first wave)Managers and senior officials 7 4 2,803Professional occupations 7 2 2,190Associate prof. and technical occupations 6 4 2,168Admin and secretarial occupations 10 6 1,052Skilled trades occupations 16 7 1,623Personal service occupations 16 8 973Sales and customer service 21 12 559Process, plant and machine operatives 21 9 1,283Elementary occupations 22 10 1,258Industry (SIC) of main earner (first wave)Agriculture, forestry and fishing 13 3 127Energy and water 5 2 273Manufacturing 9 5 1,649Construction 13 8 1,204Distribution, hotels and restaurants 20 10 1,998Transport and communications 15 7 1,594Banking and finance 11 5 2,091Public admin, education and health 8 4 4,389Other services 21 10 423
Understanding Society waves 1, 2 and 3 (2009/10, 2010/11 and 2011/12).1. Poverty risk is the proportion of children with this characteristic who are in poverty.
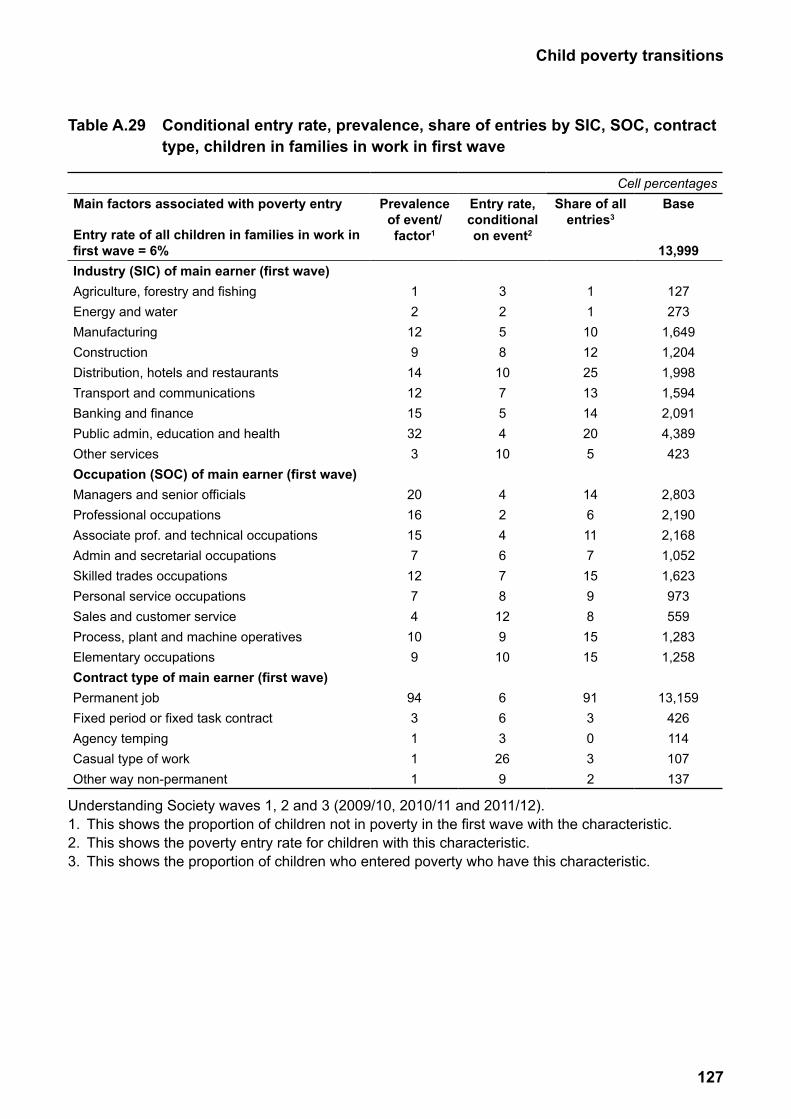
127
Child poverty transitions
Table A.29 Conditional entry rate, prevalence, share of entries by SIC, SOC, contract type, children in families in work in first wave
Cell percentagesMain factors associated with poverty entry
Entry rate of all children in families in work in first wave = 6%
Prevalence of event/factor1
Entry rate, conditional on event2
Share of all entries3
Base
13,999Industry (SIC) of main earner (first wave)Agriculture, forestry and fishing 1 3 1 127Energy and water 2 2 1 273Manufacturing 12 5 10 1,649Construction 9 8 12 1,204Distribution, hotels and restaurants 14 10 25 1,998Transport and communications 12 7 13 1,594Banking and finance 15 5 14 2,091Public admin, education and health 32 4 20 4,389Other services 3 10 5 423Occupation (SOC) of main earner (first wave)Managers and senior officials 20 4 14 2,803Professional occupations 16 2 6 2,190Associate prof. and technical occupations 15 4 11 2,168Admin and secretarial occupations 7 6 7 1,052Skilled trades occupations 12 7 15 1,623Personal service occupations 7 8 9 973Sales and customer service 4 12 8 559Process, plant and machine operatives 10 9 15 1,283Elementary occupations 9 10 15 1,258Contract type of main earner (first wave)Permanent job 94 6 91 13,159Fixed period or fixed task contract 3 6 3 426Agency temping 1 3 0 114Casual type of work 1 26 3 107Other way non-permanent 1 9 2 137
Understanding Society waves 1, 2 and 3 (2009/10, 2010/11 and 2011/12).1. This shows the proportion of children not in poverty in the first wave with the characteristic.2. This shows the poverty entry rate for children with this characteristic.3. This shows the proportion of children who entered poverty who have this characteristic.
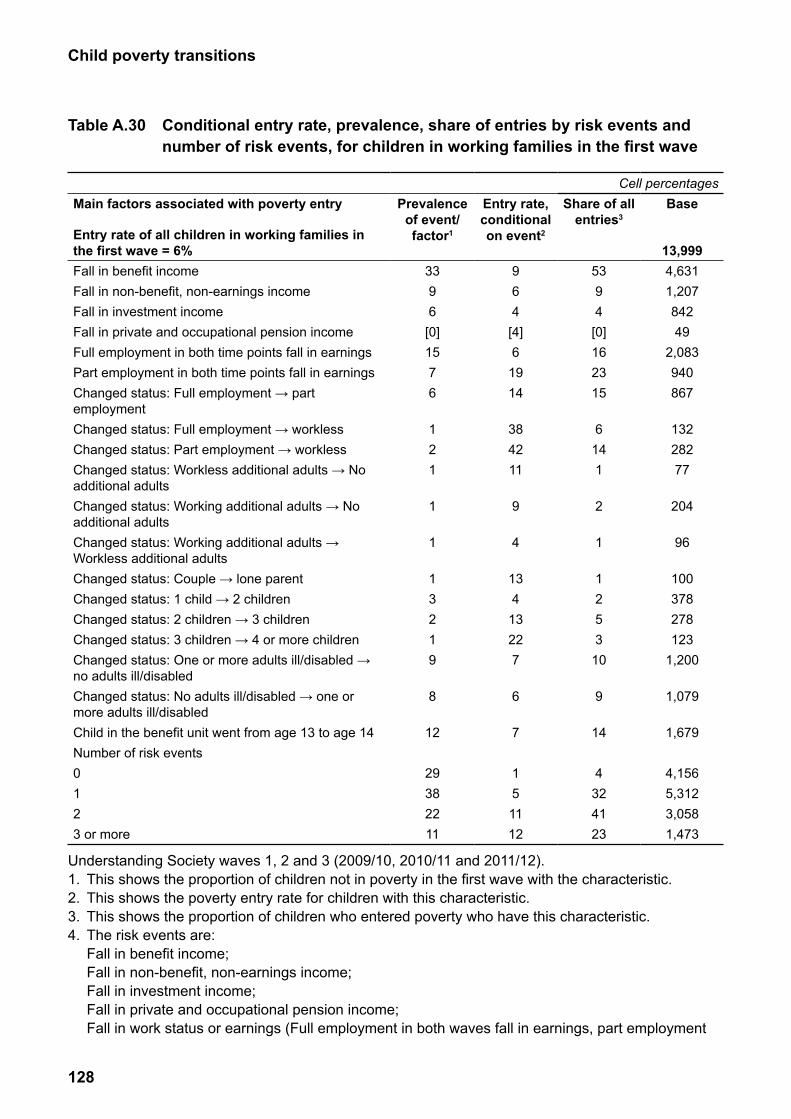
128
Child poverty transitions
Table A.30 Conditional entry rate, prevalence, share of entries by risk events and number of risk events, for children in working families in the first wave
Cell percentagesMain factors associated with poverty entry
Entry rate of all children in working families in the first wave = 6%
Prevalence of event/factor1
Entry rate, conditional on event2
Share of all entries3
Base
13,999Fall in benefit income 33 9 53 4,631Fall in non-benefit, non-earnings income 9 6 9 1,207Fall in investment income 6 4 4 842Fall in private and occupational pension income [0] [4] [0] 49Full employment in both time points fall in earnings 15 6 16 2,083Part employment in both time points fall in earnings 7 19 23 940Changed status: Full employment → part employment
6 14 15 867
Changed status: Full employment → workless 1 38 6 132Changed status: Part employment → workless 2 42 14 282Changed status: Workless additional adults → No additional adults
1 11 1 77
Changed status: Working additional adults → No additional adults
1 9 2 204
Changed status: Working additional adults → Workless additional adults
1 4 1 96
Changed status: Couple → lone parent 1 13 1 100Changed status: 1 child → 2 children 3 4 2 378Changed status: 2 children → 3 children 2 13 5 278Changed status: 3 children → 4 or more children 1 22 3 123Changed status: One or more adults ill/disabled → no adults ill/disabled
9 7 10 1,200
Changed status: No adults ill/disabled → one or more adults ill/disabled
8 6 9 1,079
Child in the benefit unit went from age 13 to age 14 12 7 14 1,679Number of risk events0 29 1 4 4,1561 38 5 32 5,3122 22 11 41 3,0583 or more 11 12 23 1,473
Understanding Society waves 1, 2 and 3 (2009/10, 2010/11 and 2011/12).1. This shows the proportion of children not in poverty in the first wave with the characteristic.2. This shows the poverty entry rate for children with this characteristic.3. This shows the proportion of children who entered poverty who have this characteristic.4. The risk events are: Fall in benefit income; Fall in non-benefit, non-earnings income; Fall in investment income; Fall in private and occupational pension income; Fall in work status or earnings (Full employment in both waves fall in earnings, part employment
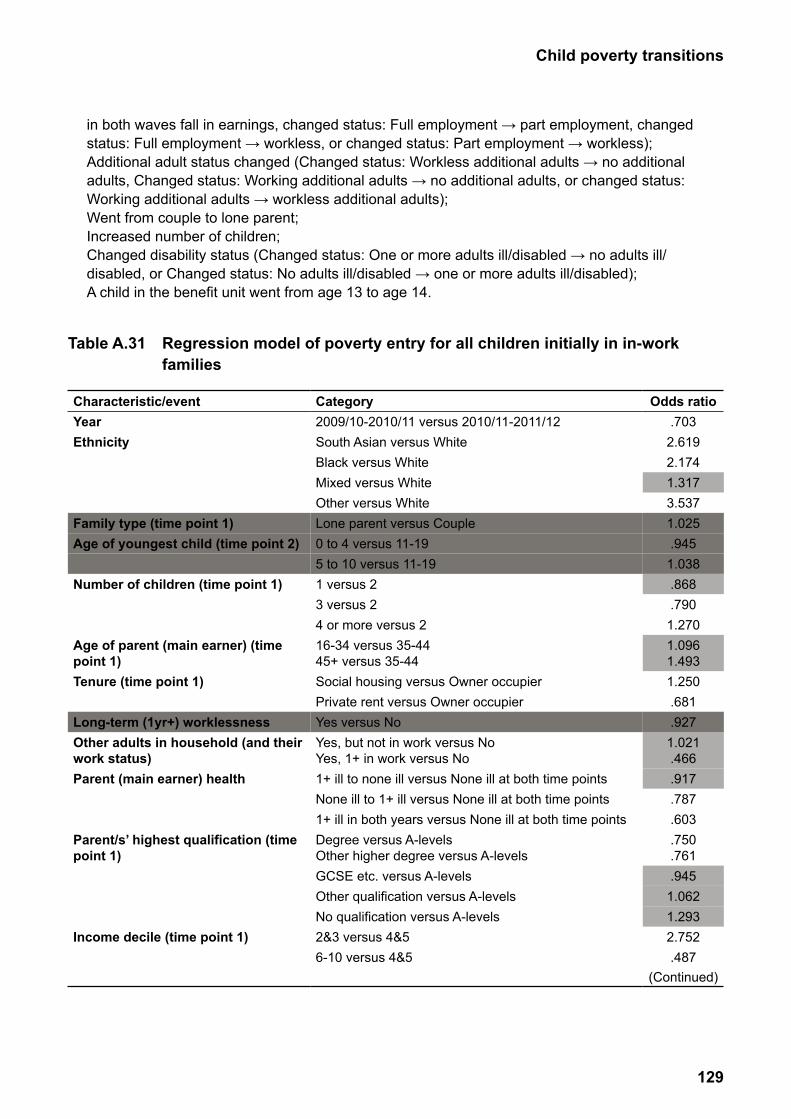
129
Child poverty transitions
in both waves fall in earnings, changed status: Full employment → part employment, changed status: Full employment → workless, or changed status: Part employment → workless);Additional adult status changed (Changed status: Workless additional adults → no additional adults, Changed status: Working additional adults → no additional adults, or changed status: Working additional adults → workless additional adults);Went from couple to lone parent;Increased number of children;Changed disability status (Changed status: One or more adults ill/disabled → no adults ill/disabled, or Changed status: No adults ill/disabled → one or more adults ill/disabled);A child in the benefit unit went from age 13 to age 14.
Table A.31 Regression model of poverty entry for all children initially in in-work families
Characteristic/event Category Odds ratioYear 2009/10-2010/11 versus 2010/11-2011/12 .703Ethnicity South Asian versus White 2.619
Black versus White 2.174Mixed versus White 1.317Other versus White 3.537
Family type (time point 1) Lone parent versus Couple 1.025Age of youngest child (time point 2) 0 to 4 versus 11-19 .945
5 to 10 versus 11-19 1.038Number of children (time point 1) 1 versus 2 .868
3 versus 2 .7904 or more versus 2 1.270
Age of parent (main earner) (time 16-34 versus 35-44 1.096 point 1) 45+ versus 35-44 1.493Tenure (time point 1) Social housing versus Owner occupier 1.250
Private rent versus Owner occupier .681Long-term (1yr+) worklessness Yes versus No .927Other adults in household (and their Yes, but not in work versus No 1.021 work status) Yes, 1+ in work versus No .466Parent (main earner) health 1+ ill to none ill versus None ill at both time points .917
None ill to 1+ ill versus None ill at both time points .7871+ ill in both years versus None ill at both time points .603
Parent/s’ highest qualification (time Degree versus A-levels .750 point 1) Other higher degree versus A-levels .761
GCSE etc. versus A-levels .945Other qualification versus A-levels 1.062No qualification versus A-levels 1.293
Income decile (time point 1) 2&3 versus 4&5 2.7526-10 versus 4&5 .487
(Continued)
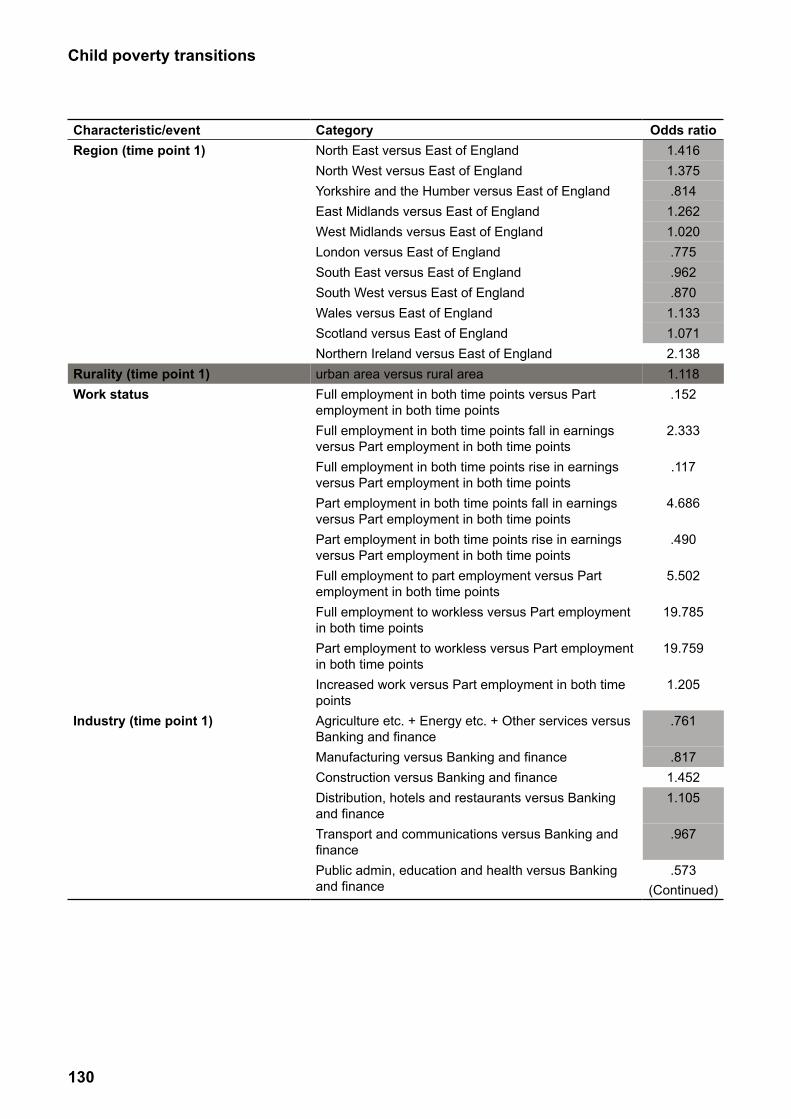
130
Child poverty transitions
Characteristic/event Category Odds ratioRegion (time point 1) North East versus East of England 1.416
North West versus East of England 1.375Yorkshire and the Humber versus East of England .814East Midlands versus East of England 1.262West Midlands versus East of England 1.020London versus East of England .775South East versus East of England .962South West versus East of England .870Wales versus East of England 1.133Scotland versus East of England 1.071Northern Ireland versus East of England 2.138
Rurality (time point 1) urban area versus rural area 1.118Work status Full employment in both time points versus Part
employment in both time points.152
Full employment in both time points fall in earnings versus Part employment in both time points
2.333
Full employment in both time points rise in earnings versus Part employment in both time points
.117
Part employment in both time points fall in earnings versus Part employment in both time points
4.686
Part employment in both time points rise in earnings versus Part employment in both time points
.490
Full employment to part employment versus Part employment in both time points
5.502
Full employment to workless versus Part employment in both time points
19.785
Part employment to workless versus Part employment in both time points
19.759
Increased work versus Part employment in both time points
1.205
Industry (time point 1) Agriculture etc. + Energy etc. + Other services versus Banking and finance
.761
Manufacturing versus Banking and finance .817Construction versus Banking and finance 1.452Distribution, hotels and restaurants versus Banking and finance
1.105
Transport and communications versus Banking and finance
.967
Public admin, education and health versus Banking and finance
.573(Continued)
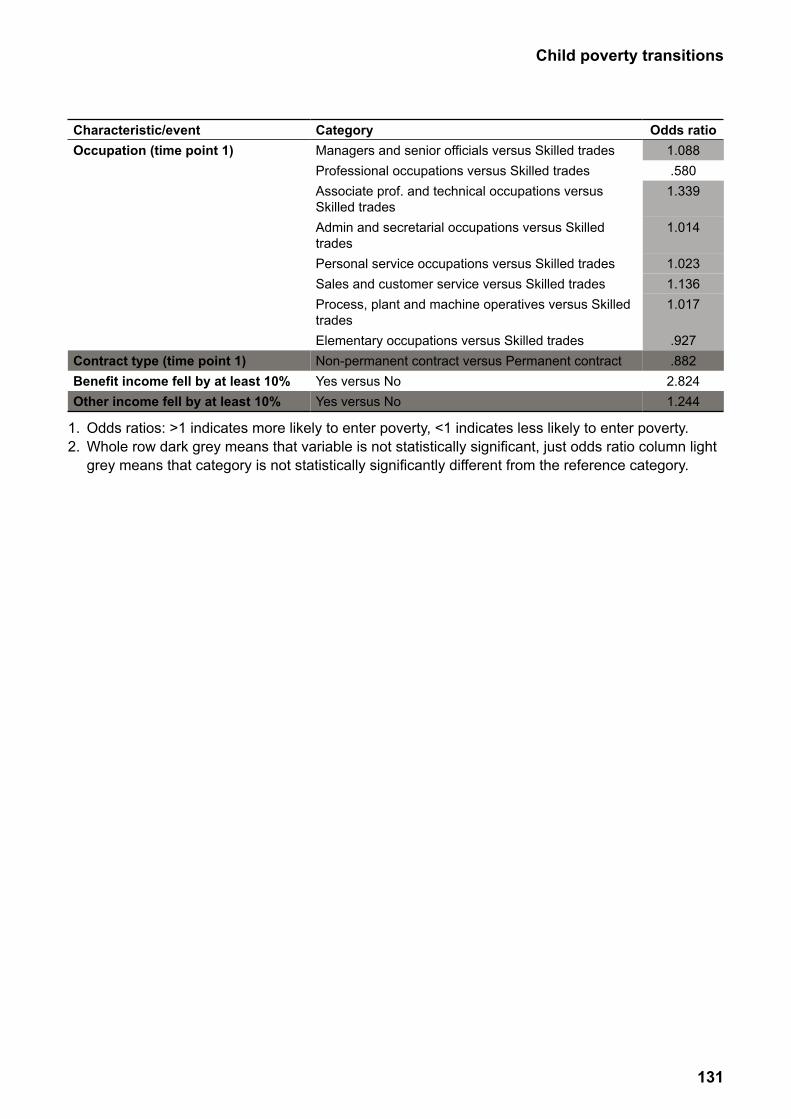
131
Child poverty transitions
Characteristic/event Category Odds ratioOccupation (time point 1) Managers and senior officials versus Skilled trades 1.088
Professional occupations versus Skilled trades .580Associate prof. and technical occupations versus Skilled trades
1.339
Admin and secretarial occupations versus Skilled trades
1.014
Personal service occupations versus Skilled trades 1.023Sales and customer service versus Skilled trades 1.136Process, plant and machine operatives versus Skilled trades
1.017
Elementary occupations versus Skilled trades .927Contract type (time point 1) Non-permanent contract versus Permanent contract .882Benefit income fell by at least 10% Yes versus No 2.824Other income fell by at least 10% Yes versus No 1.244
1. Odds ratios: >1 indicates more likely to enter poverty, <1 indicates less likely to enter poverty.2. Whole row dark grey means that variable is not statistically significant, just odds ratio column light
grey means that category is not statistically significantly different from the reference category.
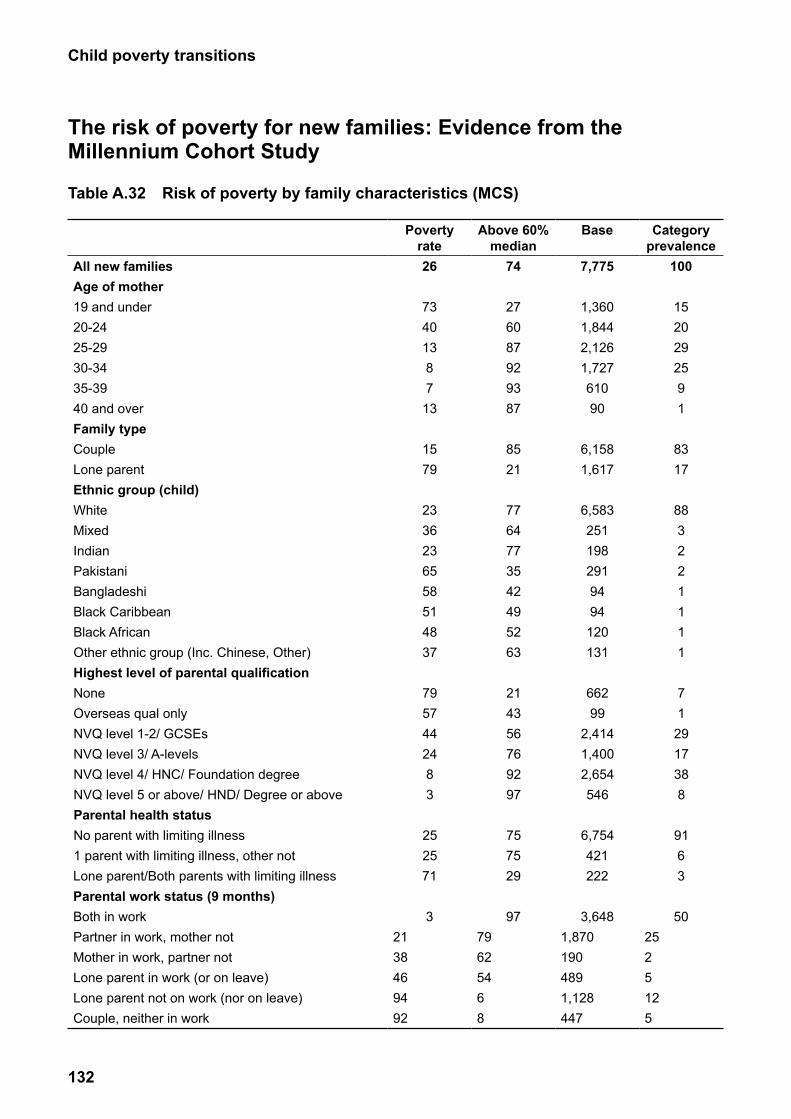
132
Child poverty transitions
The risk of poverty for new families: Evidence from the Millennium Cohort Study
Table A.32 Risk of poverty by family characteristics (MCS)
Poverty rate
Above 60% median
Base Category prevalence
All new families 26 74 7,775 100Age of mother19 and under 73 27 1,360 1520-24 40 60 1,844 2025-29 13 87 2,126 2930-34 8 92 1,727 2535-39 7 93 610 940 and over 13 87 90 1Family typeCouple 15 85 6,158 83Lone parent 79 21 1,617 17Ethnic group (child)White 23 77 6,583 88Mixed 36 64 251 3Indian 23 77 198 2Pakistani 65 35 291 2Bangladeshi 58 42 94 1Black Caribbean 51 49 94 1Black African 48 52 120 1Other ethnic group (Inc. Chinese, Other) 37 63 131 1Highest level of parental qualificationNone 79 21 662 7Overseas qual only 57 43 99 1NVQ level 1-2/ GCSEs 44 56 2,414 29NVQ level 3/ A-levels 24 76 1,400 17NVQ level 4/ HNC/ Foundation degree 8 92 2,654 38NVQ level 5 or above/ HND/ Degree or above 3 97 546 8Parental health statusNo parent with limiting illness 25 75 6,754 911 parent with limiting illness, other not 25 75 421 6Lone parent/Both parents with limiting illness 71 29 222 3Parental work status (9 months)Both in work 3 97 3,648 50Partner in work, mother not 21 79 1,870 25Mother in work, partner not 38 62 190 2Lone parent in work (or on leave) 46 54 489 5Lone parent not on work (nor on leave) 94 6 1,128 12Couple, neither in work 92 8 447 5
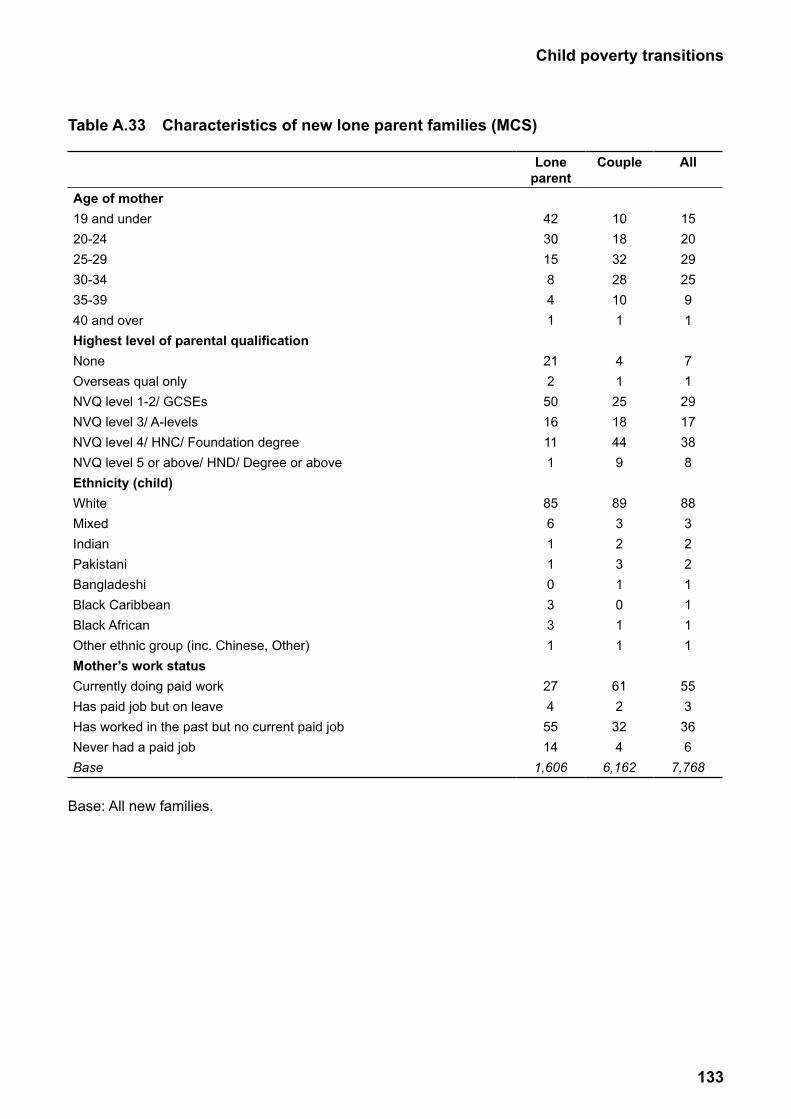
133
Child poverty transitions
Table A.33 Characteristics of new lone parent families (MCS)
Lone parent
Couple All
Age of mother19 and under 42 10 1520-24 30 18 2025-29 15 32 2930-34 8 28 2535-39 4 10 940 and over 1 1 1Highest level of parental qualificationNone 21 4 7Overseas qual only 2 1 1NVQ level 1-2/ GCSEs 50 25 29NVQ level 3/ A-levels 16 18 17NVQ level 4/ HNC/ Foundation degree 11 44 38NVQ level 5 or above/ HND/ Degree or above 1 9 8Ethnicity (child)White 85 89 88Mixed 6 3 3Indian 1 2 2Pakistani 1 3 2Bangladeshi 0 1 1Black Caribbean 3 0 1Black African 3 1 1Other ethnic group (inc. Chinese, Other) 1 1 1Mother’s work statusCurrently doing paid work 27 61 55Has paid job but on leave 4 2 3Has worked in the past but no current paid job 55 32 36Never had a paid job 14 4 6Base 1,606 6,162 7,768
Base: All new families.
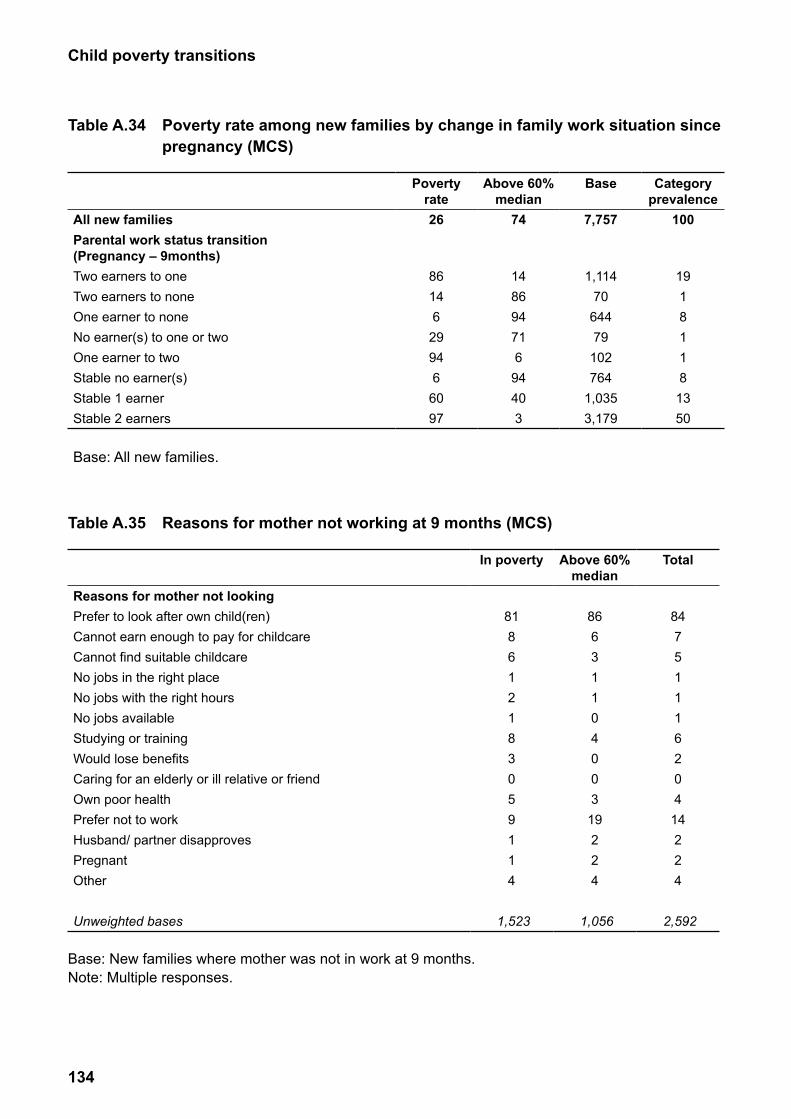
134
Child poverty transitions
Table A.34 Poverty rate among new families by change in family work situation since pregnancy (MCS)
Poverty rate
Above 60% median
Base Category prevalence
All new families 26 74 7,757 100Parental work status transition (Pregnancy – 9months)
Two earners to one 86 14 1,114 19Two earners to none 14 86 70 1One earner to none 6 94 644 8No earner(s) to one or two 29 71 79 1One earner to two 94 6 102 1Stable no earner(s) 6 94 764 8Stable 1 earner 60 40 1,035 13Stable 2 earners 97 3 3,179 50
Base: All new families.
Table A.35 Reasons for mother not working at 9 months (MCS)
In poverty Above 60% median
Total
Reasons for mother not lookingPrefer to look after own child(ren) 81 86 84Cannot earn enough to pay for childcare 8 6 7Cannot find suitable childcare 6 3 5No jobs in the right place 1 1 1No jobs with the right hours 2 1 1No jobs available 1 0 1Studying or training 8 4 6Would lose benefits 3 0 2Caring for an elderly or ill relative or friend 0 0 0Own poor health 5 3 4Prefer not to work 9 19 14Husband/ partner disapproves 1 2 2Pregnant 1 2 2Other 4 4 4
Unweighted bases 1,523 1,056 2,592
Base: New families where mother was not in work at 9 months.Note: Multiple responses.
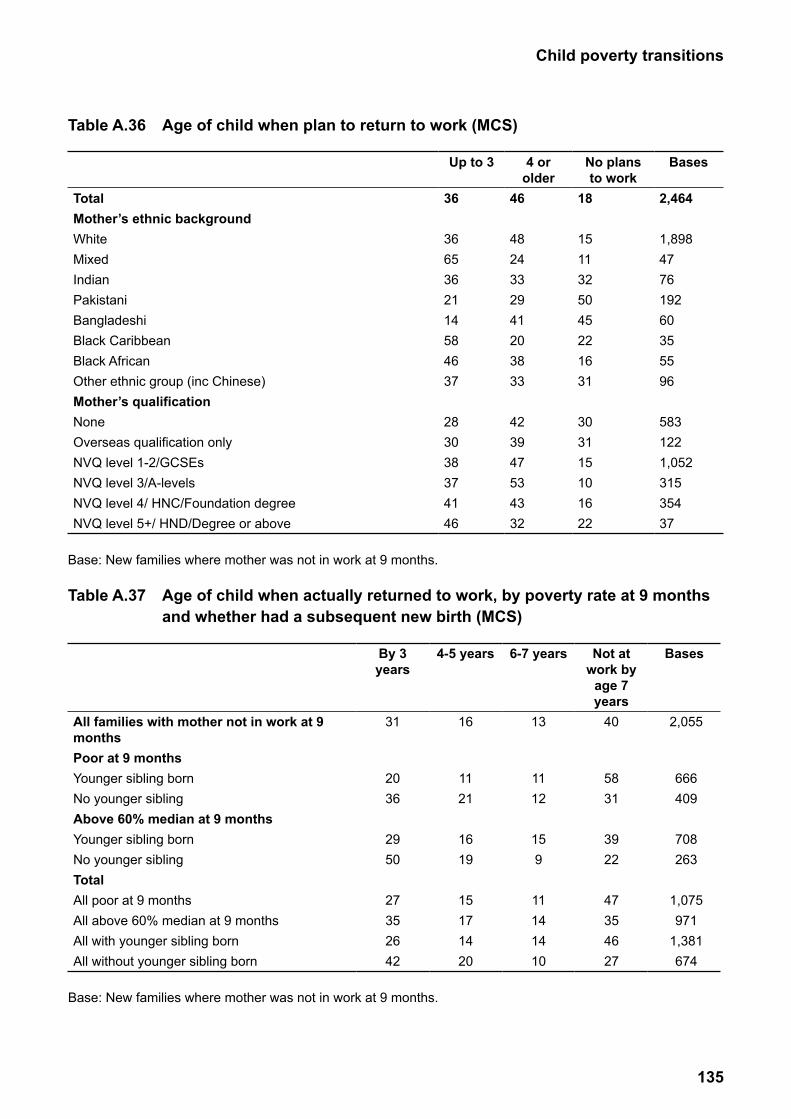
135
Child poverty transitions
Table A.36 Age of child when plan to return to work (MCS)
Up to 3 4 or older
No plans to work
Bases
Total 36 46 18 2,464Mother’s ethnic backgroundWhite 36 48 15 1,898Mixed 65 24 11 47Indian 36 33 32 76Pakistani 21 29 50 192Bangladeshi 14 41 45 60Black Caribbean 58 20 22 35Black African 46 38 16 55Other ethnic group (inc Chinese) 37 33 31 96Mother’s qualificationNone 28 42 30 583Overseas qualification only 30 39 31 122NVQ level 1-2/GCSEs 38 47 15 1,052NVQ level 3/A-levels 37 53 10 315NVQ level 4/ HNC/Foundation degree 41 43 16 354NVQ level 5+/ HND/Degree or above 46 32 22 37
Base: New families where mother was not in work at 9 months.
Table A.37 Age of child when actually returned to work, by poverty rate at 9 months and whether had a subsequent new birth (MCS)
By 3 years
4-5 years 6-7 years Not at work by
age 7 years
Bases
All families with mother not in work at 9 months
31 16 13 40 2,055
Poor at 9 monthsYounger sibling born 20 11 11 58 666 No younger sibling 36 21 12 31 409 Above 60% median at 9 monthsYounger sibling born 29 16 15 39 708 No younger sibling 50 19 9 22 263 TotalAll poor at 9 months 27 15 11 47 1,075 All above 60% median at 9 months 35 17 14 35 971 All with younger sibling born 26 14 14 46 1,381 All without younger sibling born 42 20 10 27 674
Base: New families where mother was not in work at 9 months.
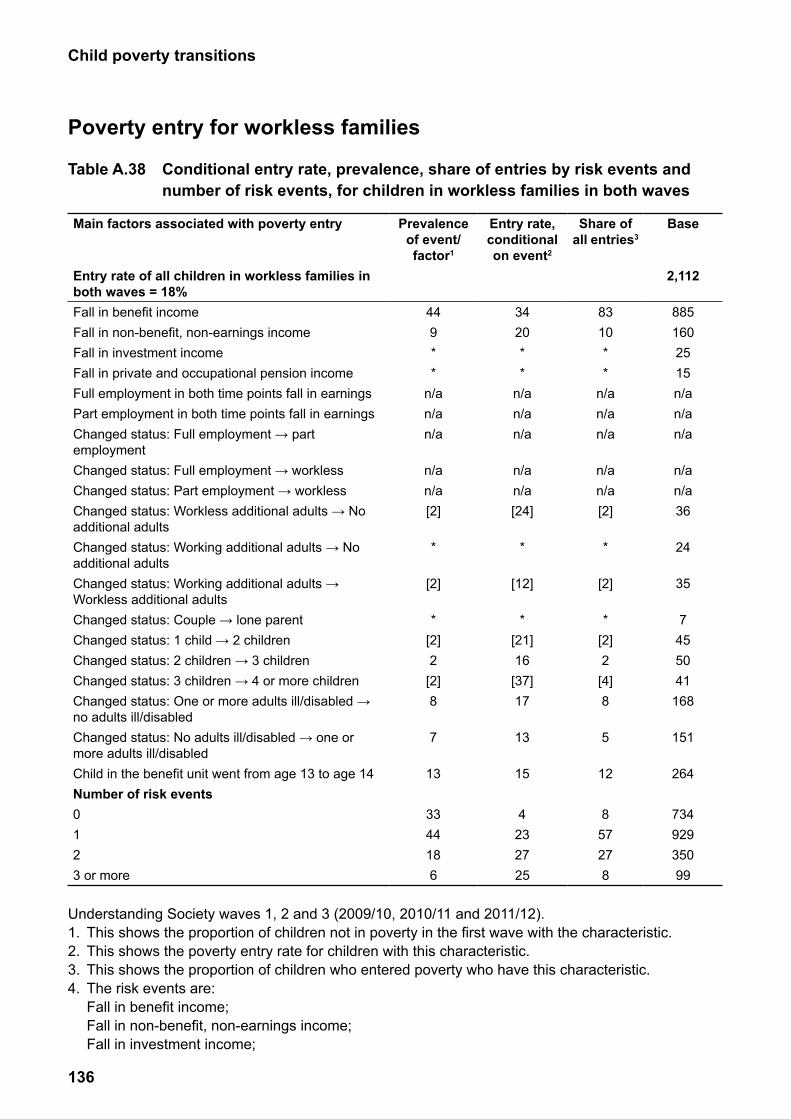
136
Child poverty transitions
Poverty entry for workless families
Table A.38 Conditional entry rate, prevalence, share of entries by risk events and number of risk events, for children in workless families in both waves
Main factors associated with poverty entry Prevalence of event/factor1
Entry rate, conditional on event2
Share of all entries3
Base
Entry rate of all children in workless families in both waves = 18%
2,112
Fall in benefit income 44 34 83 885Fall in non-benefit, non-earnings income 9 20 10 160Fall in investment income * * * 25Fall in private and occupational pension income * * * 15Full employment in both time points fall in earnings n/a n/a n/a n/aPart employment in both time points fall in earnings n/a n/a n/a n/aChanged status: Full employment → part employment
n/a n/a n/a n/a
Changed status: Full employment → workless n/a n/a n/a n/aChanged status: Part employment → workless n/a n/a n/a n/aChanged status: Workless additional adults → No additional adults
[2] [24] [2] 36
Changed status: Working additional adults → No additional adults
* * * 24
Changed status: Working additional adults → Workless additional adults
[2] [12] [2] 35
Changed status: Couple → lone parent * * * 7Changed status: 1 child → 2 children [2] [21] [2] 45Changed status: 2 children → 3 children 2 16 2 50Changed status: 3 children → 4 or more children [2] [37] [4] 41Changed status: One or more adults ill/disabled → no adults ill/disabled
8 17 8 168
Changed status: No adults ill/disabled → one or more adults ill/disabled
7 13 5 151
Child in the benefit unit went from age 13 to age 14 13 15 12 264Number of risk events0 33 4 8 7341 44 23 57 9292 18 27 27 3503 or more 6 25 8 99
Understanding Society waves 1, 2 and 3 (2009/10, 2010/11 and 2011/12).1. This shows the proportion of children not in poverty in the first wave with the characteristic.2. This shows the poverty entry rate for children with this characteristic.3. This shows the proportion of children who entered poverty who have this characteristic.4. The risk events are: Fall in benefit income; Fall in non-benefit, non-earnings income; Fall in investment income;
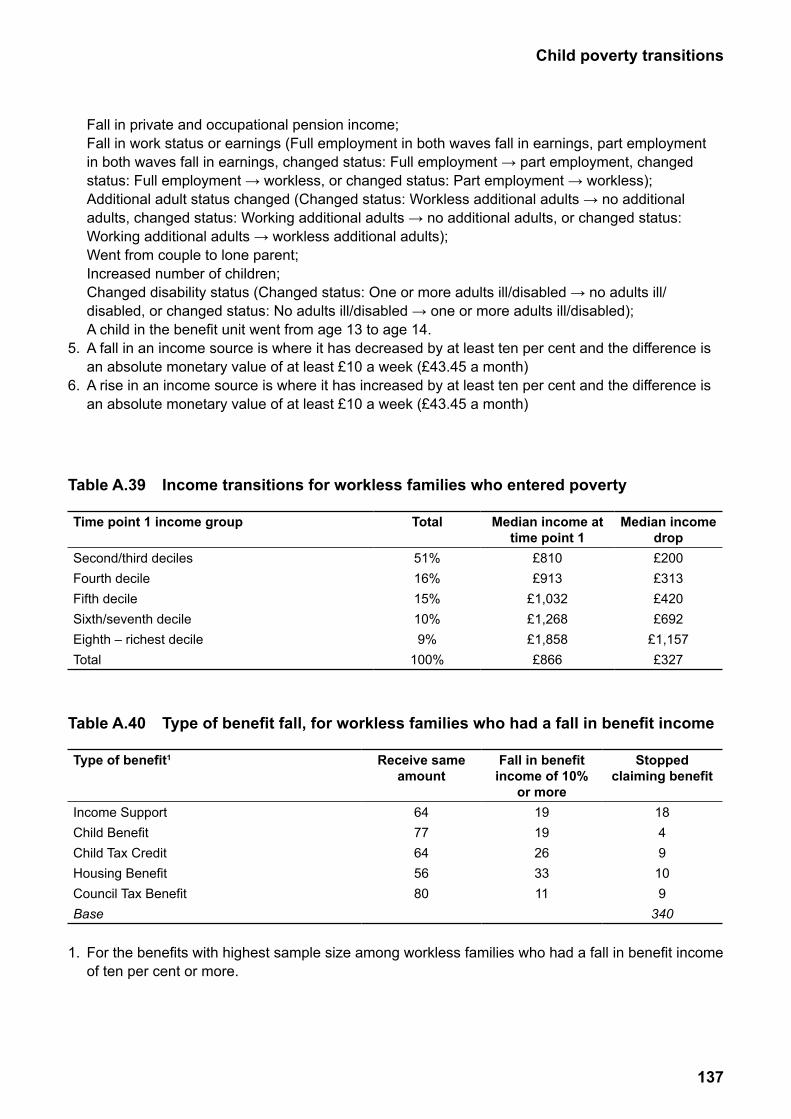
137
Child poverty transitions
Fall in private and occupational pension income; Fall in work status or earnings (Full employment in both waves fall in earnings, part employment
in both waves fall in earnings, changed status: Full employment → part employment, changed status: Full employment → workless, or changed status: Part employment → workless);
Additional adult status changed (Changed status: Workless additional adults → no additional adults, changed status: Working additional adults → no additional adults, or changed status: Working additional adults → workless additional adults);
Went from couple to lone parent; Increased number of children; Changed disability status (Changed status: One or more adults ill/disabled → no adults ill/
disabled, or changed status: No adults ill/disabled → one or more adults ill/disabled); A child in the benefit unit went from age 13 to age 14.5. A fall in an income source is where it has decreased by at least ten per cent and the difference is
an absolute monetary value of at least £10 a week (£43.45 a month)6. A rise in an income source is where it has increased by at least ten per cent and the difference is
an absolute monetary value of at least £10 a week (£43.45 a month)
Table A.39 Income transitions for workless families who entered poverty
Time point 1 income group Total Median income at time point 1
Median income drop
Second/third deciles 51% £810 £200Fourth decile 16% £913 £313Fifth decile 15% £1,032 £420Sixth/seventh decile 10% £1,268 £692Eighth – richest decile 9% £1,858 £1,157Total 100% £866 £327
Table A.40 Type of benefit fall, for workless families who had a fall in benefit income
Type of benefit1 Receive same amount
Fall in benefit income of 10%
or more
Stopped claiming benefit
Income Support 64 19 18Child Benefit 77 19 4Child Tax Credit 64 26 9Housing Benefit 56 33 10Council Tax Benefit 80 11 9Base 340
1. For the benefits with highest sample size among workless families who had a fall in benefit income of ten per cent or more.
138
Child poverty transitions
Children in workless families were also disproportionately at risk of entering poverty. One in five children were living in workless families and a certain level of worklessness is inevitable given that some lone parent families will have young children, and some parents will have disabilities or long-term health conditions. But being workless does not necessarily mean having a constant income and for some families a reduction in income means slipping into poverty.
Table A39 illustrates the income transitions made by children whose families remained workless. On average income fell by around £325 per month, so significantly lower than for families in work (whose incomes fell by around £500 per month on average, see previous section). Given the limited amount of income that benefits can provide, these families were also more likely than working families to be closer to the poverty line both before and after the poverty transition.
Table A40 shows which benefits were most likely to cause this fall in benefit income. A third of this group reported a fall in Housing Benefit, while a quarter reported a fall in Child Tax Credit and 19 per cent reported falls in Income Support and Child Benefit. Some families reported that they had stopped claiming the benefit, with 18 per cent of these workless families no longer reporting receipt of Income Support. There are a number of potential reasons for receipt of these benefits either falling or stopping among workless households. These include changes to the household type, change in number of children in the household, moving to a different benefit (for example, moving from Income Support to Jobseeker’s Allowance), moving house, stopping a benefit claim due to change in circumstances and not reclaiming (for example, stopping receiving Income Support due to a period of employment between waves and not taking up the benefit once out-of-work again), and misreporting of benefit receipt in either of the interviews. Tax credits are dependent on recipients promptly informing Her Majesty’s Revenue and Customs of any change in their circumstances, otherwise overpayments or underpayments may occur, resulting in changes in amount received a while after the recipients change in situation55.
55 www.adviceguide.org.uk/b_overpayment_of_tax_credits.pdf
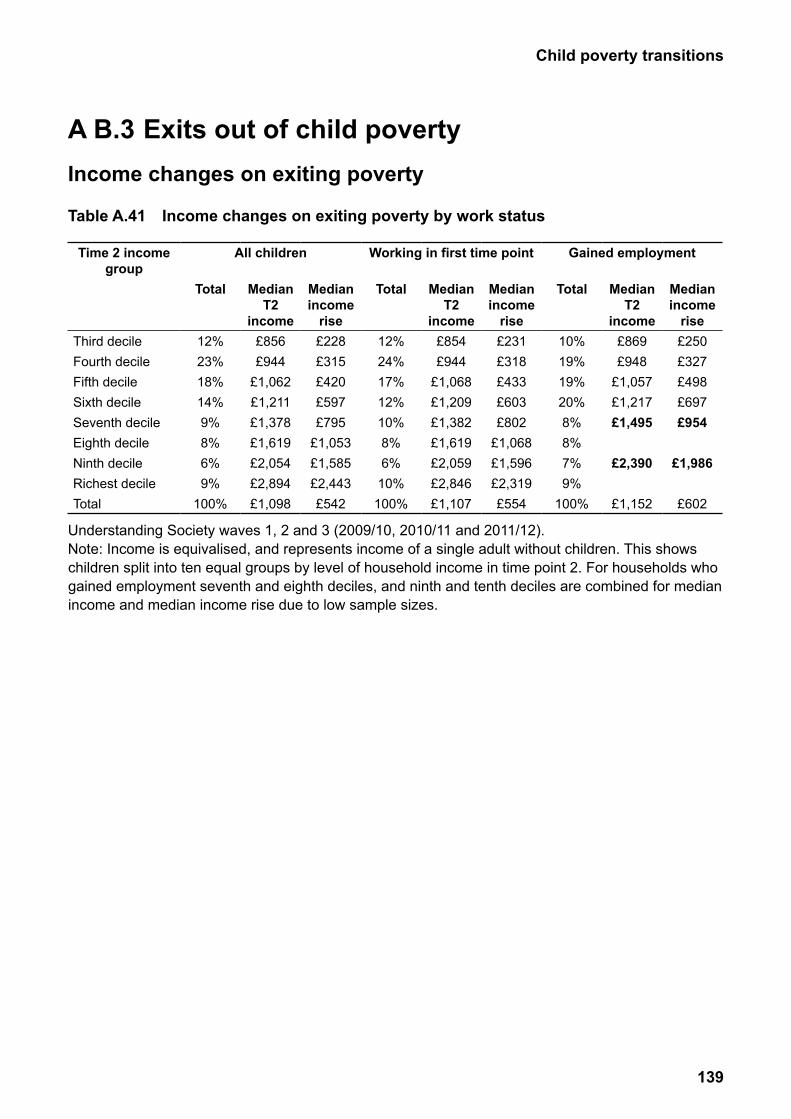
139
Child poverty transitions
A B.3 Exits out of child poverty Income changes on exiting poverty
Table A.41 Income changes on exiting poverty by work status
Time 2 income group
All children Working in first time point Gained employment
Total Median T2
income
Median income
rise
Total Median T2
income
Median income
rise
Total Median T2
income
Median income
riseThird decile 12% £856 £228 12% £854 £231 10% £869 £250Fourth decile 23% £944 £315 24% £944 £318 19% £948 £327Fifth decile 18% £1,062 £420 17% £1,068 £433 19% £1,057 £498Sixth decile 14% £1,211 £597 12% £1,209 £603 20% £1,217 £697Seventh decile 9% £1,378 £795 10% £1,382 £802 8% £1,495 £954Eighth decile 8% £1,619 £1,053 8% £1,619 £1,068 8%Ninth decile 6% £2,054 £1,585 6% £2,059 £1,596 7% £2,390 £1,986Richest decile 9% £2,894 £2,443 10% £2,846 £2,319 9%Total 100% £1,098 £542 100% £1,107 £554 100% £1,152 £602
Understanding Society waves 1, 2 and 3 (2009/10, 2010/11 and 2011/12).Note: Income is equivalised, and represents income of a single adult without children. This shows children split into ten equal groups by level of household income in time point 2. For households who gained employment seventh and eighth deciles, and ninth and tenth deciles are combined for median income and median income rise due to low sample sizes.
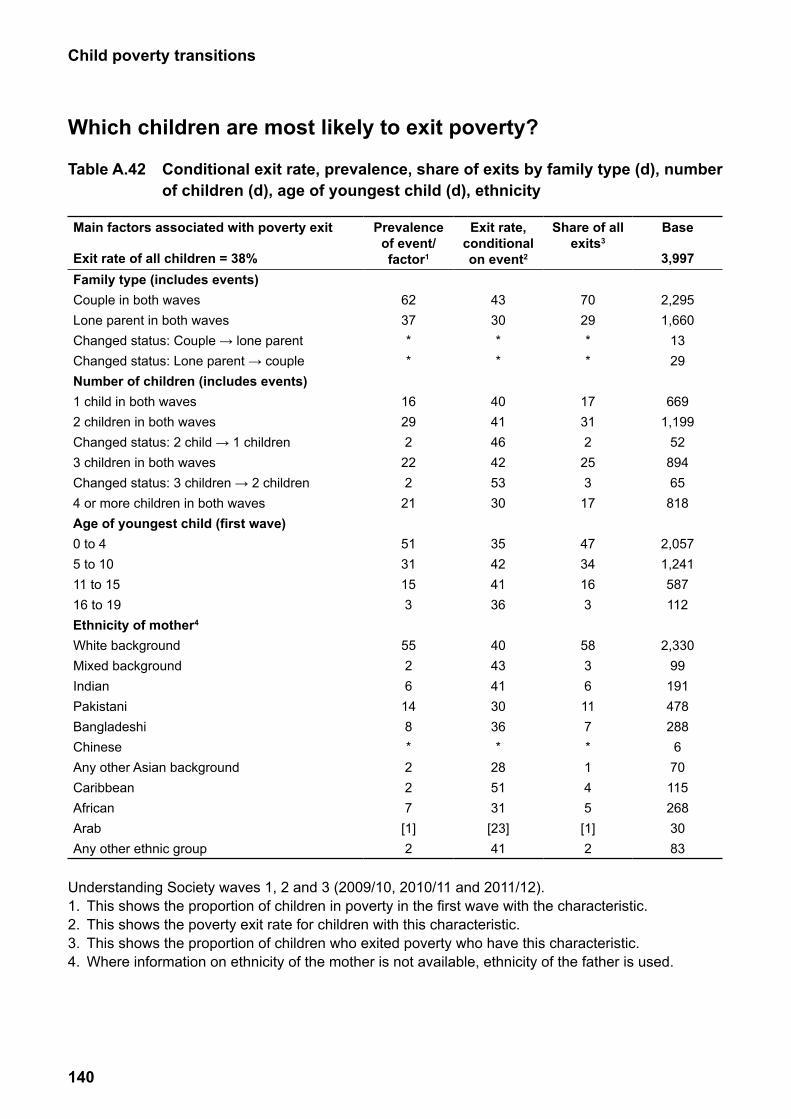
140
Child poverty transitions
Which children are most likely to exit poverty?
Table A.42 Conditional exit rate, prevalence, share of exits by family type (d), number of children (d), age of youngest child (d), ethnicity
Main factors associated with poverty exit
Exit rate of all children = 38%
Prevalence of event/factor1
Exit rate, conditional on event2
Share of all exits3
Base
3,997Family type (includes events)Couple in both waves 62 43 70 2,295Lone parent in both waves 37 30 29 1,660Changed status: Couple → lone parent * * * 13Changed status: Lone parent → couple * * * 29Number of children (includes events)1 child in both waves 16 40 17 6692 children in both waves 29 41 31 1,199Changed status: 2 child → 1 children 2 46 2 523 children in both waves 22 42 25 894Changed status: 3 children → 2 children 2 53 3 654 or more children in both waves 21 30 17 818Age of youngest child (first wave)0 to 4 51 35 47 2,0575 to 10 31 42 34 1,24111 to 15 15 41 16 58716 to 19 3 36 3 112Ethnicity of mother4
White background 55 40 58 2,330Mixed background 2 43 3 99Indian 6 41 6 191Pakistani 14 30 11 478Bangladeshi 8 36 7 288Chinese * * * 6Any other Asian background 2 28 1 70Caribbean 2 51 4 115African 7 31 5 268Arab [1] [23] [1] 30Any other ethnic group 2 41 2 83
Understanding Society waves 1, 2 and 3 (2009/10, 2010/11 and 2011/12).1. This shows the proportion of children in poverty in the first wave with the characteristic.2. This shows the poverty exit rate for children with this characteristic.3. This shows the proportion of children who exited poverty who have this characteristic.4. Where information on ethnicity of the mother is not available, ethnicity of the father is used.
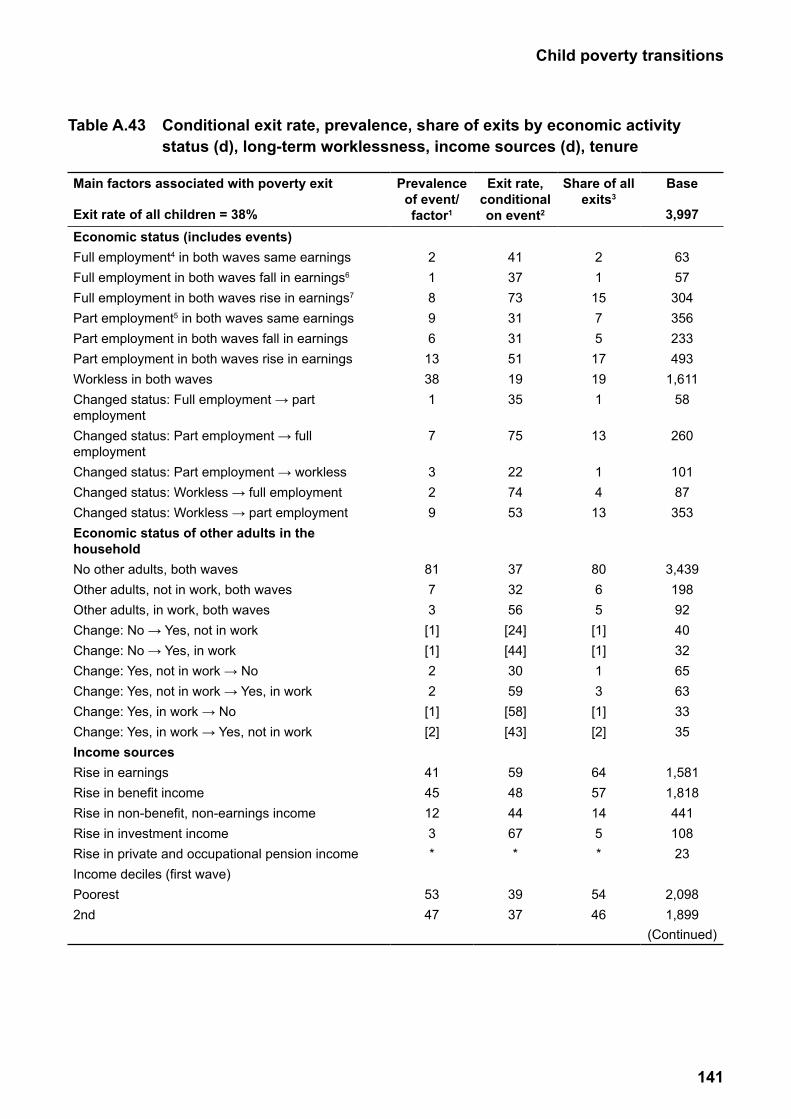
141
Child poverty transitions
Table A.43 Conditional exit rate, prevalence, share of exits by economic activity status (d), long-term worklessness, income sources (d), tenure
Main factors associated with poverty exit
Exit rate of all children = 38%
Prevalence of event/factor1
Exit rate, conditional on event2
Share of all exits3
Base
3,997Economic status (includes events)Full employment4 in both waves same earnings 2 41 2 63Full employment in both waves fall in earnings6 1 37 1 57Full employment in both waves rise in earnings7 8 73 15 304Part employment5 in both waves same earnings 9 31 7 356Part employment in both waves fall in earnings 6 31 5 233Part employment in both waves rise in earnings 13 51 17 493Workless in both waves 38 19 19 1,611Changed status: Full employment → part 1 35 1 58employmentChanged status: Part employment → full 7 75 13 260employmentChanged status: Part employment → workless 3 22 1 101Changed status: Workless → full employment 2 74 4 87Changed status: Workless → part employment 9 53 13 353Economic status of other adults in the householdNo other adults, both waves 81 37 80 3,439Other adults, not in work, both waves 7 32 6 198Other adults, in work, both waves 3 56 5 92Change: No → Yes, not in work [1] [24] [1] 40Change: No → Yes, in work [1] [44] [1] 32Change: Yes, not in work → No 2 30 1 65Change: Yes, not in work → Yes, in work 2 59 3 63Change: Yes, in work → No [1] [58] [1] 33Change: Yes, in work → Yes, not in work [2] [43] [2] 35Income sourcesRise in earnings 41 59 64 1,581Rise in benefit income 45 48 57 1,818Rise in non-benefit, non-earnings income 12 44 14 441Rise in investment income 3 67 5 108Rise in private and occupational pension income * * * 23Income deciles (first wave)Poorest 53 39 54 2,0982nd 47 37 46 1,899
(Continued)
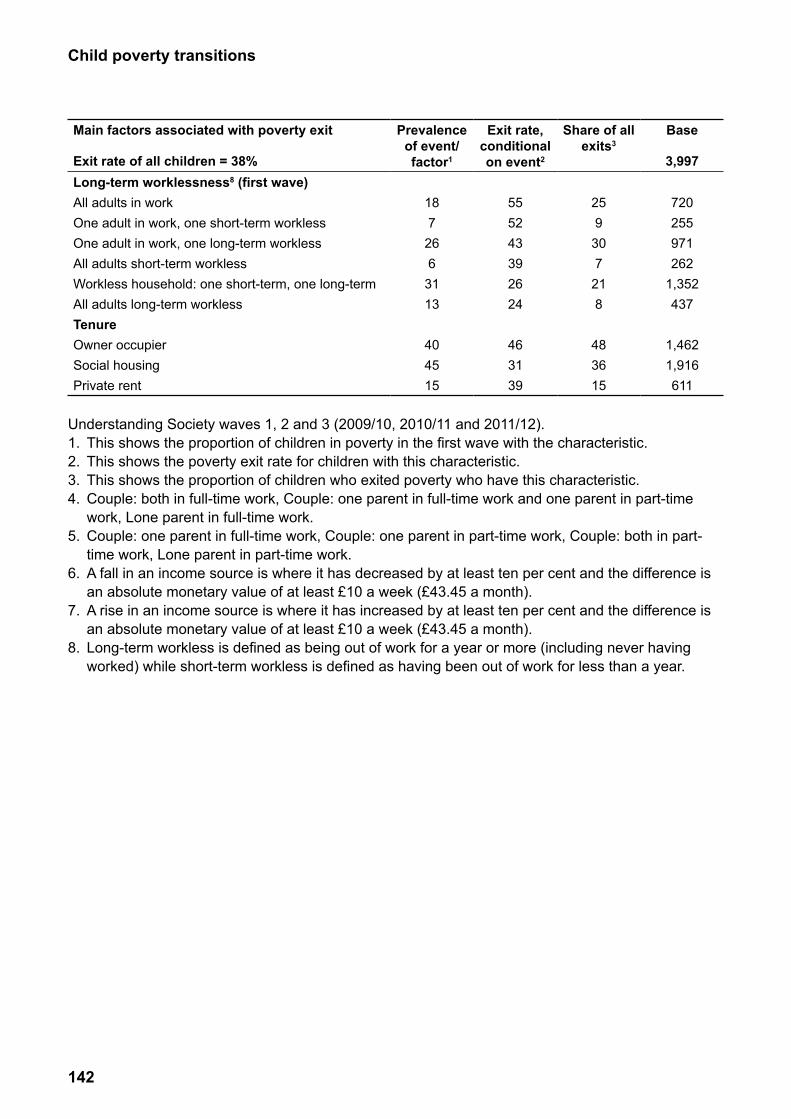
142
Child poverty transitions
Main factors associated with poverty exit
Exit rate of all children = 38%
Prevalence of event/factor1
Exit rate, conditional on event2
Share of all exits3
Base
3,997Long-term worklessness8 (first wave)All adults in work 18 55 25 720One adult in work, one short-term workless 7 52 9 255One adult in work, one long-term workless 26 43 30 971All adults short-term workless 6 39 7 262Workless household: one short-term, one long-term 31 26 21 1,352All adults long-term workless 13 24 8 437TenureOwner occupier 40 46 48 1,462Social housing 45 31 36 1,916Private rent 15 39 15 611
Understanding Society waves 1, 2 and 3 (2009/10, 2010/11 and 2011/12).1. Thisshowstheproportionofchildreninpovertyinthefirstwavewiththecharacteristic.2. This shows the poverty exit rate for children with this characteristic.3. This shows the proportion of children who exited poverty who have this characteristic.4. Couple: both in full-time work, Couple: one parent in full-time work and one parent in part-time
work, Lone parent in full-time work.5. Couple: one parent in full-time work, Couple: one parent in part-time work, Couple: both in part-
time work, Lone parent in part-time work.6. A fall in an income source is where it has decreased by at least ten per cent and the difference is
an absolute monetary value of at least £10 a week (£43.45 a month).7. A rise in an income source is where it has increased by at least ten per cent and the difference is
an absolute monetary value of at least £10 a week (£43.45 a month).8. Long-termworklessisdefinedasbeingoutofworkforayearormore(includingneverhaving
worked)whileshort-termworklessisdefinedashavingbeenoutofworkforlessthanayear.
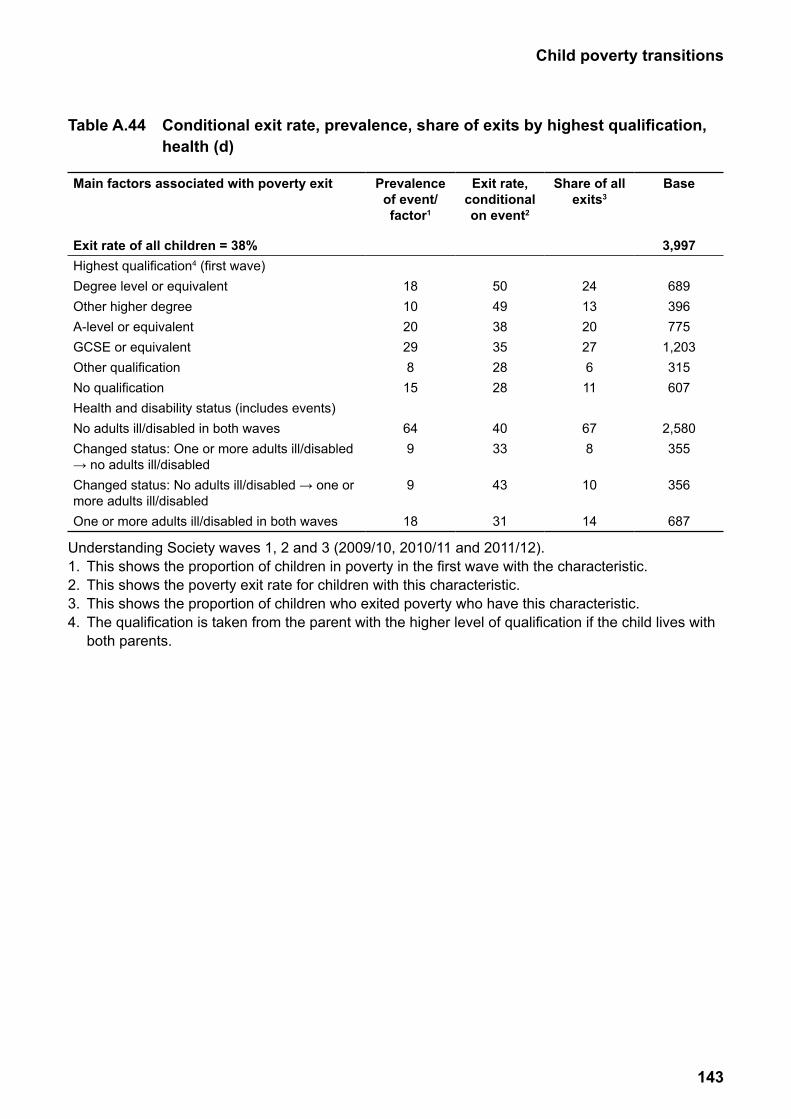
143
Child poverty transitions
Table A.44 Conditional exit rate, prevalence, share of exits by highest qualification, health (d)
Main factors associated with poverty exit Prevalence Exit rate, Share of all Baseof event/ conditional exits3
factor1 on event2
Exit rate of all children = 38% 3,997Highest qualification4 (first wave)Degree level or equivalent 18 50 24 689Other higher degree 10 49 13 396A-level or equivalent 20 38 20 775GCSE or equivalent 29 35 27 1,203Other qualification 8 28 6 315No qualification 15 28 11 607Health and disability status (includes events)No adults ill/disabled in both waves 64 40 67 2,580Changed status: One or more adults ill/disabled 9 33 8 355→noadultsill/disabledChangedstatus:Noadultsill/disabled→oneor 9 43 10 356more adults ill/disabledOne or more adults ill/disabled in both waves 18 31 14 687
Understanding Society waves 1, 2 and 3 (2009/10, 2010/11 and 2011/12).1. Thisshowstheproportionofchildreninpovertyinthefirstwavewiththecharacteristic.2. This shows the poverty exit rate for children with this characteristic.3. This shows the proportion of children who exited poverty who have this characteristic.4. Thequalificationistakenfromtheparentwiththehigherlevelofqualificationifthechildliveswith
both parents.
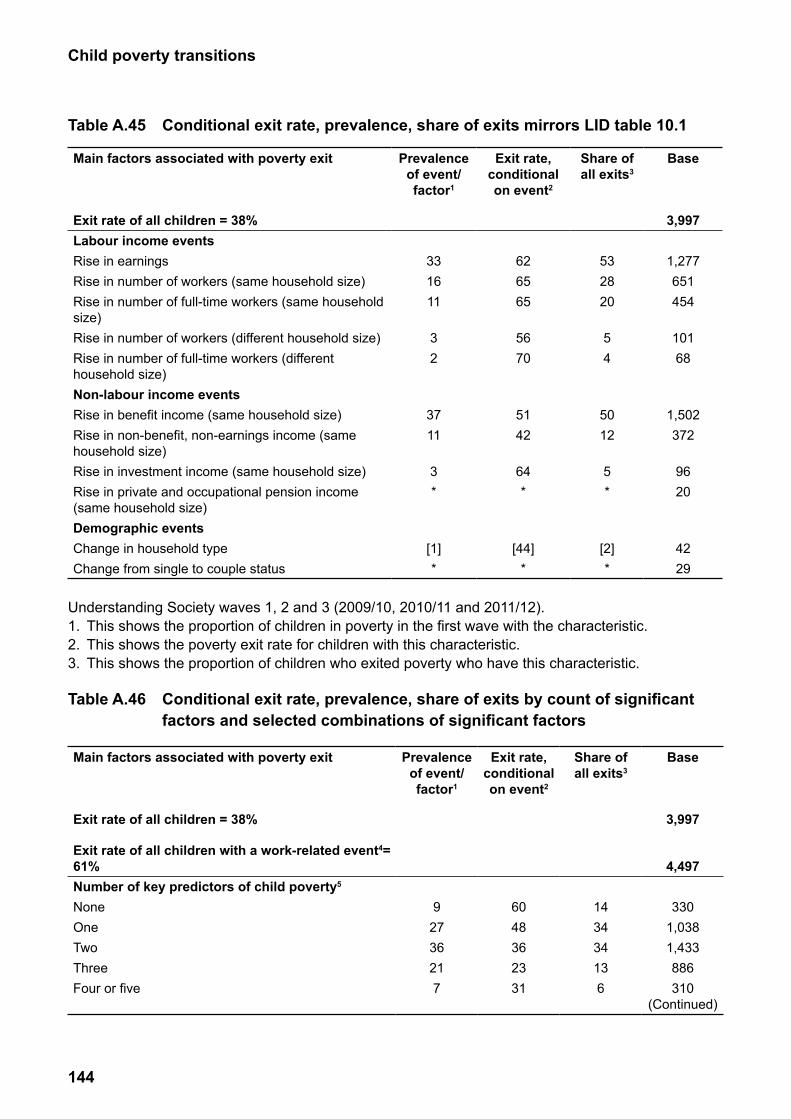
144
Child poverty transitions
Table A.45 Conditional exit rate, prevalence, share of exits mirrors LID table 10.1
Main factors associated with poverty exit Prevalence Exit rate, Share of Baseof event/ conditional all exits3
factor1 on event2
Exit rate of all children = 38% 3,997Labour income eventsRise in earnings 33 62 53 1,277Rise in number of workers (same household size) 16 65 28 651Rise in number of full-time workers (same household 11 65 20 454size)Rise in number of workers (different household size) 3 56 5 101Rise in number of full-time workers (different 2 70 4 68household size)Non-labour income eventsRise in benefit income (same household size) 37 51 50 1,502Rise in non-benefit, non-earnings income (same 11 42 12 372household size)Rise in investment income (same household size) 3 64 5 96Rise in private and occupational pension income * * * 20(same household size)Demographic eventsChange in household type [1] [44] [2] 42Change from single to couple status * * * 29
Understanding Society waves 1, 2 and 3 (2009/10, 2010/11 and 2011/12).1. This shows the proportion of children in poverty in the first wave with the characteristic.2. This shows the poverty exit rate for children with this characteristic.3. This shows the proportion of children who exited poverty who have this characteristic.
Table A.46 Conditional exit rate, prevalence, share of exits by count of significant factors and selected combinations of significant factors
Main factors associated with poverty exit Prevalence Exit rate, Share of Baseof event/ conditional all exits3
factor1 on event2
Exit rate of all children = 38% 3,997
Exit rate of all children with a work-related event4= 61% 4,497Number of key predictors of child poverty5
None 9 60 14 330One 27 48 34 1,038Two 36 36 34 1,433Three 21 23 13 886Four or five 7 31 6 310
(Continued)
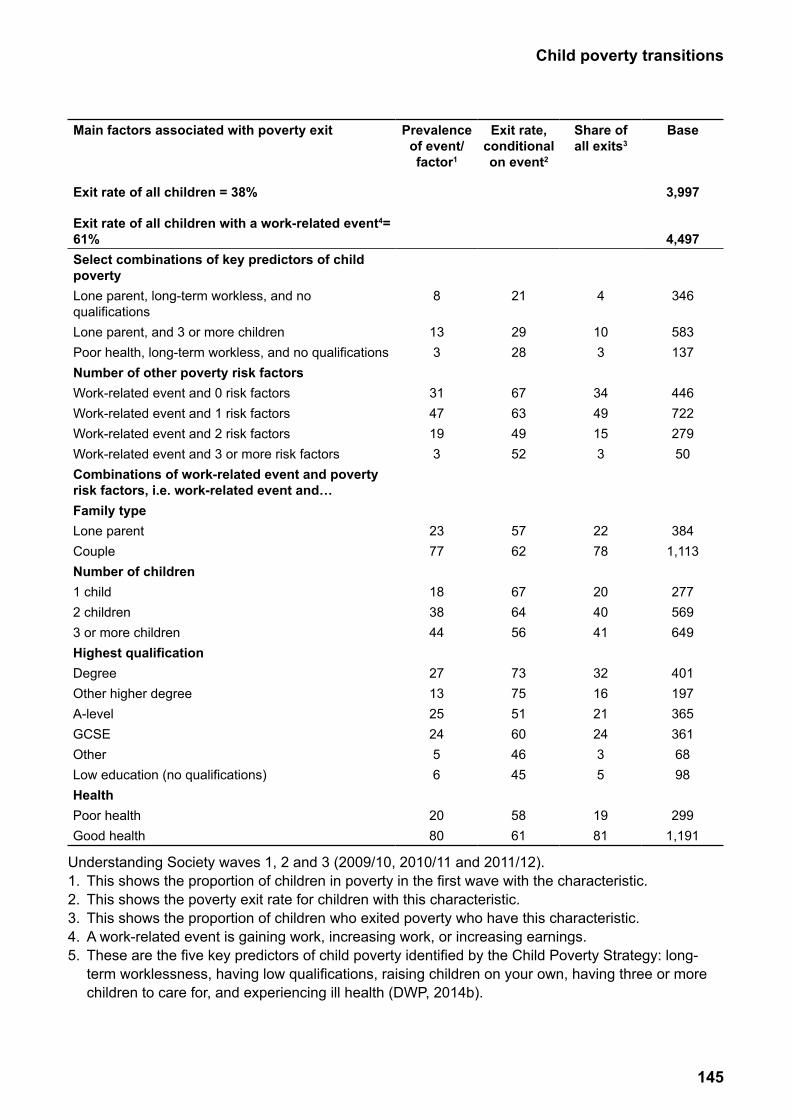
145
Child poverty transitions
Main factors associated with poverty exit
Exit rate of all children = 38%
Exit rate of all children with a work-related event4= 61%
Prevalence of event/factor1
Exit rate, conditional on event2
Share of all exits3
Base
3,997
4,497
Select combinations of key predictors of child povertyLone parent, long-term workless, and no qualifications
8 21 4 346
Lone parent, and 3 or more children 13 29 10 583Poor health, long-term workless, and no qualifications 3 28 3 137Number of other poverty risk factorsWork-related event and 0 risk factors 31 67 34 446Work-related event and 1 risk factors 47 63 49 722Work-related event and 2 risk factors 19 49 15 279Work-related event and 3 or more risk factors 3 52 3 50Combinations of work-related event and poverty risk factors, i.e. work-related event and…Family typeLone parent 23 57 22 384Couple 77 62 78 1,113Number of children1 child 18 67 20 2772 children 38 64 40 5693 or more children 44 56 41 649Highest qualificationDegree 27 73 32 401Other higher degree 13 75 16 197A-level 25 51 21 365GCSE 24 60 24 361Other 5 46 3 68Low education (no qualifications) 6 45 5 98HealthPoor health 20 58 19 299Good health 80 61 81 1,191
Understanding Society waves 1, 2 and 3 (2009/10, 2010/11 and 2011/12).1. This shows the proportion of children in poverty in the first wave with the characteristic.2. This shows the poverty exit rate for children with this characteristic.3. This shows the proportion of children who exited poverty who have this characteristic.4. A work-related event is gaining work, increasing work, or increasing earnings.5. These are the five key predictors of child poverty identified by the Child Poverty Strategy: long-
term worklessness, having low qualifications, raising children on your own, having three or more children to care for, and experiencing ill health (DWP, 2014b).
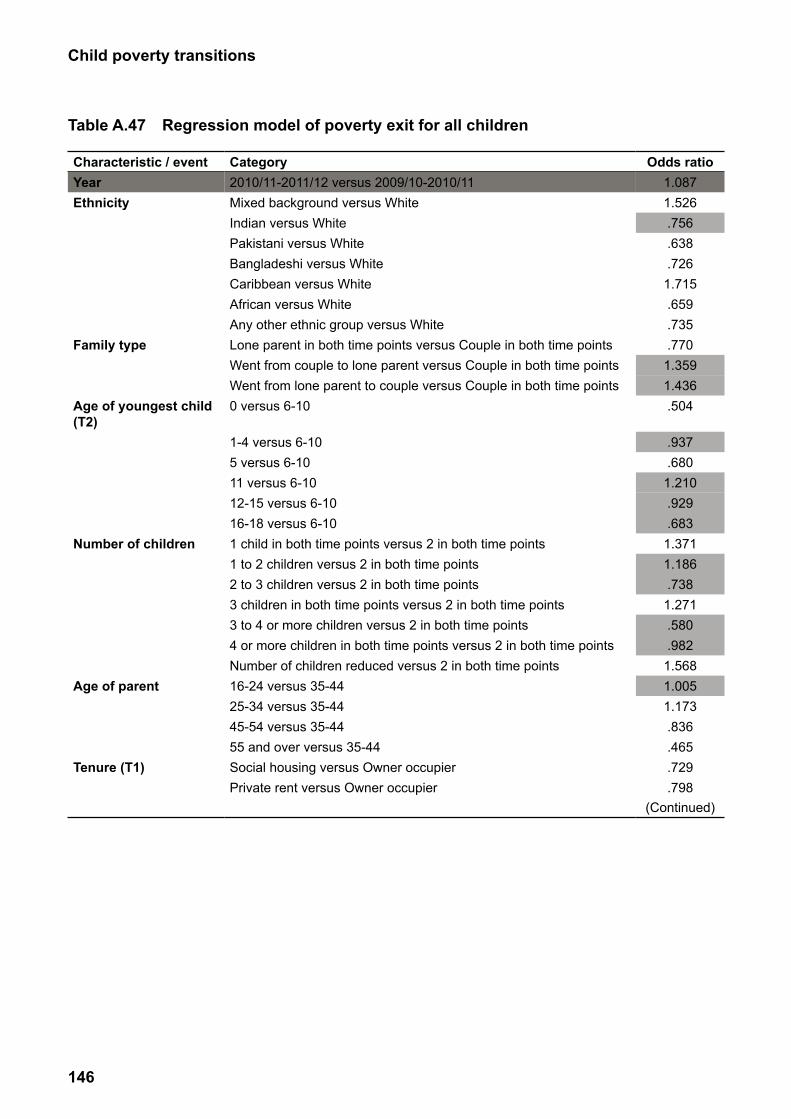
146
Child poverty transitions
Table A.47 Regression model of poverty exit for all children
Characteristic / event Category Odds ratioYear 2010/11-2011/12 versus 2009/10-2010/11 1.087Ethnicity Mixed background versus White 1.526
Indian versus White .756Pakistani versus White .638Bangladeshi versus White .726Caribbean versus White 1.715African versus White .659Any other ethnic group versus White .735
Family type Lone parent in both time points versus Couple in both time points .770Went from couple to lone parent versus Couple in both time points 1.359Went from lone parent to couple versus Couple in both time points 1.436
Age of youngest child (T2)
0 versus 6-10 .504
1-4 versus 6-10 .9375 versus 6-10 .68011 versus 6-10 1.21012-15 versus 6-10 .92916-18 versus 6-10 .683
Number of children 1 child in both time points versus 2 in both time points 1.3711 to 2 children versus 2 in both time points 1.1862 to 3 children versus 2 in both time points .7383 children in both time points versus 2 in both time points 1.2713 to 4 or more children versus 2 in both time points .5804 or more children in both time points versus 2 in both time points .982Number of children reduced versus 2 in both time points 1.568
Age of parent 16-24 versus 35-44 1.00525-34 versus 35-44 1.17345-54 versus 35-44 .83655 and over versus 35-44 .465
Tenure (T1) Social housing versus Owner occupier .729Private rent versus Owner occupier .798
(Continued)
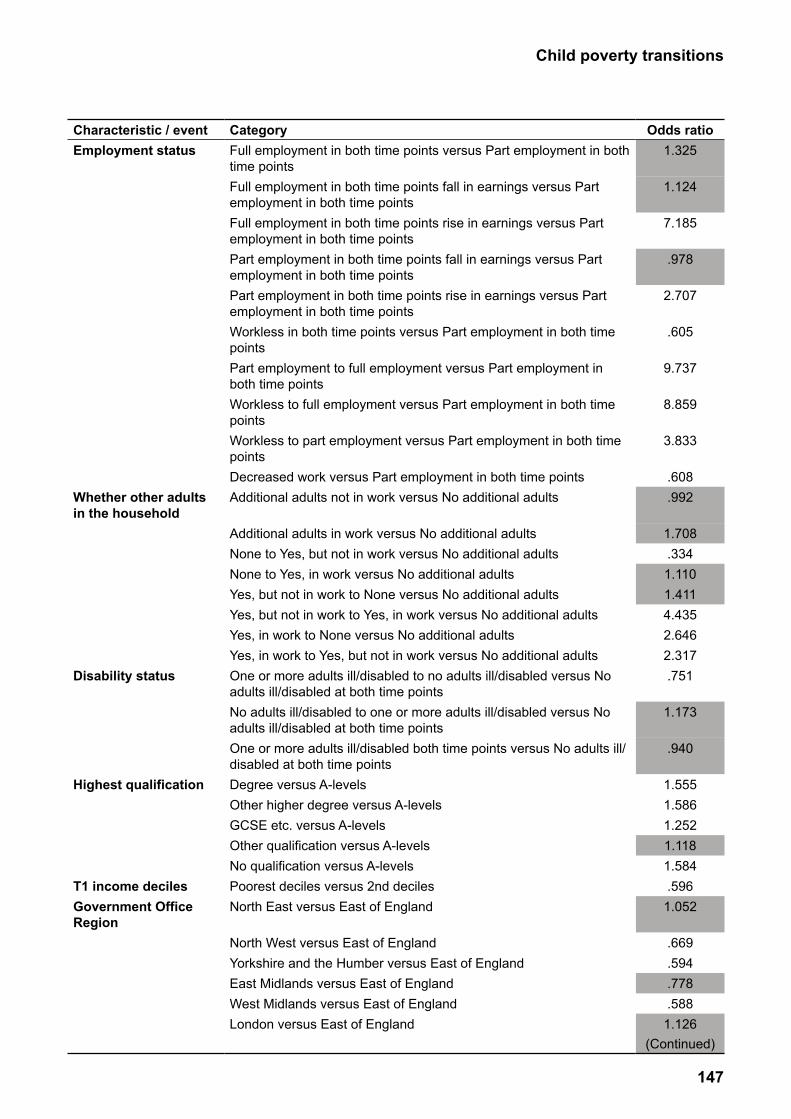
147
Child poverty transitions
Characteristic / event Category Odds ratioEmployment status Full employment in both time points versus Part employment in both 1.325
time pointsFull employment in both time points fall in earnings versus Part 1.124employment in both time pointsFull employment in both time points rise in earnings versus Part 7.185employment in both time pointsPart employment in both time points fall in earnings versus Part .978employment in both time pointsPart employment in both time points rise in earnings versus Part 2.707employment in both time pointsWorkless in both time points versus Part employment in both time .605pointsPart employment to full employment versus Part employment in 9.737both time pointsWorkless to full employment versus Part employment in both time 8.859pointsWorkless to part employment versus Part employment in both time 3.833pointsDecreased work versus Part employment in both time points .608
Whether other adults Additional adults not in work versus No additional adults .992in the household
Additional adults in work versus No additional adults 1.708None to Yes, but not in work versus No additional adults .334None to Yes, in work versus No additional adults 1.110Yes, but not in work to None versus No additional adults 1.411Yes, but not in work to Yes, in work versus No additional adults 4.435Yes, in work to None versus No additional adults 2.646Yes, in work to Yes, but not in work versus No additional adults 2.317
Disability status One or more adults ill/disabled to no adults ill/disabled versus No .751adults ill/disabled at both time pointsNo adults ill/disabled to one or more adults ill/disabled versus No 1.173adults ill/disabled at both time pointsOne or more adults ill/disabled both time points versus No adults ill/ .940disabled at both time points
Highest qualification Degree versus A-levels 1.555Other higher degree versus A-levels 1.586GCSE etc. versus A-levels 1.252Other qualification versus A-levels 1.118No qualification versus A-levels 1.584
T1 income deciles Poorest deciles versus 2nd deciles .596Government Office North East versus East of England 1.052Region
North West versus East of England .669Yorkshire and the Humber versus East of England .594East Midlands versus East of England .778West Midlands versus East of England .588London versus East of England 1.126
(Continued)
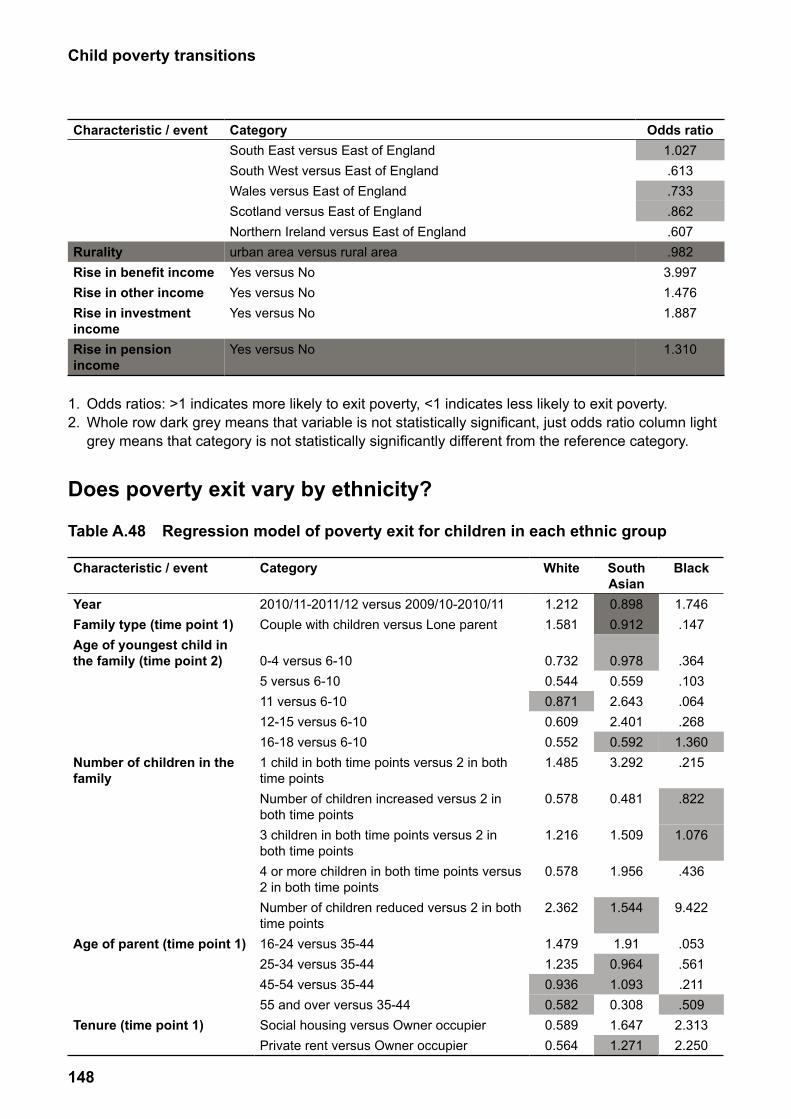
148
Child poverty transitions
Characteristic / event Category Odds ratioSouth East versus East of England 1.027South West versus East of England .613Wales versus East of England .733Scotland versus East of England .862Northern Ireland versus East of England .607
Rurality urban area versus rural area .982Rise in benefit income Yes versus No 3.997Rise in other income Yes versus No 1.476Rise in investment Yes versus No 1.887incomeRise in pension income
Yes versus No 1.310
1. Odds ratios: >1 indicates more likely to exit poverty, <1 indicates less likely to exit poverty.2.Wholerowdarkgreymeansthatvariableisnotstatisticallysignificant,justoddsratiocolumnlight
greymeansthatcategoryisnotstatisticallysignificantlydifferentfromthereferencecategory.
Does poverty exit vary by ethnicity?
Table A.48 Regression model of poverty exit for children in each ethnic group
Characteristic / event Category White South Asian
Black
Year 2010/11-2011/12 versus 2009/10-2010/11 1.212 0.898 1.746Family type (time point 1) Couple with children versus Lone parent 1.581 0.912 .147Age of youngest child in the family (time point 2) 0-4 versus 6-10 0.732 0.978 .364
5 versus 6-10 0.544 0.559 .10311 versus 6-10 0.871 2.643 .06412-15 versus 6-10 0.609 2.401 .26816-18 versus 6-10 0.552 0.592 1.360
Number of children in the 1 child in both time points versus 2 in both 1.485 3.292 .215family time points
Number of children increased versus 2 in 0.578 0.481 .822both time points3 children in both time points versus 2 in both time points
1.216 1.509 1.076
4 or more children in both time points versus 2 in both time points
0.578 1.956 .436
Number of children reduced versus 2 in both 2.362 1.544 9.422time points
Age of parent (time point 1) 16-24 versus 35-44 1.479 1.91 .05325-34 versus 35-44 1.235 0.964 .56145-54 versus 35-44 0.936 1.093 .21155 and over versus 35-44 0.582 0.308 .509
Tenure (time point 1) Social housing versus Owner occupier 0.589 1.647 2.313Private rent versus Owner occupier 0.564 1.271 2.250
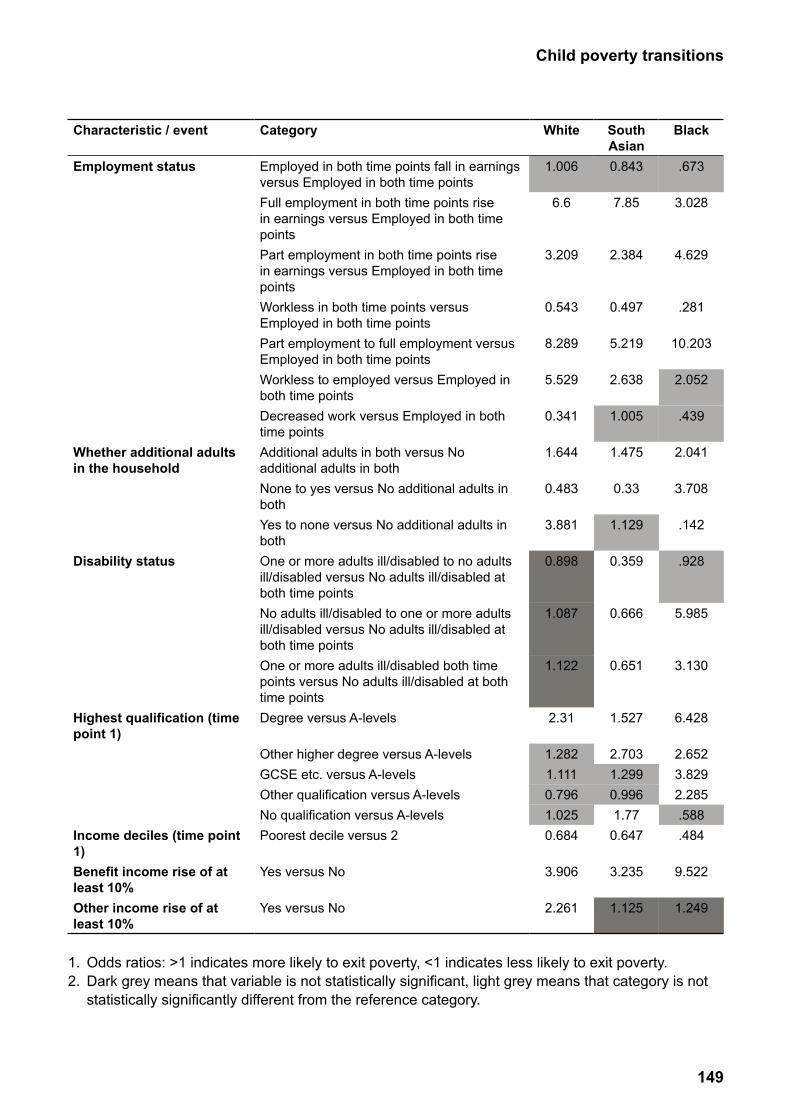
149
Child poverty transitions
Characteristic / event Category White South Asian
Black
Employment status Employed in both time points fall in earnings 1.006 0.843 .673versus Employed in both time pointsFull employment in both time points rise in earnings versus Employed in both time points
6.6 7.85 3.028
Part employment in both time points rise in earnings versus Employed in both time points
3.209 2.384 4.629
Workless in both time points versus Employed in both time points
0.543 0.497 .281
Part employment to full employment versus Employed in both time points
8.289 5.219 10.203
Workless to employed versus Employed in both time points
5.529 2.638 2.052
Decreased work versus Employed in both time points
0.341 1.005 .439
Whether additional adults Additional adults in both versus No 1.644 1.475 2.041in the household additional adults in both
None to yes versus No additional adults in both
0.483 0.33 3.708
Yes to none versus No additional adults in 3.881 1.129 .142both
Disability status One or more adults ill/disabled to no adults 0.898 0.359 .928ill/disabled versus No adults ill/disabled at both time pointsNo adults ill/disabled to one or more adults ill/disabled versus No adults ill/disabled at both time points
1.087 0.666 5.985
One or more adults ill/disabled both time points versus No adults ill/disabled at both time points
1.122 0.651 3.130
Highest qualification (time Degree versus A-levels 2.31 1.527 6.428point 1)
Other higher degree versus A-levels 1.282 2.703 2.652GCSE etc. versus A-levels 1.111 1.299 3.829Other qualification versus A-levels 0.796 0.996 2.285No qualification versus A-levels 1.025 1.77 .588
Income deciles (time point Poorest decile versus 2 0.684 0.647 .4841)Benefit income rise of at Yes versus No 3.906 3.235 9.522least 10%Other income rise of at Yes versus No 2.261 1.125 1.249least 10%
1. Odds ratios: >1 indicates more likely to exit poverty, <1 indicates less likely to exit poverty.2. Dark grey means that variable is not statistically significant, light grey means that category is not
statistically significantly different from the reference category.
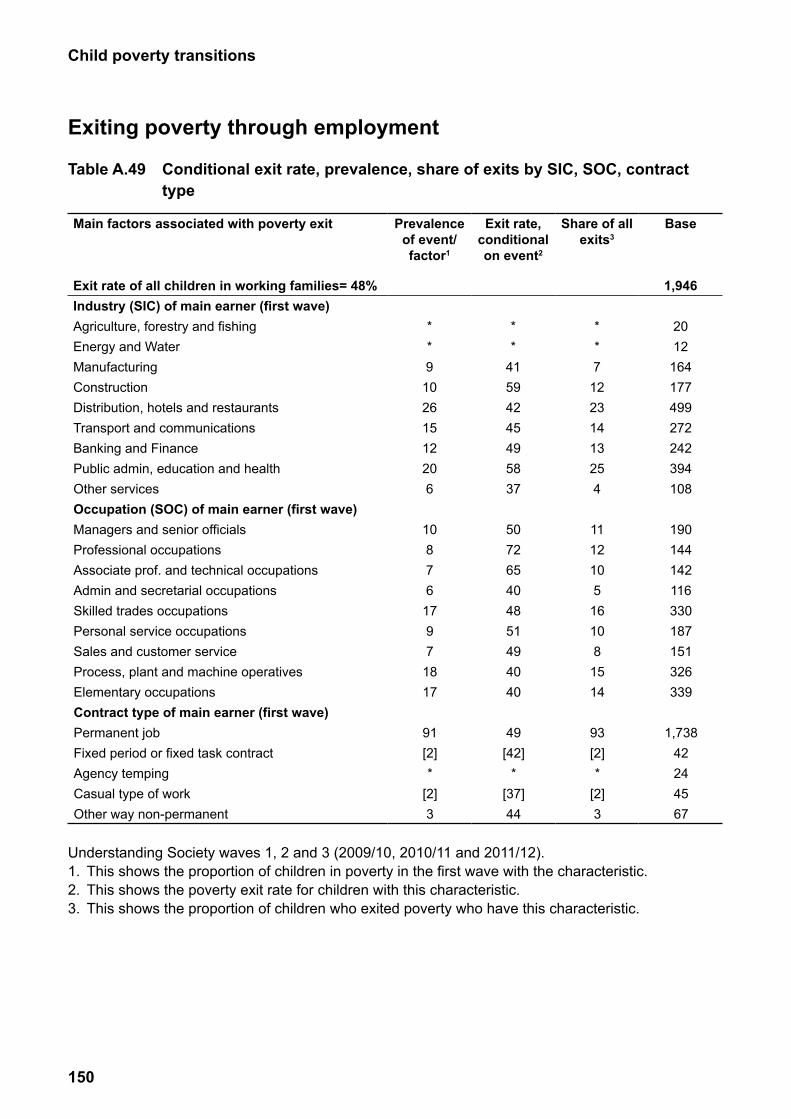
150
Child poverty transitions
Exiting poverty through employment
Table A.49 Conditional exit rate, prevalence, share of exits by SIC, SOC, contract type
Main factors associated with poverty exit Prevalence Exit rate, Share of all Baseof event/ conditional exits3
factor1 on event2
Exit rate of all children in working families= 48% 1,946Industry (SIC) of main earner (first wave)Agriculture, forestry and fishing * * * 20Energy and Water * * * 12Manufacturing 9 41 7 164Construction 10 59 12 177Distribution, hotels and restaurants 26 42 23 499Transport and communications 15 45 14 272Banking and Finance 12 49 13 242Public admin, education and health 20 58 25 394Other services 6 37 4 108Occupation (SOC) of main earner (first wave)Managers and senior officials 10 50 11 190Professional occupations 8 72 12 144Associate prof. and technical occupations 7 65 10 142Admin and secretarial occupations 6 40 5 116Skilled trades occupations 17 48 16 330Personal service occupations 9 51 10 187Sales and customer service 7 49 8 151Process, plant and machine operatives 18 40 15 326Elementary occupations 17 40 14 339Contract type of main earner (first wave)Permanent job 91 49 93 1,738Fixed period or fixed task contract [2] [42] [2] 42Agency temping * * * 24Casual type of work [2] [37] [2] 45Other way non-permanent 3 44 3 67
Understanding Society waves 1, 2 and 3 (2009/10, 2010/11 and 2011/12).1. This shows the proportion of children in poverty in the first wave with the characteristic.2. This shows the poverty exit rate for children with this characteristic.3. This shows the proportion of children who exited poverty who have this characteristic.
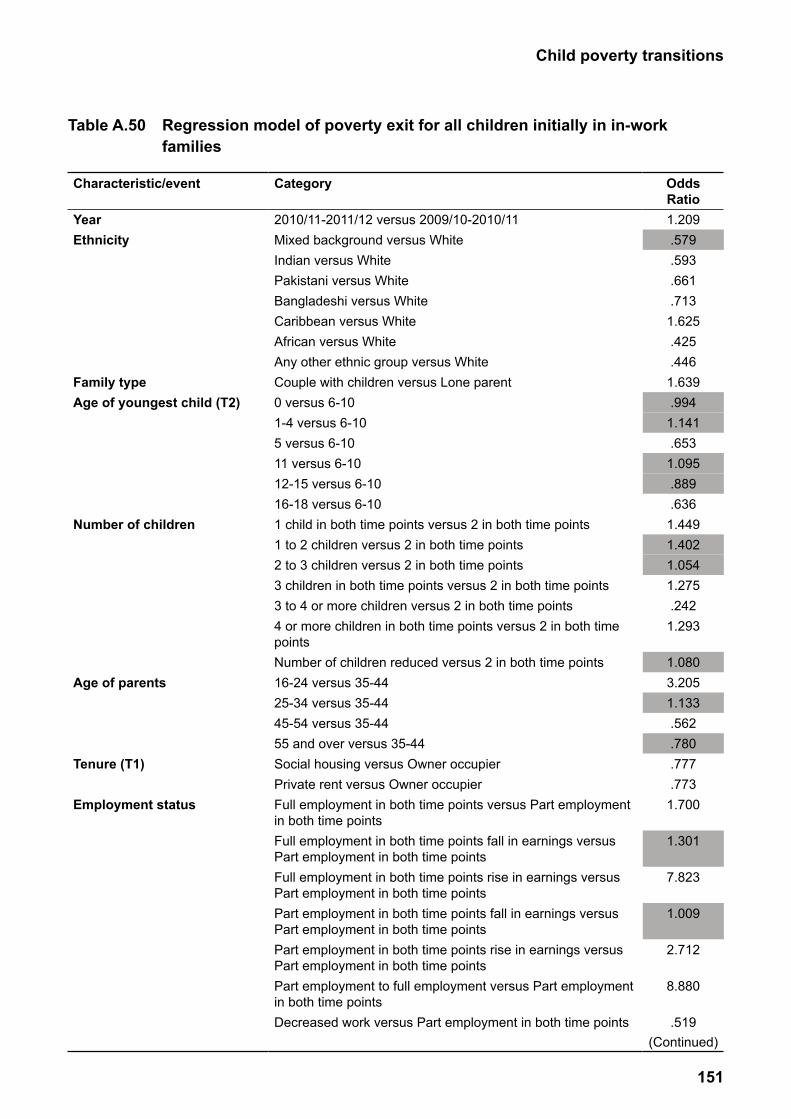
151
Child poverty transitions
Table A.50 Regression model of poverty exit for all children initially in in-work families
Characteristic/event Category Odds Ratio
Year 2010/11-2011/12 versus 2009/10-2010/11 1.209Ethnicity Mixed background versus White .579
Indian versus White .593Pakistani versus White .661Bangladeshi versus White .713Caribbean versus White 1.625African versus White .425Any other ethnic group versus White .446
Family type Couple with children versus Lone parent 1.639Age of youngest child (T2) 0 versus 6-10 .994
1-4 versus 6-10 1.1415 versus 6-10 .65311 versus 6-10 1.09512-15 versus 6-10 .88916-18 versus 6-10 .636
Number of children 1 child in both time points versus 2 in both time points 1.4491 to 2 children versus 2 in both time points 1.4022 to 3 children versus 2 in both time points 1.0543 children in both time points versus 2 in both time points 1.2753 to 4 or more children versus 2 in both time points .2424 or more children in both time points versus 2 in both time points
1.293
Number of children reduced versus 2 in both time points 1.080Age of parents 16-24 versus 35-44 3.205
25-34 versus 35-44 1.13345-54 versus 35-44 .56255 and over versus 35-44 .780
Tenure (T1) Social housing versus Owner occupier .777Private rent versus Owner occupier .773
Employment status Full employment in both time points versus Part employment 1.700in both time pointsFull employment in both time points fall in earnings versus Part employment in both time points
1.301
Full employment in both time points rise in earnings versus Part employment in both time points
7.823
Part employment in both time points fall in earnings versus Part employment in both time points
1.009
Part employment in both time points rise in earnings versus Part employment in both time points
2.712
Part employment to full employment versus Part employment in both time points
8.880
Decreased work versus Part employment in both time points .519(Continued)
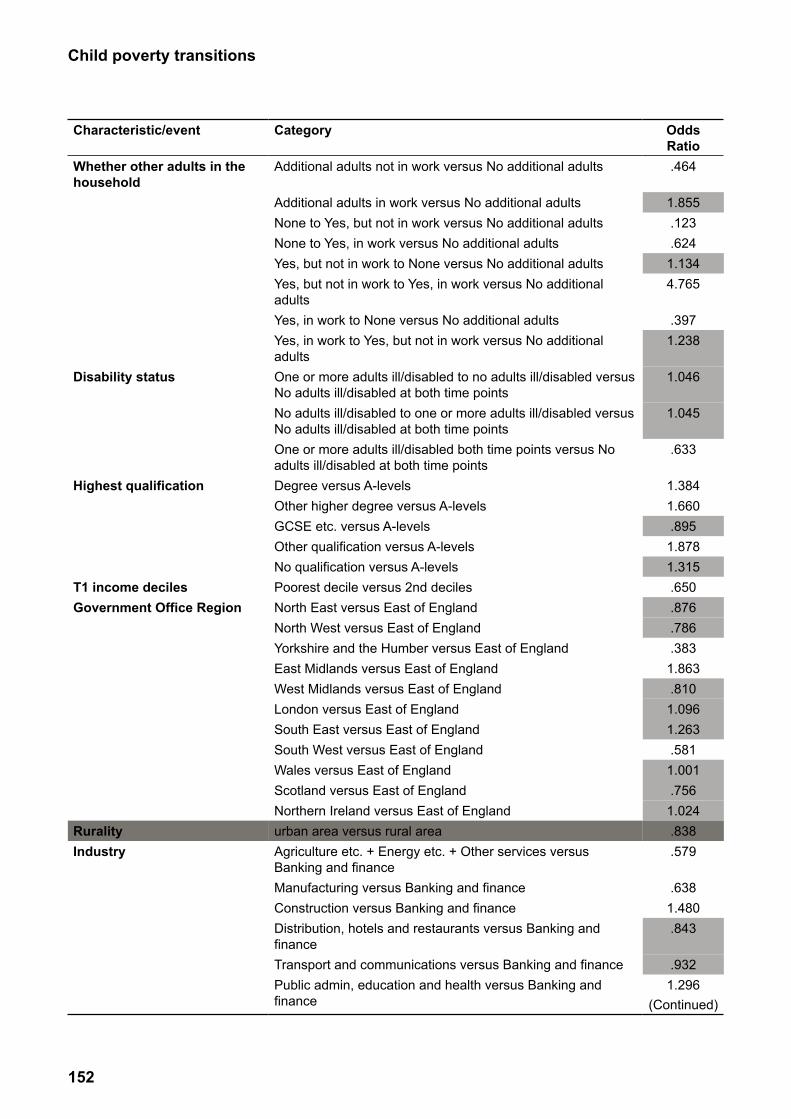
152
Child poverty transitions
Characteristic/event Category Odds Ratio
Whether other adults in the household
Additional adults not in work versus No additional adults .464
1.855.123.6241.1344.765
.3971.238
1.046
1.045
.633
1.3841.660.8951.8781.315.650.876.786.3831.863.8101.0961.263.5811.001.7561.024.838.579
.6381.480.843
.9321.296
(Continued)
Additional adults in work versus No additional adultsNone to Yes, but not in work versus No additional adultsNone to Yes, in work versus No additional adultsYes, but not in work to None versus No additional adultsYes, but not in work to Yes, in work versus No additional adultsYes, in work to None versus No additional adultsYes, in work to Yes, but not in work versus No additional adults
Disability status One or more adults ill/disabled to no adults ill/disabled versus No adults ill/disabled at both time pointsNo adults ill/disabled to one or more adults ill/disabled versus No adults ill/disabled at both time points
Highest qualification
One or more adults ill/disabled both time points versus No adults ill/disabled at both time pointsDegree versus A-levelsOther higher degree versus A-levelsGCSE etc. versus A-levelsOther qualification versus A-levelsNo qualification versus A-levels
T1 income deciles Poorest decile versus 2nd decilesGovernment Office Region North East versus East of England
North West versus East of EnglandYorkshire and the Humber versus East of EnglandEast Midlands versus East of EnglandWest Midlands versus East of EnglandLondon versus East of EnglandSouth East versus East of EnglandSouth West versus East of EnglandWales versus East of EnglandScotland versus East of EnglandNorthern Ireland versus East of England
RuralityIndustry
urban area versus rural areaAgriculture etc. + Energy etc. + Other services versus Banking and financeManufacturing versus Banking and financeConstruction versus Banking and financeDistribution, hotels and restaurants versus Banking and financeTransport and communications versus Banking and financePublic admin, education and health versus Banking and finance
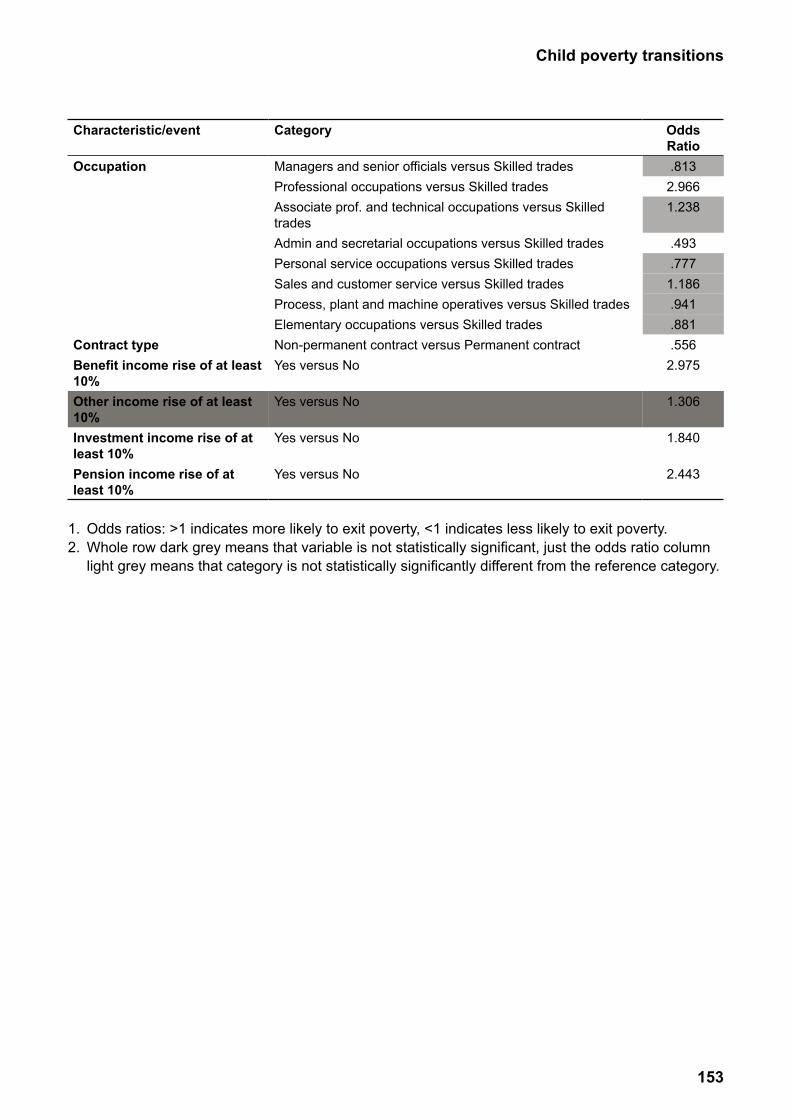
153
Child poverty transitions
Characteristic/event Category Odds Ratio
Occupation Managers and senior officials versus Skilled trades .813Professional occupations versus Skilled trades 2.966Associate prof. and technical occupations versus Skilled 1.238tradesAdmin and secretarial occupations versus Skilled trades .493Personal service occupations versus Skilled trades .777Sales and customer service versus Skilled trades 1.186Process, plant and machine operatives versus Skilled trades .941Elementary occupations versus Skilled trades .881
Contract type Non-permanent contract versus Permanent contract .556Benefit income rise of at least Yes versus No 2.97510%Other income rise of at least Yes versus No 1.30610%Investment income rise of at Yes versus No 1.840least 10%Pension income rise of at Yes versus No 2.443least 10%
1. Odds ratios: >1 indicates more likely to exit poverty, <1 indicates less likely to exit poverty.2. Whole row dark grey means that variable is not statistically significant, just the odds ratio column
light grey means that category is not statistically significantly different from the reference category.
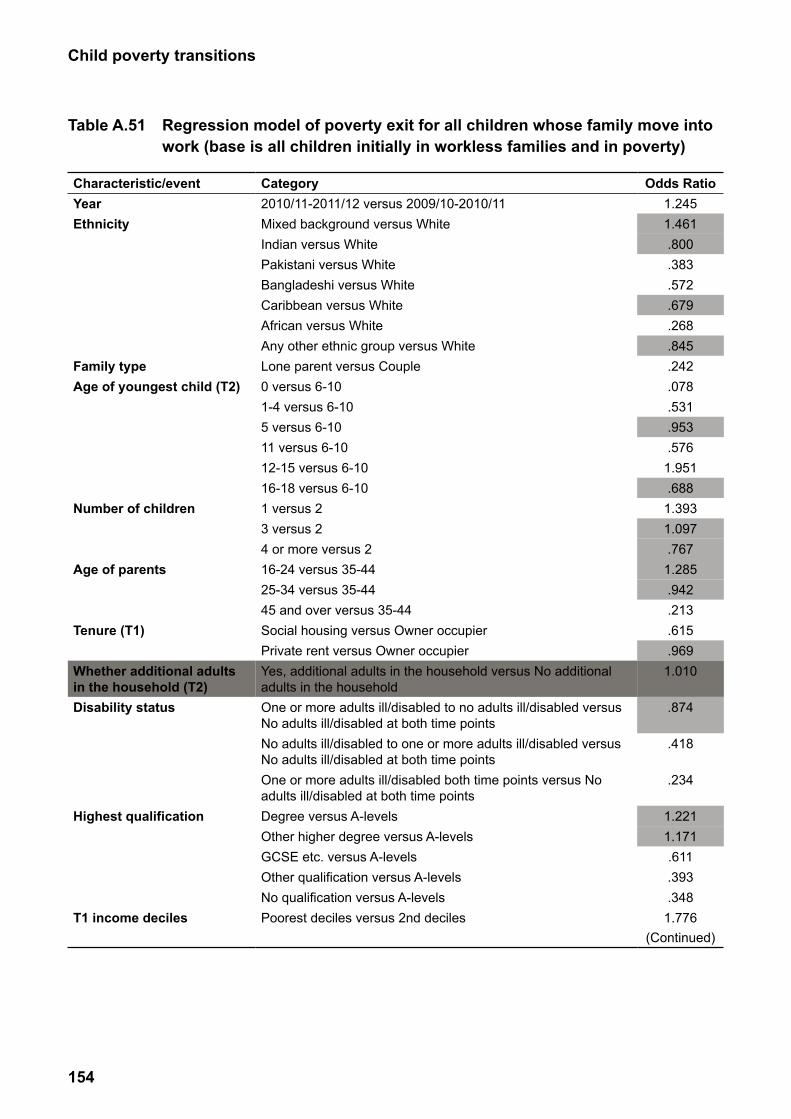
154
Child poverty transitions
Table A.51 Regression model of poverty exit for all children whose family move into work (base is all children initially in workless families and in poverty)
Characteristic/event Category Odds RatioYear 2010/11-2011/12 versus 2009/10-2010/11 1.245Ethnicity Mixed background versus White 1.461
Indian versus White .800Pakistani versus White .383Bangladeshi versus White .572Caribbean versus White .679African versus White .268Any other ethnic group versus White .845
Family type Lone parent versus Couple .242Age of youngest child (T2) 0 versus 6-10 .078
1-4 versus 6-10 .5315 versus 6-10 .95311 versus 6-10 .57612-15 versus 6-10 1.95116-18 versus 6-10 .688
Number of children 1 versus 2 1.3933 versus 2 1.0974 or more versus 2 .767
Age of parents 16-24 versus 35-44 1.28525-34 versus 35-44 .94245 and over versus 35-44 .213
Tenure (T1) Social housing versus Owner occupier .615Private rent versus Owner occupier .969
Whether additional adults Yes, additional adults in the household versus No additional 1.010in the household (T2) adults in the householdDisability status One or more adults ill/disabled to no adults ill/disabled versus .874
No adults ill/disabled at both time pointsNo adults ill/disabled to one or more adults ill/disabled versus No adults ill/disabled at both time points
.418
One or more adults ill/disabled both time points versus No adults ill/disabled at both time points
.234
Highest qualification Degree versus A-levels 1.221Other higher degree versus A-levels 1.171GCSE etc. versus A-levels .611Other qualification versus A-levels .393No qualification versus A-levels .348
T1 income deciles Poorest deciles versus 2nd deciles 1.776(Continued)

155
Child poverty transitions
Characteristic/event Category Odds RatioGovernment Office Region North East versus East of England .871
North West versus East of England .772Yorkshire and the Humber versus East of England .330East Midlands versus East of England .449West Midlands versus East of England .593London versus East of England .906South East versus East of England .357South West versus East of England .399Wales versus East of England .645Scotland versus East of England .593Northern Ireland versus East of England .313
Rurality urban area versus rural area .961Benefit income rise of at Yes versus No 1.749least 10%Other income rise of at Yes versus No 1.222least 10%
1. Odds ratios: >1 indicates more likely to gain employment and exit poverty, <1 indicates less likely to gain employment and exit poverty (i.e. more likely to stay workless and remain in poverty).
2. Whole row dark grey means that variable is not statistically significant, just the odds ratio column light grey means that category is not statistically significantly different from the reference category.
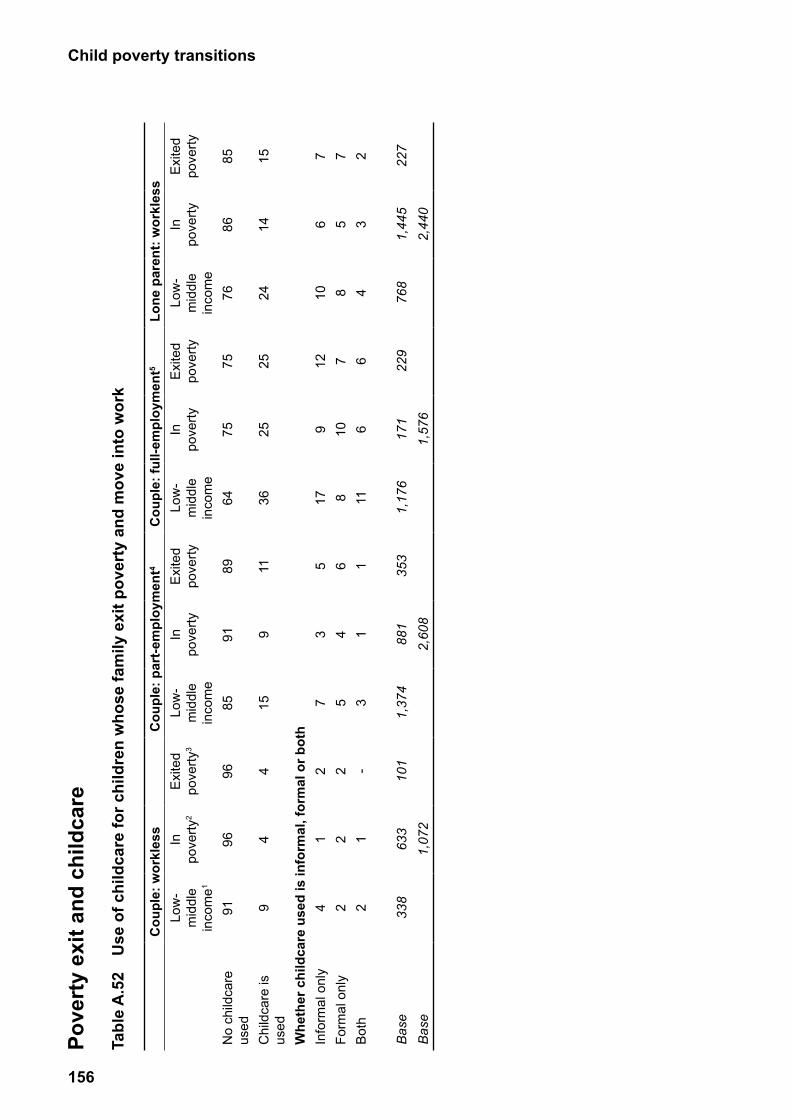
156
Child poverty transitionsPo
vert
y ex
it an
d ch
ildca
re
Tabl
e A
.52
Use
of c
hild
care
for c
hild
ren
who
se fa
mily
exi
t pov
erty
and
mov
e in
to w
ork
Cou
ple:
wor
kles
sC
oupl
e: p
art-e
mpl
oym
ent4
Cou
ple:
full-
empl
oym
ent5
Lone
par
ent:
wor
kles
sLo
w-
mid
dle
inco
me1
In
pove
rty2
Exi
ted
pove
rty3
Low
-m
iddl
e in
com
e
In
pove
rtyE
xite
d po
verty
Low
-m
iddl
e in
com
e
In
pove
rtyE
xite
d po
verty
Low
-m
iddl
e in
com
e
In
pove
rtyE
xite
d po
verty
No
child
care
us
ed91
9696
8591
8964
7575
7686
85
Chi
ldca
re is
us
ed9
44
159
1136
2525
2414
15
Whe
ther
chi
ldca
re u
sed
is in
form
al, f
orm
al o
r bot
hIn
form
al o
nly
41
27
35
179
1210
67
Form
al o
nly
22
25
46
810
78
57
Bot
h2
1-
31
111
66
43
2
Bas
e33
863
310
11,
374
881
353
1,17
617
122
976
81,
445
227
Bas
e1,
072
2,60
81,
576
2,44
0
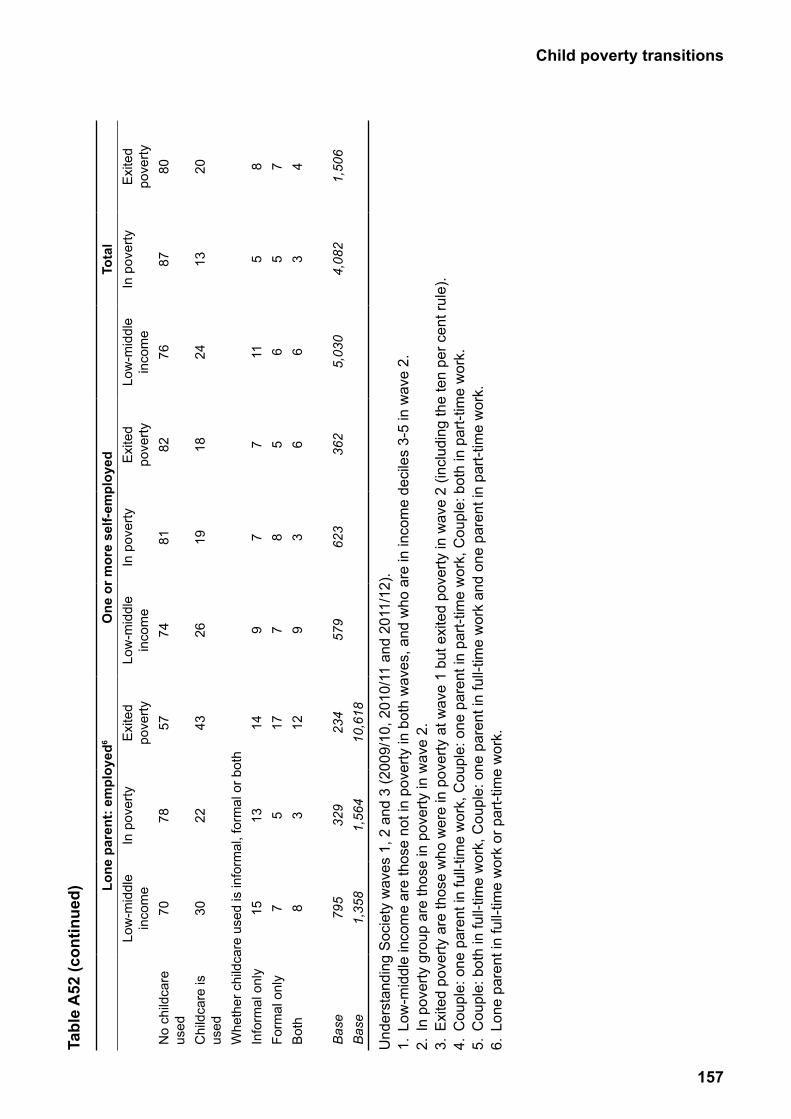
157
Child poverty transitionsTa
ble
A52
(con
tinue
d) Lone
par
ent:
empl
oyed
6O
ne o
r mor
e se
lf-em
ploy
edTo
tal
Low
-mid
dle
inco
me
In p
over
tyE
xite
d po
verty
Low
-mid
dle
inco
me
In p
over
tyE
xite
d po
verty
Low
-mid
dle
inco
me
In p
over
tyE
xite
d po
verty
No
child
care
us
ed70
7857
7481
8276
8780
Chi
ldca
re is
us
ed30
2243
2619
1824
1320
Whe
ther
chi
ldca
re u
sed
is in
form
al, f
orm
al o
r bot
hIn
form
al o
nly
1513
149
77
115
8Fo
rmal
onl
y7
517
78
56
57
Bot
h8
312
93
66
34
Bas
e79
532
923
457
962
336
25,
030
4,08
21,
506
Bas
e1,
358
1,56
410
,618
Und
erst
andi
ng S
ocie
ty w
aves
1, 2
and
3 (2
009/
10, 2
010/
11 a
nd 2
011/
12).
1. L
ow-m
iddl
e in
com
e ar
e th
ose
not i
n po
verty
in b
oth
wav
es, a
nd w
ho a
re in
inco
me
deci
les
3-5
in w
ave
2.2.
In
pove
rty g
roup
are
thos
e in
pov
erty
in w
ave
2.3.
Exi
ted
pove
rty a
re th
ose
who
wer
e in
pov
erty
at w
ave
1 bu
t exi
ted
pove
rty in
wav
e 2
(incl
udin
g th
e te
n pe
r cen
t rul
e).
4. C
oupl
e: o
ne p
aren
t in
full-
time
wor
k, C
oupl
e: o
ne p
aren
t in
part-
time
wor
k, C
oupl
e: b
oth
in p
art-t
ime
wor
k.5.
Cou
ple:
bot
h in
full-
time
wor
k, C
oupl
e: o
ne p
aren
t in
full-
time
wor
k an
d on
e pa
rent
in p
art-t
ime
wor
k.6.
Lon
e pa
rent
in fu
ll-tim
e w
ork
or p
art-t
ime
wor
k.
158
Child poverty transitions
ReferencesBarnes, M. and Lord, C. (2013). Poverty, economic status and skills: what are the links? York: Joseph Rowntree Foundation.
Barnes, M., Connoly, A. and Tomaszewski, W. (2008). The circumstances of persistently poor families with children: Evidence from the Families and Children Study (FACS), DWP Research Report no. 487, Leeds: Corporate Document Services.
Barnes, M., Lyon, N. and Millar, J. (2008). Employment transitions and the changes in economic circumstances of families with children, Department for Work and Pensions research report no.506, Leeds: Corporate Document Services.
Barnes, M., Chanfreau, J. and Tomaszewski, W. (2010). Growing Up in Scotland: The Circumstances of Persistently Poor Children, Edinburgh: Scottish Government.
Berthoud, R. (2011). Income and other measures of material well-being. In: McFall, S. L. and Garrington, C. (Eds.). (2011). Early findings from the first wave of the UK’s household longitudinal study. Colchester: Institute for Social and Economic Research, University of Essex.
Blanden, J. and Gibbons, S. (2006). The persistence of poverty across generations: A view from two British cohorts. York: Joseph Rowntree Foundation.
Brewer, M., O’Dea, C., Paull, G. and Sibieta, L. (2009). The living standards of families with children reporting low incomes, DWP Research Report No 577
Department of Work and Pensions, (2010). Low Income Dynamics: 1991 – 2008 (Great Britain), London: Department of Work and Pensions.
Department of Work and Pensions, (2007). Opportunity for all: Indicators update 2007, London: Department of Work and Pensions.
Department of Work and Pensions, (2014a). Households Below Average Income: An analysis of the income distribution 1994/95 – 2012/13, London: Department of Work and Pensions.
Department of Work and Pensions, (2014b). Child Poverty Strategy 2014-17, London: Department of Work and Pensions.
Goulden, C. (2010). Cycles of poverty, unemployment and low pay, York: Joseph Rowntree Foundation.
Gregg, P. Harkness, S. and Smith, S. (2007). ‘Welfare reform and lone parents in the UK’, Working Paper 07/182, Bristol: Centre for Market and Public Organisation, University of Bristol.
Hills, J., Brewer, M., Jenkins, S., Lister, R., Lupton, R., Machin, S., Mills, C., Modood, T., Rees, T., and Riddell, S. (2010). An anatomy of economic inequality in the UK: report of the National Equality Panel. Centre for Analysis of Social Exclusion, London, UK.
HM Treasury, Department for Children, Schools and Families, and Department for Work and Pensions (2010). Ending Child Poverty: mapping the route to 2020. London: HMT.
159
Child poverty transitions
Jenkins, S. (2011). Changing fortunes: income mobility and poverty dynamics in Britain, Oxford University Press.
Jenkins, S. (2008). Marital splits and income changes over the longer term In: Brynin, M. and Ermisch, J., (eds.) Changing Relationships. Routledge, London.
Jenkins, S., and Rigg, J. (2001). The Dynamics of Poverty in Britain. Leeds: Department of Work and Pensions.
Platt, L. (2009). Ethnicity and child poverty. London: Department of Work and Pensions.
Platt, L. (2010). Ten year transitions in children’s experience of living in a workless household: variations by ethnic group. Population Trends, 139. 70-90.
Lawton, K. (2009). Nice Work if You Can Get It: Achieving a Sustainable Solution to Low Pay and In-work Poverty, London: IPPR.
Longhi, S. and Platt, L. (2008). Pay gaps across equalities areas: an analysis of pay gaps and pay penalties by sex, ethnicity, religion, disability, sexual orientation and age using the Labour Force Survey. Equality and Human Rights Commission, Manchester.
Lynn, P. (2006). Quality Profile: British Household Panel Survey Version 2.0: Waves 1 to 13: 1991–2003. Essex: Institute for Social and Economic Research.
Maplethorpe, N., Chanfreau, J., Philo, D. and Tait, C. (2010). Families with Children in Britain: Findings from the 2008 Families and Children Study (FACS). London: Department of Work and Pensions.
The Maternity and Parental Leave etc. Regulations. (1999). http://www.legislation.gov.uk/uksi/1999/3312/pdfs/uksi_19993312_en.pdf
McQuaid, R., Fuertes, V. and Richard, A. (2010). How can Parents Escape from Recurrent Poverty? York: Joseph Rowntree Foundation.
Metcalf, H. and Dhudwar, A. (2010). Employers’ role in the low-pay/no-pay cycle. York: Joseph Rowntree Foundation.
Ray, K., Hoggart, L., Vegris, S. and Taylor, R., (2010). Better off Working? Work, Poverty and Benefit Cycling? York: Joseph Rowntree Foundation.
Save the Children. (2012). Ending Child Poverty: Ensuring Universal Credit supports working mums, London: Save the Children.
Shildrick, T., MacDonald, R., Webster, C. and Garthwaite, K. (2010). The Low-Pay, No-Pay Cycle: Understanding Recurrent Poverty, York: Joseph Rowntree Foundation.
Smith, N. and Middleton, S. (2007). A Review of Poverty Dynamics Research in the UK, York: Joseph Rowntree Foundation.
Stewart, K. (2008). Employment Trajectories for Mothers in Low-skilled Work: Evidence From the British Lone Parent Cohort. London: London School of Economics and Political Science
Tomlinson, M. and Walker, R. (2010). Recurrent Poverty: The Impact of Family and Labour Market Changes, York: Joseph Rowntree Foundation.