CHIEVEMENT IN HA RT ER S CHOOLS AND R EG UL AR P UB LI … · achievement in cha rt er s chools and...
40
A CHIEVEMENT IN C HARTER S CHOOLS AND R EGULAR PUBLIC S CHOOLS IN THE U NITED S TATES: U NDERSTANDING THE D IFFERENCES CAROLINE M. HOXBY HARVARD UNIVERSITY AND N ATIONAL B UREAU OF E CONOMIC R ESEARCH* D ECEMBER 2004 A BSTRACT This study compares the reading and mathematics proficiency of charter school students to that of their fellow students in neighboring public schools. Ninety-nine percent of all elementary students in charter schools are included in the study. The charter schools are compared to the schools that their students would most likely otherwise attend: the nearest regular public school with a similar racial composition (the "matched" school). Compared to students in the matched regular public school, charter students are 5.2 percent more likely to be proficient in reading and 3.2 percent more likely to be proficient in math on their state's exams. Students in charter schools that have been in operation longer are more likely to have a proficiency advantage over their peers in the matched regular public school. In reading, the advantage is 2.5 percent for a charter school that has been operating 1 to 4 years, 5.2 percent for a school operating 5 to 8 years, and 10.1 percent for a school operating 9 to 11 years. Also, charter school students are more likely to have a proficiency advantage if their school has funding that is at least forty percent of that enjoyed by regular public schools. The results suggest that charter schools are especially likely to raise the achievement of students who are poor or Hispanic. * The author is a Professor of Economics at Harvard University, director of the Economics of Education Program at the National Bureau of Economic Research, a member of the Koret Task Force on Education, and a Distinguished Visiting Fellow of the Hoover Institution. The author is grateful to Jason Kohout for excellent research assistance and to the departments of education of all fifty states and the District of Columbia for data and information on proficiency levels. This research has been supported by a generous grant (R29HD35983) from the National Institute for Child Health and Human Development. All errors are the author's own.
-
Upload
nguyennhan -
Category
Documents
-
view
212 -
download
0
Transcript of CHIEVEMENT IN HA RT ER S CHOOLS AND R EG UL AR P UB LI … · achievement in cha rt er s chools and...

ACHIEVEMENT IN CHARTER SCHOOLS
AND REGULAR PUBLIC SCHOOLS IN THE UNITED STATES:UNDERSTANDING THE DIFFERENCES
CAROLINE M. HOXBY
HARVARD UNIVERSITY AND
NATIONAL BUREAU OF ECONOMIC RESEARCH*
DECEMBER 2004
ABSTRACT
This study compares the reading and mathematics proficiency of charter school students
to that of their fellow students in neighboring public schools. Ninety-nine percent of all
elementary students in charter schools are included in the study. The charter schools are
compared to the schools that their students would most likely otherwise attend: the
nearest regular public school with a similar racial composition (the "matched" school).
Compared to students in the matched regular public school, charter students are 5.2
percent more likely to be proficient in reading and 3.2 percent more likely to be
proficient in math on their state's exams. Students in charter schools that have been in
operation longer are more likely to have a proficiency advantage over their peers in the
matched regular public school. In reading, the advantage is 2.5 percent for a charter
school that has been operating 1 to 4 years, 5.2 percent for a school operating 5 to 8
years, and 10.1 percent for a school operating 9 to 11 years. Also, charter school students
are more likely to have a proficiency advantage if their school has funding that is at least
forty percent of that enjoyed by regular public schools. The results suggest that charter
schools are especially likely to raise the achievement of students who are poor or
Hispanic.
* The author is a Professor of Economics at Harvard University, director of the Economics of Education
Program at the National Bureau of Economic Research, a member of the Koret Task Force on Education,
and a Distinguished Visiting Fellow of the Hoover Institution. The author is grateful to Jason Kohout for
excellent research assistance and to the departments of education of all fifty states and the District of
Columbia for data and information on proficiency levels. This research has been supported by a generous
grant (R29HD35983) from the National Institute for Child Health and Human Development. All errors
are the author's own.

1
EXECUTIVE SUMMARY
This study compares the reading and mathematics proficiency of charter school students in theUnited States to that of their fellow students in neighboring public schools. Because charterschools are public entities, their students take state exams. Thus, this study is based on schoolsthat enroll approximately 99 percent of elementary students who attend charter schools. Thecharter schools are compared to the schools that their students would most likely otherwiseattend: the nearest regular public school with a similar racial composition (the "matched"school).
Compared to students in the matched public school, charter students are 5.2 percent more likelyto be proficient in reading and 3.2 percent more likely to be proficient in math on their state'sexams. Charter schools that have been in operation longer have a greater proficiency advantageover the matched public schools. For example, in reading, the advantage is 2.5 percent for acharter school that has been operating 1 to 4 years, 5.2 percent for a school operating 5 to 8years, and 10.1 percent for a school operating 9 to 11 years.
The results how that charter schools are especially likely to raise the achievement of studentswho are poor or Hispanic. This is a useful finding because charter schools serve students whoare disproportionately likely to be minorities or poor.
Charter school students are more likely to have a proficiency advantage if their state has a strongcharter school law that gives the schools autonomy and that ensures that charter schools getfunding equal to at least 40 percent of the total per-pupil funding of regular public schools.
In states where charter schools are well-established, charter school students' advantage inproficiency tends to be greater. For instance, in Arizona, fourth grade charter students are about10 percent more likely to be proficient in reading and math than students in the matched regularpublic schools. In California, the corresponding proficiency advantages are 9 percent in readingand 5 percent in math. In Colorado, the corresponding proficiency advantages are 12 percent inreading and 14 percent in math.
North Carolina is the only state in which charter students’ proficiency is statisticallysignificantly lower, by 4 percent, in both reading and math, compared to students in the nearestpublic school. In addition, Texas’ charter students appear to be statistically significantly lessproficient in math (not reading).
By adjusting for schools that serve at-risk students, the study focuses on regular charter schoolsthat are expected to meet the same standards as traditional public schools. The study's"matching" method compares charter schools to public schools that are likely to share the sameneighborhood, same economic conditions, and the same population of students and parents. Theselection of a neighboring public school as the point of comparison ensures that the groups ofstudents being compared are as similar as possible. It is also likely that the public schoolselected for comparison was the school that most of the charter school students would haveattended, had there been no charter school.

2
A national study like this one is useful because it is comprehensive. Nevertheless, it is usefulto complement studies like this one with studies based on randomization. Because many charterschools have more applicants than places, they routinely hold lotteries, which allow scientific,random assignment studies to be conducted. The key advantage of randomization-based studiesis that the charter school students and regular public school students are comparable not only interms of race, ethnicity, and income, but also on subtle dimensions like motivation and aptitude. Multiple studies based on randomization are underway. The first such study (Hoxby andRockoff 2004) finds that a large system of Chicago charter schools raised math and readingscores by about 6 percentiles among students who entered in grade 5 or below.
Because charter schools enroll only 1.5 percent of students, it is important to include nearly allof them in a study. Results based on only a small sample of charter school students (forinstance, studies that rely on the 3 percent sample of the National Assessment of EducationalProgress) cannot be used to draw conclusions about states' charter school policies. A study thatrelies on a 3 percent sample of 1.5 percent of American students is a study based on only 0.045percent of students. In contrast, this study uses data that are sufficient for detailed investigationsof charter school students' proficiency, nationwide.

3
I. COMPARING CHARTER AND REGULAR PUBLIC SCHOOLS
Charter schools are a form of school choice that a growing number of people find
interesting. This is because charter schools may provide positive competition for regular public
schools. They may also be innovators in school management, curriculum, and the use of
technology. They may provide alternatives for children who would otherwise be confined to
failing schools. An effective, safe alternative school may be especially important for families
who are disadvantaged because they often lack the means to escape a failing school by moving
to another area. Charter schools are public schools and must accept all applicants equally. Also,
charter schools participate in their states’ accountability systems and obey many state and federal
regulations. The essential difference between charter schools and regular public schools is that
charter schools exist on a fee-per-student basis. If they can attract students, they can grow.
However, if they fail to attract students, they close. In short, charter schools combine elements
of regular public schools and private schools and therefore interest people who want to see
reform in American education but who worry about a laissez faire market for education.
Charter schools are a fledgling reform: they enroll only 1.5 percent of American
students. Several states have no charter schools at all, and only 7 states and the District of
Columbia have more than 2 percent of their students in charter schools. Thus, charter schools
are an important part of federal and state efforts to improve schools mainly because they help
policy makers envision the future, not because they already enroll many students. Not
surprisingly, much of the public is unfamiliar with charter schools and wonders how students
fare in them. This study attempts to fill that gap by providing a comprehensive look at charter
schools in the United States. It examines the achievement of 99 percent of fourth graders who
attend charter schools. Their performance is compared to that of students in the nearest regular1
public school that the students would most likely have attended if the charter school did not exist
(the "matched" school).
I.A. Why a National Study Based on Charter and Matched Regular Public Schools?
It should said at the outset that a national study like this one is useful because it is
comprehensive, timely, and allows us to investigate how the effect of charter schools varies with
their age, the support they receive from their state, and the population of students they educate.
Comparing charter school to matched regular public schools helps policy makers answer the

4
question, “What if charter schools did not exist?” Moreover, the comparisons in this study
provide some of the first available answers to questions like "Do charter schools improve as they
gain experience?", "Do charter schools do better when they receive funding comparable to that
of regular public schools?", and "Do charter schools have an especially large effect on the
achievement of disadvantaged students who would otherwise have few alternatives to the nearest
regular public school?"
Relative to methods based on controls (such as a student's being poor or a "percent poor"
variable), the matching method used in this study is superior. First, it simulates the scenario a
real parent would face. Should a parent send his child to the nearest regular public school or to a
nearby charter school? This is inherently a local question for parents and local comparison
are more useful than results that are based on aggregating achievement data up over a vast
country. Matched schools share a neighborhood; local economic conditions; and a population of
parents and students with certain incomes, races, ethnicities, and family structures. Moreover,
matching is a superior statistical method because it does not rely on unrealistic assumptions
about linearity. An example of such an unrealistic assumption is that being Hispanic always has
the same effect on a student's achievement, regardless of whether he lives in South Texas,
Miami, or Minnesota! Because we do not believe such assumptions, we should be wary of
studies that simply control for being Hispanic, being African-American, or being poor.
Matching produces results that are much more general and credible.
I.B. Other Studies, Good and Bad
Nevertheless, studies based on matching should be complemented by studies based on
randomization. Randomization-based studies are the best, most scientific way to determine how
charter schools affect students over several years. Because charter schools often have more
applicants than spaces and are not allowed to select their students, they hold random lotteries
among applicants. Therefore, a researcher can compare students who were randomly assigned to
enroll or not to enroll in a charter school. A researcher can follow the charter school students
and the randomly selected comparison group over several years of education, confident that both
groups had families who were motivated to apply to charter schools. (Parents may be motivated
to apply because they are ambitious for their children, but parents may also be motivated to
apply because their children are already performing poorly in their regular school.) In addition,

5
a researcher can often see how students were performing before they applied to charter schools.
Using pre-application data, a researcher can verify that the lottery was random and show which
types of students are attracted to charter schools.
The first randomization-based study to produce results is Hoxby and Rockoff (2004),
who study a large system of Chicago charter schools and find that they raise achievement by
about 6 percentiles among students who enroll in charter schools in grade five or earlier. (There2
are too few students who enroll in later grades to produce meaningful results for them.)
The reason that randomized studies are so valuable is that they guarantee that a
researcher is comparing apples to apples. A randomized study tells us what would have
happened to students if they had not attended charter schools. This is the best answer to policy
makers’ “what if” question: what if charter schools did not exist and students attended whatever
school they would have attended in their absence?
A poorly designed study of charter schools compares apples to oranges–that is, it
compares charter schools to schools that the charter students were unlikely to attend in any case.
Keep in mind that the typical American student does not attend a charter school. Affluent
parents whose children are doing fine in suburban schools rarely send them to fledgling charter
schools. Instead, charter schools disproportionately arise where families are relatively poor,
likely to be racial minorities, likely to speak English as a second language, and likely to have a
single parent. Policy makers’ “what if” question cannot be answered by, say, comparing a
charter school student who would otherwise have attended an inner-city public school to a
student in an affluent, suburban school.
The American Federation of Teachers (AFT) has recently promoted statistics based on
the comparison of fourth graders in charter schools to the typical fourth grader in regular public
schools. Much attention has been paid to this crude comparison, and many people have
incorrectly interpreted it as sound evidence that charter schools reduce achievement. Little
attention has been given to the fact that when the AFT compared black students to black students
or Hispanic students to Hispanic students, the results did not confirm the crude comparison. In
other words, even a mild attempt to compare apples to apples showed that the crude comparison
was misleading. Moreover, the AFT study was based on a sample of only 3 percent of students.
Because charter schools enroll only 1.5 percent of students in America, a 3 percent sample of
6
that tiny 1.5 percent of students is inadequate for determining how states' charter school policies
affect achievement. (Three percent of 1.5 percent is only 0.045 percent of students!) A state’s
policy cannot be evaluated using the equivalent of one or two classrooms of students. An
analysis of charter schools that is statistically meaningful requires larger numbers of students.3
I.C. Why this Study is Comprehensive
In contrast with studies based on very small samples, this study uses assessment data on
99 percent of fourth graders enrolled in charter schools, except that fifth or third graders are used
in states that do not test fourth graders. It is important to understand that this is not a sample: it
is all charter students for whom achievement results are reported. (The missing 1 percent are in
first year start-up schools or schools so small that scores are kept confidential to protect
individual students). This comprehensive study is possible because charter school students take
their states’ exams, under the same regulations as apply to students in regular public schools.
The findings are representative of charter school students in the United States.
II. WHAT THIS STUDY DOES
II.A. Comparisons of Proficiency
This study examines differences in achievement between charter school students and
students in regular public schools. The students’ performance on their state tests is examined. 4
To facilitate comparison between this study and national data, this study focuses on fourth
graders, a sample of whom were tested by the National Assessment of Educational Progress
(NAEP) in 2002-03. The District of Columbia and all 36 of the states that had charter school5
students enrolled in the relevant grade in 2002-03 are included. Of these states, 25 tested fourth6
graders, 11 tested fifth graders, and one tested third graders. Fourth grade test results are used
when they exist; otherwise, the firth or third grade results are used. Keep in mind that students
are always being compared to others in the same grade. A charter school and its neighboring
public school administer the same exams in the same grade.
This study focuses on reading achievement and mathematics achievement, which are
tested by all states and NAEP. This study shows its findings in terms of proficiency levels,7
which all states and NAEP publish. Although states set proficiency levels somewhat8
7
differently, charter students are always compared to regular public school students who face the
same proficiency standards. If a state has a high standard for proficiency, the percentage of
students who reach it will typically be lower in both the charter school and in the nearest regular
public school. In addition, this study shows findings for individual states whenever they are
statistically meaningful.
Under the No Child Left Behind (NCLB) law, all schools are encouraged to have very
high participation rates on their state’s exam in order to make Adequate Yearly Progress.
Therefore, by using the most recent year of performance data that is available, this study
maximizes the coverage of charter school students and their public school peers. Keep in mind,9
however, that charter school students are always compared to regular public school students who
face the same regulations on test participation and publication of test scores.
In short, the data are chosen to facilitate comparison with national data. Students are
always compared to others who take the same test, follow the same regulations, participate in the
same state assessment program, and face the same proficiency standards.
II.B. Matching Charter Schools to Regular Public Schools
Each school address in the United States is translated into a latitude and longitude. The10
distance between each charter school and each regular public school is calculated and the nearest
regular public schools are identified. The schools that are strictly nearest form one comparison11
group used in this study. They share the charter school’s neighborhood and local circumstances
to the maximum extent possible. Usually, they also have a racial composition that is similar to
that of the charter school.12
Occasionally, there is a second public school near a charter school that is almost as close
as the nearest public school but is more similar to the charter school on the basis of racial
composition. When such a second public school exists nearby, it is likely that the charter school
is drawing from it, not the very closest school. After all, a charter school can only draw
Hispanic students, say, from a regular public school that enrolls Hispanic students. Thus, the
preferred matched school, for this study, is the regular public school with the racial composition
most similar to that of the charter school, selected from the public schools that are no more than
5 percent or 0.5 miles (whichever is larger) further away than the nearest public school. The vast
majority (92.4 percent) of the time, the matched schools is the school that is strictly nearest in

8
distance. This should surprise no one: tight geographic matching is usually sufficient to ensure
that schools are similar on many dimensions simultaneously.
Geographic matching is particularly appropriate for the fourth graders whose scores are
examined in this study. Because parents are wary of sending their young children far away for
elementary schools, we can say with greater confidence that a fourth grader who attends a
neighborhood charter school would otherwise likely be attending a very close regular public
school.
II.C. A Note on Methods
A note on methods is in order. In statistics, it has been established that, when one very
heterogeneous group is compared to another, univariate controls often produce results that are
unsound. This is especially true if the group is drawn sparsely and idiosyncratically from the
underlying population that is heterogeneous. Why are univariate controls unsound? Essentially,
they are unsound because poor students are not the same regardless of where they live in the
United States. Nor are Hispanic students interchangeable. Nor are African-American students
interchangeable. And so on. We cannot simply extrapolate from one poor student (Hispanic
student, African-American student, etc.) to others who live in different areas, under different
circumstances. Yet, such extrapolation is what a simple univariate control does. Moreover,
simple linear controls assume that the support of the distributions of the groups being compared
(in this case, charter schools and regular public schools) is the same. This is far from true:
charter schools are not only very heterogeneous, but have a sparse draw of locations from
possible school sites, and have locations that are spread across the United States in a manner that
is far from uniform.
In short, a comparison between charter school and regular public schools is exactly the
situation in which simple linear controls work least well. In such circumstances, matching
produces results that are much superior. Matching ensures that the distributions of the two
groups have similar support, and matching ensures that we need only extrapolate from one
neighbor to another. Also, matching produces results that are simple to interpret: we are
learning about what a charter school student would experience if he were to attend the regular
public school that he would probably otherwise be assigned.13
Note that controlling for characteristics within a matched sample is not at all equivalent
9
to simple linear controls in unmatched samples. This is true regardless of whether there is only
one control or many. Controlling for characteristics within a matched sample is efficient and,
moreover, does not impose the restrictive assumptions that are so problematic.
II.D. Computing the Differences in Proficiency
Within the matched sample, the procedure for computing the proficiency differences
between charter school and regular public school students is simple. Subtract the percentage of
students who are proficient in the nearest regular public school from each charter school’s
percentage of students who are proficient. This is the individual charter school’s difference.
Average these individual differences over all charter schools in the United States, weighting
each school’s difference by its number of students. The averages thus produced are
representative of charter school students in the United States. This process can be implemented14
using a calculator, but it is more convenient to implement it using regression, which
automatically generates standard errors. Moreover, multivariate regression is the ideal tool for
exploring whether charter schools' effects on achievement are systematically related to their
characteristics such as age, funding, and so on. Multivariate regression allows one to compute
different effects for charter schools that are younger versus older, poorly versus well funded, and
so on.
Because many charter schools are small and the proficiency of a single cohort of fourth
graders is an imperfect measure of true achievement, an individual charter school’s difference is
often a noisy indicator of its true advantage or disadvantage vis-a-vis its neighboring public
school. It is important not to overinterpret the individual charter schools’ differences. Rather,
the individual differences need to be averaged, as described, until the average includes a
sufficient number of students to be statistically meaningful.
The standard errors that are computed for each proficiency difference indicate how much
confidence we have that the difference is meaningfully different from random noise. It is15
conventional to report as statistically significant only findings about which we have at least 90
percent confidence. These are the findings I report.16
It will turn out that the average differences for the entire United States are statistically
significant. Also, the average differences tend to be statistically significant for individual states
in which charter schools are relatively prevalent. However, the average differences are not

10
statistically significant in a number of states where charter school students are so few that one
cannot distinguish the average from noise with any confidence. For instance, all of the following
states have fewer than 200 fourth graders in charter schools and do not produce statistically
meaningful results: Arkansas, Connecticut, Indiana, Kansas, Mississippi, New Mexico, Nevada,
Oklahoma, Oregon, Rhode Island, South Carolina Utah, Virginia, and Wyoming. In addition,
some states with a fair number of charter students do not produce statistically significant results
because there is “noise” produced by factors like a new and unfamiliar test, brand-new charter
schools, or social or economic circumstances that affect students.
Saying that a difference is statistically insignificant or meaningless is not evidence that
there is zero difference in performance between charter schools and regular public schools. It is
important to distinguish between results that are statistically insignificant and a finding of zero
difference. An analogy may help. A poll that is 50-50 with a margin of error of 1 percent
indicates a zero difference or a dead heat between political candidates. A poll that is 55-45 with
a margin of error of 25 percent does not suggest that there is a dead heat, yet it is also not
statistically meaningful evidence that one candidate will win. It is indistinguishable from noise.
In many states, the charter school - public school comparison is parallel to the 55-45 poll with a
25 percent margin of error. When pollsters find that their margin of error is too large, they
usually go out and poll additional people in the hope of reducing the error. Because this study
already includes all available assessment data on charter school students, there is nothing to be
done about the data when it does no produce statistically meaningful results. Fundamentally, the
data are telling us that it is too early to evaluate charter policy on some dimension.
III. THE STUDY’S COVERAGE
III.A. Coverage of Charter Schools
All states’ charter students are included in the computation of the overall proficiency
difference between charter schools and matched regular public schools. Thus, the overall
difference is truly representative of the nation, not just large states.
Table 1 shows the states that had charter school students enrolled in the relevant grade
(usually fourth) in 2002-03. Notice that most states had only a small fraction of their students

11
attending charter schools. Even among states with charter school enrollment, most had fewer
than 2 percent of their students in such schools. The exceptions are Arizona (6.1 percent),
California (2.5 percent), Colorado (3.8 percent), Delaware (4.3 percent), the District of
Columbia (11.3 percent), Florida (2 percent), Michigan (3.8 percent), and Wisconsin (2.2
percent).
Table 1 also shows the number of charter schools with at least 10 students in the relevant
grade. (The 10 student cut-off is used because test results by grade are generally not reported for
smaller groups of students.) The total number of students in the relevant grades who attended
these schools was 50,479 in 2002-03, which is the most recent year for which federal enrollment
data are available. The study covers approximately 99 percent of the relevant students.17 18
Overall, the study covers the vast majority of charter school students in the relevant
grades and provides an accurate representation of them. The sources of proficiency data are
listed in the Data Appendix.
III.B. Information on Charter Schools' Circumstances
This study demonstrates how proficiency differences are affected by charter schools'
circumstances: their age, the laws under which they operate, and the student population they
face. This information is gleaned from The Center for Education Reform's Charter School
Directory 2004, which contains a description of each school, and their Charter School Laws
Across the States 2004, which outlines each states' charter school laws. All charter schools with
proficiency data were covered by this procedure.19
IV. SIMPLE PROFICIENCY DIFFERENCES BETWEEN CHARTER SCHOOL STUDENTS
AND STUDENTS AT MATCHED REGULAR PUBLIC SCHOOLS
Tables 2 and 3 present findings on the proficiency differences between charter school
students and students at matched regular public schools. (Appendix Tables 1 and 2 show parallel
findings for the nearest regular public schools, based purely on distance.) Findings that are
statistically significant with 90 percent confidence (one asterisk) or 95 percent confidence (two
asterisks) are shown. Findings that are statistically insignificant at conventional confidence
levels are indicated by the abbreviation "n/a". Figure 1 graphically depicts the findings from
Tables 1 and 2.
12
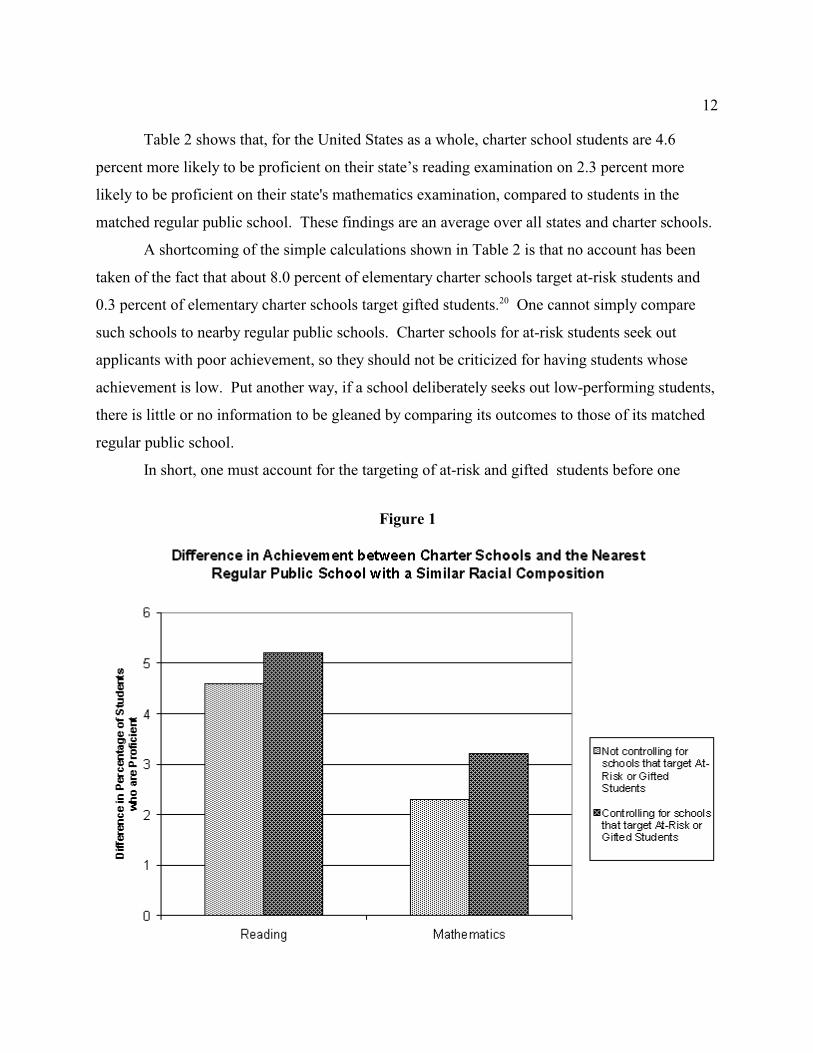
Table 2 shows that, for the United States as a whole, charter school students are 4.6
percent more likely to be proficient on their state’s reading examination on 2.3 percent more
likely to be proficient on their state's mathematics examination, compared to students in the
matched regular public school. These findings are an average over all states and charter schools.
A shortcoming of the simple calculations shown in Table 2 is that no account has been
taken of the fact that about 8.0 percent of elementary charter schools target at-risk students and
0.3 percent of elementary charter schools target gifted students. One cannot simply compare20
such schools to nearby regular public schools. Charter schools for at-risk students seek out
applicants with poor achievement, so they should not be criticized for having students whose
achievement is low. Put another way, if a school deliberately seeks out low-performing students,
there is little or no information to be gleaned by comparing its outcomes to those of its matched
regular public school.
In short, one must account for the targeting of at-risk and gifted students before one
Figure 1

13
computes charter schools' effects. This can be done by excluding schools that target or,
equivalently, allowing at-risk or gifted students to have different achievement than other
students. In Table 3, such allowances are made. Therefore, the charter school effect shown in
Table 3 is the true one. (The effect shown in Table 2 is biased downwards by the naive inclusion
of charter schools that target at-risk students.) Table 3 shows that, for the United States as a
whole, charter school students are 5.2 percent more likely to be proficient on their state’s reading
examination on 3.2 percent more likely to be proficient on their state's mathematics examination,
compared to students in the matched regular public school. These findings are the key results of
the study. They are the best estimates of charter schools' effects on the achievement of all
American elementary students.
Not surprisingly, students who are at-risk have scores that are statistically significantly
lower. Gifted students do not have scores that statistically significant higher, but this non-result
is simply a function of there being a tiny number of them in the study.
V. PROFICIENCY DIFFERENCES BY STATE
Table 4 presents state-level results that are exactly parallel to the key results in Table 3 --
that is, proficiency differences between charter schools and matched regular public schools,
accounting for the targeting of at-risk and gifted students. A state is shown in Table 4 if it has at
least one result that is statistically significant. The states where charter schools are relatively
prevalent tend to have results that are statistically significant. None of the states with fewer21
than 200 students in the relevant grade appears.
Compared to students in the matched regular public schools, Alaska’s charter students
are about 20 percent more likely to be proficient in reading and math. Arizona’s are about 10
percent more likely to be proficient in reading and math. California’s charter students are 9
percent more likely to be proficient in reading and 5 percent more likely to be proficient in math.
Relative to students in matched regular public schools, Colorado's charter school students are 12
percent more likely to be proficient in reading and 14 percent more likely to be proficient in
math. The District of Columbia's charter school advantage is nearly identical to Colorado’s.
Hawaii’s charter students are about 14 percent more likely to be proficient in reading and 12
percent more likely to be proficient in math than their fellows in the matched regular public

14
school. Illinois’ charter school advantage is 16 percent in reading and 21 percent in math.
Louisiana's is an even larger 33 percent in reading and 29 percent in math. Compared to22
students in the matched regular public schools, Massachusetts' charter school students are 8
percent more likely to be proficient in reading and math. Other states where charter school
students are more likely to be proficient, on at least one test, include Florida, Georgia, New
Jersey, Oregon, and Pennsylvania.
North Carolina stands out as the only state in which charter students are statistically
significantly less likely to be proficient in both reading and math. The North Carolina charter
school disadvantage is 4 percent in both subjects. In addition, Texas' charter school students are
7 percent less likely to be proficient in math. (In reading, the Texas proficiency difference is not
statistically significant.)
An inspection of Table 4 suggests that charter school students are more likely to
experience raised achievement if their state enacted a charter law early. For instance, consider
the enactment years of states that appear prominently in the table: Arizona, 1994; California,
1992; Colorado, 1993; the District of Columbia, 1996; Hawaii, 1994; Illinois, 1996; Louisiana,
1995; Massachusetts, 1993. These enactment dates are all on the early side. The average state
that has a charter school law enacted it in 1996, and 10 states have no law yet. It turns out,
however, that states that enacted charter laws early tend to have laws that are more highly rated
by The Center for Education Reform (see the Ranking Scorecard in Charter School Laws Across
the States 2004) and The Fordham Foundation (see Charter School Authorizing: Are States
Making the Grade? ). It may even be that, with experience, states systemically improve their23
charter school laws. We shall see that, while there is strong evidence that charter schools do
better when they receive more support, it is not easy to pick out certain aspects of support that
are more important than others. This is because a state's support for charter schools tends to be
correlated across dimensions. That is, a state that enacted its law early is also likely to provide
more adequate funding, more autonomy, multiple chartering authorities, and so on.
VI. PROFICIENCY DIFFERENCES BY THE NUMBER OF YEARS
THAT A CHARTER SCHOOL HAS BEEN IN OPERATION

15
Both Table 4 and the experience of charter school authorities hint that charter schools
may do better as they become more experienced. If experienced charter schools do better, it is
likely to be for two reasons. First, a given charter school may improve over time as it works out
the kinks in curriculum, management, and so on. Second, low-performing charter schools may
exit quickly, while high-performing charter schools may linger and disproportionately contribute
to the ranks of experienced schools. The latter "weeding-out" process is not only expected; it is
intended. Recall that one hypothesized advantage of charter schools is that they will disappear if
they cannot attract applicants.
Table 5 presents the results of an explicit test of the theory that more experienced charter
school raise achievement more. Charter schools' proficiency differences, vis-a-vis their matched
regular public schools, are allowed to depend on the number of years the charter schools have
been in operation. Compared to their fellows in regular public schools, Table 5 shows that
charter students are 2.5 percent more likely to be proficient in reading if their school has been in
Figure 2

16
operation for 1 to 4 years, 5.2 percent more likely to be proficient in reading if their school has
been in operation 5 to 8 years, and 10.1 percent more likely to be proficient in reading if their
school has in operation 9 to 11 years. For math, there is a roughly similar increase in the
likelihood of a proficiency advantage with a school's years in operation. Figure 2 depicts the
patterns graphically.
On a related point, we may wish to learn whether charter schools that close are really
those that under-perform. The answer is yes, at least for the most recent year. Only 2 percent of
the schools covered by this study closed between last year (when their achievement was
recorded) and this year. However, compared to schools that remained open, the schools that
closed had a 4 percent smaller proficiency advantage vis-a-vis their matched regular public
schools.
VII. HOW PROFICIENCY VARIES WITH A STATE'S SUPPORT FOR CHARTER SCHOOLS
As noted above, states that enacted charter school laws earlier tend to be more supportive
of charter schools on several dimensions. A state that is judged to be more supportive of charter
schools if it establishes multiple, independent chartering authorities (so that a charter school
need not seek authorization from the district with which is trying to compete); if it exempts
charter schools from local collective bargaining agreements and other rules that constrain school
management (such as a requirement that all teachers have certification obtained through regular
channels); if it gives schools legal, operational, and fiscal autonomy; and if funding for charter
schools is in the ballpark of funding for regular public schools.
We would like to test whether the proficiency advantage of more experienced charter
schools (shown in Table 5 and Figure 2) is really just an indication that charter schools do better
when they receive more support. That is, we know that older charter schools tend to be in states
that are more supportive, but can we distinguish between the effects of experience and the
effects of support?
It turns out that we can so long as we summarize a state's support for charter schools with
one measure, rather than many correlated measures. The ratio of per-pupil funding in charter
schools relative to funding in regular public schools is an efficient indicator of a state's support
for charter schools. (This is a statistical fact, not an assertion. )24

17
As a rule, charter schools receive substantially less funding than regular public schools.
The typical state law only provides for charter schools' current operating funds, and leaves them
to fend for themselves as regards capital and other funds. Because current operating funds make
up only about 85 percent of total funds, charter schools are nearly always at a funding
disadvantage. Moreover, most states guarantee only that charter schools receive the part of their
revenue that is based on the state's school finance formula. Charter schools may receive none or
only a fraction of the local revenue enjoyed by districts. Finally, states rarely guarantee that
federal funds reach charter schools, and charter schools sometimes complain that their districts
do not pass along federal revenues as they should.
Table 6 presents results in which the proficiency difference is allowed to depend on an
indicator for charter schools' funding. Specifically, the indicator tags states in which charter
schools receive less than 40 percent of the funding received by regular public schools. In
addition, the proficiency difference is allowed to depend on the number of years a charter school
has been in operation. The tables shows that a charter school's proficiency advantage is 6.4
percent greater in reading and 11.7 percent greater in math if its funding is at least 40 percent of
that enjoyed by regular public schools in its state. That is, a state's support does have an
important effect on the degree to which its charter schools raise achievement. Keep in mind that
the funding ratio is merely an efficient way of measuring a state's support for charter schools.
The funding ratio truly represents multiple dimensions of support. We should not conclude that
only funding equity matters and that other forms of support that are highly correlated with it,
such as autonomy or exemptions from collective bargaining, are irrelevant.
Table 6 also shows that controlling for the funding ratio hardly affects the relationship
between a charter school's proficiency advantage and its years in operation. These findings
suggest that experience and support are not the same thing. More experienced charter schools
are likely be better and so are those that enjoy more support.
Table 7 confirms this conclusion. It shows the effects of experience in three states that
not only have a large number of charter schools, but have charter schools that vary in experience.
Because all charter schools in a state experience the same state laws, a proficiency advantage
that rises with charter school experience within a state demonstrates that experience matters,
even for a given level of state support. Examining Table 7, we see that in Arizona, California,

18
and Florida, a charter school's effect on reading and math proficiency is larger if the school has
been in operation more years. For instance, relative to their fellows in regular public schools,
California students are 5.7 percent more likely to be proficient in reading if they attend a charter
school that has been operating 1 to 5 years, but they are 11.8 more likely to be proficient if they
attend a charter school that has been operating 6 to 11 years.
For the purposes of policy evaluation, we should care about how charter schools function
several years after a law is enacted, with several years of experience, and with funding like that
of other public schools. After all, no one designs a charter school policy that is supposed to be
experimental forever, with every year ushering in a new crop of inexperienced charter schools
that lack capital funding.
VIII. DO CHARTER SCHOOLS IMPROVE ACHIEVEMENT MORE
AMONG DISADVANTAGED CHILDREN?
One of the benefits of charter schools is supposed to be providing educational
alternatives to families that would otherwise have no ability to choose a school. Middle-income
families in the United States typically choose a school by choosing their residence and they often
enjoy substantially freedom of choice. High-income families can not only choose a school by
choosing a residence, they can afford to pay private school tuition on top of their local property
taxes. Thus, they often choose over an array of public and private schools. In contrast, low-
income families typically have little ability to choose a school. The limits on choice may be
even greater for minority families, who may hesitate to move into neighborhoods where their
racial or ethnic group is scarcely represented or has experienced discrimination in the past.
For all these reasons, we might hypothesize that charter schools have a more positive
effect on achievement when they operation in environments where families otherwise have few
choices. In other words, an area with a poor or minority population may be where charter
schools make the most difference. It is certain that charter schools are more likely to arise in
such areas.
Tables 8 and 9 present tests of the hypothesis that charter schools' proficiency advantage
is greater when they work in areas where a high percentage of students are African-American,
Hispanic, or poor. That is, they show the results of regressions in which the proficiency

19
difference is allowed to vary with the composition of the student population faced by both the
charter school and its matched regular school. An area is classified as having a high percentage
of African-American students if the share of students who are African-American in the charter
school-matched regular public school pair is the top quartile. Classification of highly Hispanic
areas is exactly parallel. Classification of disproportionately poor areas is also parallel, except
that the poverty quartiles are separately defined for each state. (Separate definitions are needed
for each state because the cost of living varies substantially among states. ) Figure 3 depicts the25
results from Tables 8 and 9, graphically.
Table 8 demonstrates that charter schools' effects on reading and math proficiency are
greater when they operate in areas that are highly Hispanic. For instance, the proficiency
advantage of the typical charter school is 4.2 percent in reading and 2.1 percent in math, but is
7.6 percent in reading and 4.1 percent in math in a highly Hispanic area. The effects for charter
schools that are in highly African-American areas are a little greater than the effects for a typical
Figure 3

20
charter school, but the difference in effects is not statistically significant.
Similarly, Table 9 demonstrates that charter schools' effects on reading proficiency are
greater when they operate in areas that are disproportionately poor. For instance, the proficiency
advantage of the typical charter school is 2.6 percent in reading, but is 6.5 percent in high
poverty areas. In short, there is some, though not overwhelming, evidence that charter schools
improve achievement more when they operate in areas where families are more disadvantaged
and are less able to choose their school.
V. CONCLUSIONS
In this study, charter school students’ achievement is compared to the achievement of
students in a matched regular public school that is not only nearby (is the very closest school
92.4 percent of the time) but also has a similar racial composition. The matched regular public
school is the one the charter students would likely otherwise attend. Thus, the results provide
some evidence on how students' achievement would change if their charter schools did not exist.
Because the study's sample includes approximately 99 percent of charter students in the fourth or
other tested elementary grade, the results are comprehensive. Compared to students in the
matched regular public school, charter students are 5.2 percent more likely to be proficient in
reading and 3.2 percent more likely to be proficient in math, on their state's exams. Students in
charter schools that have been in operation longer are more likely to have a proficiency
advantage over their peers in the matched regular public school. For instance, in reading, the
advantage is 2.5 percent for a charter school that has been operating 1 to 4 years, 5.2 percent for
a school operating 5 to 8 years, and 10.1 percent for a school operating 9 to 11 years. Also,
charter school students are more likely to have a proficiency advantage if their school has
funding that is in the ballpark of that enjoyed by regular public schools. The results suggest that
charter schools are especially likely to raise the achievement of students who are poor or
Hispanic. In states that enacted earlier, stronger charter laws, charter schools tend to have a
larger advantage in achievement vis-a-vis their matched regular public school. There are,
however, exceptions such as North Carolina.
On the whole, the results suggest that the average charter school student in the United
States benefits from having a charter school alternative. These results should presumably make

21
us patient enough to wait for the results of more multi-year studies based on random lotteries
among charter school applicants. Such studies use the scientific method most likely to inform
policy debates on charter schools.

22
TABLE 1STATES’ CHARTER SCHOOL ENROLLMENT AND THE STUDY’S COVERAGE
State Charter Enrollment
as a % of State's
Total Enrollment
Charter Schools
Operating in 2002-
03 with at least 10
Students in the
Relevant Grade
(usually 4th)
Relevant Enrollment
in those Charter
Schools
This Study Covers
Approximately this
% of Charter
Students in the
Relevant Grade
United States 50,479 99%
Alaska 1.9% 11 252 100%
Arizona 6.1% 113 3,380 89%
Arkansas 0.2% 1 36 100%
California 2.5% 199 11,231 100%
Colorado 3.8% 58 2,743 100%
Connecticut 0.4% 4 129 100%
Delaware 4.3% 8 522 100%
D.C. 11.3% 12 471 100%
Florida 2.0% 93 3,964 100%
Georgia 1.7% 28 2,575 97%
Hawaii 1.8% 7 233 100%
Idaho 1.2% 7 271 100%
Illinois 0.4% 9 366 100%
Indiana 0.1% 7 150 100%
Kansas 0.4% 5 107 60%
Louisiana 0.6% 8 330 88%
Massachusetts 1.6% 20 1,211 100%
Michigan 3.8% 135 6,729 99%
Minnesota 1.4% 30 792 100%
Mississippi 0.1% 1 42 100%
Missouri 1.1% 14 783 100%
Nevada 0.8% 6 199 92%
New Jersey 0.9% 34 1,270 94%
New Mexico 1.4% 5 197 80%
New York 0.4% 23 1,059 100%
North Carolina 1.5% 59 1,963 100%
Ohio 1.9% 68 2,811 100%
Oklahoma 0.4% 1 40 100%
Oregon 0.4% 7 125 100%
Pennsylvania 1.8% 47 2,552 100%
Rhode Island 0.4% 2 26 54%
South Carolina 0.2% 4 94 100%
Texas 1.3% 86 2,524 100%
Utah 0.3% 4 130 100%
Virginia 0.0% 1 13 100%
Wisconsin 2.2% 26 1,146 100%
Wyoming 0.1% 1 13 100%Notes: Some percentages are less than 100 because states do not report performance of students in grades where
few students have test results or where the school has started up only that year. Sources: National Center for
Education Statistics, Common Core of Data; Author's Calculations Using States' Test Data.

23
TABLE 2
DIFFERENCES IN ACHIEVEMENT BETWEEN CHARTER SCHOOLS
AND THE NEAREST REGULAR PUBLIC SCHOOL WITH A SIMILAR RACIAL COMPOSITION
Average Difference between Charter School and Its Matched Regular Public School
in the Percentage of Students who are Proficient
Reading Mathematics
explanatory factor:
Charter School 4.6 ** 2.3 **
Notes: These are results from an univariate regression of the difference in percent proficient on an indicator for a
school's being a charter school. The results are representative of elementary grade students in charter schools. That
is, the regression is weighted by the number of students in the charter schools tested. A single asterisk indicates that
the difference is statistically significant with a confidence level of 90 percent. Double asterisks indicate that the
difference is statistically significant with a confidence level of 95 percent.
Source: Author's calculations based on proficiency data. The grade tested is generally the fourth grade, but fifth or
third graders' results are used for states that do not test the fourth grade. See the Data Appendix for a full list.
TABLE 3
THE EFFECT OF CHARTER SCHOOLS ON ACHIEVEMENT
CONTROLLING FOR SCHOOLS THAT SELECT AT-RISK OR GIFTED STUDENTS
Average Difference between Charter School and Its Matched Regular Public School
in the Percentage of Students who are Proficient
Controlling for Schools that Target At-Risk or Gifted Students
Reading Mathematics
explanatory factor:
Charter School 5.2 ** 3.2 **
Targets At-Risk
Students
-8.5 ** -13.5 **
Targets Gifted
Students
n/a n/a
Notes: These are results from a multivariate regression of the difference in percent proficient on an indicator for a
school's being a charter school, a school's targeting at-risk students, and a school's targeting gifted students. In the
study, there are 91 charter schools that target at-risk students and 3 charter schools that target gifted students. The
results are representative of elementary grade students in charter schools. That is, the regression is weighted by the
number of students in the charter schools tested. A single asterisk indicates that the difference is statistically
significant with a confidence level of 90 percent. Double asterisks indicate that the difference is statistically
significant with a confidence level of 95 percent. "n/a" indicates that there is no statistically significant finding to
report.
Source: Author's calculations based on states' proficiency data. The grade tested is generally the fourth grade, but
fifth or third graders' results are used for states that do not test the fourth grade. See the Data Appendix for a full
list. See text for definitions for a description of how schools were classified as targeting at-risk or gifted students.

24
TABLE 4
THE EFFECT OF CHARTER SCHOOLS ON ACHIEVEMENT, BY STATE
Average Difference between Charter School and Its Matched Regular Public School
in the Percentage of Students who are Proficient
(Controlling for Schools that Target At-Risk or Gifted Students)
Reading Mathematics
United States 5.2 ** 3.2 **
Alaska 19.3 ** 19.6 **
Arizona 9.6 ** 10.3 **
California 8.5 ** 5.0 **
Colorado 12.3 ** 13.5 **
District of Columbia 12.3 ** 13.0 **
Florida 4.5 ** 2.8
Georgia 6.1 ** 4.6
Hawaii 14.3 ** 12.1 **
Illinois 16.2 ** 21.0 *
Louisiana 32.9 ** 29.1 **
Massachusetts 8.4 ** 7.8 **
Michigan -3.2 -0.7
North Carolina -4.3 ** -4.3 **
New Jersey 12.1 ** 6.7
New York n/a n/a
Ohio n/a n/a
Oregon 13.9 * n/a
Pennsylvania 8.8 ** n/a
Texas n/a -6.8 *
Wisconsin n/a n/aNotes: These are results from multivariate regressions of the difference in percent proficient on an indicator for a
school's being a charter school, a school's targeting at-risk students, and a school's targeting gifted students. The
results are representative of elementary grade students in charter schools. That is, the regression is weighted by the
number of students in the charter schools tested. A single asterisk indicates that the difference is statistically
significant with a confidence level of 90 percent. Double asterisks indicate that the difference is statistically
significant with a confidence level of 95 percent. "n/a" indicates that there is no statistically significant finding to
report.
Source: Author's calculations based on states' proficiency data. The grade tested is generally the fourth grade, but
fifth or third graders' results are used for states that do not test the fourth grade. See the Data Appendix for a full
list.

25
TABLE 5
HOW THE EFFECT OF CHARTER SCHOOLS DEPENDS ON THE
NUMBER OF YEARS A SCHOOL HAS BEEN IN OPERATION
Difference between Charter School and Its Matched Regular Public School
in the Percentage of Students who are Proficient
Allowing the Effect to Depend on the Years a Charter School has Been Operating
Reading Mathematics
explanatory factor:
Charter School that
has been operating 1-
4 years
2.5 ** n/a
Charter School that
has been operating 5-
8 years
5.2 ** 4.0 **
Charter School that
has been operating 9-
11 years
10.1 ** 10.8 **
Targets At-Risk
Students
-8.6 ** -13.6 **
Targets Gifted
Students
n/a n/a
Notes: These are results from a multivariate regression of the difference in percent proficient on an indicator for a
school's being a charter school that has been operating for 1-4 years, operating for 5-8 years, operating for 9-11
years; a school's targeting at-risk students, and a school's targeting gifted students. In the study, there are 91 charter
schools that target at-risk students and 3 charter schools that target gifted students. The results are representative of
elementary grade students in charter schools. That is, the regression is weighted by the number of students in the
charter schools tested. A single asterisk indicates that the difference is statistically significant with a confidence
level of 90 percent. Double asterisks indicate that the difference is statistically significant with a confidence level
of 95 percent. "n/a" indicates that there is no statistically significant finding to report.
Source: Author's calculations based on states' proficiency data. The grade tested is generally the fourth grade, but
fifth or third graders' results are used for states that do not test the fourth grade. See the Data Appendix for a full
list.

26
TABLE 6
HOW THE EFFECT OF CHARTER SCHOOLS DEPENDS ON
EQUALITY OF SUPPORT FOR CHARTER SCHOOLS
Difference between Charter School and Its Matched Regular Public School
in the Percentage of Students who are Proficient
Allowing the Effect to Depend on Whether Charter Schools Have Substantially
Less Funding than Regular Public Schools
Reading Mathematics
explanatory factor:
Charter School's
Funding is Less Than
40% of Regular
Public Schools'
Funding
-6.4 ** -11.7 **
Charter School that
has been operating 1-
4 years
3.8 ** n/a
Charter School that
has been operating 5-
8 years
5.6 ** 4.8 **
Charter School that
has been operating 9-
11 years
10.1 ** 10.7 **
Targets At-Risk
Students
-8.0 ** -12.6 **
Targets Gifted
Students
n/a n/a
Notes: These are results from a multivariate regression of the difference in percent proficient on an indicator for a
school's being a charter school that has been operating for 1-4 years, operating for 5-8 years, operating for 9-11
years; a school's targeting at-risk students, and a school's targeting gifted students. In the study, there are 91 charter
schools that target at-risk students and 3 charter schools that target gifted students. The results are representative of
elementary grade students in charter schools. That is, the regression is weighted by the number of students in the
charter schools tested. A single asterisk indicates that the difference is statistically significant with a confidence
level of 90 percent. Double asterisks indicate that the difference is statistically significant with a confidence level
of 95 percent. "n/a" indicates that there is no statistically significant finding to report.
Source: Author's calculations based on states' proficiency data. The grade tested is generally the fourth grade, but
fifth or third graders' results are used for states that do not test the fourth grade. See the Data Appendix for a full
list.

27
TABLE 7
THE U.S. AND STATES WITH LARGEST NUMBER OF CHARTER SCHOOLS
HOW THE EFFECT OF CHARTER SCHOOLS DEPENDS ON THE
NUMBER OF YEARS A SCHOOL HAS BEEN IN OPERATION
Difference between Charter School and Its Matched Regular Public School
in the Percentage of Students who are Proficient
Allowing the Effect to Depend on Whether a School Closed After the Year Tested
Reading
explanatory factor: U.S. Arizona California Florida
Charter School that has
been operating 1-5 years
3.1 ** 7.8 ** 5.7 ** n/a
Charter School that has
been operating 6-11 years
7.6 ** 11.5 ** 11.8 ** 11.5 **
Targets At-Risk Students -8.6 ** -11.5 * n/a n/a
Targets Gifted Students n/a n/a 1.8 * n/a
Math
explanatory factor: U.S. Arizona California Florida
Charter School that has
been operating 1-5 years
n/a 10.1 ** n/a n/a
Charter School that has
been operating 6-11 years
7.5 ** 10.5 ** 12.2 ** 15.3 **
Targets At-Risk Students -13.7 ** -20.6 * -16.8 ** -18.9 **
Targets Gifted Students n/a n/a 50.2 * n/a
Notes: These are results from a multivariate regression of the difference in percent proficient on an indicator for a
school's being a charter school that has been operating for 1-5 years, operating for 6-11 years; a school's targeting
at-risk students, and a school's targeting gifted students. The results are representative of elementary grade students
in charter schools. That is, the regression is weighted by the number of students in the charter schools tested. A
single asterisk indicates that the difference is statistically significant with a confidence level of 90 percent. Double
asterisks indicate that the difference is statistically significant with a confidence level of 95 percent. A result with
no asterisk is not a statistically significant finding. "n/a" indicates that there are no statistically significantly
findings to report.
Source: Author's calculations based on states' proficiency data. The grade tested is generally the fourth grade, but
fifth or third graders' results are used for states that do not test the fourth grade. See the Data Appendix for a full
list.

28
TABLE 8
SHOWING WHETHER CHARTER SCHOOLS HAVE A DIFFERENT EFFECT
ON ACHIEVEMENT IN AREAS WHERE A HIGH PERCENTAGE
OF STUDENTS ARE BLACK OR HISPANIC
Average Difference between Charter School and Its Matched Regular Public School
in the Percentage of Students who are Proficient
Allowing Effect to Differ By Share of Students who are Black & Hispanic in Area
Reading Mathematics
explanatory factor:
Charter Schools in Areas
where a High Percentage of
Students are African-
American
4.5 ** 2.6 **
Charter Schools in Areas
where a High Percentage of
Students are Hispanic
7.6 ** § 4.1 ** §
All Other Charter Schools 4.2 ** 2.1 **
Targets At-Risk Students -8.4 ** -13.4 **
Targets Gifted Students n/a n/a
Notes: These are results from a multivariate regression of the difference in percent proficient on an indicator for a
school's being a charter school, a school's being a charter school in an area where a high percentage of students are
African-American, a school's being a charter school in an area where a high percentage of students are Hispanic, a
school's targeting at-risk students, and a school's targeting gifted students. An area is classified as having a high
percentage of African-Americans if the share of students who are African-American in the matched charter-public
school pair is in the top quartile. Classification of highly Hispanic areas is exactly parallel. The results are
representative of elementary grade students in charter schools. That is, the regression is weighted by the number of
students in the charter schools tested. A single asterisk indicates that the difference is statistically significant with a
confidence level of 90 percent. Double asterisks indicate that the difference is statistically significant with a
confidence level of 95 percent. The symbol § indicates that the result is statistically significantly different from that
for "all other charter schools." "n/a" indicates that there is no statistically significant finding to report.
Source: Author's calculations based on states' proficiency data. The grade tested is generally the fourth grade, but
fifth or third graders' results are used for states that do not test the fourth grade. See the Data Appendix for a full
list.

29
TABLE 9
SHOWING WHETHER CHARTER SCHOOLS HAVE A DIFFERENT EFFECT
ON ACHIEVEMENT IN AREAS WHERE A HIGH PERCENTAGE OF STUDENTS ARE POOR
Average Difference between Charter School and Its Matched Regular Public School
in the Percentage of Students who are Proficient
Allowing Effect to Differ By Share of Students in Area who get Free/Reduced-Price Lunch
Reading Mathematics
explanatory factor:
Charter Schools in Areas
where a High Percentage of
Students are Poor
6.5 ** 4.8 **
All Other Charter Schools 2.6 ** § 4.7 **
Targets At-Risk Students -7.8 ** -12.3 **
Targets Gifted Students n/a n/a
Notes: These are results from a multivariate regression of the difference in percent proficient on an indicator for a
school's being a charter school, a school's being a charter school in an area where a high percentage of students are
poor, a school's targeting at-risk students, and a school's targeting gifted students. An area is classified as having a
high percentage of students who are poor if the share of students who get free or reduced-price lunch in the matched
charter-public school pair is in the top quartile for the state. The results are representative of elementary grade
students in charter schools. That is, the regression is weighted by the number of students in the charter schools
tested. A single asterisk indicates that the difference is statistically significant with a confidence level of 90 percent.
Double asterisks indicate that the difference is statistically significant with a confidence level of 95 percent. The
symbol § indicates that the result is statistically significantly different from that for "all other charter schools." "n/a"
indicates that there is no statistically significant finding to report.
Source: Author's calculations based on states' proficiency data. The grade tested is generally the fourth grade, but
fifth or third graders' results are used for states that do not test the fourth grade. See the Data Appendix for a full
list.

30
APPENDIX TABLE 1
DIFFERENCES IN ACHIEVEMENT BETWEEN CHARTER SCHOOLS
AND THE NEAREST REGULAR PUBLIC SCHOOL§
Average Difference between Charter School and Its Matched Regular Public School
in the Percentage of Students who are Proficient
Reading Mathematics
explanatory factor:
Charter School 3.6 ** 1.3 *
Notes: The nearest regular public school is, for this table, based purely on distance. These are results from an§
univariate regression of the difference in percent proficient on an indicator for a school's being a charter school.
The results are representative of elementary grade students in charter schools. That is, the regression is weighted by
the number of students in the charter schools tested. A single asterisk indicates that the difference is statistically
significant with a confidence level of 90 percent. Double asterisks indicate that the difference is statistically
significant with a confidence level of 95 percent.
Source: Author's calculations based on proficiency data. The grade tested is generally the fourth grade, but fifth or
third graders' results are used for states that do not test the fourth grade. See the Data Appendix for a full list.
APPENDIX TABLE 2
THE EFFECT OF CHARTER SCHOOLS ON ACHIEVEMENT
CONTROLLING FOR SCHOOLS THAT SELECT AT-RISK OR GIFTED STUDENTS
Average Difference between Charter School and the Nearest Regular Public School§
in the Percentage of Students who are Proficient
Controlling for Schools that Target At-Risk or Gifted Students
Reading Mathematics
explanatory factor:
Charter School 4.1 ** 2.3 **
Targets At-Risk
Students
-7.9 ** -13.4 **
Targets Gifted
Students
n/a n/a
Notes: The nearest regular public school is, for this table, based purely on distance. These are results from a§
multivariate regression of the difference in percent proficient on an indicator for a school's being a charter school, a
school's targeting at-risk students, and a school's targeting gifted students. In the study, there are 91 charter schools
that target at-risk students and 3 charter schools that target gifted students. The results are representative of
elementary grade students in charter schools. That is, the regression is weighted by the number of students in the
charter schools tested. A single asterisk indicates that the difference is statistically significant with a confidence
level of 90 percent. Double asterisks indicate that the difference is statistically significant with a confidence level
of 95 percent. "n/a" indicates that there is no statistically significant finding to report.
Source: Author's calculations based on states' proficiency data. The grade tested is generally the fourth grade, but
fifth or third graders' results are used for states that do not test the fourth grade. See the Data Appendix for a full
list. See text for definitions for a description of how schools were classified as targeting at-risk or gifted students.

31
DATA APPENDIX
Location, Enrollment, and School Classification Information comes from:
United States Department of Education, National Center for Education Statistics.
Common Core of Data, 2002-03 school year.
Electronic data. http://nces.ed.gov/ccd/ccddata.asp
supplemented with data from www.geocode.com when necessary;
Center for Education Reform, Charter School Directory 2004. Washington, D.C.: The Center
for Education Reform, 2004.
Center for Education Reform, Charter School Laws Across the States 2004. Washington, D.C.:
The Center for Education Reform, 2004.
State Proficiency data comes from:
State of Alaska, Department of Education and Early Development.
Terra Nova Cat/6, Reading and Mathematics exam, Grade 4 Results, 2002-03 school year.
Electronic data. http://www.eed.state.ak.us/tls/assessment/results.html.
State of Arizona, Department of Education, Accountability Division, Research and
Evaluation Section.
Arizona's Instrument to Measure Standards (AIMS) test, Grade 5 results, 2003-04 school year.
Electronic data. http://www.ade.state.az.us/profile/publicview/
State of Arkansas, Department of Education.
Arkansas Benchmark Exam, Grade 4 Results, 2003-04 school year.
Electronic data. http://arkedu.state.ar.us/whats_new/BENCHMARK.htm

32
State of California, Department of Education.
California Standardized Testing and Reporting (STAR) program, Grade 4 Results, 2003-04
school year.
Electronic data. http://star.cde.ca.gov/star2004/index.asp
State of Colorado, Department of Education.
Colorado Student Assessment (CSAP), Grade 4 reading results, Grade 5 mathematics results,
2003-04 school year.
Electronic data. http://www.cde.state.co.us/index_assess.htm
State of Connecticut, Department of Education.
Connecticut Mastery Test (CMT), Grade 4 Results, 2002-03 school year.
Electronic data. http://www.cmtreports.com
State of Delaware, Department of Education.
Delaware Student Testing Program (DSTP), Grade 5 results, 2003-04 data school year.
Electronic data. http://dstp.doe.state.de.us/DSTPMART/SummaryMenu.asp
District of Columbia Public Schools. Stanford 9 test, Grade 4 results, 2003-04 school year.
Electronic data. http://silicon.k12.dc.us/apds/APDSSummaryReports.asp
District of Columbia Public Charter School Board. Stanford 9 test, Grade 4 results, 2003-04
school year.
Electronic data. http://www.dcpubliccharter.com/
State of Florida, Department of Education.
Florida Comprehensive Assessment Test (FCAT), Grade 4 results, 2003-04 school year.
Electronic data. http://fcat.fldoe.org/
State of Georgia, Department of Education.

33
Criterion Referenced Competency Test (CRCT), Grade 4 results, 2002-03 school year.
Electronic data. http://reportcard.gaosa.org/
State of Hawaii, Department of Education.
Hawaii State Assessment (HSA) test, Grade 5 results, 2002-03 school year.
Electronic data. http://doe.k12.hi.us/
State of Idaho, Board of Education.
Idaho Standards Achievement Test (ISAT), Grade 4 results, 2003-04 school year.
Electronic data. http://www.idahoboardofed.org/saa/
State of Illinois, Board of Education.
Illinois Standards Achievement Test (ISAT), Grade 5 results, 2002-03 school year.
Electronic data. http://www.isbe.net/research/default.htm
State of Indiana, Department of Education.
Indiana Statewide Testing for Educational Progress-Plus (ISTEP+), Grade 3 results, 2003-04
school year.
Electronic data. http://www.doe.state.in.us/istep/welcome.html
State of Kansas, Department of Education.
Kansas State Assessment, Grade 5 results, 2002-03 school year.
Electronic data. http://www.ksde.org/assessment/
State of Louisiana, Department of Education.
Louisiana Educational Assessment Program (LEAP), Grade 4 results, 2003-04 school year.
Electronic data. http://www.doe.state.la.us/lde/accountability/home.html
Commonwealth of Massachusetts, Department of Education.
Massachusetts Comprehensive Assessment System (MCAS), Grade 4 results, 2002-03 school

34
year.
Electronic data. http://www.doe.mass.edu/mcas/
State of Michigan, Department of Education.
Michigan Education Assessment Program (MEAP), Grade 4 results, 2003-04 school year.
Electronic data. http://www.michigan.gov/mde
State of Minnesota, Department of Education.
Minnesota Comprehensive Assessment (MCA), Grade 5 results, 2003-04 school year.
Electronic data. http://education.state.mn.us/ReportCard2004/
State of Mississippi, Department of Education.
Mississippi Curricuum Test Data (MCT), Grade 4 results, 2003-04 school year.
Electronic data. http://www.mde.k12.ms.us/ACAD/
State of Missouri, Department of Elementary and Secondary Education.
Missouri Assessment Program (MAP), Grade 4 results (math), Grade 3 results (reading, known
as Communication Arts), 2003-04 school year.
Electronic data. http://www.dese.state.mo.us/commissioner/statereportcard/
State of Nevada, Department of Education.
Nevada Criterion-Referenced Examination, Grade 5 results, 2003-04 school year.
Electronic data. http://nevadareportcard.com/
State of New Jersey, Department of Education.
Elementary School Proficiency Assessment (ESPA), Grade 4 results, 2002-03 school year.
Electronic data. http://education.state.nj.us/rc/index.html
State of New Mexico, Public Education Department.
New Mexico Standards-Based Assessment (NMSBA), Grade 4 results, 2003-04 school year.

35
Electronic data. http://www.sde.state.nm.us
State of New York, State Education Department (University of the State of New York).
New York State Testing Program, Grade 4 results, 2002-03 school year.
Electronic data. http://www.emsc.nysed.gov/irts/
State of North Carolina, State Board of Education, Department of Public Instruction.
ABCs of Public Education Tests, Grade 4 results, 2003-04 school year.
Electronic data. http://abcs.ncpublicschools.org/abcs/
State of Ohio, Department of Education.
Ohio Achievement Tests, Grade 4 results, 2003-04 school year.
Electronic data. http://ilrc.ode.state.oh.us/
State of Oklahoma, Department of Education.
Oklahoma Core Curriculum Test, Grade 5 results, 2002-03 school year.
Electronic data. http://www.schoolreportcards.org/
State of Oregon, Department of Education.
Oregon Statewide Assessment (OSA), Grade 5 results, 2003-04 school year.
Electronic data. www.ode.state.or.us/asmt/
Commonwealth of Pennsylvania, Department of Education.
Pennsylvania System of School Assessment (PSSA), Grade 5 results, 2003-04 school year.
Electronic data. http://www.pde.state.pa.us/a_and_t/
State of Rhode Island, Department of Elementary and Secondary Education.
New Standards Reference Exam, Grade 4 results, 2002-03 school year.
Electronic data. http://www.ridoe.net/standards/stateassessment/

36
State of South Carolina, Department of Education.
Palmetto State Achievement Tests (PACT), Grade 4 results, 2002-03 school year.
Electronic data. http://www.myscschools.com/reportcard/2003/
State of Texas, Department of Education.
Texas Assessment of Knowledge and Skills (TAKS), Grade 4 results, 2002-03 school year.
Electronic data. http://www.tea.state.tx.us/perfreport/
State of Utah, Office of Education.
Core CRT test, Grade 4 results, 2003-04 school year.
Electronic data. http://www.usoe.k12.ut.us/eval/evaluation/
State of Virginia, Department of Education.
Standards of Learning (SOL), Grade 5 results, 2002-03 school year.
Electronic data. http://www.pen.k12.va.us/VDOE/Assessment/home.shtml
State of Wisconsin, Department of Public Instruction.
Wisconsin Knowledge and Concepts Examination (WKCE), Grade 4 results, 2003-04 school
year.
Electronic data. http://data.dpi.state.wi.us/data/performance.asp
State of Wyoming, Department of Education.
Wyoming Comprehensive Assessment System (WyCAS), Grade 4 results, 2003-04 school year.
Electronic data. http://www.k12.wy.us/aa.asp
Note: The above list contains the sources of state assessment data. The most recent assessment
data published by each state in mid August 2004 were used. States not shown had no charter
school enrollment in the relevant grade in 2002-03.

37
1. In states where fourth graders are not tested, fifth or third graders’ achievement is examined. See below for details.
2. See Hoxby and Rockoff, "The Impact of Charter Schools on Student Achievement", 2004.http://post.economics.harvard.edu/faculty/hoxby/papers.html
3. The National Assessment of Educational Progress (NAEP) is a reliable test that has provenextraordinarily useful for tracking American achievement over time. Its sampling scheme iscarefully designed to this end. However, NAEP was not designed for comparisons betweenregular public schools and a phenomena as scarce and as idiosyncratically distributed as charterschools. Essentially, the problem is the following. NAEP is designed to be representative ofAmerican schools in general. NAEP picks up charter schools but only where they really are andin proportion to their share in the population (1.5 percent of students). Because charter schoolsare highly unusual and idiosyncratically distributed, the NAEP sample of charter school studentsis unusual and idiosyncratically distributed. The NAEP sample of regular public school studentsis, in contrast, usual. It thus includes many students who have no comparable peer in the charterschool sample. Crude comparisons using NAEP data inevitably include inappropriate publicschool students in the control group.
4. The list of tests and data sources is in the Data Appendix.
5. In addition, it is wise to focus on elementary schools because charter schools aredisproportionately elementary schools. For instance, fourth graders make up more than 11.3percent of charter school students, even though they would make up only 7.6 percent if charterschools were equally distributed over all grades between kindergarten and twelfth.
6. For a study like this, it is important to use the uniform method to determine whether a schoolshould be included and how it should be classified. The 2002-03 Common Core of Data (UnitedStates Department of Education, National Center for Education Statistics) was used as thestandard. All state data was mapped onto, and classified according to, the Common Core. Charter schools that did not exist at the time recorded by the Common Core are not included inthe study.
7. Some states have an English language arts exam or exams. In all cases, the exam or part ofthe exam closest to reading is used.
8. The No Child Left Behind (NCLB) law has caused all states to be explicit about theirproficiency standards. The states’ proficiency levels were used. The vast majority of the time,these are also the levels used for Adequate Yearly Progress calculations under NCLB. Thisstudy presents results based on proficiency levels because they are available for all states and aremeasured in the same units (the percentage who are proficient). Many states publish scale scoresalso. When standardized, the scale scores produce findings that confirm those based on theproficiency levels.
Endnotes
38
9. At the time this study was conducted, the District of Columbia and 14 states had publishedtheir data for the 2003-04 school year. 2002-03 data are used for the remaining 22 states. It isadvantageous to use the 2003-04 data whenever available because participation rates rose innearly all states between the two year, owing to the implementation of NCLB.
10. In most cases, the Common Core of Data 2002-03 provides the latitude and longitude ofschools. The remaining school addresses were translated into latitude and longitude bygeocode.com. See Data Appendix for citations.
11. The geocoding of address data has a small margin of error because addresses are mapped todiscrete, not continuous, points of latitude and longitude in the United States. For instance, mostaddresses are mapped to a Census block. Then, the latitude and longitude at the center of thatblock are used. (The block is the smallest summary area used by the United States Census ofPopulation). Some addresses are mapped by broader area–at worst, to a zipcode area.
The result of mapping addresses to discrete points of latitude and longitude is thatschools with distances within 3 percent of one another are ties for the nearest public school. Indense urban areas, 0.3 miles rather than 3 percent defines a tie. When a tie occurs (usually, thereis none), it is broken by using the school with the racial composition most similar to that of thecharter school. The pool of potential comparison schools does not include non-regular publicschools, such as alternative schools, schools for the disabled, schools that admit students basedon examinations, and magnet schools to which a student must apply.
12. Compared to students in the nearest regular public school, charter schools’ fourth gradersare 2.4 percent more likely to be black, 1 percent less likely to be Asian, and 8 percent less likelyto be Hispanic. If the free and reduced-price lunch programs generated pure measures ofpoverty, it would also be useful to match charter schools on the basis of these programs. However, the lunch program measures participation, not the eligibility of students, which isbased purely on their family income. Charter schools that are small or recent start ups tend notto participate in the lunch programs even if some of their students are eligible. For a smallschool, the costs of running a formal program may exceed the benefits, and the school canalways run an informal meals program.
13. For statistical work on this topic, see Heckman, Ichimura, and Todd, Review of EconomicStudies 1997, 1998; Rubin and Thomas, Annals of Statistics 1992; Rubin and Thomas,Biometrika 1992; Rosenbaum Journal of the American Statistical Association 1989; Hirano,Imbens and Ridder, NBER Technical Working Paper 251, 2000; Hahn, Econometrica 1998.
14. Strictly speaking, they are representative of the 99 percent of charter school students whoare covered by this study.
15. The computation of standard errors that are robust to heteroskedasticity does not affectwhich are reported.
16. In the tables, asterisks are used to indicate whether the confidence level is 90 percent or 95percent.

39
17. The federal enrollment data are from the United States Department of Education, CommonCore of Data, 2002-03. It is useful for computing comparable enrollment statistics across states,for computing the racial composition of schools, and for identifying the location of schools. Seethe Data Appendix for the full citation.
18. The coverage ratio is approximate, not exact, because some students who are enrolled inthe fall are no longer enrolled in the same school when state tests are administered. In addition,federal enrollment data are not yet available for 2003-04.
19. In a small number of cases, there was an ambiguity in the Charter School Directory 2004 orCharter School Laws Across the States 2004--most often a charter school that had movedcampuses. Ambiguities were cleared up through consultation of schools' and states' onlinematerials.
20. A school is classified as targeting at-risk students if its description in the Charter SchoolDirectory 2004 says that its program is for students who are "at-risk"; "drop-outs";"delinquents"; or under the care of the state, the courts, or the juvenile detention system. Aschool if classified as targeting gifted students if its description in the Charter School Directory2004 says that its program is for students or "gifted" or "talented".
21. Whether a state has results that are statistically significant depends not only on its number ofcharter school students but also on the variation in the difference between charter students’achievement and the achievement of students in the comparison schools. The greater is thisvariation, the greater the noise, and the less likely are the results to be statistically significant.
22. It should be noted that Louisiana's results, though statistically significant, are impreciselymeasured, owing to the small number of charter schools in the state.
23. The reference is to Louann Bierlein Palmer and Rebecca Gau, Charter School Authorizing: Are States Making the Grade? Washington, DC: Thomas D. Fordham Institute, 2003.
24. This fact can be established formally by performing principal component analysis on thecriteria in The Center for Education Reform's or The Fordham Foundation's rankings of charterschool laws. States that give charter schools only a small fraction of the funding of regularpublic schools tend to support charter schools less on many dimensions, as shown by thecorrelation between the funding ratio and the first principal component.
25. In other words, one wants to avoid overclassifying areas in, say, Mississippi as poor andareas in, say, California as non-poor.