Chicago Health Atlas - NACCHO · called a hash value or “message digest ... BRFSS* vs. Chicago...
42
Chicago Health Atlas Context, current status, and future work April 30, 2013 Roderick (Eric) Jones, MPH Chicago Department of Public Health
Transcript of Chicago Health Atlas - NACCHO · called a hash value or “message digest ... BRFSS* vs. Chicago...
Chicago Health Atlas Context, current status, and future work
April 30, 2013
Roderick (Eric) Jones, MPH
Chicago Department of Public Health

Session Preview
• What is the Chicago Health Atlas?
• Background:
Contextual factors that play a role in the
collaboration
• Current work:
Getting started, developing matching algorithms,
minimizing reidentification risk
• Challenges and lessons learned:
Deriving meaning and delivering it to people who
can use it
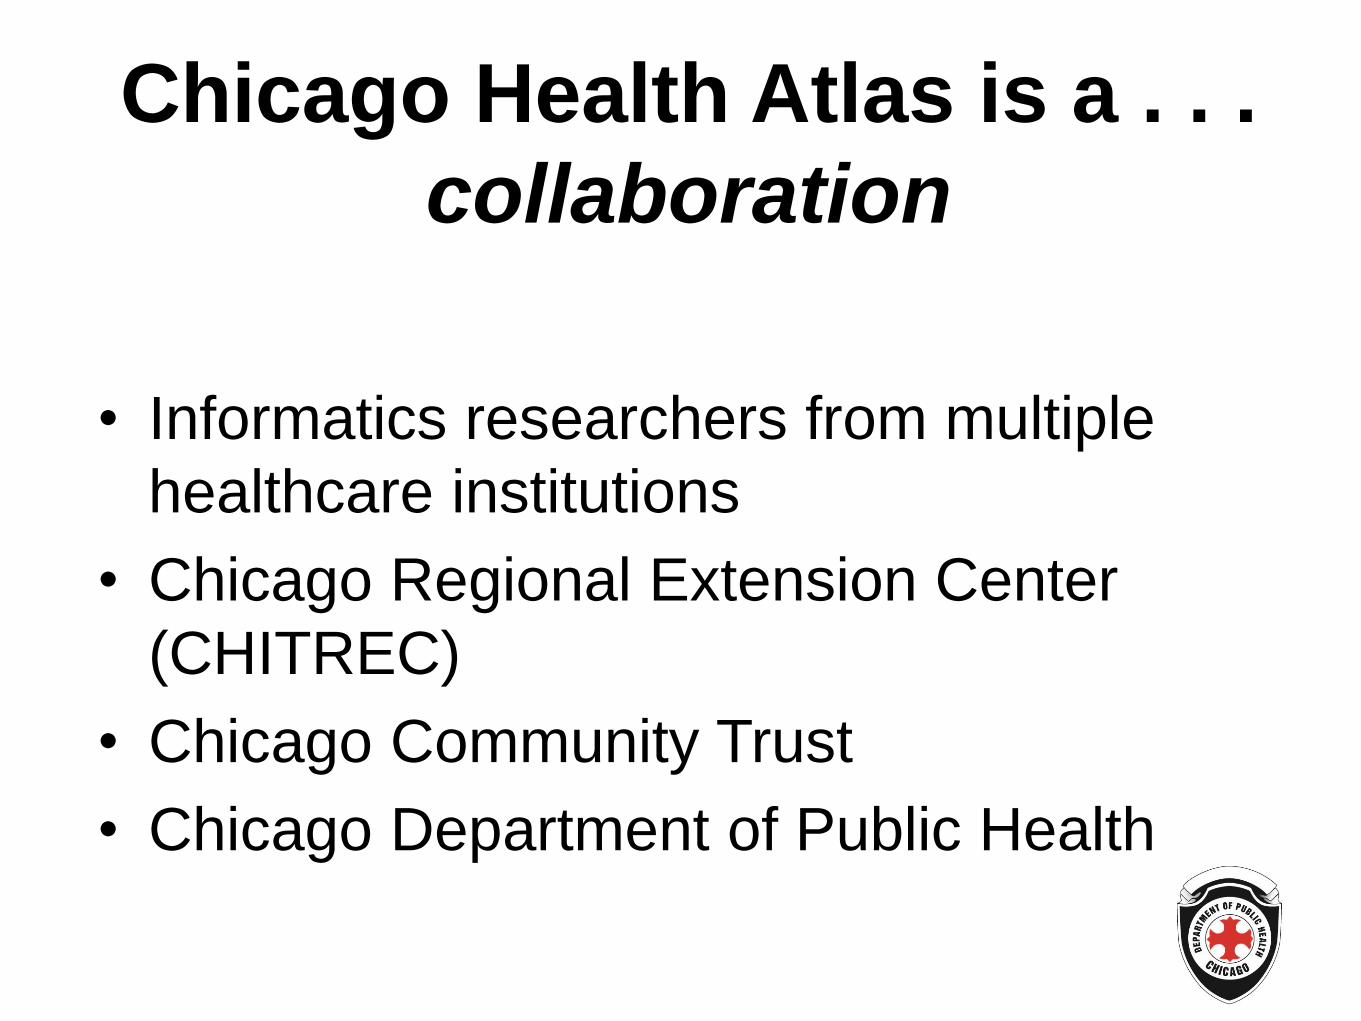
Chicago Health Atlas is a . . .
collaboration
• Informatics researchers from multiple
healthcare institutions
• Chicago Regional Extension Center
(CHITREC)
• Chicago Community Trust
• Chicago Department of Public Health

Chicago Health Atlas is a . . .
website

Chicago Health Atlas is a . . .
database
• De-identified electronic health record
data for ~1 million Chicagoans
• In-patient and out-patient visits spanning
2006-2011
• Individual patient records matched
across institutions
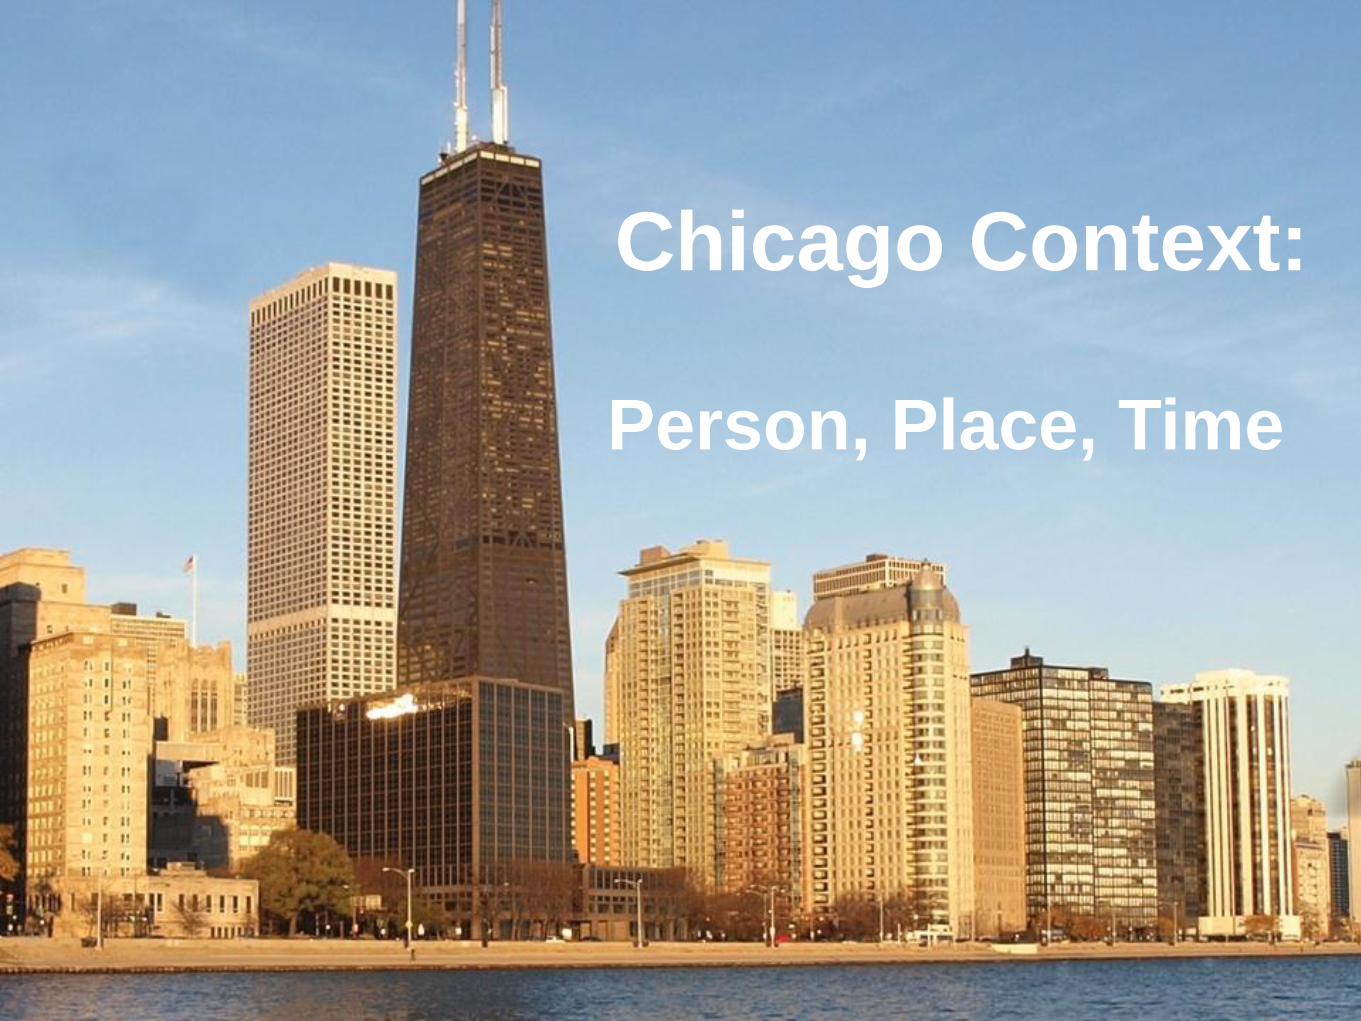
Chicago Context:
Person, Place, Time
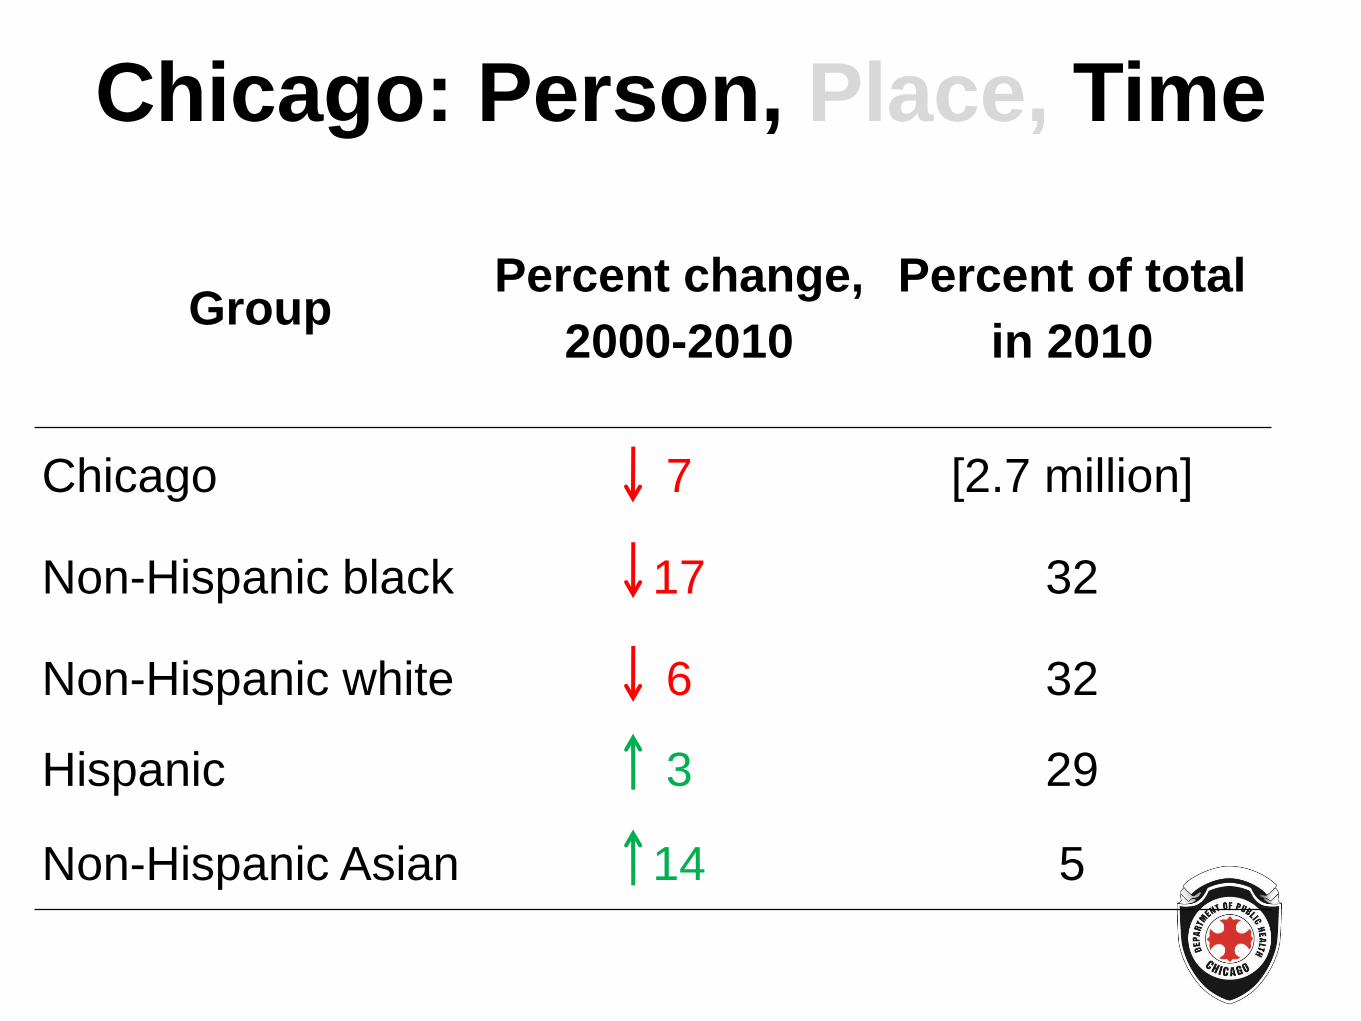
Chicago: Person, Place, Time
Group Percent change,
2000-2010
Percent of total
in 2010
Chicago 7 [2.7 million]
Non-Hispanic black 17 32
Non-Hispanic white 6 32
Hispanic 3 29
Non-Hispanic Asian 14 5

Chicago: Person, Place, Time 229 Square miles
77 neighborhood “Community areas”
with population median of 31,000
(range, 3,000 – 99,000)
Stem Leaf # Boxplot
9 9 1 0
9 4 1 |
8 |
8 02 2 |
7 99 2 |
7 23 2 |
6 |
6 44 2 |
5 556667 6 |
5 223 3 |
4 559 3 +-----+
4 0124 4 | |
3 5666799 7 | + |
3 01112233 8 *-----*
2 55669 5 | |
2 01123334 8 | |
1 568888899 9 +-----+
1 01233334 8 |
0 6679 4 |
0 33 2 |
----+----+----+----+
Multiply Stem.Leaf by 10**+4
All but two community areas have
larger populations than the least-
populated Illinois county
O’Hare
Midway
Lake Michigan
Suburban Cook County
Loop
Chicago Context:
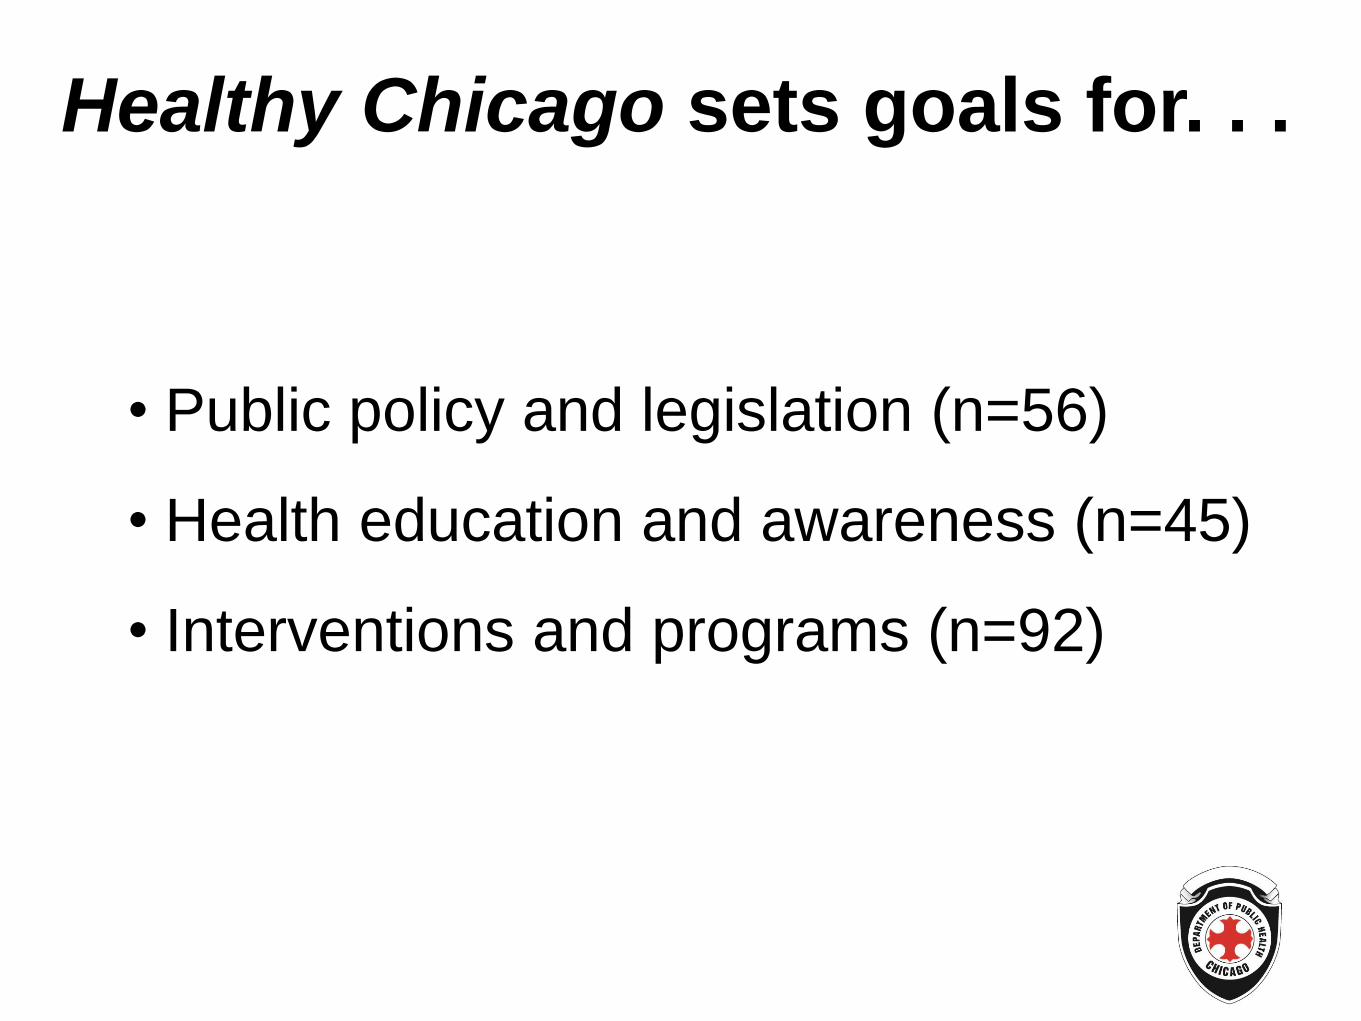
• Public policy and legislation (n=56)
• Health education and awareness (n=45)
• Interventions and programs (n=92)
Healthy Chicago sets goals for. . .
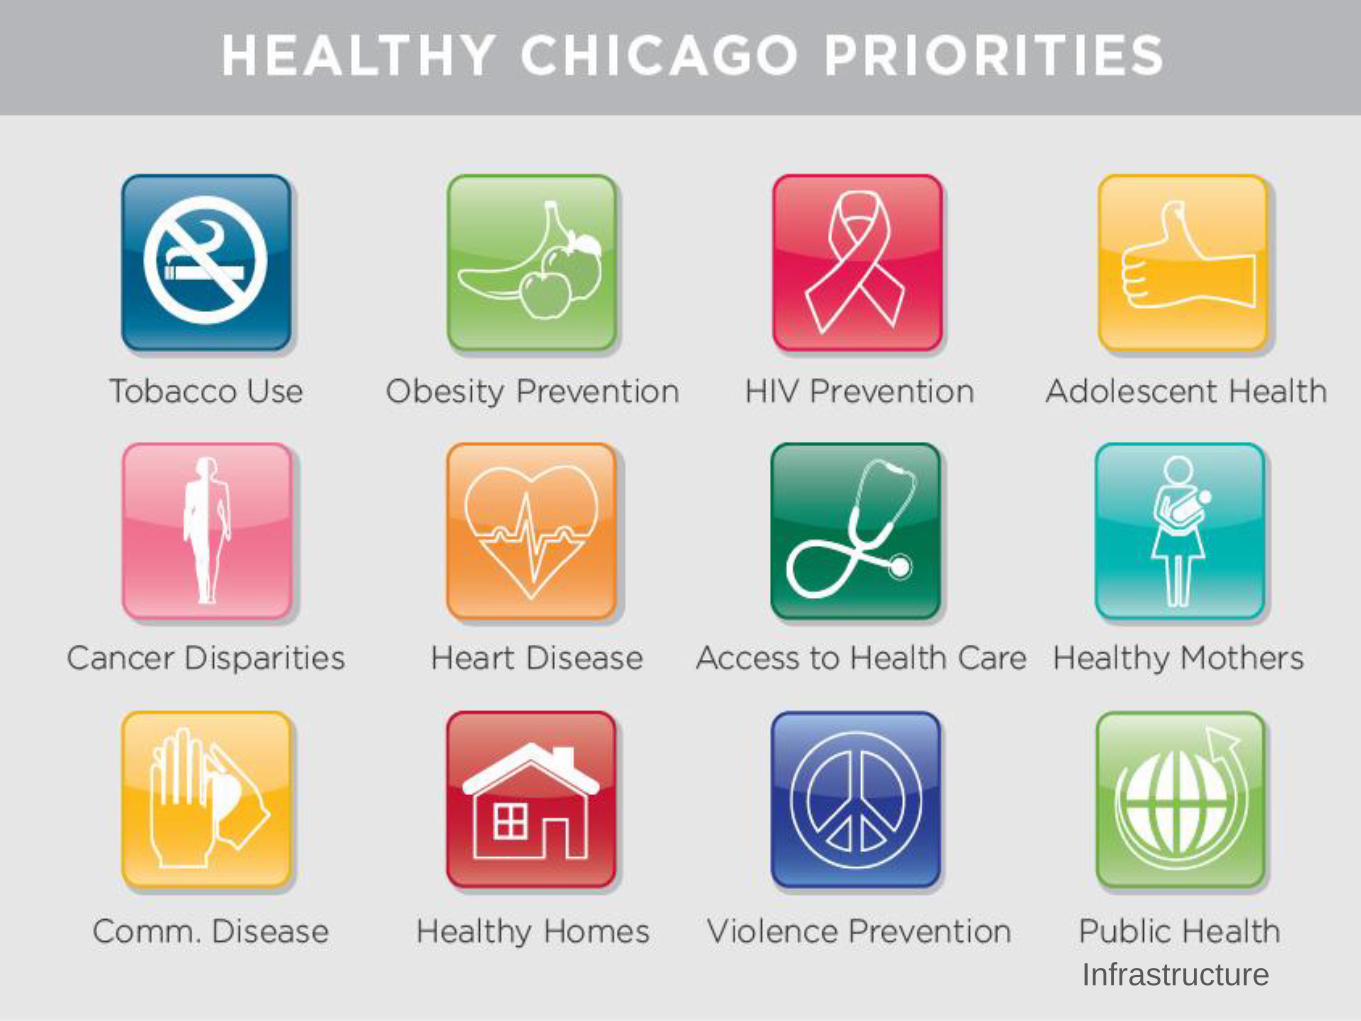
HEALTHY CHICAGO Chicago Department of Public Health
Infrastructure
Highlights Infrastructure
• Establish an Office of Epidemiology and
Public Health Informatics
• Expand epidemiology capacity through an
increase in staff and the development of
strategic partnerships with other entities who
use or collect public health data
NYC Macroscope
Scientific Advisory Group
• New York City has embarked on a study to
validate population health estimates from its
Primary Care Information Project
• CDPH involvement has lead to collaboration
on developing vision and methodology for
more widespread use of EHR data for public
health
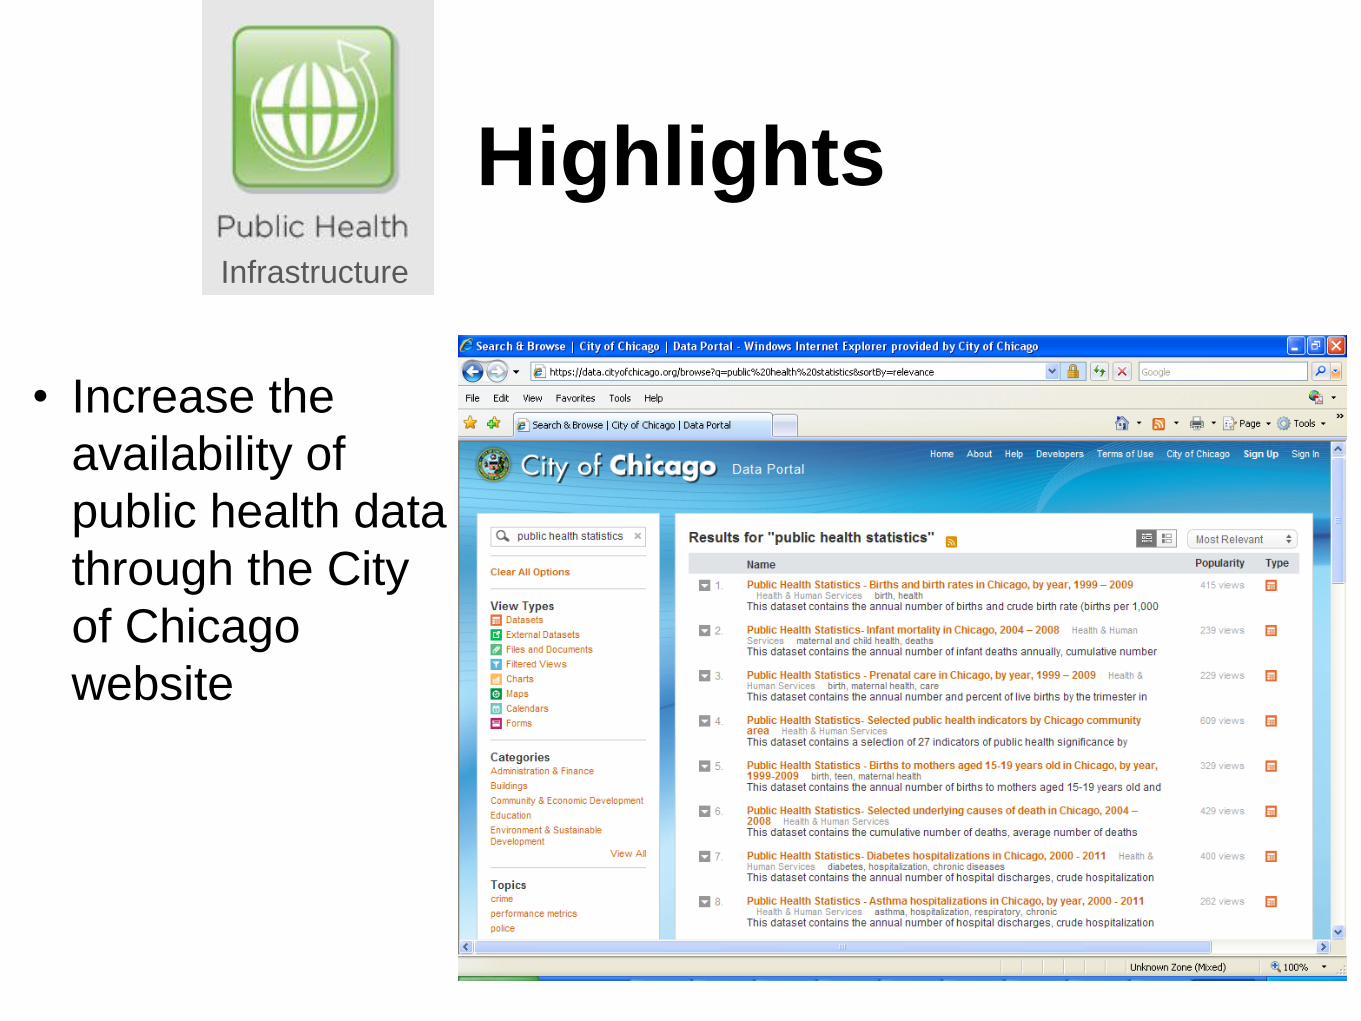
Highlights Infrastructure
• Increase the
availability of
public health data
through the City
of Chicago
website
Chicago Context:
Health Information Exchange
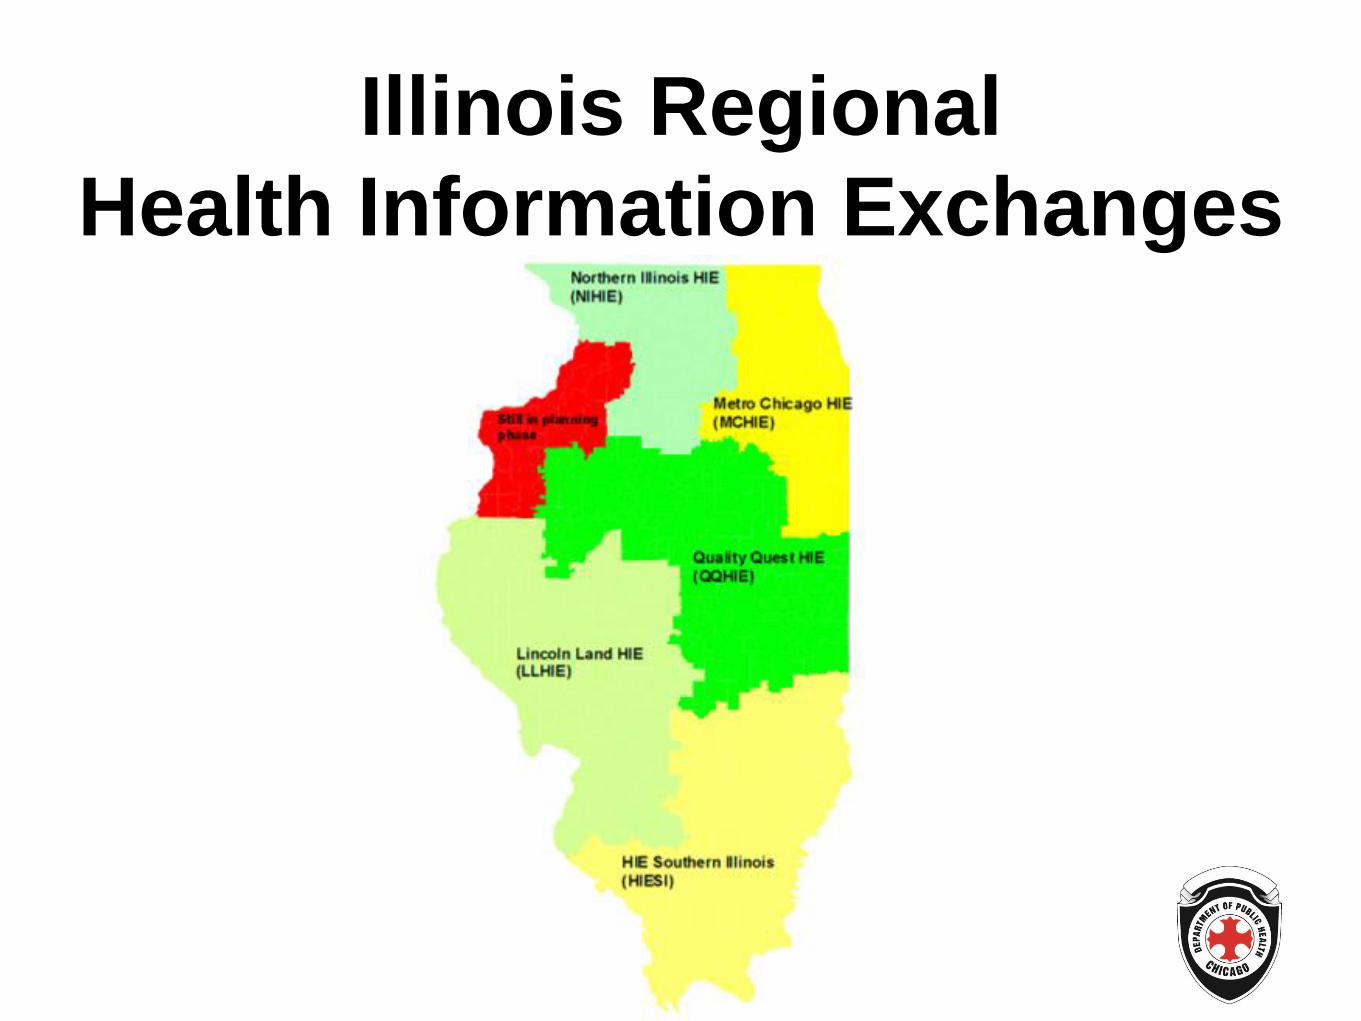
Illinois Regional
Health Information Exchanges
Even if we don’t have a mature
HIE or a Regenstrief Institute,
is it possible to . . .
• Leverage existing EHR data,
• Weave together data from multiple
institutions with publicly available data,
• Measure disease burden and care delivered?

Process – getting started
• Coordinated IRB approval across multiple
institutions
• Limited to structured data, no free text
• Constrained to adults aged 18-89
• Focus on 606xx zip codes, with known
overlapping care institutions and high
population density
Data Dictionary
• Standardized specifications for data
extractions from participating sites
–Demographics
–Vital signs
–Encounter type
–Diagnoses
–Medications
–Laboratory tests
Methods
Patient de-identification and
matching across sites

How we “Hashed” our Data
One-way hash algorithms take in identifiers and produce a fixed-size output
called a hash value or “message digest”
John O’Dwyer 6/12/1970 M 987654329 20802322ED366A1EFD562A6219C4D7AF993BADAD
Java application is run on institution side of firewall,
creates 5 hash IDs depending on availability of last name, first name,
date of birth, gender, Social security number.
X:\Data\Institution A patients
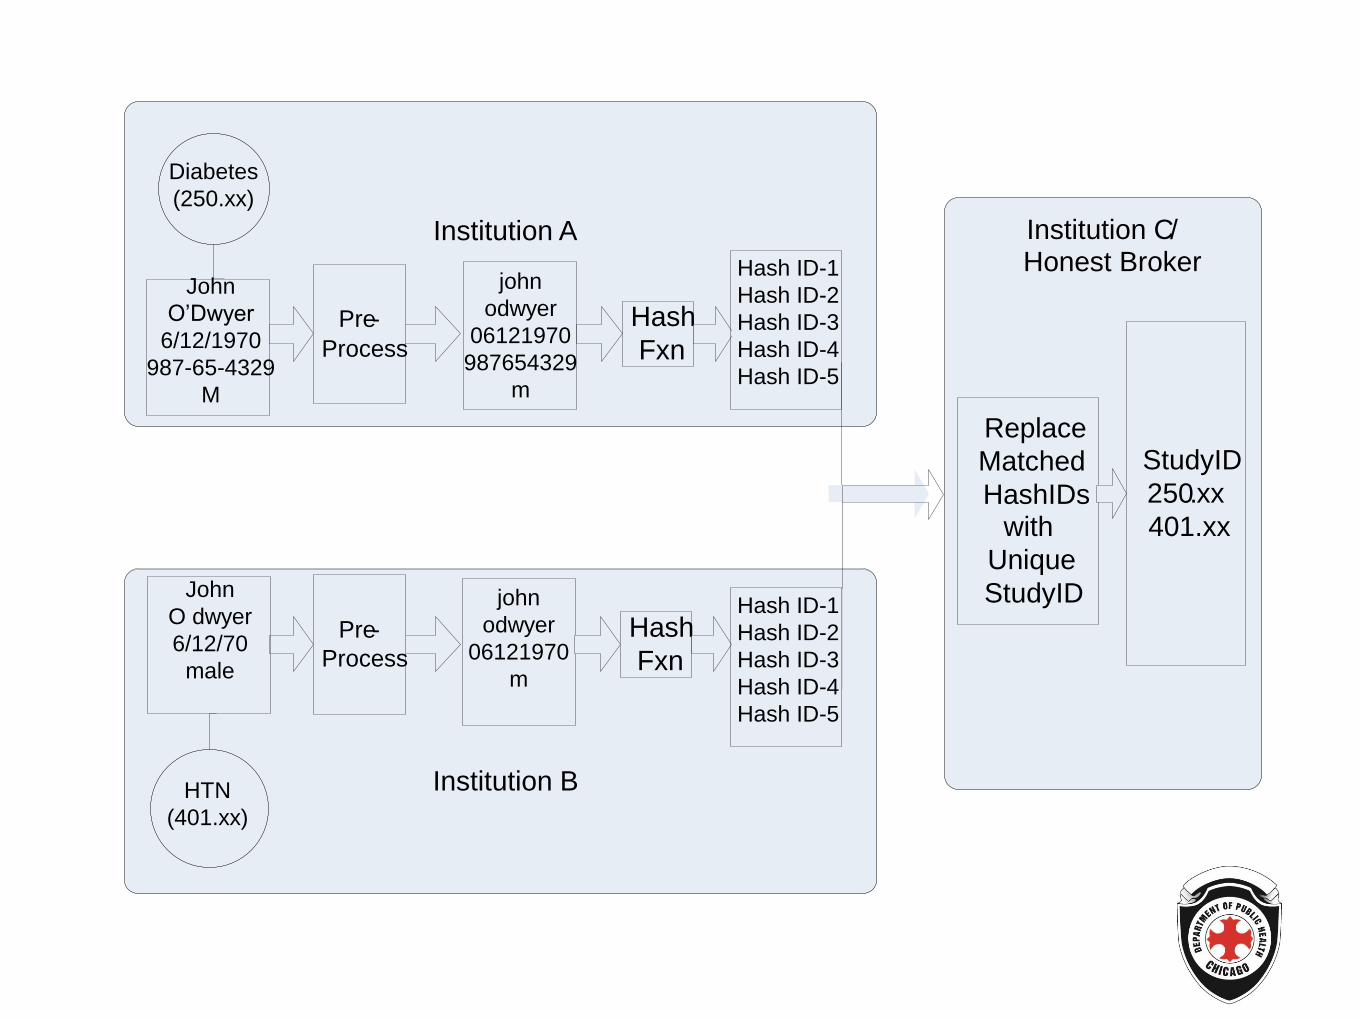
Institution C / Honest Broker
Institution B
Institution A
Pre -
Process
Hash
Fxn
StudyID
250 . xx
401.xx
Pre -
Process
Hash
Fxn
Replace
Matched
HashIDs with
Unique
StudyID Hash ID-1
Hash ID-2
Hash ID-3
Hash ID-4
Hash ID-5
Hash ID-1
Hash ID-2
Hash ID-3
Hash ID-4
Hash ID-5
Diabetes
(250.xx)
HTN
(401.xx)
John
O’Dwyer
6/12/1970
987-65-4329
M
John
O dwyer
6/12/70
male
john
odwyer
06121970
m
john
odwyer
06121970
987654329
m

Two ways to de-identify information
(1) the removal of individual, familial,
household, employer identifiers
(2) a formal determination by a qualified
statistician . . .
Ensuring privacy and
minimizing risk of re-identification
23
Determine through “generally accepted
statistical and scientific principles and
methods, that the risk is very small
that the information could be used,
alone or in combination with other
reasonably available information, by
the anticipated recipient to identify the
subject of the information.”
. . .Formal Determination
(abridged)
24
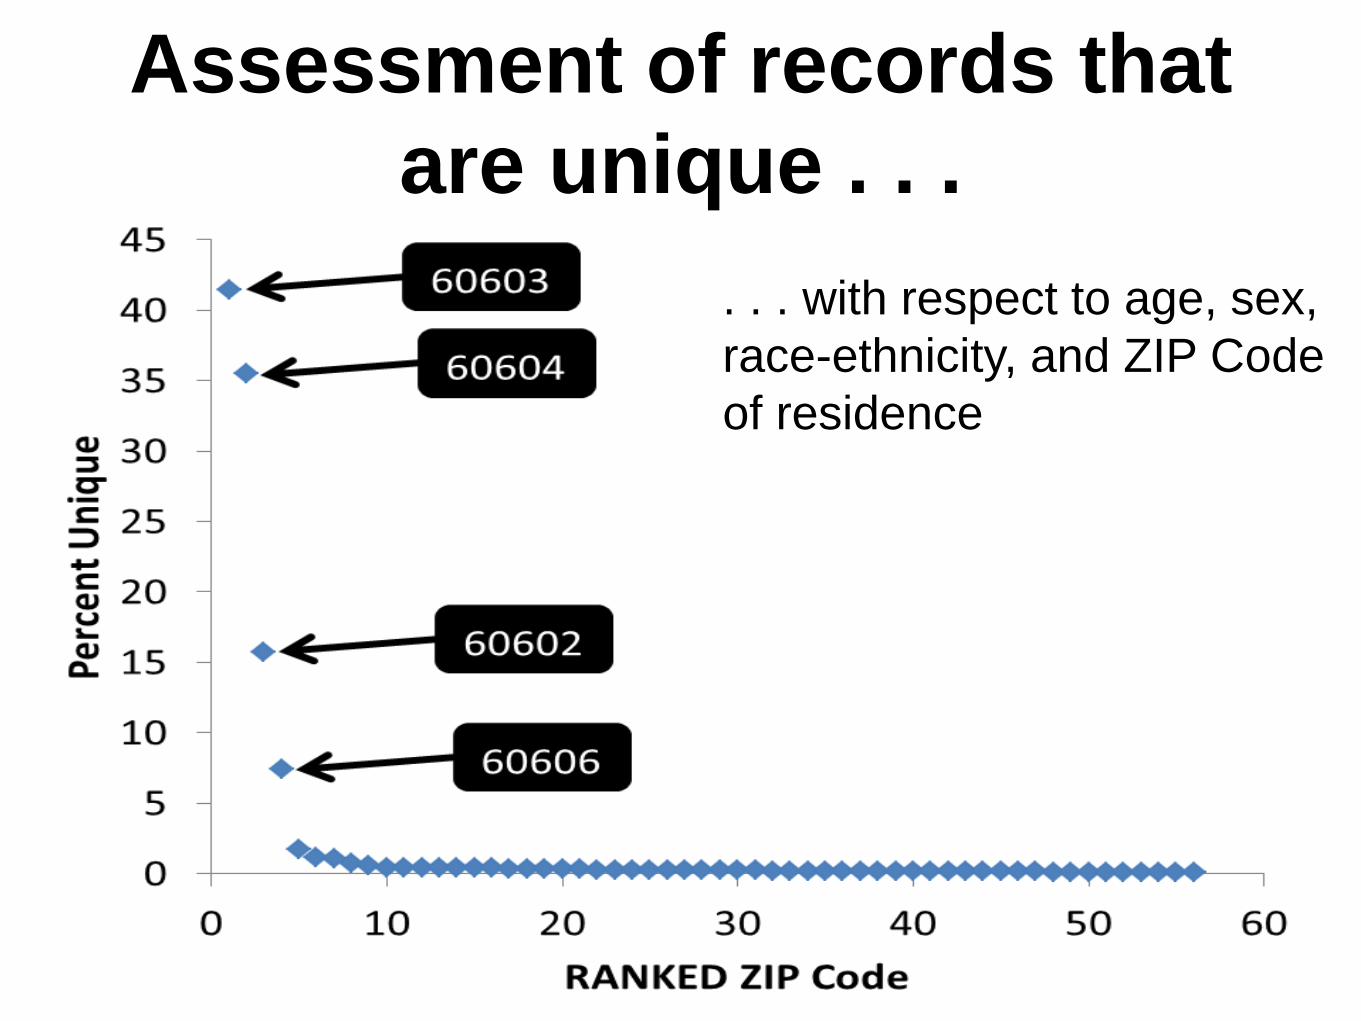
Assessment of records that
are unique . . .
. . . with respect to age, sex,
race-ethnicity, and ZIP Code
of residence
Findings
A promising source of prevalence estimates

Data contribution summary,
April 2013
1 2 3 4 5 6
Demographics C C C C C PC
Diagnoses C C C C C PC
Visit type C C C C C PC
BMI, BP C PP N N N PC
Glucose, HbA1c C C C N N PC
Medications C C C N N PC
Institution Data Type
C: complete; N: not yet incorporated;
PP: partial time period; PC: partial cohort

Sample size/cohort comparison,
by residential ZIP code, BRFSS* vs. Chicago Health Atlas
Source Min Median Mean Max
IL BRFSS, Chicago
2011 respondents 4 15 16 33
Chicago Health
Atlas, patient with
2010 visit 1,339 10,031 9,270 21,289
*CDC Behavioral Risk Factor Surveillance System survey, Chicago
sub-sample from Illinois dataset.

Challenge
Calculating disease prevalence estimates
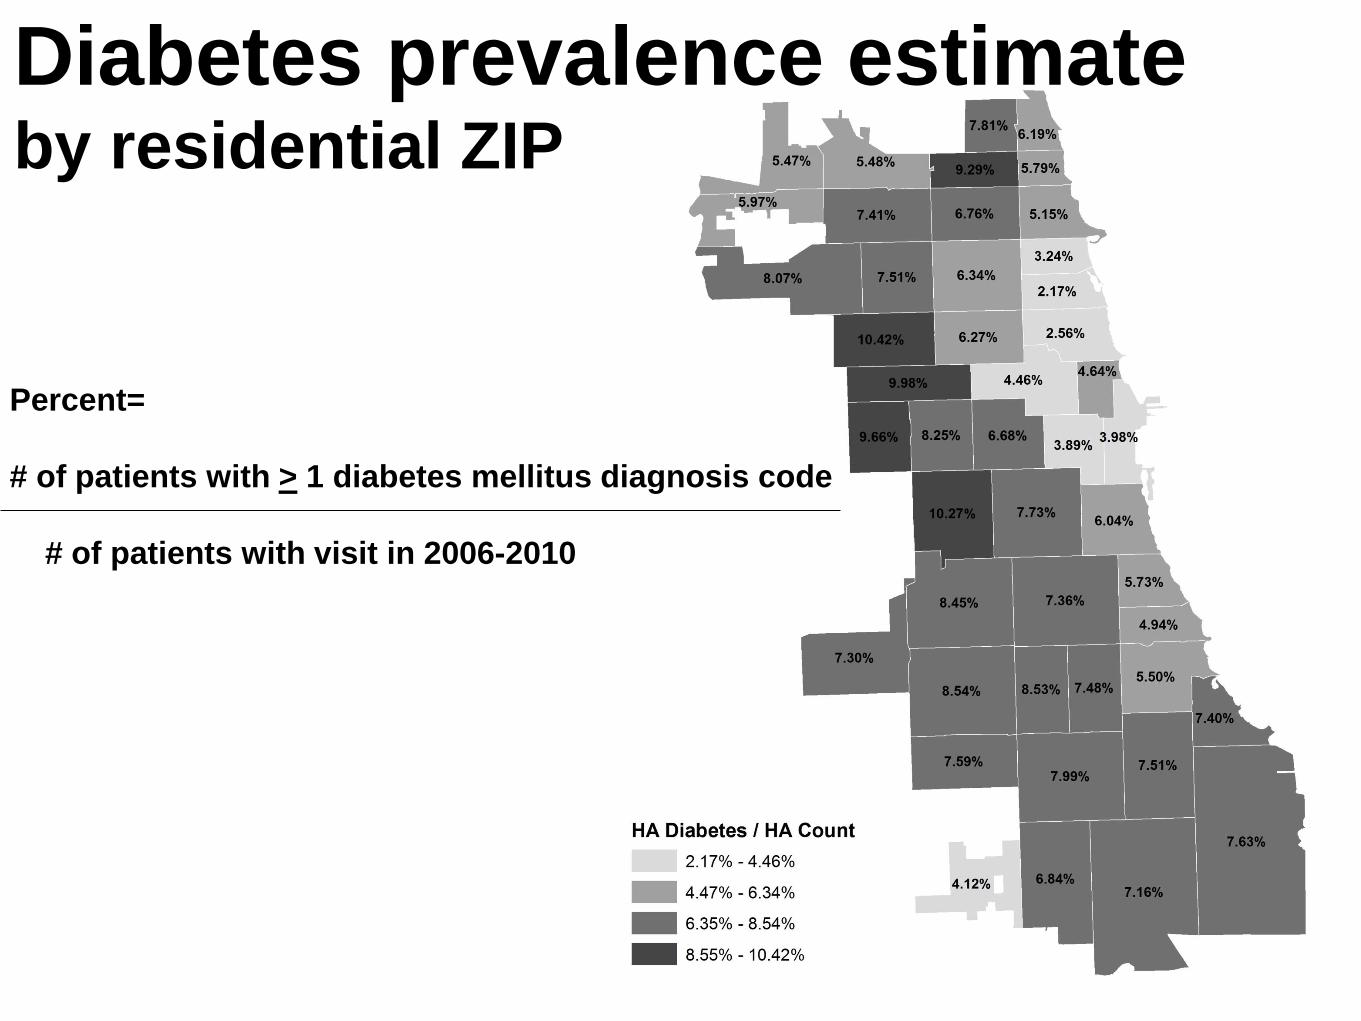
Percent=
# of patients with > 1 diabetes mellitus diagnosis code
# of patients with visit in 2006-2010
Diabetes prevalence estimate by residential ZIP
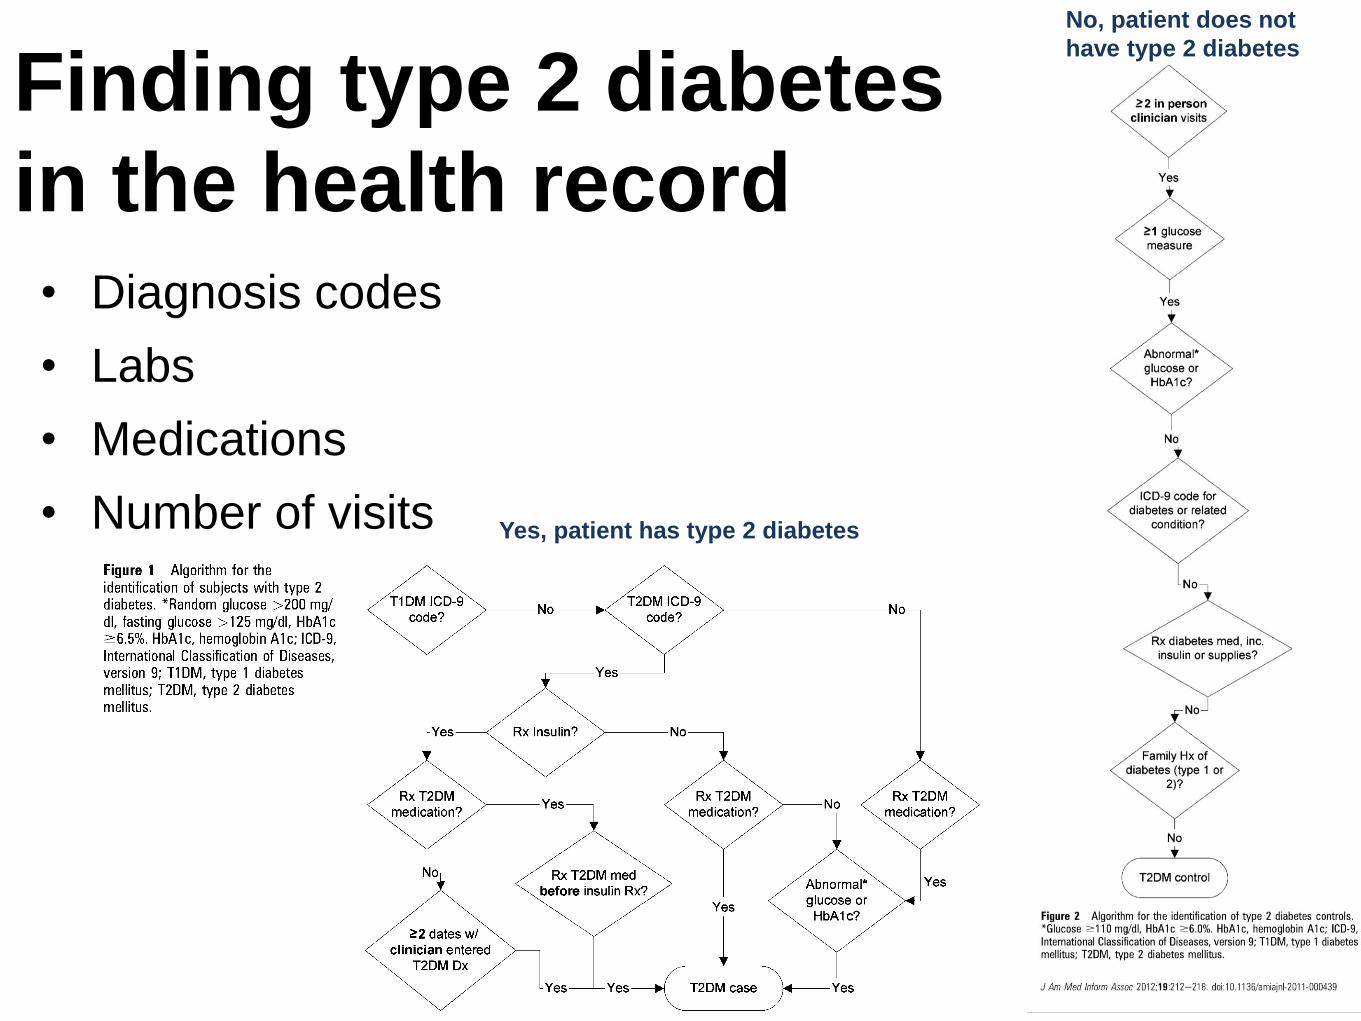
Finding type 2 diabetes
in the health record • Diagnosis codes
• Labs
• Medications
• Number of visits Yes, patient has type 2 diabetes
No, patient does not
have type 2 diabetes

Minimum number of visits recorded
Percent
Percent of Atlas patients with
diabetes diagnosis in 2006-2010
Illinois BRFSS estimates the prevalence of diabetes in Chicago at 9-11%.

Challenge
Applying estimates to Chicago
– rather than patient – populations

Age groups
Perc
en
t
Age distribution comparison, 2010
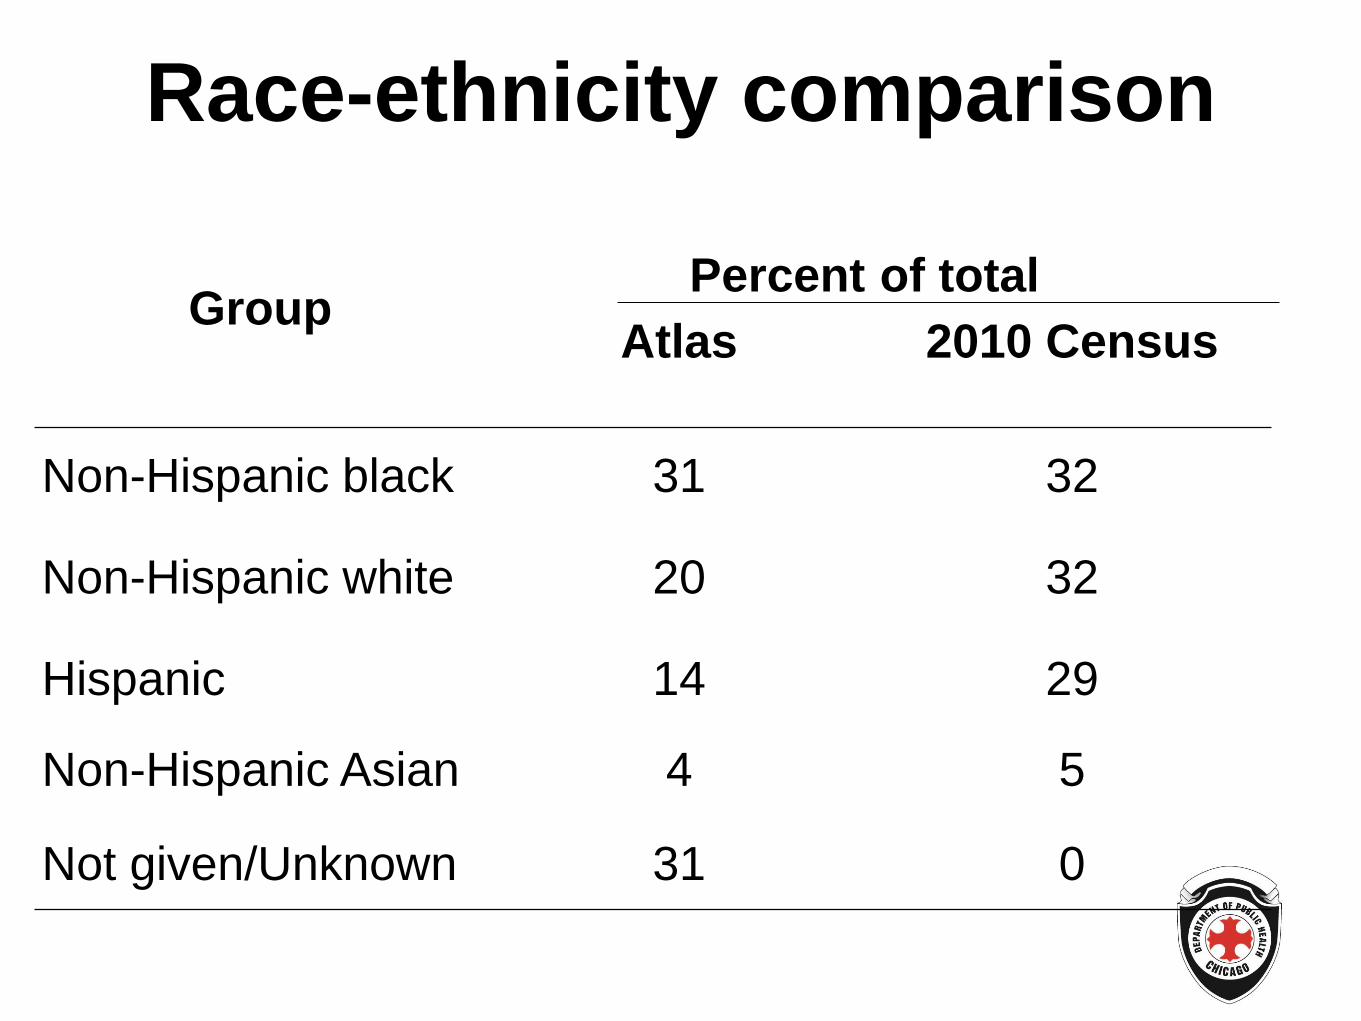
Race-ethnicity comparison
Group Percent
Atlas
of total
2010 Census
Non-Hispanic black 31 32
Non-Hispanic white 20 32
Hispanic 14 29
Non-Hispanic Asian 4 5
Not given/Unknown 31 0
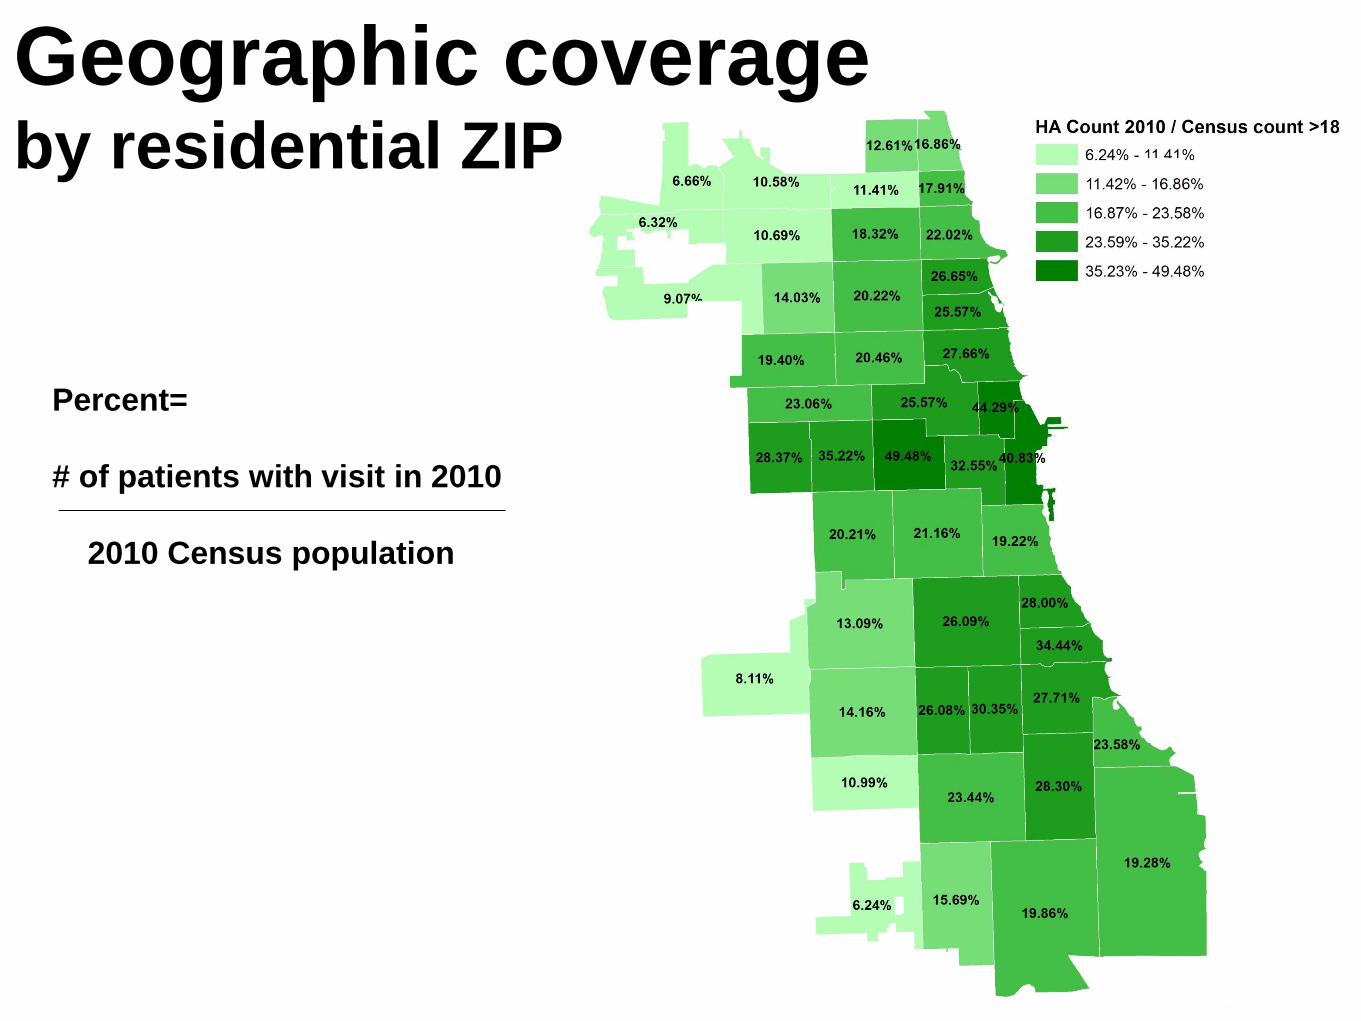
Percent=
# of patients with visit in 2010
2010 Census population
Geographic coverage by residential ZIP
Additional text

Making data available for use
To participating institutions
–Piloting query system
To public
–Chicago Health Atlas website

Website work has involved
• Identifying health-related data from
potential partners
• Evaluating need for data-sharing
agreements
• Securing and importing the data
• Developing procedures and best
practices for ongoing integration of data
Developing procedures and
best practices • Public health indicators from City Data Portal
can be viewed for temporal and neighborhood
trends
• Incorporating CDC guidelines for classification
of map categories
• How to make metadata easily accessible to
users
• How to deal with aggregated geographies and
time periods

Chicago Health Atlas Funders
• Otho S.A. Sprague Institute
• Northwestern Memorial Hospital
Community Engagement

Health Atlas Research Team
• Northwestern University: Abel Kho, John Cashy, Anna
Roberts, Sara Lake
• Univ. of Illinois-Chicago: Bill Galanter, John Lazaro
• Cook County Hospital System: Bala Hota, Amanda Grasso
• Univ. of Chicago Medical Center: Chris Lyttle, Ben Vekhter,
David Meltzer
• Alliance of Chicago: Erin Kaleba, Fred Rachman, Jermaine
Dellahousaye
• Rush University Medical Center: Shannon Sims, Aaron Tabor
• Vanderbilt University: Brad Malin
• UIC Intern team: Ariadna Garcia, Pravin Babu Karuppaiah,
Shazia Sathar, Ulas Keles (Sid Battacharya, Faculty mentor)

facebook.com/ChicagoPublicHealth @ChiPublicHealth
312.747.9884
CityofChicago.org/Health