Chicago Downtown Office000 IBM 71 South Wacker Drive 71,718* OWP/P 111 West Washington Street 61,000...
4
© 2004 CB Richard Ellis, Inc. Chicago Downtown Office THIRD QUARTER 2004 MarketView With the leasing market still affected by a reduced demand for office space, the downtown Chicago office vacancy rate increased during third quarter to 14.6% from 14.1% at second quarter. The vacancy rate, up from 13.0% one year ago, tracks space available for direct lease in 117.3 million square feet (msf) of office buildings downtown. When including sublease space, the overall downtown availability rate increased marginally to 18.6% from 18.4% in the second quarter. The lack of substantial job growth coupled with over 3.0 msf of new construction slated for completion in 2005 could extend the downturn for another 12 to 24 months. While this new supply of office space is already significantly preleased, the tenants taking space are not new to the market, therefore creating holes of second-generation space. With landlord concessions remaining strong and the availability rate above equilibrium, tenants will continue to have leverage in the market. Net absorption registered at (390,720) square feet in the third quarter, consistent with (410,613) square feet reported at the end of third quarter 2003. During the third quarter, the Central Loop was the only submarket to record positive net absorption. The West Loop showed the largest amount of negative net absorption of (341,732) square feet, a substantial change from 110,742 square feet in the second quarter. The positive indicator in the market remains the continued strong activity in investment sales, in the central business district (CBD). Active investors included pension funds, foreign investors, wealthy individuals/syndicates, 1031 exchange buyers, REITs, and regional owners. Sellers and buyers responded to market forces impacted by abundant capital, low interest rates, and plentiful debt. Class A-and B-leased properties attracted the most attention and traded at the highest prices. Conversely, properties with leasing risk or rollover issues have not seen the same level of investor interest. QUICK STATS Vacancy 14.6% Lease Rates $29.32 G Net Absorption* (390,720) Construction 3.35 msf * The arrows are trend indicators over the specified time period and do not represent a positive or negative value. (e.g., absorption could be negative, but still represent a positive trend over a specified period.) Change from last Current Yr. Qtr. HOT TOPICS • The overall downtown vacancy rate increased to 14.6% during the third quarter. • Decreased demand was evident in negative net absorption that totaled (390,720) square feet, up from (695,566) square feet in the second quarter. • The Central Loop demonstrated positive absorption of 284,770 square feet, the only submarket to post positive. • Investment sale activity downtown remains strong despite the repressed leasing market. VACANCY RATE VS. LEASE RATE Vacancy Rate 14.6% Lease Rate $ 29.32 G “ “ -1% 1% 3% 5% 7% 9% 11% 13% 15% 3Q01 1Q02 3Q02 1Q03 3Q03 1Q04 3Q04 % Vacancy $20 $25 $30 $35 Gross Avg. $/psf Until there is substantial positive job growth, the CBD will continue to experience ‘trading spaces.’
Transcript of Chicago Downtown Office000 IBM 71 South Wacker Drive 71,718* OWP/P 111 West Washington Street 61,000...
© 2004 CB Richard Ellis, Inc.
© Copyright 2004 CB Richard Ellis (CBRE) Statistics contained herein may represent a different data set than that used to generate National Vacancy and Availability Index statistics published by CB Richard Ellis’ Corporate Communications Department or CB Richard Ellis’ research and Econometric Forecasting unit, Torto Wheaton Research. Information herein has been obtained from sources believed reliable. While we do not doubt its accuracy, we have not verified it and make no guarantee, warranty or representation about it. It is your responsibility to independently confirm its accuracy and completeness. Any projections, opinions, assumptions or estimates used are for example only and do not represent the current or future performance of the market. This information is designed exclusively for use by CB Richard Ellis clients, and cannot be reproduced without prior written permission of CB Richard Ellis.
MarketView | Chicago Downtown Office | 3Q 2004
Chicago Downtown OfficeTHIRD QUARTER 2004
MarketView
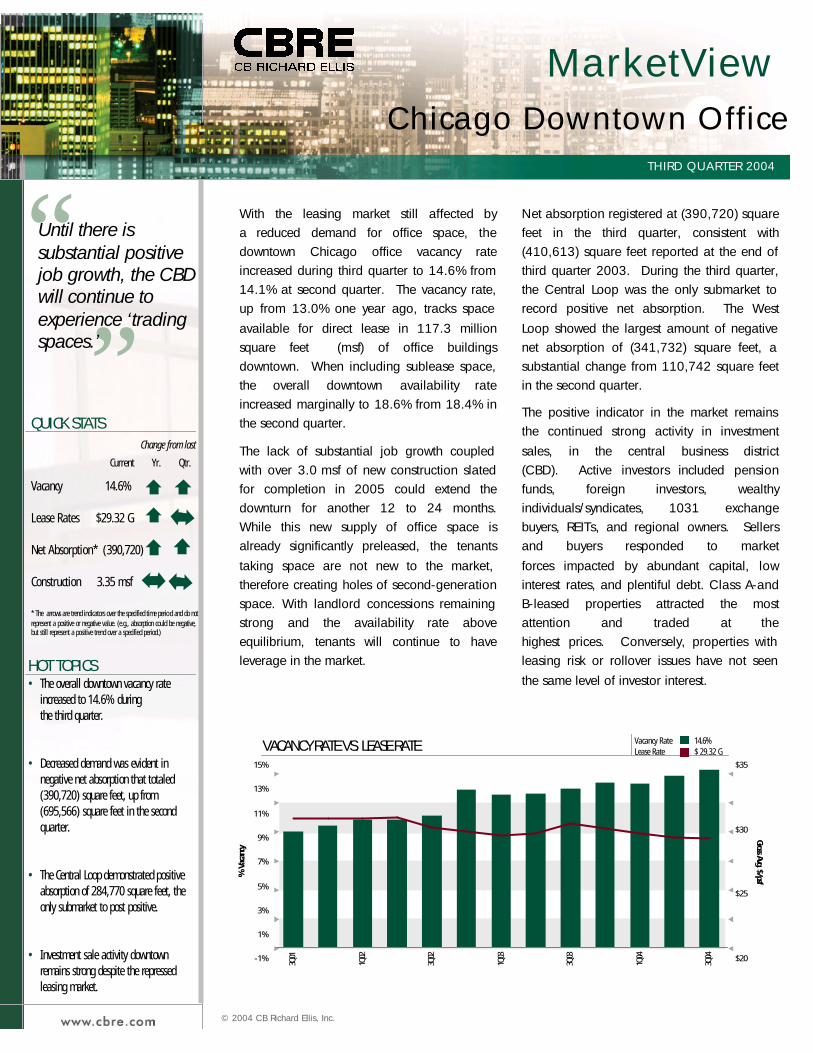
With the leasing market still affected by a reduced demand for office space, the downtown Chicago office vacancy rate increased during third quarter to 14.6% from 14.1% at second quarter. The vacancy rate, up from 13.0% one year ago, tracks space available for direct lease in 117.3 million square feet (msf) of office buildings downtown. When including sublease space, the overall downtown availability rate increased marginally to 18.6% from 18.4% in the second quarter.
The lack of substantial job growth coupled with over 3.0 msf of new construction slated for completion in 2005 could extend the downturn for another 12 to 24 months. While this new supply of office space is already significantly preleased, the tenants taking space are not new to the market, therefore creating holes of second-generation space. With landlord concessions remaining strong and the availability rate above equilibrium, tenants will continue to have leverage in the market.
Net absorption registered at (390,720) square feet in the third quarter, consistent with (410,613) square feet reported at the end of third quarter 2003. During the third quarter, the Central Loop was the only submarket to record positive net absorption. The West Loop showed the largest amount of negative net absorption of (341,732) square feet, a substantial change from 110,742 square feet in the second quarter.
The positive indicator in the market remains the continued strong activity in investment sales, in the central business district (CBD). Active investors included pension funds, foreign investors, wealthy individuals/syndicates, 1031 exchange buyers, REITs, and regional owners. Sellers and buyers responded to market forces impacted by abundant capital, low interest rates, and plentiful debt. Class A-and B-leased properties attracted the most attention and traded at the highest prices. Conversely, properties with leasing risk or rollover issues have not seen the same level of investor interest.
QUICK STATS
Vacancy 14.6%
Lease Rates $29.32 G
Net Absorption* (390,720)
Construction 3.35 msf
* The arrows are trend indicators over the specified time perio d and do not represent a positive or negative value. (e.g., absorption could be negative, but still represent a positive trend over a specified period.)
Change from last
Current Yr. Qtr.
HOT TOPICS• The overall downtown vacancy rate
increased to 14.6% during the third quarter.
• Decreased demand was evident in negative net absorption that totaled (390,720) square feet, up from (695,566) square feet in the second quarter.
• The Central Loop demonstrated positive absorption of 284,770 square feet, the only submarket to post positive.
• Investment sale activity downtown remains strong despite the repressed leasing market.
NET LEASESIncludes all lease types whereby the tenant pays an agreed rent plus most, or all, of the operating expenses and taxes for the property, including utilities, insurance and/or maintenance expenses.
MARKET COVERAGEIncludes all competitive office buildings 20,000 sf and greater in size.
NET ABSORPTIONThe change in occupied square feet from one period to the next.
NET RENTABLE AREAThe gross building square footage minus the elevator core, flues, pipe shafts, vertical ducts, balconies, and stairwell areas.
OCCUPIED SQUARE FEETBuilding area not considered vacant.
UNDER CONSTRUCTIONBuildings which have begun construction as evidenced by site excavation or foundation work.
VACANT SQUARE FEETExisting Building Area which is physically vacant or immediately available.
VACANCY RATEVacant Building Feet divided by the Net Rentable Area.
OVERALL VACANCY RATEVacant Building Feet plus sublease space divided by the Net Rentable Area.
TOP CHICAGO LEASE TRANSACTIONS
Size (sf) Tenant Address
300,000* GE Capital Corporation 500 West Monroe Street
126,000 IBM 71 South Wacker Drive
71,718* OWP/P 111 West Washington Street
61,000 Shefsky & Froelich Ltd. 111 East Wacker Drive
44,800* GMAC Commerical Mortgage 150 South Wacker Drive
41,334 Kaplan Education Services 500 West Van Buren Street
35,000 Howe Barnes Investments 222 South Riverside Drive
*Renewal/ExpansionCHICAGO SUBMARKET MAP
VACANCY RATE VS. LEASE RATE Vacancy Rate 14.6%Lease Rate $ 29.32 G
For more information regarding the MarketView, please contact: Kelly Badhwar, Research ManagerCB Richard Ellis 311 South Wacker Drive, Suite 400, Chicago, Illinois 60606
T. 312.935.1400 • F. 312.935.1880 [email protected]
“ “
-1%
1%
3%
5%
7%
9%
11%
13%
15%
3Q01
1Q02
3Q02
1Q03
3Q03
1Q04
3Q04
% V
acan
cy
$20
$25
$30
$35
Gross Avg. $/psf
Until there is substantial positive job growth, the CBD will continue to experience ‘trading spaces.’
CB Richard Ellis | Chicago Downtown Office | 3Q 2004 CB Richard Ellis | Chicago Downtown Office | 3Q 2004
© 2004 CB Richard Ellis, Inc.© 2004 CB Richard Ellis, Inc.
West Loop 29,500,304 13.2% (341,732) 2,500,000 16.9%Class A 18,419,255 12.8% (358,490) 2,500,000 $14-$25 16.7%Class B 8,115,244 14.0% (23,742) — $7-$14 17.9%Class C 2,965,805 13.8% 40,500 — $6-$12 15.4%
Central Loop 48,765,583 14.5% 284,770 850,000 18.4%Class A 20,478,263 13.6% 41,983 850,000 $12-$24 20.9%Class B 18,054,984 13.2% 50,439 — $7-$13 14.9%Class C 10,232,336 18.3% 192,348 — $5-$10 19.6%
East Loop 22,141,711 16.5% (257,931) — 20.9%Class A 5,930,836 16.4% (183,459) — $12-$22 23.6%Class B 10,082,835 17.6% (90,748) — $7-$14 22.3%Class C 6,128,040 14.8% 16,276 — $5-$10 16.0%
North Michigan Ave. 12,352,872 11.1% (12,162) — 15.0%Class A 4,357,168 13.7% 4,532 — $9-$21 17.8%Class B 6,685,711 11.2% (26,852) — $8-$15 15.6%Class C 1,309,993 2.4% 10,158 — $7-$13 2.7%
River North 4,497,718 24.7% (63,665) — 31.1%Class A 382,436 28.7% 0 — $11-$17 34.9%Class B 2,459,111 32.5% (29,223) — $8-$13 41.8%Class C 1,656,171 12.2% (34,442) — $6-$11 14.2%
Chicago CBD 117,258,188 14.6% (390,720) 3,350,000 18.6%
Market RentableArea
VacancyRate %
NetAbsorption
SF
Under Construction SF
Average Asking Lease Rate $
SF/YR
Overall Vacancy Rate*%
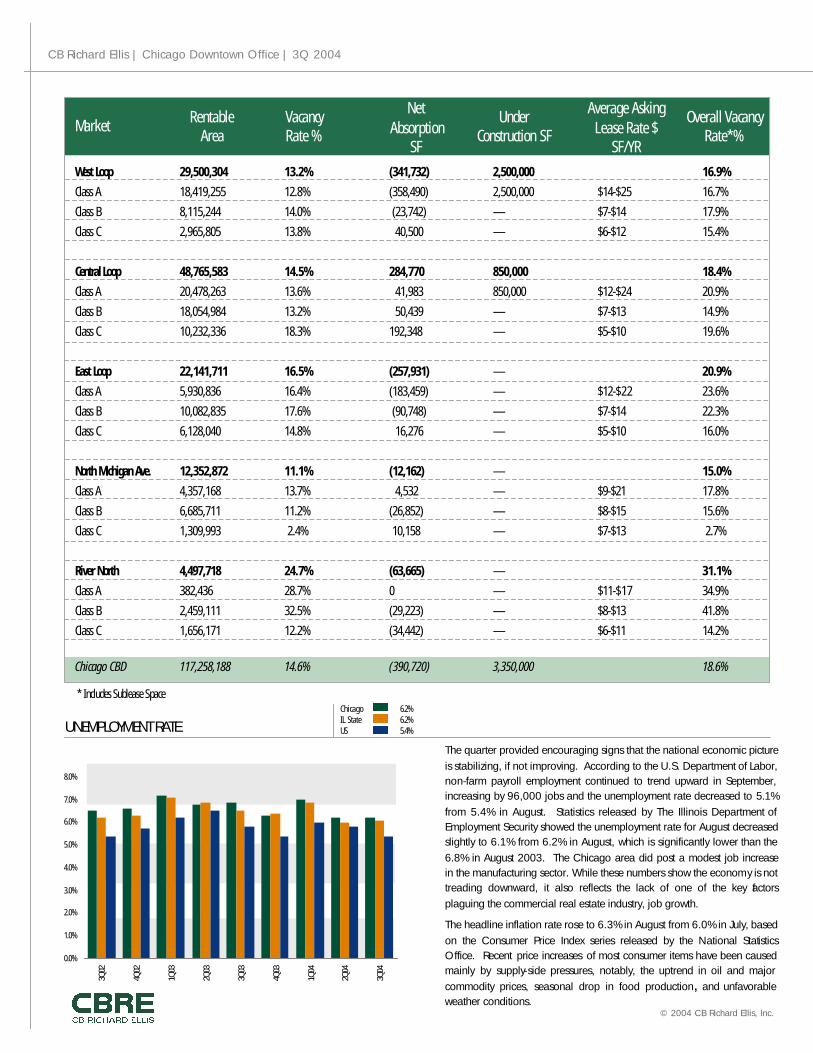
UNEMPLOYMENT RATEThe quarter provided encouraging signs that the national economic picture is stabilizing, if not improving. According to the U.S. Department of Labor, non-farm payroll employment continued to trend upward in September, increasing by 96,000 jobs and the unemployment rate decreased to 5.1% from 5.4% in August. Statistics released by The Illinois Department of Employment Security showed the unemployment rate for August decreased slightly to 6.1% from 6.2% in August, which is significantly lower than the 6.8% in August 2003. The Chicago area did post a modest job increase in the manufacturing sector. While these numbers show the economy is not treading downward, it also reflects the lack of one of the key factors plaguing the commercial real estate industry, job growth.
The headline inflation rate rose to 6.3% in August from 6.0% in July, based on the Consumer Price Index series released by the National Statistics Office. Recent price increases of most consumer items have been caused mainly by supply-side pressures, notably, the uptrend in oil and major commodity prices, seasonal drop in food production, and unfavorable weather conditions.
VACANCY & NET ABSORPTIONAbsorption sf (390,720)Vacancy 14.6%
The overall direct vacancy rate inched up to 18.6% at third quarter from 18.4% at mid-year. Direct vacancy increased in all downtown submarkets during the third quarter with the exception of the Central Loop. Continuing to report the highest direct vacancy rate was the River North submarket at 24.7%, which conversely, is a 3.4% decrease from a year ago. At 11.1%, the North Michigan Avenue submarket posted the lowest vacancy rate.
The Central Loop demonstrated a positive absorption of 284,770 square feet, the only submarket to post positive during the third quarter. There were net losses in occupied space in the East Loop, ( 257,931) square feet; West Loop, (341,732) square feet; North Michigan Avenue, (12,162) square feet; and River North, (63,665) square feet. Even with the current market velocity, the majority of tenants relocating are leasing less space.
Notwithstanding the rising vacancy rates and negative net absorption, overall asking rates remained relatively stable during the third quarter. Rental rates for trophy Class A buildings ranged from $18 to $25 per square foot (psf). In other Class A buildings, average rents ranged from $9 to $25 psf, while Class B building rates ranged from $7 to $15 psf. The West Loop continued to demand the highest rates for Class A buildings ranging from $14 to $25 psf.
AVERAGE ASKING LEASE RATES
CONSTRUCTION ACTIVITY
Construction activity continued on three major downtown developments –One S. Dearborn, 71 S. Wacker and 111 S. Wacker. These structures will add 3.4 msf to the downtown office market, and are approximately 70%preleased. However, many of the tenants anchoring these projects are vacating existing Loop locations which will create additional vacancies across the submarkets. Developments on the horizon include Fifield Companies’470,000-square-foot office building at 550 West Adams Street, which is 64%preleased by United States Gypsum Company. The project will break groundin the fourth quarter and is scheduled for delivery mid-year 2005.
MARKET OUTLOOK
Lack of demand and continued downsizing of space requirements will negatively impact the downtown office market until job growth, relocations to the market or an improved economic picture take place. Without signs of recovery, landlords will continue to be competitive by increasing tenant allowances and concessions in order to realize any positive leasing activity for their buildings. For the foreseeable future, historic low interest rates, flight of capital and foreign investment are the factors that will influence the investment market.
Chicago 6.2%IL State 6.2%US 5.4%
* year-to-date
0
1,000,000
2,000,000
3,000,000
4,000,000
5,000,000
6,000,000
2001
2002
2003
2004
*
Sq. F
t. Un
der C
onstr
uctio
n
* Includes Sublease Space
(2,600.0)
(2,200.0)
(1,800.0)
(1,400.0)
(1,000.0)
(600.0)
(200.0)
200.0
600.0
2Q02
3Q02
4Q02
1Q03
2Q03
3Q03
4Q03
1Q04
2Q04
3Q04
Abso
rptio
n sf
(000
's)
8.0%
10.0%
12.0%
14.0%
16.0%
Vacancy %
0.0%
1.0%
2.0%
3.0%
4.0%
5.0%
6.0%
7.0%
8.0%
3Q02
4Q02
1Q03
2Q03
3Q03
4Q03
1Q04
2Q04
3Q04
$15.00
$20.00
$25.00
$30.00
2000
2001
2002
2003
2004
*
Gros
s Avg
. Ask
ing
Rent
*year-to-date

CB Richard Ellis | Chicago Downtown Office | 3Q 2004 CB Richard Ellis | Chicago Downtown Office | 3Q 2004
© 2004 CB Richard Ellis, Inc.© 2004 CB Richard Ellis, Inc.
West Loop 29,500,304 13.2% (341,732) 2,500,000 16.9%Class A 18,419,255 12.8% (358,490) 2,500,000 $14-$25 16.7%Class B 8,115,244 14.0% (23,742) — $7-$14 17.9%Class C 2,965,805 13.8% 40,500 — $6-$12 15.4%
Central Loop 48,765,583 14.5% 284,770 850,000 18.4%Class A 20,478,263 13.6% 41,983 850,000 $12-$24 20.9%Class B 18,054,984 13.2% 50,439 — $7-$13 14.9%Class C 10,232,336 18.3% 192,348 — $5-$10 19.6%
East Loop 22,141,711 16.5% (257,931) — 20.9%Class A 5,930,836 16.4% (183,459) — $12-$22 23.6%Class B 10,082,835 17.6% (90,748) — $7-$14 22.3%Class C 6,128,040 14.8% 16,276 — $5-$10 16.0%
North Michigan Ave. 12,352,872 11.1% (12,162) — 15.0%Class A 4,357,168 13.7% 4,532 — $9-$21 17.8%Class B 6,685,711 11.2% (26,852) — $8-$15 15.6%Class C 1,309,993 2.4% 10,158 — $7-$13 2.7%
River North 4,497,718 24.7% (63,665) — 31.1%Class A 382,436 28.7% 0 — $11-$17 34.9%Class B 2,459,111 32.5% (29,223) — $8-$13 41.8%Class C 1,656,171 12.2% (34,442) — $6-$11 14.2%
Chicago CBD 117,258,188 14.6% (390,720) 3,350,000 18.6%
Market RentableArea
VacancyRate %
NetAbsorption
SF
Under Construction SF
Average Asking Lease Rate $
SF/YR
Overall Vacancy Rate*%
UNEMPLOYMENT RATEThe quarter provided encouraging signs that the national economic picture is stabilizing, if not improving. According to the U.S. Department of Labor, non-farm payroll employment continued to trend upward in September, increasing by 96,000 jobs and the unemployment rate decreased to 5.1% from 5.4% in August. Statistics released by The Illinois Department of Employment Security showed the unemployment rate for August decreased slightly to 6.1% from 6.2% in August, which is significantly lower than the 6.8% in August 2003. The Chicago area did post a modest job increase in the manufacturing sector. While these numbers show the economy is not treading downward, it also reflects the lack of one of the key factors plaguing the commercial real estate industry, job growth.
The headline inflation rate rose to 6.3% in August from 6.0% in July, based on the Consumer Price Index series released by the National Statistics Office. Recent price increases of most consumer items have been caused mainly by supply-side pressures, notably, the uptrend in oil and major commodity prices, seasonal drop in food production, and unfavorable weather conditions.
VACANCY & NET ABSORPTIONAbsorption sf (390,720)Vacancy 14.6%
The overall vacancy rate inched up to 18.6% at third quarter from 18.4% at mid-year. Direct vacancy increased in all downtown submarkets during the third quarter with the exception of the Central Loop. Continuing to report the highest direct vacancy rate was the River North submarket at 24.7%, which conversely, is a 3.4% decrease from a year ago. At 11.1%, the North Michigan Avenue submarket posted the lowest vacancy rate.
The Central Loop demonstrated a positive absorption of 284,770 square feet, the only submarket to post positive during the third quarter. There were net losses in occupied space in the East Loop, ( 257,931) square feet; West Loop, (341,732) square feet; North Michigan Avenue, (12,162) square feet; and River North, (63,665) square feet. Even with the current market velocity, the majority of tenants relocating are leasing less space.
Notwithstanding the rising vacancy rates and negative net absorption, overall asking rates remained relatively stable during the third quarter. Rental rates for trophy Class A buildings ranged from $18 to $25 per square foot (psf). In other Class A buildings, average rents ranged from $9 to $25 psf, while Class B building rates ranged from $7 to $15 psf. The West Loop continued to demand the highest rates for Class A buildings ranging from $14 to $25 psf.
AVERAGE ASKING LEASE RATES
CONSTRUCTION ACTIVITY
Construction activity continued on three major downtown developments –One S. Dearborn, 71 S. Wacker and 111 S. Wacker. These structures will add 3.4 msf to the downtown office market, and are approximately 70%preleased. However, many of the tenants anchoring these projects are vacating existing Loop locations which will create additional vacancies across the submarkets. Developments on the horizon include Fifield Companies’470,000-square-foot office building at 550 West Adams Street, which is 64%preleased by United States Gypsum Company. The project will break groundin the fourth quarter and is scheduled for delivery mid-year 2005.
MARKET OUTLOOK
Lack of demand and continued downsizing of space requirements will negatively impact the downtown office market until job growth, relocations to the market or an improved economic picture take place. Without signs of recovery, landlords will continue to be competitive by increasing tenant allowances and concessions in order to realize any positive leasing activity for their buildings. For the foreseeable future, historic low interest rates, flight of capital and foreign investment are the factors that will influence the investment market.
Chicago 6.2%IL State 6.2%US 5.4%
* year-to-date
0
1,000,000
2,000,000
3,000,000
4,000,000
5,000,000
6,000,000
2001
2002
2003
2004
*
Sq. F
t. Un
der C
onstr
uctio
n
* Includes Sublease Space
(2,600.0)
(2,200.0)
(1,800.0)
(1,400.0)
(1,000.0)
(600.0)
(200.0)
200.0
600.0
2Q02
3Q02
4Q02
1Q03
2Q03
3Q03
4Q03
1Q04
2Q04
3Q04
Abso
rptio
n sf
(000
's)
8.0%
10.0%
12.0%
14.0%
16.0%
Vacancy %
0.0%
1.0%
2.0%
3.0%
4.0%
5.0%
6.0%
7.0%
8.0%
3Q02
4Q02
1Q03
2Q03
3Q03
4Q03
1Q04
2Q04
3Q04
$15.00
$20.00
$25.00
$30.00
2000
2001
2002
2003
2004
*
Gros
s Avg
. Ask
ing
Rent
*year-to-date

© 2004 CB Richard Ellis, Inc.
© Copyright 2004 CB Richard Ellis (CBRE) Statistics contained herein may represent a different data set than that used to generate National Vacancy and Availability Index statistics published by CB Richard Ellis’ Corporate Communications Department or CB Richard Ellis’ research and Econometric Forecasting unit, Torto Wheaton Research. Information herein has been obtained from sources believed reliable. While we do not doubt its accuracy, we have not verified it and make no guarantee, warranty or representation about it. It is your responsibility to independently confirm its accuracy and completeness. Any projections, opinions, assumptions or estimates used are for example only and do not represent the current or future performance of the market. This information is designed exclusively for use by CB Richard Ellis clients, and cannot be reproduced without prior written permission of CB Richard Ellis.
MarketView | Chicago Downtown Office | 3Q 2004
Chicago Downtown OfficeTHIRD QUARTER 2004
MarketView
With the leasing market still affected by a reduced demand for office space, the downtown Chicago office vacancy rate increased during third quarter to 14.6% from 14.1% at second quarter. The vacancy rate, up from 13.0% one year ago, tracks space available for direct lease in 117.3 million square feet (msf) of office buildings downtown. When including sublease space, the overall downtown availability rate increased marginally to 18.6% from 18.4% in the second quarter.
The lack of substantial job growth coupled with over 3.0 msf of new construction slated for completion in 2005 could extend the downturn for another 12 to 24 months. While this new supply of office space is already significantly preleased, the tenants taking space are not new to the market, therefore creating holes of second-generation space. With landlord concessions remaining strong and the availability rate above equilibrium, tenants will continue to have leverage in the market.
Net absorption registered at (390,720) square feet in the third quarter, consistent with (410,613) square feet reported at the end of third quarter 2003. During the third quarter, the Central Loop was the only submarket to record positive net absorption. The West Loop showed the largest amount of negative net absorption of (341,732) square feet, a substantial change from 110,742 square feet in the second quarter.
The positive indicator in the market remains the continued strong activity in investment sales, in the central business district (CBD). Active investors included pension funds, foreign investors, wealthy individuals/syndicates, 1031 exchange buyers, REITs, and regional owners. Sellers and buyers responded to market forces impacted by abundant capital, low interest rates, and plentiful debt. Class A-and B-leased properties attracted the most attention and traded at the highest prices. Conversely, properties with leasing risk or rollover issues have not seen the same level of investor interest.
QUICK STATS
Vacancy 14.6%
Lease Rates $29.32 G
Net Absorption* (390,720)
Construction 3.35 msf
* The arrows are trend indicators over the specified time perio d and do not represent a positive or negative value. (e.g., absorption could be negative, but still represent a positive trend over a specified period.)
Change from last
Current Yr. Qtr.
HOT TOPICS• The overall downtown vacancy rate
increased considerably to 14.6% during the third quarter.
• Decreased demand was evident in negative net absorption that totaled (390,720) square feet, up from (695,566) square feet in the second quarter.
• The Central Loop demonstrated positive absorption of 284,770 square feet, the only submarket to post positive.
• Investment sale activity downtown remains strong despite the repressed leasing market.
NET LEASESIncludes all lease types whereby the tenant pays an agreed rent plus most, or all, of the operating expenses and taxes for the property, including utilities, insurance and/or maintenance expenses.
MARKET COVERAGEIncludes all competitive office buildings 20,000 sf and greater in size.
NET ABSORPTIONThe change in occupied square feet from one period to the next.
NET RENTABLE AREAThe gross building square footage minus the elevator core, flues, pipe shafts, vertical ducts, balconies, and stairwell areas.
OCCUPIED SQUARE FEETBuilding area not considered vacant.
UNDER CONSTRUCTIONBuildings which have begun construction as evidenced by site excavation or foundation work.
VACANT SQUARE FEETExisting Building Area which is physically vacant or immediately available.
VACANCY RATEVacant Building Feet divided by the Net Rentable Area.
OVERALL VACANCY RATEVacant Building Feet plus sublease space divided by the Net Rentable Area.
TOP CHICAGO LEASE TRANSACTIONS
Size (sf) Tenant Address
300,000* GE Capital Corporation 500 West Monroe Street
126,000 IBM 71 South Wacker Drive
71,718* OWP/P 111 West Washington Street
61,000 Shefsky & Froelich Ltd. 111 East Wacker Drive
44,800* GMAC Commerical Mortgage 150 South Wacker Drive
41,334 Kaplan Education Services 500 West Van Buren Street
35,000 Howe Barnes Investments 222 South Riverside Drive
*Renewal/ExpansionCHICAGO SUBMARKET MAP
VACANCY RATE VS. LEASE RATE Vacancy Rate 14.6%Lease Rate $ 29.32 G
For more information regarding the MarketView, please contact: Kelly Badhwar, Research ManagerCB Richard Ellis 311 South Wacker Drive, Suite 400, Chicago, Illinois 60606
T. 312.935.1400 • F. 312.935.1880 [email protected]
“ “
-1%
1%
3%
5%
7%
9%
11%
13%
15%
3Q01
1Q02
3Q02
1Q03
3Q03
1Q04
3Q04
% V
acan
cy
$20
$25
$30
$35
Gross Avg. $/psf
Until there is substantial positive job growth, the CBD will continue to experience ‘trading spaces.’