Chiba Prefecture – Our Business Base - Chiba Kōgyō Bank · The Chiba Kogyo Bank, Ltd. is an...
20
Transcript of Chiba Prefecture – Our Business Base - Chiba Kōgyō Bank · The Chiba Kogyo Bank, Ltd. is an...
1
Contents Chiba Prefecture – Our Business Base········································································································ 01 Corporate Profile ········································································································································ 02 Corporate Outline ······································································································································ 02 Message from the President ······················································································································ 03 Medium Term Management Plan ·············································································································· 04 Basic Rationale behind Promoting Region-Based Financing ······································································ 05 Business Highlights ····································································································································· 05 Topics ························································································································································· 06 Corporate Social Responsibility (CSR) ········································································································ 06 Summary of Selected Financial Data (Consolidated) ················································································· 07 Business Performance (Consolidated) ········································································································ 08 Consolidated Financial Statements ············································································································ 09 Consolidated Subsidiaries ·························································································································· 18 Organization Chart ····································································································································· 18 Board of Directors, Corporate Auditors and Executive Officers ································································· 19 Major Shareholders (Common Stock) ········································································································ 19
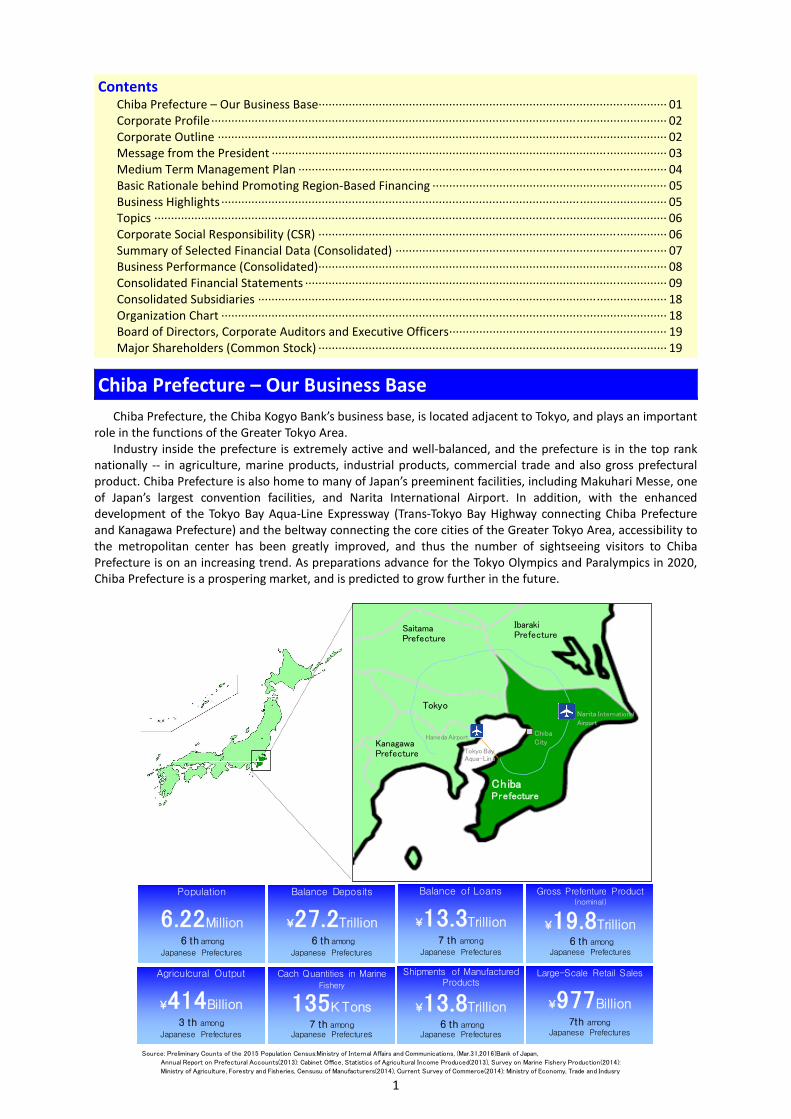
Chiba Prefecture – Our Business Base
Chiba Prefecture, the Chiba Kogyo Bank’s business base, is located adjacent to Tokyo, and plays an important role in the functions of the Greater Tokyo Area.
Industry inside the prefecture is extremely active and well-balanced, and the prefecture is in the top rank nationally -- in agriculture, marine products, industrial products, commercial trade and also gross prefectural product. Chiba Prefecture is also home to many of Japan’s preeminent facilities, including Makuhari Messe, one of Japan’s largest convention facilities, and Narita International Airport. In addition, with the enhanced development of the Tokyo Bay Aqua-Line Expressway (Trans-Tokyo Bay Highway connecting Chiba Prefecture and Kanagawa Prefecture) and the beltway connecting the core cities of the Greater Tokyo Area, accessibility to the metropolitan center has been greatly improved, and thus the number of sightseeing visitors to Chiba Prefecture is on an increasing trend. As preparations advance for the Tokyo Olympics and Paralympics in 2020, Chiba Prefecture is a prospering market, and is predicted to grow further in the future.
Source: Preliminary Counts of the 2015 Population Census:Ministry of Internal Affairs and Communications, (Mar.31,2016)Bank of Japan,
Annual Report on Prefectural Accounts(2013): Cabinet Office, Statistics of Agricultural Income Produced(2013), Survey on Marine Fishery Production(2014):
Ministry of Agriculture, Forestry and Fisheries, Censusu of Manufacturers(2014), Current Survey of Commerce(2014): Ministry of Economy, Trade and Indusry
Population
6.22Million
6th among
Japanese Prefectures
Gross Prefenture Product(nominal)
¥19.8Trillion6th among
Japanese Prefectures
Balance Deposits
¥27.2Trillion
6th among
Japanese Prefectures
Balance of Loans
¥13.3Trillion
7 th among
Japanese Prefectures
Agriculcural Output
¥414Billion
3 th among
Japanese Prefectures
Cach Quantities in Marine Fishery
135K Tons7 th among
Japanese Prefectures
Shipments of Manufactured Products
¥13.8Trillion6th among
Japanese Prefectures
Chiba City
IbarakiPrefecture
SaitamaPrefecture
Tokyo
KanagawaPrefecture
ChibaPrefecture
Tokyo BayAqua-Line
Narita International
Airport
Haneda Airport
Large-Scale Retail Sales
¥977Billion
7th amongJapanese Prefectures
2
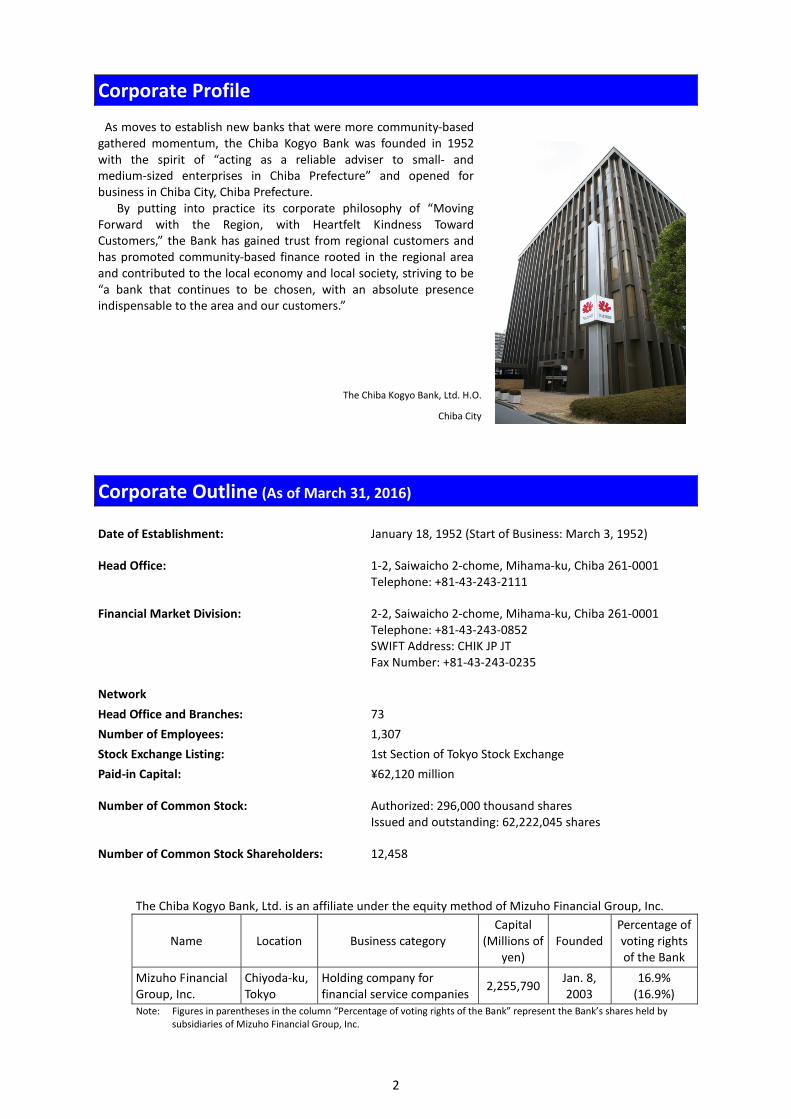
Corporate Profile
As moves to establish new banks that were more community-based gathered momentum, the Chiba Kogyo Bank was founded in 1952 with the spirit of “acting as a reliable adviser to small- and medium-sized enterprises in Chiba Prefecture” and opened for business in Chiba City, Chiba Prefecture.
By putting into practice its corporate philosophy of “Moving Forward with the Region, with Heartfelt Kindness Toward Customers,” the Bank has gained trust from regional customers and has promoted community-based finance rooted in the regional area and contributed to the local economy and local society, striving to be “a bank that continues to be chosen, with an absolute presence indispensable to the area and our customers.”
The Chiba Kogyo Bank, Ltd. H.O.
Chiba City
Corporate Outline (As of March 31, 2016) Date of Establishment: January 18, 1952 (Start of Business: March 3, 1952)
Head Office: 1-2, Saiwaicho 2-chome, Mihama-ku, Chiba 261-0001 Telephone: +81-43-243-2111
Financial Market Division: 2-2, Saiwaicho 2-chome, Mihama-ku, Chiba 261-0001 Telephone: +81-43-243-0852 SWIFT Address: CHIK JP JT Fax Number: +81-43-243-0235
Network Head Office and Branches: 73 Number of Employees: 1,307 Stock Exchange Listing: 1st Section of Tokyo Stock Exchange Paid-in Capital: ¥62,120 million
Number of Common Stock: Authorized: 296,000 thousand shares Issued and outstanding: 62,222,045 shares
Number of Common Stock Shareholders: 12,458
The Chiba Kogyo Bank, Ltd. is an affiliate under the equity method of Mizuho Financial Group, Inc.
Name Location Business category Capital
(Millions of yen)
Founded Percentage of voting rights of the Bank
Mizuho Financial Group, Inc.
Chiyoda-ku, Tokyo
Holding company for financial service companies 2,255,790 Jan. 8,
2003 16.9%
(16.9%) Note: Figures in parentheses in the column “Percentage of voting rights of the Bank” represent the Bank’s shares held by
subsidiaries of Mizuho Financial Group, Inc.
3
Message from the President
Shunichi AoyagiPresident (CEO)
As always, I would like to extend my sincerest appreciation for your patronage of the Chiba Kogyo Bank. On this occasion, we have formulated the “Annual Report 2016,” which highlights the Bank’s management
activities and operating results for FY2015, and provides an overview of our CSR and other initiatives. We would be pleased if stakeholders could take the time to peruse this document.
The economy of Chiba Prefecture in FY2015 continued to be on a recovery track in general, despite some
partial weakness, while maintaining low bankruptcy numbers and continuing on an upward trend in the employment environment.
Against this financial and economic backdrop, the Bank took up the challenge of the final year of the previous three-year (FY2013-2015) Medium-Term Management Plan, named the “2nd Stage of Transformation and Growth Strategy,” and aggressively responded to funding needs of regional customers as well as strove to demonstrate consulting capabilities, and as a result, the Bank was able to achieve many targets such as loan balance, centering on financing to small and medium enterprises, and residential loans.
In realizing this achievement, we would like to express our sincerest gratitude for goodwill we received from our customers, shareholders and everyone in the region.
Chiba Prefecture, the Bank’s business base, is a prospering market blessed with a location adjacent to the
capital city, and which we expect to grow further as preparations advance for the Tokyo Olympics and Paralympics to be held four years hence. Meanwhile, in the future business environment, business challenges of prefectural small and medium enterprises and individual customer’s needs will become even more diverse and sophisticated, while an excessive supply of products and services through financial competition expansion, including other business lines, is also predicted, due to the progress of the falling birthrate and aging population, population decline in the prefecture, prolonged low interest rates, and other factors.
Based on such business environment, in April 2016 the Bank started its new Medium-Term Management Plan, “Consulting Kodo Project 2019.” Positioning three years from this year as the stage toward realization of “Establishment as a Consulting Bank,” the configuration that the Bank must strive to become, and in order to be of greater help to the area and customers and to sustain growth together, the Bank will make concerted efforts with “Implementation of Consulting Kodo” as its core strategy.
I look forward to your further support in the future.
4
Medium Term Management Plan “Consulting Kodo (to consider and act)” is to “pursue real challenges and problems of the Bank’s partners,
area and customers, and seriously ponder and propose answers to the problems.” While the business challenges of prefectural small and medium enterprises and individual customer’s needs
will become even more diverse and sophisticated, in order to respond to changes in the business environment such as excess supply of products and services through financial competition expansion, including other business lines, the Bank considered that it must respond by changing its thinking and behavior to enable the establishment as a consulting bank that can respond to customer problems and needs flexibly and closely.
The highest priority acts for “establishment as a consulting bank” include transitioning from a legacy-type business model centered on the provision of products to a new business model built to diversify profits and create a profitable structure, and transitioning from “provision of financing and services” to “Consulting Kodo.”
Toward realization of “Establishment as a Consulting Bank,” the configuration three years hence, with a core strategy of “Implementation of Consulting Kodo” to consider the customer first, the Bank will make concerted efforts centering on key priorities for achievement of this, “reinforcement of its sales foundation” “reinforcement of its personnel and organizational foundations.”
(FY2013-2015) “2nd Stage of Transformation and Growth Strategy”Generating sales strength through improvements of efficiency and productivity, and expansion of customer foundation
(FY2011-2012) “Chiba Kogin Transformation and Growth Strategy”
Personnel and organizationalfoundation reinforcement
Financial foundation reinforcement Governance system reinforcement
Sales foundation reinforcement
Core Strategy“Implementation of Consulting Kodo”
to consider the customer first
Establishment as a Consulting Bank <3 years hence>
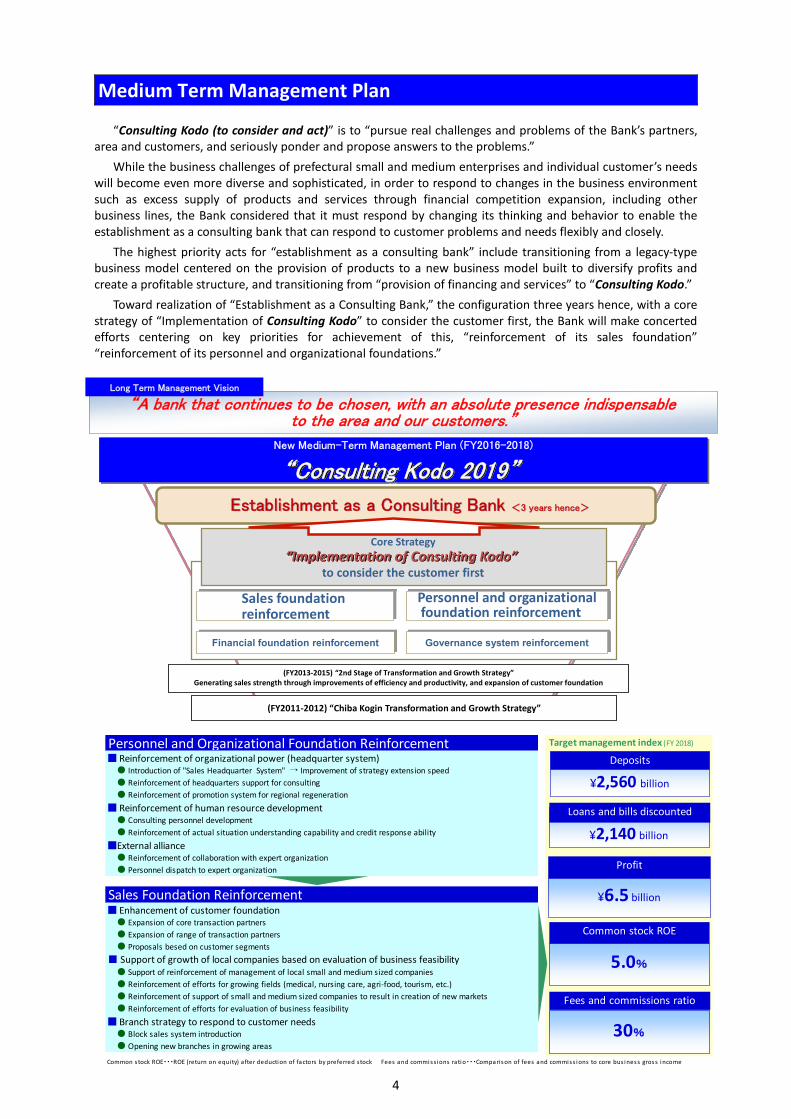
“A bank that continues to be chosen, with an absolute presence indispensable to the area and our customers.”
Long Term Management Vision
New Medium-Term Management Plan (FY2016-2018)
“Consulting Kodo 2019”
■ Reinforcement of organizational power (headquarter system)● Introduction of "Sales Headquarter System" → Improvement of strategy extension speed● Reinforcement of headquarters support for consulting● Reinforcement of promotion system for regional regeneration■ Reinforcement of human resource development● Consulting personnel development● Reinforcement of actual situation understanding capability and credit response ability■External alliance● Reinforcement of collaboration with expert organization● Personnel dispatch to expert organization
■ Enhancement of customer foundation● Expansion of core transaction partners● Expansion of range of transaction partners● Proposals besed on customer segments
● Support of reinforcement of management of local small and medium sized companies● Reinforcement of efforts for growing fields (medical, nursing care, agri-food, tourism, etc.)● Reinforcement of support of small and medium sized companies to result in creation of new markets● Reinforcement of efforts for evaluation of business feasibility■ Branch strategy to respond to customer needs● Block sales system introduction● Opening new branches in growing areas
■ Support of growth of local companies based on evaluation of business feasibility
Common s tock ROE・・・ROE (return on equi ty) after deduction of factors by preferred stock Fees and commis sions ratio・・・Comparis on of fees and commis s ions to core bus ines s gros s income
Personnel and Organizational Foundation Reinforcement
Sales Foundation Reinforcement
¥2,560 billion
Deposits
Loans and bills discounted
¥2,140 billion
Profit
¥6.5 billion
Common stock ROE
5.0%
30%
Fees and commissions ratio
Target management index (FY 2018)
5
Corporate
Philosophy Moving Forward with the Region, with
Heartfelt Kindness Toward Customers
Basic Rationale behind Promoting Region-Based Financing
We believe it is our practice of this corporate philosophy that enables us to realize region-based financing. We aim to fulfill our obligation as a regional financial institution by actively responding to the financing needs of small and medium enterprises, individual businesses owners, and also individual customers of the region, to provide a smooth supply of financing, while offering management support to the small and medium enterprises in the region and actively contributing to the revitalization of the region’s economy.
In promoting region-based financing, the Bank takes a medium- to long-term outlook while continuously pushing forward with the Bank-wide initiatives of (1) providing consulting functions to client companies, (2) actively participating in region-wide revitalization, and (3) actively transmitting information to the region and customers. We believe these initiatives will lead to expansion of the Bank’s customer base, and improvement in the Bank’s profitability and financial soundness.
Business Highlights
Support for Agri-food Businesses Revitalize agriculture with peanuts, a Chiba
Prefectural specialty Through expansion of production and
improvement of the quality of Chiba-grown peanuts, for regeneration of agriculture of the region, the Bank cooperates with customers and promotes “peanut contract growing projects.”
The Bank’s coordinators with agricultural related qualifications such as Agricultural Management Advisors also participated and supported -- from engagement in farming to purchasing of products.
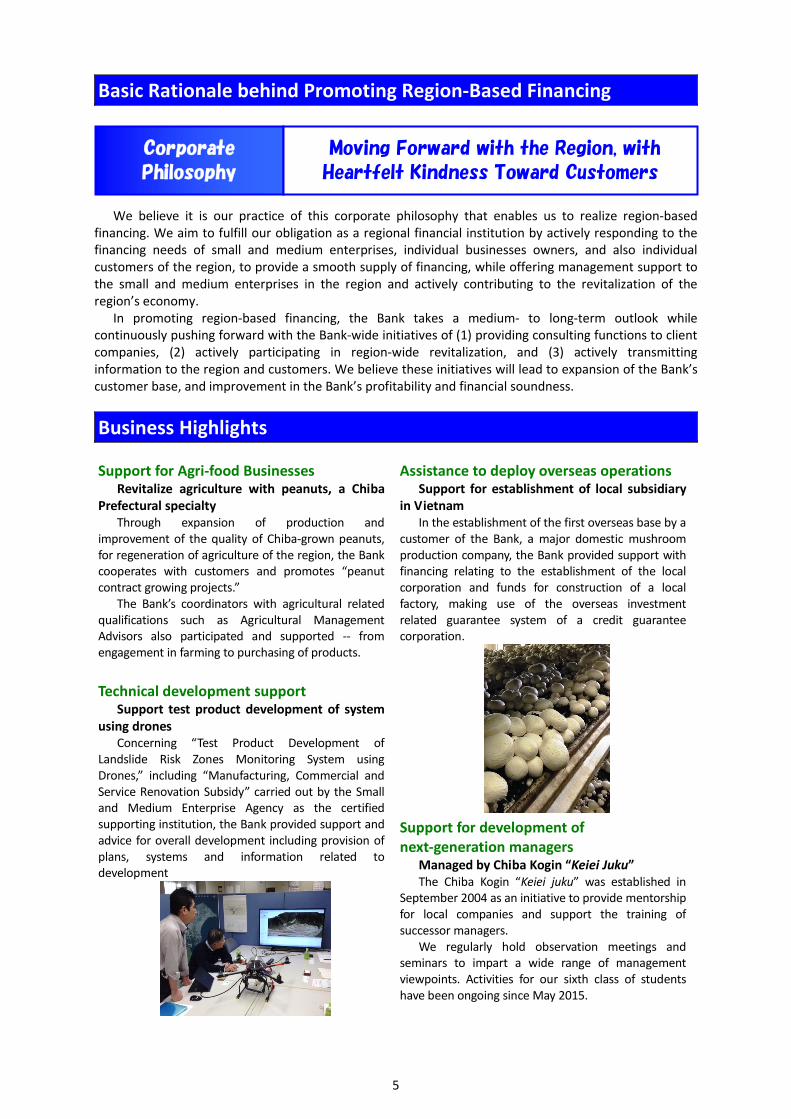
Assistance to deploy overseas operations Support for establishment of local subsidiary
in Vietnam In the establishment of the first overseas base by a
customer of the Bank, a major domestic mushroom production company, the Bank provided support with financing relating to the establishment of the local corporation and funds for construction of a local factory, making use of the overseas investment related guarantee system of a credit guarantee corporation.
Technical development support Support test product development of system
using drones Concerning “Test Product Development of
Landslide Risk Zones Monitoring System using Drones,” including “Manufacturing, Commercial and Service Renovation Subsidy” carried out by the Small and Medium Enterprise Agency as the certified supporting institution, the Bank provided support and advice for overall development including provision of plans, systems and information related to development
Support for development of next-generation managers
Managed by Chiba Kogin “Keiei Juku” The Chiba Kogin “Keiei juku” was established in
September 2004 as an initiative to provide mentorship for local companies and support the training of successor managers.
We regularly hold observation meetings and seminars to impart a wide range of management viewpoints. Activities for our sixth class of students have been ongoing since May 2015.
6
Topics The Chiba Kogyo Bank has been doing new construction, relocation or renewal of bank branches
aiming at more usable, comfortable and functional branch buildings.
Higashi Matsudo Branch grand opening On January 12, 2016, the Bank’s 72nd branch,
Higashi Matsudo Branch had its grand opening. In a highly visible location across from the station
roundabout, the branch is on the 2nd floor of the building, directly connected to the Higashi Matsudo Station of the Hokuso Line by a connecting passageway. The lobby of the branch uses wood grown in Chiba Prefecture, creating a space with a sense of openness.
In addition, a shared-use multi-story car parking facility is available (for 156 cars) so customers can easily visit the branch by car.
Corporate Social Responsibility (CSR) As a bank in step with the community, the Bank will contribute to a regional society and economy.
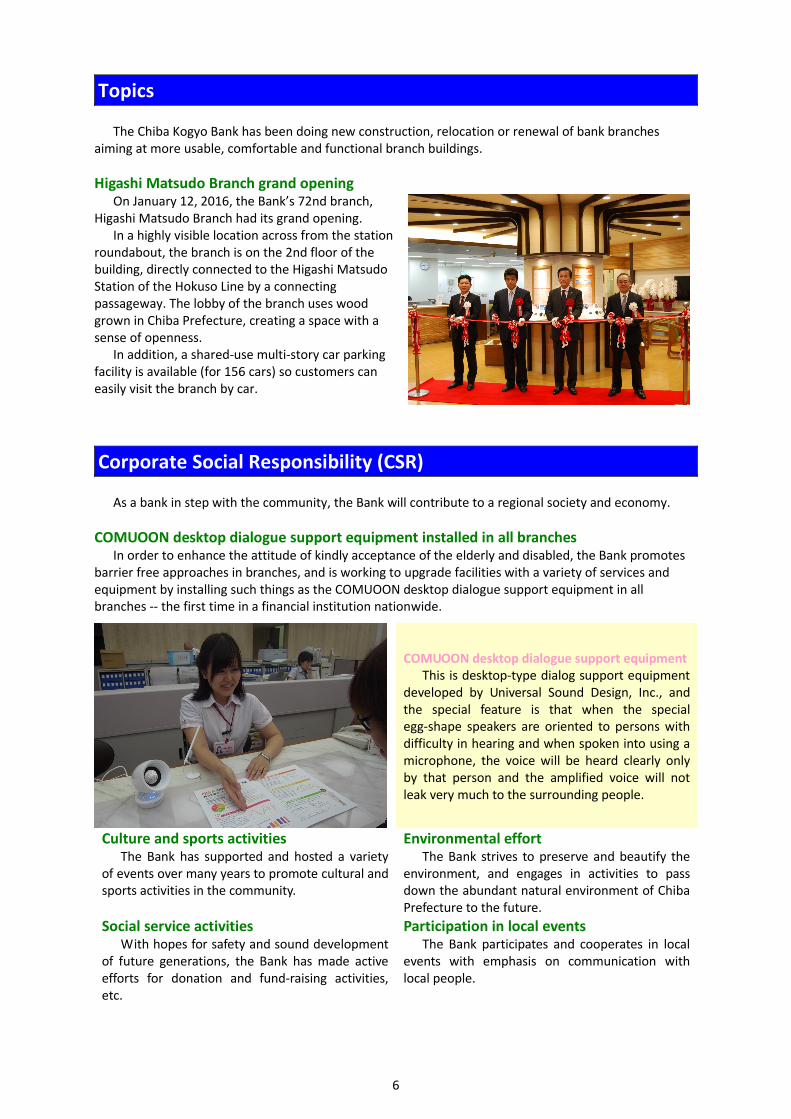
COMUOON desktop dialogue support equipment installed in all branches In order to enhance the attitude of kindly acceptance of the elderly and disabled, the Bank promotes
barrier free approaches in branches, and is working to upgrade facilities with a variety of services and equipment by installing such things as the COMUOON desktop dialogue support equipment in all branches -- the first time in a financial institution nationwide.
COMUOON desktop dialogue support equipmentThis is desktop-type dialog support equipment
developed by Universal Sound Design, Inc., and the special feature is that when the special egg-shape speakers are oriented to persons with difficulty in hearing and when spoken into using a microphone, the voice will be heard clearly only by that person and the amplified voice will not leak very much to the surrounding people.
Culture and sports activities The Bank has supported and hosted a variety
of events over many years to promote cultural and sports activities in the community.
Environmental effort The Bank strives to preserve and beautify the
environment, and engages in activities to pass down the abundant natural environment of Chiba Prefecture to the future.
Social service activities With hopes for safety and sound development
of future generations, the Bank has made active efforts for donation and fund-raising activities, etc.
Participation in local events The Bank participates and cooperates in local
events with emphasis on communication with local people.
7
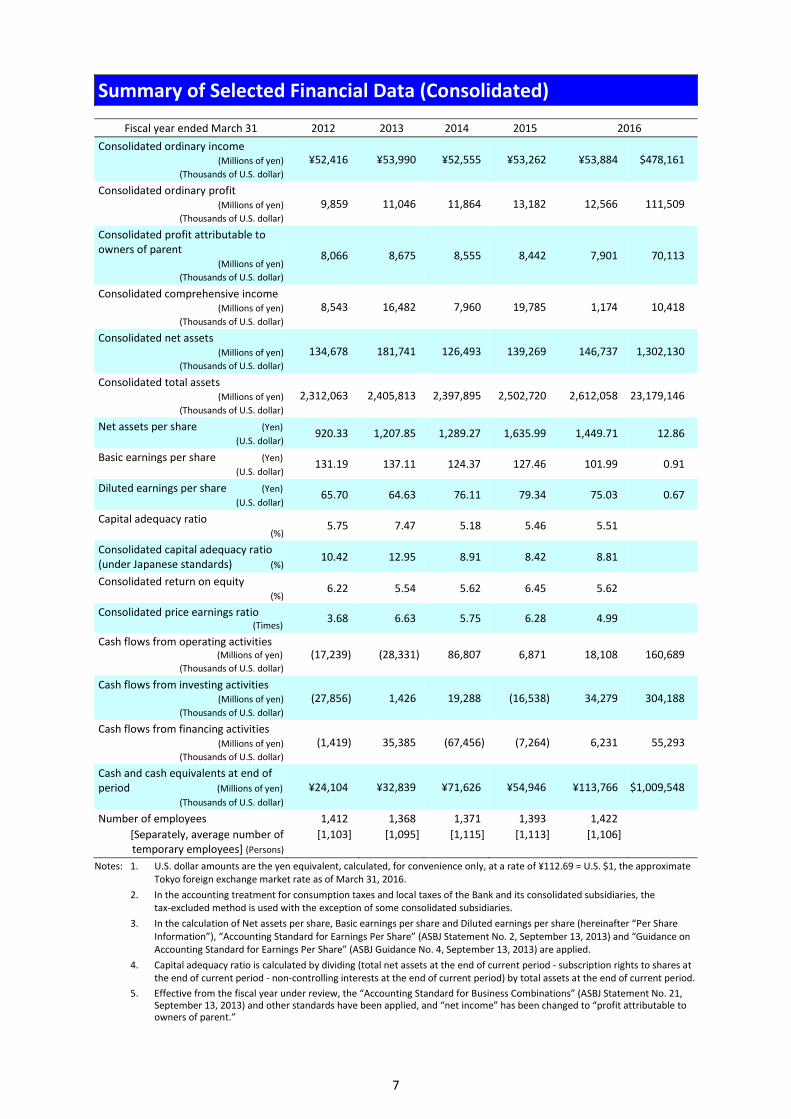
Summary of Selected Financial Data (Consolidated)
Fiscal year ended March 31 2012 2013 2014 2015 2016 Consolidated ordinary income
(Millions of yen) (Thousands of U.S. dollar)
¥52,416 ¥53,990 ¥52,555 ¥53,262 ¥53,884 $478,161
Consolidated ordinary profit (Millions of yen)
(Thousands of U.S. dollar) 9,859 11,046 11,864 13,182 12,566 111,509
Consolidated profit attributable to owners of parent
(Millions of yen) (Thousands of U.S. dollar)
8,066 8,675 8,555 8,442 7,901 70,113
Consolidated comprehensive income (Millions of yen)
(Thousands of U.S. dollar) 8,543 16,482 7,960 19,785 1,174 10,418
Consolidated net assets (Millions of yen)
(Thousands of U.S. dollar) 134,678 181,741 126,493 139,269 146,737 1,302,130
Consolidated total assets (Millions of yen)
(Thousands of U.S. dollar) 2,312,063 2,405,813 2,397,895 2,502,720 2,612,058 23,179,146
Net assets per share (Yen) (U.S. dollar)
920.33 1,207.85 1,289.27 1,635.99 1,449.71 12.86
Basic earnings per share (Yen) (U.S. dollar)
131.19 137.11 124.37 127.46 101.99 0.91
Diluted earnings per share (Yen) (U.S. dollar)
65.70 64.63 76.11 79.34 75.03 0.67
Capital adequacy ratio (%)
5.75 7.47 5.18 5.46 5.51
Consolidated capital adequacy ratio (under Japanese standards) (%) 10.42 12.95 8.91 8.42 8.81
Consolidated return on equity (%)
6.22 5.54 5.62 6.45 5.62
Consolidated price earnings ratio (Times) 3.68 6.63 5.75 6.28 4.99
Cash flows from operating activities (Millions of yen)
(Thousands of U.S. dollar) (17,239) (28,331) 86,807 6,871 18,108 160,689
Cash flows from investing activities (Millions of yen)
(Thousands of U.S. dollar) (27,856) 1,426 19,288 (16,538) 34,279 304,188
Cash flows from financing activities (Millions of yen)
(Thousands of U.S. dollar) (1,419) 35,385 (67,456) (7,264) 6,231 55,293
Cash and cash equivalents at end of period (Millions of yen)
(Thousands of U.S. dollar) ¥24,104 ¥32,839 ¥71,626 ¥54,946 ¥113,766 $1,009,548
Number of employees [Separately, average number of temporary employees] (Persons)
1,412 [1,103]
1,368[1,095]
1,371[1,115]
1,393 [1,113]
1,422 [1,106]
Notes: 1. U.S. dollar amounts are the yen equivalent, calculated, for convenience only, at a rate of ¥112.69 = U.S. $1, the approximate Tokyo foreign exchange market rate as of March 31, 2016.
2. In the accounting treatment for consumption taxes and local taxes of the Bank and its consolidated subsidiaries, the tax-excluded method is used with the exception of some consolidated subsidiaries.
3. In the calculation of Net assets per share, Basic earnings per share and Diluted earnings per share (hereinafter “Per Share Information”), “Accounting Standard for Earnings Per Share” (ASBJ Statement No. 2, September 13, 2013) and “Guidance on Accounting Standard for Earnings Per Share” (ASBJ Guidance No. 4, September 13, 2013) are applied.
4. Capital adequacy ratio is calculated by dividing (total net assets at the end of current period - subscription rights to shares at the end of current period - non-controlling interests at the end of current period) by total assets at the end of current period.
5. Effective from the fiscal year under review, the “Accounting Standard for Business Combinations” (ASBJ Statement No. 21, September 13, 2013) and other standards have been applied, and “net income” has been changed to “profit attributable to owners of parent.”
8
Business Performance (Consolidated)
In FY2015 ended March 31, 2016, the Japanese economy stayed on the track of a mild recovery, and improvements were seen in corporate earnings and the employment situation with the effects of the Government’s economic measures and the decline of energy prices, etc. However, future predictions for the economy are rather uncertain as well, with concern about a downward swing of the economy intensifying due to the slowdown of the economies of emerging countries including China, and the trend of financial market instability toward the end of the fiscal year.
The economy of Chiba Prefecture, which forms the basis for the Chiba Kogyo Bank’s business base, continued to be on a recovery track in general, despite some partial weakness, while maintaining low bankruptcy numbers and continuing on an upward trend in the employment environment.
Against this financial and economic backdrop, the Bank took up the challenge of the final year of its three-year (FY2013-2015) Medium-Term Management plan, named the “2nd Stage of Transformation and Growth Strategy” and actively carried out various measures, aiming to be “the best consultant for our customers in the region.”
As a result, the Group’s performance was as follows. From an operational standpoint, deposits totaled ¥2,338.3 billion, an increase of ¥69.2 billion compared
with the end of FY2014, primarily due to an increase in individual deposits. Loans and bills discounted amounted to ¥1,912.6 billion, an increase of ¥90.4 billion compared with the end of FY2014, as a result of efforts to discover latent financing needs through consulting sales activities, and proactive efforts toward financial needs of business partners. Securities holdings amounted to ¥512.4 billion, down ¥41.2 billion from the end of FY2014.
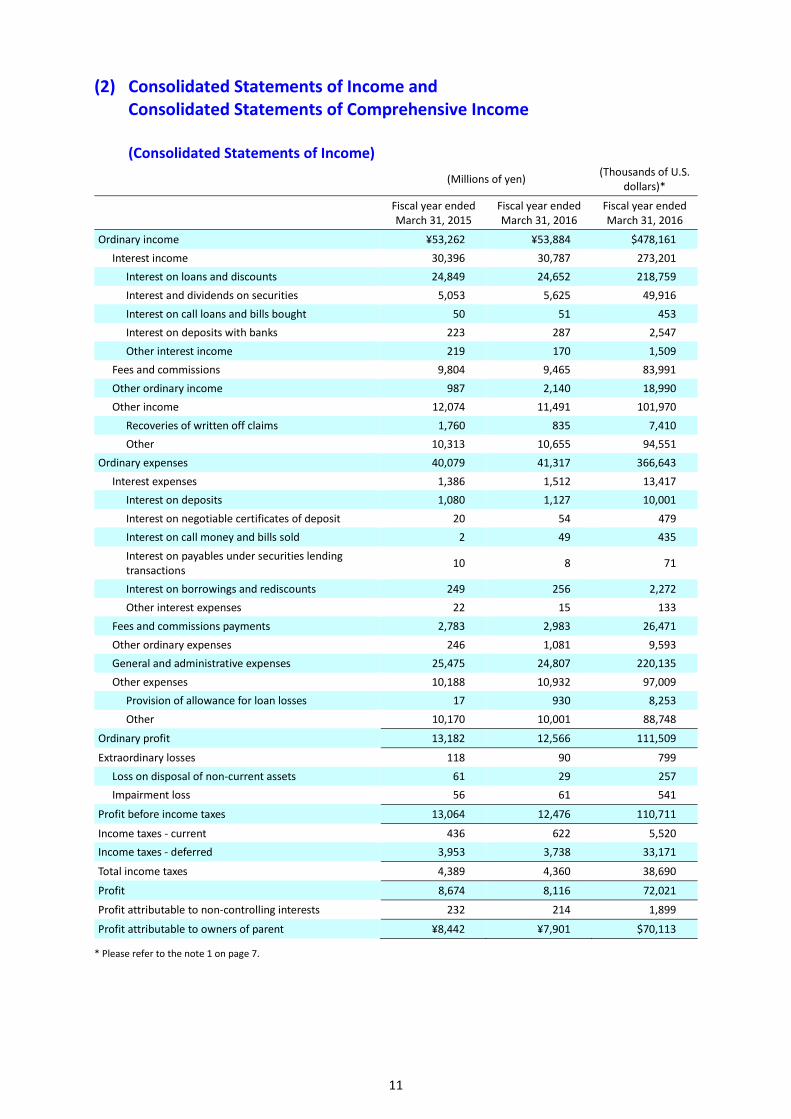
From a profit and loss standpoint, ordinary income increased ¥622 million year on year to ¥53.884 billion, due to efforts for improvement of fund management profits while the decline in interest rates continues, and also due to the increase in sales gains on securities. Ordinary expenses increased ¥1.237 billion year on year to ¥41.317 billion, owing to an increase in credit-related expenses, etc. despite efforts for reduction of general and administrative expenses. As a result, the Group posted ordinary profit of ¥12.566 billion, a decrease of ¥615 million year on year. Profit attributable to owners of parent decreased ¥540 million year on year to ¥7.901 billion.
Effective from the fiscal year under review, the “Accounting Standard for Business Combinations” (ASBJ Statement No. 21, September 13, 2013) and other standards have been applied, and “net income” has been changed to “profit attributable to owners of parent.”
Business performance by segment was as follows. Ordinary income from banking business increased ¥751 million year on year to ¥45.135 billion, while its segment profit decreased ¥695 million to ¥11.744 billion. Ordinary income from leasing business decreased ¥387 million year on year to ¥8.639 billion, while its segment profit decreased ¥75 million to ¥245 million. Ordinary income from credit guarantee and credit card business increased ¥45 million year on year to ¥2.055 billion, while its segment profit increased ¥65 million to ¥939 million. Ordinary income from other business segment increased ¥96 million year on year to ¥2.384 billion, while its segment profit increased ¥23 million to ¥121 million.
The consolidated capital adequacy ratio (under Japanese standards) at the end of FY2015 rose 0.39 percentage points from the end of FY2014 to 8.81%.
9
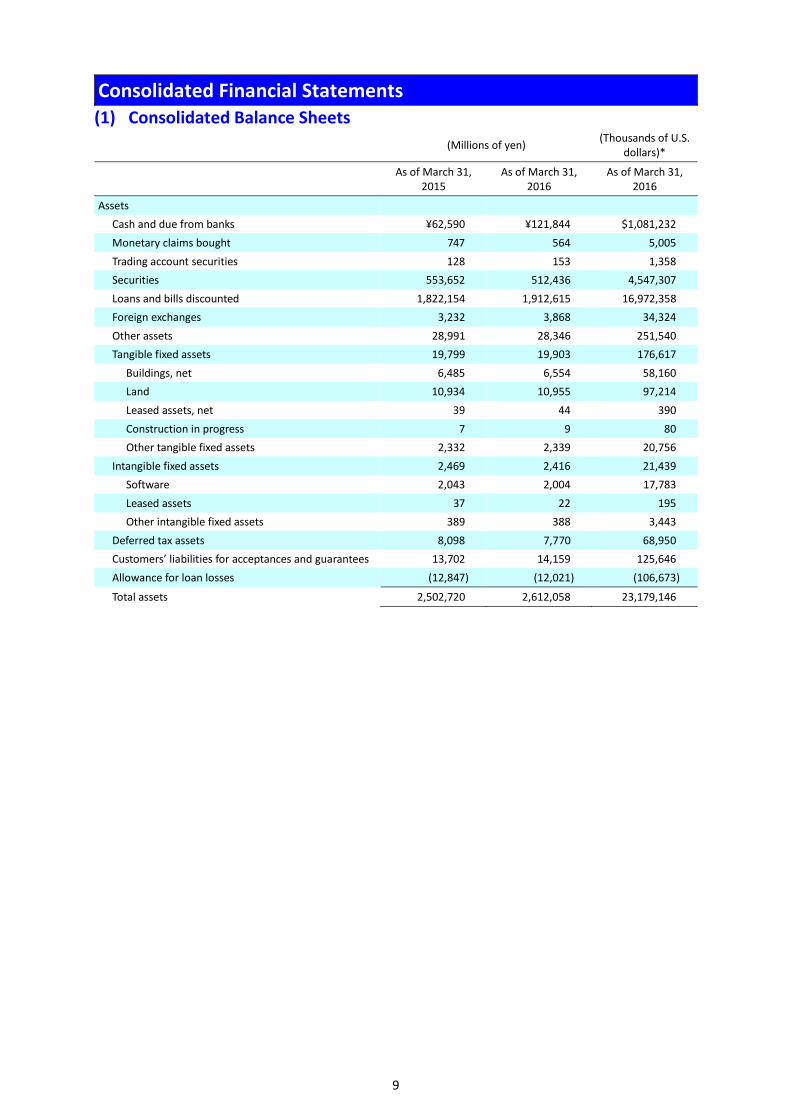
Consolidated Financial Statements
(1) Consolidated Balance Sheets (Millions of yen) (Thousands of U.S.
dollars)*
As of March 31, 2015
As of March 31, 2016
As of March 31, 2016
Assets Cash and due from banks ¥62,590 ¥121,844 $1,081,232 Monetary claims bought 747 564 5,005 Trading account securities 128 153 1,358 Securities 553,652 512,436 4,547,307 Loans and bills discounted 1,822,154 1,912,615 16,972,358 Foreign exchanges 3,232 3,868 34,324 Other assets 28,991 28,346 251,540 Tangible fixed assets 19,799 19,903 176,617
Buildings, net 6,485 6,554 58,160 Land 10,934 10,955 97,214 Leased assets, net 39 44 390 Construction in progress 7 9 80 Other tangible fixed assets 2,332 2,339 20,756
Intangible fixed assets 2,469 2,416 21,439 Software 2,043 2,004 17,783 Leased assets 37 22 195 Other intangible fixed assets 389 388 3,443
Deferred tax assets 8,098 7,770 68,950 Customers’ liabilities for acceptances and guarantees 13,702 14,159 125,646 Allowance for loan losses (12,847) (12,021) (106,673)
Total assets 2,502,720 2,612,058 23,179,146
10
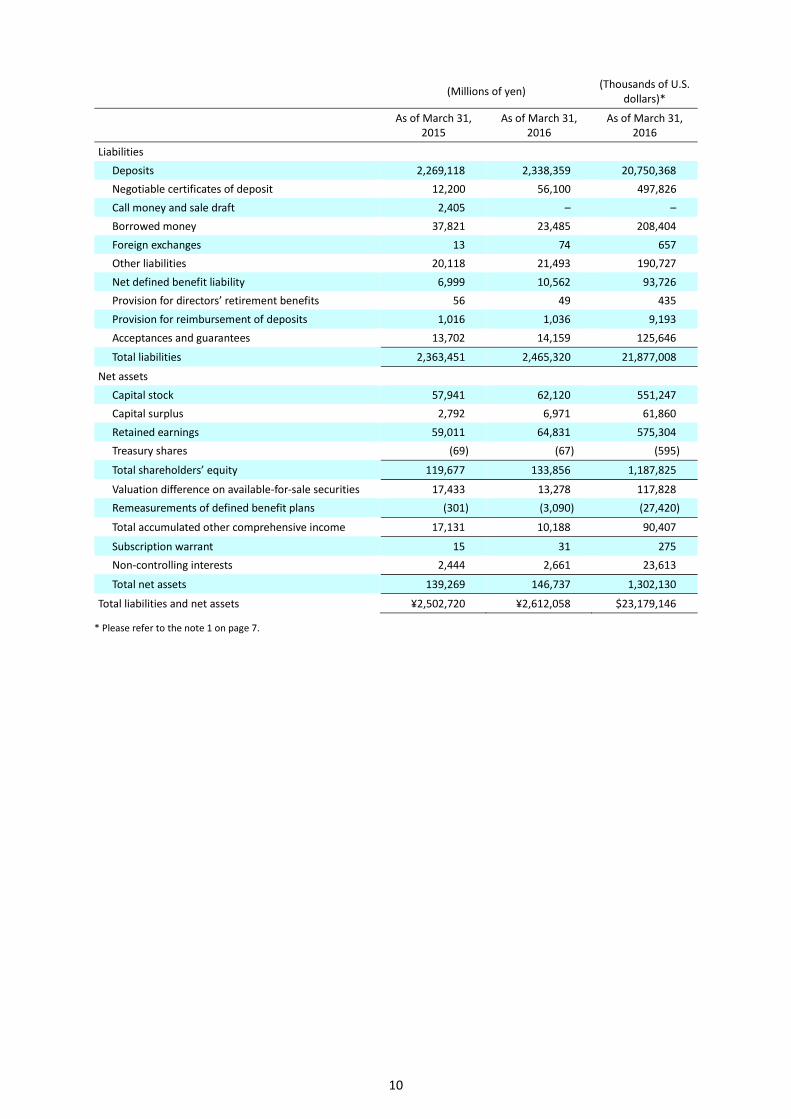
(Millions of yen) (Thousands of U.S. dollars)*
As of March 31, 2015
As of March 31, 2016
As of March 31, 2016
Liabilities Deposits 2,269,118 2,338,359 20,750,368 Negotiable certificates of deposit 12,200 56,100 497,826 Call money and sale draft 2,405 – – Borrowed money 37,821 23,485 208,404 Foreign exchanges 13 74 657 Other liabilities 20,118 21,493 190,727 Net defined benefit liability 6,999 10,562 93,726 Provision for directors’ retirement benefits 56 49 435 Provision for reimbursement of deposits 1,016 1,036 9,193 Acceptances and guarantees 13,702 14,159 125,646
Total liabilities 2,363,451 2,465,320 21,877,008
Net assets Capital stock 57,941 62,120 551,247 Capital surplus 2,792 6,971 61,860 Retained earnings 59,011 64,831 575,304 Treasury shares (69) (67) (595)
Total shareholders’ equity 119,677 133,856 1,187,825
Valuation difference on available-for-sale securities 17,433 13,278 117,828 Remeasurements of defined benefit plans (301) (3,090) (27,420)
Total accumulated other comprehensive income 17,131 10,188 90,407
Subscription warrant 15 31 275 Non-controlling interests 2,444 2,661 23,613
Total net assets 139,269 146,737 1,302,130
Total liabilities and net assets ¥2,502,720 ¥2,612,058 $23,179,146
* Please refer to the note 1 on page 7.
11
(2) Consolidated Statements of Income and Consolidated Statements of Comprehensive Income
(Consolidated Statements of Income)
(Millions of yen) (Thousands of U.S. dollars)*
Fiscal year endedMarch 31, 2015
Fiscal year ended March 31, 2016
Fiscal year ended March 31, 2016
Ordinary income ¥53,262 ¥53,884 $478,161 Interest income 30,396 30,787 273,201
Interest on loans and discounts 24,849 24,652 218,759 Interest and dividends on securities 5,053 5,625 49,916 Interest on call loans and bills bought 50 51 453 Interest on deposits with banks 223 287 2,547 Other interest income 219 170 1,509
Fees and commissions 9,804 9,465 83,991 Other ordinary income 987 2,140 18,990 Other income 12,074 11,491 101,970
Recoveries of written off claims 1,760 835 7,410 Other 10,313 10,655 94,551
Ordinary expenses 40,079 41,317 366,643 Interest expenses 1,386 1,512 13,417
Interest on deposits 1,080 1,127 10,001 Interest on negotiable certificates of deposit 20 54 479 Interest on call money and bills sold 2 49 435 Interest on payables under securities lending transactions 10 8 71
Interest on borrowings and rediscounts 249 256 2,272 Other interest expenses 22 15 133
Fees and commissions payments 2,783 2,983 26,471 Other ordinary expenses 246 1,081 9,593 General and administrative expenses 25,475 24,807 220,135 Other expenses 10,188 10,932 97,009
Provision of allowance for loan losses 17 930 8,253 Other 10,170 10,001 88,748
Ordinary profit 13,182 12,566 111,509
Extraordinary losses 118 90 799 Loss on disposal of non-current assets 61 29 257 Impairment loss 56 61 541
Profit before income taxes 13,064 12,476 110,711
Income taxes - current 436 622 5,520 Income taxes - deferred 3,953 3,738 33,171
Total income taxes 4,389 4,360 38,690
Profit 8,674 8,116 72,021
Profit attributable to non-controlling interests 232 214 1,899
Profit attributable to owners of parent ¥8,442 ¥7,901 $70,113
* Please refer to the note 1 on page 7.
12
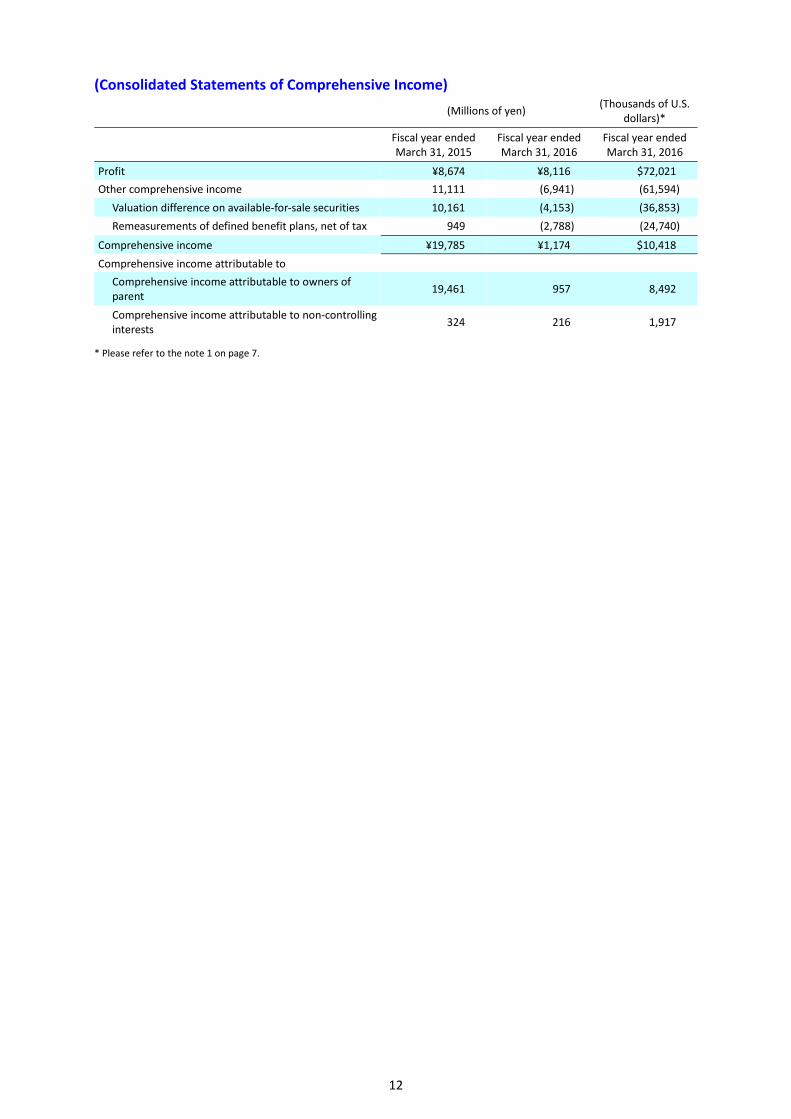
(Consolidated Statements of Comprehensive Income) (Millions of yen) (Thousands of U.S.
dollars)*
Fiscal year endedMarch 31, 2015
Fiscal year ended March 31, 2016
Fiscal year ended March 31, 2016
Profit ¥8,674 ¥8,116 $72,021 Other comprehensive income 11,111 (6,941) (61,594)
Valuation difference on available-for-sale securities 10,161 (4,153) (36,853) Remeasurements of defined benefit plans, net of tax 949 (2,788) (24,740)
Comprehensive income ¥19,785 ¥1,174 $10,418 Comprehensive income attributable to
Comprehensive income attributable to owners of parent 19,461 957 8,492
Comprehensive income attributable to non-controlling interests 324 216 1,917
* Please refer to the note 1 on page 7.
13
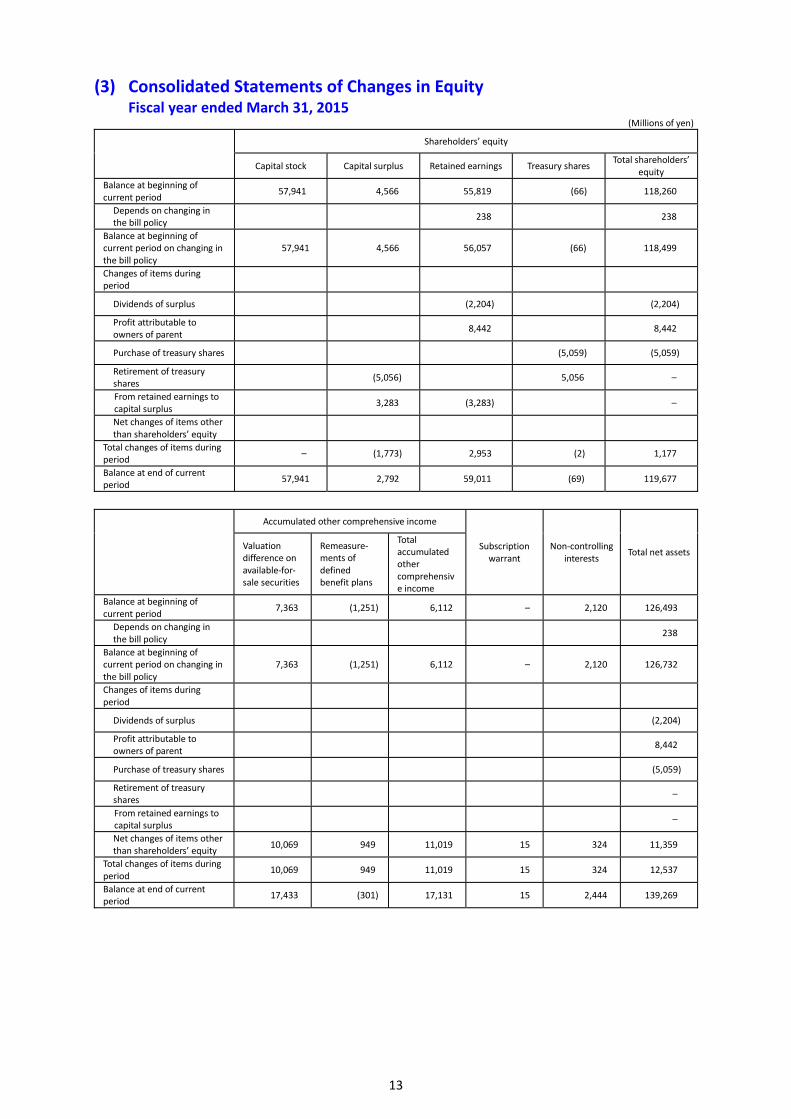
(3) Consolidated Statements of Changes in Equity Fiscal year ended March 31, 2015
(Millions of yen)
Shareholders’ equity
Capital stock Capital surplus Retained earnings Treasury shares Total shareholders’ equity
Balance at beginning of current period 57,941 4,566 55,819 (66) 118,260
Depends on changing in the bill policy 238 238
Balance at beginning of current period on changing in the bill policy
57,941 4,566 56,057 (66) 118,499
Changes of items during period
Dividends of surplus (2,204) (2,204)
Profit attributable to owners of parent 8,442 8,442
Purchase of treasury shares (5,059) (5,059)
Retirement of treasury shares (5,056) 5,056 –
From retained earnings to capital surplus 3,283 (3,283) –
Net changes of items other than shareholders’ equity
Total changes of items during period – (1,773) 2,953 (2) 1,177
Balance at end of current period 57,941 2,792 59,011 (69) 119,677
Accumulated other comprehensive income
Subscription warrant
Non-controlling interests Total net assets
Valuation difference on available-for- sale securities
Remeasure- ments of defined benefit plans
Total accumulated other comprehensive income
Balance at beginning of current period 7,363 (1,251) 6,112 – 2,120 126,493
Depends on changing in the bill policy 238
Balance at beginning of current period on changing in the bill policy
7,363 (1,251) 6,112 – 2,120 126,732
Changes of items during period
Dividends of surplus (2,204)
Profit attributable to owners of parent 8,442
Purchase of treasury shares (5,059)
Retirement of treasury shares –
From retained earnings to capital surplus –
Net changes of items other than shareholders’ equity 10,069 949 11,019 15 324 11,359
Total changes of items during period 10,069 949 11,019 15 324 12,537
Balance at end of current period 17,433 (301) 17,131 15 2,444 139,269
14
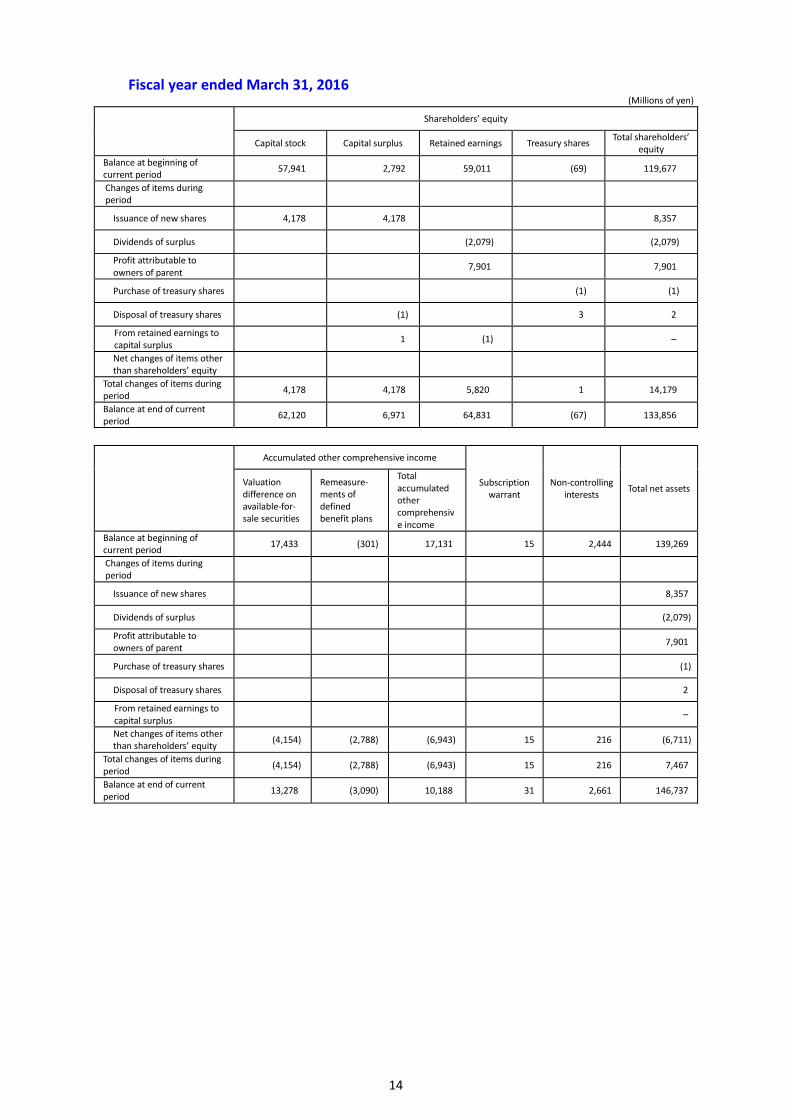
Fiscal year ended March 31, 2016 (Millions of yen)
Shareholders’ equity
Capital stock Capital surplus Retained earnings Treasury shares Total shareholders’ equity
Balance at beginning of current period 57,941 2,792 59,011 (69) 119,677
Changes of items during period
Issuance of new shares 4,178 4,178 8,357
Dividends of surplus (2,079) (2,079)
Profit attributable to owners of parent 7,901 7,901
Purchase of treasury shares (1) (1)
Disposal of treasury shares (1) 3 2
From retained earnings to capital surplus 1 (1) –
Net changes of items other than shareholders’ equity
Total changes of items during period 4,178 4,178 5,820 1 14,179
Balance at end of current period 62,120 6,971 64,831 (67) 133,856
Accumulated other comprehensive income
Subscription warrant
Non-controlling interests Total net assets
Valuation difference on available-for- sale securities
Remeasure- ments of defined benefit plans
Total accumulated other comprehensive income
Balance at beginning of current period 17,433 (301) 17,131 15 2,444 139,269
Changes of items during period
Issuance of new shares 8,357
Dividends of surplus (2,079)
Profit attributable to owners of parent 7,901
Purchase of treasury shares (1)
Disposal of treasury shares 2
From retained earnings to capital surplus –
Net changes of items other than shareholders’ equity (4,154) (2,788) (6,943) 15 216 (6,711)
Total changes of items during period (4,154) (2,788) (6,943) 15 216 7,467
Balance at end of current period 13,278 (3,090) 10,188 31 2,661 146,737
15
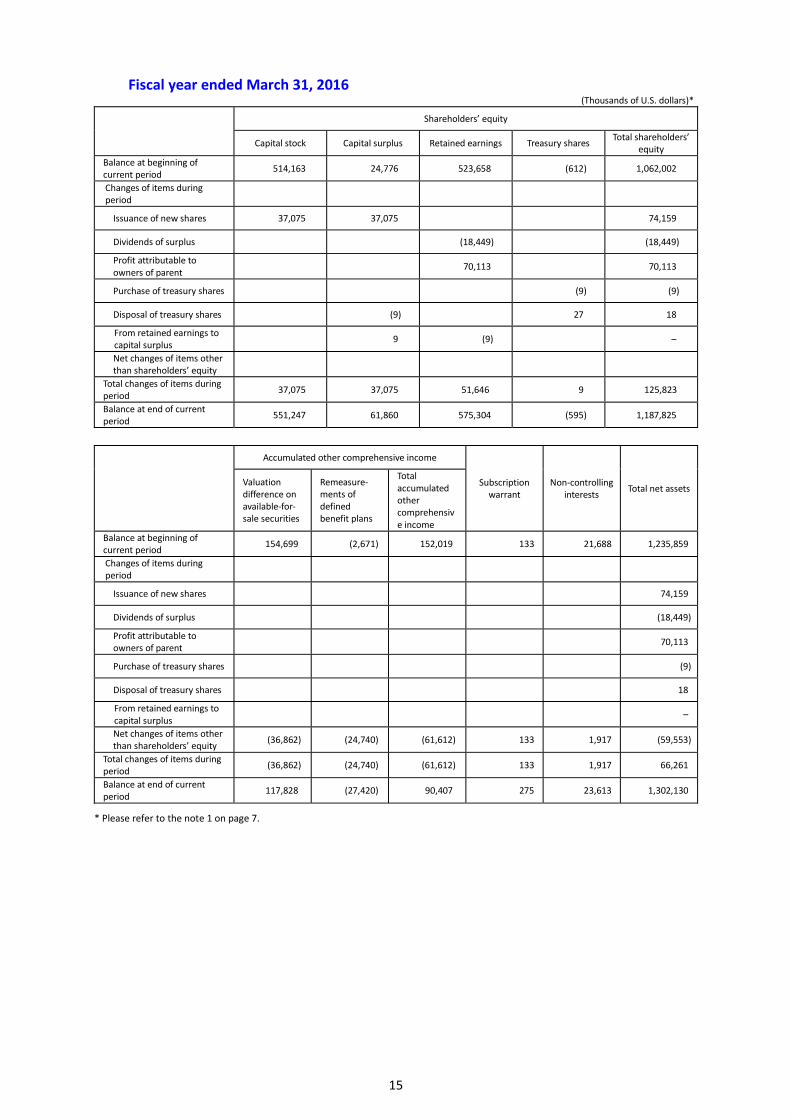
Fiscal year ended March 31, 2016 (Thousands of U.S. dollars)*
Shareholders’ equity
Capital stock Capital surplus Retained earnings Treasury shares Total shareholders’ equity
Balance at beginning of current period 514,163 24,776 523,658 (612) 1,062,002
Changes of items during period
Issuance of new shares 37,075 37,075 74,159
Dividends of surplus (18,449) (18,449)
Profit attributable to owners of parent 70,113 70,113
Purchase of treasury shares (9) (9)
Disposal of treasury shares (9) 27 18
From retained earnings to capital surplus 9 (9) –
Net changes of items other than shareholders’ equity
Total changes of items during period 37,075 37,075 51,646 9 125,823
Balance at end of current period 551,247 61,860 575,304 (595) 1,187,825
Accumulated other comprehensive income
Subscription warrant
Non-controlling interests Total net assets
Valuation difference on available-for- sale securities
Remeasure- ments of defined benefit plans
Total accumulated other comprehensive income
Balance at beginning of current period 154,699 (2,671) 152,019 133 21,688 1,235,859
Changes of items during period
Issuance of new shares 74,159
Dividends of surplus (18,449)
Profit attributable to owners of parent 70,113
Purchase of treasury shares (9)
Disposal of treasury shares 18
From retained earnings to capital surplus –
Net changes of items other than shareholders’ equity (36,862) (24,740) (61,612) 133 1,917 (59,553)
Total changes of items during period (36,862) (24,740) (61,612) 133 1,917 66,261
Balance at end of current period 117,828 (27,420) 90,407 275 23,613 1,302,130
* Please refer to the note 1 on page 7.
16
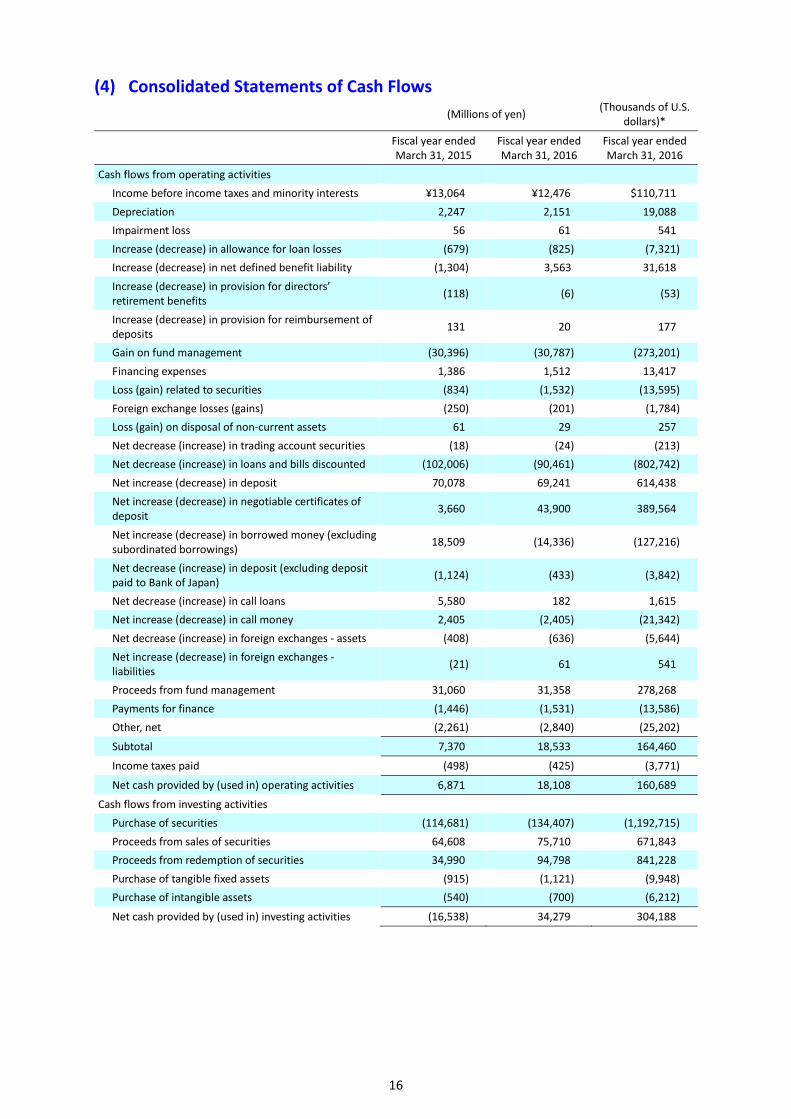
(4) Consolidated Statements of Cash Flows (Millions of yen) (Thousands of U.S.
dollars)*
Fiscal year endedMarch 31, 2015
Fiscal year ended March 31, 2016
Fiscal year ended March 31, 2016
Cash flows from operating activities Income before income taxes and minority interests ¥13,064 ¥12,476 $110,711 Depreciation 2,247 2,151 19,088 Impairment loss 56 61 541 Increase (decrease) in allowance for loan losses (679) (825) (7,321) Increase (decrease) in net defined benefit liability (1,304) 3,563 31,618 Increase (decrease) in provision for directors’ retirement benefits (118) (6) (53)
Increase (decrease) in provision for reimbursement of deposits 131 20 177
Gain on fund management (30,396) (30,787) (273,201) Financing expenses 1,386 1,512 13,417 Loss (gain) related to securities (834) (1,532) (13,595) Foreign exchange losses (gains) (250) (201) (1,784) Loss (gain) on disposal of non-current assets 61 29 257 Net decrease (increase) in trading account securities (18) (24) (213) Net decrease (increase) in loans and bills discounted (102,006) (90,461) (802,742) Net increase (decrease) in deposit 70,078 69,241 614,438 Net increase (decrease) in negotiable certificates of deposit 3,660 43,900 389,564
Net increase (decrease) in borrowed money (excluding subordinated borrowings) 18,509 (14,336) (127,216)
Net decrease (increase) in deposit (excluding deposit paid to Bank of Japan) (1,124) (433) (3,842)
Net decrease (increase) in call loans 5,580 182 1,615 Net increase (decrease) in call money 2,405 (2,405) (21,342) Net decrease (increase) in foreign exchanges - assets (408) (636) (5,644) Net increase (decrease) in foreign exchanges - liabilities (21) 61 541
Proceeds from fund management 31,060 31,358 278,268 Payments for finance (1,446) (1,531) (13,586) Other, net (2,261) (2,840) (25,202)
Subtotal 7,370 18,533 164,460
Income taxes paid (498) (425) (3,771)
Net cash provided by (used in) operating activities 6,871 18,108 160,689
Cash flows from investing activities Purchase of securities (114,681) (134,407) (1,192,715) Proceeds from sales of securities 64,608 75,710 671,843 Proceeds from redemption of securities 34,990 94,798 841,228 Purchase of tangible fixed assets (915) (1,121) (9,948) Purchase of intangible assets (540) (700) (6,212)
Net cash provided by (used in) investing activities (16,538) 34,279 304,188
17
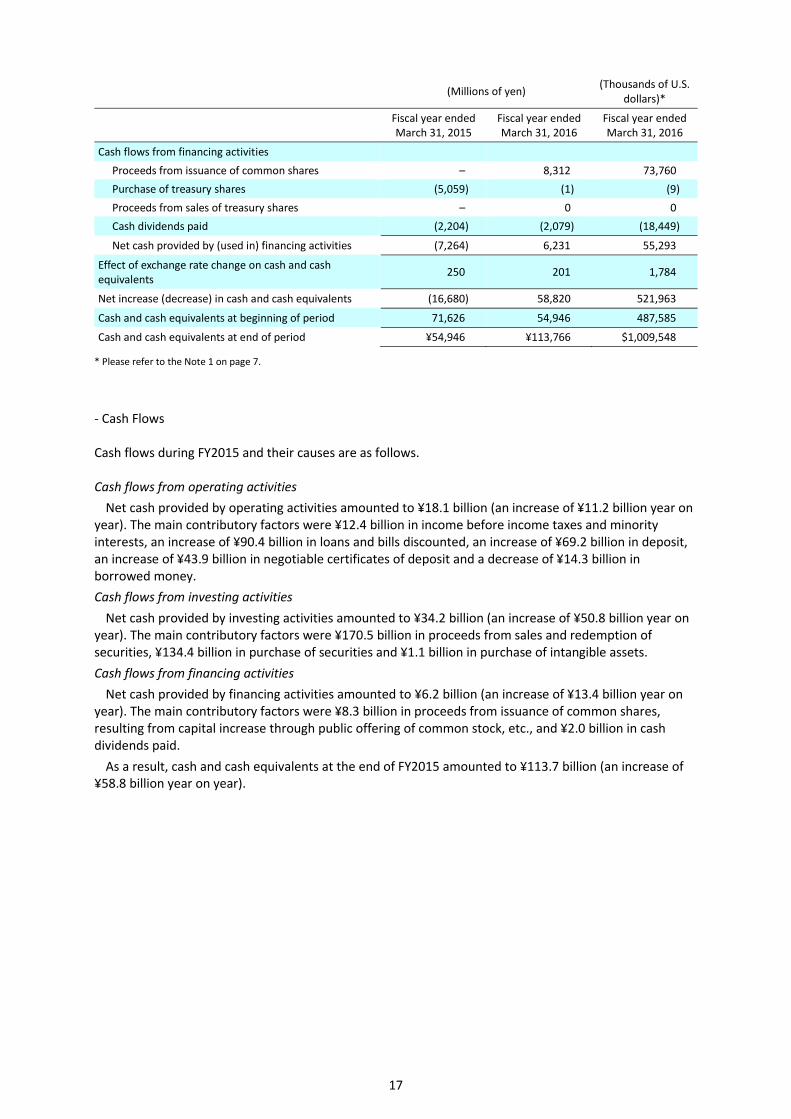
(Millions of yen) (Thousands of U.S. dollars)*
Fiscal year endedMarch 31, 2015
Fiscal year ended March 31, 2016
Fiscal year ended March 31, 2016
Cash flows from financing activities Proceeds from issuance of common shares – 8,312 73,760 Purchase of treasury shares (5,059) (1) (9) Proceeds from sales of treasury shares – 0 0 Cash dividends paid (2,204) (2,079) (18,449)
Net cash provided by (used in) financing activities (7,264) 6,231 55,293
Effect of exchange rate change on cash and cash equivalents 250 201 1,784
Net increase (decrease) in cash and cash equivalents (16,680) 58,820 521,963
Cash and cash equivalents at beginning of period 71,626 54,946 487,585
Cash and cash equivalents at end of period ¥54,946 ¥113,766 $1,009,548
* Please refer to the Note 1 on page 7.
- Cash Flows Cash flows during FY2015 and their causes are as follows. Cash flows from operating activities
Net cash provided by operating activities amounted to ¥18.1 billion (an increase of ¥11.2 billion year on year). The main contributory factors were ¥12.4 billion in income before income taxes and minority interests, an increase of ¥90.4 billion in loans and bills discounted, an increase of ¥69.2 billion in deposit, an increase of ¥43.9 billion in negotiable certificates of deposit and a decrease of ¥14.3 billion in borrowed money. Cash flows from investing activities
Net cash provided by investing activities amounted to ¥34.2 billion (an increase of ¥50.8 billion year on year). The main contributory factors were ¥170.5 billion in proceeds from sales and redemption of securities, ¥134.4 billion in purchase of securities and ¥1.1 billion in purchase of intangible assets. Cash flows from financing activities
Net cash provided by financing activities amounted to ¥6.2 billion (an increase of ¥13.4 billion year on year). The main contributory factors were ¥8.3 billion in proceeds from issuance of common shares, resulting from capital increase through public offering of common stock, etc., and ¥2.0 billion in cash dividends paid.
As a result, cash and cash equivalents at the end of FY2015 amounted to ¥113.7 billion (an increase of ¥58.8 billion year on year).
18
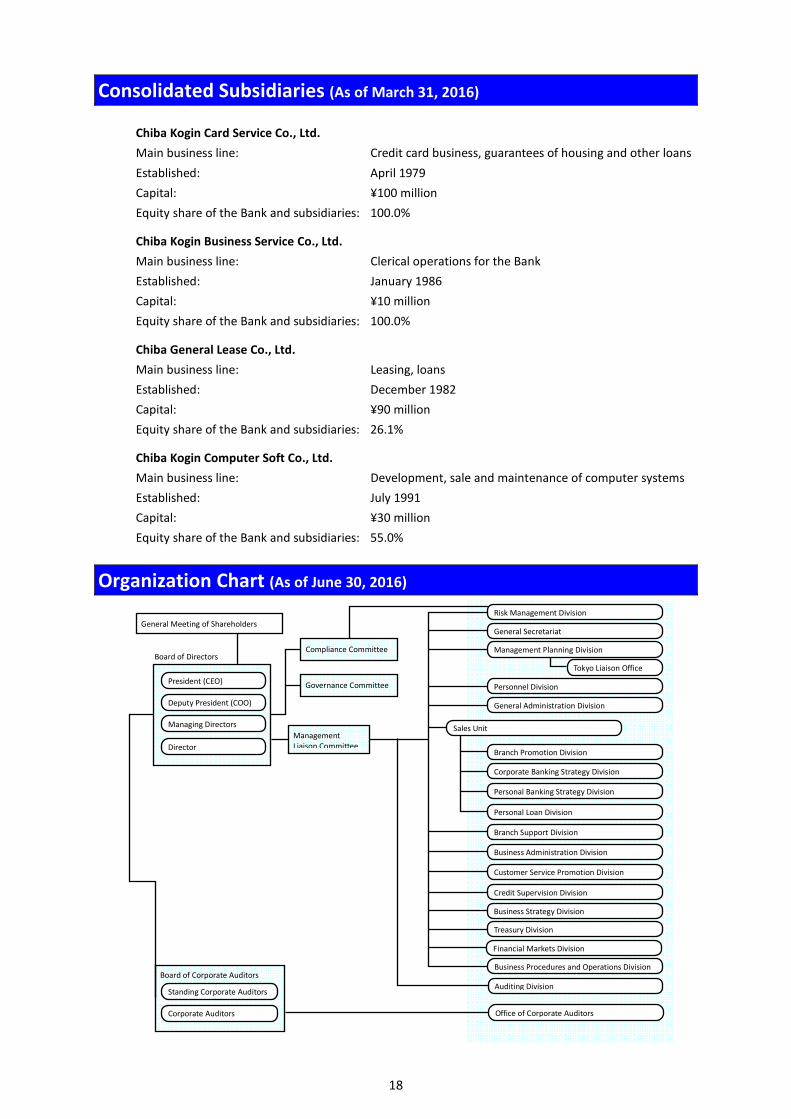
Consolidated Subsidiaries (As of March 31, 2016)
Chiba Kogin Card Service Co., Ltd. Main business line: Credit card business, guarantees of housing and other loansEstablished: April 1979 Capital: ¥100 million Equity share of the Bank and subsidiaries: 100.0%
Chiba Kogin Business Service Co., Ltd. Main business line: Clerical operations for the Bank Established: January 1986 Capital: ¥10 million Equity share of the Bank and subsidiaries: 100.0%
Chiba General Lease Co., Ltd. Main business line: Leasing, loans Established: December 1982 Capital: ¥90 million Equity share of the Bank and subsidiaries: 26.1%
Chiba Kogin Computer Soft Co., Ltd. Main business line: Development, sale and maintenance of computer systems Established: July 1991 Capital: ¥30 million Equity share of the Bank and subsidiaries: 55.0%
Organization Chart (As of June 30, 2016)
General Meeting of Shareholders
Board of Directors
President (CEO)
Deputy President (COO)
Managing Directors
Board of Corporate Auditors
Standing Corporate Auditors
Corporate Auditors
Compliance Committee
Management Liaison Committee
Risk Management Division
General Secretariat
Tokyo Liaison Office
Personnel Division
General Administration Division
Branch Support Division
Business Administration Division
Customer Service Promotion Division
Credit Supervision Division
Treasury Division
Business Procedures and Operations Division
Auditing Division
Office of Corporate Auditors
Business Strategy Division
Director
Governance Committee
Branch Promotion Division
Corporate Banking Strategy Division
Personal Banking Strategy Division
Personal Loan Division
Sales Unit
Financial Markets Division
Management Planning Division
19
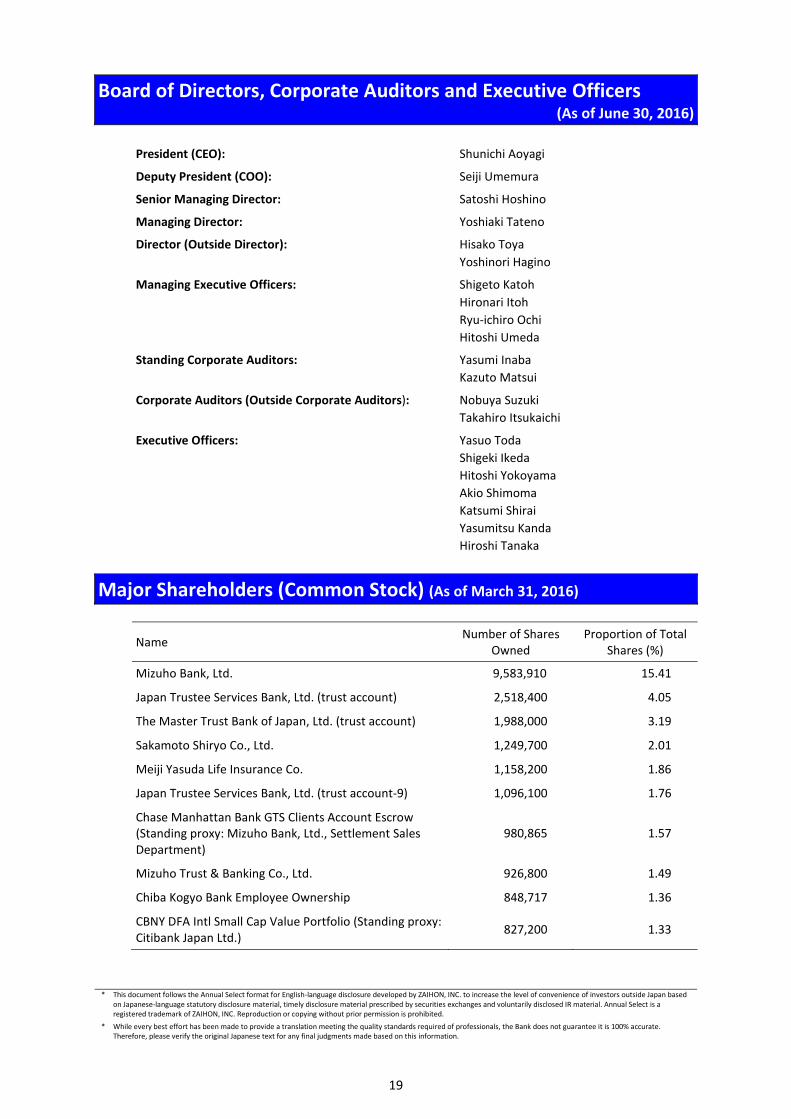
Board of Directors, Corporate Auditors and Executive Officers (As of June 30, 2016)
President (CEO): Shunichi Aoyagi
Deputy President (COO): Seiji Umemura
Senior Managing Director: Satoshi Hoshino
Managing Director: Yoshiaki Tateno
Director (Outside Director): Hisako Toya Yoshinori Hagino
Managing Executive Officers: Shigeto Katoh Hironari Itoh Ryu-ichiro Ochi Hitoshi Umeda
Standing Corporate Auditors: Yasumi Inaba Kazuto Matsui
Corporate Auditors (Outside Corporate Auditors): Nobuya Suzuki Takahiro Itsukaichi
Executive Officers: Yasuo Toda Shigeki Ikeda Hitoshi Yokoyama Akio Shimoma Katsumi Shirai Yasumitsu Kanda Hiroshi Tanaka
Major Shareholders (Common Stock) (As of March 31, 2016)
Name Number of Shares Owned
Proportion of Total Shares (%)
Mizuho Bank, Ltd. 9,583,910 15.41
Japan Trustee Services Bank, Ltd. (trust account) 2,518,400 4.05
The Master Trust Bank of Japan, Ltd. (trust account) 1,988,000 3.19
Sakamoto Shiryo Co., Ltd. 1,249,700 2.01
Meiji Yasuda Life Insurance Co. 1,158,200 1.86
Japan Trustee Services Bank, Ltd. (trust account-9) 1,096,100 1.76
Chase Manhattan Bank GTS Clients Account Escrow (Standing proxy: Mizuho Bank, Ltd., Settlement Sales Department)
980,865 1.57
Mizuho Trust & Banking Co., Ltd. 926,800 1.49
Chiba Kogyo Bank Employee Ownership 848,717 1.36
CBNY DFA Intl Small Cap Value Portfolio (Standing proxy: Citibank Japan Ltd.) 827,200 1.33
* This document follows the Annual Select format for English-language disclosure developed by ZAIHON, INC. to increase the level of convenience of investors outside Japan based on Japanese-language statutory disclosure material, timely disclosure material prescribed by securities exchanges and voluntarily disclosed IR material. Annual Select is a registered trademark of ZAIHON, INC. Reproduction or copying without prior permission is prohibited.
* While every best effort has been made to provide a translation meeting the quality standards required of professionals, the Bank does not guarantee it is 100% accurate. Therefore, please verify the original Japanese text for any final judgments made based on this information.