cheri wp169 - Cornell University WP169... · 1 Revised Version (12/15) Changing Faculty Employment...
38
1 Revised Version (12/15) Changing Faculty Employment at Four-Year Colleges and Universities in the United States by Liang Zhang, Ronald G. Ehrenberg, and Xiangmin Liu Zhang is an associate professor of higher education and labor studies at Penn State University. Ehrenberg is the Irving M. Ives Professor of Industrial and Labor Relations and Economics at Cornell University, Director of the Cornell Higher Education Research Institute (CHERI) and a research associate at the National Bureau of Economic Research. Liu is an assistant professor of labor studies and employment relations at Penn State University. Address queries to Zhang at 410B Rackley Building, Pennsylvania State University, University Park, PA 16802; phone: 814.863.3774; email: [email protected]
Transcript of cheri wp169 - Cornell University WP169... · 1 Revised Version (12/15) Changing Faculty Employment...

1
Revised Version (12/15)
Changing Faculty Employment at Four-Year Colleges and
Universities in the United States
by
Liang Zhang, Ronald G. Ehrenberg, and Xiangmin Liu
Zhang is an associate professor of higher education and labor studies at Penn State University. Ehrenberg is the Irving M. Ives Professor of Industrial and Labor Relations and Economics at Cornell University, Director of the Cornell Higher Education Research Institute (CHERI) and a research associate at the National Bureau of Economic Research. Liu is an assistant professor of labor studies and employment relations at Penn State University. Address queries to Zhang at 410B Rackley Building, Pennsylvania State University, University Park, PA 16802; phone: 814.863.3774; email: [email protected]

2
Abstract
We use panel data models to examine variations and changes in faculty employment at
four-year colleges and universities in the United States. The share of part-time faculty among
total faculty has continued to grow during the last two decades, while the share of full-time
lecturers and instructors has been relatively stable. Meanwhile, the share of non-tenure track
faculty among full-time faculty has been growing, especially among the professorial ranks.
Dynamic panel data models suggest that employment levels of different types of faculty respond
to a variety of economic and institutional factors. Colleges and universities have increasingly
employed faculty whose salaries and benefits are relatively inexpensive; the slowly deteriorating
financial situations at most colleges and universities have led to an increasing reliance on a
contingent academic workforce. A cross-sectional comparison of the share of full-time non-
tenure track faculty also reveals significant variations across institutions.

3
Changing Faculty Employment at Four-Year Colleges and
Universities in the United States
1. Introduction
The landscape of faculty employment in higher education has evolved at least in two
ways, namely, employment status (i.e., full-time vs. part-time) and tenure eligibility. Many have
observed that in response to the oversupply of PhDs in many academic disciplines since the early
1970s, a segmented academic employment structure evolved consisting of tenure track and non-
tenure track faculty (Roemer & Schnitz 1982; Rosenblum & Rosenblum 1990), with the majority
of non-tenure track faculty working part-time and most tenure-track faculty working full-time.
Gradually, this bifurcated system based on tenure status transformed into a trifurcated one,
consisting of full-time faculty who were tenured or on tenure tracks, full-time faculty who were
not eligible for tenure, and part-time faculty (Ehrenberg 2012; Schuster 1998). Among full-time
faculty, tenure eligibility roughly aligned with academic ranks, with professorial faculty (i.e.,
assistant, associate, and full professors) typically tenured or tenure-eligible, and instructors and
lecturers not on tenure tracks. While some professorial faculty were not on tenure tracks, they
were certainly not the norm.
This seems not to be the case any longer. The line between professorial ranks and tenure
eligibility has become increasingly blurred. Recent data indicate that while the share of full-time
instructors and lecturers has stagnated, the share of professorial faculty who are not eligible for
tenure has increased substantially. This has occurred across all professorial ranks, although most
prominently among assistant professors. With this new growth, non-tenure track faculty,
including part-time faculty and full-time non-tenure track faculty, now constitute the majority of
the academic labor force in the United States (Kezar & Sam 2010). Some argue that institutions

4
have been actively adjusting their faculty employment strategies in order to cope with stringent
fiscal realities, increase managerial discretion, and maintain an academic workforce that is
responsive to market incentives (Rhoades 1998; Zhang & Liu 2010).
While much has been written about the growth of contingent faculty employment in
higher education, very few have documented the recent growth in the share of non-tenure track
professorial faculty and used panel data to examine various economic and institutional factors
behind this trend. In this study, we use faculty employment data from four-year colleges and
universities in the United States from1993 to 2013 and document recent trends in faculty
employment, especially the increasing share of professorial faculty who are not tenure eligible.
We then examine an array of economic and institutional characteristics that affect the
employment of different types of faculty in terms of employment status, tenure eligibility, and
faculty ranks across different types of institutions over time.
2. Literature Review
The use of contingent faculty at colleges and universities in the United States has been
rising since 1970s; at the same time, the types of faculty that constitute the “contingent”
academic workforce have become increasingly complex. In the traditional dual labor market
model, part-time faculty represented the primary type of contingent faculty as opposed to full-
time regular faculty who were tenured or on tenure tracks. In 1975, part-time faculty represented
about 30% of the academic labor force in the United States; by 2005, this proportion had
increased to approximately 48% (Monks 2009),1 a proportion much higher than in the rest of the
U.S. workforce. This appeared to be an anomaly, considering the high skill requirements and
1 As we show later in this paper, the proportion of part-time faculty has continued to increase, albeit slowly, in recent years.

5
institutionalized practice of tenure in the academic labor market. Many argued that the rise of
part-time faculty employment was due to an oversupply of PhDs in many academic fields since
the 1970s (Roemer & Schnitz 1982; Rosenblum & Rosenblum 1990).
While the proportion of full-time faculty shrunk due to increased employment of part-
time faculty, the composition of full-time faculty became increasingly stratified. During the
1980s and 1990s, there was tremendous growth in the share of teaching faculty with lecturer and
instructor titles among full-time faculty. Ehrenberg and Zhang (2005) reported that the
proportion of teaching faculty with lecturer and instructor titles among all full-time faculty
increased from about 10% in 1987 to 22% in 2005, a trend that was consistently documented in
the literature (e.g., Anderson 2002; Conley & Lesley 2002; Zhang & Liu 2010). From a job
security perspective, some full-time lecturers and instructors have multi-year contracts that
distinguish them from part-time faculty with limited duration contracts. However, because the
vast majority of full-time lecturers and instructors are not tenure-eligible, they are denied the
ultimate insurance of job security. Probably for these reasons, in empirical studies on faculty
employment, researchers typically viewed these full-time teaching faculty as part of the
contingent workforce in higher education.
Not surprisingly, as the proportion of part-time faculty and full-time teaching faculty rose,
the proportion of full-time professorial faculty (i.e., those with assistant, associate, and full
professor ranks) declined. Traditionally, professorial faculty were either tenured or on tenure
tracks, which ensured lifelong employment, as opposed to the unstable or fixed-term
employment situations of part-time faculty and full-time lecturers and instructors. Furthermore,
professors were usually evaluated based on research productivity and teaching effectiveness. In
contrast, part-time faculty and full-time lecturers and instructors were hired primarily to teach; in

6
most cases, research was not part of their job descriptions (Anderson 2002; Ehrenberg & Zhang
2005; Gappa & Leslie 1993; Zhang & Liu 2010).
In recent years, however, there has been a slow but steady erosion of tenure within the
full-time professorial ranks. Many professors are now hired without tenure eligibility. Anecdotal
evidence suggests that this has occurred for various reasons. For example, on the research side,
non-tenure track research professors often hold soft-money positions, which offer advantages of
low or no teaching responsibilities but require them to underwrite at least a share of their own
salaries. As a result, employing a large number of research professors would enable institutions
to generate a high volume of external grants and contracts and be responsive to a volatile funding
environment.
On the teaching side, some institutions are now creating career paths for non-tenure track
professorial faculty as they begin to recognize the importance of instructional faculty. For
example, using undergraduate student transcript data from Northwestern University, Figlio,
Schapiro and Soter (2013) showed that non-tenure track faculty outperform tenure track faculty
in terms of student learning in core classes, which is mostly attributed to long-term employment
relationships with full-time non-tenure track faculty, a pattern similar to what Bettinger and Long
(2010) found in their study using student transcript data from large public institutions in Ohio.
Not surprisingly, Northwestern now has the titles of assistant, associate, and full professors of
instruction. As non-tenure track assistant professors mature (are promoted), growth is expected
in the ranks of non-tenure track associate and full professors.
Finally, some institutions now use the title professor of practice when hiring faculty from
outside academia with unique skills. Previously non-academic faculty members were hired as
senior lecturers, but many institutions found that the title was not sufficiently prestigious to

7
attract top talent. Over time, more growth can also be expected in the senior non-tenure track
professorial faculty ranks.
What can economic theories inform us about these trends? The basic “law” of labor
demand suggests a negative relationship with the costs of employing a specific type of faculty,
and a positive relationship with the costs associated with employing other types of faculty. For
example, other factors held constant, if salaries paid to professorial faculty rose relative to part-
time faculty, institutions would hire fewer professorial faculty and more part-time faculty, which
is essentially a cost-saving mechanism. Empirical results are consistent with these theoretical
predictions. Zhang and Liu (2010) used a cross-sectional sample of four-year colleges and
universities and confirmed substitution effects among part-time faculty, full-time teaching
faculty, and full-time professorial faculty. In addition, Cheslock and Callie (2015) used detailed
salary and employment information from a sample of business schools and found that as salaries
grew for professors, their employment level decreased.
Costs must be cut in times of financial instability and declining public support in the form
of state appropriations and government grants and contracts. However, the substantial gap in
salary and benefits between contingent faculty and their tenured and tenure track counterparts
may motivate contingent faculty to unionize and negotiate their employment conditions with
institutions.2 Once unionized, faculty unions can influence salary and job security. Research has
shown that the presence of faculty unions is positively associated with salary premiums (Hedrick,
Henson, Krieg, and Wassell 2011). The effect of faculty unions on employment levels is,
however, not straightforward. Take full-time, non-tenure track faculty unions, for example. On
the one hand, these faculty unions seek to increase salaries, protect job security, and maintain
2 See Maynard and Joseph (2008) and Liu and Zhang (2015) for detailed discussions on job satisfaction and work. effort of contingent faculty.

8
faculty participation in shared governance structures (Rhoades 1998); thus, they may be opposed
to the employment of part-time faculty if they believe doing so will erode employment stability
for full-time faculty. On the other hand, the presence of these unions, which may increase full-
time non-tenure track faculty, may also increase an institution’s reliance on part-time faculty.
Similarly, while the presence of part-time faculty unions may discourage institutions from hiring
more part-time faculty, it may help universities attract and recruit high-quality instructors by
improving their working conditions.
Institutional wealth also affects faculty employment. The “income effect” on different
types of faculty employment depends on roles of each type of faculty in improving institutional
outcomes as perceived by institutions. As far as institutional prestige is concerned—which is
increasingly defined by research as opposed to teaching—colleges and universities would most
likely employ fewer part-time faculty and full-time teaching faculty and more professorial
faculty when financial resources permit. Of course, it is also true that employing more part-time
and full-time teaching faculty to fulfill teaching needs would free up time for professorial faculty
to conduct research (Zhang & Ehrenberg 2010).
In addition to price and income effects, faculty employment at colleges and universities is
influenced by a host of institutional characteristics (Liu & Zhang 2013). Private institutions, on
average, have higher levels of part-time faculty than their public counterparts. Furthermore,
institutions located in big cities or suburbs are able to draw on a large supply of qualified
individuals for part-time work. The proportion of part-time students also is positively associated
with part-time faculty employment. Finally, the difference in faculty employment across
institutions is related to the portfolio of academic programs (Johnson & Turner 2009). Although
we do not examine many of these factors in our panel data analysis because they are superseded

9
by institutional fixed effects, we do examine the effects of time-variant factors on faculty
employment.
3. Data
The main data source for this study was the Integrated Postsecondary Education Data
System (IPEDS).3 We collected data on faculty employment and other institutional
characteristics for academic years 1993–94 through 2013–14. We limited our sample to four-
year general colleges and universities, a total of 1,463 institutions; we excluded institutions
offering less than four-year degrees and specialized institutions from the analysis. Because
degree programs offered by institutions changed slightly over years, we used information on
level of instruction, i.e., four-year general colleges and universities based on data reported in
academic year 2013–14 to determine our final sample. In other words, a few institutions in our
sample were not four-year colleges in earlier years.
We set the beginning of our study period to 1993–94 because that was the first year the
IPEDS Fall Staff Survey provided detailed information on employment status (part-time vs. full-
time), academic ranks (assistant professor, associate professor, full professor, lecturer and
instructor), and tenure status (tenured and tenure track, and non-tenure track). These data,
however, were only available in odd-numbered years between 1993 and 2001. Since 2001,
institutions were encouraged, but not required, to report these detailed data in even-numbered
years. Finally, there was a change in the definition of instructional faculty between the 2011–12
and 2012–13 academic years. Prior to the 2012–13 academic year, instructional faculty reported
3 IPEDS consists of a series of interrelated survey components that are designed to collect information about different aspects of postsecondary educational institutions, including institutional characteristics, student enrollment and completion rates, institutional finances, and faculty employment and compensation. IPEDS collects data from all post-secondary institutions in the United States and territories.

10
in IPEDS included faculty members whose main responsibilities were instruction, research,
and/or public services. Since then, instructional faculty only include faculty whose main
responsibility is instruction. Due to this change of definition, we excluded the last two years of
data in our regression models.
In Table 1, we provide information on the variables used in this study. In addition to
faculty employment data by employment status, rank, and tenure status, we also used faculty
salary data to compute the average salary for professorial faculty and for instructors and lecturers.
In some model specifications, we estimated professorial faculty by ranks, so average salaries
were also computed for subcategories of professorial faculty. IPEDS salary data did not include
salary data for part-time faculty because part-time faculty were usually paid on a per course basis,
making it difficult to report and compare across institutions since workloads for part-time faculty
varied. To estimate the income effect, we collected data on total current revenues, adjusted by
full-time equivalent (FTE) student enrollment depending on model specifications.
We also examined the effects of institutional characteristics on faculty employment.
These variables include enrollment size, the proportion of part-time students, institutional control,
Carnegie classification, and whether an institution had a medical school. These variables have
been used in the literature as important determinants of faculty employment. Since some of these
variables are time invariant, they are suppressed in panel data models. Finally, we used faculty
union data from the Directory of Faculty Contracts and Bargaining Agents in Institutions of
Higher Education 2012, compiled by the National Center for the Study of Collective Bargaining
in Higher Education and the Professions. We created three dummy variables to represent whether
an institution had a full-time tenure-track union, a full-time non-tenure track union, and a part-
time non-tenure track union in each year.

11
4. Trends of Faculty Employment
Table 2 reports the shares of part-time faculty, full-time lecturers and instructors, and
professorial faculty by type of institutional control and Carnegie classification.4 Because the
definition of instructional faculty changed in 2012–13, we use data from 2011–12 as our most
recent data points in order to make comparisons with earlier years. Several observations can be
made here. First, the variation in faculty composition across institutional types is substantial. For
example, in 1993–94, the proportions of part-time faculty ranged from a low of 19.4% at public
doctoral/research institutions to a high of 51.8% at private master’s institutions.5 Also, based on
the standard deviations reported in parentheses, it is clear that faculty composition varied within
each category of institutions. Second, generally speaking, private institutions employed more
contingent faculty than their public counterparts (i.e., almost 50% private vs. 35% at public
institutions). This is true except for bachelor’s institutions, where public institutions had a higher
proportion of contingent faculty than their private counterparts. Third, among public institutions,
doctoral/research institutions had the highest proportion of professorial faculty while bachelor’s
institutions had the highest proportion of contingent faculty, In contrast, among private
institutions, doctoral/research institutions and bachelor’s institutions had the highest proportion
of full-time professorial faculty. Finally, from 1993 to 2011, there was a significant increase in
the proportion of part-time faculty and a significant decrease in the proportion of full-time
4 Carnegie classification is based on the 2010 edition (Carnegie Foundation for the Advancement of Teaching, 2011). The numbers of institutions listed in this table are based on all institutions that were included in each category in 2010. The actual numbers used to compute the proportions in the table may differ due to missing data. However, using a consistent sample of institutions in 1993 and 2013 yielded very similar results. This sample provides us with a relatively homogenous group of institutions with sufficient variation in faculty employment. We do not include baccalaureate/associate’s colleges, theological institutions, or specialized schools and centers because these institutions usually have different faculty employment practices than general purpose colleges and universities. 5 Our sample does not include two-year colleges, where proportions of part-time faculty and full-time non-tenure track faculty are much higher than those at four-year institutions.

12
professorial faculty. The proportion of full-time lecturers and instructors remained relatively
stable over the study period, at around 11% of total faculty.6 The shift from full-time professorial
faculty to part-time faculty seems to be more pronounced among public institutions than among
private institutions. This is consistent with the view that declining public support for higher
education has propelled colleges and universities to use part-time faculty as a cost-saving
strategy.
[INSERT TABLE 2 ABOUT HERE]
Figure 1 shows the trend of faculty employment during the study period. The graph
indicates a consistent increase in part-time faculty and a steady decrease in professorial faculty
over time, while the proportion of full-time lecturers and instructors remained quite stable. The
break in the trend line between 2011 and 2012 is due to the change in the definition of
instructional faculty in the Fall Staff Survey, which excluded faculty members whose main
responsibility was research and public service and restricted the category to faculty whose main
responsibility was instruction. Because part-time faculty members are hired mainly for the
purpose of teaching, their proportion was higher after 2011.
[INSERT FIGURE 1 ABOUT HERE]
The change in the distribution of faculty among part-time faculty, full-time lecturers and
instructors, and professorial faculty is related to, but different from the change in the distribution
of faculty employment by tenure status due to the change in tenure eligibility among full-time
faculty. Table 3 reports the share of non-tenure track full-time faculty by academic rank for each
type of institution. First, across different academic ranks, there is a clear divide between full-time
6 This trend differs from earlier studies (e.g., Anderson 2002; Conley & Lesley 2002; Ehrenberg & Zhang 2005; Zhang & Liu 2010) because researchers used the total number of full-time faculty as the denominator to calculate the share of full-time teaching faculty, while we used the total number of faculty, both part-time and full-time, to compute this proportion.

13
lecturers/instructors and professorial faculty. While the (vast) majority of lecturers and
instructors were not tenure eligible, the reverse was true for all three ranks of full-time
professorial faculty. This is not surprising, given the job descriptions for teaching faculty and
tenure criteria at most four-year colleges and universities. Among the three professorial ranks,
assistant professors had the highest proportion and full professors had the lowest proportion of
faculty who were not tenure eligible. Second, tenure eligibility of lecturers and instructors seems
to be related to the level of institutional emphasis on instruction. For example, private institutions,
on average, had higher proportions of lecturers and instructors who were tenure eligible,
reflecting their desire to maintain a stable, effective instructional faculty. In addition, among both
public and private institutions, bachelor’s institutions had the highest proportion of teaching
faculty eligible for tenure. This was true in both 1993 and 2011, although the difference was not
as pronounced in the latter year.
[INSERT TABLE 3 ABOUT HERE]
Finally, from 1993 to 2011, there was a significant increase in the proportions of all ranks
of full-time, non-tenure track faculty. For all four-year institutions, 22.4% of all full-time faculty
were not eligible for tenure in 1993; this proportion increased to 34.0% in 2011. Broken down by
rank, the proportions in 1993 were 80%, 23.7%, 8.9%, and 5.0% for lecturers/instructors,
assistant professors, associate professors, and full professors, respectively. These proportions
increased across the board to 94.7%, 35.6%, 15.9%, and 9.7% in 2011. Aggregating across
professorial faculty, the proportion not eligible for tenure increased from 12.1% in 1993 to
20.3% in 2011 (these two proportions are not reported in the table). So, roughly speaking, 1 out
of every 5 professors was not eligible for tenure in 2011; for assistant professors the ratio was 1
out of every 3.

14
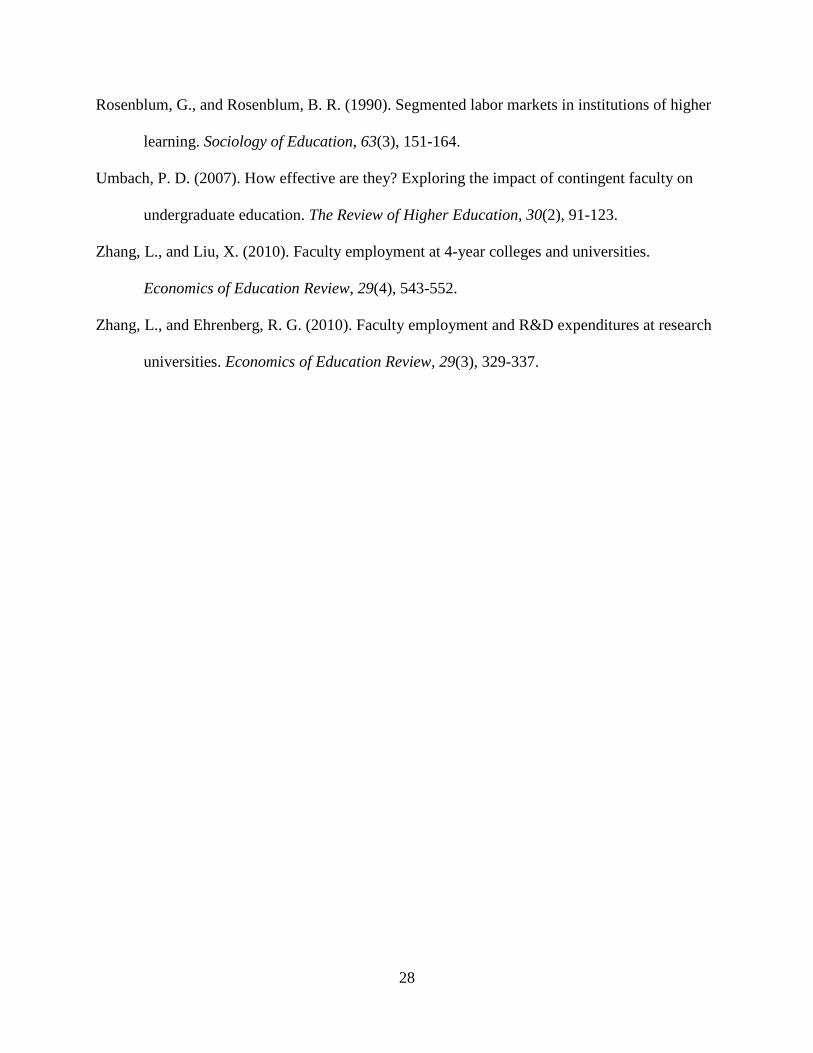
Figure 2 shows the trend of tenure eligibility by faculty rank during the study period. The
graph indicates a gradual but steady increase in the proportion of non-tenure track full-time
faculty over time for all ranks of full-time faculty. Despite the clear divide between
lecturers/instructors and professors, a significant proportion of professorial faculty, especially
assistant professors, were not on tenure tracks in 2011. Not surprisingly, when only instructional
faculty data are considered in the last 2 years of the study period in Figure 2, the proportion of
professorial faculty who were not on tenure tracks becomes lower, suggesting a high proportion
of professorial faculty who were not eligible for tenure in research and public service positions.
[INSERT FIGURE 2 ABOUT HERE]
5. Econometric Analysis
In this section, we present a formal regression analysis to examine how faculty
employment is influenced by various economic and institutional factors. We consider a dynamic
panel data model where the employment levels of different types of faculty depend on each other.
In other words, if the faculty employment in category i in one year is high, it affects faculty
employment in subsequent years not only in category i, but also in other categories. One of the
empirical decisions is how many categories of faculty employment to estimate separately. The
basic categories examined in the literature include part-time faculty, full-time
lecturers/instructors, and professorial faculty; however, based on the time trends we identified in
the proceeding section, it appeared appropriate to separate assistant professors from associate
and full professors. Nearly every 1 out 3 assistant professors in recent years was not on a tenure
track, while the proportion was much lower among associate and professors. In addition,
assistant professors, even those on tenure tracks, have much less job security than tenured

15
associate and full professors. For these reasons, employment decisions related to assistant
professors are probably quite different than those related to their more senior counterparts.
Formally, we consider four mutually-exclusive faculty types in our empirical model: part-
time faculty, full-time lecturers/instructors, assistant professors, and associate and full
professors.7 Take part-time faculty as an example. The number of part-time faculty at institution
i in year t (𝑃𝑃𝑃𝑃𝑖𝑖𝑖𝑖) is specified to be a function of employment of each of the four faculty types in
year t-1 (𝐹𝐹𝐹𝐹𝐹𝐹𝑖𝑖𝑖𝑖,𝑖𝑖−1); the average salary of each of the three full-time faculty types for which we
have data in year t (𝐹𝐹𝐹𝐹𝐹𝐹_𝑆𝑆𝐹𝐹𝑆𝑆𝑖𝑖𝑖𝑖𝑖𝑖); institutional revenue in year t (𝑅𝑅𝑅𝑅𝑅𝑅𝑖𝑖𝑖𝑖); and a vector of
institutional characteristics including, for example, enrolment (𝑋𝑋𝑖𝑖𝑖𝑖), institutional fixed effects
(𝜂𝜂𝑖𝑖), time fixed effects (𝜃𝜃𝑖𝑖), and a random error term (𝜇𝜇𝑖𝑖𝑖𝑖):
𝑃𝑃𝑃𝑃𝑖𝑖𝑖𝑖 = 𝛼𝛼0 + ∑ 𝛼𝛼1𝑖𝑖𝐹𝐹𝐹𝐹𝐹𝐹𝑖𝑖𝑖𝑖,𝑖𝑖−14𝑖𝑖=1 + ∑ 𝛼𝛼2𝑖𝑖𝐹𝐹𝐹𝐹𝐹𝐹_𝑆𝑆𝐹𝐹𝑆𝑆𝑖𝑖𝑖𝑖𝑖𝑖4
𝑖𝑖=2 + 𝛼𝛼3𝑅𝑅𝑅𝑅𝑅𝑅𝑖𝑖𝑖𝑖 + 𝑋𝑋𝑖𝑖𝑖𝑖𝛽𝛽 + 𝜂𝜂𝑖𝑖 + 𝜃𝜃𝑖𝑖 + 𝜇𝜇𝑖𝑖𝑖𝑖 (Eq. 1)
where j = 1, 2, 3, 4, representing part-time faculty, full-time lecturers/instructors, assistant
professors, and associate and full professors, respectively. The same equation can be estimated
for each of the four faculty types. Institutional fixed effects control for variables not included in
the model that are relatively fixed over time and might be expected to influence faculty
employment levels (e.g., institutional control, Carnegie classification, institutional location, etc.).
Likewise, time fixed effects control for national level variables that vary over time that might
influence an institution’s employment decisions (e.g., the supply of PhDs, unemployment rate,
etc.). Since the error terms could be autoregressive (i.e., institutions that employ a higher or
lower number of certain types of faculty in one time period are likely to employ a higher or
lower number of those types of faculty in the next period), the above model is estimated using
7 Unfortunately, although IPEDS reports data on average salary for full-time faculty by ranks, these data are not available for part-time faculty or full-time faculty by tenure status.

16
dynamic panel data modeling techniques (Arellano & Bond 1991). Statistical tests suggest that
one lag term is sufficient to account for the autoregressive nature of error terms.
Table 4 presents results from Eq. 1; values for the dependent variables are the logarithms
of the numbers of part-time faculty, full-time lecturers and instructors, assistant professors, and
associate and full professors, respectively. Because faculty employment data are only available
for odd-numbered years between 1993 and 2001, we only use data from 2001–2011 in our
empirical models. First, these models estimate how previous levels of faculty employment
affected recent levels. Not surprisingly, all four estimated coefficients on the diagonal line are
large and significant, suggesting that the number of faculty in each category in a given year
significantly predicts the number of faculty in the same category in the next year.
Based on data from a cross-sectional sample of four-year colleges and universities, Zhang
and Liu (2010) suggested that a change in the number of faculty in a particular category is
negatively related to its adjustment costs. When adjustment costs are low (e.g., part-time faculty),
it is more difficult to predict the future employment level based on the current employment level.
However, the results in Table 4 indicate that among the four types of faculty, the largest
estimated coefficients are associated with part-time faculty, while the smallest estimated
coefficients are associated with associate and full professors. This counter-intuitive result is due
to our fixed effects models, which already account for the stable employment levels of
professorial faculty. A simple correlation of faculty employment levels across years confirms
this interpretation. The strengths of inter-temporal correlation coefficients become stronger
moving from part-time faculty to full-time lecturers/instructors to assistant professors to
associate and full professors. For example, the correlations between the (log) numbers of each
faculty type in 2001–01 and 2011–12 are 0.72, 0.80, 0.90, and 0.92 for part-time, full-time

17
lecturers/instructors, assistant professors, and associate and full professors, respectively.8 The
difference between inter-temporal correlation and fixed effects models makes perfect sense
because employment of part-time faculty and full-time lecturers is related to institutional long-
term strategies; thus, it is easier to predict the change in future years, given the change in a
specific year. Changes in professorial faculty employment, especially at the associate and full
professor levels, depend on factors such as retirement and promotion as much as new hires, and
therefore changes are less predictable over time.
[INSERT TABLE 4 ABOUT HERE]
Off-diagonal coefficients also reveal some interesting patterns. Most pronounced among
them is the result that changes in the number of part-time faculty are negatively related to
changes in the numbers of full-time lecturers/instructors and associate/full professors, which is
consistent with the notion that part-time faculty are hired to fulfill teaching needs that are unmet
by full-time faculty members. The interdependence among full-time faculty members is mostly
positive, except that the changes in the number of assistant professors are negatively related to
changes in the number of associate and full professors. This negative relationship can be
explained by the promotion of assistant professors and the employment of new assistant
professors to fill vacancies left by senior professors due to retirement or moves.
The next three variables in the table are (log) average salaries for full-time
lecturers/instructors, assistant professors, and associate and full professors. Estimated price
elasticities are largely consistent with what economic theories would predict (i.e., negative own-
price elasticity and positive cross-price elasticity). For example, the price elasticities for all three
types of full-time faculty are significant and negative, suggesting that as one type of faculty 8 As one may expect, the inter-temporal correlation coefficients decrease as the length of time increases. We use the correlations between data from 2001–02 and 2011–12 to summarize the strength of inter-temporal correlation across these four types of faculty. Complete tables of correlation coefficients are available upon request.

18
becomes more expensive over time, its employment level decreases. For full-time
lecturers/instructors, a 10% increase in salary is associated with a 1.7% decrease in employment;
for assistant professors, the employment reduction is 2.6% and for associate and full professors it
is 1.4%. The positive cross-price elasticities between assistant professors and associate/full
professors suggest that as associate/full professors become more expensive related to assistant
professors, the employment level for assistant professors rises, while that for associate and full
professors falls.
Results also suggest that wealthier institutions employ fewer part-time faculty and full-
time lecturers/instructors. On average, a 10% increase in current revenues is associated with a
2.3% (not statistically significant) reduction in the number of part-time faculty and a 3.8%
reduction in the number of full-time lecturers/instructors. Estimates also show a positive income
effect for assistant professors with marginally significant effects, and close to no effect on
associate and full professors. These results are consistent with the view that prestige-maximizing
institutions perceive a high proportion of part-time faculty and full-time teaching faculty as
undesirable.
In addition, faculty employment in all categories is positively influenced by student
enrollment. For example, a 10% increase in FTE student enrollment is associated with a 3.2%
increase in the number of part-time faculty, a 2.7% increase in the number of full-time lecturers
and instructors, a 1.7% increase in the number of assistant professors, and a 0.9% increase in the
number of associate and full professors. While these effects are all positive and significant,
institutions mainly rely on part-time faculty and full-time teaching faculty to fulfill additional
teaching needs. The mixture of enrollment also matters. When total FTE enrollment is held

19
constant, an increase in the proportion of part-time students is associated with an increase in the
number of part-time faculty.
Finally, the three union variables do not seem to affect faculty employment of different
types. In addition to the possibility that the effects of unions are unclear, as we discussed earlier
in the paper, the small number of institutions that changed their union statuses during the sample
period may also be a factor. For example, during the years included in our panel data models,
only about 2 dozen institutions had changed their statuses on at least one of the three union
variables, accounting for less than 2% of institutions included in our sample. As a result, most
estimates are not statistically significant. The only two statistically significant estimates are the
effects of part-time faculty unions on the employment levels of part-time faculty and full-time
teaching faculty. Results suggest that part-time faculty unions support the expansion of part-time
faculty, which limits the expansion of full-time teaching faculty.
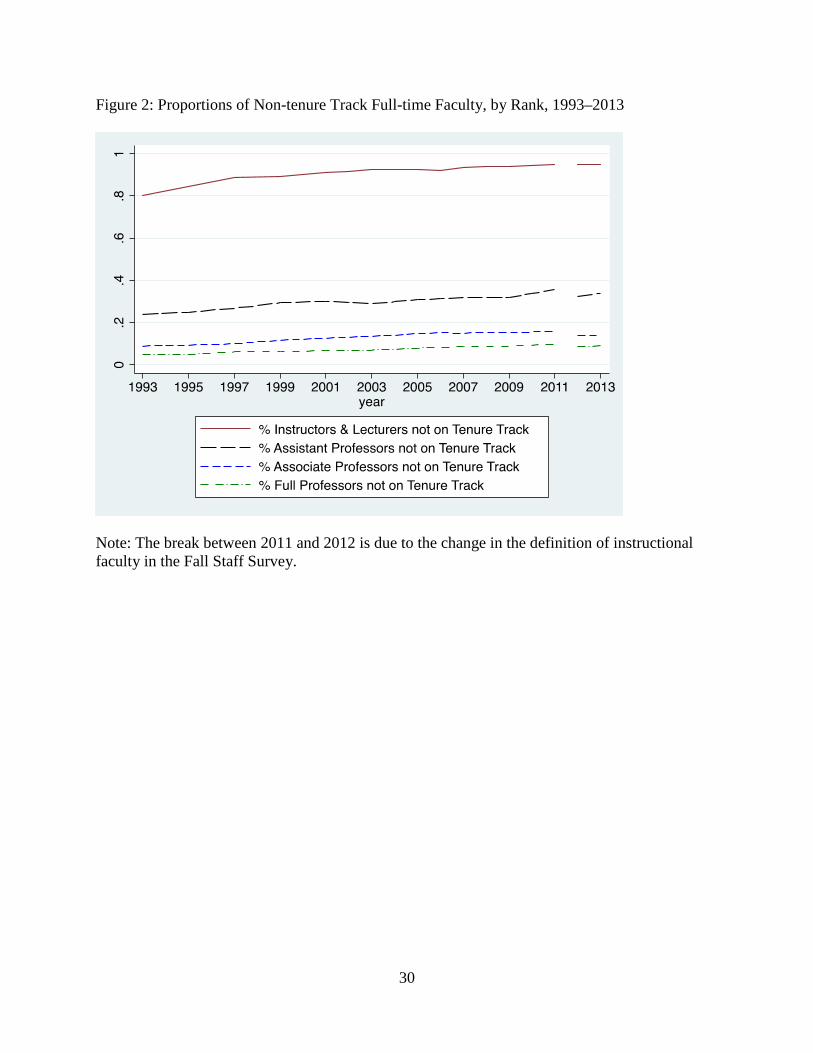
To examine whether faculty employment patterns vary across types of institutions, we
ran separate analyses for doctoral/research institutions, master’s institutions, and bachelor’s
institutions. Results are reported in Appendix Tables A–C. This set of tables reveals qualitatively
similar patterns across the three types of institutions. For example, with regard to the relationship
between the change in employment levels in a given year and the change in the next year, the
largest estimated coefficients are associated with part-time faculty across all three types of
institutions, while the lowest estimated coefficients are associated with associate and full
professors at bachelor’s and master’s institutions, and with assistant professors at
doctoral/research institutions. Own-price elasticities within each faculty type are consistently
negative across all three types of institutions, while cross-price elasticities are generally positive,
especially between assistant professors and associate/full professors.

20
Across all three types of institutions, our estimates indicate negative revenue effects for
part-time faculty and full-time lecturers/instructors and positive effects for assistant professors.
An increase in student enrollment is associated with an increase in faculty employment in all
categories overall. The largest impact, however, differs across institutions. Among
doctoral/research institutions, the numbers of full-time lecturers/instructors and assistant
professors increased the most, while among master’s and bachelor’s institutions, the numbers of
part-time faculty and full-time lecturers and instructors increased the most. The employment
level of part-time faculty is positively related to the proportion of part-time student enrollment;
however, estimates and significance levels vary across types of institutions.
In the next step of the analysis, we had hoped to use similar dynamic panel data models
to examine determinants of the increasing employment of non-tenure track full-time professorial
faculty; however, this approach was not possible because IPEDS data for one of the key elements
in Eq. 1, the average salary for each type of faculty, are not differentiated by tenure track status.
Given this major limitation, we chose to take a cross-sectional approach to examine variations in
the prevalence of non-tenure-track faculty across institutions. Although this approach does not
generate strong causal inferences like the dynamic panel data approach, it nonetheless sheds light
on the factors that may be related to the increasing usage of non-tenure track faculty. In Table 5,
we present results from our two models, with full-time lecturers/instructors included (the first
model) and excluded (the second model). These cross-sectional models include several
additional institutional characteristics that are constant over time (e.g., whether an institution has
a medical school, private vs. public, and Carnegie classification). Results presented here are
estimated using pooled data with year dummies. Year-by-year results are very similar (only with
smaller t-values) to those discussed previously in this section.

21
[INSERT TABLE 5 ABOUT HERE]
The first model includes all full-time faculty (i.e., professors and full-time lecturers and
instructors), while the second model incudes only faculty with professorial ranks. These two
models yield similar results. For example, institutional wealth is negatively related to the share of
full-time faculty who were not on tenure tracks. In other words, wealthier institutions employed a
higher proportion of tenured or tenure-track faculty. Larger institutions, as measured by FTE
student enrollment employed fewer non-tenure track faculty. This is consistent with the notion
that large institutions are better able to reassign faculty to different positions in the event of
workload changes; further, large institutions, especially doctoral/research institutions, can hire
graduate students to teach undergraduate courses, thus reducing the need for part-time faculty
and full-time non-tenure track faculty. Institutions with a large proportion of part-time students
employed more non-tenure track faculty.
In additional analyses not reported in this table, we add the share of doctoral students to
test whether institutions with more doctoral students employ fewer full-time non-tenure track
faculty. Because the vast majority of master’s and bachelor’s institutions have no doctoral
students, this additional model is estimated for research and doctoral institutions only. Results
confirm a negative association between the share of doctoral students and the share of full-time
non-tenure track faculty; however, a higher share of doctoral students does not necessarily
decrease the share of non-tenure track faculty among full-time professorial faculty. In other
words, institutions use graduate students to substitute full-time lecturers and instructors, but not
full-time faculty with professorial ranks.
Institutional characteristics are also related to the employment of full-time non-tenure
track faculty. Institutions with medical schools employed a much higher proportion of non-

22
tenure track faculty than institutions without medical schools. Medical schools have a tradition of
hiring clinical and research faculty whose contracts are tied to the durations of external grants.
Private institutions employed more non-tenure track faculty than their public counterparts,
indicating that private institutions may have more flexibility in faculty employment, and thus be
more likely to pursue cost savings and economic efficiency. The share of non-tenure track full-
time faculty was higher at doctoral/research institutions than at master’s and bachelor’s
institutions. This is probably due to the emphasis on research for tenure-track faculty at
doctoral/research institutions. In addition, because of their higher compensation levels, academic
appointments at doctoral/research institutions (even non-tenure track appointments) are more
attractive than similar appointments at master’s and bachelor’s institutions.
Finally, there are significant variations across institutions in the share of full-time non-
tenure track faculty by union status. As expected, at institutions with full-time tenure track
faculty unions, full-time non-tenure track employees comprised a lower share of the overall
faculty, because the goal of a full-time tenure track faculty union is to increase salaries and
protect the job security of these faculty members. The positive association between the presence
of a full-time non-tenure track union and the proportion of faculty comprised of full-time non-
tenure track employees is a bit surprising, because the presence of these unions may discourage
institutions from hiring more full-time non-tenure track faculty. However, the presence of these
unions may improve working conditions (e.g., salaries and benefits, job security) of full-time
non-tenure track faculty, thus making the institutions more attractive. This positive association
could also be due to reverse causation (i.e., that when a large share of faculty are full-time non-
tenure track employees, non-tenure track faculty unions are more likely to be created). Similarly,
the negative association between the presence of part-time faculty unions and the share of full-

23
time non-tenure track faculty could also be due to reverse causation (i.e., when there are many
part-time and few full-time non-tenure track faculty, part-time faculty unions are more likely to
be created). Again, these observations are based on cross-institutional variations. When we used
dynamic panel data models without controlling for salaries, all union variables became
statistically insignificant.
6. Concluding Remarks
In this paper, we used panel data models to examine variations and changes in faculty
employment at four-year colleges and universities in the United States in recent decades. Our
study produced several findings. First, the share of total faculty comprised of part-time
employees has continued to grow during the last two decades or so, from about 30% in 1993 to
about 38% of total faculty in recent years. The proportion of full-time lecturers and instructors,
however, has been relatively stable, hovering around 11% of the total faculty during the study
period. One significant change is the growing share of non-tenure track faculty among full-time
faculty, especially among the professorial ranks. Roughly 1 out of every 5 professors is not
eligible for tenure; for assistant professors, that ratio grows to 1 out of every 3. The significant
increase in the proportion of non-tenure track professorial faculty is the most recent trend
signaling the slow, continuing erosion of the tenure system in U.S. higher education since the
1970s.
Second, our dynamic panel data models indicate that employment levels of different
faculty types respond to a variety of economic and institutional factors. Negative own-price
elasticities within faculty types and positive cross-price elasticities suggest that everything else
being equal, higher education institutions employ faculty whose salaries and benefits are

24
relatively less expensive. The large gap in compensation between part-time faculty and full-time
faculty has certainly contributed to the increasing use of part-time faculty over time. In addition,
although prestige-maximizing institutions hire more professorial faculty than part-time faculty
and full-time teaching faculty, the slowly deteriorating financial situations at most colleges and
universities have led to an over-reliance on contingent academic workers. The growing
unionization of these contingent faculty members will probably slow down the process a bit;
however, our empirical models were not able to detect these effects because very few transitions
in union status occurred during the study period.
Third, a cross-sectional comparison of the share of full-time non-tenure track faculty
reveals significant variations across institutions. Full-time non-tenure track faculty are more
prevalent at private institutions, institutions with medical schools, and doctoral/research
institutions. In addition, large and wealthy institutions hire fewer full-time non-tenure track
faculty members, as do institutions with fewer part-time students. Again, the effect of union
status is not clear and may suffer from reverse causation in cross-sectional models.
Given the precarious fiscal environment encountered by many colleges and universities
and the current over-supply of doctoral degree holders in many academic fields, it is almost
certain that the use of contingent faculty—part-time faculty, full-time lecturers and instructors,
and non-tenure track professors—will continue to grow. The question is whether we have
achieved a new equilibrium of faculty composition (Monk, Dooris, & Erickson 2009) or are on a
slippery slope that will eventually lead to the dissolution of tenure as we know it. Faculty
unionization is an important factor to consider when contemplating this question. On one hand,
the unionization of contingent faculty could reduce incentives for institutions to hire more such
employees. At the University of Cincinnati, for example, full-time non-tenure track faculty

25
members enjoy the same benefits as tenure-track faculty members, including sabbaticals, health
and life insurance, and retirement benefits. On the other hand, (the possibility of) unionization of
full-time tenure track faculty could support the preservation of tenure. The recent union case at
Pacific Lutheran University challenges the assumption that upheld the Yeshiva decision: full-
time tenure-track faculty members at private institutions are automatically managerial employees.
This could motivate private institutions to reevaluate their vulnerability to union organizing
among tenure-track faculty and renegotiate the relationship between administration and faculty.
Among all these trends, perhaps the most relevant question related to contingent faculty
employment is its impact on institutional performance, including, for example, student learning
and research activities. The jury is still out on the impact of contingent faculty on student
learning and college outcomes. While some studies have shown a negative impact of contingent
faculty on student learning and graduation (Ehrenberg & Zhang 2005; Umbach 2007), others
have shown a positive impact of adjunct faculty on follow-on course interest and performance
(Bettinger & Long 2010; Figlio, Schapiro, & Soter 2013). Carrell and West (2010) suggested
that while adjunct faculty may promote students’ interest in a subject through higher grades, they
perform significantly worse in subsequent courses in the subject. Without substantial evidence
on the adverse effect of this growing practice of contingent employment, the trend is likely to
continue.

26
References:
Anderson, E. L. (2002). The new professoriate: Characteristics, contributions and compensation.
Washington DC: American Council on Education.
Arellano, M., and Bond, S. (1991). Some tests of specification for panel data: Monte Carlo
evidence and an application to employment equations. Review of Economic Studies,
58(2), 277-297.
Bettinger, E. P., and Long, B. T. (2010). Does cheaper mean better? The impact of using adjunct
instructors on student outcomes. The Review of Economics and Statistics, 92(3), 598-613.
Carnegie Foundation for the Advancement of Teaching (2011). The Carnegie classification of
institutions of higher education, 2010 edition. Menlo Park, CA: Author.
Carrell, S. E., and West, J. E. (2010). Does professor quality matter? Evidence from random
assignment of students to professors. Journal of Political Economy, 118(3), 409-432.
Cheslock, J. J., and Callie, T. M. (2015). Changing salary structure and faculty composition
within business schools: Differences across sectors and state funding levels. Economics
of Education Review, 49, 42-54.
Conley, V. M., and Leslie, D. W. (2002). Part-time instructional faculty and staff: Who they are,
what they do, and what they think. Washington, DC: U.S. Department of Education.
Ehrenberg, R. G., and Zhang, L. (2005). Do tenured and tenure-track faculty matter? Journal of
Human Resources, 40(3), 647-659.
Figlio, D. N., Schapiro, M. O., and Soter, K. B. (2013). Are tenure track professors better
teachers? (No. W19406). Cambridge, MA: National Bureau of Economic Research.
Gappa, J. M., and Leslie, D. (1993). The invisible faculty: Improving the status of part-timers in
higher education. San Francisco: Jossey-Bass.

27
Hedrick, D. W., Henson, S. E., Krieg, J. M., and Wassell, C. S. (2011). Is there really a faculty
union salary premium? Industrial & Labor Relations Review, 64(3), 558-575.
Johnson, W. R., and Turner, S. (2009). Faculty without students: Resource allocation in higher
education. The Journal of Economic Perspectives, 32(2), 169-189.
Kezar, A., and Sam, C. (2010). Special issue: Understanding the new majority of non-tenure-
track faculty in higher education—Demographics, experiences, and plans of
action. ASHE Higher Education Report, 36(4), 1-133.
Liu, X., and Zhang, L. (2013). Flexibility at the core: What determines employment of part-time
faculty in academia. Industrial Relations, 68(2), 312-339.
Liu, X., and Zhang, L. (2015). Examining the relationship among part-time work arrangement,
job satisfaction, and work effort: A study of U.S. college faculty. Advances in Industrial
and Labor Relations, 21, 87-117.
Maynard, D. C., and Joseph, T. A. (2008). Are all part-time faculty underemployed? The
influence of faculty status preference on satisfaction and commitment. Higher
Education, 55(2), 139-154.
Monk, D. H., Dooris, M. J., and Erickson, R. A. (2009). In search of a new equilibrium:
Economic aspects of higher education's changing faculty composition. Education
Finance and Policy, 4(3), 300-318.
Monks, J. (2009). Who are the part-time faculty? Academe, 95(4), 33-37.
Rhoades, G. (1998). Managed professionals: Unionized faculty and restructuring academic
labor. Albany, NY: SUNY Press.
Roemer, R. E., and Schnitz, J. E. (1982). Academic employment as day labor: The dual labor
market in higher education. The Journal of Higher Education, 53(5), 514-531.
28
Rosenblum, G., and Rosenblum, B. R. (1990). Segmented labor markets in institutions of higher
learning. Sociology of Education, 63(3), 151-164.
Umbach, P. D. (2007). How effective are they? Exploring the impact of contingent faculty on
undergraduate education. The Review of Higher Education, 30(2), 91-123.
Zhang, L., and Liu, X. (2010). Faculty employment at 4-year colleges and universities.
Economics of Education Review, 29(4), 543-552.
Zhang, L., and Ehrenberg, R. G. (2010). Faculty employment and R&D expenditures at research
universities. Economics of Education Review, 29(3), 329-337.

29
Figure 1: Proportions of Part-time Faculty, Full-time Instructors and Lecturers, and Full-time Professorial Faculty, 1993–2013
Note: The break between 2011 and 2012 is due to the change in the definition of instructional faculty in the Fall Staff Survey.
30
Figure 2: Proportions of Non-tenure Track Full-time Faculty, by Rank, 1993–2013
Note: The break between 2011 and 2012 is due to the change in the definition of instructional faculty in the Fall Staff Survey.

31
Table 1: Variables and Data Sources Variable IPEDS Surveys Number of part-time faculty Fall Staff Number of full-time lecturers and Instructors Fall Staff Number of professorial faculty Fall Staff Number of assistant professors Fall Staff Number of associate and full professors Fall Staff Average salary of professorial faculty Faculty Salary Average salary of assistant professors Faculty Salary Average salary of associate and full professors Faculty Salary Average salary of full-time teaching faculty Faculty Salary Institutional revenues Finance FTE enrollment Enrollment Proportion of part-time students Enrollment Private institutions Institutional Characteristics Carnegie classification Institutional Characteristics Medical school Institutional Characteristics Full-time tenure-track union NCSCBHEP Full-time non-tenure track union NCSCBHEP Part-time non-tenure track union NCSCBHEP
NCSCBHEP: National Center for the Study of Collective Bargaining in Higher Education and the Professions

32
Table 2: Faculty Employment at Four-Year Colleges and Universities, by Control and Institution Type, 1993–2011 1993 2011
Public institutions No. of
Institutions Part-time faculty
Full-time lecturers
Full-time professors
Part-time faculty
Full-time lecturers
Full-time professors
Doctoral/research 160 19.4 (12.6) 12.9 (9.0) 67.8 (14.0) 25.8 (11.7) 14.5 (8.1) 59.7 (12.2) Master’s 242 30.4 (18.5) 7.6 (10.5) 62.0 (18.7) 42.0 (15.4) 10.5 (8.2) 47.6 (13.0) Bachelor’s 92 36.8 (19.7) 13.3 (14.1) 49.9 (22.9) 47.7 (17.8) 10.9 (9.4) 41.3 (17.7) Sub-total 494 23.5 (17.6) 11.3 (10.8) 65.2 (18.7) 32.0 (15.8) 13.0 (8.5) 54.9 (14.4) Private institutions
Doctoral/research 106 31.6 (23.1) 12.7 (14.4) 55.6 (23.7) 35.4 (20.9) 13.5 (10.7) 51.1 (17.8) Master’s 363 51.8 (22.5) 6.4 (10.8) 41.8 (22.4) 59.5 (20.2) 5.4 (8.0) 35.1 (18.7) Bachelor’s 500 33.7 (19.4) 9.3 (14.1) 57.0 (22.9) 40.3 (20.7) 8.5 (12.5) 51.2 (22.7) Sub-total 969 38.7 (21.9) 9.8 (14.4) 51.4 (24.0) 45.3 (21.8) 9.5 (10.9) 45.3 (21.6)
Total 1463 29.7 (21.5) 10.7 (13.3) 59.6 (23.1) 37.9 (20.8) 11.4 (10.4) 50.6 (19.8) Note: Doctoral/research institutions include institutions that awarded at least 20 research doctoral degrees during 2010 (excluding doctoral-level degrees that qualify recipients for entry into professional practice, such as the JD, MD, PharmD, DPT, etc.). Master’s institutions include institutions that awarded at least 50 master's degrees and fewer than 20 doctoral degrees during 2010. Bachelor’s institutions include institutions where baccalaureate degrees represent at least 10% of all undergraduate degrees and where fewer than 50 master's degrees or 20 doctoral degrees were awarded during the update year.

33
Table 3: Proportion of Non-tenure Track Full-time Faculty by Rank at Four-Year Colleges and Universities, by Control and Institution Type, 1993–2011 1993 2011 Public institutions All L/I Asst. Assoc. Full All L/I Asst. Assoc. Full Doctoral/research 23.2 89.7 23.6 7.3 3.5 35.5 97.7 39.2 16.0 8.3 Master’s 13.2 75.8 11.5 3.3 2.7 22.1 94.1 14.2 2.6 2.0 Bachelor’s 19.5 55.8 18.4 5.3 4.8 25.3 72.3 20.2 8.3 7.4 Subtotal 20.3 84.9 19.8 6.1 3.3 31.5 95.7 31.2 12.0 6.7 Private institutions
Doctoral/research 28.7 74.8 34.0 15.6 7.2 41.5 96.4 44.1 24.9 14.1 Master’s 25.3 75.9 27.7 13.1 9.7 37.0 92.6 42.7 22.1 17.1 Bachelor’s 22.3 60.8 26.0 12.5 9.5 30.8 82.8 35.9 16.8 12.4 Subtotal 26.2 72.0 30.1 14.0 8.4 37.8 93.1 41.7 22.0 14.4 Total 22.4 80.0 23.7 8.9 5.0 34.0 94.7 35.6 15.9 9.7 Note: L/I = Lecturer/Instructor; Asst. = Assistant Professor; Assoc. = Associate Professor; Full = Full Professor

34
Table 4: Dynamic Panel Estimation for Employment Levels of Faculty Types with Cross Lag Terms, 2001–2011 (N =14,218)
Part-time faculty
Full-time lecturers & instructors
Assistant professors
Associate & full
professors Log number of part-time faculty, t-1 .705*** -.0118 .0116** .00393* (49.35) (-1.18) (2.71) (1.97) Log number of full-time lecturers, t-1 -.0379*** .655*** .0315*** .0148*** (-3.44) (30.62) (6.98) (6.95) Log number of assistant professors, t-1 .0410 .144*** .565*** .0149*** (1.80) (6.65) (32.46) (3.39) Log number of associate & full professors, t-1 -.103** 0.290*** -.0886*** .224*** (-3.02) (8.78) (-6.40) (17.09) Log avg. salary of lecturers .0559 -.169*** -.00954 -.0137 (1.24) (-3.96) (-0.52) (-1.61) Log avg. salary of assistant professors -.0457 .107 -.255*** .0556** (-0.47) (1.17) (-6.53) (3.04) Log avg. salary of associate & full professors .0175 .0811 .236*** -.139*** (0.16) (0.80) (5.47) (-6.91) Log revenue -.0234 -.0378* .0131 -.00052 (-1.22) (-2.08) (1.68) (-0.14) Log number of FTE students .315*** .274*** .168*** .0891*** (6.05) (5.59) (7.98) (9.08) Proportion of part-time students .0464* -.0288 -.0133 .00297 (2.28) (-1.49) (-1.61) (0.77) Full-time tenure-track union, t-1 -.0473 -0.349 .0146 -.0197 (-0.19) (-1.47) (0.14) (-0.42) Full-time non-tenure track union, t-1 -.130 0.139 -.0184 .0112 (-0.55) (0.62) (-0.19) (0.25) Part-time non-tenure track union, t-1 .266* -.252* -.0226 -.0350 (1.98) (-2.00) (-0.42) (-1.39) Note: Year fixed effects are also included in all models; t-values in parentheses; * p < 0.05, ** p < 0.01, *** p < 0.001

35
Table 5: Cross-Sectional Model for the Share of Full-time NTT Faculty, 2001–2011 All full-time
faculty Professorial faculty only
Log revenue per FTE student -.0721*** -.0691*** (-15.10) (-13.66) Log number of FTE students -.0156* -.0427*** (-2.40) (-6.11) Proportion of part-time students .0337*** .0326*** (14.79) (13.29) Has medical school .172*** .221*** (16.54) (20.40) Private institutions .102*** .165*** (16.40) (25.15) Research/doctoral institutions .0303** .0678*** (3.12) (6.53) Master’s institutions -.00183 .0130 (-0.30) (1.96) Full-time tenure-track union -.0436*** -.0270* (-4.18) (-2.48) Full-time non-tenure track union .0607*** .0507*** (4.75) (3.80) Part-time non-tenure track union -.0609*** -.0274* (-4.92) (-2.12) N 16972 16508 Note: Year fixed effects are also included in all models; t-values in parentheses; * p < 0.05, ** p < 0.01, *** p < 0.001
36
Appendix Table A: Dynamic Panel Estimation for Employment Levels of Different Types of Faculty at Research and Doctoral Institutions, 2001–2011 (N = 2,716)
Part-time faculty
Full-time lecturers & instructors
Assistant professors
Associate & full professors
Log number of part-time faculty, t-1 .737*** -.0101 .00783 .00839* (31.11) (-0.46) (1.00) (2.09) Log number of full-time lecturers, t-1 -.0473* .581*** .0264*** .0000446 (-2.21) (18.24) (3.34) (0.01) Log number of assistant professors, t-1 .398*** .0468 .119*** -.0306* (6.54) (0.79) (3.56) (-2.43) Log number of assoc. & full professors, t-1 -.639*** .127 .163*** .595*** (-5.14) (1.06) (3.95) (12.43) Log avg. salary of lecturers -.0430 -.0967 .00479 -.0132 (-0.56) (-1.31) (0.17) (-0.96) Log avg. salary of assistant professors -.938*** -.276 -.342*** .0182 (-4.62) (-1.13) (-3.75) (0.40) Log avg. salary of assoc. & full professors .266 .469 0.152 -.159** (1.02) (1.52) (1.33) (-2.86) Log revenue -.0227 -.0250 .0117 -.000105 (-0.51) (-0.59) (0.74) (-0.01) Log number of FTE students -.0266 .294* .314*** .0768** (-0.19) (2.21) (6.51) (3.05) Proportion of part-time students .120 -.0526 -.0670** .0248 (1.66) (-0.76) (-2.59) (1.87) Full-time tenure-track union, t-1 -.0377 -.235 .0351 -.0329 (-0.15) (-0.94) (0.37) (-0.70) Full-time non-tenure track union, t-1 -.0425 .140 -.114 -.0113 (-0.16) (0.57) (-1.21) (-0.24) Part-time non-tenure track union, t-1 .308* -.00960 -.0641 -.0173 (2.15) (-0.07) (-1.24) (-0.68) Note: Year fixed effects are also included in all models; t-values in parentheses; * p < 0.05, ** p < 0.01, *** p < 0.001

37
Appendix Table B: Dynamic Panel Estimation for Employment Levels of Different Types of Faculty at Master’s Institutions, 2001–2011 (N = 6,108)
Part-time faculty
Full-time lecturers
& instructors
Assistant professors
Associate & full
professors Log number of part-time faculty, t-1 .701*** .0104 .00261 .00680* (38.38) (0.73) (0.50) (2.52) Log number of full-time lecturers, t-1 -.0611** .680*** .0391*** .0162*** (-3.18) (21.83) (6.36) (5.08) Log number of assistant professors, t-1 .0133 .134*** .584*** .0116 (0.33) (4.02) (32.13) (1.84) Log number of assoc. & full professors, t-1 -.105 .304*** -.0950*** .287*** (-1.87) (6.30) (-5.48) (22.87) Log avg. salary of lecturers .0149 -.161* -.0644* .0289* (0.19) (-2.37) (-2.55) (2.22) Log avg. salary of assistant professors -.0204 .242 -.231*** -.0187 (-0.12) (1.62) (-4.18) (-0.65) Log avg. salary of assoc. & full professors -.133 .135 .561*** -.149*** (-0.63) (0.76) (8.51) (-4.34) Log revenue -.0789 -.122* .0140 .0212* (-1.32) (-2.42) (0.75) (2.18) Log number of FTE students .505*** .136 .129*** .0219 (5.46) (1.74) (4.46) (1.45) Proportion of part-time students .0629 .0495 -.0188 .0129 (1.43) (1.33) (-1.35) (1.81) Full-time tenure-track union, t-1 -.120 -.862* .0360 .0539 (-0.25) (-2.09) (0.23) (0.67) Full-time non-tenure track union, t-1 -.359 .691 -.0791 -.0333 (-0.83) (1.92) (-0.58) (-0.47) Part-time non-tenure track union, t-1 .336 -.742*** .0510 .00377 (1.26) (-3.37) (0.60) (0.09) Note: Year fixed effects are also included in all models; t-values in parentheses; * p < 0.05, ** p < 0.01, *** p < 0.001

38
Appendix Table C: Dynamic Panel Estimation for Employment Levels of Different Types of Faculty at Bachelor’s Institutions, 2001–2011
Part-time faculty
Full-time lecturers & instructors
Assistant professors
Associate & full professors
Log number of part-time faculty, t-1 .715*** -.0316 .0183* -.00226 (32.36) (-1.79) (2.30) (-0.57) Log number of full-time lecturers, t-1 -.0223 0.647*** .0266*** .0208*** (-1.39) (22.22) (3.41) (5.32) Log number of assistant professors, t-1 -.000875 0.153*** .458*** .00665 (-0.03) (4.57) (18.51) (0.91) Log number of assoc. & full professors, t-1 -.0920* 0.282*** -.0467* .267*** (-2.01) (5.63) (-2.19) (12.98) Log avg. salary of lecturers .155* -0.249*** -.00421 -.0435** (2.18) (-3.30) (-0.12) (-2.59) Log avg. salary of assistant professors .171 0.154 -.228*** .109*** (1.34) (1.14) (-3.75) (3.60) Log avg. salary of assoc. & full professors -.133 0.0421 .133* -.141*** (-1.01) (0.30) (2.11) (-4.51) Log revenue -.0169 -0.0305 .0113 -.00596 (-0.76) (-1.29) (1.07) (-1.14) Log number of FTE students .153* 0.365*** .192*** .139*** (2.19) (4.94) (5.73) (8.48) Proportion of part-time students .0385 -0.0554* -.00712 .0000159 (1.64) (-2.21) (-0.63) (0.00) Full-time tenure-track union, t-1 -.0555 -1.613** -.00358 .0410 (-0.11) (-3.02) (-0.01) (0.33) Full-time non-tenure track union, t-1 . . . . . . . . Part-time non-tenure track union, t-1 -.0463 -0.0704 .00652 .0208 (-0.09) (-0.13) (0.03) (0.17) N 5392 5394 5394 5394 Note: Year fixed effects are also included in all models; no bachelor’s institution changed their full-time non-tenure track union status during the study period; t-values in parentheses; * p < 0.05, ** p < 0.01, *** p < 0.001