CHEP OPERATIONS REVIEW - brambles.com€¦ · Siebel •Used globally by ... Supply chain...
47
CHEP OPERATIONS REVIEW ORLANDO, FLORIDA 26 OCTOBER 2007
Transcript of CHEP OPERATIONS REVIEW - brambles.com€¦ · Siebel •Used globally by ... Supply chain...
CHEP
OPERATIONS REVIEW
ORLANDO, FLORIDA
26 OCTOBER 2007
INFORMATION SYSTEMS
AT CHEP
DONNA SLYSTER SVP, IS and CIO
3
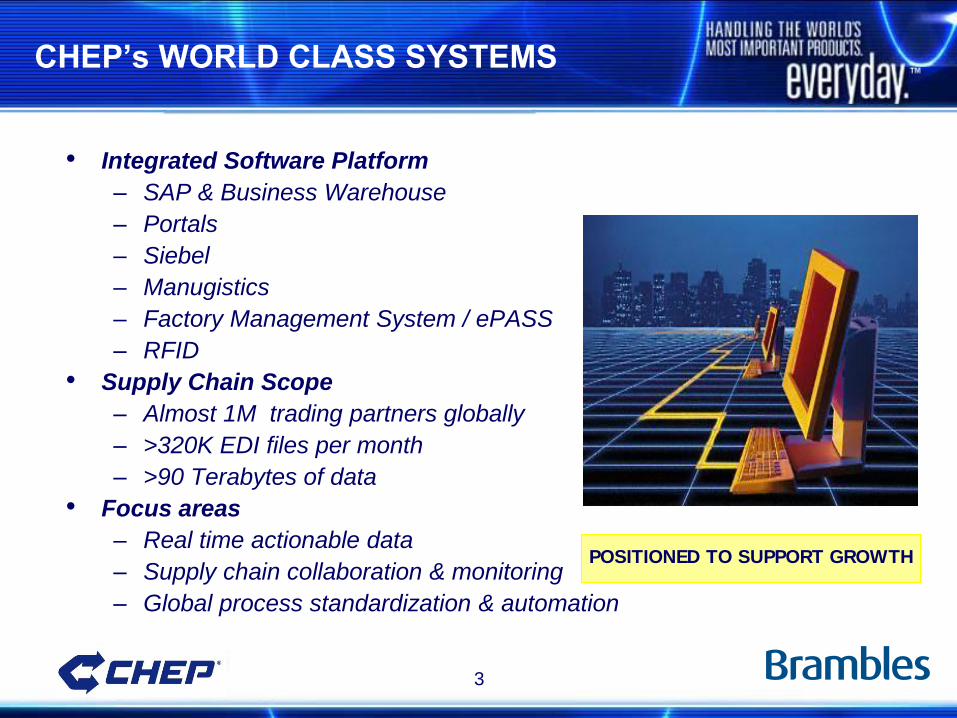
CHEP’s WORLD CLASS SYSTEMS
• Integrated Software Platform
– SAP & Business Warehouse
– Portals
– Siebel
– Manugistics
– Factory Management System / ePASS
– RFID
• Supply Chain Scope
– Almost 1M trading partners globally
– >320K EDI files per month
– >90 Terabytes of data
• Focus areas
– Real time actionable data
– Supply chain collaboration & monitoring
– Global process standardization & automation
POSITIONED TO SUPPORT GROWTH
4
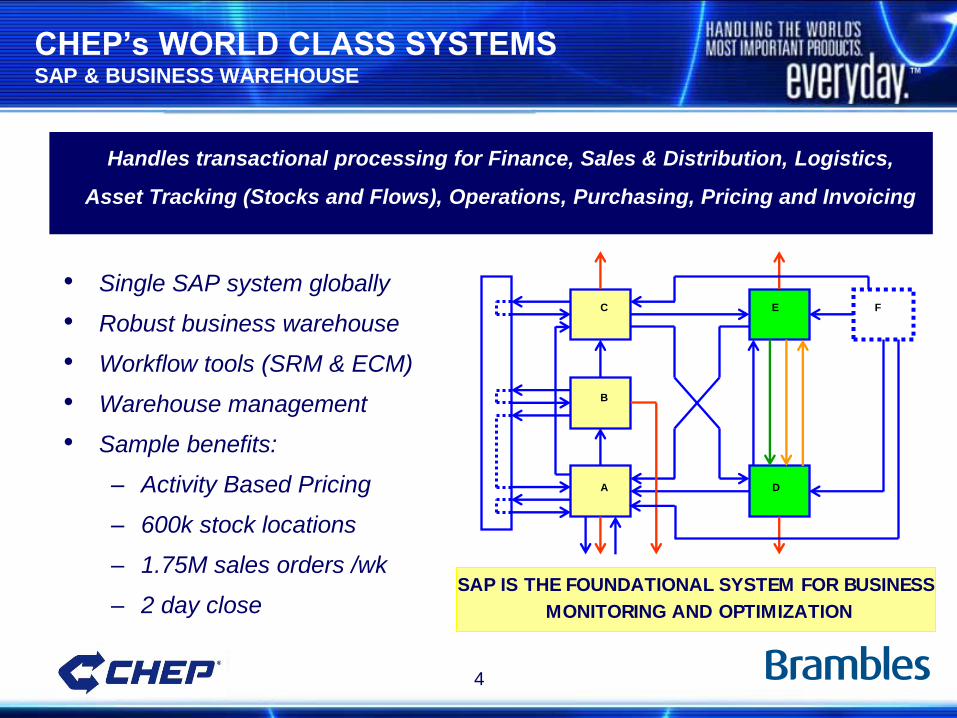
CHEP’s WORLD CLASS SYSTEMS SAP & BUSINESS WAREHOUSE
• Single SAP system globally
• Robust business warehouse
• Workflow tools (SRM & ECM)
• Warehouse management
• Sample benefits:
– Activity Based Pricing
– 600k stock locations
– 1.75M sales orders /wk
– 2 day close
Handles transactional processing for Finance, Sales & Distribution, Logistics,
Asset Tracking (Stocks and Flows), Operations, Purchasing, Pricing and Invoicing
F E
D
C
B
A
SAP IS THE FOUNDATIONAL SYSTEM FOR BUSINESS
MONITORING AND OPTIMIZATION
5
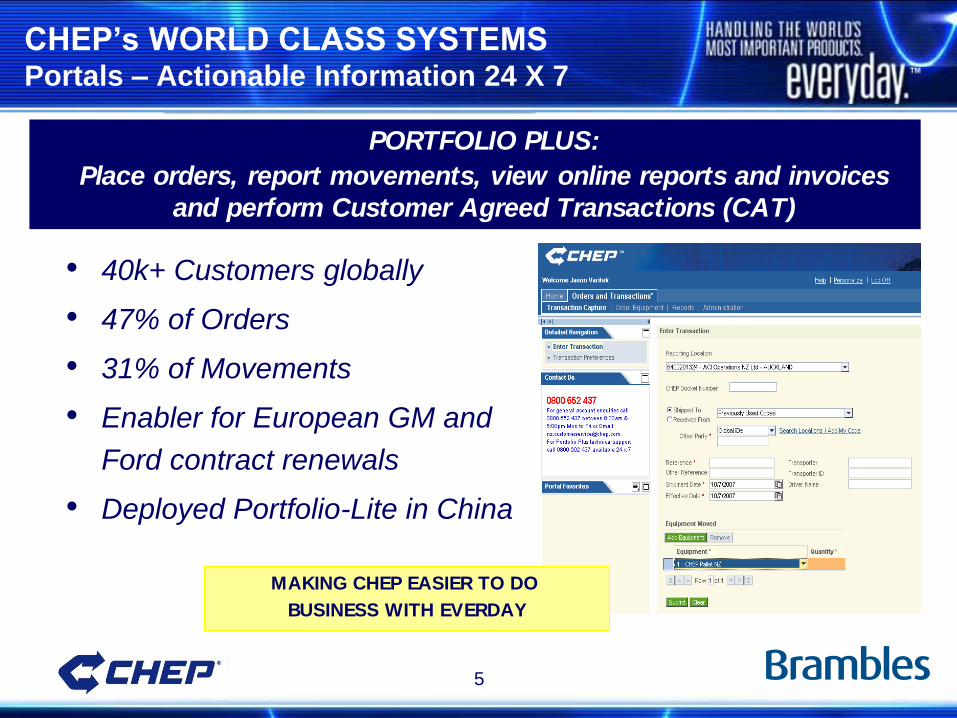
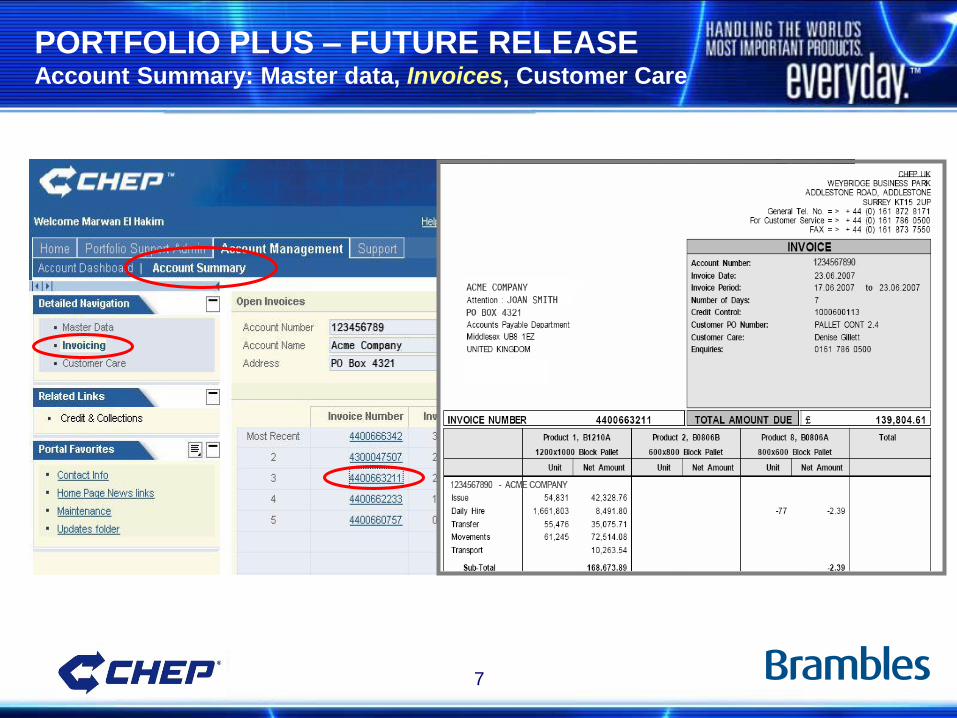
PORTFOLIO PLUS:
Place orders, report movements, view online reports and invoices
and perform Customer Agreed Transactions (CAT)
MAKING CHEP EASIER TO DO
BUSINESS WITH EVERDAY
CHEP’s WORLD CLASS SYSTEMS Portals – Actionable Information 24 X 7
• 40k+ Customers globally
• 47% of Orders
• 31% of Movements
• Enabler for European GM and
Ford contract renewals
• Deployed Portfolio-Lite in China
6
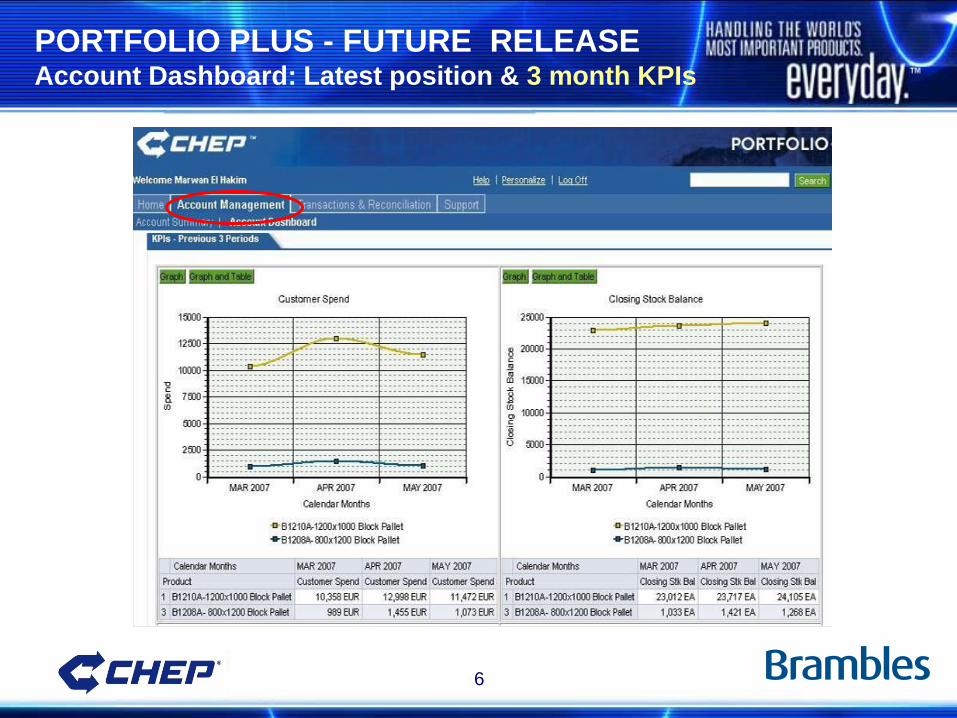
PORTFOLIO PLUS - FUTURE RELEASE Account Dashboard: Latest position & 3 month KPIs
7
PORTFOLIO PLUS – FUTURE RELEASE Account Summary: Master data, Invoices, Customer Care
8
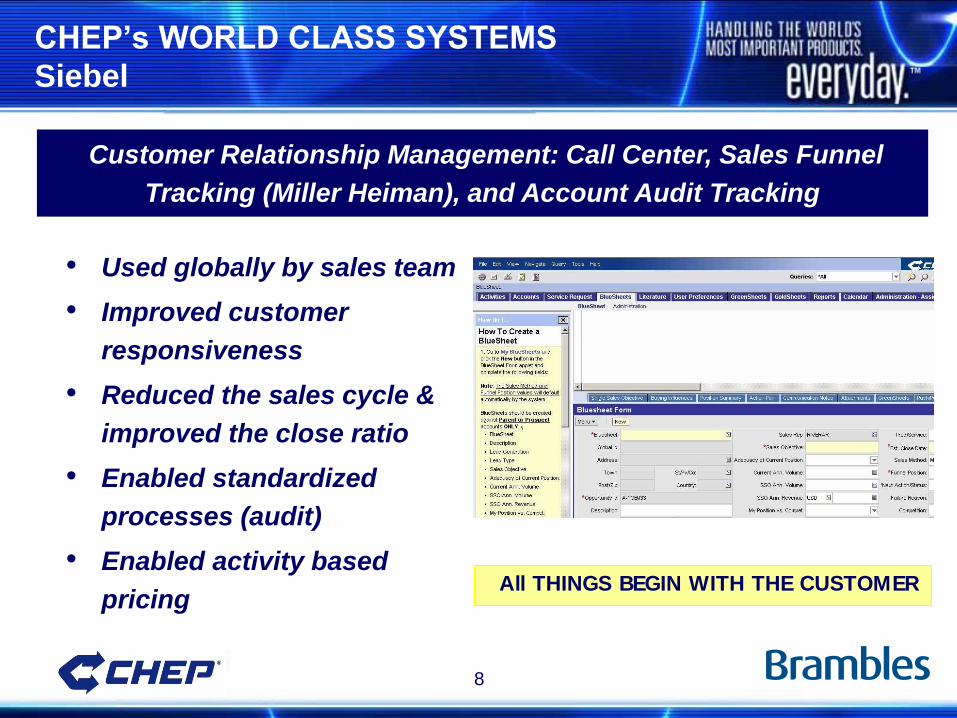
CHEP’s WORLD CLASS SYSTEMS
Siebel
• Used globally by sales team
• Improved customer
responsiveness
• Reduced the sales cycle &
improved the close ratio
• Enabled standardized
processes (audit)
• Enabled activity based
pricing All THINGS BEGIN WITH THE CUSTOMER
Customer Relationship Management: Call Center, Sales Funnel
Tracking (Miller Heiman), and Account Audit Tracking
9
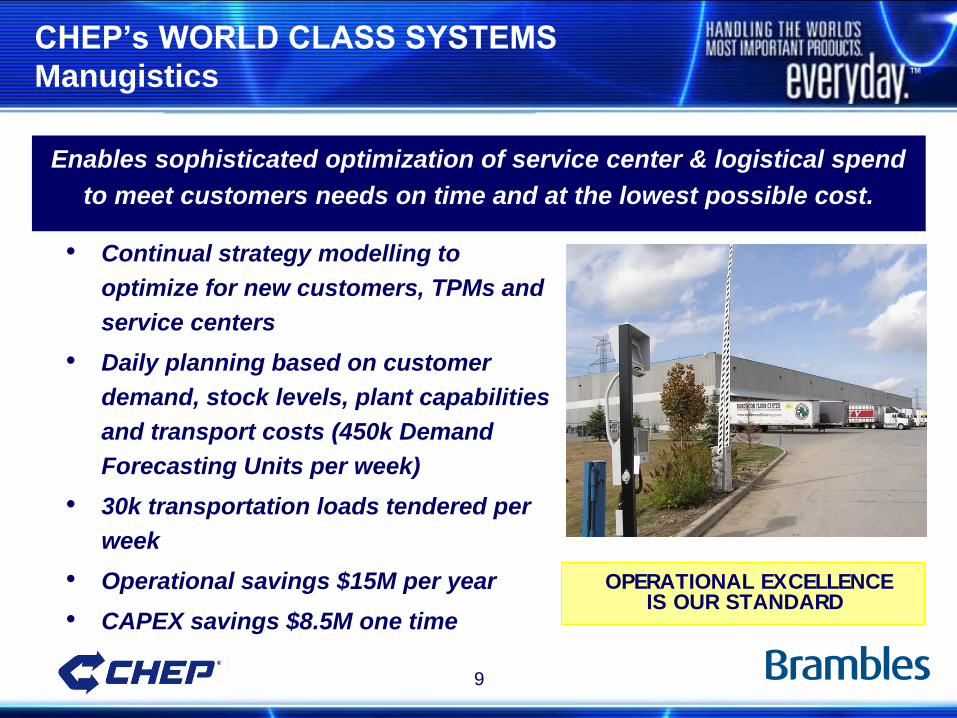
CHEP’s WORLD CLASS SYSTEMS
Manugistics
• Continual strategy modelling to
optimize for new customers, TPMs and
service centers
• Daily planning based on customer
demand, stock levels, plant capabilities
and transport costs (450k Demand
Forecasting Units per week)
• 30k transportation loads tendered per
week
• Operational savings $15M per year
• CAPEX savings $8.5M one time
Enables sophisticated optimization of service center & logistical spend
to meet customers needs on time and at the lowest possible cost.
OPERATIONAL EXCELLENCE IS OUR STANDARD
10
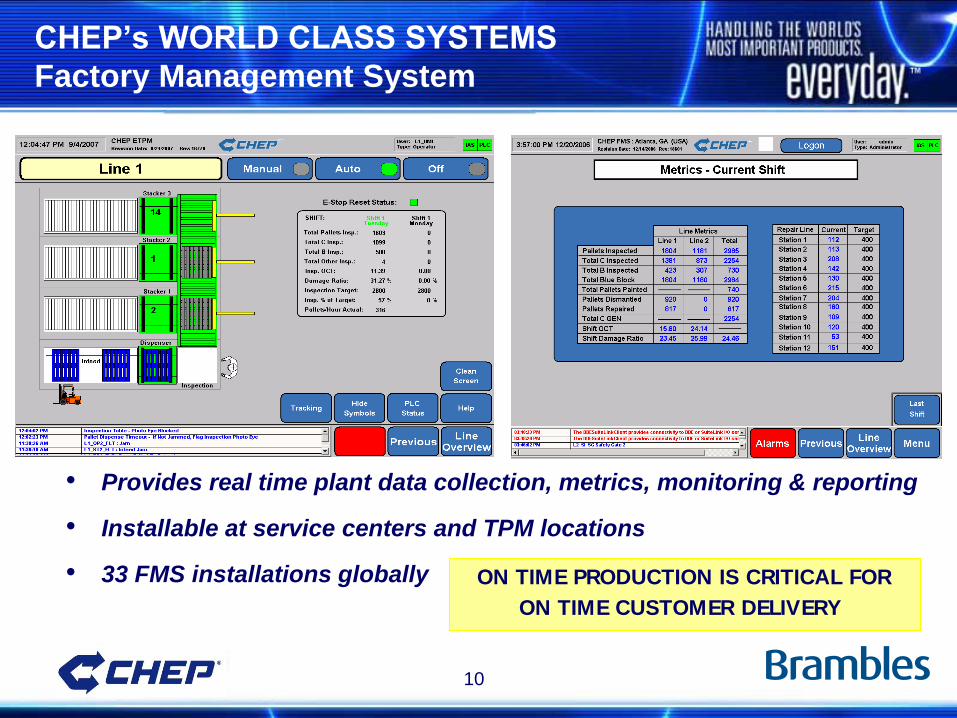
CHEP’s WORLD CLASS SYSTEMS
Factory Management System
• Provides real time plant data collection, metrics, monitoring & reporting
• Installable at service centers and TPM locations
• 33 FMS installations globally ON TIME PRODUCTION IS CRITICAL FOR
ON TIME CUSTOMER DELIVERY
11
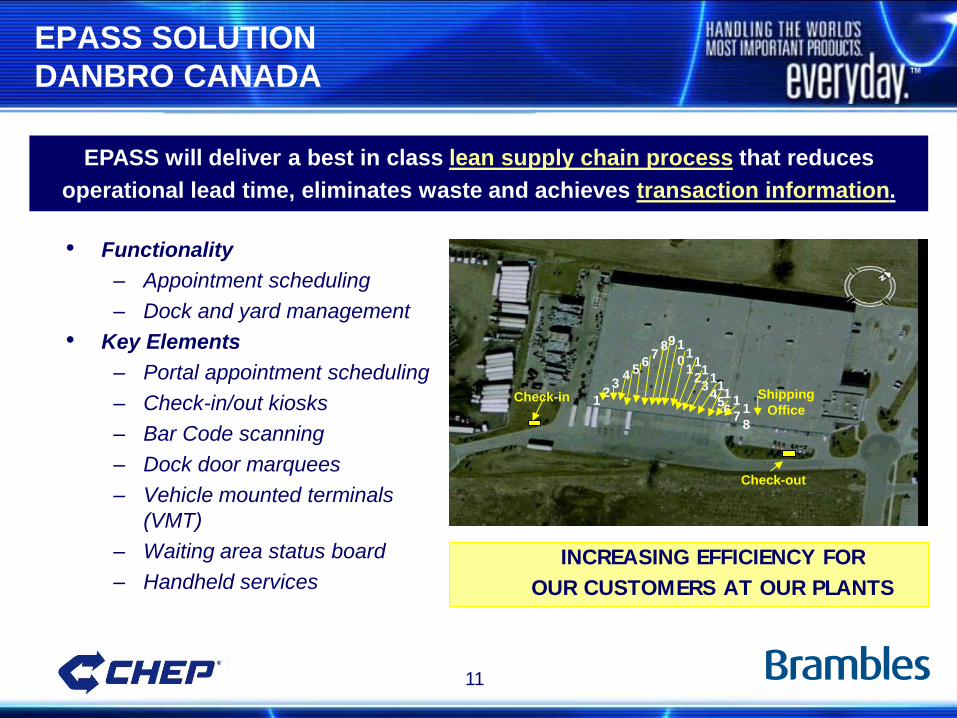
EPASS SOLUTION
DANBRO CANADA
• Functionality
– Appointment scheduling
– Dock and yard management
• Key Elements
– Portal appointment scheduling
– Check-in/out kiosks
– Bar Code scanning
– Dock door marquees
– Vehicle mounted terminals
(VMT)
– Waiting area status board
– Handheld services
Check-in
Check-out
1 2
3 4 5
6 7
1
3
9
1
2
1
1
8 1
0
1
6
1
5
1
4 1
7 1
8
Shipping
Office
EPASS will deliver a best in class lean supply chain process that reduces
operational lead time, eliminates waste and achieves transaction information.
INCREASING EFFICIENCY FOR
OUR CUSTOMERS AT OUR PLANTS
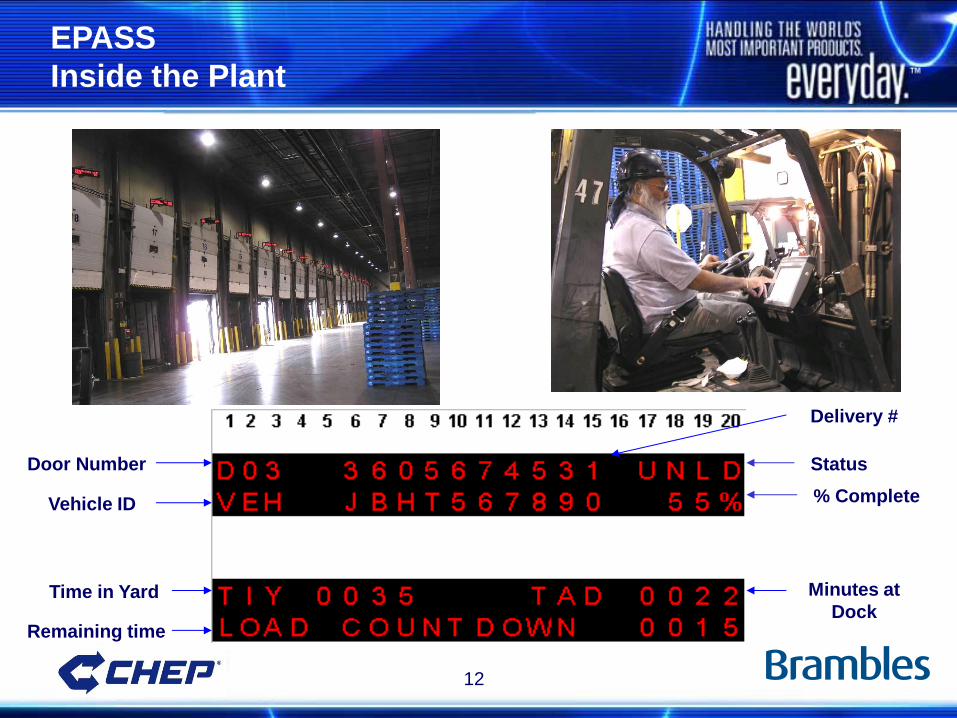
12
Door Number
Delivery #
Status
Vehicle ID % Complete
Remaining time
Time in Yard Minutes at
Dock
EPASS
Inside the Plant
13
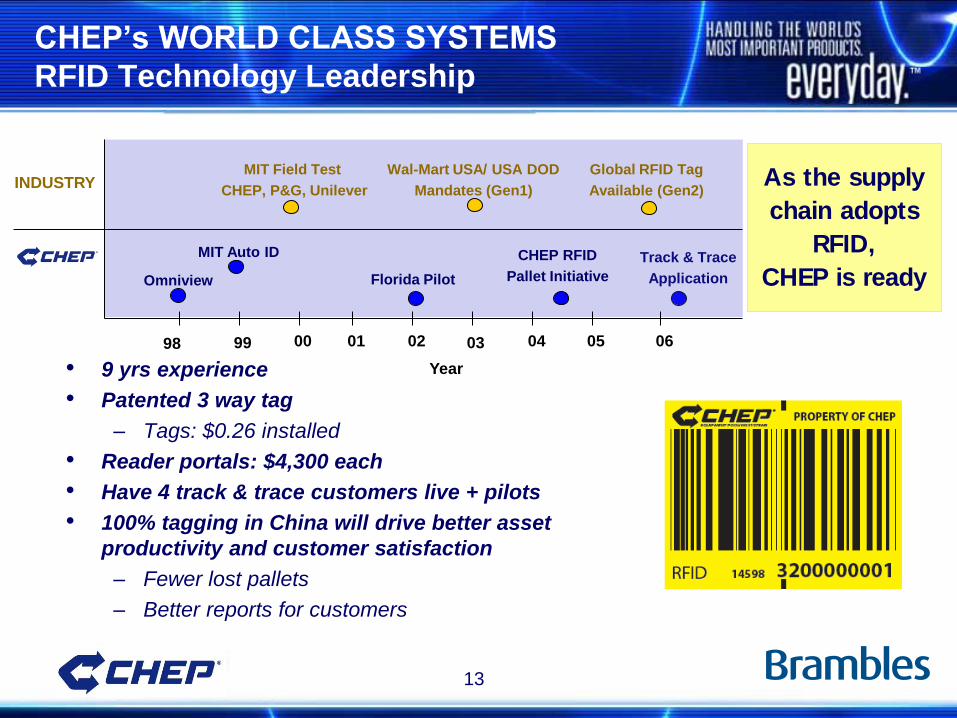
CHEP’s WORLD CLASS SYSTEMS
RFID Technology Leadership
• 9 yrs experience
• Patented 3 way tag
– Tags: $0.26 installed
• Reader portals: $4,300 each
• Have 4 track & trace customers live + pilots
• 100% tagging in China will drive better asset
productivity and customer satisfaction
– Fewer lost pallets
– Better reports for customers
Track & Trace
Application
INDUSTRY
98 99 00 02 01 03 04 05 06
MIT Field Test
CHEP, P&G, Unilever
Florida Pilot
Wal-Mart USA/ USA DOD
Mandates (Gen1)
Global RFID Tag
Available (Gen2)
CHEP RFID
Pallet Initiative
MIT Auto ID
Omniview
Year
As the supply
chain adopts
RFID,
CHEP is ready
14
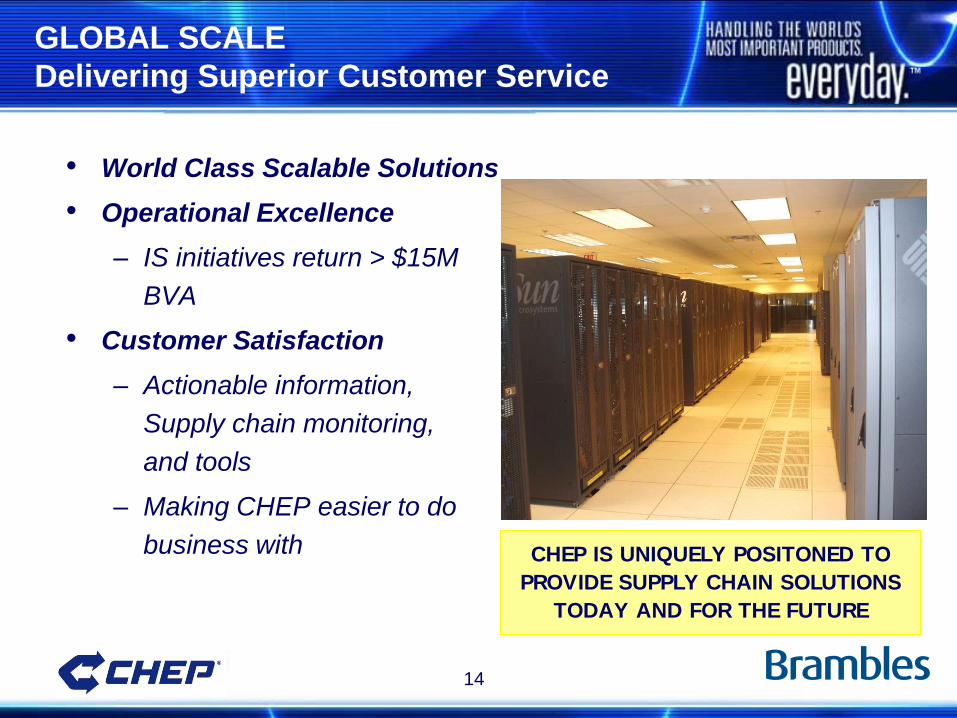
GLOBAL SCALE
Delivering Superior Customer Service
• World Class Scalable Solutions
• Operational Excellence
– IS initiatives return > $15M
BVA
• Customer Satisfaction
– Actionable information,
Supply chain monitoring,
and tools
– Making CHEP easier to do
business with CHEP IS UNIQUELY POSITONED TO
PROVIDE SUPPLY CHAIN SOLUTIONS
TODAY AND FOR THE FUTURE
15
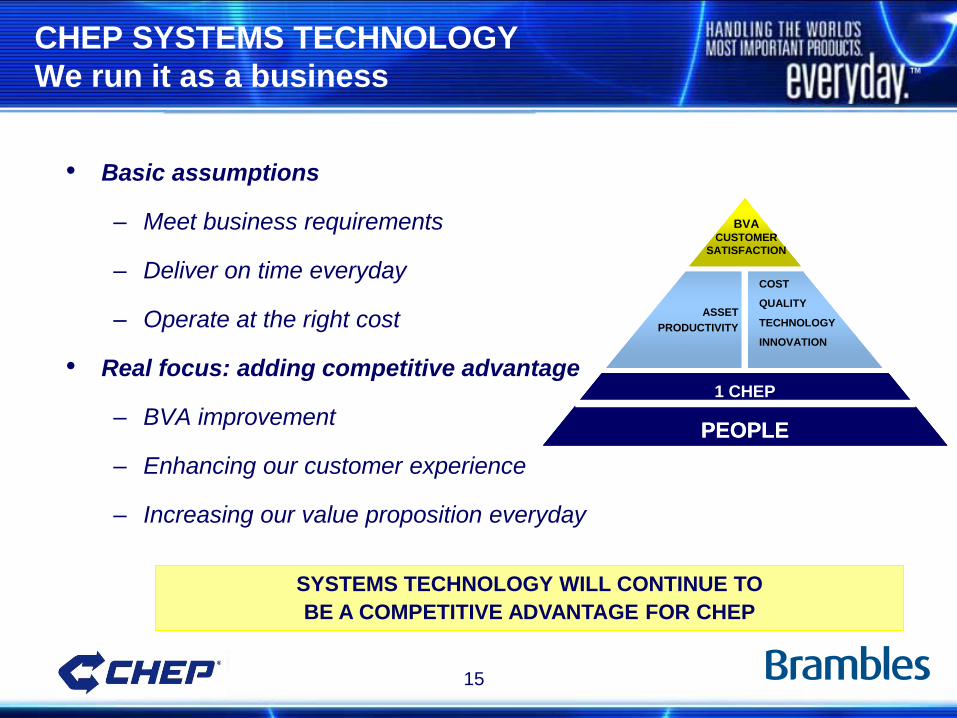
CHEP SYSTEMS TECHNOLOGY
We run it as a business
• Basic assumptions
– Meet business requirements
– Deliver on time everyday
– Operate at the right cost
• Real focus: adding competitive advantage
– BVA improvement
– Enhancing our customer experience
– Increasing our value proposition everyday
SYSTEMS TECHNOLOGY WILL CONTINUE TO
BE A COMPETITIVE ADVANTAGE FOR CHEP
BVACUSTOMER
SATISFACTION
1 CHEP
ASSET
PRODUCTIVITY
COST
QUALITY
TECHNOLOGY
INNOVATION
PEOPLE
BVACUSTOMER
SATISFACTION
1 CHEP1 CHEP
ASSET
PRODUCTIVITY
COST
QUALITY
TECHNOLOGY
INNOVATION
PEOPLEPEOPLE
CHEP USA
NETWORK OPTIMIZATION
RAMON GENEMARAS – SVP, SUPPLY CHAIN
17
OBJECTIVES
• Meet customers’ expectations
– Enable growth
– On time delivery
– Quality & cost efficiency
• Drive network flexibility and adaptability to customer
demands
– Location, scale and mix of operating facilities
• Achieve supply chain cost efficiency by optimizing:
– Transport
– Service Centers
– ETPMs/DTPMs
18
NETWORK MODELING PROCESS
• Idea generation
– Customers and suppliers
– Cross functional
• All people, all levels
• Identify variables
– Economic dynamics (Transport Cost, Fuel, Supply/Demand)
– Building lease renewals
– ETPM, DTPM opportunities
– Annual validation of Plant volumes and capacity
requirements
• Filtering
– SCO Steering Committee prioritize ideas

19
NETWORK OPTIMIZATION
Support Customer Initiatives
• Growth Plans
– New Distribution Centers & production sites
– New product lines or lane expansions
– Acquisitions and consolidations
• Supply Chain Improvement Programs
– Customers’ network optimization
– Relocation or remix of existing DCs
– Cycle and inventory reductions
– Trailer fleet reduction
– Environmental sustainability
20
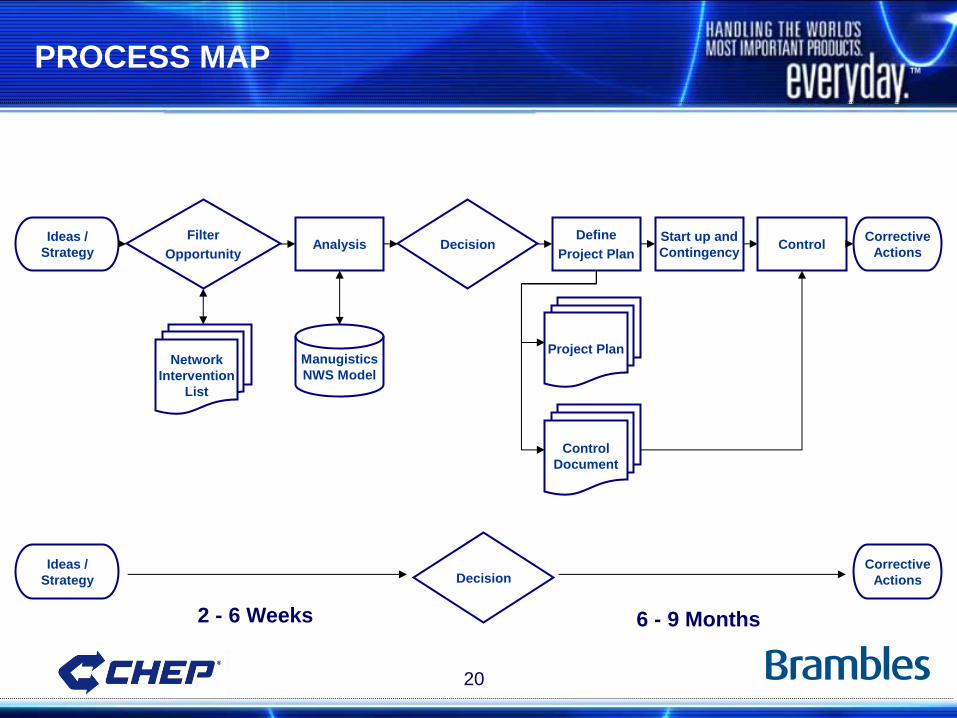
PROCESS MAP
Filter
Opportunity
Ideas /
Strategy Decision Analysis
Define
Project Plan
Manugistics
NWS Model
Start up and
Contingency Control
Corrective
Actions
Network
Intervention
List
Project Plan
Control
Document
Ideas /
Strategy
Corrective
Actions
6 - 9 Months 2 - 6 Weeks
Decision
21
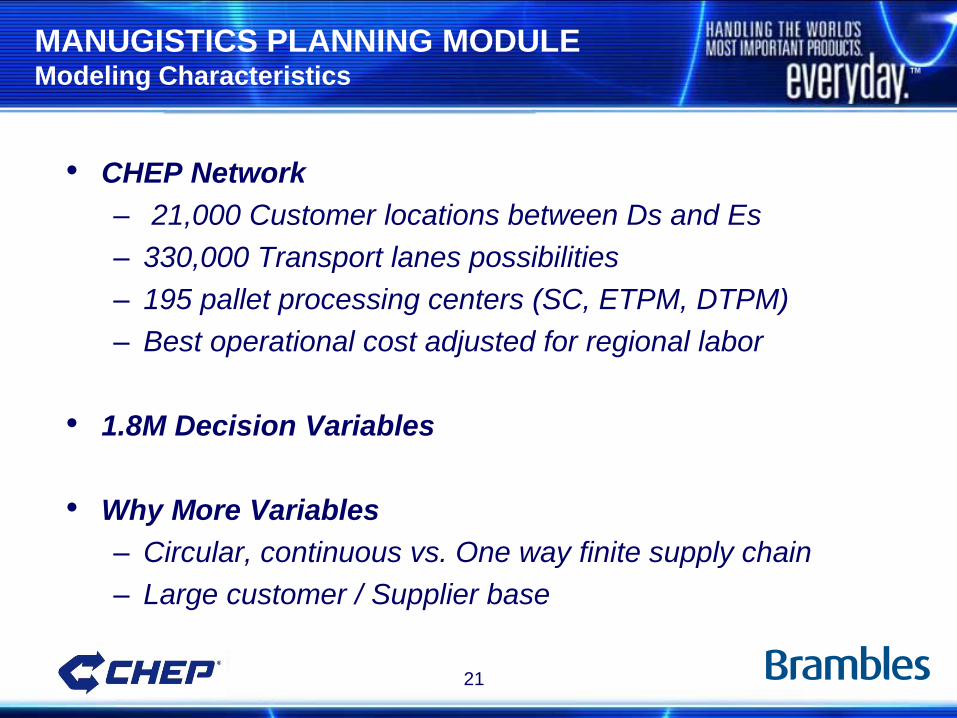
MANUGISTICS PLANNING MODULE Modeling Characteristics
• CHEP Network
– 21,000 Customer locations between Ds and Es
– 330,000 Transport lanes possibilities
– 195 pallet processing centers (SC, ETPM, DTPM)
– Best operational cost adjusted for regional labor
• 1.8M Decision Variables
• Why More Variables
– Circular, continuous vs. One way finite supply chain
– Large customer / Supplier base
22
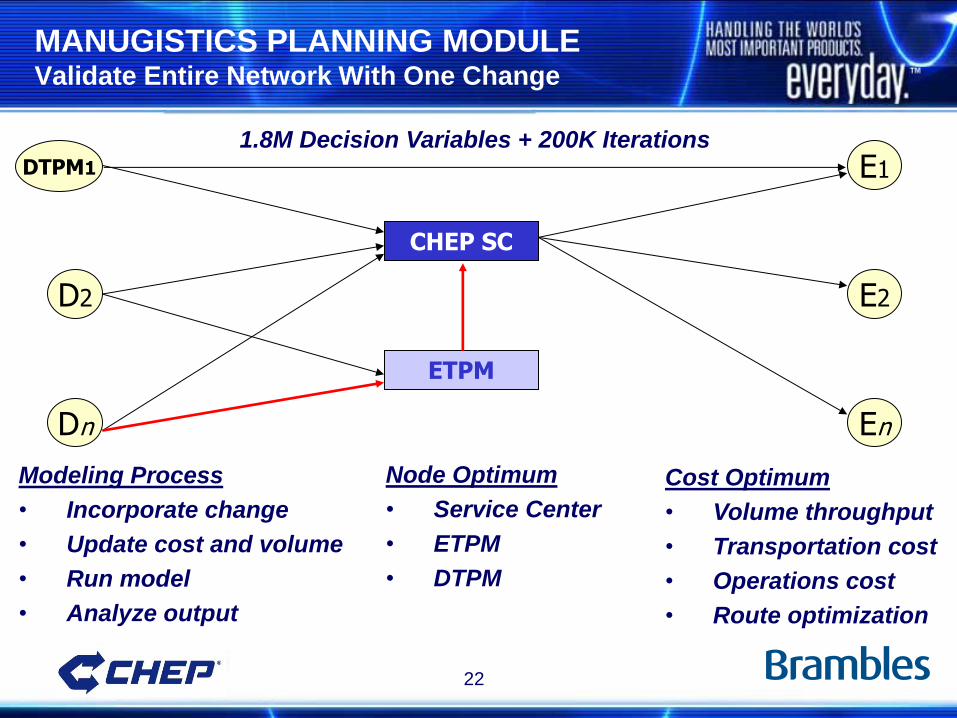
MANUGISTICS PLANNING MODULE Validate Entire Network With One Change
DTPM1
D2
Dn
CHEP SC
ETPM
E1
E2
En
1.8M Decision Variables + 200K Iterations
Node Optimum
• Service Center
• ETPM
• DTPM
Cost Optimum
• Volume throughput
• Transportation cost
• Operations cost
• Route optimization
Modeling Process
• Incorporate change
• Update cost and volume
• Run model
• Analyze output
23
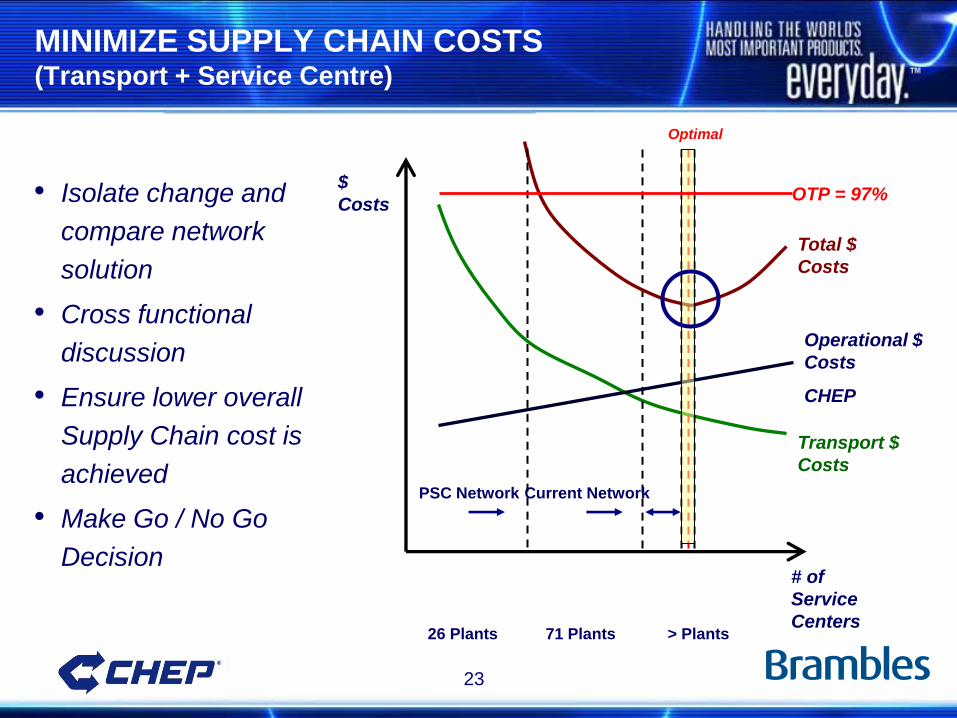
MINIMIZE SUPPLY CHAIN COSTS (Transport + Service Centre)
# of
Service
Centers
$
Costs
Total $
Costs
Transport $
Costs
Operational $
Costs
CHEP
Optimal
Current Network PSC Network
26 Plants 71 Plants > Plants
OTP = 97%
• Isolate change and
compare network
solution
• Cross functional
discussion
• Ensure lower overall
Supply Chain cost is
achieved
• Make Go / No Go
Decision
24
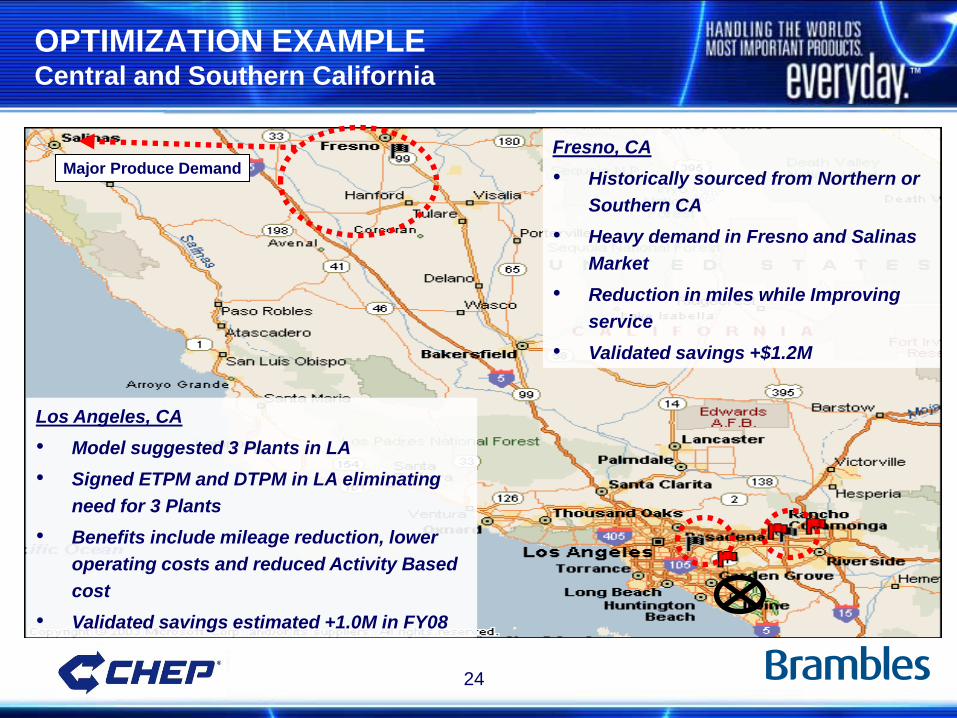
OPTIMIZATION EXAMPLE Central and Southern California
Major Produce Demand
Los Angeles, CA
• Model suggested 3 Plants in LA
• Signed ETPM and DTPM in LA eliminating
need for 3 Plants
• Benefits include mileage reduction, lower
operating costs and reduced Activity Based
cost
• Validated savings estimated +1.0M in FY08
Fresno, CA
• Historically sourced from Northern or
Southern CA
• Heavy demand in Fresno and Salinas
Market
• Reduction in miles while Improving
service
• Validated savings +$1.2M
25
IMPLEMENTATION PROCESS
• Inputs
– Cost benefits and revenue impacts
– Volumes requirement
– Growth, customer satisfaction, quality implications
• Outputs
– Annual estimated savings
– Confirmation of equipment needs and cost
– Start date, sign up with customer
– Risks and opportunities
• Steering Committee Review
– Logistics, Plant Operations, Planning, TPM group, Finance,
Supply Chain, SCO Team, Sales
– Go / No Go decision
26
IMPLEMENTATION TIMETABLE
Average of 24 weeks
• Site Sizing and Selection (~16 weeks)
– Market analysis and building lease negotiations
– Tenant Improvements, Permits, & Certificate of Occupancy
(For DTPM/ETPM locations this phase only 4 weeks)
• Select Equipment and Plant Operator (~20 weeks)
– Gain CAPEX approval, order and install equipment
– Sign Operating Agreement with 3rd Party Operator
• Site Start Up (~5 weeks)
– Plant Operator recruits staff
• Complete operator and safety training
– Execute Ramp Up plan
27
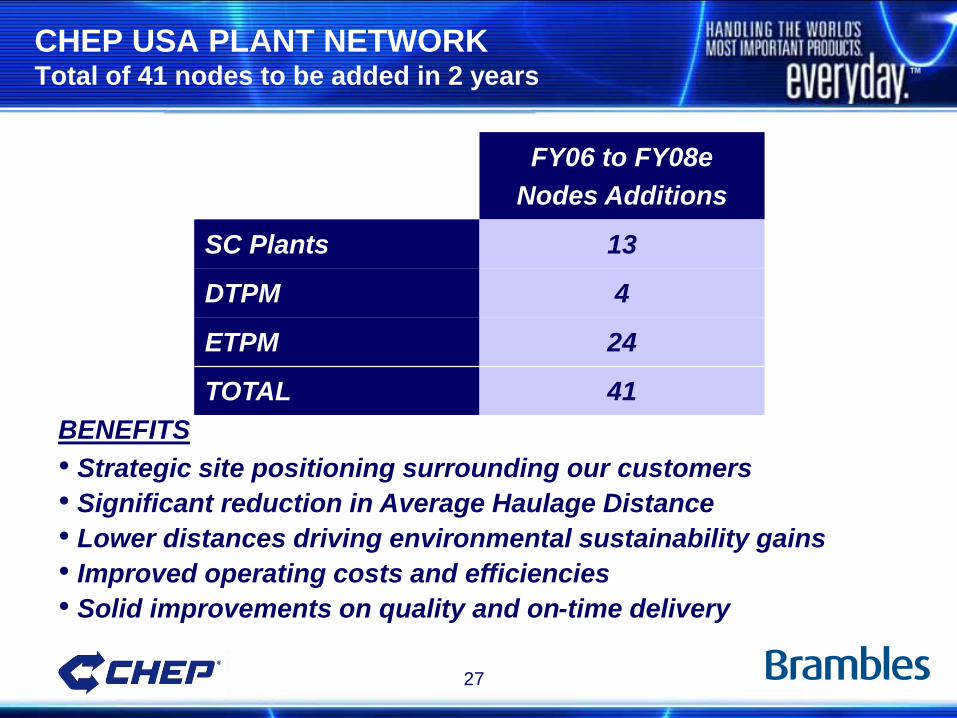
CHEP USA PLANT NETWORK Total of 41 nodes to be added in 2 years
BENEFITS
• Strategic site positioning surrounding our customers
• Significant reduction in Average Haulage Distance
• Lower distances driving environmental sustainability gains
• Improved operating costs and efficiencies
• Solid improvements on quality and on-time delivery
FY06 to FY08e
Nodes Additions
SC Plants 13
DTPM 4
ETPM 24
TOTAL 41
28
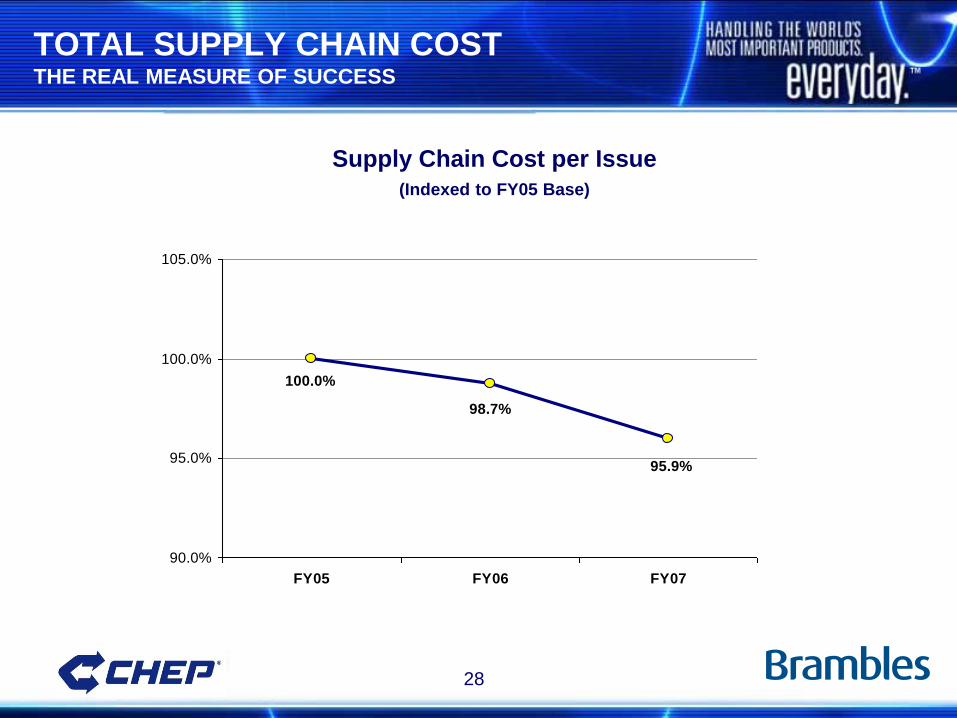
TOTAL SUPPLY CHAIN COST THE REAL MEASURE OF SUCCESS
Supply Chain Cost per Issue
(Indexed to FY05 Base)
95.9%
98.7%
100.0%
90.0%
95.0%
100.0%
105.0%
FY05 FY06 FY07
29
• Network Optimization is the heart and soul of Supply Chain
Excellence
• The complexity and dynamic nature of our business requires
highly sophisticated information tools and process
• ETPM and DTPM have significantly improved the network
optimization possibilities
• Dedicated Supply Chain teams ensure flawless execution to
deploy 20 new nodes per year
• The intellectual equity developed by our teams have
transformed the Network Optimization Process into a core
competency for CHEP
SUMMARY
INNOVATION
&
TECHNOLOGY LEADERSHIP MATT PHELPS - SENIOR VICE PRESIDENT, PROCESS
TECHNOLOGY AND PRODUCT ENGINEERING
31
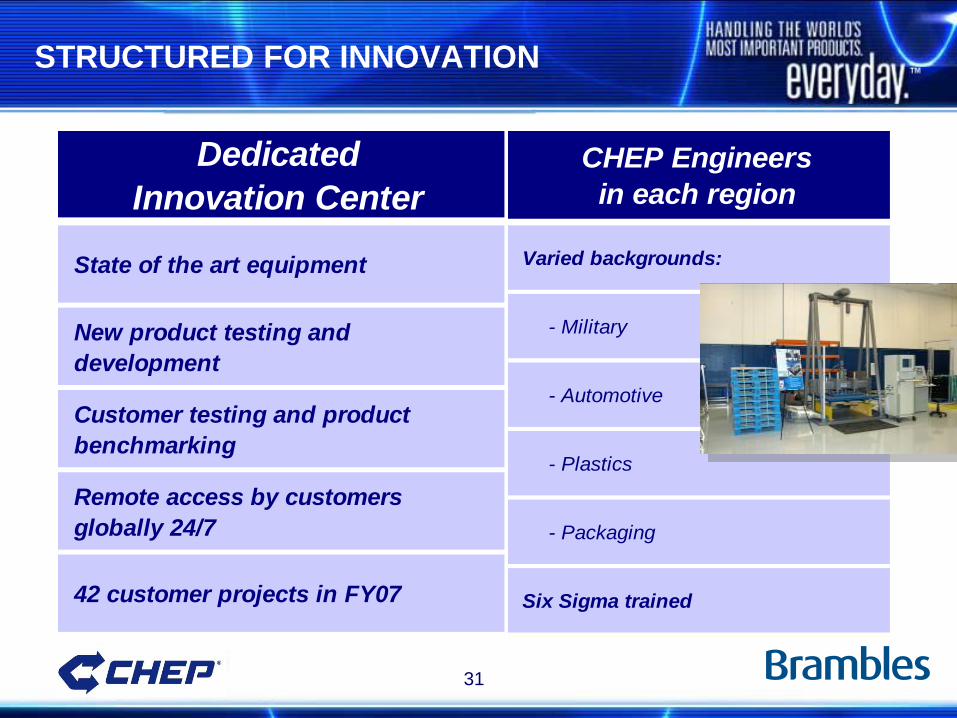
STRUCTURED FOR INNOVATION
Dedicated
Innovation Center
State of the art equipment
New product testing and
development
Customer testing and product
benchmarking
Remote access by customers
globally 24/7
42 customer projects in FY07
CHEP Engineers
in each region
Varied backgrounds:
- Military
- Automotive
- Plastics
- Packaging
Six Sigma trained
32
INVENT ONCE; APPLY EVERYWHERE
• Important partnerships – Open door policy
– With customers
• Application engineers and industry trade groups
– With suppliers: open door policy
– With CHEP functions
• Operations
• Marketing
• Asset Productivity
• Logistics
– With CHEP global leadership
• Quarterly priority setting
• BVA focused project list
33
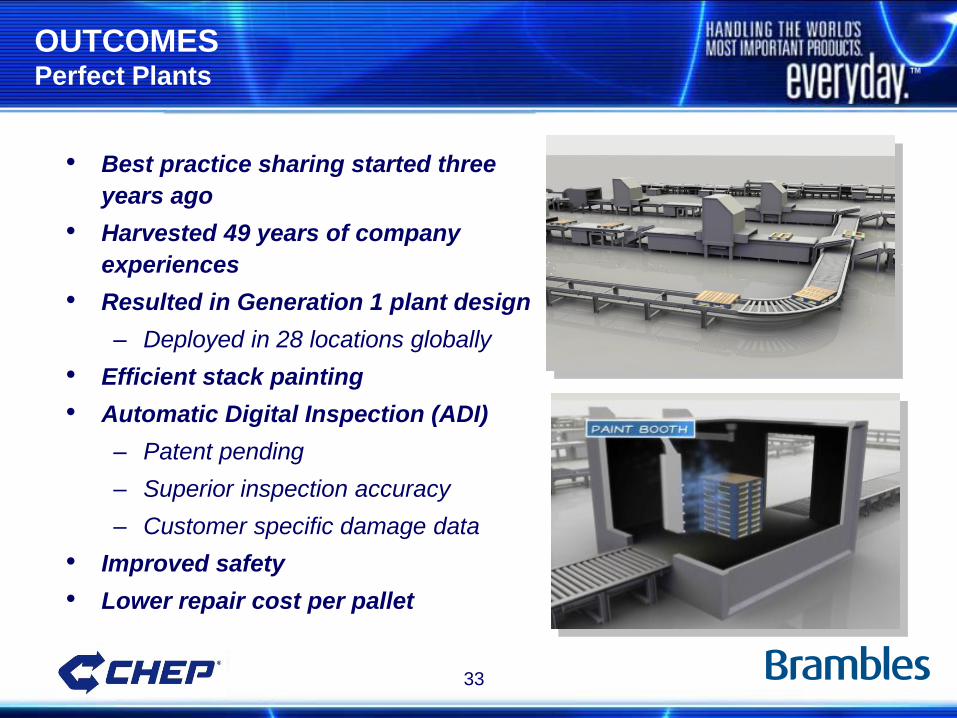
OUTCOMES Perfect Plants
• Best practice sharing started three
years ago
• Harvested 49 years of company
experiences
• Resulted in Generation 1 plant design
– Deployed in 28 locations globally
• Efficient stack painting
• Automatic Digital Inspection (ADI)
– Patent pending
– Superior inspection accuracy
– Customer specific damage data
• Improved safety
• Lower repair cost per pallet
34
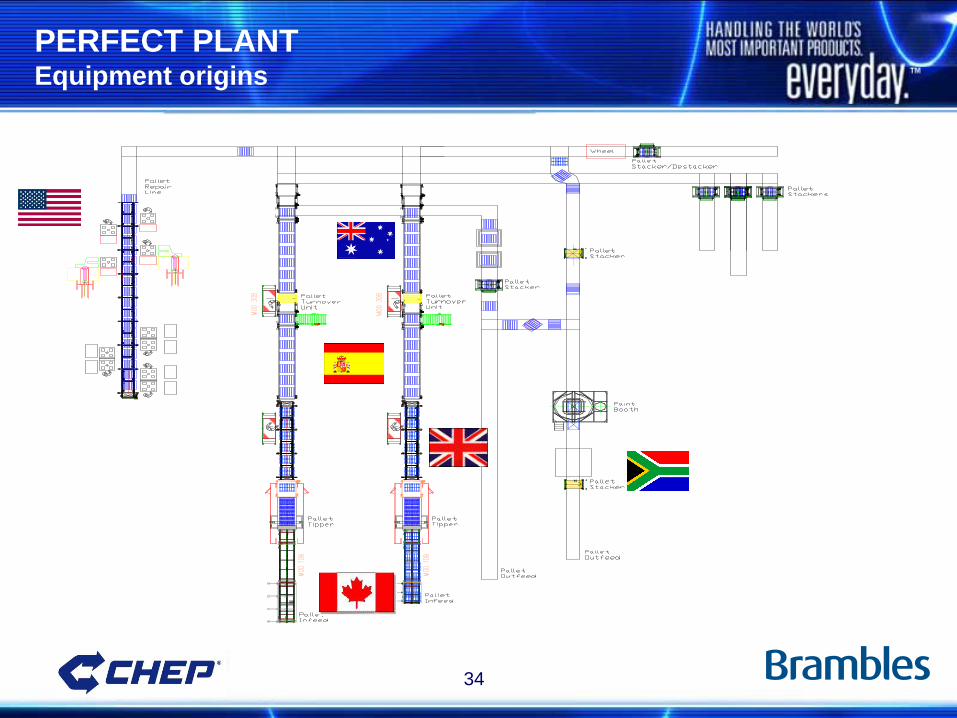
PERFECT PLANT Equipment origins
35
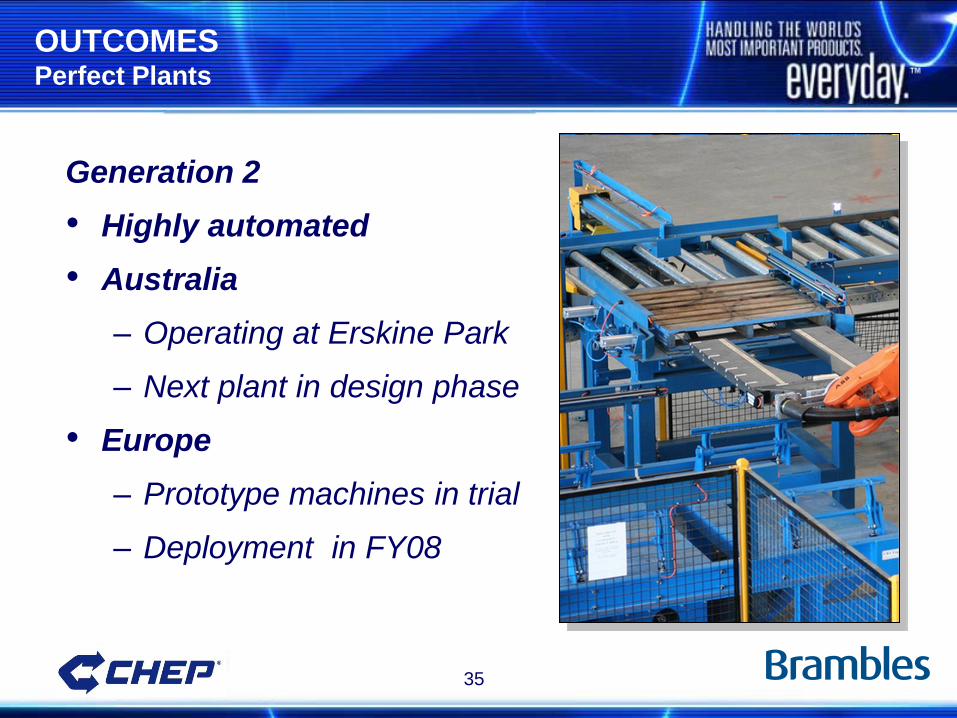
OUTCOMES Perfect Plants
Generation 2
• Highly automated
• Australia
– Operating at Erskine Park
– Next plant in design phase
• Europe
– Prototype machines in trial
– Deployment in FY08
36
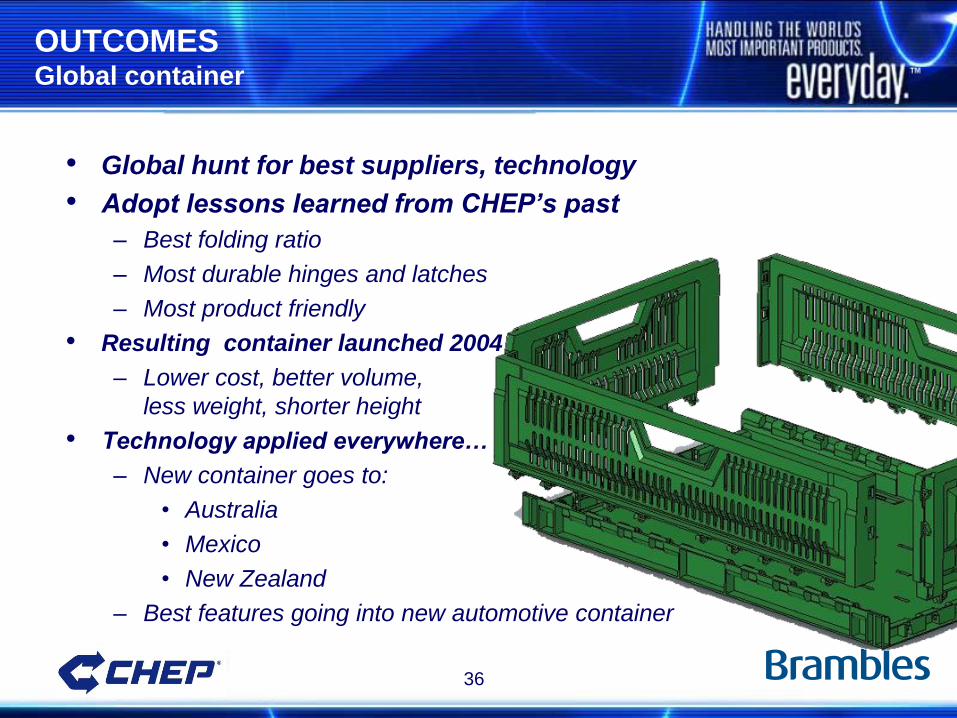
OUTCOMES Global container
• Global hunt for best suppliers, technology
• Adopt lessons learned from CHEP’s past
– Best folding ratio
– Most durable hinges and latches
– Most product friendly
• Resulting container launched 2004
– Lower cost, better volume,
less weight, shorter height
• Technology applied everywhere…
– New container goes to:
• Australia
• Mexico
• New Zealand
– Best features going into new automotive container

37
OUTCOMES Blue Guardian
• New impact guard for forklifts
– Started with obscure industry item
– Improved by CHEP for durability,
cost, safety
• Redirects impact energy to center
block or stringer
• Protects products and pallets
– 40% reduction to lead board
damage
• Over 10,000 units to be deployed
around the world in FY08
38
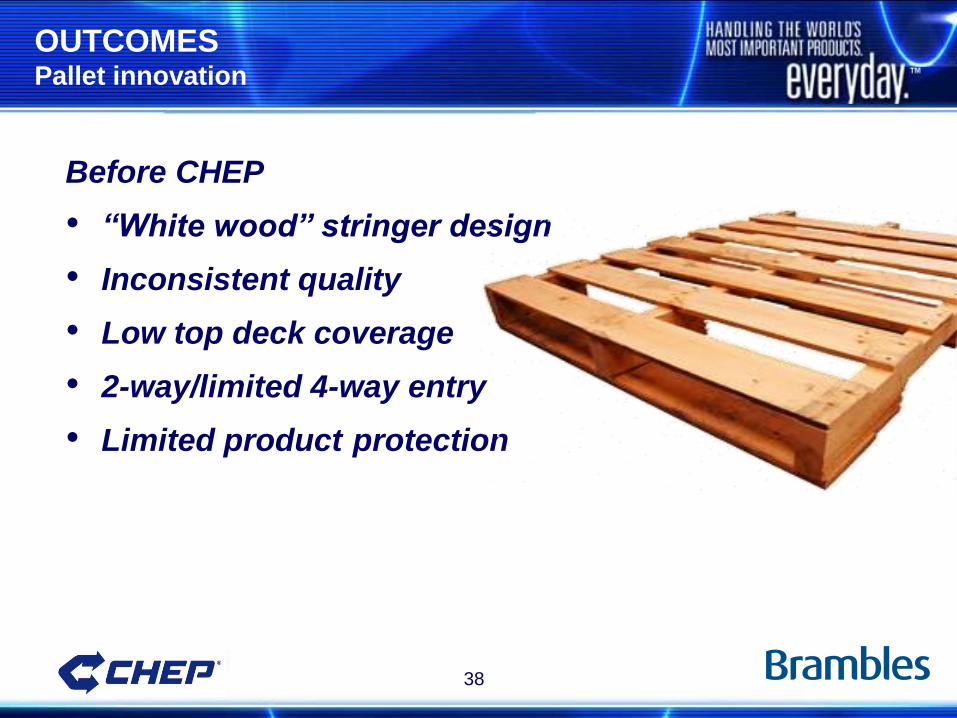
OUTCOMES Pallet innovation
Before CHEP
• “White wood” stringer design
• Inconsistent quality
• Low top deck coverage
• 2-way/limited 4-way entry
• Limited product protection

39
OUTCOMES Pallet innovation
Inn
ov
ati
on
1958 1970s 2000 2007
40
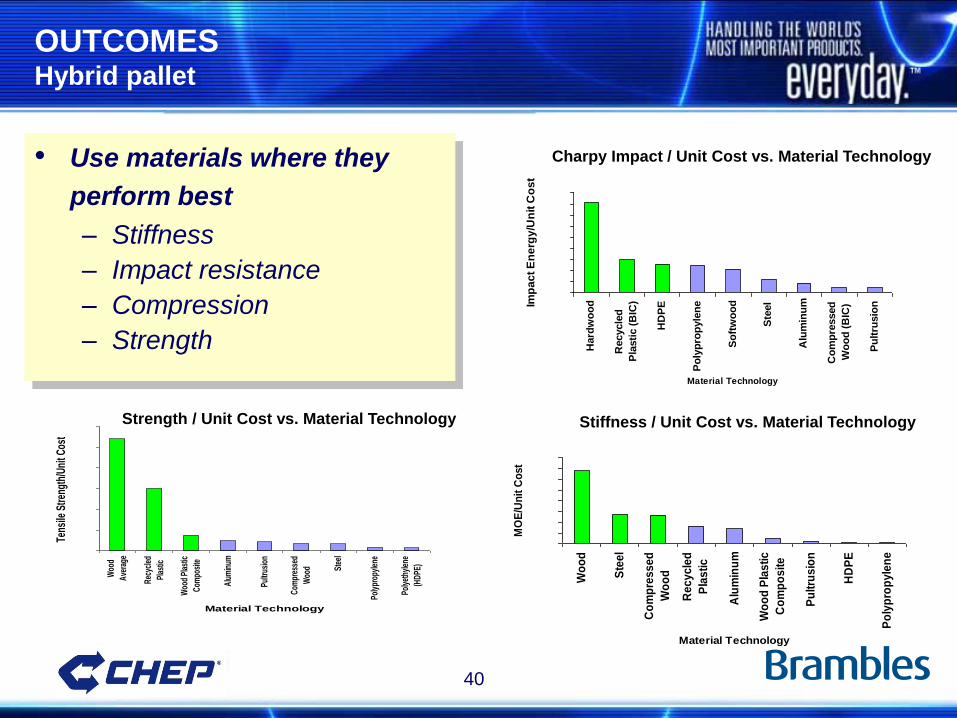
OUTCOMES Hybrid pallet
• Use materials where they
perform best
– Stiffness
– Impact resistance
– Compression
– Strength
0200400600800
10001200140016001800
Hard
wo
od
Recycle
d
Pla
sti
c (
BIC
)
HD
PE
Po
lyp
rop
yle
ne
So
ftw
oo
d
Ste
el
Alu
min
um
Co
mp
ressed
Wo
od
(B
IC)
Pu
ltru
sio
n
Material Technology
Imp
ac
t E
ne
rgy
/Un
it C
os
t
0
500
1000
1500
2000
2500
3000
Woo
d
Ave
rage
Rec
ycle
d
Plas
tic
Woo
d Pl
astic
Com
posi
te
Alu
min
um
Pultr
usio
n
Com
pres
sed
Woo
d Stee
l
Poly
prop
ylen
e
Poly
ethy
lene
(HD
PE)
Material Technology
Tens
ile S
tren
gth/
Uni
t Cos
t
050
100150200250300350400
Wo
od
Ste
el
Co
mp
res
se
d
Wo
od
Re
cy
cle
d
Pla
sti
c
Alu
min
um
Wo
od
Pla
sti
c
Co
mp
os
ite
Pu
ltru
sio
n
HD
PE
Po
lyp
rop
yle
ne
Material Technology
MO
E/U
nit
Co
st
Stiffness / Unit Cost vs. Material Technology
Charpy Impact / Unit Cost vs. Material Technology
Strength / Unit Cost vs. Material Technology
41
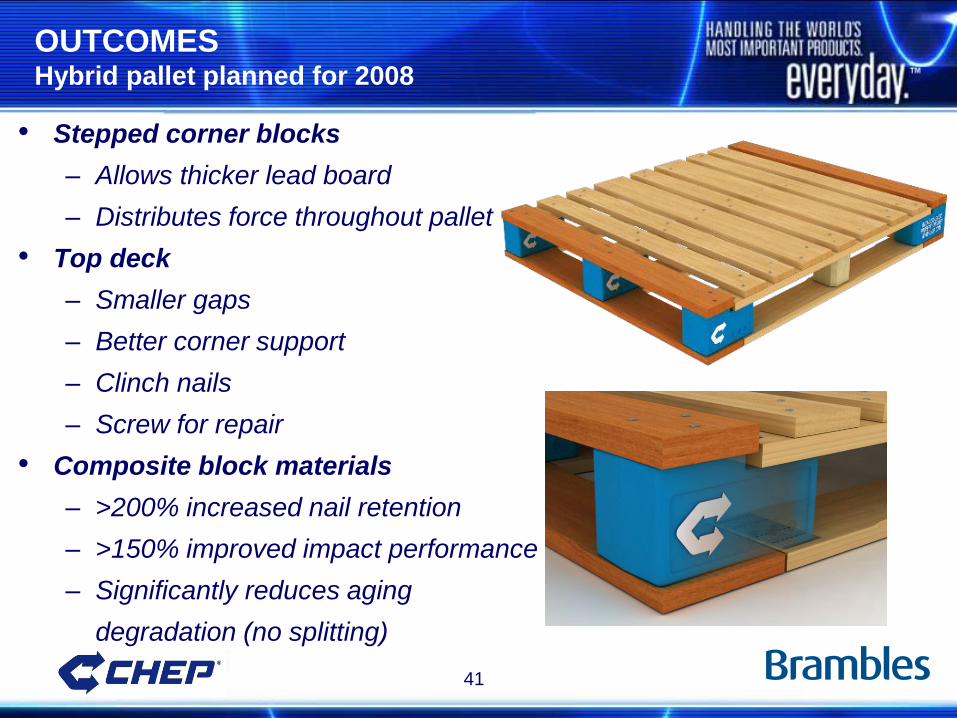
OUTCOMES Hybrid pallet planned for 2008
• Stepped corner blocks
– Allows thicker lead board
– Distributes force throughout pallet
• Top deck
– Smaller gaps
– Better corner support
– Clinch nails
– Screw for repair
• Composite block materials
– >200% increased nail retention
– >150% improved impact performance
– Significantly reduces aging
degradation (no splitting)
42
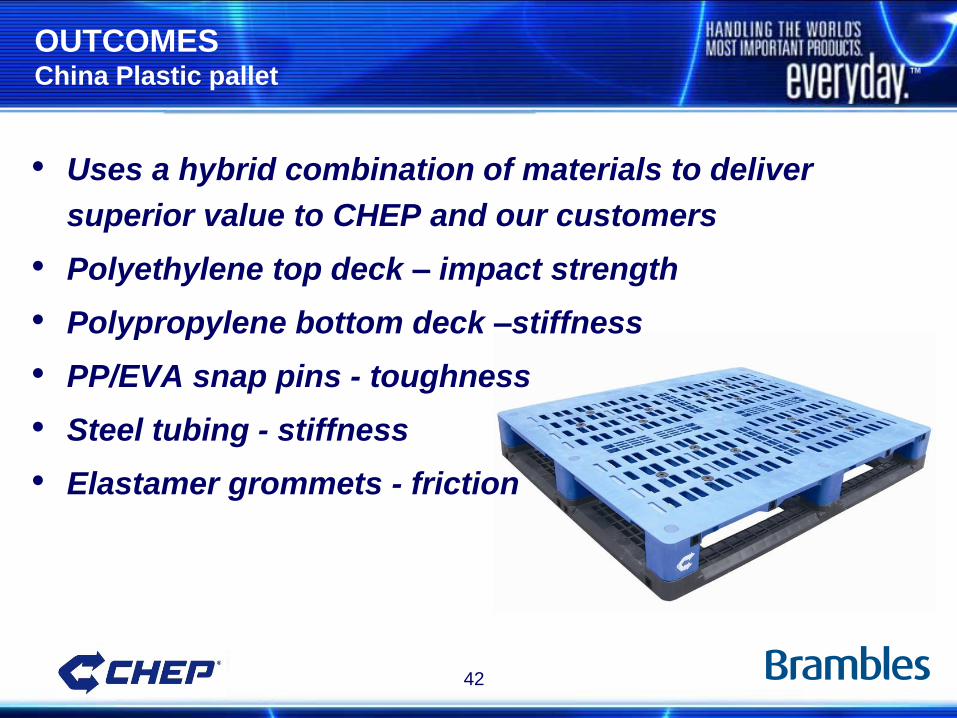
OUTCOMES China Plastic pallet
• Uses a hybrid combination of materials to deliver
superior value to CHEP and our customers
• Polyethylene top deck – impact strength
• Polypropylene bottom deck –stiffness
• PP/EVA snap pins - toughness
• Steel tubing - stiffness
• Elastamer grommets - friction
43
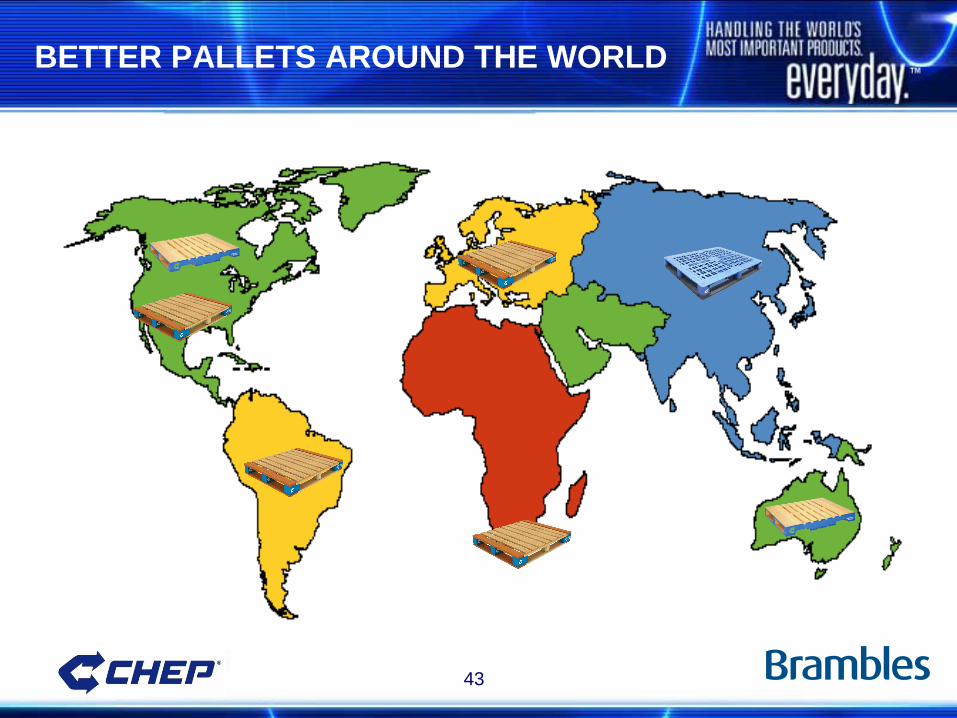
BETTER PALLETS AROUND THE WORLD
44
SUMMARY
• Progress so far
– Global infrastructure drives innovation for CHEP and
our customers
– Perfect Plants - Generation 1
– Best in class wooden and plastic pallets
– Best in class folding containers
• Continuous improvement
– Perfect Plants - Generation 2 and beyond
– Hybrid pallet technology global deployment
– New container designs to power growth
45
Disclaimer statement
The release, publication or distribution of this presentation in certain jurisdictions may be restricted by
law and therefore persons in such jurisdictions into which this presentation is released, published or
distributed should inform themselves about and observe such restrictions.
This presentation does not constitute, or form part of, an offer to sell or the solicitation of an offer to
subscribe for or buy any securities, nor the solicitation of any vote or approval in any jurisdiction, nor
shall there be any sale, issue or transfer of the securities referred to in this presentation in any
jurisdiction in contravention of applicable law.
Persons needing advice should consult their stockbroker, bank manager, solicitor, accountant or other
independent financial advisor. Certain statements made in this presentation are forward-looking
statements. These forward-looking statements are not historical facts but rather are based on Brambles’
current expectations, estimates and projections about the industry in which Brambles operates, and
beliefs and assumptions. Words such as "anticipates," "expects," "intends," "plans," "believes," "seeks,”
"estimates," and similar expressions are intended to identify forward-looking statements.
These statements are not guarantees of future performance and are subject to known and unknown risks,
uncertainties and other factors, some of which are beyond the control of Brambles, are difficult to predict
and could cause actual results to differ materially from those expressed or forecasted in the forward-
looking statements. Brambles cautions shareholders and prospective shareholders not to place undue
reliance on these forward-looking statements, which reflect the view of Brambles only as of the date of this
presentation. The forward-looking statements made in this presentation relate only to events as of the date
on which the statements are made. Brambles will not undertake any obligation to release publicly any
revisions or updates to these forward-looking statements to reflect events, circumstances or unanticipated
events occurring after the date of this presentation except as required by law or by any appropriate
regulatory authority.
46
Michael Sharp
Vice President Corporate Affairs
+61 (2) 9256 5255
Contact details