CHEMISTRY OF AN OXIDATIVE ALKALINE EXTRACTION …
64
CHEMISTRY OF AN OXIDATIVE ALKALINE EXTRACTION BETWEEN CHLORINE DIOXIDE STAGES Troy Runge, Art J. Ragauskas Institute of Paper Science and Technology
Transcript of CHEMISTRY OF AN OXIDATIVE ALKALINE EXTRACTION …

CHEMISTRY OF AN OXIDATIVE ALKALINE EXTRACTION
BETWEEN CHLORINE DIOXIDE STAGES
Troy Runge, Art J. RagauskasInstitute of Paper Science and Technology

Topics CoveredIntroduction– Project Objectives – Review of Alkaline Extraction and Oxidant
Reinforcement ChemistryResults and Discussion– Pulp Characterization– UV/VIS– Molecular Weight– NMR
Conclusions/Future Research

Why Study Oxidative Extraction Chemistry?
Increased ECF bleaching sequences– Compliance with “Cluster Rules” legislation– >50% of bleached chemical market pulp– Popular ECF sequences
» D(E*)DED E* = oxidant reinforcement» OD(E*)D of O2 and/or H2O2
– D0 stage has received the bulk of research attention
– Opportunities also exist understanding oxidative E1 stage chemistry

Ph.D. Project ObjectivesPh.D. Project ObjectivesExplore the fundamental chemistry of reactions occurring during the alkaline extraction stageFocus on the E1 stage after a D0 delignification stageLook at various oxidant reinforcements– (EAr), E, (EO), (EP), (EPO)
Use NMR spectroscopy to measure functional group changes and GPC to measure MW distribution changesMeasure and correlate bleachability to lignin structural changes

Brief Bleaching Chemistry Review
Reaction schemes based primarily on model compound studies from the literatureBriefly cover main reactions of– ClO2
– NaOH– O2
– H2O2

ClO2 Delignification Chemistry
OCH3OH
OO
OOHO
OCH3
O
OCH3O
Para-quinone Ortho-quinone Muconic Acid Methyl Ester
ClO2 ClO2ClO2
Reacts primarily with phenolic structures
Generates Cl2and HOCl species that further delignify and form AOX

NaOH Chemistry - Neutralization
RCOOH
OH
OCH3
R= aryl or alkyl
HO-
HO-
RCOO- H2O
H2OO-
OCH3
+
+
Ionizes acidic groups - increases solubilityDisassociates lignin complexes allowing greater diffusion out of the fiber cell wall

NaOH Chemistry - Chlorine Elimination
Cl
O
OHO-
Cl
O-
OHO
O
O-
O
-O
O
O
C Cl
CHO
HO-
HCl-
H2O-
C Cl
C-O
Cl--
C
CO
-OHC OH
C-O
Elimination of organically bound Cl– Reduces AOX– Increases lignin
solubility– Increases
reactivity of lignin aromatic group

Alkaline Saponification of Methyl Ester Group in Muconic Acid Methyl Ester
R
OCH3
OO
HO
R
OH
OO
HO
O
R
O
OCH3
O
O
R
O
OH
O
Recent Hypothesis– McKague, Froass,
and Evtguin et al.
Saponification of Methyl Ester– MAME formed in
D0 stage– Increases solubility

Hydroxide Addition to Quinones
O
O
HO-
+
OO
H
HO- H
+
O
O-
HO
-
O
O
-OH
COO-
OH
-
Hydroxide addition to quinones– Increases lignin solubility– Considered minor reaction
Alkali environment can also cause quinone radicals to form and couple

O2 and H2O2 Species
O2oxygen
e- H++ e- H++
perhydroxl radical
e- H++HOH + OHHOOH
hydrogen peroxide
e- H++2 HOH
water & hydroxyl radical water
H+ O2
HOO
OH+ H+
superoxide radical
-OOHperhydroxyl anion oxoanion
pKa 4.8 pKa 11.8 pKa 11.9
O2 and H2O2 form similar reactive species
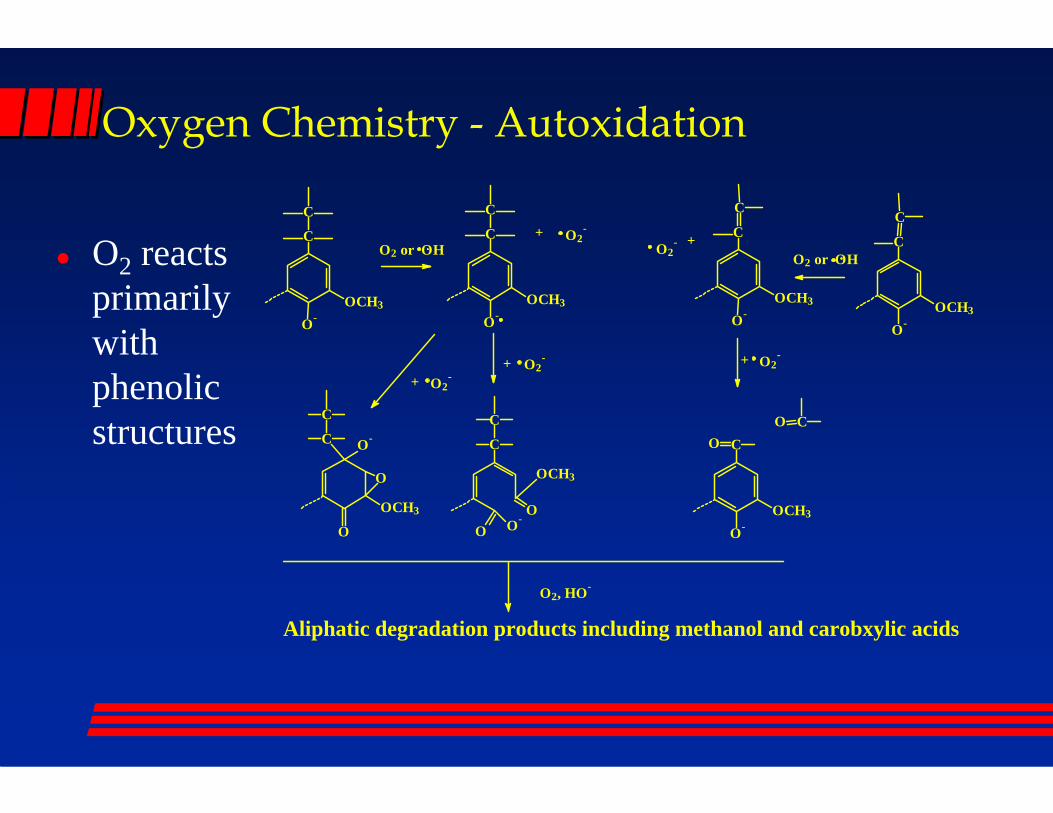
Oxygen Chemistry - Autoxidation
C
O-OCH3
OCO
O2, HO-
Aliphatic degradation products including methanol and carobxylic acids
O-O
OCH3
C
C
O
C
C
O
OCH3
O-
O
C
C
O-OCH3
O2-C
C
O-OCH3
+ C
C
O-OCH3
C
C
O-OCH3
+O2-
O2 or OH
O2-
O2-
O2-
O2 or OH
+++
O2 reacts primarily with phenolic structures

Hydrogen Peroxide Chemistry - Addition Reactions
OR
OCH3
CHCH
HCO
HOO-
OR
OCH3
CHCH
HCO-
HOO
OR
OCH3
CHCH
HCO
OHOO-
OR
OCH3
CHCH
HCO
-O OOH
OR
OCH3
CHO
HC
HCO
OHO-
-OH
Addition to quinone structures
Michael addition to conjugated carbonyl structures
-OOH O
O-
R
OHO
O-
R
OOHHO O--OHO
-O
R
OOHO
O
R

H2O2 and O2 Reactions that Create Quinones
OCH3
OR
O-
HOO-
OCH3
O-R
O-
OHO
OCH3
O-R
O
O
OCH3
OC
O-
OR
OCH3O-
OH
OR
-O
HO- O2
OCH3O
O
O2-
O2 or OHC OH
O-
OCH3
C OH
OOCH3
C OH
OOCH3
COH
OOCH3
O O-
OOCH3
O
C O
HO--O2-
Dakin reaction
Dakin-like reaction

Bleaching Conditions
D0 - 0.20 KF (2.3% charge of ClO2)– 10% solids, 45 min., 45oC, pHi = 2.5
E1 stagesBleachingStage
Bleaching Conditions Employed
E 2.0% NaOH; atmospheric pressure.(EO) 2.5% NaOH; 60 psig O2 initially, -12 psig/5
minutes(EP) 2.5% NaOH; 0.5% hydrogen peroxide(EPO) 2.5% NaO; 0.5% hydrogen peroxide; 60
psig O2 initially, -12 psig/5 minutes(EAr) All O2 was removed from the pulp and
chemicals. 2.0% NaOH ; slight Ar pressure

Bleaching Conditions - continuedD1 - 0.75% ClO2, 0.2% NaOH– 10% solids, 3 hours, 70oC, pHf ~ 4.0
E2 stages - 1.0% NaOH– 10% solids, 75 min., 70oC
D2 - varying ClO2 charge– NaOH charge = 20% of ClO2 charge– 10% solids, 3 hours, 70oC, pHf ~ 4.0

0.0
0.5
1.0
1.5
2.0
2.5
3.0
3.5
4.0
BS D D(EAr) DE D(EO) D(EP) D(EPO) D(EAr)D DED D(EO)D D(EP)D D(EPO)D
Stage
Aci
d-In
solu
ble
Lign
in w
ith 9
5% C
I .
0
5
10
15
20
25
30
Kap
pa N
umbe
r w
ith 9
5% C
I
Acid-Insoluble
Kappa Number
Bleached Pulps - Lignin Content
Oxidant reinforcement increased delignification for E1* stageO2 increased delignification more than H2O2
Kappa more sensitive than acid insoluble lignin

Bleached Pulps - CED Viscosity
15
17
19
21
23
25
27
29
31
33
BS D D(EAr) DE D(EO) D(EP) D(EPO) D(EAr)D DED D(EO)D D(EP)D D(EPO)D
Stage
CED
Visc
osity
with
95%
CI (
cP)
Viscosity is a measure of carbohydrate degradationLoss from D0 -acid hydrolysisLoss from oxidative EO2 cause more damage than H2O2

Bleached Pulps - D1 ISO Brightness
65
70
75
80
85
90
D(EAr)D DED D(EO)D D(EP)D D(EPO)D
Stage
D1 I
SO B
right
ness
with
95%
CI
.
Increased D1brightness with oxidant reinforcementH2O2 > O2
Affected by lignin and chromophore amount
Bleached Pulps - D2 Brightness Ceiling
81
82
83
84
85
86
87
88
89
90
91
0.1 0.2 0.3 0.4 0.5 0.6 0.7 0.8 0.9
D2 Charge, %
D2 I
SO B
righ
tnes
s
D(EAr)DED
D(E)DED
D(EO)DED
D(EP)DED
D(EPO)DED
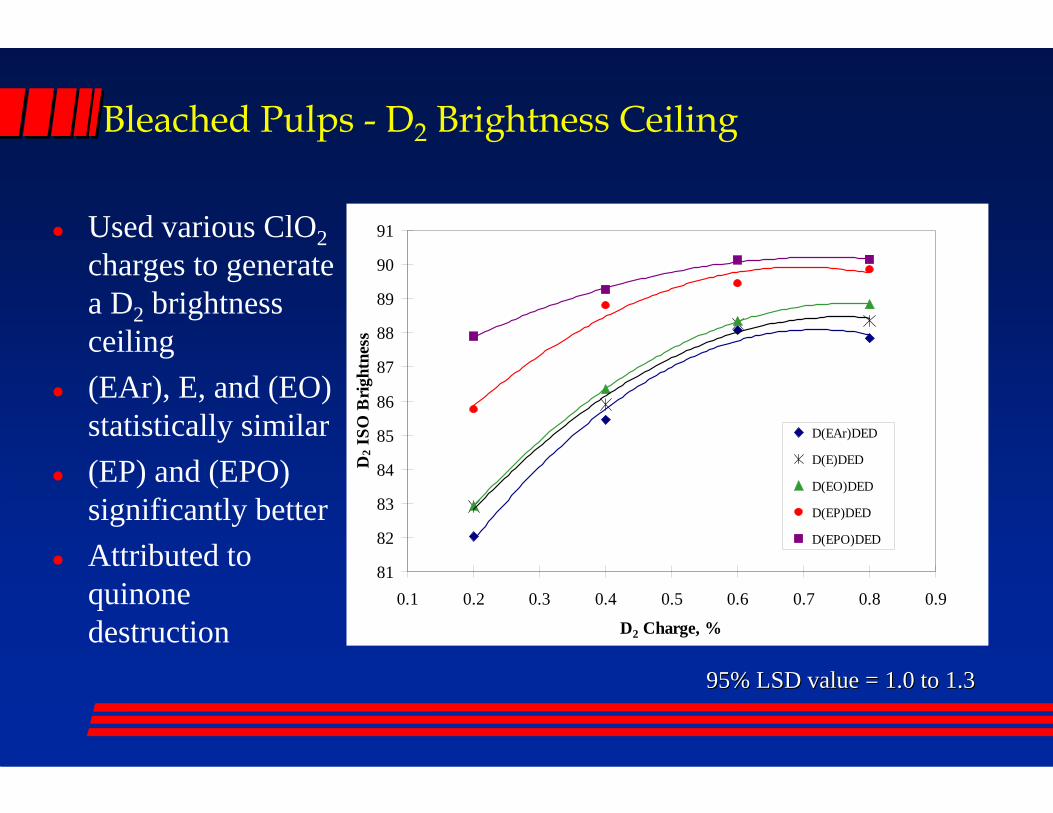
95% LSD value = 1.0 to 1.395% LSD value = 1.0 to 1.3
Used various ClO2charges to generate a D2 brightness ceiling(EAr), E, and (EO) statistically similar(EP) and (EPO) significantly betterAttributed to quinone destruction

AOX and Cl / 100 C atoms of Bleach Effluents
0.0
0.3
0.5
0.8
1.0
1.3
1.5
1.8
2.0
D+D(EAr) D+DE D+D(EO) D+D(EP) D+D(EPO)
Bleach Sequence
AO
X (g
Cl/k
g pu
lp)
0.0
0.5
1.0
1.5
2.0
2.5
3.0
Cl /
100
C
AOX Cl/100C
Trend of decreased AOX content with increased oxidantMineralization phenomena -literatureAmount of decrease is not significant

Bleached Pulps - Carboxyl Content
50
55
60
65
70
75
80
85
90
BS D D(EAr) DE D(EO) D(EP) D(EPO) DED D(EPO)D
Stage
Pul
p C
OO
H c
onte
nt (m
eq/k
g) w
ith
95%
CI
.
COOH groups can control physical paper propertiesConductometric titrationTrend of increased COOH groups with oxidant but not significant
Bleachability Fundamentals
To obtain fundamental understanding of changes in delignification and bleachability - understand changes to lignin structure– Lignin color– Lignin size– Lignin functional groups

Lignin Isolation
Characterized pulps and effluents were used to isolate lignin– Residual lignin - Acid Hydrolysis
» 0.1 M HCl in 9:1 dioxane:H2O solution» Remove dioxane & acid precipitate» Wash repeatedly & freeze-dry
– Effluent lignin - Precipitate» Alkaline stages only» Acid precipitate» Wash repeatedly & freeze-dry

Bleachability Fundamentals
To obtain fundamental understanding of changes in delignification and bleachability - understand changes to lignin structure– Lignin color– Lignin size– Lignin functional groups

VIS Absorbance - Residual Lignins
-1
-0.5
0
0.5
1
1.5
2
350 400 450 500 550 600 650 700Wavelength (nm)
Res
idua
l Lig
nin
Visi
ble
Abs
. ∆ S
pect
ra (A
bs L
/g c
m)
DD(EAr)DED(EO)D(EP)D(EPO)
Measured in 1:1 (v/v) dioxane:waterAcidic solutions to remove ionization effectsGreatest change in 360 to 420 nm region
0
0.2
0.4
0.6
0.8
1
1.2
1.4
Brownstock D D(EAr) DE D(EO) D(EP) D(EPO)
Bleach Stage
Lign
in A
bsor
ptiv
ity a
t 457
nm
(Abs
L/g
cm
)
ResidualEffluent
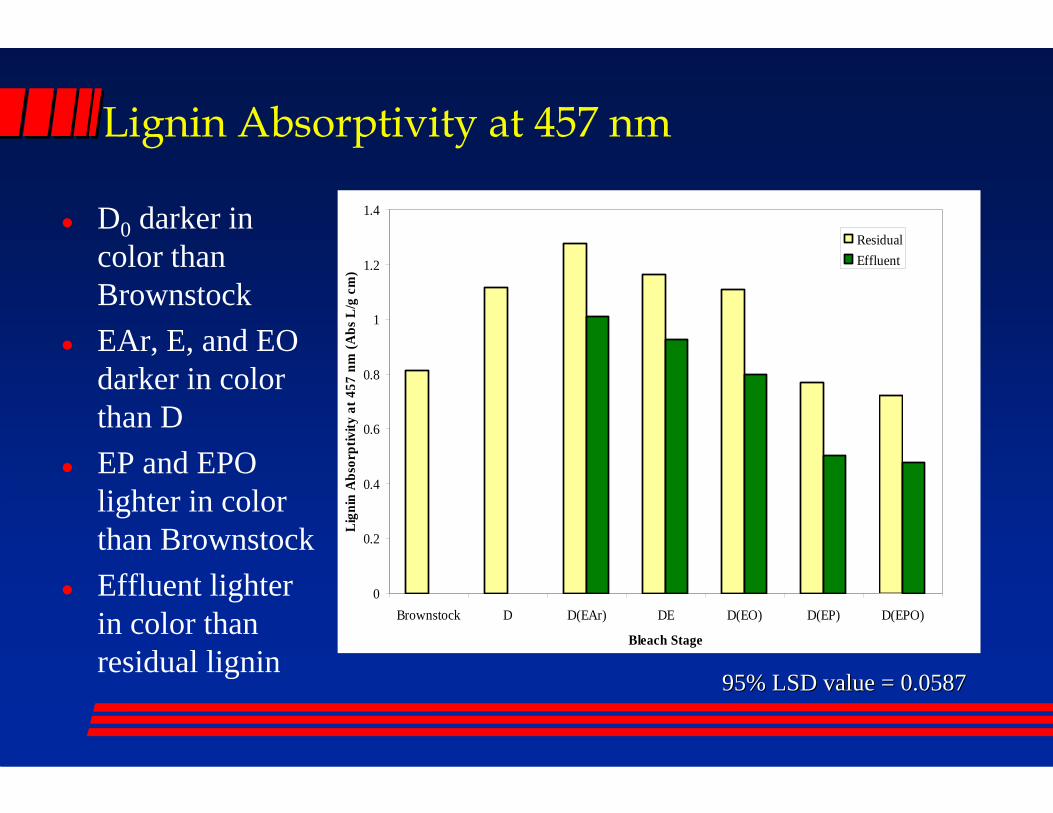
Lignin Absorptivity at 457 nm
D0 darker in color than BrownstockEAr, E, and EO darker in color than DEP and EPO lighter in color than BrownstockEffluent lighter in color than residual lignin
95% LSD value = 0.058795% LSD value = 0.0587
Bleachability Fundamentals
To obtain fundamental understanding of changes in delignification and bleachability - understand changes to lignin structure– Lignin color– Lignin size– Lignin functional groups
Effluent Apparent MW Distribution
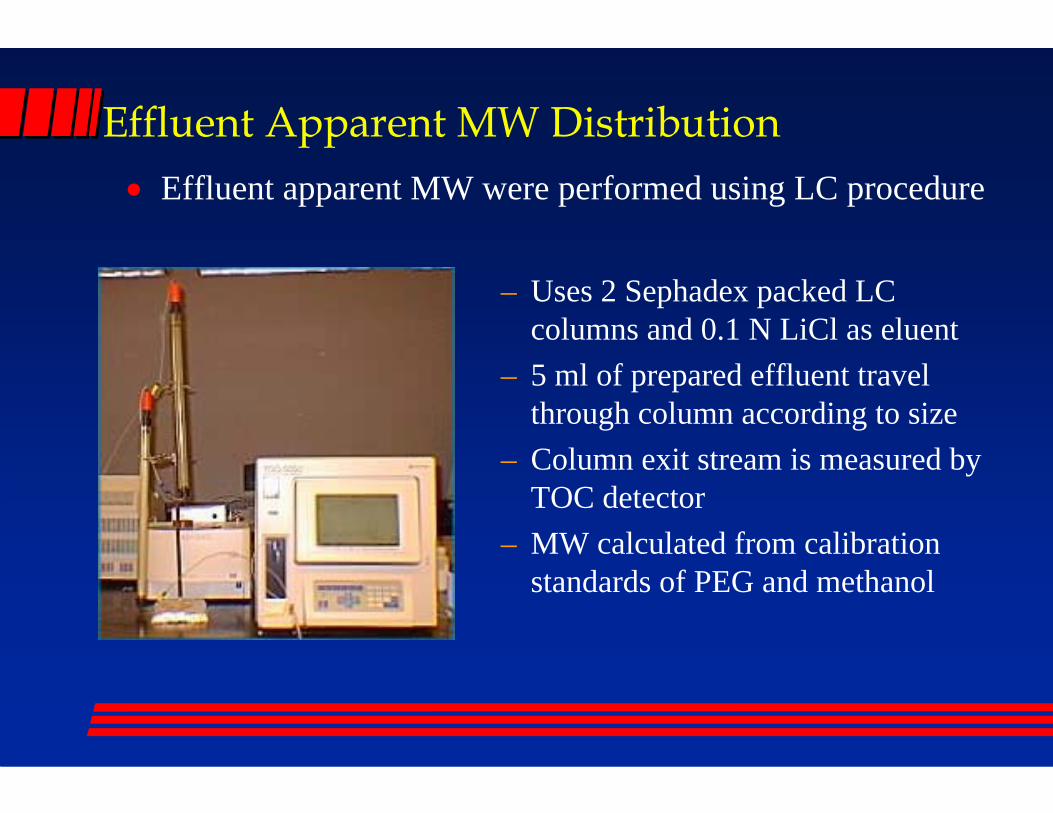
– Uses 2 Sephadex packed LC columns and 0.1 N LiCl as eluent
– 5 ml of prepared effluent travel through column according to size
– Column exit stream is measured by TOC detector
– MW calculated from calibration standards of PEG and methanol
• Effluent apparent MW were performed using LC procedure

Apparent MW Distributions of Bleach Stage Effluents
0
20
40
60
80
100
120
0 2000 4000 6000 8000 10000 12000 14000 16000 18000 20000
Apparent Molecular Weight
TOC
, ppm
D
D(EPO)
D(EPO)D
D0 - low MW fragments onlyE1* -bimodal distributionD1 low amount of organic matter

Alkaline Extraction Oxidant Affect on E* Stage Effluent Apparent MW Distributions
0
20
40
60
80
100
120
140
160
180
200
0 2000 4000 6000 8000 10000 12000 14000 16000 18000
Apparent Molecular Weight
TOC
, ppm
D(EAr)DED(EO)D(EP)D(EPO)
Oxidant reinforcement decreases effluent apparent MWSignifies oxidant is reacting with dissolved effluent lignin

Average Effluent Molecular Weight
Quantify MW decrease with number and weighted averageDecrease in MWW > MWN due to changes occurring mainly in higher MW fraction 0
1000
2000
3000
4000
5000
6000
7000
8000
9000
D D(EAr) DE D(EO) D(EP) D(EPO)
Bleach Sequence
Mol
ecul
ar W
eigh
t Ave
rage
MWn
MWw
MWMWN N 95% LSD = 621; MW95% LSD = 621; MWWW 95% LSD = 71895% LSD = 718

Controlled Experiment of Oxidant Addition on Effluent Lignin Apparent MW Distribution
D(EAr) effluent was treated to (EP), (EO), and (EPO)Oxidants were able to degrade effluent lignin
0
20
40
60
80
100
120
140
160
180
200
0 2000 4000 6000 8000 10000 12000 14000 16000 18000 20000
Apparent Molecular Weight
TO
C, p
pm (o
n an
orig
inal
D(E
Ar)
bas
is)
D(EAr)D(EAr)(EP)D(EAr)(EO)D(EAr)(EPO)

Hypothesis - Effluent Apparent MW
Hypothesis: Dissolved lignin in effluent of E1* stage reacts with O2 and H2O2reinforcement - consuming chemicals
Test with alternative E1 stages that remove the bulk of the effluent lignin before the O2and H2O2 are applied

Alternative Alkaline Extraction Experiments
E EPOWash
Majority ofeffluent lignin
D Pulp
D(EP)pulp
Effluent
Freshchemicals
CounterCounter--current Extractioncurrent Extraction Double ExtractionDouble Extraction

Results of the Alternative Extraction Stages
Removal of effluent lignin before applying oxidant reinforcement does not significantly improve delignification or brightnessAdditional experiments with increasing H2O2 charges indicated residual lignin was reactive to further oxidant chemicalThis suggests that very little oxidant is wasted reacting with effluent lignin
Bleachability Fundamentals
To obtain fundamental understanding of changes bleachability - understand changes to lignin structure– Lignin color– Lignin size– Lignin functional groups

NMR Spectroscopy on Lignin
Bruker 400 MHzExperiments Performed– 1H NMR – 13C NMR – 31P NMR - Hydroxyl groups– 31P NMR - Quinones– 2H NMR - Alkyl Carbonyls

Typical 1H NMR Spectrum
(ppm) -202468101214
COOHCOOH Phenolic HPhenolic H
D(EO) residual lignin D(EO) residual lignin TSP internal standardTSP internal standard
Methoxy HMethoxy H
Aromatic HAromatic H
Formyl HFormyl H
Aliphatic CHAliphatic CHXX--OO--
DMSODMSO
OC
OOCH3
C
CH2OH
[R]H
H H
CH2
CHOH
OH
CH
CH
CHO
OCH3
OR
HH
H

1H NMR - COOH groups
0.0
0.5
1.0
1.5
2.0
2.5
Brownstock D D(EAr) DE D(EO) D(EP) D(EPO)
Bleach Sequence
CO
OH
gro
ups,
mm
ol/g
isol
ated
lign
in .
Residual
Effluent
95% LSD = 0.15995% LSD = 0.159
COOH increase due to alkaliAttributed to MAME saponificationO2 and H2O2do not give appreciable increases
R
OH
OO
HO
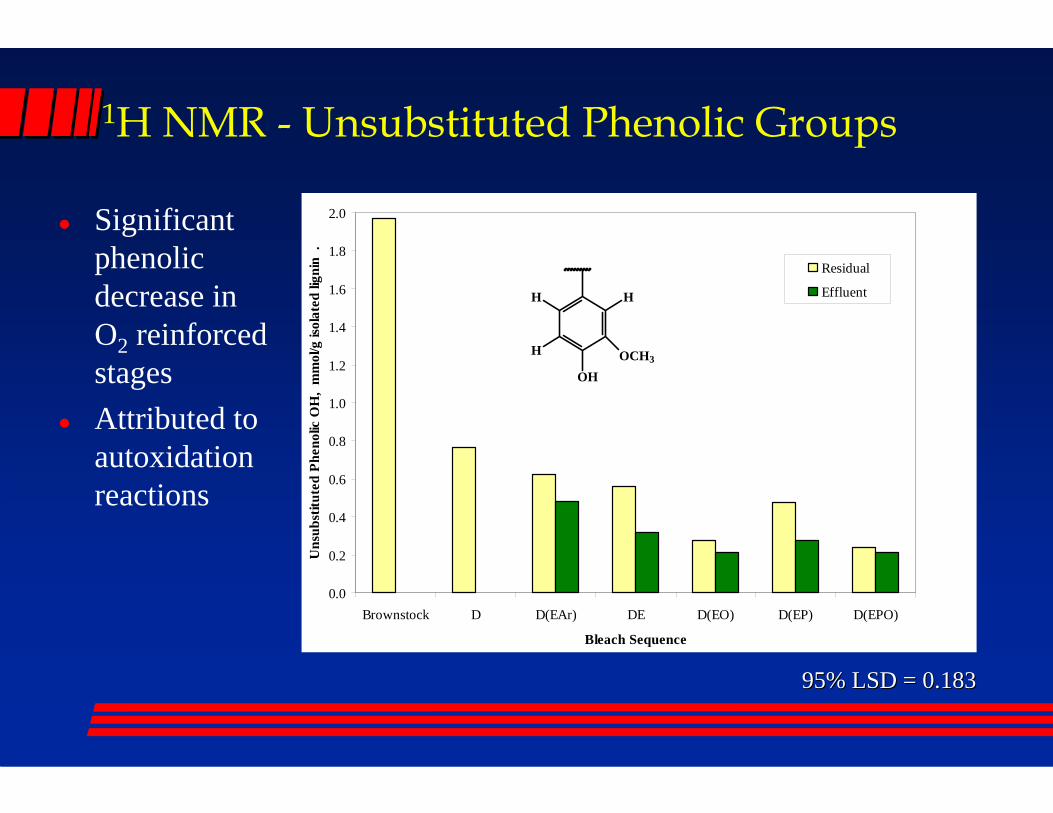
1H NMR - Unsubstituted Phenolic Groups
0.0
0.2
0.4
0.6
0.8
1.0
1.2
1.4
1.6
1.8
2.0
Brownstock D D(EAr) DE D(EO) D(EP) D(EPO)
Bleach Sequence
Uns
ubst
itute
d Ph
enol
ic O
H,
mm
ol/g
isol
ated
lign
in .
Residual
Effluent
95% LSD = 0.18395% LSD = 0.183
Significant phenolic decrease in O2 reinforced stagesAttributed to autoxidation reactions
OHOCH3
H
H H

1H NMR - Substituted Phenolic Groups
0.0
0.2
0.4
0.6
0.8
1.0
1.2
1.4
Brownstock D D(EAr) DE D(EO) D(EP) D(EPO)
Bleach Sequence
Subs
titut
ed P
heno
lic O
H,
mm
ol/g
isol
ated
lign
in
.
ResidualEffluent
95% LSD = 0.05495% LSD = 0.054
Decrease in O2 reinforced stagesSubstituted phenolic did not decrease as much as unsubstituted - indicating less reactive
OHOCH3H3CO

1H NMR - Other Groups
Formyl – No change during D0
– slight decrease with O2 reinforcementAromatic – decrease during D0
– No change in E1*Methoxyl and Aliphatic CHX-O-– high variability

1H NMR - D1 stage
D1 Stage – Destroys aromatic
nature of lignin – Leaves primarily
aliphatic structures
No differences noted between functional groups from previous E1* stage
ppm 0 2 4 6 8 10 12
DED LigninDED Lignin

Typical 13C NMR Spectrum
(ppm)20406080100120140160180 0
D(EO) residual lignin D(EO) residual lignin
COOH COOH
Aromatic CsAromatic Cs
DMSODMSO
MethoxyMethoxy
ConjugatedConjugated UnconjugatedUnconjugated
Cs on aliphatic ether Cs on aliphatic ether & hydroxyls& hydroxyls
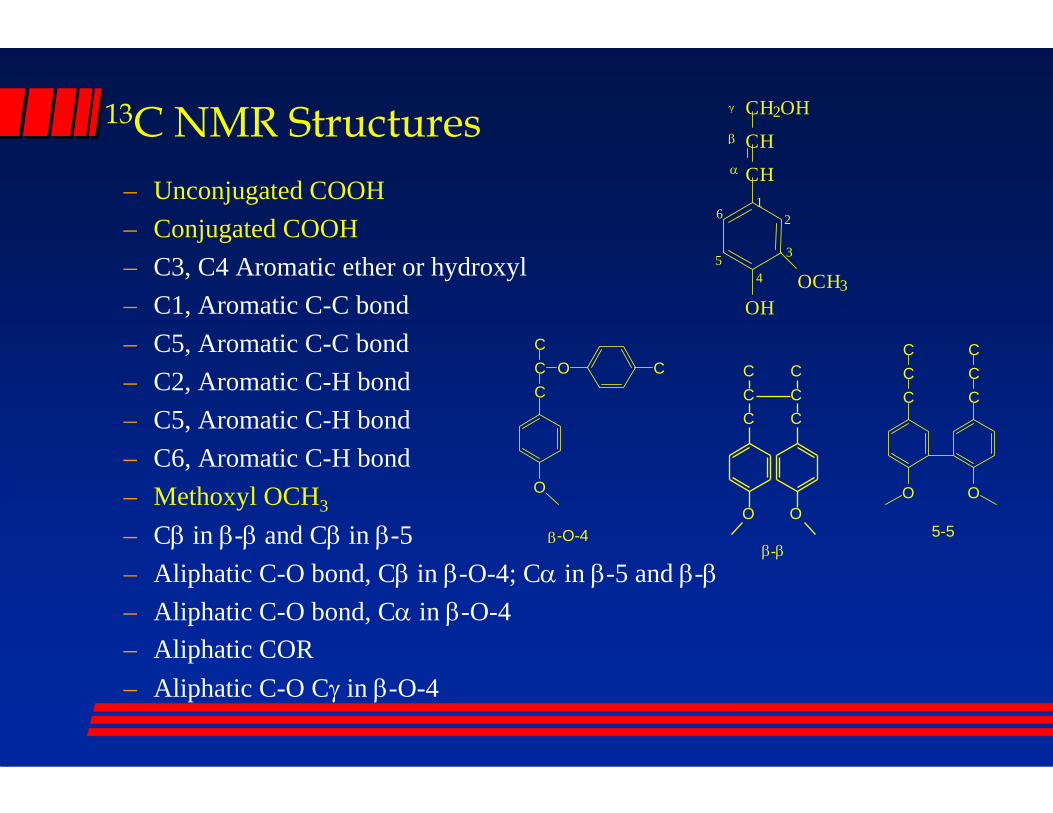
13C NMR Structures– Unconjugated COOH– Conjugated COOH– C3, C4 Aromatic ether or hydroxyl– C1, Aromatic C-C bond– C5, Aromatic C-C bond– C2, Aromatic C-H bond– C5, Aromatic C-H bond– C6, Aromatic C-H bond– Methoxyl OCH3
– Cβ in β-β and Cβ in β-5– Aliphatic C-O bond, Cβ in β-O-4; Cα in β-5 and β-β– Aliphatic C-O bond, Cα in β-O-4– Aliphatic COR– Aliphatic C-O Cγ in β-O-4
CH
CH
CH2OH
OHOCH3
12
3
45
6
α
β
γ
CCC
CC
C
O O
β-β
CCC
O C
O
β-O-4
CC
O
C
C
O
CC
5-5

13C NMR - Unconjugated COOH
0.0
0.2
0.4
0.6
0.8
1.0
1.2
Brownstock D D(EAr) DE D(EO) D(EP) D(EPO)
Bleaching Sequence
Unc
onju
gate
d C
OO
H
(C a
tom
s/Aro
mat
ic R
ing)
Residual
Effluent
95% LSD = 0.09595% LSD = 0.095
O
R
O
OH
O
Increase in D0stage and all E1* stageSuggests an increase in COOH groups due to alkali
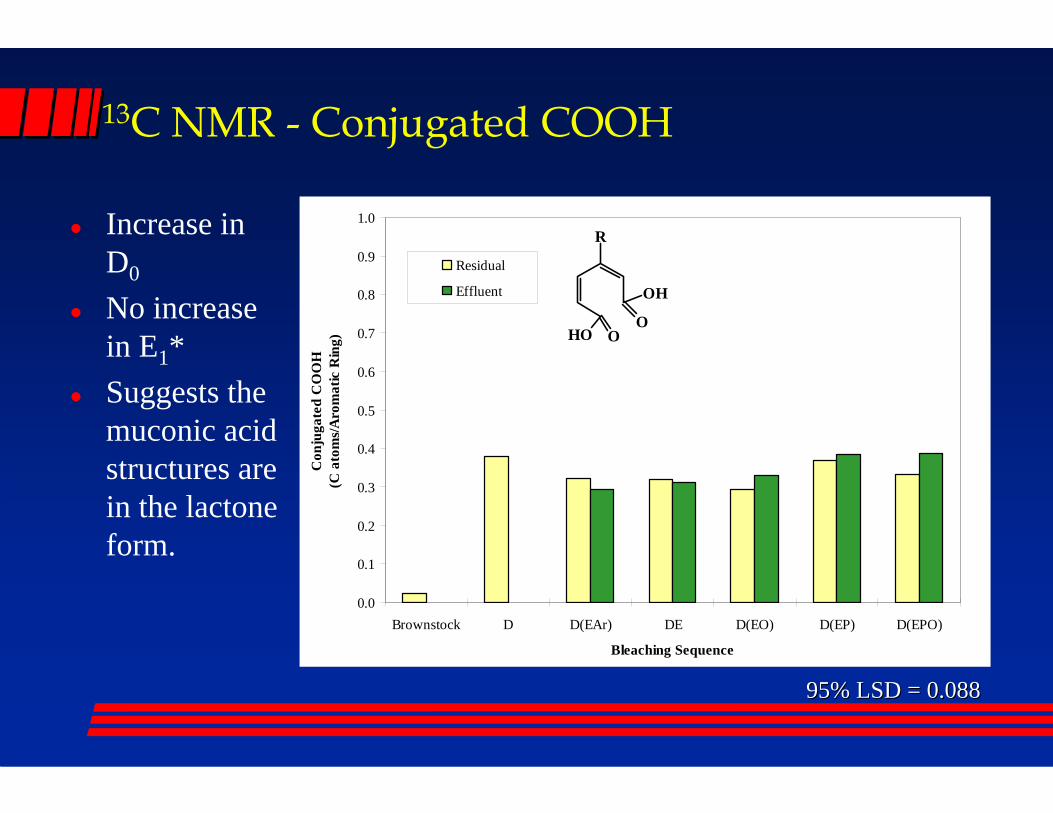
13C NMR - Conjugated COOH
0.0
0.1
0.2
0.3
0.4
0.5
0.6
0.7
0.8
0.9
1.0
Brownstock D D(EAr) DE D(EO) D(EP) D(EPO)
Bleaching Sequence
Con
juga
ted
CO
OH
(C
ato
ms/A
rom
atic
Rin
g)
Residual
Effluent
95% LSD = 0.08895% LSD = 0.088
R
OH
OO
HO
Increase in D0
No increase in E1*Suggests the muconic acid structures are in the lactoneform.

20406080100120140160180
13C NMR Spectra Around the E stage
0ppm
Muconic acidOCH3
D residual lignin
DE effluent lignin
DE residual lignin
UnconjugatedUnconjugatedCOOHCOOH
ConjugatedConjugatedCOOHCOOH
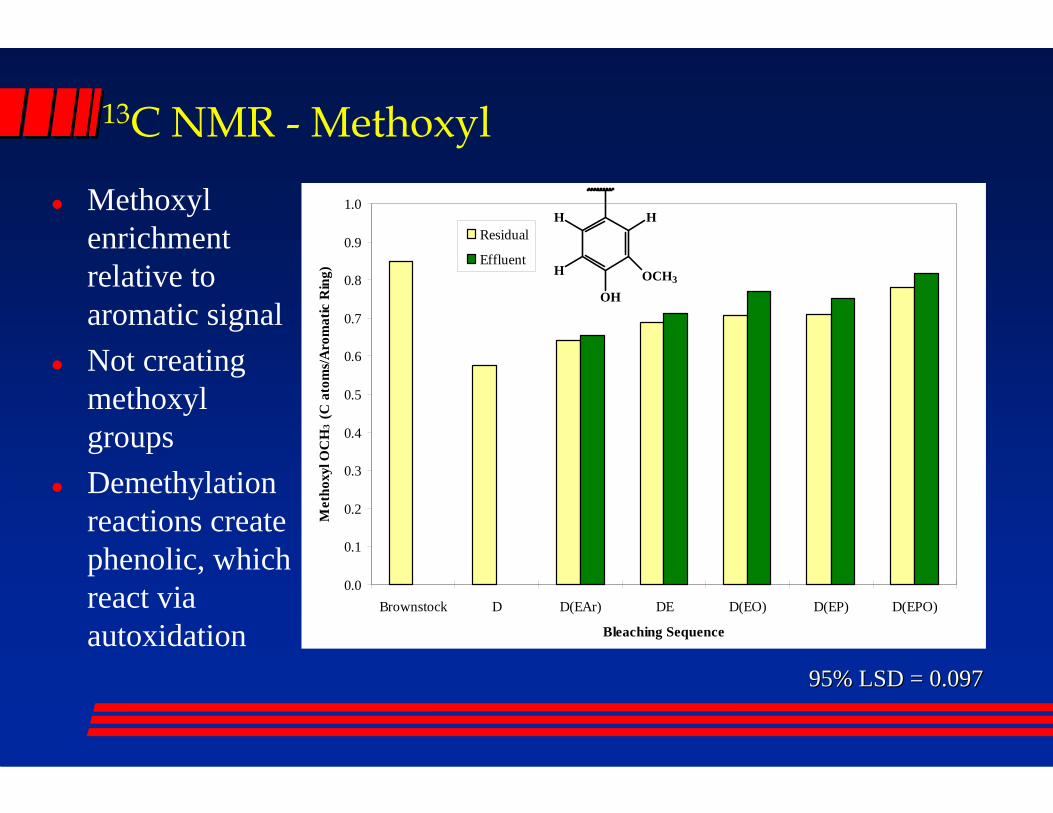
13C NMR - Methoxyl
0.0
0.1
0.2
0.3
0.4
0.5
0.6
0.7
0.8
0.9
1.0
Brownstock D D(EAr) DE D(EO) D(EP) D(EPO)
Bleaching Sequence
Met
hoxy
l OC
H3
(C a
tom
s/Aro
mat
ic R
ing)
Residual
Effluent
95% LSD = 0.09795% LSD = 0.097
OHOCH3
H
H HMethoxyl enrichment relative to aromatic signalNot creating methoxyl groupsDemethylation reactions create phenolic, which react via autoxidation
31P NMR - Hydroxyl Groups
2-chloro-4,4,5,5-tetramethyl-1,3,2-dioxaphospholane derivatizedLignins used– Preliminary study - small scale
» 33 kappa industrial softwood pulp
– D0 residual lignin» Performed E1* stage reactions» 1:1 (v/v) dioxane:water » Isolated lignin
Similar results
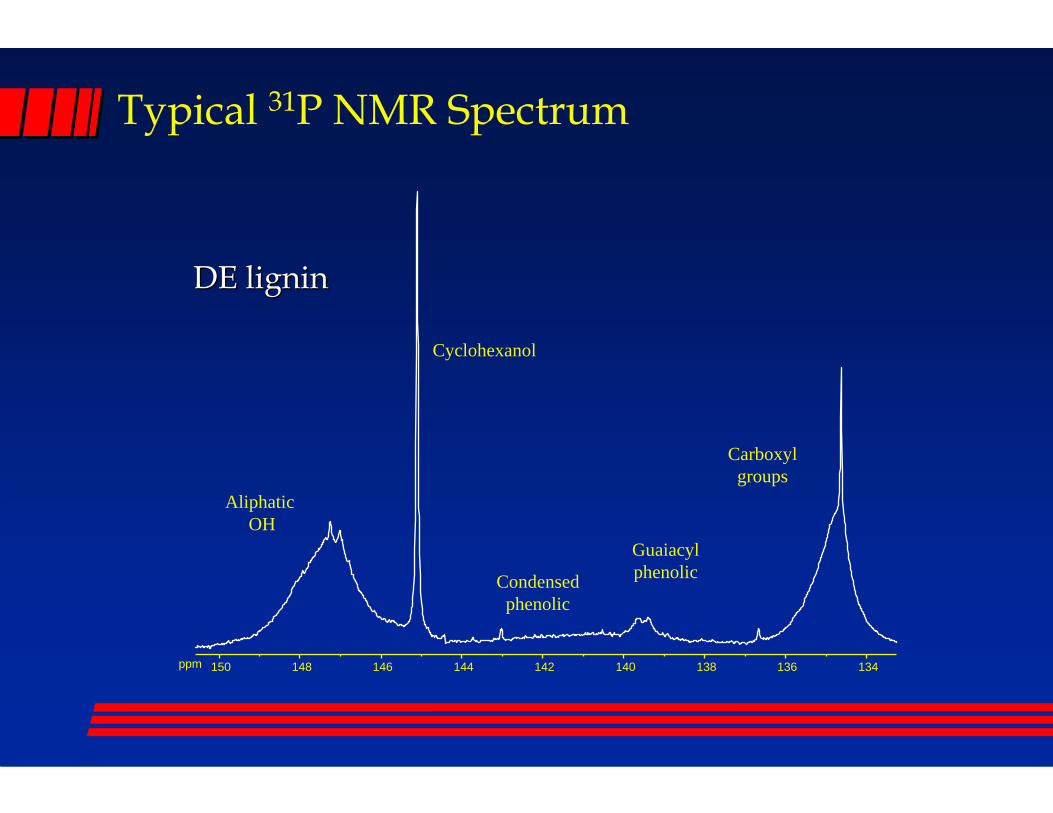
Typical 31P NMR Spectrum
Aliphatic OH
ppm 134136138140142144146148150
Cyclohexanol
Condensedphenolic
Guaiacylphenolic
Carboxylgroups
DE ligninDE lignin

31P NMR - Carboxyl Groups
0.0
0.2
0.4
0.6
0.8
1.0
1.2
D D(EAr) DE D(EO) D(EP) D(EPO)
Bleach Stage
Car
boxy
lic A
cid
(mm
ol/g
isol
ated
lign
in)
95% LSD = 0.19195% LSD = 0.191
Increase in COOH with alkali - MAME saponificationIncrease with H2O2reinforcement -perhydroxyl addition to quinone structures

31P NMR - Phenolic
0.0
0.1
0.2
0.3
0.4
0.5
0.6
D D(EAr) DE D(EO) D(EP) D(EPO)
Bleach Stage
Phe
nolic
(mm
ol/g
isol
ated
lign
in)
GuaiacylCondensed
Condensed phenolic 95% LSD = 0.059; Guaiacyl phenolic 95% LSD = Condensed phenolic 95% LSD = 0.059; Guaiacyl phenolic 95% LSD = 0.024 0.024
Phenolic decrease with oxidant reinforcement - autoxidation reactionsCondensed phenolic smaller drop indicating lower reactive than guaiacyl

31P NMR - Aliphatic Hydroxyl Groups
0.0
0.2
0.4
0.6
0.8
1.0
1.2
1.4
D D(EAr) DE D(EO) D(EP) D(EPO)
Bleach Stage
Alip
hatic
OH
(mm
ol/g
isol
ated
lign
in)
95% LSD = 0.15095% LSD = 0.150
Increase in aliphatic hydroxyl due to alkaliPossibly due to chlorine elimination reactions

Existing NMR Techniques Summary
Existing techniques are able to show some major delignification reactions Measured structures correlated well with delignification but not brightnessNew NMR techniques needed to measure chromophore structures

Lignin Chromophore Structures
Consists primarily of conjugated carbonyls– Quinones– Conjugated
alkyl carbonyls
O
OH
OCH3
coniferaldehyde
O
OOCH3
O
O
para-quinone ortho-quinone
O
CH
OCH3
O
OCH3C
OCH3
OH
O
CH
OCH3
H3CO
CH
O
para-quinone methide ortho-quinone methide
para-para-stilbene quinone

31P NMR - Quinones
Internal Standardtri-m-tolyl-phosphate
05 -5 -10 -15 -20 ppm
Phosphate ester adductLabeled quinone
Procedure developed by Zawadzki et al.Tri-methyl phosphite derivatized

31P NMR - Quinone Content of D0 and E1*
0.00
0.05
0.10
0.15
0.20
0.25
Brownstock D D(EAr) DE D(EO) D(EP) D(EPO)
Bleach Stage
Qui
none
Con
tent
(mm
ol/g
isol
ated
lign
in)
Residual Effluent
95% LSD = 0.05395% LSD = 0.053
D0 stage increase quinones -phenolic reaction Alkali decreases quinone -hydroxide addition & BAR O2 and H2O2decreases quinone -perhydroxyl addition
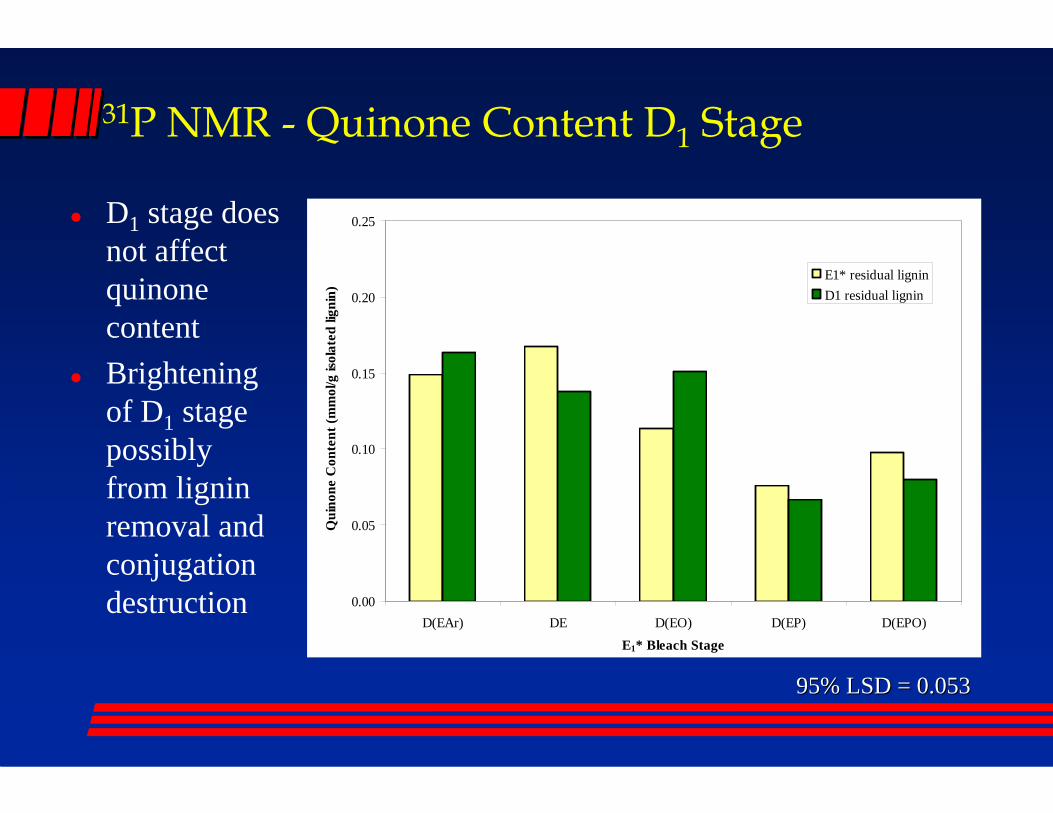
31P NMR - Quinone Content D1 Stage
0.00
0.05
0.10
0.15
0.20
0.25
D(EAr) DE D(EO) D(EP) D(EPO)E1* Bleach Stage
Qui
none
Con
tent
(mm
ol/g
isol
ated
lign
in)
E1* residual ligninD1 residual lignin
95% LSD = 0.05395% LSD = 0.053
D1 stage does not affect quinone contentBrightening of D1 stage possibly from lignin removal and conjugation destruction

Apparent Quinone Content vs D1 Brightness
y = -39.092x + 84.662R2 = 0.8231
70
72
74
76
78
80
82
84
86
0.00 0.05 0.10 0.15 0.20 0.25 0.30 0.35
Apparent Quinone (mmol /kg pulp)
ISO
Bri
ghtn
ess
D(EOP)D
DED
D(EO)D
D(EP)D
D(EAr)D
Apparent quinone = quinone content on pulp weight basis (acid -insoluble ligninCorrelates well brightness suggesting it is a major chromophore

Conclusions
First research to compare fundamental differences between oxidant reinforcement in an alkaline extraction stageAble to to show delignification and brightening reactions occur in the oxidative E1 stageStructural changes measured by existing NMR techniques of 1H-, 13C-, and 31P-hydroxyl NMR useful in explaining delignification reactions but do not correlate to brightness
Conclusions - continuedSummary of main effects of each chemical– NaOH
» Dramatic increase in COOH - MAME saponification
– O2» Increases delignification - autoxidation reactions» Unsubstituted phenolics more reactive than
substituted» Ambient O2 increases delignification
– H2O2» Increases brightness - quinone addition reactions
Acknowledgments:Acknowledgments:IPST Member CompaniesIPST Member CompaniesIPST Wood Chemistry GroupIPST Wood Chemistry Group