Chemistry Education Research and Practiceresearch.chem.psu.edu/mallouk/articles/CERP2016.pdf ·...
16
1174 | Chem. Educ. Res. Pract., 2016, 17, 1174--1189 This journal is © The Royal Society of Chemistry 2016 Cite this: Chem. Educ. Res. Pract., 2016, 17, 1174 Examining the use of adaptive technologies to increase the hands-on participation of students with blindness or low vision in secondary-school chemistry and physics Cary A. Supalo,†* a Jennifer R. Humphrey,* a Thomas E. Mallouk, a H. David Wohlers b and William S. Carlsen c To determine whether a suite of audible adaptive technologies would increase the hands-on participation of high school students with blindness or low vision in chemistry and physics courses, data were examined from a multi-year field study conducted with students in mainstream classrooms at secondary schools across the United States. The students worked with sighted laboratory partners. Four categories of data were analyzed with regard to levels of hands-on participation, including quantitative coding of video-recorded laboratory lessons, qualitative assessment of the same videos, student interviews, and teacher interviews. Evidence in support of the efficacy of the technologies to increase the students’ hands-on participation during laboratory lessons was substantial. However, certain factors affected the quantitative interpretation of the data: students with usable low vision experienced similar levels of participation both with and without the adaptations, and students with little usable vision often required more time than did students with full vision to accomplish some laboratory tasks. Additional factors inherent to natural educational environments were also determined to have strong effects on student outcomes. Relatively few students with blindness or low vision (BLV) pursue advanced studies in the sciences and enter careers in the science, technology, engineering, and mathematics (STEM) fields. While students with BLV in mainstream science courses traditionally depend on others to conduct most lab activities and report observations (Miner et al., 2001; Pence et al., 2003), many find this approach frustrating—and worse, uninspiring (Dewey, 1938; Piaget, 1970; Supalo, 2010)—leaving them uninterested in further scientific pursuits (French, 1924; Rutherford and Ahlgren, 1990; Paris et al., 1998; McPhail et al., 2000; Pence et al., 2003). This may help explain why so few persons with BLV are in the professional scientific community, the low numbers of which are noted or implied in various sources (Division of Science Resources Statistics, 2003; Scadden, 2005; Allum, 2010). Further, active participation in planning and carrying out investigations is one of a number of essential epistemic practices identified as essential to science teaching and learning in recent recommendations by the National Research Council (National Research Council, 2012). Students with BLV in mainstream chemistry and physics classrooms generally depend on laboratory partners or personal laboratory assistants to conduct activities and report visual observations. While this methodology has been educationally successful for some (Miner et al., 2001), a focus on increased physical involvement and independence may be a preferable approach (Supalo, 2010). Many educators and researchers, including Piaget (Piaget, 1970) and Dewey (Dewey, 1938), have long posited that active physical participation in science experi- mentation is highly beneficial to the educational experience (French, 1924; Scadden, 2005), including for students with blindness and other disabilities (French, 1924; Burke, 1932; Long, 1940; Bryan, 1952; Bryan, 1957; Long, 1973; Linn and Thier, 1975; DeLucchi and Malone, 1982; Lynch et al., 2007; Winograd and Rankel, 2007). In recent years, numerous papers on classroom adaptations, technologies, and activities with the potential of increasing the physical hands-on involvement for science students with BLV have been published (Neppel et al., 2005; Penrod et al., 2005; Supalo, 2005; Bromfield-Lee and Oliver-Hoyo, 2007; Neely, 2007; Bromfield-Lee and Oliver-Hoyo, 2009; Pereira et al., 2011; Bonifa ´cio, 2012; Boyd-Kimball, 2012; Wedler et al., 2012; Garrido-Escudero, 2013; Harshman et al., 2013; Pereira et al., 2013; Supalo et al., 2014; Supalo and a Department of Chemistry, The Pennsylvania State University, University Park, Pennsylvania 16802, USA. E-mail: [email protected], [email protected] b Department of Chemistry, Truman State University, Kirksville, Missouri 63501, USA c Department of Curriculum and Instruction, The Pennsylvania State University, University Park, Pennsylvania 16802, USA † Current address: Department of Chemistry at Purdue University, West Lafayette, Indiana 47907, USA. Received 22nd June 2016, Accepted 5th September 2016 DOI: 10.1039/c6rp00141f www.rsc.org/cerp Chemistry Education Research and Practice PAPER
Transcript of Chemistry Education Research and Practiceresearch.chem.psu.edu/mallouk/articles/CERP2016.pdf ·...

1174 | Chem. Educ. Res. Pract., 2016, 17, 1174--1189 This journal is©The Royal Society of Chemistry 2016
Cite this: Chem. Educ. Res. Pract.,
2016, 17, 1174
Examining the use of adaptive technologies toincrease the hands-on participation of studentswith blindness or low vision in secondary-schoolchemistry and physics
Cary A. Supalo,†*a Jennifer R. Humphrey,*a Thomas E. Mallouk,a H. David Wohlersb
and William S. Carlsenc
To determine whether a suite of audible adaptive technologies would increase the hands-on participation of
high school students with blindness or low vision in chemistry and physics courses, data were examined from
a multi-year field study conducted with students in mainstream classrooms at secondary schools across the
United States. The students worked with sighted laboratory partners. Four categories of data were analyzed
with regard to levels of hands-on participation, including quantitative coding of video-recorded laboratory
lessons, qualitative assessment of the same videos, student interviews, and teacher interviews. Evidence in
support of the efficacy of the technologies to increase the students’ hands-on participation during laboratory
lessons was substantial. However, certain factors affected the quantitative interpretation of the data: students
with usable low vision experienced similar levels of participation both with and without the adaptations, and
students with little usable vision often required more time than did students with full vision to accomplish
some laboratory tasks. Additional factors inherent to natural educational environments were also determined
to have strong effects on student outcomes.
Relatively few students with blindness or low vision (BLV) pursueadvanced studies in the sciences and enter careers in the science,technology, engineering, and mathematics (STEM) fields. Whilestudents with BLV in mainstream science courses traditionallydepend on others to conduct most lab activities and reportobservations (Miner et al., 2001; Pence et al., 2003), many findthis approach frustrating—and worse, uninspiring (Dewey, 1938;Piaget, 1970; Supalo, 2010)—leaving them uninterested infurther scientific pursuits (French, 1924; Rutherford and Ahlgren,1990; Paris et al., 1998; McPhail et al., 2000; Pence et al., 2003).This may help explain why so few persons with BLV are in theprofessional scientific community, the low numbers of whichare noted or implied in various sources (Division of ScienceResources Statistics, 2003; Scadden, 2005; Allum, 2010). Further,active participation in planning and carrying out investigationsis one of a number of essential epistemic practices identifiedas essential to science teaching and learning in recent
recommendations by the National Research Council (NationalResearch Council, 2012).
Students with BLV in mainstream chemistry and physicsclassrooms generally depend on laboratory partners or personallaboratory assistants to conduct activities and report visualobservations. While this methodology has been educationallysuccessful for some (Miner et al., 2001), a focus on increasedphysical involvement and independence may be a preferableapproach (Supalo, 2010). Many educators and researchers,including Piaget (Piaget, 1970) and Dewey (Dewey, 1938), havelong posited that active physical participation in science experi-mentation is highly beneficial to the educational experience(French, 1924; Scadden, 2005), including for students withblindness and other disabilities (French, 1924; Burke, 1932;Long, 1940; Bryan, 1952; Bryan, 1957; Long, 1973; Linn andThier, 1975; DeLucchi and Malone, 1982; Lynch et al., 2007;Winograd and Rankel, 2007). In recent years, numerous paperson classroom adaptations, technologies, and activities with thepotential of increasing the physical hands-on involvement forscience students with BLV have been published (Neppel et al.,2005; Penrod et al., 2005; Supalo, 2005; Bromfield-Lee andOliver-Hoyo, 2007; Neely, 2007; Bromfield-Lee and Oliver-Hoyo,2009; Pereira et al., 2011; Bonifacio, 2012; Boyd-Kimball, 2012;Wedler et al., 2012; Garrido-Escudero, 2013; Harshman et al.,2013; Pereira et al., 2013; Supalo et al., 2014; Supalo and
a Department of Chemistry, The Pennsylvania State University, University Park,
Pennsylvania 16802, USA. E-mail: [email protected], [email protected] Department of Chemistry, Truman State University, Kirksville,
Missouri 63501, USAc Department of Curriculum and Instruction, The Pennsylvania State University,
University Park, Pennsylvania 16802, USA
† Current address: Department of Chemistry at Purdue University, West Lafayette,Indiana 47907, USA.
Received 22nd June 2016,Accepted 5th September 2016
DOI: 10.1039/c6rp00141f
www.rsc.org/cerp
Chemistry EducationResearch and Practice
PAPER

This journal is©The Royal Society of Chemistry 2016 Chem. Educ. Res. Pract., 2016, 17, 1174--1189 | 1175
Kennedy, 2014; Wedler et al., 2014). The National ScienceFoundation funded a three-year grant titled IndependentLaboratory Access for the Blind (ILAB) that contributed tothis body of educational research (Supalo, 2007). This projectwas a mixed-methods investigation of the efficacy of ILAB-developed adaptive technologies to increase the hands-onparticipation of secondary-school students with BLV enrolledin mainstream chemistry and physics courses.
These technologies included talking tools, as well as audibleinterfaces to commercially available tools. The results of Year 1of the three-year study have already been reported (Supalo, 2010).The present article examines the extent of hands-on participationof students during Years 2 and 3, for which the approach of thestudy was refined.
By developing and providing a range of audible adaptivetechnologies, we sought to empower students with BLV toindependently perform data-collection activities alongside theirlab group partners during laboratory lessons. In this paper, weexplore the following research question: would the use of suchtechnologies foster more hands-on, multisensory participationby students with BLV as members of lab groups with sightedstudents in laboratory classroom environments?
Key predictions were: (1) when students with BLV use theadapted technologies during laboratory lessons, they willachieve a more hands-on science experience than when theydo not use the technologies during laboratory lessons; and (2)when students with BLV use the adapted technologies duringlaboratory lessons to achieve a more hands-on science experience,they will more fully participate in the activities of the lab groupas compared to laboratory lessons when they do not use thetechnologies.
For the purposes of the study, the term ‘‘hands-on’’ wasbroadly defined as involving direct physical action with the goalof obtaining data through any of the available senses, often—butnot necessarily—including the use of adaptive tools.
Results for Year 1 were substantially positive (Supalo, 2010).For the two subsequent years of the study, the hypotheses anddata analysis methodologies were somewhat refined. In aninvestigation of the data from Year 2 and Year 3 for the revisedHypotheses #1 and #2 (listed above)—both concerning thestudents’ hands-on participation in laboratory activities—useof the adapted technologies during labs was shown to increaseparticipants’ hands-on performance as compared to labs whenthe technologies were not used (Scadden, 2005).
The present article concerns the remaining hypotheses,which are centered on effects potentially resulting from thisincreased physical participation in a further exploration of thedata from Years 2 and 3:
When students with BLV use the adapted technologies duringlaboratory lessons to achieve a more hands-on science learningexperience:
H3: They contribute more productively to discussions in theirlab groups than during laboratory lessons when they do not use thetechnologies.
H4: Their social acceptance into their lab groups is greater thanduring laboratory lessons when they do not use the technologies.
H5: Their attitudes toward science are impacted positively.H6: Their interest in science is impacted positively.H7: Their interest in pursuing STEM career paths is impacted
positively.As illustrated in Fig. 1, these hypotheses are based on the
premise that direct, hands-on experiences in science laboratorycourses may be more advantageous in several aspects for studentswith BLV than is the traditional methodology of relying on others(Linn and Their, 1975; DeLucchi and Malone, 1982; Winograd andRankel, 2007; Supalo, 2010).
Experimental overview
Testing of hypotheses #1–7 was conducted under the sameInstitutional Review Board consents, and involved the samestudents, laboratory lessons, interviews, data instruments, anddata analysis. Field-testing was conducted in natural classroomsettings with the participants working in lab groups having oneto five sighted partners.
The sources of data included audiovisual recordings oflaboratory lessons, student interviews conducted both beforeand after the school term, and post-course interviews with theteachers. Many audiovisual recordings of lessons receivedby the researchers were not utilized for a variety of reasons,including poor quality and not adhering to the defined para-meters. This resulted in some students having only a few usablevideos, while others had many more. From among the usablevideos, a sample set was chosen.
The videos were analyzed for pertinent behavioral qualitiesof the students with BLV and their partners, with accuracybeing checked during repeat viewings. The properties listedin Box 1 were the foundation for video analysis, but other
Fig. 1 How the use or non-use of the adaptive technologies duringlaboratory lessons was expected to impact the lab-group inclusion andSTEM interest of students with BLV. (Adapted from Supalo (Supalo, 2010).)
Paper Chemistry Education Research and Practice
1176 | Chem. Educ. Res. Pract., 2016, 17, 1174--1189 This journal is©The Royal Society of Chemistry 2016
characteristics or conditions of potential interest were likewisechronicled. Additionally noted for each video were the number
and gender of the lab partners, and whether or not theyappeared in other lessons.
Box 1: Properties examined during qualitative analysis of the audiovisual recordings of the laboratory lessons describedin Appendix 1.� The overall hands-on performance of the student with BLV.� Whether the student seemed comfortable using the adapted technologies.� Whether the student used the adapted technologies correctly and efficiently.� The student’s apparent level of understanding of the lesson material.� Which lab-group member(s) assumed leadership.� Whether the student and the partners seemed comfortable with each other.� How intellectually involved the student was in the lab group discussions.� How accepted the student seemed to be within the lab group.
Pertinent sections of audio-recorded interviews were trans-cribed verbatim and analyzed. The students’ pre-course interviewresponses were compared with their post-course responses, andresponses from each student were compared to those of the otherstudents. The teachers’ post-course interview responses werecompared with the students’ responses, and responses fromeach teacher were compared to those of the other teachers.All responses were compared to the video data and to thehypotheses.
Participants and settings
The sample population of students with BLV was comprised oftwo females and four males from six schools in the UnitedStates, a single participant per school, with some diversity inrace, geographic location, and community demographics. Twostudents had some usable vision; the other four were eithercompletely blind or very nearly so. All attended mainstreamsecondary institutions. Signed consent forms were obtainedfrom students, parents, and teachers, as required by theInstitutional Review Board (case #24587) of The PennsylvaniaState University.
Each student participated in field testing at his/her own schoolin natural classroom settings. Three of the students were enrolledin chemistry courses, and three were enrolled in physics.
The students and their teachers were provided with trainingin using the adapted technologies prior to the beginning oftheir respective courses. The technologies were incorporatedinto the laboratory components of participants’ respectivescience courses during some lessons but not during others,so the control and experimental conditions could be compared.Only lab lessons in which the participants worked in lab groups(with sighted students) were included in analysis, so the hands-onperformance of the participants could be compared with that oftheir partners. None of the students with BLV had personallaboratory assistants in the labs that were analyzed.
Technological intervention
The technologies developed for the study primarily includedelectronic devices and software adaptations, which produced
either audible tones or spoken numerical values. The corner-stone of this work was a software interface between the VernierSoftware & Technology line of classroom laboratory probewareand the Job Access with Speech (JAWS) screen-reader software(Supalo et al., 2007; Supalo et al., 2009a, 2009b; Supalo, 2010).JAWS, a commercial text-to-speech product available fromFreedom Scientific and widely used by persons with BLV,transforms compatible screen displays of text into speech.
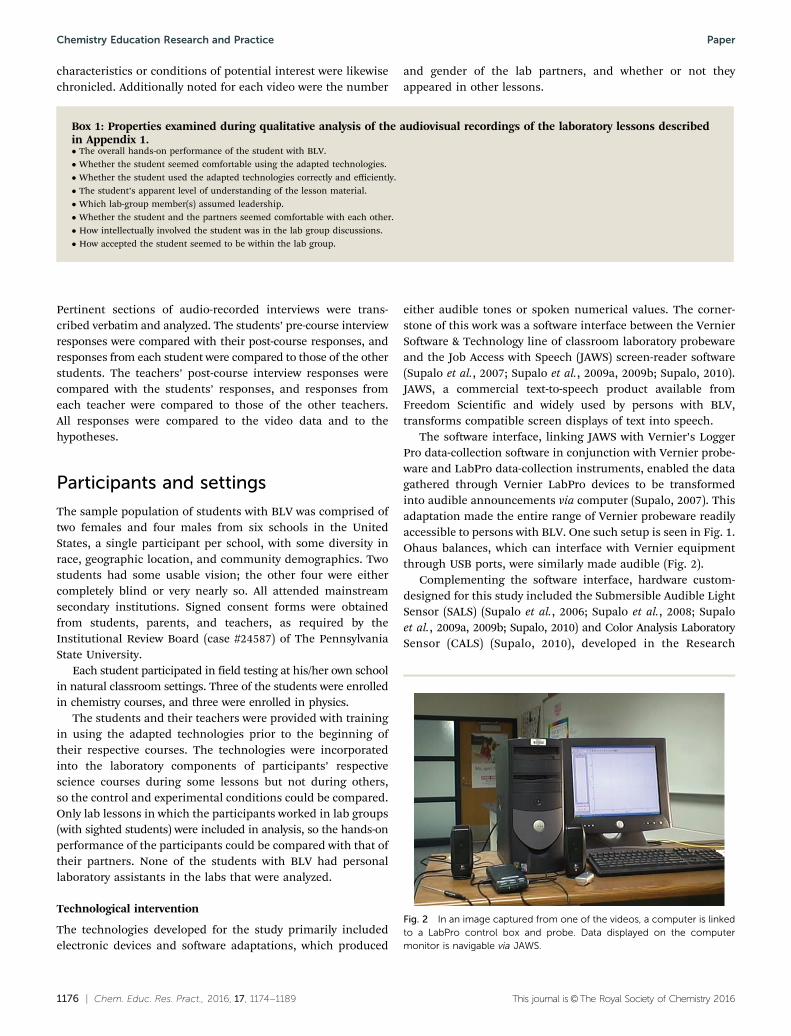
The software interface, linking JAWS with Vernier’s LoggerPro data-collection software in conjunction with Vernier probe-ware and LabPro data-collection instruments, enabled the datagathered through Vernier LabPro devices to be transformedinto audible announcements via computer (Supalo, 2007). Thisadaptation made the entire range of Vernier probeware readilyaccessible to persons with BLV. One such setup is seen in Fig. 1.Ohaus balances, which can interface with Vernier equipmentthrough USB ports, were similarly made audible (Fig. 2).
Complementing the software interface, hardware custom-designed for this study included the Submersible Audible LightSensor (SALS) (Supalo et al., 2006; Supalo et al., 2008; Supaloet al., 2009a, 2009b; Supalo, 2010) and Color Analysis LaboratorySensor (CALS) (Supalo, 2010), developed in the Research
Fig. 2 In an image captured from one of the videos, a computer is linkedto a LabPro control box and probe. Data displayed on the computermonitor is navigable via JAWS.
Chemistry Education Research and Practice Paper

This journal is©The Royal Society of Chemistry 2016 Chem. Educ. Res. Pract., 2016, 17, 1174--1189 | 1177
Instruments Facility in the Chemistry Department at ThePennsylvania State University. The SALS detected whether aliquid was light-transmissive or opaque and emitted eitherspoken frequencies or audible tones. The CALS spoke thecolors of solids, liquids in test tubes, or liquids in beakers,depending on which of three specialized probes were usedwith the control box. The two CALS probes for liquids werenot submersible and were designed to take readings of thecolors of liquids through glass.
Data collection
A large body of data was gathered in the form of audiovisualrecordings of laboratory lessons, audio recordings of pre-/post-course student interviews, and audio recordings of post-courseteacher interviews. Multiple sources of evidence were examinedto provide a layered picture of the conditions and events thatoccurred during the study (Wolcott, 2001; Maxwell, 2005). Amixed-methods approach was used because neither quantitativenor qualitative analysis alone would have been sufficient toaddress the complexities of the research question (Creswell, 2009).
Video data
Of the lessons that were adaptable with the technologies, arandomized assignment process determined which incorporatedthe technologies and which did not. For each participant, a mix ofboth types of lessons as usable video recordings was required.
Labs involving the adapted technologies were labeled I-lessons;those not involving these technologies were N-lessons. A ‘‘lesson’’was defined as a discrete educational unit within the coursematerials, focusing on one concept or a closely related set ofconcepts and having a beginning, middle, and end. While mostlessons took up all or a majority of one class period each, somelessons occupied less than a class period, and some requiredmore than one class period.
One video camera at each school was used by the teacher torecord the participant and his/her lab groups in action. In mostcases, the teacher set up the camera in a static location for theduration of a lab, occasionally adjusting the position as needed.The recordings were burned onto mini-DVD discs, which weremailed to us. Some teachers provided large numbers of audio-visual recordings, while some sent only a few.
Not all audiovisual recordings that were received wereincluded in analysis. For participants who had many recordings,a sample was chosen. For those having a small number, theselections were limited. Lessons were omitted from the studyfor a variety of reasons, such as the camera angle inadequatelyrevealing the activities of the participant and/or the lab grouppartners, or showing labs not involving group partners at all(the participants worked either alone or with the teacher orteacher’s aide).
Interview data
Interviews from scripted sets of questions were conducted pre-and post-course with each participant and post-course with
each teacher. Questions included those related to students’career plans, previous experiences in science classes, interestsin and attitudes toward science, various aspects of laboratoryparticipation, and the adapted technologies (Supalo, 2010).Numerous unscripted questions were also asked to solicitadditional information depending on the answers to scriptedquestions. The interviews were conducted by the first author, achemist who is blind. Interviews were audio-recorded, and allsubstantive discussion was transcribed for analysis (Supalo, 2010).
Data analysis
Of the 54 video-recorded lessons that were received for thestudents in the study, 27 were analyzed: 12 cumulative for thethree schools in Year 2, and 15 cumulative for the three schoolsin Year 3. Thirteen were N-lessons and 14 were I-lessons. Thenumbers of N-lessons and I-lessons were not evenly distributedamong the schools, due to the varying numbers of videos receivedper school and the challenges in selecting usable videos.
For the quantitative data, the activities of the participantand his/her lab group partners were coded for each of theselected video-recorded lessons. Only activities determined tobe ‘‘laboratory-goal-directed actions,’’ or LGDA, were includedin the coding as described in Appendix 2. While lab discussionand setup—as interactive activities that engage students—areknown to contribute to student learning, these activities werenot included in the video coding and analysis because they didnot involve the taking of data with the adaptive technologies.The adapted technologies were designed for taking data, soLGDA was defined as those actions that were approximatelydirected toward data collection, and thus did not include setup,cleanup, reading experimental procedures, discussing, waiting,making calculations, taking notes, or listening to the teacher.
A ‘‘targeted transcript’’ was constructed for each videoanalyzed, briefly describing every instance of LGDA, and indi-cating the beginning and ending time of each. The durations ofthe instances of LGDA were calculated. For each lesson, thetotal number of seconds of LGDA was determined for thestudent with BLV, individual lab group partners, and the groupas a whole. From this, the percent of time engaged (PTE) foreach person in the lab group was calculated, revealing thepercentage of the total LGDA time attributable to specific labgroup members.
Because the number of lab group partners varied from oneto five in the lessons analyzed, PTEs from one lab were oftennot directly comparable to PTEs from other labs. For instance, aparticipant’s PTE of 20% for a lesson would be interpretedquite differently if the student had one partner or five. Conse-quently, to produce an index of participation controlling for thevariation in the number of lab partners across lessons, all PTEswere converted into parity-weighted percentages. This wasaccomplished by multiplying each person’s PTE by the numberof people in the lab group. For example, a participant’s PTE of20% for a group with one partner would be 20 � 2 = 40% parityweighted, meaning that the participant contributed only 40%
Paper Chemistry Education Research and Practice
1178 | Chem. Educ. Res. Pract., 2016, 17, 1174--1189 This journal is©The Royal Society of Chemistry 2016
of parity, while the partner contributed 160%. Conversely, parityin a lab group containing the participant and five partners wouldbe 100/6 = 16.7%, and a PTE of 20% would become 20 � 6 =120% parity weighted, revealing that the participant contributed120% of parity regarding LGDA time. Values greater than 100%meant that a participant contributed more than his/her equalshare of time on LGDA.
The videos were also qualitatively analyzed regarding thehands-on performance of the students with BLV as comparedto their lab partners. Among the features examined were howthe qualitative aspects of their performance compared to theirparity values, whether they used the adapted technologies correctlyand efficiently, how well the two partially sighted students seemedto see in laboratory environments, and how the performance of thestudents with partial vision compared to that of the students whowere fully blind or nearly so.
For the audio interviews with students and teachers, alltranscripts were double-checked for accuracy, and the contentof statements qualitatively analyzed for results. Pre- and post-course statements were compared, as were student and teacherstatements.
Results
Multiple streams of data—videos, student interviews, and teacherinterviews—were used for triangulation of results.
For the quantitative analysis of the videos, the data weretranscribed and encoded using a common set of rules, whichwas allowed to become more detailed with time (Skoog and West,1982). Overall consistency in coding was achieved by recheckingthe set of transcripts near the end of data analysis and makingadjustments as necessary to ensure that all criteria were followed.Minor inconsistencies—such as whether or not a few brief glancesfrom a lab partner at a chemical solution were coded asLGDA—were often ignored if adjustment would have producedonly trivial changes in parity-weighted percentages.
Because all analyses (except the t-tests) were done by oneresearcher, two video-recorded lessons—one each from Years 2and 3—were completely reanalyzed quantitatively as additionalconfirmation of the reliability of the results. These repeatanalyses resulted in BLV parity values very close to the originals.Quantitative and qualitative analyses of the video-recordedlessons were additionally confirmed via multiple viewingsthroughout the analysis process. The authors also conferredregularly and at length, discussing in-depth the results as theydeveloped and reached consensus on ambiguities.
Quantitative (videos): parity-weighted values
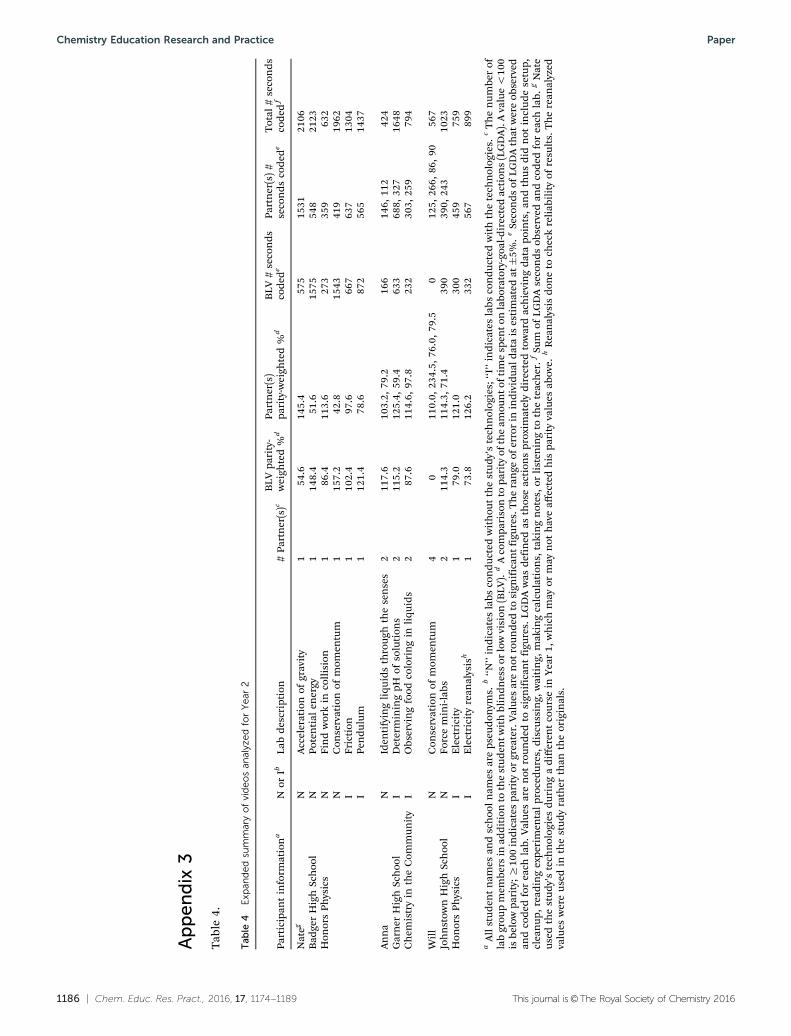
Tables 1 and 2 summarize the findings for each student withBLV. All student names are pseudonyms. See Appendices 3 and4 for complete information.
In Year 2, Nate’s averaged parity-weighted percentage ofparticipation across the four N-lessons (112) was the same ashis I-lesson average. For Anna, the parity-weighted value for thesingle N-lesson (118) was somewhat higher than the average ofthe two I-lessons (102). The values for Will’s two N-lessons werewidely divergent and straddled the value for his single I-lesson.The average of all I-lessons in Year 2 (100) was similar to theN-lesson average (97).
The results for Year 3 more consistently showed a differencebetween the values for N-lessons and I-lessons. All threeparticipants in Year 3 had higher averaged parity-weightedvalues for their I-lessons than for their N-lessons, and theaverage of all I-lessons together (90) was substantially higherthan the N-lesson average (56).
Standard deviations for the averaged values of parity-weighted participation were calculated by pooling the data byyear. For Year 2, the results for N-lessons were 97 � 55 andI-lessons 100 � 19; for Year 3, N-lessons were 56 � 38 andI-lessons 90 � 37. For both years together, overall valuesand standard deviations were N-lessons 78 � 51 and I-lessons93 � 31.
Table 1 Summary of videos analyzed for Year 2
Participant information N or Ia Lab description # Partner(s)b BLV parity-weighted %c
Nated
Honors PhysicsN Acceleration of gravity 1 55N Potential energy 1 148N Find work in collision 1 86N Conservation of momentum 1 157I Friction 1 102I Pendulum 1 121
AnnaChemistry in the Community
N Identifying liquids through the senses 2 118I Determining pH of Solutions 2 115I Observing food coloring in liquids 2 88
WillHonors Physics
N Conservation of momentum 4 0N Force mini-labs 2 114I Electricity 1 74
a ‘‘N’’ indicates labs conducted without the adapted technologies; ‘‘I’’ indicates labs conducted with the technologies. b The number of lab groupmembers in addition to the student with BLV. c A comparison to parity of the amount of time the student with BLV spent on laboratory-goal-directed actions. A value o100 is below parity; Z100 indicates parity or greater. The range of error in individual data is estimated at �5%. d Nateand Dale both used the adapted technologies during different courses in Year 1, which may or may not have affected their parity values listedabove.
Chemistry Education Research and Practice Paper

This journal is©The Royal Society of Chemistry 2016 Chem. Educ. Res. Pract., 2016, 17, 1174--1189 | 1179
Standard deviations are typically used to determine randomerror in replicate measurements of the same quantity(Skoog and West, 1982). However, the parity-weighted valuesin Tables 1 and 2 contain systematic error as well as randomerror, arising from the fact that no two experiments or partici-pants were alike: the students with BLV differed in personality,the teachers differed in personality and teaching approach, thelessons varied in content, the specific adaptive technologiesvaried from one lesson to another, and the interpersonaldynamics among lab group members were highly diverse.
Next, t-tests were used to determine whether the differencesbetween the averaged parity-weighted values of the I-lessonsand N-lessons were significant at a given level of confidence,and statistical significance was found in some of the data.
In the t-test (see eqn (1)) (Skoog and West, 1982), s is theexperimentally determined standard deviation for a given dataset, nI and nN are the numbers of I-lessons and N-lessons,respectively, and t is a statistical quantity that depends on thenumber of degrees of freedom and the chosen confidence limit:
Iavg �Navg 4 ts
ffiffiffiffiffiffiffiffiffiffiffiffiffiffiffiffinI þ nN
nInN
r(1)
The t-test results are summarized in Table 3. In Year 2, whenboth students with partial vision were participants, the averageparity-weighted value of the I-lessons was statistically minimallydifferent from the average parity-weighted value of the N-lessons.In contrast, in Year 3, the parity-weighted average for theI-lessons was statistically greater than the parity-weightedN-lesson average at the 95% confidence level. Pooling bothyears together, a statistically significant difference between theI-lessons and N-lessons was found at the 85% confidence level,but not at the 95% confidence level.
Overall, this analysis supports our prediction that the studentswith BLV in this study (especially those who were blind or nearlyso) would quantitatively experience more hands-on laboratoryparticipation during the I-lessons than during the N-lessons.
For the chemistry lessons (predominant in Year 3), the differ-ence between I-lessons and N-lessons was found to be significantat the 95% confidence level. Statistical significance was not foundat the 95% confidence level for the physics lessons (predominantin Year 2).
Qualitative (videos): insights and revelations
The qualitative data provided a richly detailed and nuancedbody of information, revealing some unexpected findings.Among them was that higher parity-weighted percentages werenot necessarily entirely due to greater frequency and varietyof goal-directed activities. For instance, Ken habitually workedvery slowly and carefully, which biased his results towardhigher parity-weighted values. In fact, the students with BLVas a group often took longer than did the sighted students toaccomplish some tasks—such as manipulating laboratoryapparatus, using supplies, and conducting procedures bothwith and without the adapted technologies—likewise inflatingtheir parity values.
Another finding was that the two partially sighted students,both of them participants during Year 2, could actually see wellenough to take many data points visually during N-lessonsand I-lessons alike. For example, Anna could see the colors ofsolutions and pH strips, and Nate had enough visual acuity toread a meter stick to half-inch accuracy, potentially explainingwhy their I-lesson parity averages differed so little from theirN-lesson parity averages. Nate’s wide differences in individualN-lesson parity values were generally due simply to the volun-tary division of tasks between him and his partner. However,this is not to minimize the fact that Nate and Anna both hadsubstantial visual disabilities.
Table 2 Summary of videos analyzed for Year 3
Participantinformation N or Ia Lab description # Partner(s)b
BLV parity-weighted %c
YasminChemistry
N Diffusion 2 2N Acid base 2 39I Cations and anions 2 32I MgO 3 117I Percent yield 3 71
KenChemistry
N Classification of matter 2 61N Percent yield 2 63I Discovering density 2 83I Average mass 1 102I Families of elements 1 135I Molar volume of a gas 3 36
Daled
PhysicsN Trigonometry 5 50N Acceleration of gravity 5 119I Friction 3 120I Inclined plane 5 112
a ‘‘N’’ indicates labs conducted without the adapted technologies; ‘‘I’’indicates labs conducted with the technologies. b The number of lab groupmembers in addition to the student with BLV. c A comparison to parity ofthe amount of time the student with BLV spent on laboratory-goal-directedactions. A value o100 is below parity; Z100 indicates parity or greater. Therange of error in individual data is estimated at�5%. d Nate and Dale bothused the adapted technologies during different courses in Year 1, whichmay or may not have affected their parity values listed above.
Table 3 Statistical analysis of pooled data
Data set s Degrees of freedom Confidence level (%) t Iavg � Navg ts
ffiffiffiffiffiffiffiffiffiffiffiffiffiffiffiffinI þ nN
nInN
rIavg significantly 4 Navg?
Year 2 14.7 10 95 1.81 3.1 15.6 NoYear 3 29.1 13 95 1.77 34.1 27.2 YesBoth Years 31.7 25 95 1.71 15.6 20.9 NoChemistry 27.5 12 95 1.78 30.0 27.3 YesPhysics 36.9 11 95 1.80 14.7 37.8 No
Paper Chemistry Education Research and Practice

1180 | Chem. Educ. Res. Pract., 2016, 17, 1174--1189 This journal is©The Royal Society of Chemistry 2016
Will exhibited the most unusual set of parity values, withone N-lesson at 0 and another at 114, and the single I-lesson at74. This spread of values would have been difficult to interpretwithout qualitative analysis. In two of the three lessons, Willwas partnered with boys who were obviously his friends. In theN-lesson for which he contributed no LGDA, he did not appearto know his partners well and took no initiative to participate.During the N-lesson with a parity value of 114, he was muchmore verbal and participatory, consistently engaging withhis partners and the educational material. A second majorreason for increased participation in this lesson was a BLV-accessible tactile protractor, which was not among the toolsdeveloped for this study. Using this protractor, Will took thelead by measuring all the angles, with the assistance of hispartners.
Of all the videos analyzed for this study, Will’s I-lesson onelectricity may offer the most striking example of success withthe adapted technologies. Using the JAWS/Logger Pro interface,Will independently took many data points—both voltmeter andammeter values—throughout this lab. He explained to theteacher that he had audible access to Cartesian graphs andtables in addition to meter readouts. His lower parity weight-ing of 74 in this lesson as compared to the N-lesson with 114reflects greatly increased efficiency due to the audible adapta-tion and his highly competent operation of it. During theN-lesson, he’d had to work relatively slowly to measure theangles tactilely, but in this I-lesson he was able to take datapoints quickly and easily. Consequently, the parity value of 74 isa positive result even when compared to the N-lesson valueof 114.
Further evidence of the efficacy of the adapted techno-logies can be found in the qualitative analysis of the otherstudents’ lessons. All of the students used the technologieswith some success. While Nate could see the computer screento a certain degree, he accessed some of the data through theaudible software interface in both of his analyzed I-lessons.Yasmin was observed using the talking balance and SALS;Ken was observed using the talking balance, SALS, andtemperature probe; and Dale was observed using forcemeters. Additional usages of other of the adapted techno-logies were mentioned in some of the interviews. All of theseobserved and reported usages not only increased the amountof hands-on participation for the students, but also increasedthe range of their activities, as they would not have beenable to take many of these types of data without adaptivetechnologies.
In the lessons analyzed, Anna had the least success withthe adapted technologies. While she managed to take somedata with the CALS, she did so not by inserting filledglass beakers into the beaker holder as the device wasdesigned, but by pouring liquids directly into the beakerholder. During the pH lesson, she repeatedly attempted totake pH readings with the SALS, which does not measurepH. However, the interview evidence indicates that sheimproved in her understanding and usage of the techno-logies over time.
Qualitative (interviews): in their own words
While the lessons analyzed represented a portion of the labsfor each course, the interviews covered the entire courseexperience for each participant. Other than mentions of afew glitches and equipment failures, interview evidence fromthe students and teachers was positive regarding the adaptedtechnologies as increasing the students’ hands-on participa-tion during laboratory lessons. In their pre-course interviews,most of the students indicated that they had previously partici-pated only in a very limited fashion during earlier grouplaboratory activities. The following exchange with Anna wasparticularly telling:
Interviewer: At any time previous did you feel in one of thesegroup situations that the group felt you were not contributing a lotto the group? Did you ever get that sense?
Anna: I don’t know if the group ever felt it, but I know I’ve felt it.Because a lot of times if there was something so visual, a lot oftimes they would just do it and they wouldn’t let me do anything forit, even when I would ask, even when I would ask to do something,they would not let me do it at all.
In contrast, during her post-course interview, when askedabout the specific aspect she had enjoyed the most regardingher favorite lab lesson during the study, she said:
Anna: Being able to tell what’s going on and not have peopledescribe it for me.
Interviewer: So you liked to gather that on your own?Anna: Yeah. I like to be independent with everything that I do.In her pre-course interview, Yasmin stated that her earlier
participation in science labs had been mainly as her group’snote-taker:
Interviewer: If you want to elaborate for me a little more onthat, how you participated in science labs in the past. Was itprimarily just as the recorder? You wrote down what they told you?Not much more than that?
Yasmin: Not much more, though sometimes I would ask,because sometimes I would just get so bored that I would ask if Icould stir something, so sometimes I would be the group’s stirrer Iguess. I think that was about it.
Yasmin’s teacher said to the interviewer post-course that, ‘‘Ireally feel like maybe during the other years, she didn’t reallyfeel like she was a part, you know, she was just kind of abystander. Where I think because of your support I’ve beenletting her just be such an active member, a contributingmember of her group. I think that worked really well for her.And for me.’’
Ken had this to say during his post-course interview: ‘‘I reallyliked being able to participate in the labs. With the ILAB tools Ifelt that I was able to participate better than I would have beenable to participate without them. And I really liked being able tohave the hands-on experience.’’ He added: ‘‘The adaptive toolsgave me more freedom in the lab and more chance to do thingsindependently.’’
While all the students and teachers spoke positively aboutthe adapted technologies, perhaps Ken said it best: ‘‘I was ableto do a lot of labs that I might not have been able to do
Chemistry Education Research and Practice Paper
This journal is©The Royal Society of Chemistry 2016 Chem. Educ. Res. Pract., 2016, 17, 1174--1189 | 1181
before. . . That really helped me to realize that I can participatein a visual course like chemistry if I have the right toolsavailable to use.’’
Such quotes from Anna, Yasmin, and Ken are representativeof those found in the interviews for all six students on thecrucial themes of this study. It is clear that, while using theadapted tools, the students felt they experienced less dependencyon others, took on more varied roles in the laboratory, and contri-buted to laboratory activities in new ways.
The qualitative interview data represented here, althoughsmall, is indeed telling to the experiences of the participants.More analysis may reveal statistically significant findings of alarger sample size are possible. Unfortunately, due to variationsin how video and audio recordings were collected as part of thisstudy, it limits the statistical analysis techniques that may yieldresults that are more telling. This was a major limitation of thisstudy and should be improved in future work.
Findings and observations
Three students participated during Year 2 and three studentsduring Year 3, each at a different school. The number ofN-lessons and I-lessons analyzed differed for each student,depending on the number and usability of the videos received.A total of 13 N-lessons and 14 I-lessons were analyzed.
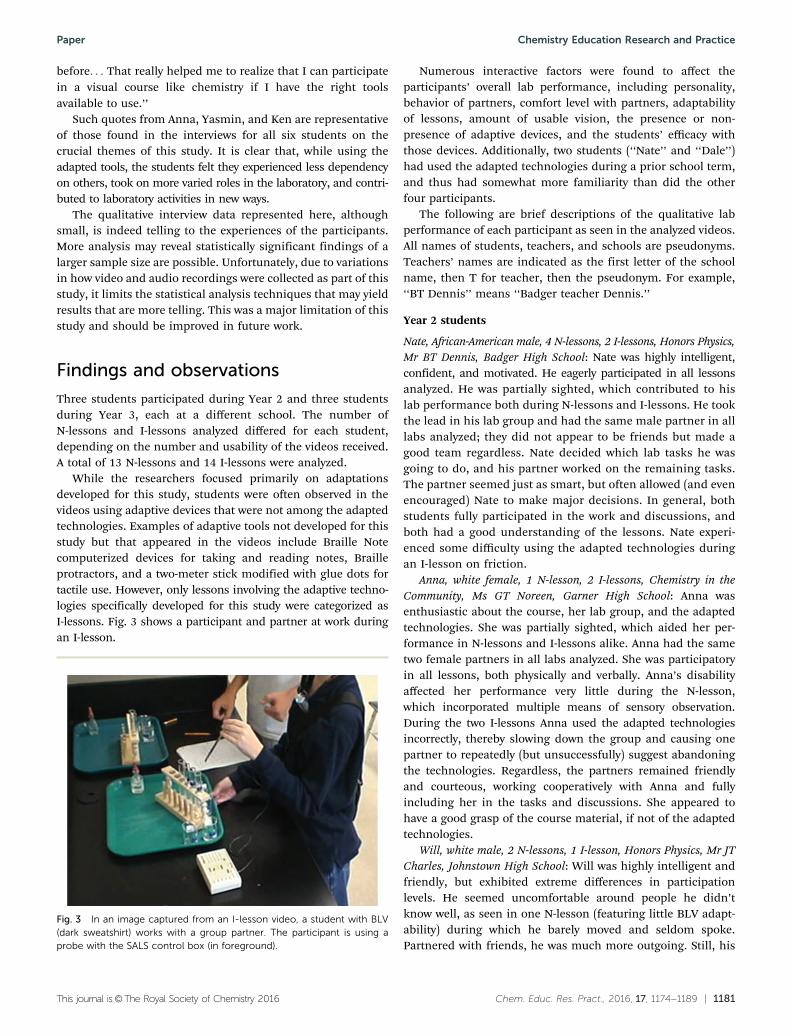
While the researchers focused primarily on adaptationsdeveloped for this study, students were often observed in thevideos using adaptive devices that were not among the adaptedtechnologies. Examples of adaptive tools not developed for thisstudy but that appeared in the videos include Braille Notecomputerized devices for taking and reading notes, Brailleprotractors, and a two-meter stick modified with glue dots fortactile use. However, only lessons involving the adaptive techno-logies specifically developed for this study were categorized asI-lessons. Fig. 3 shows a participant and partner at work duringan I-lesson.
Numerous interactive factors were found to affect theparticipants’ overall lab performance, including personality,behavior of partners, comfort level with partners, adaptabilityof lessons, amount of usable vision, the presence or non-presence of adaptive devices, and the students’ efficacy withthose devices. Additionally, two students (‘‘Nate’’ and ‘‘Dale’’)had used the adapted technologies during a prior school term,and thus had somewhat more familiarity than did the otherfour participants.
The following are brief descriptions of the qualitative labperformance of each participant as seen in the analyzed videos.All names of students, teachers, and schools are pseudonyms.Teachers’ names are indicated as the first letter of the schoolname, then T for teacher, then the pseudonym. For example,‘‘BT Dennis’’ means ‘‘Badger teacher Dennis.’’
Year 2 students
Nate, African-American male, 4 N-lessons, 2 I-lessons, Honors Physics,Mr BT Dennis, Badger High School: Nate was highly intelligent,confident, and motivated. He eagerly participated in all lessonsanalyzed. He was partially sighted, which contributed to hislab performance both during N-lessons and I-lessons. He tookthe lead in his lab group and had the same male partner in alllabs analyzed; they did not appear to be friends but made agood team regardless. Nate decided which lab tasks he wasgoing to do, and his partner worked on the remaining tasks.The partner seemed just as smart, but often allowed (and evenencouraged) Nate to make major decisions. In general, bothstudents fully participated in the work and discussions, andboth had a good understanding of the lessons. Nate experi-enced some difficulty using the adapted technologies duringan I-lesson on friction.
Anna, white female, 1 N-lesson, 2 I-lessons, Chemistry in theCommunity, Ms GT Noreen, Garner High School: Anna wasenthusiastic about the course, her lab group, and the adaptedtechnologies. She was partially sighted, which aided her per-formance in N-lessons and I-lessons alike. Anna had the sametwo female partners in all labs analyzed. She was participatoryin all lessons, both physically and verbally. Anna’s disabilityaffected her performance very little during the N-lesson,which incorporated multiple means of sensory observation.During the two I-lessons Anna used the adapted technologiesincorrectly, thereby slowing down the group and causing onepartner to repeatedly (but unsuccessfully) suggest abandoningthe technologies. Regardless, the partners remained friendlyand courteous, working cooperatively with Anna and fullyincluding her in the tasks and discussions. She appeared tohave a good grasp of the course material, if not of the adaptedtechnologies.
Will, white male, 2 N-lessons, 1 I-lesson, Honors Physics, Mr JTCharles, Johnstown High School: Will was highly intelligent andfriendly, but exhibited extreme differences in participationlevels. He seemed uncomfortable around people he didn’tknow well, as seen in one N-lesson (featuring little BLV adapt-ability) during which he barely moved and seldom spoke.Partnered with friends, he was much more outgoing. Still, his
Fig. 3 In an image captured from an I-lesson video, a student with BLV(dark sweatshirt) works with a group partner. The participant is using aprobe with the SALS control box (in foreground).
Paper Chemistry Education Research and Practice

1182 | Chem. Educ. Res. Pract., 2016, 17, 1174--1189 This journal is©The Royal Society of Chemistry 2016
participation in lab tasks and discussions was largely depen-dent on whether he had adaptive tools for data collection.He also appeared to have better understanding of the lessonmaterial when using adaptive devices. When both partneredwith friends and having adaptive devices, he became highlyparticipatory—physically, verbally, and intellectually. Duringthese occasions, as evidenced during an N-lesson involving aBraille protractor and an I-lesson incorporating an audibleadaptation, he was a full partner in his group and sometimesthe leader.
Year 3 students
Yasmin, white female, 2 N-lessons, 3 I-lessons, Chemistry, Ms CTHannah, Carter High School: Yasmin had a quick mind andgenerally an excellent grasp of the material. Various combinationsof cheerful female partners appeared in the lessons, all of whomseemed to be friends or acquaintances, and among whom Yasminwas fairly well socially included. However, most of her lab actionswere closely hand-guided by the partners, rendering many ofher physical contributions trivial and superfluous. Her partnersseemed very fond of her, but were helpful to the verge ofpatronization. Nonetheless, Yasmin followed the action duringlessons by listening, participating in discussions, and askingquestions. It was unclear how well she understood theadapted technologies: her observed use of the balance waslimited to listening to the JAWS readout rather than operatingthe equipment, and she had some trouble with the SALSduring an I-lesson.
Ken, white male, 2 N-lessons, 4 I-lessons, Chemistry, Ms CTYvonne, Crystal Lake High School: Ken was bright, friendly, andeasy-going. He and the teacher had minor difficulties with theadapted technologies, but Ken was able to use them success-fully once the issues were resolved. He did not have the sameset of partners twice in the lessons analyzed, which resulted invery different interpersonal dynamics from lab to lab, andlarge variations in the amount and quality of his participation.Both N-lessons offered substantial tactility, and the partnersworked alongside him fairly well. In three I-lessons, somepartners treated him as a full group member, while othersin the same groups rarely interacted with him. In a fourthI-lesson (having three partners instead of one or two) thepartners generally did not involve Ken but instead workedwith each other. Ken looked uncomfortable throughout thislesson, and indicated confusion regarding lab activities and workprogress.
Dale, white male, 2 N-lessons, 2 I-lessons, Physics, Mr ST Robert,Stevens High School: With five partners, Dale had the largest labgroups in the study, and the same partners throughout thelessons analyzed. He also exhibited the most confusion. Whilehe possessed access to the same information as did his partners,his utterances primarily were questions rather than contribu-tions to discussions. His partners were generally attentive, butsometimes ignored his queries in favor of focusing on the work.He participated well in one N-lesson that featured tactile oppor-tunities, but the other offered little means of involvement.He participated fairly well during one I-lesson, aided by his
confident use of the adapted technologies and having onlythree partners rather than five, but still asked many questions.During the other I-lesson he used the technologies withdifficulty, seemed ill-prepared to understand the material,and repeatedly missed key verbal information.
Interview evidence
The interviews largely corroborated the video data, and provideda rich source of additional information. All six participantsreported having had a positive overall experience with theadapted technologies, despite a few technological hiccups.
According to Nate’s teacher: ‘‘He loved diving into all labs.He wasn’t apprehensive at all, he just dove right into them andaway he went.’’ BT Dennis said Nate characteristically took thelead in his group. Both BT Dennis and Nate mentioned havingtrouble locating the statistics for graphs. (However, as theinterviewer pointed out, a JAWS-accessible statistics functionexists within the Logger Pro analysis menu.) Otherwise, BT Dennissaid Nate was efficacious with the adapted technologies.
According to Anna and her teacher, Anna improved in heruse of the adapted technologies over time. Regarding her usuallab partners, ‘‘I felt very accepted,’’ Anna said. ‘‘Everyone justtreated me like a normal person.’’ However, GT Noreen said, whenAnna was placed with different partners (in some unanalyzedlessons), ‘‘I think she had more difficulties feeling part of thegroup, and she didn’t have as many responsibilities. They kindof took the responsibilities.’’
Speaking about Will’s I-lesson on electricity, ‘‘It was funwatching him get JAWS cranked up and listening intently forthe current and voltage readings,’’ said JT Charles. ‘‘Anythingthat involved the computer as data collector and data processorwere easy for Will to do—simply because he is so incrediblyfacile with the stuff.’’ In contrast to the researchers’ observationsregarding Will’s overall group participation, JT Charles said:‘‘Everybody worked together and Will was just a member ofthe full team.’’ He described a lab (not among those analyzed) inwhich Will’s team was randomly chosen but within which Willhad especially excelled.
Yasmin and CT Hannah mentioned difficulties with severalof the adapted technologies, but eventually finding successwith most of them. ‘‘I was able to help out and contribute,and be able to actually tell my group information rather thanmy group telling me information,’’ Yasmin said. ‘‘I enjoyedbeing able to contribute, which I thought was just very, verydifferent than what I’m used to.’’ Of the partners, CT Hannahsaid, ‘‘They knew when to push and when to help, and when tomake her do it herself,’’ which runs counter to the researchers’observations.
‘‘I would generally try and work with different people eachtime just to get a different experience each time,’’ said Ken. CTYvonne said: ‘‘What I did was I would change around, like, hewould have a different group.’’ Of the adapted technologies,Ken said, ‘‘I felt like when I had the tools I was able toparticipate more fully, and I felt more included in the group.’’CT Yvonne said, ‘‘Ken worked very well with the other kidsin the group. He’s flexible and he goes with the flow on
Chemistry Education Research and Practice Paper

This journal is©The Royal Society of Chemistry 2016 Chem. Educ. Res. Pract., 2016, 17, 1174--1189 | 1183
everything.’’ However, the researchers observed, going with theflow sometimes meant going along with being ignored.
Dale said, ‘‘You have to get a lot of information askingquestions, ask questions, asking, you know, what was goingon.’’ Of his partners, he stated, ‘‘They were trying to do the labas well, and I don’t think they really had the time to reallyexplain everything.’’ Regarding the suite of technologies, STRobert said, ‘‘It gave him power because he really was on top ofthat stuff, and he knew how to use it. And [Dale’s partners] werevery impressed, as was I, with his ability to manipulate thecomputer and get the data out just by the voice commands. . .
He was very adept at that.’’
STEM attitudes and interest
Yasmin presented the most striking example of a turnaround inattitude and interest. She described her prior laboratory scienceexperiences, in which her lab groups had simply told her theirobservations, as having been ‘‘dull.’’ She said: ‘‘Previously,I kind of felt like, ‘Okay, what’s the answer?’ Like I didn’t reallycare because I didn’t feel like I had to care. You know, like,other people were doing [the lab work]. Why, what was thepurpose of me caring?’’
In contrast, during her post-course interview, Yasmin saidchemistry had been ‘‘one of my favorite classes.’’ Regarding herlab group and the adapted technologies, she said, ‘‘I definitelyfelt more involved when I was using the tools in helpingthem. . . It just made everything more interesting, you know?’’CT Hannah agreed: ‘‘Chemistry is now her favorite science, andit’s mainly just because of the things that she’s been able to doin my class.’’ While previously Yasmin had mentioned govern-ment as a potential profession, post-course she said: ‘‘I actuallyhave been considering maybe going into some sort of science. . .
I definitely enjoyed science a lot more. I think it’s the mostinteresting thing in the universe.’’
Will also indicated great enthusiasm in his post-courseinterview: ‘‘Well, I loved the course material. I absolutely lovedit. And it told me that there’s no reason I can’t delve into thisand keep on going. . . [It] really piqued my interest, and so that’sreally what this course has done.’’ He added: ‘‘Overall it wasincredible. . . So it’s really just been a life-changing thing.’’Regarding his career, he said, ‘‘It’s got to involve science,engineering, physics.’’
While Nate and Ken said they had enjoyed their respec-tive laboratory science courses, both indicated an interestin the legal profession. Nevertheless, in his post-course inter-view, Ken said, ‘‘When I was allowed to use the tools, thelabs seemed more interesting to me because I was able toparticipate more fully, and also because I was able to havehands-on access to the data instead of having to ask peoplewhat the thermometer was reading or what the balance wasreading.’’
Anna likewise reflected positively on her experience, saying‘‘Chemistry class was a lot of fun for me,’’ and ‘‘I loved it.’’However, like Nate and Ken, she did not veer far from her initialcareer interests. She went from wanting to become a teacher
of students with visual impairments (pre-course) to wanting toteach either math or special education (post-course).
While Dale said ‘‘I’ve never been very fond of mathematics,’’he also stated that he had ‘‘enjoyed’’ the course and that it‘‘gave me a little bit of an understanding of physics.’’ His careeraspirations were in music or teaching cane travel (orientationand mobility with the use of a white cane). ‘‘I’m not reallythinking of wanting to become a physicist or a chemist,’’he said.
Where they are now
The students from this study are becoming a remarkable groupof adults. When last heard from, Yasmin was majoring inphysics in college and was also pursuing her interest in federalgovernment. Nate was majoring in political science. Ken wasparticipating in local governmental activities and planning tomajor in political science. Anna was studying toward becoming aspecial education teacher. Dale was considering majoring inurban studies and maintained an interest in teaching canetravel. During the study, will had been dealing with a majorillness; the researchers have not been able to establish howhe fared.
Limitations
The analyzed videos and interviews provide a detailed andconcrete record of student activity; however, we acknowledgethe complexities of such data, including ambiguous actionsof participants, some activity occurring partially or entirelyoff-screen, portions of videos being silent due to microphonenon-use or malfunction, backs sometimes being turned to thecamera, and so forth. Factors of these types were an inevitableconsequence of efforts to minimize observer effects. We alsorecognize that different results might have been achieved had adifferent sampling of videos been selected for analysis.
As previously mentioned, other limitations included the largenumber of variables, attributable to conducting research innatural classroom settings; not receiving a video of every labora-tory lesson from every teacher; small participant sample size,exacerbated by the circumstance that two of the six participantspossessed substantial usable vision; and the insufficiency forsome participants of the pre-intervention technology training,leading to occasional participant frustration with the study’sadaptive tools.
The primary weakness of the study was the large number ofvariables: schools, teachers, partners, lessons. However, thesewere variations to be expected in natural classroom environments.Other issues included the less-than-optimal quality of somevideos, occasional malfunction of the adapted technologies, andinsufficient teacher/student training. Many of the students andteachers had difficulties with the technologies during lab lessons;having had only a single training session at the beginning ofthe school term likely contributed to misuse or non-use of somedevices. More training and support is recommended for anyfuture similar studies.
Paper Chemistry Education Research and Practice
1184 | Chem. Educ. Res. Pract., 2016, 17, 1174--1189 This journal is©The Royal Society of Chemistry 2016
Conclusions
Substantial support for our predictions was found, althoughthis support was stronger for the participants who wereblind or very nearly so than for those who were partiallysighted. This is likely because the partially sighted studentscould take some data visually, which contributed to theirperformance across the board. Overall, this research sug-gests that low-cost technological adaptations, such as theaudible software interface and electronic devices used inthis study, can enable students with BLV to have a morehands-on experience in science laboratory settings. Becauseongoing advances in BLV adaptations are necessary to keeppace with mainstream laboratory classroom technologies,the ILAB study extends the work on earlier adaptive techno-logies and classroom activities found to be useful for sciencestudents having BLV.
Support was found for Hypothesis #3, particularly in thecase of Will and, to lesser extents, Dale, Yasmin, and Ken.Will went from being mostly silent in one N-lesson to fullpartner in an I-lesson (but also took the lead during part ofthe other N-lesson). Dale often spoke with assurance duringone I-lesson (but also offered substantial discussion duringone N-lesson), and Yasmin said she enjoyed being a providerof information when using the technologies. Ken may havebeen somewhat more involved in discussions during someI-lessons, but his partners were a greater factor than was thepresence of the technologies. Nate and Anna were confidentgo-getters, and their participation in discussions was essen-tially unaffected.
Support was likewise found for Hypothesis #4, most clearlyillustrated by Ken’s interview statement regarding groupinclusion. Further support was found in ST Robert’s commentabout the lab partners being impressed with Dale’s use of thetechnologies (although Dale’s frequent state of confusion wasa substantially negative factor). Will may have had greatersocial acceptance when using adaptive technologies, butanother powerful influence was whether he was partneredwith friends. While Anna stated that she had felt accepted,this was in reference to her lab group in general and notI-lessons versus N-lessons. Anna may actually have experi-enced somewhat reduced acceptance when using the adaptedtechnologies incorrectly. Yasmin’s social acceptance appearedlittle affected, and Nate had no issues with social acceptanceeither with or without the technologies.
Hypotheses #5 and #6 found support in the interviewevidence, particularly for Yasmin and Will. Yasmin went fromreporting apathy and boredom to finding great enjoyment andinterest in science. Will raved about his experience, calling it‘‘life-changing.’’ Ken said he had found lab lessons moreinteresting when using the technologies. All participants saidthey enjoyed their respective courses and had found themengaging.
Yasmin’s new-found passion for science was punctuated byher choice of physics as college major, providing the strongestsupport for Hypothesis #7.
Additional observations can also be made, such as that theparticipants were more included in their lab groups, bothsocially and physically, when they actively included themselves.Some students did this in every lesson analyzed, while othersexhibited varying levels of self-inclusion. The basic conditionsfor reliable self-inclusion appeared to be:� Comfort with the group partners� Receptiveness of the group partners� Basic understanding of the lesson� Existence of accessible lab tasksOften this meant generally working with the same people,
as did Nate and Anna, or with combinations of the samepeople, as did Yasmin. Will did best when partnered withfriends and when lab tasks were accessible. Ken did best whenworking with people who were receptive to working withhim. Dale performed well when he had accessible tasks, wasencouraged by his partners, and was prepared to understandthe lesson. Lab-group size may also be a factor, as some evidencesuggested that participants were more successful in smallergroups.
Obviously, the selection of group partners for studentswith BLV is a crucial matter, as is the accessibility of tasks,which is achievable both through the incorporation oflow-cost adaptations and the tactility of certain activities.Participants appeared to be more accepted as working mem-bers within receptive groups when there were substantivelab tasks they could do, either with or without adaptations.However, the adapted technologies clearly enhanced theoverall experience of laboratory science for the participants,and all six indicated having had some positive engagementwith them.
Implications and recommendations
The finding that the students with BLV often required moretime than did sighted students to accomplish some laboratorytasks suggests that future work must blend quantitative mea-surement with analysis of time on task to produce a measureincorporating both the length of time and effective use of time.Establishing means to better control for the many variableswould also be valuable for future research, as would morethorough training for participants on experimental techno-logies prior to use in interventions.
As adaptive technologies and methodologies continue to becreated and modified over time, research regarding the efficacyof new developments should be conducted through quantitativeand qualitative measures. Research should also be conductedon various educational outcomes including learning andachievement. The goal must be continuous innovation andimprovement in laboratory adaptations for students with BLV,leading to greater facilitated access to the laboratory sciencesand increased educational parity.
Practitioners can take home from this study that moreaccess technology innovation is necessary in the STEM fieldsof study. Their future involvement through the sharing of
Chemistry Education Research and Practice Paper
This journal is©The Royal Society of Chemistry 2016 Chem. Educ. Res. Pract., 2016, 17, 1174--1189 | 1185
their experiences with students with visual impairments inthe chemical education literature would greatly enhanceresearch in this area. Most research in this area involvesindividual situations that serve as excellent case studies.The more situations that can be documented and shared inthe literature will serve as valuable resources to both practi-tioners and researchers. Approaches to teaching chemistryin a hands-on way to students with visual impairments is onlyin its infancy stages. This work represents one illustrativeexample of what is possible. More contributions are still neces-sary to address other specific aspects in general chemistry andeven more so in upper level chemistry courses. These techno-logies described here were designed to encourage studentswith BVI that they can make significant intellectual contribu-tions as part of a laboratory team. Further, this work serves asan example of what is possible for students with BVI in thechemistry laboratory and is intended to raise the expectation ofchemistry educators. Much work still is necessary to insurechemistry and other science courses can be as inclusive aspossible.
Appendix 1: criteria and guidelinesfor qualitative video analysis
For each lab analyzed, include a one-phrase description of thelaboratory lesson in the title of the analysis. Within the quali-tative analysis for each video-recorded lesson, note:� How well the student with BLV seems to see, if at all.� How the performance of the students with significant
partial vision compares to that of the students with little orno usable vision.� Which of the study’s adaptive technologies were used.� The BLV student’s apparent level of ease in using the
study’s adaptive technologies.� Whether the student with BLV used the study’s adaptive
technologies correctly.� Whether the student with BLV used the study’s adaptive
technologies efficiently.� Whether the student with BLV appeared willing and eager
to physically participate in the laboratory lesson.� Whether the student with BLV appeared willing and eager
to intellectually participate in the laboratory lesson.� The BLV student’s and the group partners’ apparent level
of comfort with each other.� The BLV student’s apparent level of interest in the labora-
tory proceedings.� Whether and how the lab group partners took any data
points from the usage of the study’s technologies.� Any other pertinent observations regarding utterances or
actions occurring during the laboratory lesson.� How the qualitative analysis supports or does not support
the quantitative analysis.� Recognizing that ambiguities are inherent in human
behavior, the data analyst’s best judgment shall be used in
reporting observations, consulting with the other researchersas necessary to achieve clarity and consensus
Appendix 2: video-coding guidelinesfor quantitative analysis
Only activities determined to be laboratory-goal-directedactions, or LGDA, shall be coded for analysis. LGDA is definedas those actions proximately directed toward achieving datapoints. The beginning and ending time of each instance ofLGDA for the student with BLV and each of his/her lab grouppartners is to be recorded to the closest second on the video’stime counter.� All instances of LGDA by the student with BLV and each
group partner are to be noted for inclusion in analysis, regard-less of whether the study’s adaptive technologies were usedduring those actions.� When the group partners use the study’s adaptive tech-
nologies, this shall be coded as LGDA the same as when thestudent with BLV uses the technologies.� When JAWS and/or one of the study’s technologies pro-
duces audible data, this is to be coded as LGDA for everyone inthe lab group who actively listens to JAWS or the technologiesto learn the data.� When a computer is used in conjunction with the study’s
adaptive technologies to take data, this is to be coded as LGDAfor all lab group members who actively watch the computermonitor to learn the data.� When the student with BLV and/or one of the partners is
working with a computer, care must be taken to distinguishwhether this activity is directed toward taking data (which is tobe coded as LGDA), or involves reading the experimentalprocedure, making calculations, or taking notes (which arenot to be coded as LGDA).� Looking at and/or listening to laboratory equipment or
materials with the intent of gathering data-related informationshall be coded as LGDA.� Pointing or gesturing at laboratory equipment or materials
to draw attention to data-related information shall be codedas LGDA.� When an action is ambiguous as to whether or not it is
LGDA, the data analyst’s best judgment shall be used, consult-ing with the other researchers as necessary to achieve clarityand consensus.� With physics labs, care must be taken to recognize that
some activities seeming to be setup are actually LGDA in caseswhen figuring out how to arrange the setup is part of theexperiment itself, rather than preparation for the experiment.� Not to be coded as LGDA are setup, cleanup, reading
experimental procedures, discussing, waiting, making calcula-tions, taking notes, drawing diagrams, doing lab write-up, orlistening to the teacher.� Not to be coded as LGDA are attempts to get one of the
study’s technologies to work prior to using it in the laboratoryexperiment.
Paper Chemistry Education Research and Practice
1186 | Chem. Educ. Res. Pract., 2016, 17, 1174--1189 This journal is©The Royal Society of Chemistry 2016
Ap
pe
nd
ix3
Tab
le4.
Tab
le4
Exp
and
ed
sum
mar
yo
fvi
de
os
anal
yze
dfo
rY
ear
2
Part
icip
ant
info
rmat
ion
aN
orIb
Lab
des
crip
tion
#Pa
rtn
er(s
)cB
LVpa
rity
-w
eigh
ted
%d
Part
ner
(s)
pari
ty-w
eigh
ted
%d
BLV
#se
con
ds
cod
ede
Part
ner
(s)
#se
con
ds
cod
ede
Tot
al#
seco
nd
sco
ded
f
Nat
eg
Bad
ger
Hig
hSc
hoo
lH
onor
sPh
ysic
s
NA
ccel
erat
ion
ofgr
avit
y1
54.6
145.
457
515
3121
06N
Pote
nti
alen
ergy
114
8.4
51.6
1575
548
2123
NFi
nd
wor
kin
coll
isio
n1
86.4
113.
627
335
963
2N
Con
serv
atio
nof
mom
entu
m1
157.
242
.815
4341
919
62I
Fric
tion
110
2.4
97.6
667
637
1304
IPe
nd
ulu
m1
121.
478
.687
256
514
37
An
na
Gar
ner
Hig
hSc
hoo
lC
hem
istr
yin
the
Com
mu
nit
y
NId
enti
fyin
gli
quid
sth
rou
ghth
ese
nse
s2
117.
610
3.2,
79.2
166
146,
112
424
ID
eter
min
ing
pHof
solu
tion
s2
115.
212
5.4,
59.4
633
688,
327
1648
IO
bser
vin
gfo
odco
lori
ng
inli
quid
s2
87.6
114.
6,97
.823
230
3,25
979
4
Wil
lJo
hn
stow
nH
igh
Sch
ool
Hon
ors
Phys
ics
NC
onse
rvat
ion
ofm
omen
tum
40
110.
0,23
4.5,
76.0
,79
.50
125,
266,
86,
9056
7N
Forc
em
ini-
labs
211
4.3
114.
3,71
.439
039
0,24
310
23I
Ele
ctri
city
179
.012
1.0
300
459
759
IE
lect
rici
tyre
anal
ysis
h1
73.8
126.
233
256
789
9
aA
llst
ud
ent
nam
esan
dsc
hoo
lnam
esar
eps
eud
onym
s.b
‘‘N’’
ind
icat
esla
bsco
nd
uct
edw
ith
out
the
stu
dy’
ste
chn
olog
ies;
‘‘I’’
ind
icat
esla
bsco
nd
uct
edw
ith
the
tech
nol
ogie
s.c
Th
en
um
ber
ofla
bgr
oup
mem
bers
inad
dit
ion
toth
est
ud
entw
ith
blin
dn
ess
orlo
wvi
sion
(BLV
).d
Aco
mpa
riso
nto
pari
tyof
the
amou
nto
ftim
esp
ento
nla
bora
tory
-goa
l-dir
ecte
dac
tion
s(L
GD
A).
Ava
lueo
100
isbe
low
pari
ty;Z
100
ind
icat
espa
rity
orgr
eate
r.V
alu
esar
en
otro
un
ded
tosi
gnif
ican
tfi
gure
s.T
he
ran
geof
erro
rin
ind
ivid
ual
dat
ais
esti
mat
edat�
5%.
eSe
con
ds
ofLG
DA
that
wer
eob
serv
edan
dco
ded
for
each
lab.
Val
ues
are
not
rou
nd
edto
sign
ific
ant
figu
res.
LGD
Aw
asd
efin
edas
thos
eac
tion
spr
oxim
atel
yd
irec
ted
tow
ard
ach
ievi
ng
dat
apo
ints
,an
dth
us
did
not
incl
ud
ese
tup,
clea
nu
p,re
adin
gex
peri
men
tal
proc
edu
res,
dis
cuss
ing,
wai
tin
g,m
akin
gca
lcu
lati
ons,
taki
ng
not
es,o
rli
sten
ing
toth
ete
ach
er.
fSu
mof
LGD
Ase
con
ds
obse
rved
and
cod
edfo
rea
chla
b.g
Nat
eu
sed
the
stu
dy’
ste
chn
olog
ies
du
rin
ga
diff
eren
tco
urs
ein
Yea
r1,
wh
ich
may
orm
ayn
oth
ave
affec
ted
his
pari
tyva
lues
abov
e.h
Rea
nal
ysis
don
eto
chec
kre
liab
ilit
yof
resu
lts.
Th
ere
anal
yzed
valu
esw
ere
use
din
the
stu
dy
rath
erth
anth
eor
igin
als.
Chemistry Education Research and Practice Paper

This journal is©The Royal Society of Chemistry 2016 Chem. Educ. Res. Pract., 2016, 17, 1174--1189 | 1187
Appendix 4
Table 5.
Conflicts of interest
Supalo is president and founder of Independence Science, acompany for which Humphrey has done some minor consulting.The other authors declare no competing financial interest.
Acknowledgements
This work was supported by the National Science Foundationunder Research in Disability Education grant HRD-0726417.We thank the schools, teachers, parents, and especially thestudents who participated in this study. We also thank DavidHulce for designing the abstract graphic.
References
Allum J. R., (2010), Annual Salary and Employment Survey 2009,Washington D. C.: American Chemical Society.
Bonifacio V. D. B., (2012), QR-Coded Audio Periodic Table ofthe Elements: A Mobile-Learning Tool, J. Chem. Educ., 89(4),552–554.
Boyd-Kimball D., (2012), Adaptive Instructional Aids for Teachinga Blind Student in a Nonmajors College Chemistry Course,J. Chem. Educ., 89(11), 1395–1399.
Bromfield-Lee D. C. and Oliver-Hoyo M. T., (2007), A QualitativeOrganic Analysis that Exploits the Senses of Smell, Touch,and Sound, J. Chem. Educ., 84(12), 1976–1978.
Bromfield-Lee D. C. and Oliver-Hoyo M. T., (2009), An Esteri-fication Kinetics Experiment that Relies on the Sense ofSmell, J. Chem. Educ., 86(1), 82–84.
Bryan A. H., (1952), Chemistry for the Blind, Sci. Educ., 36,91–95.
Bryan A. H., (1957), General Science for the Blind, Sci. Educ., 41,26–30.
Burke E. A., (1932), Laboratory Work in Science for the Blind,The Teachers Forum, 4, 48–49.
Creswell J. W., (2009), Research Design: Qualitative, Quantitative,and Mixed Methods Approaches, 3rd edn, Los Angeles: SAGEPublications.
DeLucchi L. and Malone L., (1982), SAVI (Science Activities forthe Visually Impaired), in Mangold S., (ed.) A Teacher’s Guideto the Special Educational Needs of Blind and Visually
Table 5 Expanded summary of videos analyzed for Year 3
Participantinformationa N or Ib Lab description
#Partner(s)c
BLV parity-weighted %d
Partner(s) parity-weighted %d
BLV # secondscodede
Partner(s) # secondscodede
Total # secondscoded f
YasminCarterHigh SchoolChemistry
N Diffusion 2 1.8 156.0, 142.2 4 353, 322 679N Acid base 2 39.0 110.4, 150.6 271 766, 1047 2084I Cations and anions 2 32.4 202.5, 65.1 87 541, 174 802I MgO 3 116.8 76.8, 103.2, 103.2 320 210, 282, 283 1095I Percent yield 3 71.2 173.2, 96.4, 59.2 282 686, 383, 235 1586
KenCrystal LakeHigh SchoolChemistry
N Classificationof matter
2 60.7 106.6, 132.7 186 327, 407 920
N Percent yield 2 63.4 105.4, 131.2 187 311, 387 885I Discovering density 2 83.1 210.3, 6.6 137 347, 11 495I Average mass 1 102.4 97.6 279 266 545I Families of elements 1 139.8 60.2 458 197 655I Families of elements
Reanalysisg1 135.0 65.0 454 219 673
I Molar volumeof a gas
3 36.0 189.5, 142.3, 32.2 67 353, 265, 60 745
Daleh
StevensHigh SchoolPhysics
N Trigonometry 5 50.4 351.0, 50.4, 112.2,15.0, 21.0
43 300, 43, 96, 13, 18 513
N Acceleration ofgravity
5 119.4 339.6, 58.8, 70.2,12.0, 0
200 569, 99, 118, 20, 0 1006
I Friction 3 119.6 90.4, 91.2, 98.8 347 263, 265, 287 1162I Inclined plane 5 112.4 149.1, 92.0, 89.0,
59.5, 98.0187 248, 153, 148,
99, 163998
a All student names and school names are pseudonyms. b ‘‘N’’ indicates labs conducted without the study’s technologies; ‘‘I’’ indicates labsconducted with the technologies. c The number of lab group members in addition to the student with blindness or low vision (BLV).d A comparison to parity of the amount of time spent on laboratory-goal-directed actions (LGDA). A value o100 is below parity; Z100 indicatesparity or greater. Values are not rounded to significant figures. The range of error in individual data is estimated at �5%. e Seconds of LGDA thatwere observed and coded for each lab. Values are not rounded to significant figures. LGDA was defined as those actions proximately directedtoward achieving data points, and thus did not include setup, cleanup, reading experimental procedures, discussing, waiting, making calculations,taking notes, or listening to the teacher. f Sum of LGDA seconds observed and coded for each lab. g Reanalysis done to check reliability of results.The reanalyzed values were used in the study rather than the originals. h Dale used the study’s technologies during a different course in Year 1,which may or may not have affected his parity values above.
Paper Chemistry Education Research and Practice
1188 | Chem. Educ. Res. Pract., 2016, 17, 1174--1189 This journal is©The Royal Society of Chemistry 2016
Handicapped Children, 1st edn, New York: American Founda-tion for the Blind, pp. 72–93.
Dewey J., (1938), Experience and Education, New York: Macmillan.Division of Science Resources Statistics, (2003), Women, Minorities,
and Persons with Disabilities in Science and Engineering: 2002,Arlington: National Science Foundation.
French R. S., (1924), General Science: A Necessary Factor in aModern Curriculum, in Proceedings of the 27th BiennialConvention of the American Association of Instructors of theBlind, Watertown: American Association of Instructors of theBlind, pp. 152–154.
Garrido-Escudero A., (2013), Using a Hands-On Method to HelpStudents Learn Inorganic Chemistry Nomenclature via Assemblyof Two-Dimensional Shapes, J. Chem. Educ., 90(9), 1196–1199.
Harshman J., Lowery Bretz S. Yezierski E., (2013), SeeingChemistry through the Eyes of the Blind: A Case StudyExamining Multiple Gas Law Representations, J. Chem.Educ., 90(6), 710–716.
Linn M. C. and Thier H. D., (1975), Adapting Science Materialfor the Blind (ASMB): Expectation for Student Outcomes,Sci. Educ., 59(2), 237–246.
Long R. E., (1940), The Importance of a Laboratory in ScienceClasses—What Shall Be in It? in Proceedings of the 35thBiennial Convention of the American Association of Instructorsof the Blind, Washington D. C.: American Association ofInstructors of the Blind, pp. 173–175.
Long N. T., (1973), Science Curriculum Improvement Study (SCIS):Its Effect on Concept Development and Manipulative Skills inVisually Handicapped Children, PhD University of California,Berkeley.
Lynch S., Taymans J., Watson W. A., Ochsendorf R. J., Pyke C.and Szesze M., (2007), Effectiveness of a Highly RatedScience Curriculum Unit for Students with Disabilities inGeneral Education Classrooms, Exceptional Children, 73(2),202–223.
Maxwell J. A., (2005), Qualitative Research Design: An InteractiveApproach, 2nd edn, Thousand Oaks: SAGE Publications.
Miner D. L., Nieman R., Swanson A. B. and Woods M., (2001),Teaching Chemistry to Students with Disabilities: A Manual forHigh Schools, Colleges, and Graduate Programs, 4th edn,Washington D.C.: American Chemical Society.
McPhail J. C., Pierson J. M., Freeman J. G., Goodman J. andAyappa A., (2000), The Role of Interest in Fostering SixthGrade Students’ Identities as Competent Learners, CurriculumInquiry, 30(1), 43–70.
National Research Council, (2012), A Framework for K-12 ScienceEducation: Practices, Crosscutting Concepts, and Core Ideas,Washington D. C.: National Academies Press.
Neely M. B., (2007), Using Technology and Other AssistiveStrategies to Aid Students with Disabilities in PerformingChemistry Lab Tasks, J. Chem. Educ., 84(10), 1697–1701.
Neppel K., Oliver-Hoyo M. T., Queen C. and Reed N., (2005),A Closer Look at Acid-Base Olfactory Titrations, J. Chem.Educ., 82(4), 607–610.
Paris S. G., Yambor K. M. and Packard B. W.-L., (1998), Hands-On Biology: A Museum-School-University Partnership for
Enhancing Students’ Interest and Learning in Science,The Elementary School Journal, 98(3), 267–288.
Pence L. E., Workman H. J. and Riecke P., (2003), EffectiveLaboratory Experiences for Students with Disabilities: TheRole of a Student Laboratory Assistant, J. Chem. Educ., 80(3),295–298.
Penrod W. M., Haley C. D. and Matheson L. P., (2005), A Modelfor Improving Science Teaching for Students with VisualImpairments, RE:view, 37(2), 53–60.
Pereira F., Aires-de-Sousa J., Bonifacio V. D.B., Mata P. andLobo A. M., (2011), MOLinsight: A Web Portal for theProcessing of Molecular Structures by Blind Students,J. Chem. Educ., 88(3), 361–362.
Pereira F., Ponte-e-Sousa J. C., Fartaria R. P.S., BonifacioV. D.B., Mata P., Aires-de-Sousa J. and Lobo A. M., (2013),Sonified Infrared Spectra and Their Interpretation by Blindand Visually Impaired Students, J. Chem. Educ., 90(8),1028–1031.
Piaget J., (1970), Science of Education and the Psychology of theChild, New York: Orion, p. 71.
Rutherford F. J. and Ahlgren A., (1990), Science for All Americans,New York: Oxford.
Scadden L., (2005), Current Status of People with Disabilitiesin STEM Education: A Personal Perspective, in NationalSymposium on STEM Education, Las Cruces: RASEM Squared,pp. 1–6.
Skoog D. A. and West D. M., (1982), Fundamentals of AnalyticalChemistry, 4th edn, Philadelphia: CBS College Publishing.pp. 39–57, 56–67.
Supalo C., (2005), Techniques to Enhance Instructors’ TeachingEffectiveness with Chemistry Students Who Are Blind orVisually Impaired, J. Chem. Educ., 82(10), 1513–1518.
Supalo C. A., (2007), Independent Laboratory Access for theBlind, Braille Monitor, 50(5), 337–338. *(Is braille monitorthe journal?).
Supalo C. A., (2010), Teaching Chemistry and Other Sciences toBlind and Low-Vision Students through Hands-On LearningExperiences in High School Science Laboratories, PhD dissertation,The Pennsylvania State University.
Supalo C. A. and Kennedy S. H., (2014), Using CommerciallyAvailable Techniques to Make Organic Chemistry Represen-tations Tactile and More Accessible to Students with Blindnessor Low Vision. J. Chem. Educ., 91(10), 1745–1747.
Supalo C. A., Kreuter R. A., Musser A., Han J., Briody E., McArtorC., Gregory K. and Mallouk T. E., (2006), Using AdaptiveTools and Techniques to Teach a Class of Students Who AreBlind or Low-Vision, Assist. Tech. Outcomes and Benefits, 3(1),110–116.
Supalo C. A., Mallouk T. E., Amorosi C., Rankel L., Wohlers H.D., Roth A. and Greenberg A., (2007), Talking Tools to AssistStudents Who Are Blind in Laboratory Courses, Journal ofScience Education for Students with Disabilities, 12, 27–32.
Supalo C. A., Mallouk T. E., Rankel L., Amorosi C. and GraybillC. M., (2008), Low-Cost Laboratory Adaptations for PrecollegeStudents Who Are Blind or Visually Impaired, J. Chem. Educ.,85(2), 243–247.
Chemistry Education Research and Practice Paper
This journal is©The Royal Society of Chemistry 2016 Chem. Educ. Res. Pract., 2016, 17, 1174--1189 | 1189
Supalo C. A., Dwyer D., Eberhart H. L., Bunnag N., and MalloukT. E., (2009a), Teacher Training Workshop for Educators ofStudents Who Are Blind or Low Vision, Journal of ScienceEducation for Students with Disabilities, 13, 9–16.
Supalo C. A., Mallouk T. E., Amorosi C., Lanouette J., WohlersH. D. and McEnnis K., (2009b), Using Adaptive Tools andTechniques to Teach a Class of Students Who Are Blind orLow-Vision, J. Chem. Educ., 86(5), 587–591.
Supalo C. A., Isaacson M. D. and Lombardi M. V., (2014),Making Hands-On Science Learning Accessible for StudentsWho Are Blind or Have Low Vision, J. Chem. Educ., 91(2),195–199.
Wedler H. B., Cohen S. R., Davis R. L., Harrison J. G., Siebert M. R.,Willenbring D., Hamann C. S., Shaw J. T. and Tantillo D. J.,
(2012), Applied Computational Chemistry for the Blind andVisually Impaired, J. Chem. Educ., 89(11), 1400–1404.
Wedler H. B., Boyes L., Davis R. L., Flynn D., Franz A., HamannC. S., Harrison J. G., Lodewyk M. W., Milinkevich K. A., ShawJ. T., Tantillo D. J. and Wang S. C., (2014), Nobody Can SeeAtoms: Science Camps Highlighting Approaches for MakingChemistry Accessible to Blind and Visually Impaired Students,J. Chem. Educ., 91(2), 188–194.
Winograd M. D. and Rankel L. A., (2007), Making ScienceFair: Making Science Instruction and Labs Accessible forStudents Who Are Blind or Visually Impaired, RE:view, 39(3),122–127.
Wolcott H. F., (2001), Writing Up Qualitative Research, 2nd edn,Thousand Oaks: SAGE Publications.
Paper Chemistry Education Research and Practice