Chemical Trespass - Pesticides in Our Bodies & Corporate Accountability
60
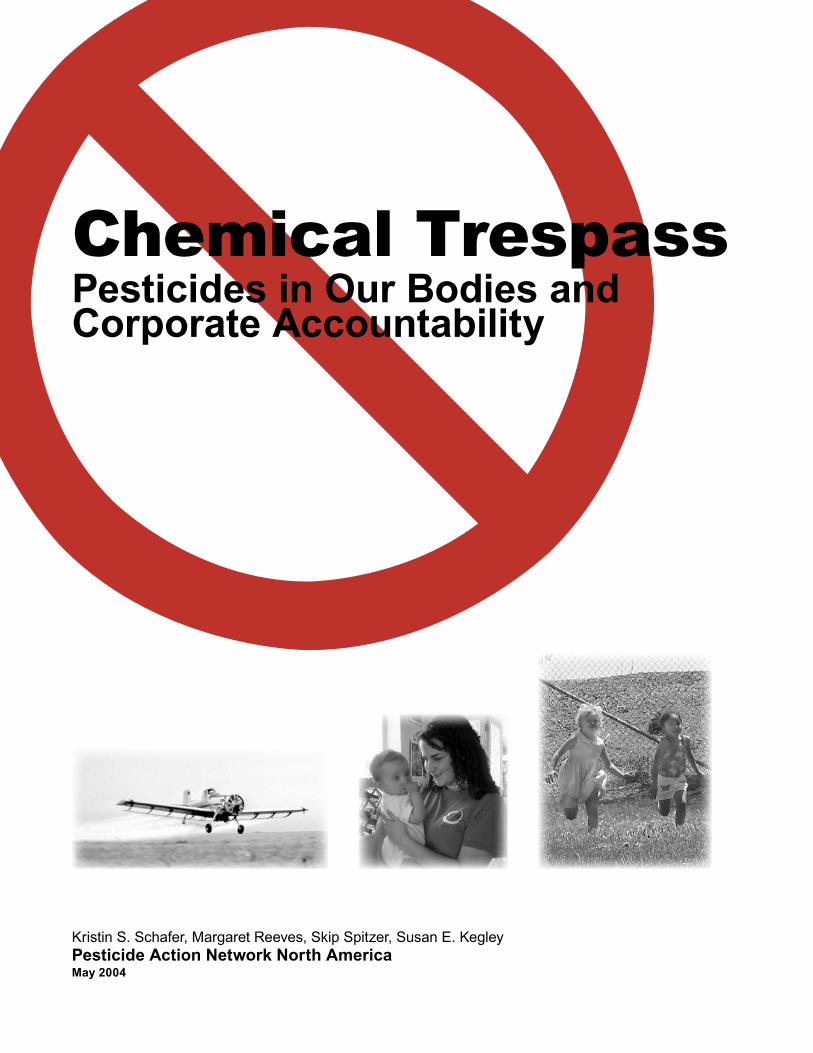
X Chemical Trespass Pesticides in Our Bodies and Corporate Accountability Kristin S. Schafer, Margaret Reeves, Skip Spitzer, Susan E. Kegley Pesticide Action Network North America May 2004
Transcript of Chemical Trespass - Pesticides in Our Bodies & Corporate Accountability
XChemical TrespassPesticides in Our Bodies and Corporate Accountability
Kristin S. Schafer, Margaret Reeves, Skip Spitzer, Susan E. KegleyPesticide Action Network North AmericaMay 2004

Chemical TrespassPesticides in Our Bodies and Corporate Accountability
Pesticide Action Network North AmericaMay 2004
AuthorsKristin S. Schafer, Program Coordinator, Persistent Pesticides Margaret Reeves, PhD, Senior Scientist Skip Spitzer, Program Coordinator, Corporate Accountability Susan E. Kegley, PhD, Senior Scientist
AcknowledgementsThis report reflects the efforts and expertise of many individuals both within Pesticide Action Network North America and among our partner organizations and institutions. Jessica Koll-meyer worked closely with the authors in researching and drafting the report, and Stephan Orme provided expertise on accessing and managing data. Monica Moore, Tanya Brown and Martha Olson Jarocki provided useful comments as the report was being developed and finalized, and Bob Sholtz helped strengthen our analytical approach to data analysis. Previous work of our colleague Marion Moses, M.D. cataloguing evidence of specific health effects of pesticides was invaluable in developing the health impacts discussion in this report.
We also gratefully acknowledge the insights and suggestions provided by the reviewers of the report: Carol Dansereau, Michael DiBartolomeis, Joe DiGangi, Kim Hooper, Phil Howard, Sharyle Patton and Erika Schreder. Participation in the report’s review does not necessarily indicate endorsement by the reviewers or their organizations of the analyses, conclusions or recommendations presented.
Thanks also go to Brenda J. Willoughby who formatted the report for publication, Mateo Rutherford and Roy Rojas of Berkeley Interpretation, Translation and Transcription Services (BITTS) who translated the Executive Summary into Spanish, and Cori Fay Traub, Martha Olson Jarocki, Travis Coan, Jessica Kollmeyer and Alexandra Latta for proofing and copy edit-ing.
Major funding for this report was provided by Cedar Tree Foundation. Additional support came from the Clarence E. Heller Charitable Foundation, Mitchell Kapor Foundation and Panta Rhea Foundation; and from the Nicole Jae Ford Fund, established by her parents and friends in memory of Nicole Jae Ford who passed away at four months of age.
The authors bear responsibility for any factual errors. Recommendations and views expressed are those of Pesticide Action Network North America, and do not necessarily represent the views of our funders and supporters.
Copyright 2004 by Pesticide Action Network North America. Permission is granted to reproduce portions of this report, provided the publishing organization is acknowledged.
Printed on recycled paper. Cover printed on 100% post-consumer recycled, non-de-inked paper.
Contents
Executive Summary ..................................................................................... 5
Government data reveal pesticide body burden .............................................. 5Pesticide companies must be held accountable .............................................. 8Real changes are needed to reduce pesticide body burdens ......................... 9
1. Pesticides in Our Bodies ................................................................... 11
CDC now monitors chemical residues in people ........................................... 11Body burden data provide direct evidence of pesticide exposure .................. 12Pesticide exposure is linked to chronic diseases ........................................... 13CDC body burden data provide incentive for change .................................... 15
2. What CDC Body Burden Data Show .............................................. 19
Most people in the U.S. have many pesticides in their bodies ....................... 21Many people in the U.S. are exposed to pesticides at dangerous levels ....... 22Children carry the heaviest body burden of many harmful pesticides ........... 25Mexican Americans carry higher body burdens of many pesticides .............. 27Organochlorine pesticides in women put future generations at risk ............. 29
3. Corporate Responsibility for Pesticide Body Burdens .......... 30
Pesticide companies define pest management options ................................. 30Pesticide companies use political influence to promote pesticide use .......... 30Corporate responsibility is an efficient way to address harm ......................... 31Most people support corporate accountability for products ........................... 31
4. Dow’s Responsibility for Chlorpyrifos Body Burdens ............ 33
Dow’s chlorpyrifos Pesticide Trespass Index and the right to know ............... 33Dow’s chlorpyrifos: Producing and protecting a profitable hazard ................. 34
5. Preventing Pesticide Body Burdens .............................................. 37
Recommendations for corporations and government .................................... 38What individuals can do ................................................................................. 39
Notes ................................................................................................................. 40
Appendix A Analytical Methods ..................................................................... 45
Appendix B Calculating Pesticide Exposure from Metabolites in Urine ........ 49
Appendix C Using Blood Concentrations of Pesticides and Metabolites to Assess Pesticide Exposure .................................................. 52
Appendix D Where Can I Learn More? ......................................................... 55
Appendix E Glossary ..................................................................................... 56

Chemical Trespass 5
The human body is not designed to cope with synthetic pesticides. Yet we all carry a cocktail of chemicals designed to kill insects, weeds and other agricultural and household pests.
Some of these pesticides are coursing through our systems at levels that can barely be detected with the most sophisticated monitoring equip-ment. Others occur in concentrations refl ecting exposure levels known to be unsafe.
Many of the pesticides we carry in our bodies can cause cancer, disrupt our hormone systems, decrease fertility, cause birth defects or weaken our immune systems. These are just some of the known detrimental effects of particular pesticides at very low levels of exposure. Almost nothing is known about the long-term impacts of multiple chemicals in the body over long periods.
For decades, pesticide manufacturers have argued that applying pesticides in our homes and intro-ducing them into our environment is necessary and safe. When used correctly, they argue, pesti-cides harm pests, not people. But the claim that pesticides are necessary is rapidly eroding in light of the grow-ing success of sustainable and organic agricultural production and alterna-tive controls for household pests. And the safety argument is directly chal-lenged by the data analyzed in this report documenting the presence of pesticides in the bodies of men, wom-en and children throughout the U.S.
Government data reveal pesticide body burdenThe U.S. Centers for Disease Control and Prevention (CDC) released its Second National Report on Human Exposure to Environmental Chemicals in January 2003. The report refl ects the results of testing 9,282 people for the pres-ence in their bodies of 116 chemicals, including 34 pesticides.
This report takes a closer look at what the CDC data tell us about the pesticides we all carry, or our “pesticide body bur-den.” Analysis of these data tell us which groups of people carry the most of which pesticides, and whether the levels we’re exposed to are considered “safe” by U.S. authorities. We also review what is known (and what is not known) about the long-term health effects of daily exposure to this mix of synthetic chemicals, who is responsible for the
Chemical Trespass Pesticides in Our Bodies and Corporate Accountability
Executive Summary
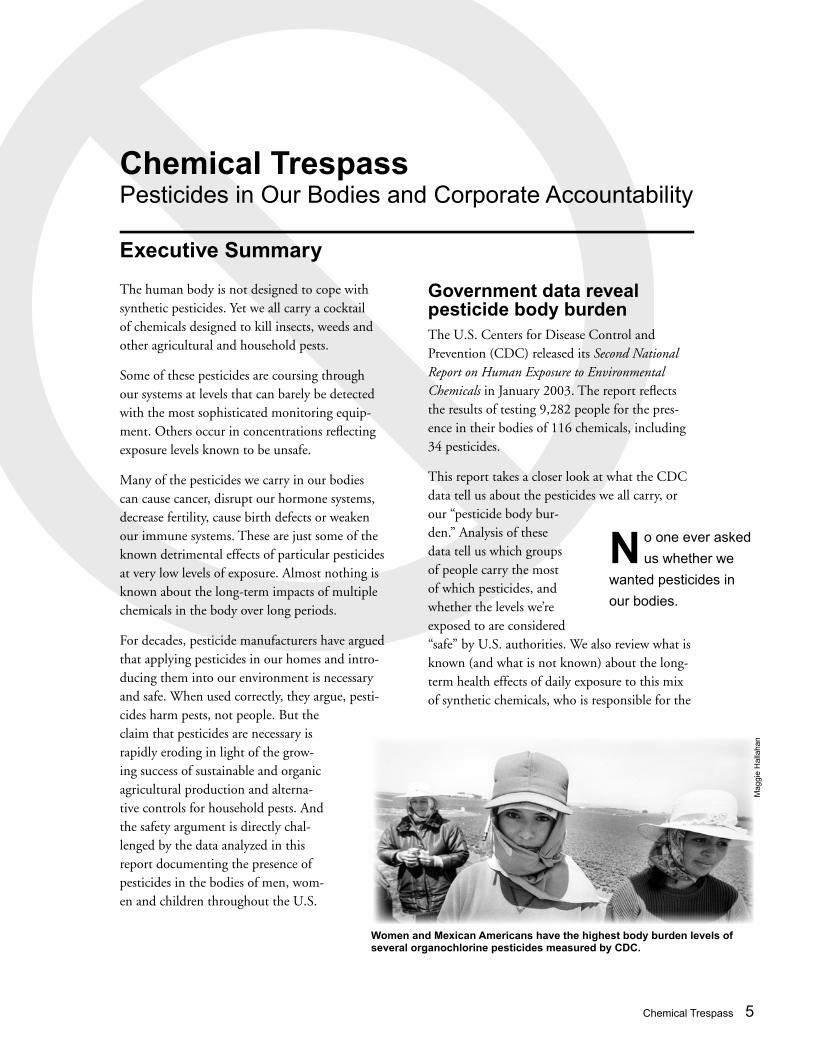
Women and Mexican Americans have the highest body burden levels of several organochlorine pesticides measured by CDC.
N o one ever asked
us whether we
wanted pesticides in
our bodies.
Mag
gie
Hal
laha
n
6 Executive Summary
pesticides in our bodies and what can and must be done to prevent and elimi-nate pesticide body burdens. Key find-ings of our analysis are outlined below.
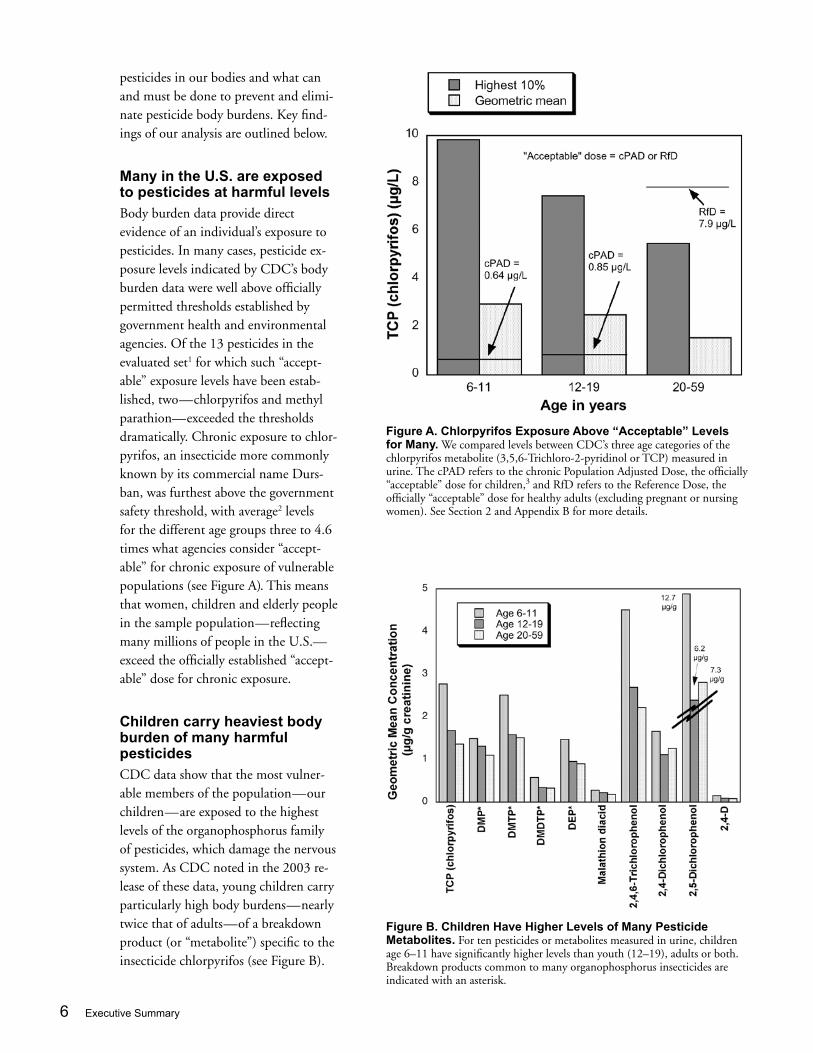
Many in the U.S. are exposed to pesticides at harmful levelsBody burden data provide direct evidence of an individual’s exposure to pesticides. In many cases, pesticide ex-posure levels indicated by CDC’s body burden data were well above officially permitted thresholds established by government health and environmental agencies. Of the 13 pesticides in the evaluated set1 for which such “accept-able” exposure levels have been estab-lished, two—chlorpyrifos and methyl parathion—exceeded the thresholds dramatically. Chronic exposure to chlor-pyrifos, an insecticide more commonly known by its commercial name Durs-ban, was furthest above the government safety threshold, with average2 levels for the different age groups three to 4.6 times what agencies consider “accept-able” for chronic exposure of vulnerable populations (see Figure A). This means that women, children and elderly people in the sample population—reflecting many millions of people in the U.S.—exceed the officially established “accept-able” dose for chronic exposure.
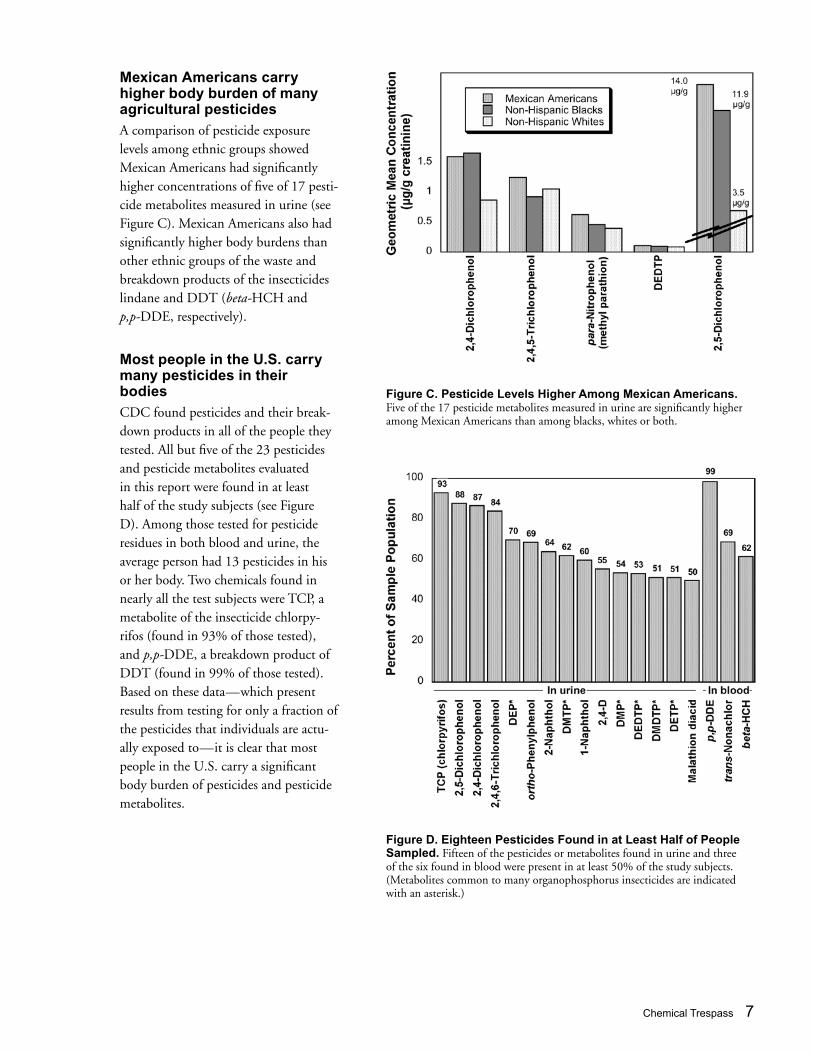
Children carry heaviest body burden of many harmful pesticidesCDC data show that the most vulner-able members of the population—our children—are exposed to the highest levels of the organophosphorus family of pesticides, which damage the nervous system. As CDC noted in the 2003 re-lease of these data, young children carry particularly high body burdens—nearly twice that of adults—of a breakdown product (or “metabolite”) specific to the insecticide chlorpyrifos (see Figure B).
Figure B. Children Have Higher Levels of Many Pesticide Metabolites. For ten pesticides or metabolites measured in urine, children age 6–11 have significantly higher levels than youth (12–19), adults or both. Breakdown products common to many organophosphorus insecticides are indicated with an asterisk.
Figure A. Chlorpyrifos Exposure Above “Acceptable” Levels for Many. We compared levels between CDC’s three age categories of the chlorpyrifos metabolite (3,5,6-Trichloro-2-pyridinol or TCP) measured in urine. The cPAD refers to the chronic Population Adjusted Dose, the officially “acceptable” dose for children,3 and RfD refers to the Reference Dose, the officially “acceptable” dose for healthy adults (excluding pregnant or nursing women). See Section 2 and Appendix B for more details.
Chemical Trespass 7
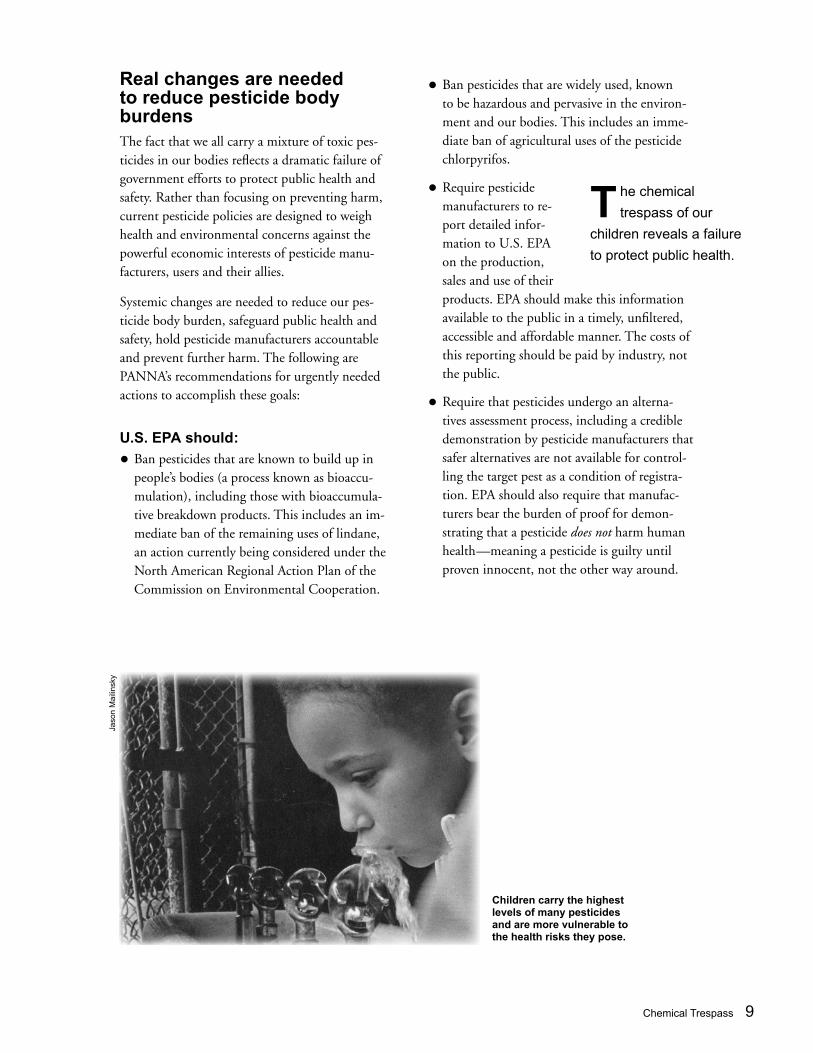
Mexican Americans carry higher body burden of many agricultural pesticidesA comparison of pesticide exposure levels among ethnic groups showed Mexican Americans had significantly higher concentrations of five of 17 pesti-cide metabolites measured in urine (see Figure C). Mexican Americans also had significantly higher body burdens than other ethnic groups of the waste and breakdown products of the insecticides lindane and DDT (beta-HCH and p,p-DDE, respectively).
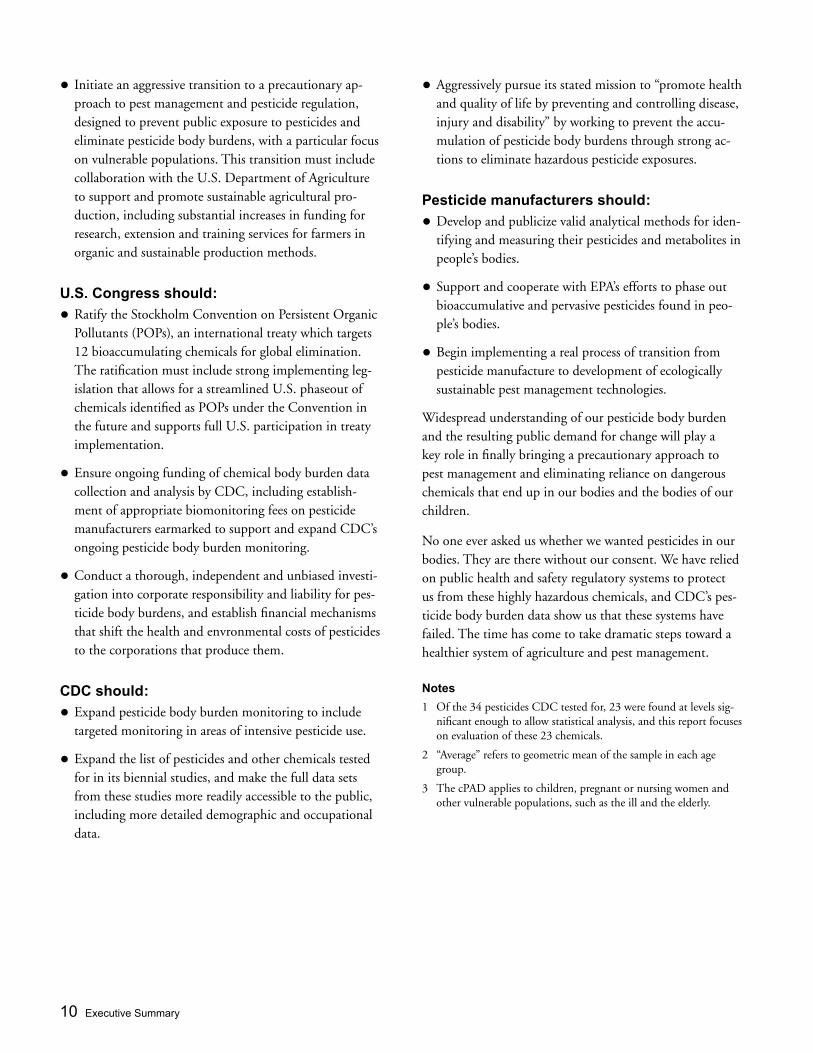
Most people in the U.S. carry many pesticides in their bodiesCDC found pesticides and their break-down products in all of the people they tested. All but five of the 23 pesticides and pesticide metabolites evaluated in this report were found in at least half of the study subjects (see Figure D). Among those tested for pesticide residues in both blood and urine, the average person had 13 pesticides in his or her body. Two chemicals found in nearly all the test subjects were TCP, a metabolite of the insecticide chlorpy-rifos (found in 93% of those tested), and p,p-DDE, a breakdown product of DDT (found in 99% of those tested). Based on these data—which present results from testing for only a fraction of the pesticides that individuals are actu-ally exposed to—it is clear that most people in the U.S. carry a significant body burden of pesticides and pesticide metabolites.
Figure D. Eighteen Pesticides Found in at Least Half of People Sampled. Fifteen of the pesticides or metabolites found in urine and three of the six found in blood were present in at least 50% of the study subjects. (Metabolites common to many organophosphorus insecticides are indicated with an asterisk.)
Figure C. Pesticide Levels Higher Among Mexican Americans. Five of the 17 pesticide metabolites measured in urine are significantly higher among Mexican Americans than among blacks, whites or both.

8 Executive Summary
Future generations are at riskAdult women—including women of childbearing age—had the highest measured body burden levels of three of the six organochlorine pesticides evaluated (see Figure E). This is cause for serious concern, as many of these pesticides are known to have multiple harmful effects when crossing the placenta during fetal development. Potential negative impacts of fetal exposure include reduced infant birth weight, reproductive problems includ-ing low sperm counts and other fertil-ity problems later in life and disrup-tion of neurological development during infancy, potentially leading to learning disabilities and other neurobehavioral problems. Elevated levels of p,p-DDE in mothers, for example, have been associated with both lower infant birth weight and reduced lactation, shortening the length of time mothers are able to breastfeed.
Pesticide companies must be held accountableWhere did these harmful pesticides in our bodies come from? Who is responsible for this chemical trespass?
Primary responsibility must rest with pesticide manufacturers. Over the last 50 years, agrochem-ical companies have largely defined the range of pest control technologies available to farmers and non-agricultural users alike. They also use their political influence to promote and protect their interests by limiting health and safety regula-tions. Pesticide manufacturers have the greatest capacity to prevent pesticide body burdens, and the general public expects manufacturers to be responsible for the impacts of their products.
In an effort to begin quantifying the responsi-bilities of individual manufacturers for pesticide body burdens, PANNA has developed a Pesticide Trespass Index (PTI). The PTI is a quantitative measure (a number between 0 and 1) of the frac-
tion of chemical trespass attributable to a specific manufacturer for a pesticide, or group of pesti-cides, found in a population.
A test case using the pesticide chlorpyrifos as an example illustrates how the PTI works. Dow AgroSciences, a wholly-owned subsidiary of Dow Chemical Corporation, is the primary manufac-turer of chlorpyrifos. Using conservative market share estimates, Dow’s PTI for chlorpyrifos can be calculated to be 0.8. This suggests that at least 80% of the population’s chlorpyrifos body burden is the responsibility of Dow Chemical Corporation.
It would be difficult to make a case that anyone could be more responsible for the chlorpyrifos in our bodies than Dow Chemical Company. Dow developed and was the first to commercial-ize the pesticide for a wide range of agricultural, residential and non-residential uses, and remains the predominant producer of technical grade chlorpyrifos to this day. The company continues to produce and promote the pesticide in the U.S. and internationally, despite strong evidence of significant public health impacts.
Figure E. Women Have Highest Levels of Some Organochlorine Pesticides. Women 20 years of age and older have significantly higher levels than men or children of three of the six persistent organochlorine pesticides measured by CDC.
Chemical Trespass 9
Real changes are needed to reduce pesticide body burdens The fact that we all carry a mixture of toxic pes-ticides in our bodies refl ects a dramatic failure of government efforts to protect public health and safety. Rather than focusing on preventing harm, current pesticide policies are designed to weigh health and environmental concerns against the powerful economic interests of pesticide manu-facturers, users and their allies.
Systemic changes are needed to reduce our pes-ticide body burden, safeguard public health and safety, hold pesticide manufacturers accountable and prevent further harm. The following are PANNA’s recommendations for urgently needed actions to accomplish these goals:
U.S. EPA should:
• Ban pesticides that are known to build up in people’s bodies (a process known as bioaccu-mulation), including those with bioaccumula-tive breakdown products. This includes an im-mediate ban of the remaining uses of lindane, an action currently being considered under the North American Regional Action Plan of the Commission on Environmental Cooperation.
• Ban pesticides that are widely used, known to be hazardous and pervasive in the environ-ment and our bodies. This includes an imme-diate ban of agricultural uses of the pesticide chlorpyrifos.
• Require pesticide manufacturers to re-port detailed infor-mation to U.S. EPA on the production, sales and use of their products. EPA should make this information available to the public in a timely, unfi ltered, accessible and affordable manner. The costs of this reporting should be paid by industry, not the public.
• Require that pesticides undergo an alterna-tives assessment process, including a credible demonstration by pesticide manufacturers that safer alternatives are not available for control-ling the target pest as a condition of registra-tion. EPA should also require that manufac-turers bear the burden of proof for demon-strating that a pesticide does not harm human health—meaning a pesticide is guilty until proven innocent, not the other way around.
T he chemical
trespass of our
children reveals a failure
to protect public health.
Children carry the highest levels of many pesticides and are more vulnerable to the health risks they pose.
Jaso
n M
ailin
sky
10 Executive Summary
• Initiate an aggressive transition to a precautionary ap-proach to pest management and pesticide regulation, designed to prevent public exposure to pesticides and eliminate pesticide body burdens, with a particular focus on vulnerable populations. This transition must include collaboration with the U.S. Department of Agriculture to support and promote sustainable agricultural pro-duction, including substantial increases in funding for research, extension and training services for farmers in organic and sustainable production methods.
U.S. Congress should:
• Ratify the Stockholm Convention on Persistent Organic Pollutants (POPs), an international treaty which targets 12 bioaccumulating chemicals for global elimination. The ratification must include strong implementing leg-islation that allows for a streamlined U.S. phaseout of chemicals identified as POPs under the Convention in the future and supports full U.S. participation in treaty implementation.
• Ensure ongoing funding of chemical body burden data collection and analysis by CDC, including establish-ment of appropriate biomonitoring fees on pesticide manufacturers earmarked to support and expand CDC’s ongoing pesticide body burden monitoring.
• Conduct a thorough, independent and unbiased investi-gation into corporate responsibility and liability for pes-ticide body burdens, and establish financial mechanisms that shift the health and envronmental costs of pesticides to the corporations that produce them.
CDC should:
• Expand pesticide body burden monitoring to include targeted monitoring in areas of intensive pesticide use.
• Expand the list of pesticides and other chemicals tested for in its biennial studies, and make the full data sets from these studies more readily accessible to the public, including more detailed demographic and occupational data.
• Aggressively pursue its stated mission to “promote health and quality of life by preventing and controlling disease, injury and disability” by working to prevent the accu-mulation of pesticide body burdens through strong ac-tions to eliminate hazardous pesticide exposures.
Pesticide manufacturers should:
• Develop and publicize valid analytical methods for iden-tifying and measuring their pesticides and metabolites in people’s bodies.
• Support and cooperate with EPA’s efforts to phase out bioaccumulative and pervasive pesticides found in peo-ple’s bodies.
• Begin implementing a real process of transition from pesticide manufacture to development of ecologically sustainable pest management technologies.
Widespread understanding of our pesticide body burden and the resulting public demand for change will play a key role in finally bringing a precautionary approach to pest management and eliminating reliance on dangerous chemicals that end up in our bodies and the bodies of our children.
No one ever asked us whether we wanted pesticides in our bodies. They are there without our consent. We have relied on public health and safety regulatory systems to protect us from these highly hazardous chemicals, and CDC’s pes-ticide body burden data show us that these systems have failed. The time has come to take dramatic steps toward a healthier system of agriculture and pest management.
Notes
1 Of the 34 pesticides CDC tested for, 23 were found at levels sig-nificant enough to allow statistical analysis, and this report focuses on evaluation of these 23 chemicals.
2 “Average” refers to geometric mean of the sample in each age group.
3 The cPAD applies to children, pregnant or nursing women and other vulnerable populations, such as the ill and the elderly.
Chemical Trespass 11
Every person alive today carries a load of syn-thetic chemicals in his or her body.1 This mix of chemicals—our chemical body burden—varies from day to day, depending on what we eat, the products we use, where we are and what is in the environment around us. Some chemicals have been accumulating in our blood and tissues since before we were born, when they were transferred to us from our mothers in the womb. Others we carry for a period of hours, days, weeks or months.
Many of the chemicals we carry in our bodies are pesticides, the only toxic chemicals intention-ally applied and released into the environment that are designed to kill living things. Many of the pesticides that were widely used in the past—such as DDT and chlordane in the 1950s and 1960s—are still found in our bodies, even in children born long after the chemicals were banned in the U.S. This is due to the transfer of pesticides to the next generation in the womb (and through breastmilk), to ongoing exposure to these persistent chemicals that are still found in our food, air and water, and to the global movement of chemicals that continue to be used in other parts of the world.
Across the globe, pesticides have been found in people’s blood, urine, breastmilk, semen, adipose (fatty) tissue, amniotic fl uid, infant meconium (fi rst stool) and umbilical cord blood.2 In the past several years, some body burden studies have focused on pesticides that pass through the body relatively quickly,3 complementing the many studies documenting persistent pesticides that the body stores for years—in some cases de-cades—in fatty tissues.
1. Pesticides in Our Bodies More than 16,000 pesticide products made from roughly 1,200 active ingredients are currently registered for use in this country.4 An estimated 1.2 billion pounds of these pesticides5 are used in the U.S. every year. No one knows how many of these eventually end up in our bodies, and what the long-term effects may be of exposure to this wide array of synthetic chemicals. We do know that individual pesticides are linked to a range of illnesses, and that dramatic increases in chemi-cal use in the last several decades directly parallel the increased incidence of many chronic diseases associated with environ-mental contamination.
CDC now monitors chemical residues in peopleIn the late 1990s, the U.S. Centers for Disease Control and Prevention (CDC) began conduct-ing biennial studies measuring a wide range of pesticides and other chemicals in thousands of people throughout the United States. In January 2003, CDC released its Second National Report on Human Exposure to Environmental Chemicals reporting on body burden testing in the U.S. population for 116 chemicals, including 34 pes-ticides.6
Our report takes a closer look at what the CDC data tell us about our pesticide body burden (see Appendix A for a description of analytical meth-ods). We estimate levels of pesticide exposure from body burden data and compare them with “acceptable” exposure levels set by government agencies. We look at which sub-groups of the
A n estimated
1.2 billion pounds
of pesticides are used
in the U.S. every year.
12 Section 1
population are carrying higher levels of which pesticides, and which groups carry the heaviest pesticide body burden. In Sections 3 and 4, we explore what these data can tell us about corpo-rate responsibility for our pesticide body burden, using one chemical—the organophosphorus (OP) pesticide chlorpyrifos—as a case study.
Body burden data provide direct evidence of pesticide exposure
Cumulative exposures to pesticides may come from a variety of sources, depending on what we eat, where we live, how we work and what we use to control pests at home. Pesticide body burden data can demonstrate conclusively whether or not people have been exposed.
Pesticide residues in food are a ubiquitous source of exposure.7 People are also exposed to pesticides in drinking water,8 air,9 housedust10 soil and con-taminated surfaces. Pesticides used in the home (or carried into the home on clothing or shoes)
can be absorbed through skin contact, inhalation or accidental ingestion, as can pesticides used in of-fi ces and other workplaces, schools, parks and other urban settings. Farmworkers and people in communities and schools located near
farms where pesticides are sprayed may inhale fumes or touch residues that have drifted and settled in their yards or homes.11 Farmworkers often come into direct contact with pesticides at work as well.
When a person is exposed to pesticides, the body’s detoxifi cation mechanisms are activated.12 Some pesticides are metabolized or transformed into different chemicals that are easier for the body to excrete. Others resist degradation and are stored in fatty tissues in the body. Generally it is the breakdown products—called metabo-lites—of a pesticide that are found when testing blood, urine or other body fl uids or tissues. Some metabolites are common to a group of pesticides
while others can be linked to exposure to a spe-cifi c pesticide.
Testing of urine provides evidence of recent exposure to chemicals that break down or are excreted relatively quickly by the body. OP and carbamate pesticides fall into this category. OP pesticides accounted for 73% of the insecticides in current use in the U.S. in 2001, a total of ap-proximately 73 million pounds per year.13 When OP and carbamate pesticide breakdown products are found in body burden tests, it refl ects recent exposure—generally within a few days of the sample being taken. While these pesticides may not persist for long periods in the environment or in our bodies, their widespread use means that people are continuously re-exposed to them and thus carry them as part of their pesticide body burden
In contrast, body burden data from blood and fatty tissues or fl uids like breastmilk provide evi-dence of exposure to chemicals like organochlo-rine (OC) pesticides that are stored in our body fat for long periods—months, years or a lifetime. OC pesticides have a long history of widespread use in the U.S. and around the world. These compounds are typically very persistent in the environment, and some are transported long dis-tances on air and water currents and via contami-nated fi sh and other wildlife.14 Levels measured in blood and fatty tissue thus refl ect exposures over time, starting with pesticides passed on to us
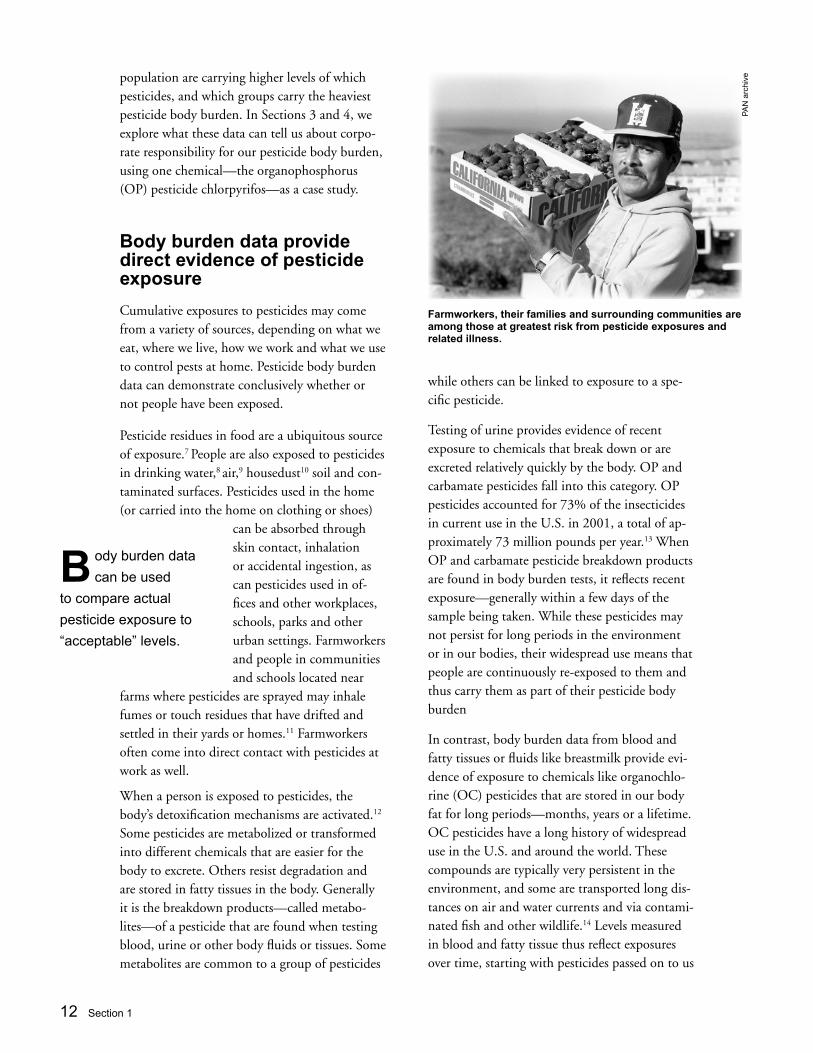
Farmworkers, their families and surrounding communities are among those at greatest risk from pesticide exposures and related illness.
PA
N a
rchi
ve
B ody burden data
can be used
to compare actual
pesticide exposure to
“acceptable” levels.
Chemical Trespass 13
by our mothers in the womb, and continuing to recent exposures from residues in our food, water and air.15
The combination of blood and urine analyses gives us a snapshot of the pesticides we carry in our bodies at a given moment. It can also provide information about the levels at which we have been exposed to pesticides in the environment.
For those pesticides that pass through the body quickly, it is possible to use the concentrations found in urine to estimate recent exposures (see Appendix B). This calculation is also possible for persistent pesticides found in blood, although more data are necessary to validate the assump-tions made (see Appendix C). Body burden data can thus be used to compare estimated pesticide exposure levels to “acceptable” levels of exposure established by government agencies, below which their scientists say no harm is expected (see box How Much Pesticide Exposure is “Acceptable” on page 26 for more detail).
Pesticide exposure is linked to chronic diseasesDramatic increases in the use of pesticides and other chemicals since the 1950s directly paral-lel the increased incidence of diseases associated with environmental contamination. For example, one in four people in the U.S. today will contract cancer during his or her lifetime. While scientists can’t tell us how much of this cancer is caused by exposure to chemicals, many pesticides are known carcinogens that have been associated with increased risk of specifi c types of cancer. Other chronic illnesses or health effects with strong evidence of linkages to pesticide exposure include Parkinson’s Disease, low birth weight, birth defects and declining sperm counts (see box Evidence Links Chronic Illnesses and Pesticide Ex-posure on page 16).16
Pesticides can harm people’s health in a variety of ways. OP insecticides, for example, work by in-terfering with the nervous systems of insects, and can affect the human nervous system in a similar way. Some OP pesticides are highly acutely
toxic, some cause developmental or reproduc-tive harm, and some are known or suspected to disrupt the human hormone (endocrine) system. Carbamate pesticides are very similar to the OP compounds in their effects on the human ner-vous system, interfering with the transmission of nerve impulses. Some chemicals in this class are hormone disruptors and/or carcinogenic as well. OC pesticides are linked to both acute and chronic health ef-fects, including cancer, neurological damage, and birth defects. Many organochlorines are also suspected hormone sys-tem disruptors.17
Companies that produce and sell pesticides are required to test them on laboratory animals to predict possible effects on people, including cancer, harm to the reproductive system, disrup-tions in the development of infants or children, and, for some chemicals, toxicity to the brain or nervous system (neurotoxicity). These studies provide information on the lowest dose at which health effects are observed in animals. 18 Such tests fall far short of adequately assessing risks to human health—particularly with respect to cumulative exposure impacts, risks of simulta-neous exposure to multiple chemicals, and the long-term effects and risks to our children, such as developmental impacts from in utero expo-
C hildren born to
women who live in
a high pesticide use area
while pregnant have an
increased risk of various
birth defects.
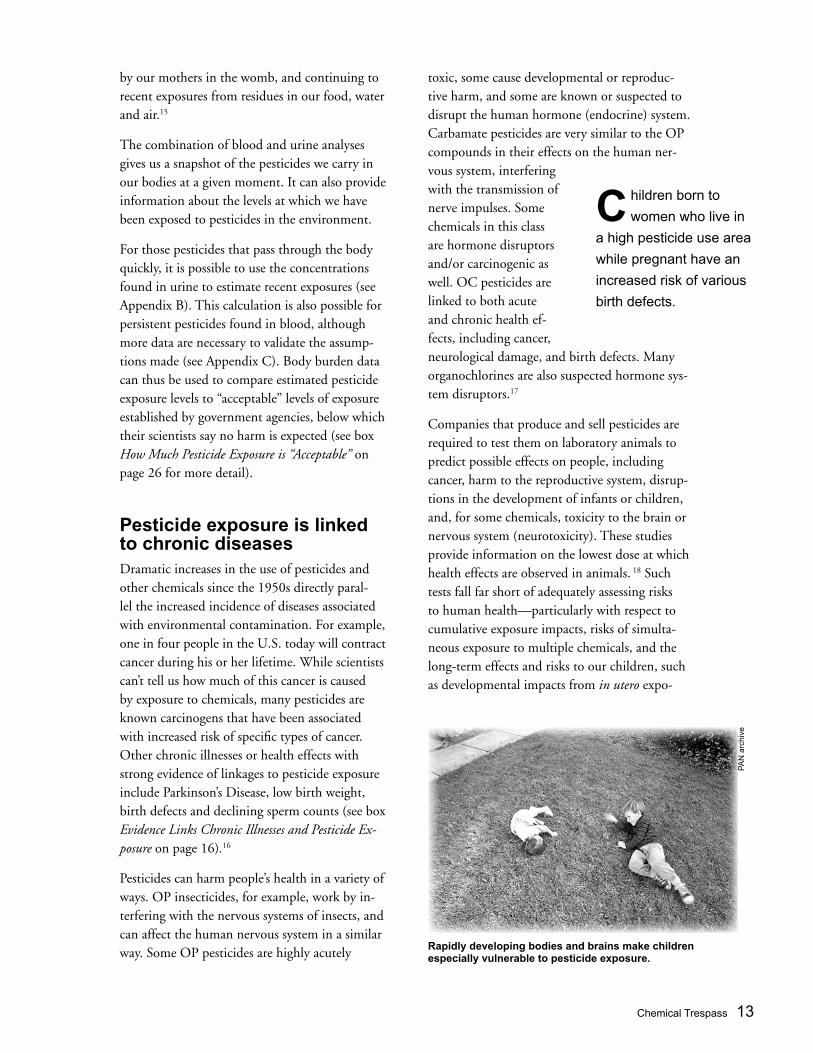
Rapidly developing bodies and brains make children especially vulnerable to pesticide exposure.
PA
N a
rchi
ve
14 Section 1
sures (see box Why Risk Assessment Doesn’t Tell the Whole Story).
There is widespread acknowledgement that chil-dren are at high risk from pesticide exposure, particularly from low-level exposure during criti-cal periods of biological development. Pesticide exposure during pregnancy has been linked to low infant birth weights, birth defects and higher rates of miscarriage.19 One recent study docu-ments a link between reduced pesticide use in
New York City (due to recent restrictions on the insecticides chlorpyrifos and diazinon), lower body burdens of these chemicals and higher birth weights and larger head circumference among infants studied.20 Associations between many childhood cancers and pesticide exposures have also been documented.21 The National Academy of Sciences estimates that 25% of all cases of developmental defects could be the result of a combination of genetic factors and chemical ex-posures.22 Learning disabilities have increased by
Why Risk Assessment Doesn’t Tell the Whole Story
In theory, risk assessment provides a reliable estimate of how much of a particular toxin an average person can be exposed to without expe-riencing adverse effects. In fact, the process is deeply flawed, not least because it does not con-sider the real-world mix of chemicals most peo-ple encounter—the wide variety of pesticides in food and water, on lawns, and in homes and workplaces; fumes from gasoline and diesel and gasoline exhaust; and other toxic substances in food, air, water and consumer products. The impacts of this chemical cocktail are unknown, but additive or synergistic effects as a result of such combinations are likely.1
Risk assessments may underestimate human health effects for many other reasons. For example, other factors influencing individual susceptibility to chemical exposure—such as nutrition, infectious agents, and even socio-economic variables—are not considered. Gaps in toxicity data exist for some types of adverse
effects, and theoretical “uncertainty factors” are used that do not reflect the real differences between laboratory animals and humans. Un-certainty factors also do not adequately address differences among individuals such as intrinsic susceptibility, age and health (see page 26 for a more detailed discussion of the limitations of uncertainty factors). Also overlooked is consid-eration of the undue influence of manufacturers and users of pesticides on agencies conducting the risk assessments.2
The many data gaps, assumptions based on little data and overlooked variables inherent to risk assessment make the process less than purely scientific. Using such an approach to determine so-called “acceptable” exposure to a single pesticide, or even a class of pesticides with similar mechanisms of action,3 results in policy decisions that do not adequately protect public health.
Notes
1 J. Payne, M. Scholze and A. Kortenkamp, Mixtures of Four Organochlorines Enhance Human Breast Cancer Cell Proliferation, Environ Health Perspect, 2001, 109: 391-397, see http://ehpnet1.niehs.nih.gov/docs/2001/109p391.
2 For a more detailed discussion, see S. Kegley, Limitations of toxicity data, PAN Pesticide Database, Pesticide Ac-tion Network, 2003, http://docs.pesticideinfo.org/documentation4/ref_toxicity1.html.
3 The Food Quality Protection Act of 1996 requires U.S. EPA to evaluate exposures to pesticides with a common mechanism of toxicity as a group, with a mandate to keep cumulative exposures to that group below levels of concern. As of early 2004, the only group for which this type of analysis is nearing completion is the organophos-phorus insecticides. Other classes of pesticides to be evaluated include N-methyl carbamate insecticides, thiocar-bamate herbicides, dithiocarbamate fungicides, chloroacetanilide herbicides, and triazine herbicides. See Assessing Cumulative Risk, U.S. EPA, http://www.epa.gov/pesticides/cumulative.

Chemical Trespass 15
more than 200% over the last 20 years, and rates of autism have increased even more rapidly.23
A new long-term study by U.S. EPA, the Na-tional Cancer Institute and the National Institute of Environmental Health Sciences is underway exploring the link between health effects and long-term pesticide exposure among 89,000 farmworkers and their families in North Carolina and Iowa. Strong correlations are beginning to emerge between pesticide exposure and a variety of health effects, including correlations between exposure to specifi c pesticides and the develop-ment of prostate cancer and lung cancer. Some of the strongest linkages found—those between exposure to the pesticide chlorpyrifos and lung cancer—were not predicted by animal studies. This ongoing research project will continue to report fi ndings over the course of the multi-year study.24
CDC body burden data provide incentive for changeCDC’s ongoing monitoring of pesticides and other chemicals in the bodies of thousands of people represents both a tremendous opportunity and a real danger.
The danger lies in making our chemical body burden seem acceptable. CDC promotes its data as a baseline of background exposure levels that can be used to compare with higher levels that occur with dramatic exposures.25 This implies that these so-called baseline levels are normal, acceptable and perhaps even harmless. In its re-lease of the 2003 body burden data, CDC clearly emphasized that measurement of chemicals in people’s bodies does not mean these chemicals cause disease.26 Indeed, CDC’s position seems to be that measured levels of chemicals in hu-mans—chemical body burdens—are not a cause for concern until they are defi nitively linked with specifi c human diseases.
This position represents a failure to protect pub-lic health. The idea that pesticides in our bodies are not cause for concern and no action needs to be taken is an indefensible stance. Pesticides
are toxic chemicals, and routine and constant exposure to them is clearly cause for concern and preventative action, even when defi nitive causal linkages between body burden exposure and particular diseases are diffi cult or impossible to prove.
The opportunity pro-vided by the CDC data is twofold. First, solid evidence that people throughout the U.S. are carrying dozens of chemicals in their bod-ies—and perhaps hun-dreds more not yet tested for27—refutes a long-standing myth promoted by pesticide manufac-turers that pesticides are not a signifi cant threat to public health. CDC’s body burden data show that this is not true. The result of pesticide-based pest management in agriculture and elsewhere is that we all carry a mixture of pesticides in our bodies.
Second, CDC’s body burden data offer an op-portunity to change the way we think about pro-tecting the public from toxic pesticides. Public health systems have failed to such an extent that even our children carry pesticides in their bod-ies. Recognition of this failure should spur us to demand immediate and fundamental changes in the regulation of pesticides, and a systemic shift toward promotion of safer alternatives that will prevent and eliminate pesticide body burdens.
B ody burden data
should change
the way we think about
protecting the public from
toxic pesticides.
Pesticides affect many different organ systems in the body, and can cause a range of immediate and long-term effects even at very low levels of exposure.
PA
N a
rchi
ve
16 Section 1
Evidence Links Chronic Illnesses and Pesticide ExposureLinking chronic diseases with exposure to specific pesti-cides is a complex endeavor, as very low-level exposures can result in effects long after the initial exposure occurs. In some cases, it is pesticide exposure among parents that results in health effects in their children. Still, for some health effects there is more than a suggestive correlation. Examples of diseases where studies indicate a strong link-age between pesticide exposure and illness include:1
• Childhood Cancers Pesticides are a risk factor for sev-eral types of cancer in children.2 Among the highest risk factor is parents’ home use, which can increase the risk of leukemia by as much as 11 times and brain cancer by as much as ten times.3 Home extermination increases the risk of non-Hodgkin lymphoma, leukemia, and Wilm’s tumor.4 Living on a farm increases the risk of bone cancer and leukemia,5 and having parents who are farmers or farmworkers increases a child’s risk of bone cancer, brain cancer, soft tissue sarcoma, and Wilm’s tumor.6
• Breast Cancer Evidence on the links between pesticide exposure and breast cancer is mixed, with many studies showing no correlation and others showing strong link-ages. Recent research in Colombia, for example, showed an association between levels of DDE in the blood and risk for breast cancer, and dieldrin exposure has also been linked with significantly elevated breast cancer risk.7 A 2001 study of the combined effect of four organochlo-rine pesticides found that the mixture of these estrogenic chemicals enhanced the spread of breast cancer cells.8
• Lymphoma The Lymphoma Foundation of America recently compiled dozens of studies documenting in-creased risk of lymphoma from pesticide exposure.9 In-creased risk of developing non-Hodgkin lymphoma was found among people exposed to lindane, DDT, organo-phosphorus insecticides and various herbicides including 2,4-D.10
• Other Cancers Living in an agricultural area where pesticides are used increases the risk of several types of cancer in adults, including, among others, leukemia, brain cancer, ovarian cancer, pancreatic cancer and stom-ach cancer.11 A growing body of evidence links pesticide exposure to cancer specifically among farmworkers and farmers.12 Multiple studies have shown that farmers are more likely to develop leukemia, brain, prostate, and skin cancer and non-Hodgkin’s lymphoma than the general population.13 Farmers and farmworkers experience similar increases in multiple myeloma and cancers of the stom-ach, prostate, and testis, while farmworkers show unique
increases in cancers of the mouth, pharynx, lung, and liver.14 A review of Central California Cancer Registry data shows an association between the development of leukemia among Hispanic males and exposure to the pes-ticides 2,4-D, atrazine, and captan.15 • Parkinson’s Disease Strong evidence links Parkinson’s disease to pesticide exposure. Most studies are of people exposed through their work, especially to herbicides.16 There is also evidence of increased risk of Parkinson’s from exposure to pesticides in the home,17 living in a rural area,18 and using well water.19 Parkinson’s has also been linked to elevated levels of organochlorine pesticides in brain tissue.20
• Low Birth Weight A strong relationship has been found between prematurely delivered and low birth weight babies and mothers’ blood levels of DDE, the metabolic breakdown product of DDT.21 Similar links between low birth weights and several other pesticides have been documented, including increased birth weights in New York City following the ban of residential uses of the pesticides chlorpyrifos and diazinon.22
• Birth Defects Children born to women who live in a high pesticide use area while pregnant have an increased risk of various birth defects, including cleft lip/palate, limb reduction defects and neural tube defects (e.g., spina bifida and anencephaly).23 If the mother is not exposed to pesticides but the father works in agriculture, a child runs a higher risk of being born with hypospadias (undescend-ed testicles), cleft lip/palate and other birth defects.24
• Declining Sperm Counts A 1992 study documented a 40% decline in sperm count worldwide over the second half of the 20th century. While there is no widely agreed explanation for these global declines, some studies have linked pesticide exposure with decreased sperm quality, and linked higher sperm density with lower pesticide exposures.25 Hormone disruption is considered a pos-sible contributor to lower sperm counts, and dozens of pesticides are known or suspected hormone disruptors. The list includes widely used carbamates such as aldicarb and carbaryl, common organophosphorus pesticides (e.g., malathion and chlorpyrifos), and persistent chlorinated pesticides such as endosulfan, lindane and DDT.26 Re-searchers at the University of Missouri-Columbia found in 2002 that sperm counts were significantly lower in men from rural mid-Missouri. The study authors suggest that agricultural chemicals could explain the difference.27
continued
Chemical Trespass 17
Notes
1 In developing these bullets we relied heavily on the work of Dr. Marion Moses and the more detailed summary of health effects she developed for S. Kegley, A. Katten and M. Moses, Second-hand Pesticides: Airborne Pesticide Drift in California, Pesticide Action Network North America, California Rural Legal As-sistance Foundation and Pesticide Education Center, 2003 (San Francisco CA). See also: a) http://www.pesticides.org/educmaterials.html b) G. Solomon, O. Ogunseitan, J. Kirsch, Pesticides and Human Health, Physicians for Social Responsibility and Californians for Pesticide Reform, 2000 (San Francisco, CA), see http://www.psrla.org/pesthealthmain.htm.
2 a) N.T. Fear, E. Roman, G. Reeves, and B. Pannett, Childhood cancer and paternal employment in agriculture: The role of pesti-cides, Br. J. Cancer, 1998, 77(5): 825–29. b) P. Kristensen, A. Anderson, and L.M. Irgens, Cancer in off-spring of parent engaged in agricultural activities in Norway: Incidence and risk factors in the farm environment, Intl. J. Can-cer, 1996, 65(1): 39–50. c) C.R. Sharpe, E.L. Franco, and B. de Camargo, Parental ex-posures to pesticides and risk of Wilms’ tumor in Brazil, Am. J. Epidemiol, 1995, 141(3): 210-17.
3 J.M. Pogoda and S. Preston Martin, Household pesticides and risk of pediatric brain tumors, Environ Health Perspect, 1997, 105(11): 1214-20.
4 a) J.K. Leiss and D.A. Savitz, Home pesticide use and childhood cancer: A case-control study, Am J Pub Health, 1995, 85(2): 249–52. b) X. Ma, P.A. Buffl er, R.B. Gunier, et al., Critical windows of exposure to household pesticides and risk of childhood leukemia, Environ Health Perspect, 2002, 110(9): 955–60. c) A.F. Olshan, N.E. Breslow, J.M. Falletta, et al., Risk factors for Wilm’s tumor: Report from the National Wilm’s Tumor Study, Cancer, 1993, 72(3): 938–44.
5 a) P.C. Valery, W. McWhirter, A. Sleigh, et al., Farm exposures, parental occupation, and risk of Ewing’s sarcoma in Australia: A national case-control study, Can Causes Contr, 2002, 13(3): 263–70. b) E.A. Holly, P.M. Bracci, B.A. Mueller, et al., Farm and animal exposures and pediatric brain tumors: Results from the United States West Coast Childhood Brain Tumor Study, Can Epid Bio-mark Prev, 1998, 7(9): 797–802. c) G.R. Bunin, J.D. Buckley, C.P. Boesel, et al., Risk factors for astrocytic glioma and primitive neuroectodermal tumor of the brain in young children: A report from the Children’s Cancer Group, Can Epid Biomark Prev, 1994, 3(3): 197–204.
6 a) L. Hum, N. Kreiger, and M.M. Finkelstein, The relationship between, parental occupation and bone cancer risk in offspring, Int J Epid, 1998, 27(5): 766–71. b) P. Kristensen, A. Andersen, L.M. Irgens, et al., Cancer in offspring of parents engaged in agricultural activities in Norway: Incidence and risk factors in the farm environment, Int J Can, 1996, 65(1): 39-50. c) E.A. Holly, D.P. Aston, P.K.A. Ahn, et al., Ewing’s bone sar-coma, parental occupational exposures and other factors, Am J Epid, 1992, 135(2): 122–29. d) M. Feychting, N. Plato, G. Nise, and A. Ahlbom, Paternal occupational exposures and childhood cancer, Environ Health Perspect, 2001, 109(2): 193–96. e) C. Magnani, G. Pastore, L. Luzzatto, et al., Parental occupa-
tion and other environmental factors in the etiology of leukemias and non-Hodgkin’s lymphomas in childhood: A case-control study, Tumori, 1990, 76(5): 413–19. f ) C.R. Sharpe, E.L. Franco, B. deCamargo, et al., Parental expo-sures to pesticides and risk of Wilm’s tumor in Brazil, Am J Epid, 1995, 141(3): 210–17.
7 a) P. Olaya-Contreras, J. Rodriguez-Villamil, H.J. Posso-Valen-cia, and J.E. Cortez, Organochlorine exposure and breast cancer risk in Colombian women, Cad Saude Publica, 1998, 14 (suppl 3): 124-32. b) A.P. Hoyer, P. Granjean, T. Jorgensen, et al., Organochlorine exposure and risk of breast cancer, Lancet, 1998, 352(9143): 1816-20.
8 J. Payne, M. Scholze, and A. Kortenkamp, Mixtures of Four Or-ganochlorines Enhance Human Breast Cancer Cell Proliferation, Environ Health Perspect, 2001, 109: 391-397, see http://ehpnet1.niehs.nih.gov/docs/2001/109p391.
9 S. Osborn, Do Pesticides Cause Lymphoma? Lymphoma Founda-tion of America, 2001, see http://www.lymphomaresearch.org.
10 a) S.H. Zahm, D.D. Weisenburger, et al., A case-control study of non-Hodgkin’s lymphoma and the herbicide 2,4-dichlorophen-oxyacetic acid (2,4-D) in eastern Nebraska, Epidemiology, 1990, 1(5): 349-56. b) S.H. Zahm, and A. Blair, Pesticides and non-Hodgkin’s lym-phoma, Cancer Res, 1992, 52(Suppl 19): 5485s-5488s. c) A. Blair, K.P. Cantor, et al., Non-hodgkin’s lymphoma and agricultural use of the insecticide lindane, Am J Ind Med, 1998, 33(1): 82-7.
11 a) D. Godon, P. Lajoie, J.P. Thouez, et al., Pesticides and cancer in a Quebec rural farming population: A geographical interpreta-tion, Soc Sci Med, 1989, 29(7): 819–33. b) M. McCabe, M. Nowak, R. Hamilton, et al., Cancer of lym-phatic tissues in cane-growing areas of Queensland, Med J Aust, 1984, 141(7): 412–14. c) D. Waterhouse, W.J. Carman, D. Schottenfeld, et al., Cancer incidence in the rural community of Tecumseh, Michigan: A pattern of increased lymphopoietic neoplasms, Cancer, 1996, 77(4): 763–70. d) M.E. Loevinsohn, Insecticide use and increased mortality in rural central Luzon, Philippines, Lancet, 1987, 1: 1359–62. e) A. Ahlbom, I.L. Navier, S. Norell, et al., Nonoccupational risk indicators for astrocytomas in adults, Am J Epid, 1986, 124(2): 334–37. f ) A. Aschengrau, D. Ozonoff, P. Coogan, et al., Cancer risk and residential proximity to cranberry cultivation in Massachusetts, Am J Publ Health, 1996, 86(9): 1289–96. g) A. Donna, P. Crosignani, F. Robutti, et al., Triazine herbicides and ovarian epithelial neoplasms, Scand J Work Env Health, 1989, 15: 47-53. h) A. Donna, P-G. Betta, F. Robutti, et al., Ovarian mesothelial tumors and herbicides: A case-control study, Carcinogenesis, 1984, 5: 941–42. i) D.M. Schreinemachers, Cancer mortality in four northern wheat-producing states, Environ Health Perspect, 2000, 108(9): 873–81. j) A. Paldy, N. Puskas, and I. Farkas, Pesticide use related to can-cer incidence as studied in a rural district of Hungary, Sci Total Env, 1988, 73(3): 229–44.
12 P.K. Mills and S. Kwong, Cancer incidence in the United Farm
continued on next page
18 Section 1
Workers of America (UFW) 1987-1997, Am J Ind Med, 2001, 40: 596-603.
13 J. Dich, S.H. Zahm, et al., Pesticides and cancer, Can Causes Cont, 1997, 8(3): 420-43.
14 a) P.K. Mills and S. Kwong, Cancer incidence in the United Farm Workers of America (UFW) 1987-1997, Am J Ind Med, 2001, 40: 596–603. b) S.H. Zham and A. Blair, Cancer among migrant and seasonal farmworkers: An epidemiologic review and research agenda, Am J Ind Med, 1993, 24: 753–66. c) S.H. Zham, M.H. Ward, and A. Blair, Pesticides and cancer, Occup Med: State of the Art Reviews, 1997, 12: 269–89.
15 P.K. Mills, Correlation analysis of pesticide use data and cancer incidence rates in California counties, Arch. Env. Health, 1998, 53: 410–13.
16 J.M. Gorell, C.C. Johnson, B.A. Rybicki, et al., The risk of Par-kinson’s disease with exposure to pesticides, farming, well water, and rural living, Neurology, 1998, 50(5): 1346-50.
17 P.G. Butterfi eld, B.G. Valanis, P.S. Spencer, et al., Environmen-tal antecedents of young-onset Parkinson’s disease, Neurology, 1993, 43(6): 1150–58.
18 a) S.J. McCann, D.G. LeCouteur, A.C. Green, et al., The epi-demiology of Parkinson’s disease in an Australian population, Neuroepidemiology, 1998, 17(6): 310–17. b) A.H. Rajput, R.J. Uitti, W. Stern, et al., Georgraphy, drinking water chemistry, pesticides and herbicides and the etiology of Parkinson’s disease, Can J Neurolog Sci, 1987, 14: 414–18. c) S.C. Ho, et al., Epidemiologic study of Parkinson’s disease in Hong Kong, Neurology, 1989, 39(10): 1314–18. d) C.M. Tanner, B. Chen, W-Z. Wang, et al., Environmental factors in the etiology of Parkinson’s disease, Can J Neuro Sci, 1987, 14: 419–23. e) B. Ritz and F. Yu, Parkinson’s disease mortality and pesticide exposure in California 1984–1994, Int J Epid, 2000, 29(2): 323–29. f ) A. Priyadarshi, S.A. Khuder, E.A. Schaub, et al., Environmen-tal risk factors and Parkinson’s disease: A meta-analysis, Env Res, 2001, 86(2): 122–27. g) K. Marder, G. Logroscino, B. Alfaro, et al., Environmental risk factors for Parkinson’s disease in an urban multiethnic com-munity, Neurology, 1998, 50(1): 279–81. h) W. Koller, B. Vetere-Overfi eld, C. Gray, et al., Environmen-tal risk factors in Parkinson’s disease, Neurology, 1990, 40(8): 1218–21. i) G.F. Wong, C.S. Gray, R.S. Hassanein, et al., Environmental risk factors in siblings with Parkinson’s disease, Arch Neurol, 1991, 48(3): 287–89.
19 a) C.H. Tsai, S.K. Lo, L.C. See, et al., Environmental risk factors of young onset Parkinson’s disease: A case-control study, Clin Neurol Neurosurg, 2002, 104(4): 328–33. b) M. Behari, A.K. Srivastava, R.R. Das, et al., Risk factors of Parkinson’s disease in Indian patients, J Neurol Sci, 2001, 190(1–2): 49–55. c) M. Zorzon, L. Capus, A. Pellegrino, et al., Familial and envi-ronmental risk factors in Parkinson’s disease: A case-control study in north-east Italy, Acta Neurol Scand, 2002, 105(2): 77–82. d) A. Smargiassi, A. Mutti, A. De Rosa, et al., A case-control study of occupational and environmental risk factors for Parkin-
son’s disease in the Emilia-Romagna region of Italy, Neurotoxicol-ogy, 1998, 19(4-5): 709–12.
20 L. Fleming, J.B. Mann, et al., Parkinson’s disease and brain levels of organochlorine pesticides, Ann Neurol, 1994, 36(1): 100-3.
21 M.P. Longnecker, M.A. Klebanoff, H. Zhou, J.W. Brock, Asso-ciation between maternal serum concentration of the DDT me-tabolite DDE and pre-term and small-for-gestational-age babies at birth, The Lancet, 2001, 358: 110-114.
22 a) R.S. Procianoy, and S. Schvartsman. Blood pesticide concen-tration in mothers and their newborn infants: Relation to prema-turity, Acta Paediatr Scand, 1981, 70(6): 925-8. b) F.P. Perera, V. Rauh, et al., Effects of transplacental exposure to environmental pollutants on birth outcomes in a multiethnic population, Environ Health Perspect, 2003, 111(2): 201-5. c) R.M. Whyatt, V. Rauh, D.B. Barr, et al., Prenatal Insecticide Exposures, Birth Weight and Length Among an Urban Minority Cohort, Environ Health Perspect, 2004, doi:10.1289/ehp.6641, see http://ehp.niehs.nih.gov/members/2004/6641/6641.html.
23 a) J.E. Gordon and C.M. Shy, Agricultural chemical use and congenital cleft lip and/or palate, Arch Env Health, 1981, 36: 213–21. b) D.A. Schwartz and J.P. LoGerfo, Congenital limb reduction defects in the agricultural setting, Am J Pub Health, 1988, 78: 654–57. c) G.M. Shaw, C.R. Wasserman, C.D. O’Malley, et al., Maternal pesticide exposure from multiple sources and selected congenital anomalies, Epidemiology, 1999, 10(1): 60–66. d) A.E. Czeizel, Pesticides and birth defects [letter], Epidemiol-ogy, 1996, 7(1): 111. e) E.M. Bell, I. Hertz-Picciotto, and J.J. Beaumont, A case-con-trol study of pesticides and fetal death due to congenital anoma-lies, Epidemiology, 2001, 12(2): 148–56.
24 a) V.F. Garry, D. Schreinemachers, M.E. Harkins, et al., Pesticide appliers, biocides, and birth defects in rural Minnesota, Environ Health Perspect, 1996, 104(4): 394–99. b) M. Restrepo, N. Munoz, N.E. Day, et al., Birth defects among children born to a population occupationally exposed to pesti-cides in Columbia, Scand J Work Env Health, 1990, 16: 239–46. c) A.M. Garcia, F.G. Benavides, T. Fletcher, et al., Paternal ex-posure to pesticides and congenital malformations, Scand J Work Env Health, 1998, 24(6): 473–80.
25 a) S.H. Swan, R.L. Kruse, et al., Semen quality in relation to biomarkers of pesticide exposure, Environ Health Perspect, 2003, 111(12): 1478-84. b) A. Abell, E. Ernst, et al., High sperm density among members of organic farmers’ association, Lancet, 1994, 343(8911): 1498.
26 a) E. Carlsen, A. Giwercman, N. Keiding, N. Skakkebaek, Evi-dence for Decreasing Quality of Semen During Past 50 Years, British Medical Journal, 1992, 305:609-613. b) L.R. Fraser, et al., Effects of estradiol 17B and environmental estrogens on mammalian sperm function, Presented at the an-nual conference of the European Society of Human Reproduc-tion and Embryology, Vienna, July 2002, see http://conf.eshre.com/PDF/O-119.pdf.
27 a) S.H. Swan, C. Brazil, E.E. Drobnis, et al., Geographical Dif-ference in Semen Quality of Fertile U.S. Males, Environ Health Perspect, 2003, 111(4): 414-20. b) Study for Future Families, Sperm Quality Low in Farming Region, Associated Press, 11 November 2002, see http://www.missouri.edu.
continued from previous page
Chemical Trespass 19
The National Health and Nutrition Examination Survey (NHANES), conducted by the National Center for Health Statistics of the Centers for Disease Control and Prevention (CDC), is a multi-year project assessing the health and nutri-tional status of the U.S. population.
The data considered in this report are from the NHANES 1999–2000 cycle of the biennial sur-vey, in which 9,282 people in 26 U.S. locations were interviewed and tested for 116 chemicals, including 34 pesticides. CDC released these data in January 2003 in its Second National Report on Human Exposure to Environmental Chemicals.28 The 2003 report is a signifi cant expansion from the fi rst body burden study released in 2001, which was based on an earlier NHANES survey and included nine pesticides and 27 chemicals in total.29
As mentioned above, CDC documents the U.S. population’s chemical body burden of three types of pesticides and their metabolites: organochlo-rine insecticides (OCs), organophosphorus insec-ticides (OPs) and carbamate insecticides. CDC scientists also tested for a few widely used weed killers and other pesticides that don’t fall into any of these categories. In our report, we analyze CDC’s fi ndings for 23 pesticides (or pesticide metabolites) that were found at detectable levels in the blood or urine of at least 24% of the sam-pled individuals and where there were suffi cient detections to provide statistically valid results.
Some of the more surprising results of this analy-sis include the following:
• One hundred percent of the people tested for pesticides in both their blood and urine have
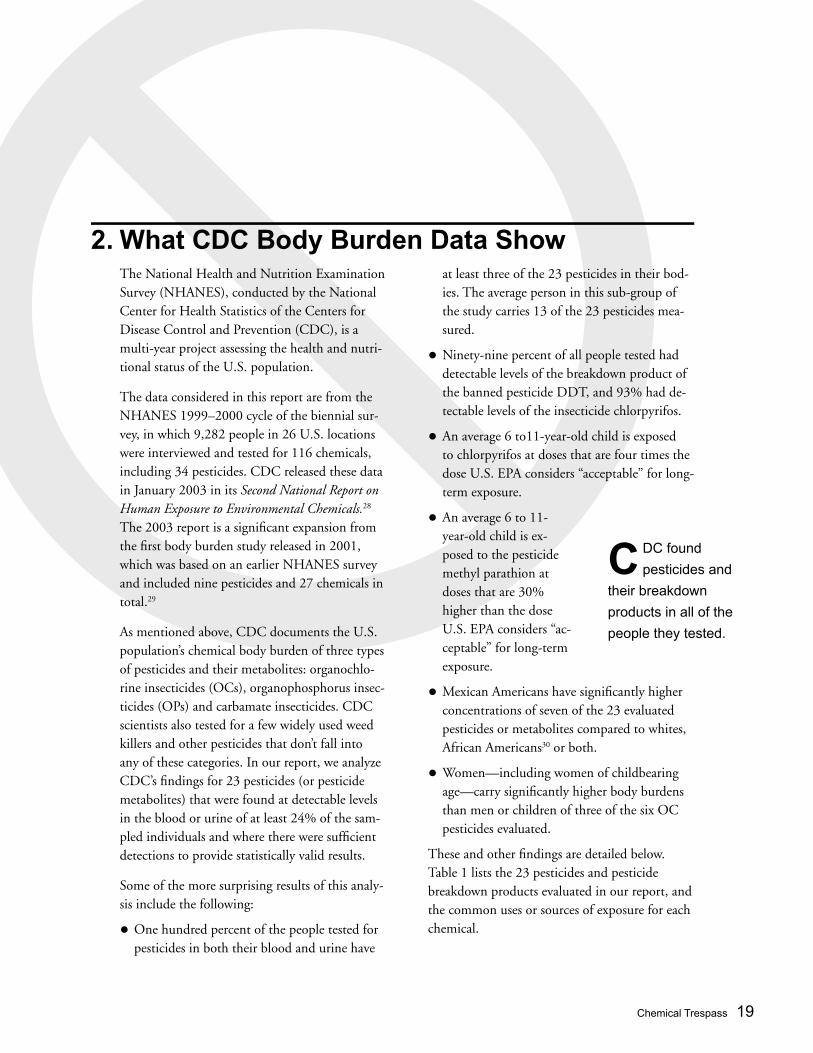
2. What CDC Body Burden Data Show at least three of the 23 pesticides in their bod-ies. The average person in this sub-group of the study carries 13 of the 23 pesticides mea-sured.
• Ninety-nine percent of all people tested had detectable levels of the breakdown product of the banned pesticide DDT, and 93% had de-tectable levels of the insecticide chlorpyrifos.
• An average 6 to11-year-old child is exposed to chlorpyrifos at doses that are four times the dose U.S. EPA considers “acceptable” for long-term exposure.
• An average 6 to 11-year-old child is ex-posed to the pesticide methyl parathion at doses that are 30% higher than the dose U.S. EPA considers “ac-ceptable” for long-term exposure.
• Mexican Americans have signifi cantly higher concentrations of seven of the 23 evaluated pesticides or metabolites compared to whites, African Americans30 or both.
• Women—including women of childbearing age—carry signifi cantly higher body burdens than men or children of three of the six OC pesticides evaluated.
These and other fi ndings are detailed below. Table 1 lists the 23 pesticides and pesticide breakdown products evaluated in our report, and the common uses or sources of exposure for each chemical.
C DC found
pesticides and
their breakdown
products in all of the
people they tested.
20 Section 2
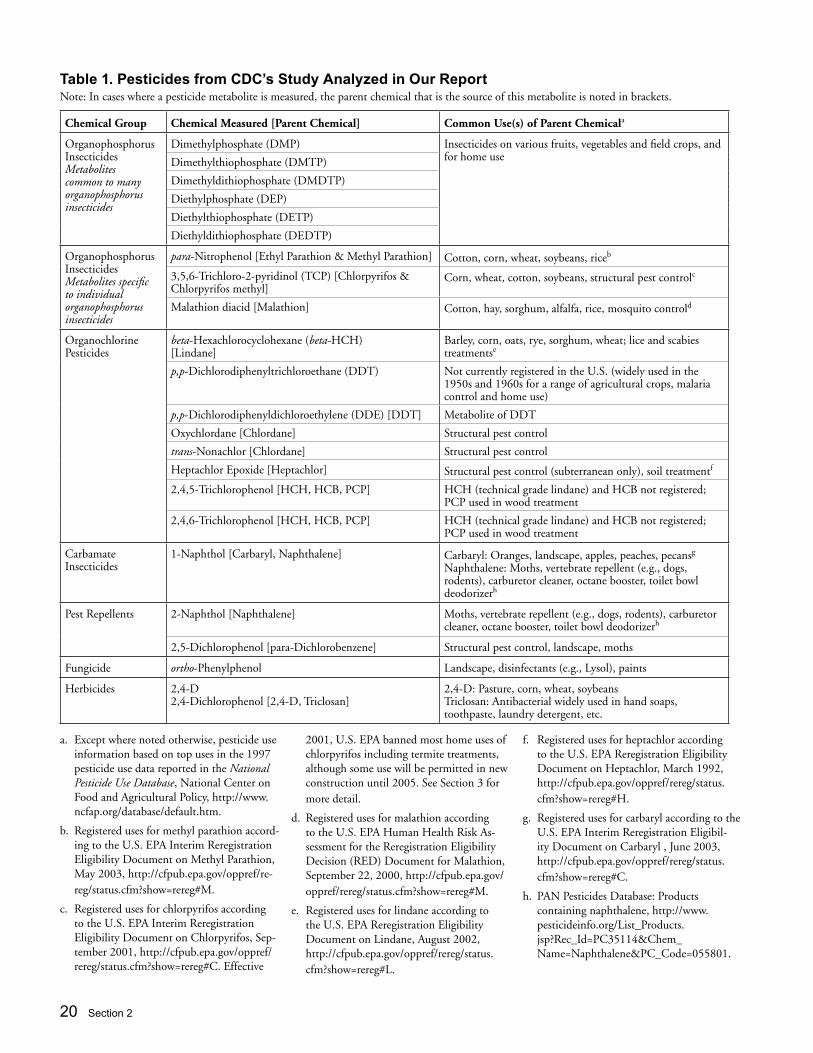
Table 1. Pesticides from CDC’s Study Analyzed in Our Report Note: In cases where a pesticide metabolite is measured, the parent chemical that is the source of this metabolite is noted in brackets.
Chemical Group Chemical Measured [Parent Chemical] Common Use(s) of Parent Chemicala
Organophosphorus Insecticides Metabolites common to many organophosphorus insecticides
Dimethylphosphate (DMP) Insecticides on various fruits, vegetables and field crops, and for home useDimethylthiophosphate (DMTP)
Dimethyldithiophosphate (DMDTP)
Diethylphosphate (DEP)
Diethylthiophosphate (DETP)
Diethyldithiophosphate (DEDTP)
Organophosphorus Insecticides Metabolites specific to individual organophosphorus insecticides
para-Nitrophenol [Ethyl Parathion & Methyl Parathion] Cotton, corn, wheat, soybeans, riceb
3,5,6-Trichloro-2-pyridinol (TCP) [Chlorpyrifos & Chlorpyrifos methyl]
Corn, wheat, cotton, soybeans, structural pest controlc
Malathion diacid [Malathion] Cotton, hay, sorghum, alfalfa, rice, mosquito controld
Organochlorine Pesticides
beta-Hexachlorocyclohexane (beta-HCH)[Lindane]
Barley, corn, oats, rye, sorghum, wheat; lice and scabies treatmentse
p,p-Dichlorodiphenyltrichloroethane (DDT) Not currently registered in the U.S. (widely used in the 1950s and 1960s for a range of agricultural crops, malaria control and home use)
p,p-Dichlorodiphenyldichloroethylene (DDE) [DDT] Metabolite of DDT
Oxychlordane [Chlordane] Structural pest control
trans-Nonachlor [Chlordane] Structural pest control
Heptachlor Epoxide [Heptachlor] Structural pest control (subterranean only), soil treatmentf
2,4,5-Trichlorophenol [HCH, HCB, PCP] HCH (technical grade lindane) and HCB not registered; PCP used in wood treatment
2,4,6-Trichlorophenol [HCH, HCB, PCP] HCH (technical grade lindane) and HCB not registered; PCP used in wood treatment
Carbamate Insecticides
1-Naphthol [Carbaryl, Naphthalene] Carbaryl: Oranges, landscape, apples, peaches, pecansg
Naphthalene: Moths, vertebrate repellent (e.g., dogs, rodents), carburetor cleaner, octane booster, toilet bowl deodorizerh
Pest Repellents 2-Naphthol [Naphthalene] Moths, vertebrate repellent (e.g., dogs, rodents), carburetor cleaner, octane booster, toilet bowl deodorizerh
2,5-Dichlorophenol [para-Dichlorobenzene] Structural pest control, landscape, moths
Fungicide ortho-Phenylphenol Landscape, disinfectants (e.g., Lysol), paints
Herbicides 2,4-D2,4-Dichlorophenol [2,4-D, Triclosan]
2,4-D: Pasture, corn, wheat, soybeansTriclosan: Antibacterial widely used in hand soaps, toothpaste, laundry detergent, etc.
a. Except where noted otherwise, pesticide use information based on top uses in the 1997 pesticide use data reported in the National Pesticide Use Database, National Center on Food and Agricultural Policy, http://www.ncfap.org/database/default.htm.
b. Registered uses for methyl parathion accord-ing to the U.S. EPA Interim Reregistration Eligibility Document on Methyl Parathion, May 2003, http://cfpub.epa.gov/oppref/re-reg/status.cfm?show=rereg#M.
c. Registered uses for chlorpyrifos according to the U.S. EPA Interim Reregistration Eligibility Document on Chlorpyrifos, Sep-tember 2001, http://cfpub.epa.gov/oppref/rereg/status.cfm?show=rereg#C. Effective
2001, U.S. EPA banned most home uses of chlorpyrifos including termite treatments, although some use will be permitted in new construction until 2005. See Section 3 for more detail.
d. Registered uses for malathion according to the U.S. EPA Human Health Risk As-sessment for the Reregistration Eligibility Decision (RED) Document for Malathion, September 22, 2000, http://cfpub.epa.gov/oppref/rereg/status.cfm?show=rereg#M.
e. Registered uses for lindane according to the U.S. EPA Reregistration Eligibility Document on Lindane, August 2002, http://cfpub.epa.gov/oppref/rereg/status.cfm?show=rereg#L.
f. Registered uses for heptachlor according to the U.S. EPA Reregistration Eligibility Document on Heptachlor, March 1992, http://cfpub.epa.gov/oppref/rereg/status.cfm?show=rereg#H.
g. Registered uses for carbaryl according to the U.S. EPA Interim Reregistration Eligibil-ity Document on Carbaryl , June 2003, http://cfpub.epa.gov/oppref/rereg/status.cfm?show=rereg#C.
h. PAN Pesticides Database: Products containing naphthalene, http://www.pesticideinfo.org/List_Products.jsp?Rec_Id=PC35114&Chem_Name=Naphthalene&PC_Code=055801.
Chemical Trespass 21
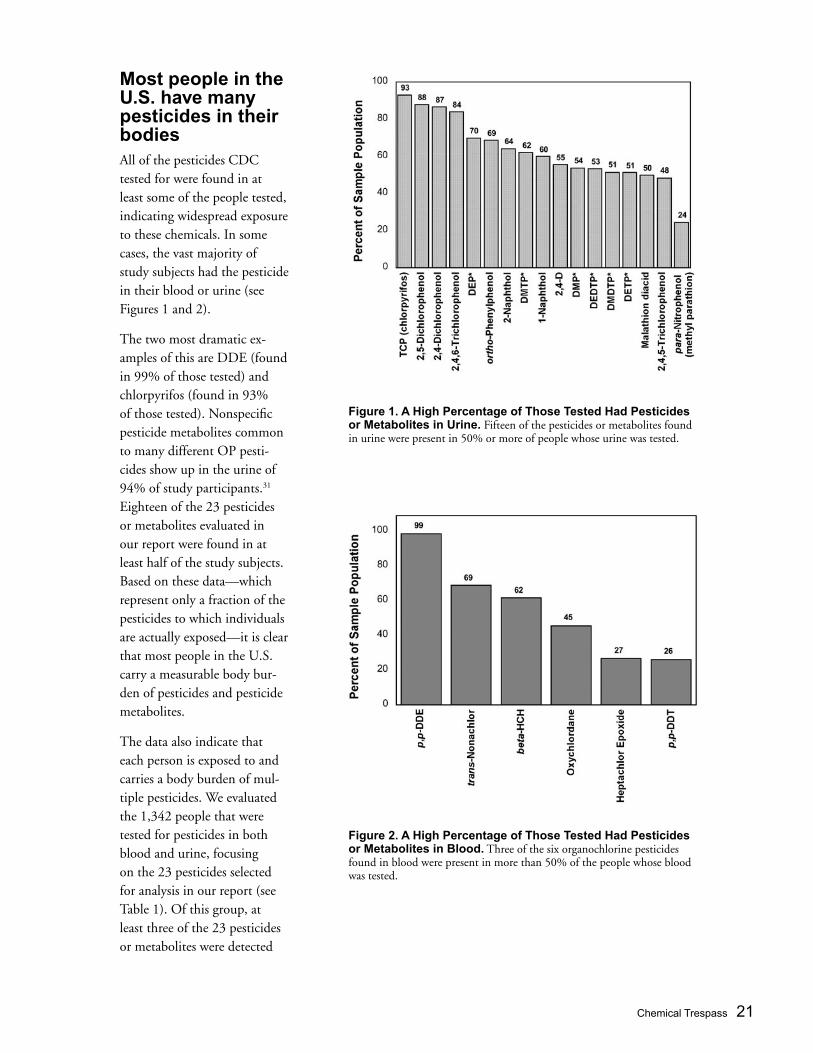
Most people in the U.S. have many pesticides in their bodiesAll of the pesticides CDC tested for were found in at least some of the people tested, indicating widespread exposure to these chemicals. In some cases, the vast majority of study subjects had the pesticide in their blood or urine (see Figures 1 and 2).
The two most dramatic ex-amples of this are DDE (found in 99% of those tested) and chlorpyrifos (found in 93% of those tested). Nonspecific pesticide metabolites common to many different OP pesti-cides show up in the urine of 94% of study participants.31 Eighteen of the 23 pesticides or metabolites evaluated in our report were found in at least half of the study subjects. Based on these data—which represent only a fraction of the pesticides to which individuals are actually exposed—it is clear that most people in the U.S. carry a measurable body bur-den of pesticides and pesticide metabolites.
The data also indicate that each person is exposed to and carries a body burden of mul-tiple pesticides. We evaluated the 1,342 people that were tested for pesticides in both blood and urine, focusing on the 23 pesticides selected for analysis in our report (see Table 1). Of this group, at least three of the 23 pesticides or metabolites were detected
Figure 1. A High Percentage of Those Tested Had Pesticides or Metabolites in Urine. Fifteen of the pesticides or metabolites found in urine were present in 50% or more of people whose urine was tested.
Figure 2. A High Percentage of Those Tested Had Pesticides or Metabolites in Blood. Three of the six organochlorine pesticides found in blood were present in more than 50% of the people whose blood was tested.
22 Section 2
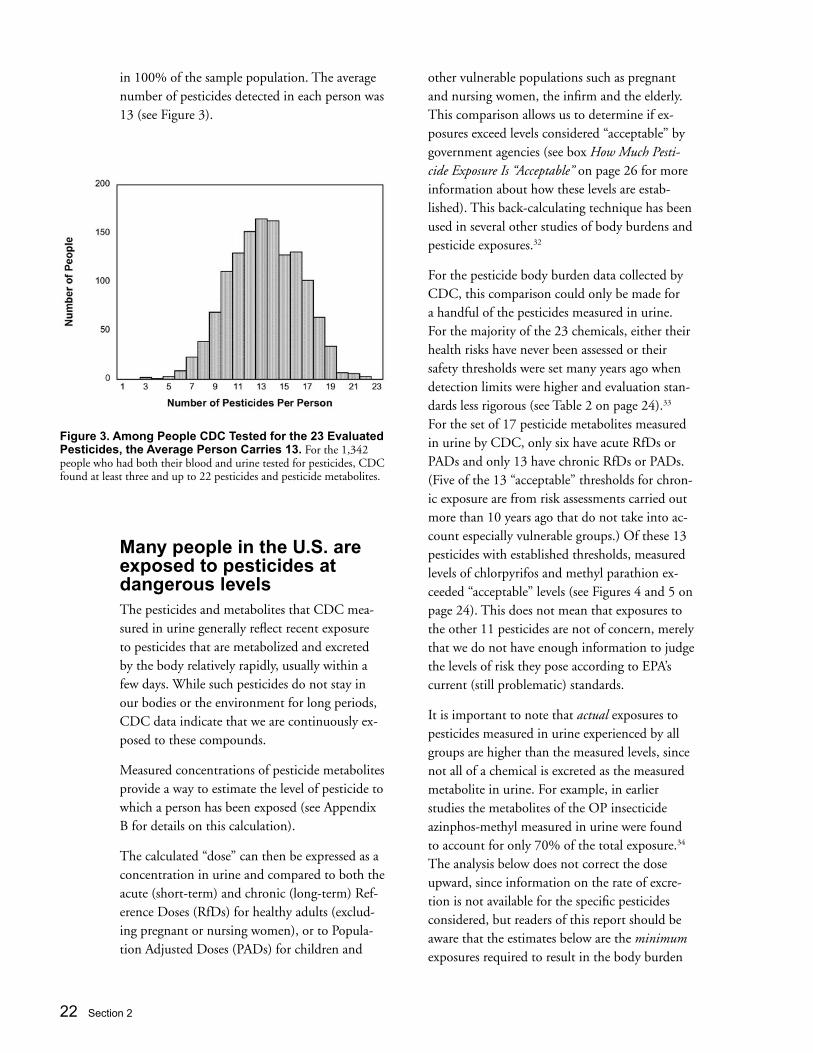
in 100% of the sample population. The average number of pesticides detected in each person was 13 (see Figure 3).
other vulnerable populations such as pregnant and nursing women, the infirm and the elderly. This comparison allows us to determine if ex-posures exceed levels considered “acceptable” by government agencies (see box How Much Pesti-cide Exposure Is “Acceptable” on page 26 for more information about how these levels are estab-lished). This back-calculating technique has been used in several other studies of body burdens and pesticide exposures.32
For the pesticide body burden data collected by CDC, this comparison could only be made for a handful of the pesticides measured in urine. For the majority of the 23 chemicals, either their health risks have never been assessed or their safety thresholds were set many years ago when detection limits were higher and evaluation stan-dards less rigorous (see Table 2 on page 24).33 For the set of 17 pesticide metabolites measured in urine by CDC, only six have acute RfDs or PADs and only 13 have chronic RfDs or PADs. (Five of the 13 “acceptable” thresholds for chron-ic exposure are from risk assessments carried out more than 10 years ago that do not take into ac-count especially vulnerable groups.) Of these 13 pesticides with established thresholds, measured levels of chlorpyrifos and methyl parathion ex-ceeded “acceptable” levels (see Figures 4 and 5 on page 24). This does not mean that exposures to the other 11 pesticides are not of concern, merely that we do not have enough information to judge the levels of risk they pose according to EPA’s current (still problematic) standards.
It is important to note that actual exposures to pesticides measured in urine experienced by all groups are higher than the measured levels, since not all of a chemical is excreted as the measured metabolite in urine. For example, in earlier studies the metabolites of the OP insecticide azinphos-methyl measured in urine were found to account for only 70% of the total exposure.34 The analysis below does not correct the dose upward, since information on the rate of excre-tion is not available for the specific pesticides considered, but readers of this report should be aware that the estimates below are the minimum exposures required to result in the body burden
Figure 3. Among People CDC Tested for the 23 Evaluated Pesticides, the Average Person Carries 13. For the 1,342 people who had both their blood and urine tested for pesticides, CDC found at least three and up to 22 pesticides and pesticide metabolites.
Many people in the U.S. are exposed to pesticides at dangerous levelsThe pesticides and metabolites that CDC mea-sured in urine generally reflect recent exposure to pesticides that are metabolized and excreted by the body relatively rapidly, usually within a few days. While such pesticides do not stay in our bodies or the environment for long periods, CDC data indicate that we are continuously ex-posed to these compounds.
Measured concentrations of pesticide metabolites provide a way to estimate the level of pesticide to which a person has been exposed (see Appendix B for details on this calculation).
The calculated “dose” can then be expressed as a concentration in urine and compared to both the acute (short-term) and chronic (long-term) Ref-erence Doses (RfDs) for healthy adults (exclud-ing pregnant or nursing women), or to Popula-tion Adjusted Doses (PADs) for children and
Chemical Trespass 23
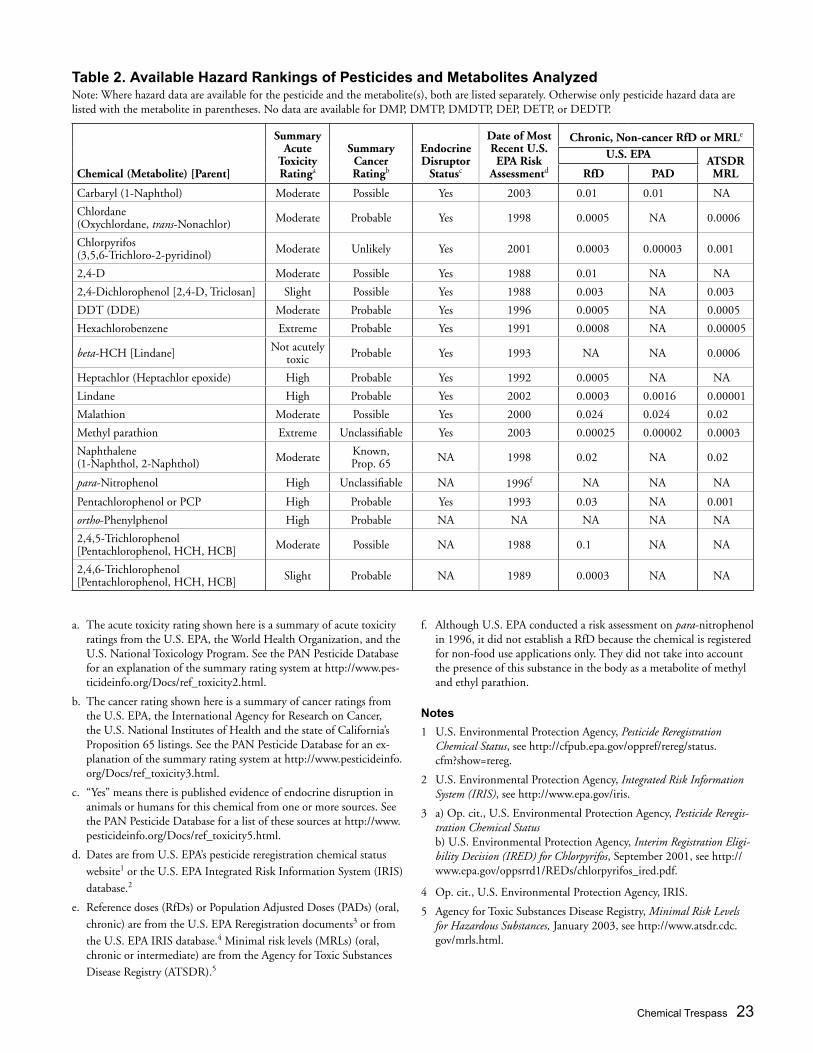
Table 2. Available Hazard Rankings of Pesticides and Metabolites AnalyzedNote: Where hazard data are available for the pesticide and the metabolite(s), both are listed separately. Otherwise only pesticide hazard data are listed with the metabolite in parentheses. No data are available for DMP, DMTP, DMDTP, DEP, DETP, or DEDTP.
Chemical (Metabolite) [Parent]
Summary Acute
Toxicity Ratinga
Summary Cancer Ratingb
Endocrine Disruptor
Statusc
Date of Most Recent U.S. EPA Risk
Assessmentd
Chronic, Non-cancer RfD or MRLe
U.S. EPAATSDR MRLRfD PAD
Carbaryl (1-Naphthol) Moderate Possible Yes 2003 0.01 0.01 NA
Chlordane (Oxychlordane, trans-Nonachlor) Moderate Probable Yes 1998 0.0005 NA 0.0006
Chlorpyrifos (3,5,6-Trichloro-2-pyridinol) Moderate Unlikely Yes 2001 0.0003 0.00003 0.001
2,4-D Moderate Possible Yes 1988 0.01 NA NA
2,4-Dichlorophenol [2,4-D, Triclosan] Slight Possible Yes 1988 0.003 NA 0.003
DDT (DDE) Moderate Probable Yes 1996 0.0005 NA 0.0005
Hexachlorobenzene Extreme Probable Yes 1991 0.0008 NA 0.00005
beta-HCH [Lindane] Not acutely toxic Probable Yes 1993 NA NA 0.0006
Heptachlor (Heptachlor epoxide) High Probable Yes 1992 0.0005 NA NA
Lindane High Probable Yes 2002 0.0003 0.0016 0.00001
Malathion Moderate Possible Yes 2000 0.024 0.024 0.02
Methyl parathion Extreme Unclassifiable Yes 2003 0.00025 0.00002 0.0003
Naphthalene (1-Naphthol, 2-Naphthol) Moderate Known,
Prop. 65 NA 1998 0.02 NA 0.02
para-Nitrophenol High Unclassifiable NA 1996f NA NA NA
Pentachlorophenol or PCP High Probable Yes 1993 0.03 NA 0.001
ortho-Phenylphenol High Probable NA NA NA NA NA
2,4,5-Trichlorophenol [Pentachlorophenol, HCH, HCB] Moderate Possible NA 1988 0.1 NA NA
2,4,6-Trichlorophenol [Pentachlorophenol, HCH, HCB] Slight Probable NA 1989 0.0003 NA NA
a. The acute toxicity rating shown here is a summary of acute toxicity ratings from the U.S. EPA, the World Health Organization, and the U.S. National Toxicology Program. See the PAN Pesticide Database for an explanation of the summary rating system at http://www.pes-ticideinfo.org/Docs/ref_toxicity2.html.
b. The cancer rating shown here is a summary of cancer ratings from the U.S. EPA, the International Agency for Research on Cancer, the U.S. National Institutes of Health and the state of California’s Proposition 65 listings. See the PAN Pesticide Database for an ex-planation of the summary rating system at http://www.pesticideinfo.org/Docs/ref_toxicity3.html.
c. “Yes” means there is published evidence of endocrine disruption in animals or humans for this chemical from one or more sources. See the PAN Pesticide Database for a list of these sources at http://www.pesticideinfo.org/Docs/ref_toxicity5.html.
d. Dates are from U.S. EPA’s pesticide reregistration chemical status
website1 or the U.S. EPA Integrated Risk Information System (IRIS) database.2
e. Reference doses (RfDs) or Population Adjusted Doses (PADs) (oral, chronic) are from the U.S. EPA Reregistration documents3 or from the U.S. EPA IRIS database.4 Minimal risk levels (MRLs) (oral, chronic or intermediate) are from the Agency for Toxic Substances Disease Registry (ATSDR).5
f. Although U.S. EPA conducted a risk assessment on para-nitrophenol in 1996, it did not establish a RfD because the chemical is registered for non-food use applications only. They did not take into account the presence of this substance in the body as a metabolite of methyl and ethyl parathion.
Notes
1 U.S. Environmental Protection Agency, Pesticide Reregistration Chemical Status, see http://cfpub.epa.gov/oppref/rereg/status.cfm?show=rereg.
2 U.S. Environmental Protection Agency, Integrated Risk Information System (IRIS), see http://www.epa.gov/iris.
3 a) Op. cit., U.S. Environmental Protection Agency, Pesticide Reregis-tration Chemical Status b) U.S. Environmental Protection Agency, Interim Registration Eligi-bility Decision (IRED) for Chlorpyrifos, September 2001, see http://www.epa.gov/oppsrrd1/REDs/chlorpyrifos_ired.pdf.
4 Op. cit., U.S. Environmental Protection Agency, IRIS.
5 Agency for Toxic Substances Disease Registry, Minimal Risk Levels for Hazardous Substances, January 2003, see http://www.atsdr.cdc.gov/mrls.html.
24 Section 2
levels measured by CDC. This chemical-by-chemical analysis also does not account for potential cumulative exposures to multiple neurotoxic OP pesticides with similar mechanisms of action.
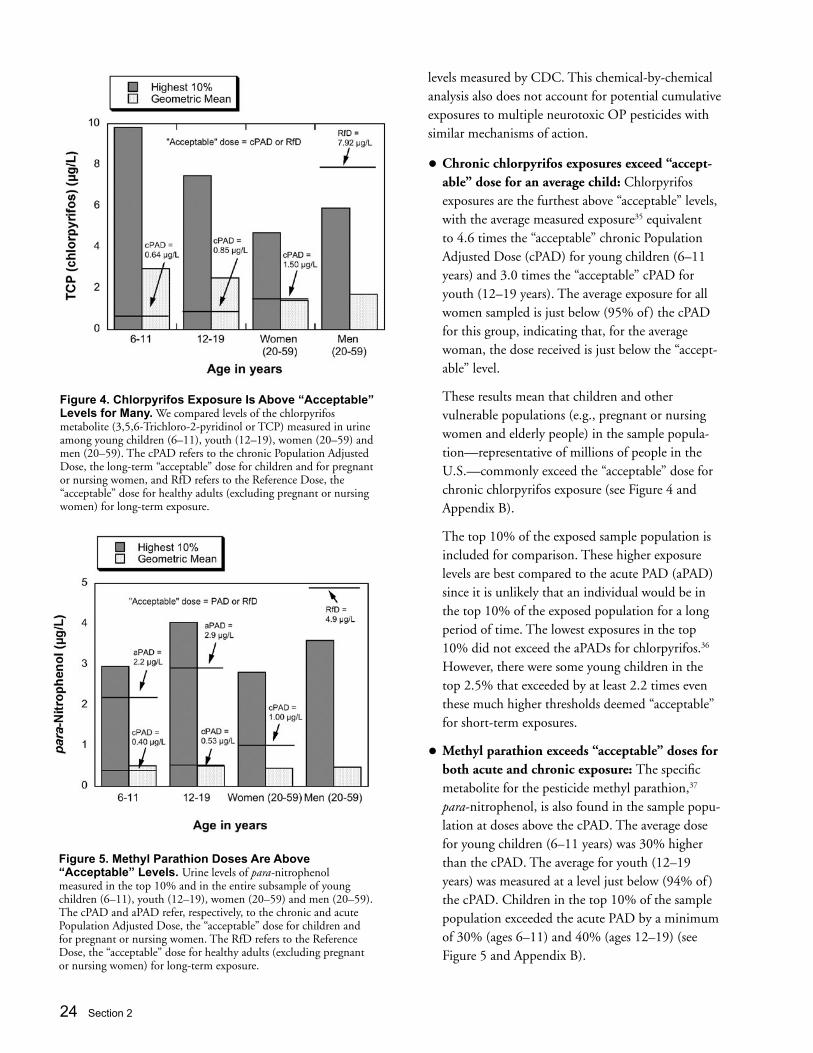
• Chronic chlorpyrifos exposures exceed “accept-able” dose for an average child: Chlorpyrifos exposures are the furthest above “acceptable” levels, with the average measured exposure35 equivalent to 4.6 times the “acceptable” chronic Population Adjusted Dose (cPAD) for young children (6–11 years) and 3.0 times the “acceptable” cPAD for youth (12–19 years). The average exposure for all women sampled is just below (95% of ) the cPAD for this group, indicating that, for the average woman, the dose received is just below the “accept-able” level.
These results mean that children and other vulnerable populations (e.g., pregnant or nursing women and elderly people) in the sample popula-tion—representative of millions of people in the U.S.—commonly exceed the “acceptable” dose for chronic chlorpyrifos exposure (see Figure 4 and Appendix B).
The top 10% of the exposed sample population is included for comparison. These higher exposure levels are best compared to the acute PAD (aPAD) since it is unlikely that an individual would be in the top 10% of the exposed population for a long period of time. The lowest exposures in the top 10% did not exceed the aPADs for chlorpyrifos.36 However, there were some young children in the top 2.5% that exceeded by at least 2.2 times even these much higher thresholds deemed “acceptable” for short-term exposures.
• Methyl parathion exceeds “acceptable” doses for both acute and chronic exposure: The specific metabolite for the pesticide methyl parathion,37 para-nitrophenol, is also found in the sample popu-lation at doses above the cPAD. The average dose for young children (6–11 years) was 30% higher than the cPAD. The average for youth (12–19 years) was measured at a level just below (94% of ) the cPAD. Children in the top 10% of the sample population exceeded the acute PAD by a minimum of 30% (ages 6–11) and 40% (ages 12–19) (see Figure 5 and Appendix B).
Figure 5. Methyl Parathion Doses Are Above “Acceptable” Levels. Urine levels of para-nitrophenol measured in the top 10% and in the entire subsample of young children (6–11), youth (12–19), women (20–59) and men (20–59). The cPAD and aPAD refer, respectively, to the chronic and acute Population Adjusted Dose, the “acceptable” dose for children and for pregnant or nursing women. The RfD refers to the Reference Dose, the “acceptable” dose for healthy adults (excluding pregnant or nursing women) for long-term exposure.
Figure 4. Chlorpyrifos Exposure Is Above “Acceptable” Levels for Many. We compared levels of the chlorpyrifos metabolite (3,5,6-Trichloro-2-pyridinol or TCP) measured in urine among young children (6–11), youth (12–19), women (20–59) and men (20–59). The cPAD refers to the chronic Population Adjusted Dose, the long-term “acceptable” dose for children and for pregnant or nursing women, and RfD refers to the Reference Dose, the “acceptable” dose for healthy adults (excluding pregnant or nursing women) for long-term exposure.

Chemical Trespass 25
Children carry the heaviest body burden of many harmful pesticidesWhen it comes to protecting children from pes-ticides, “acceptable” levels of exposure are mostly lower than those for adults. Children eat more food on a pound-for-pound body weight basis than does an average-weight adult male, thus their exposures from food tend to be higher than those of adults. Young children’s bodies are en-gaged in a wide range of hormone-directed devel-opmental processes that are susceptible to disrup-tion by chemical exposure. Their proportionately larger exposures and unique susceptibilities com-bine to make children much more vulnerable to the adverse effects of pesticides.
As noted in Section 1, there is some evidence suggesting that recent increases in childhood can-cers and neurobehavioral diseases such as autism, ADHD and ADD are correlated to chemical ex-posures. Studies are presently underway to more conclusively evaluate potential links between exposures and disease.
The U.S. Food Quality Protection Act of 1996 recognized that children are not simply small adults. Following recommendations of an in-fluential U.S. National Academy of Sciences study,38 the law requires U.S. EPA to take into consideration the fact that children are uniquely vulnerable to pesticides in the food supply by building an additional uncertainty factor into risk assessments (see box How Much Pesticide Ex-posure is “Acceptable”? on page 26).
CDC’s body burden data show that these most vulnerable members of the population are ex-posed to the highest levels of pesticides and metabolites that were measured in urine—six metabolites of OP insecticides, three chlorinated phenols and the herbicide 2,4-D. For these ten urinary metabolites, young children (6–11 years) had significantly higher levels than adults (20–59 years), youth (12–19 years) or both (see Figure 6; see Appendix A for summary data). As noted by CDC in the initial release of the data, young children carry particularly high body burdens—
nearly twice that of adults—of chlorpyrifos breakdown products in their urine.
Most home uses of chlorpyrifos (widely known by the Dow product name Dursban) were banned by the U.S. EPA as of December 2001, although some use in new construction contin-ues to be permitted until 2005.39 It is encourag-ing to note that researchers in New York City have documented a decrease in chlorpyrifos levels found in umbilical cord blood and an increase in newborn birth weights since the ban has taken effect.40 However, most agricultural uses of chlor-pyrifos continue to be allowed, and an estimated ten million pounds of the pesticide are used each year in agricultural production.41 Chlorpyrifos also remains registered for use in a number of non-agricultural settings (see Section 4 on page 34 for more detail on chlorpyrifos uses). This means that many people continue to be exposed to chlorpyrifos through the food they eat, der-mal contact, residues brought into the home on clothing, and—in regions of high chlorpyrifos use—through the air they breathe.
Figure 6. Children Have the Highest Levels of Many Pesticide Metabolites. For ten of the seventeen pesticides or metabolites evaluated in urine, children age 6–11 have significantly higher levels than youth, adults or both. For two metabolites, adults have higher levels than children. An asterisk indicates breakdown products that are common to many organophosphorus insecticides. (Note: Letters a,b,c in the figure indicate significant differences among age groups, p < 0.05).
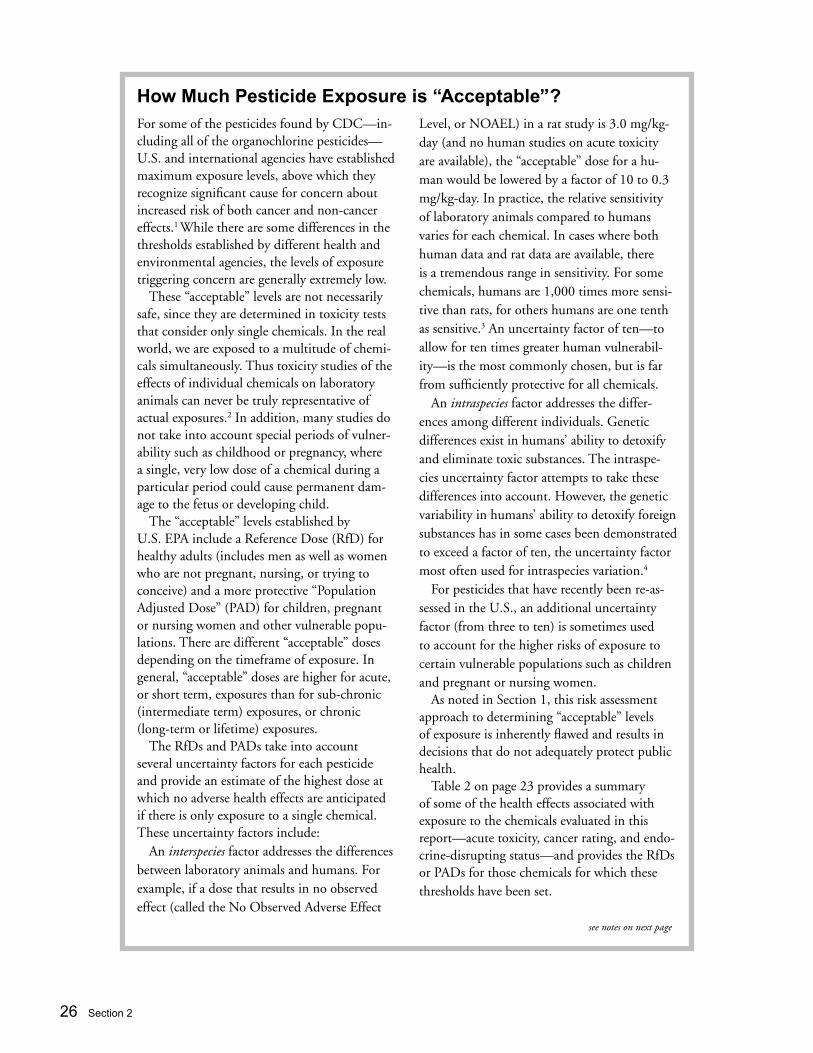
26 Section 2
How Much Pesticide Exposure is “Acceptable”? For some of the pesticides found by CDC—in-cluding all of the organochlorine pesticides—U.S. and international agencies have established maximum exposure levels, above which they recognize significant cause for concern about increased risk of both cancer and non-cancer effects.1 While there are some differences in the thresholds established by different health and environmental agencies, the levels of exposure triggering concern are generally extremely low.
These “acceptable” levels are not necessarily safe, since they are determined in toxicity tests that consider only single chemicals. In the real world, we are exposed to a multitude of chemi-cals simultaneously. Thus toxicity studies of the effects of individual chemicals on laboratory animals can never be truly representative of actual exposures.2 In addition, many studies do not take into account special periods of vulner-ability such as childhood or pregnancy, where a single, very low dose of a chemical during a particular period could cause permanent dam-age to the fetus or developing child.
The “acceptable” levels established by U.S. EPA include a Reference Dose (RfD) for healthy adults (includes men as well as women who are not pregnant, nursing, or trying to conceive) and a more protective “Population Adjusted Dose” (PAD) for children, pregnant or nursing women and other vulnerable popu-lations. There are different “acceptable” doses depending on the timeframe of exposure. In general, “acceptable” doses are higher for acute, or short term, exposures than for sub-chronic (intermediate term) exposures, or chronic (long-term or lifetime) exposures.
The RfDs and PADs take into account several uncertainty factors for each pesticide and provide an estimate of the highest dose at which no adverse health effects are anticipated if there is only exposure to a single chemical. These uncertainty factors include:
An interspecies factor addresses the differences between laboratory animals and humans. For example, if a dose that results in no observed effect (called the No Observed Adverse Effect
Level, or NOAEL) in a rat study is 3.0 mg/kg-day (and no human studies on acute toxicity are available), the “acceptable” dose for a hu-man would be lowered by a factor of 10 to 0.3 mg/kg-day. In practice, the relative sensitivity of laboratory animals compared to humans varies for each chemical. In cases where both human data and rat data are available, there is a tremendous range in sensitivity. For some chemicals, humans are 1,000 times more sensi-tive than rats, for others humans are one tenth as sensitive.3 An uncertainty factor of ten—to allow for ten times greater human vulnerabil-ity—is the most commonly chosen, but is far from sufficiently protective for all chemicals.
An intraspecies factor addresses the differ-ences among different individuals. Genetic differences exist in humans’ ability to detoxify and eliminate toxic substances. The intraspe-cies uncertainty factor attempts to take these differences into account. However, the genetic variability in humans’ ability to detoxify foreign substances has in some cases been demonstrated to exceed a factor of ten, the uncertainty factor most often used for intraspecies variation.4
For pesticides that have recently been re-as-sessed in the U.S., an additional uncertainty factor (from three to ten) is sometimes used to account for the higher risks of exposure to certain vulnerable populations such as children and pregnant or nursing women.
As noted in Section 1, this risk assessment approach to determining “acceptable” levels of exposure is inherently flawed and results in decisions that do not adequately protect public health.
Table 2 on page 23 provides a summary of some of the health effects associated with exposure to the chemicals evaluated in this report—acute toxicity, cancer rating, and endo-crine-disrupting status—and provides the RfDs or PADs for those chemicals for which these thresholds have been set.
see notes on next page
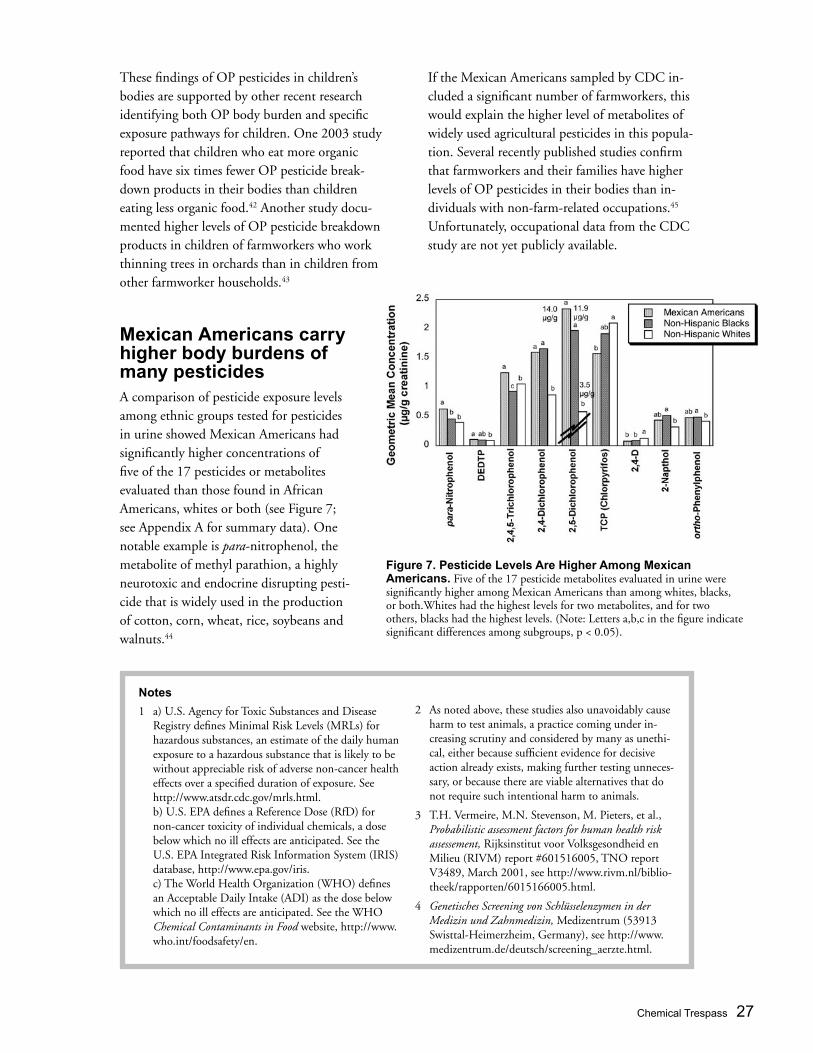
Chemical Trespass 27
These findings of OP pesticides in children’s bodies are supported by other recent research identifying both OP body burden and specific exposure pathways for children. One 2003 study reported that children who eat more organic food have six times fewer OP pesticide break-down products in their bodies than children eating less organic food.42 Another study docu-mented higher levels of OP pesticide breakdown products in children of farmworkers who work thinning trees in orchards than in children from other farmworker households.43
Mexican Americans carry higher body burdens of many pesticidesA comparison of pesticide exposure levels among ethnic groups tested for pesticides in urine showed Mexican Americans had significantly higher concentrations of five of the 17 pesticides or metabolites evaluated than those found in African Americans, whites or both (see Figure 7; see Appendix A for summary data). One notable example is para-nitrophenol, the metabolite of methyl parathion, a highly neurotoxic and endocrine disrupting pesti-cide that is widely used in the production of cotton, corn, wheat, rice, soybeans and walnuts.44
If the Mexican Americans sampled by CDC in-cluded a significant number of farmworkers, this would explain the higher level of metabolites of widely used agricultural pesticides in this popula-tion. Several recently published studies confirm that farmworkers and their families have higher levels of OP pesticides in their bodies than in-dividuals with non-farm-related occupations.45 Unfortunately, occupational data from the CDC study are not yet publicly available.
Figure 7. Pesticide Levels Are Higher Among Mexican Americans. Five of the 17 pesticide metabolites evaluated in urine were significantly higher among Mexican Americans than among whites, blacks, or both.Whites had the highest levels for two metabolites, and for two others, blacks had the highest levels. (Note: Letters a,b,c in the figure indicate significant differences among subgroups, p < 0.05).
Notes
1 a) U.S. Agency for Toxic Substances and Disease Registry defines Minimal Risk Levels (MRLs) for hazardous substances, an estimate of the daily human exposure to a hazardous substance that is likely to be without appreciable risk of adverse non-cancer health effects over a specified duration of exposure. See http://www.atsdr.cdc.gov/mrls.html. b) U.S. EPA defines a Reference Dose (RfD) for non-cancer toxicity of individual chemicals, a dose below which no ill effects are anticipated. See the U.S. EPA Integrated Risk Information System (IRIS) database, http://www.epa.gov/iris. c) The World Health Organization (WHO) defines an Acceptable Daily Intake (ADI) as the dose below which no ill effects are anticipated. See the WHO Chemical Contaminants in Food website, http://www.who.int/foodsafety/en.
2 As noted above, these studies also unavoidably cause harm to test animals, a practice coming under in-creasing scrutiny and considered by many as unethi-cal, either because sufficient evidence for decisive action already exists, making further testing unneces-sary, or because there are viable alternatives that do not require such intentional harm to animals.
3 T.H. Vermeire, M.N. Stevenson, M. Pieters, et al., Probabilistic assessment factors for human health risk assessement, Rijksinstitut voor Volksgesondheid en Milieu (RIVM) report #601516005, TNO report V3489, March 2001, see http://www.rivm.nl/biblio-theek/rapporten/6015166005.html.
4 Genetisches Screening von Schlüsselenzymen in der Medizin und Zahnmedizin, Medizentrum (53913 Swisttal-Heimerzheim, Germany), see http://www.medizentrum.de/deutsch/screening_aerzte.html.
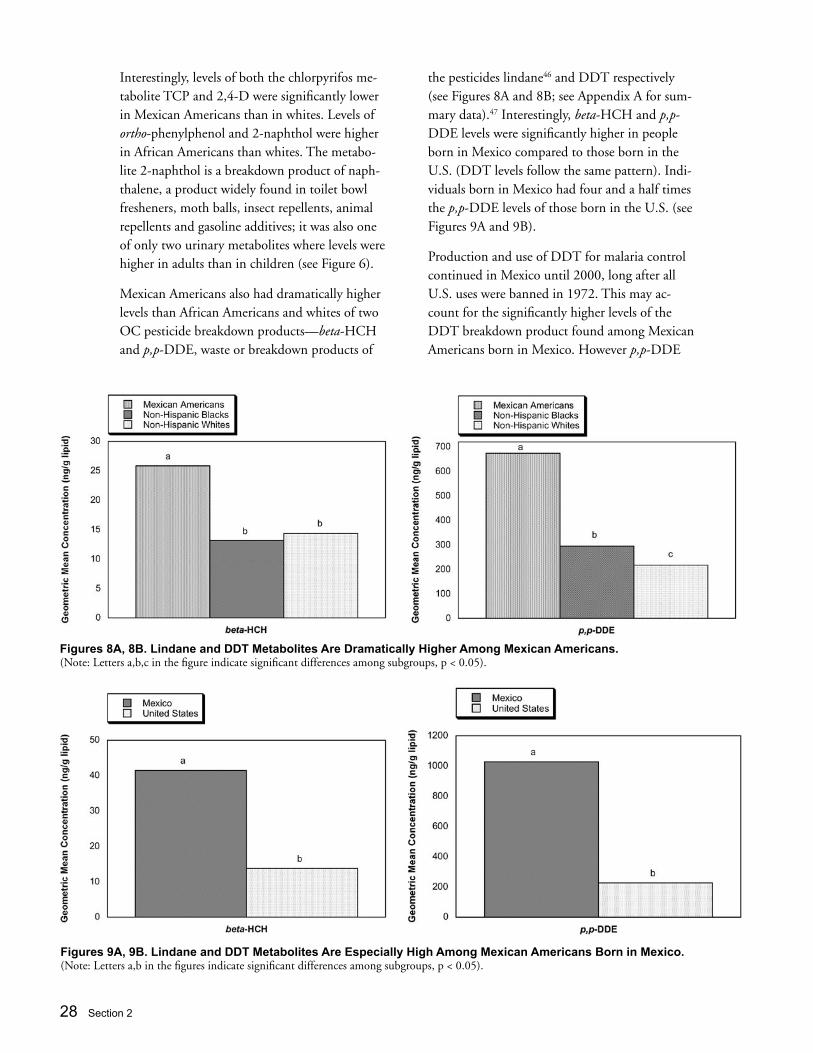
28 Section 2
Figures 9A, 9B. Lindane and DDT Metabolites Are Especially High Among Mexican Americans Born in Mexico. (Note: Letters a,b in the figures indicate significant differences among subgroups, p < 0.05).
Interestingly, levels of both the chlorpyrifos me-tabolite TCP and 2,4-D were significantly lower in Mexican Americans than in whites. Levels of ortho-phenylphenol and 2-naphthol were higher in African Americans than whites. The metabo-lite 2-naphthol is a breakdown product of naph-thalene, a product widely found in toilet bowl fresheners, moth balls, insect repellents, animal repellents and gasoline additives; it was also one of only two urinary metabolites where levels were higher in adults than in children (see Figure 6).
Mexican Americans also had dramatically higher levels than African Americans and whites of two OC pesticide breakdown products—beta-HCH and p,p-DDE, waste or breakdown products of
the pesticides lindane46 and DDT respectively (see Figures 8A and 8B; see Appendix A for sum-mary data).47 Interestingly, beta-HCH and p,p-DDE levels were significantly higher in people born in Mexico compared to those born in the U.S. (DDT levels follow the same pattern). Indi-viduals born in Mexico had four and a half times the p,p-DDE levels of those born in the U.S. (see Figures 9A and 9B).
Production and use of DDT for malaria control continued in Mexico until 2000, long after all U.S. uses were banned in 1972. This may ac-count for the significantly higher levels of the DDT breakdown product found among Mexican Americans born in Mexico. However p,p-DDE
Figures 8A, 8B. Lindane and DDT Metabolites Are Dramatically Higher Among Mexican Americans. (Note: Letters a,b,c in the figure indicate significant differences among subgroups, p < 0.05).
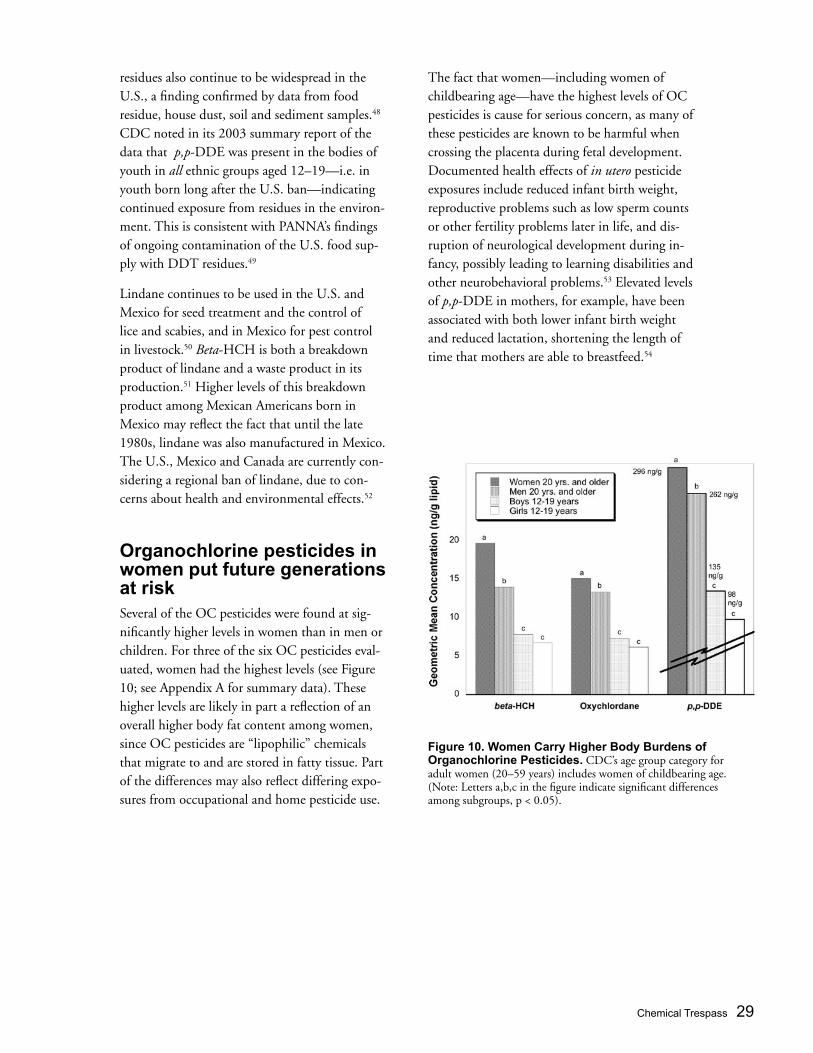
Chemical Trespass 29
Figure 10. Women Carry Higher Body Burdens of Organochlorine Pesticides. CDC’s age group category for adult women (20–59 years) includes women of childbearing age. (Note: Letters a,b,c in the figure indicate significant differences among subgroups, p < 0.05).
residues also continue to be widespread in the U.S., a finding confirmed by data from food residue, house dust, soil and sediment samples.48 CDC noted in its 2003 summary report of the data that p,p-DDE was present in the bodies of youth in all ethnic groups aged 12–19—i.e. in youth born long after the U.S. ban—indicating continued exposure from residues in the environ-ment. This is consistent with PANNA’s findings of ongoing contamination of the U.S. food sup-ply with DDT residues.49
Lindane continues to be used in the U.S. and Mexico for seed treatment and the control of lice and scabies, and in Mexico for pest control in livestock.50 Beta-HCH is both a breakdown product of lindane and a waste product in its production.51 Higher levels of this breakdown product among Mexican Americans born in Mexico may reflect the fact that until the late 1980s, lindane was also manufactured in Mexico. The U.S., Mexico and Canada are currently con-sidering a regional ban of lindane, due to con-cerns about health and environmental effects.52
Organochlorine pesticides in women put future generations at risk Several of the OC pesticides were found at sig-nificantly higher levels in women than in men or children. For three of the six OC pesticides eval-uated, women had the highest levels (see Figure 10; see Appendix A for summary data). These higher levels are likely in part a reflection of an overall higher body fat content among women, since OC pesticides are “lipophilic” chemicals that migrate to and are stored in fatty tissue. Part of the differences may also reflect differing expo-sures from occupational and home pesticide use.
The fact that women—including women of childbearing age—have the highest levels of OC pesticides is cause for serious concern, as many of these pesticides are known to be harmful when crossing the placenta during fetal development. Documented health effects of in utero pesticide exposures include reduced infant birth weight, reproductive problems such as low sperm counts or other fertility problems later in life, and dis-ruption of neurological development during in-fancy, possibly leading to learning disabilities and other neurobehavioral problems.53 Elevated levels of p,p-DDE in mothers, for example, have been associated with both lower infant birth weight and reduced lactation, shortening the length of time that mothers are able to breastfeed.54

30 Section 3
While pesticides are not intentionally designed to enter our bodies, the CDC data demonstrate that many do. Yet we have never consented to this incursion. In this sense, the body burden documented by CDC and in many other stud-ies55 represents an unmistakable chemical trespass on our bodies. Who is responsible?
This question is complicated by the range of ac-tors involved in the development, commercializa-tion and application of pesticides. Also involved are the government agencies which are explicitly
charged with safeguarding public health, occupation-al safety and the environ-ment. Responsibility for pesticides in our bodies, of course, also includes matters of consumer and individual choice.
Despite this complexity, there is little doubt that fundamental responsibil-ity for our pesticide body burden rests with the manufacturers of the offending pesticides. The following are several of the most compelling rea-sons for this view.
Pesticide companies defi ne pest management optionsA handful of large agrochemical companies—corporations like Syngenta, Monsanto, BASF, Dow, DuPont and Bayer—control roughly 65% of the $8.6 billion agrochemical market in the U.S.56 Over the last 50 years, these corporations have largely defi ned the range of pest control
3. Corporate Responsibility for Pesticide Body Burdens
technologies available to farmers and non-agri-cultural users alike. By focusing on products and techniques that are most profi table, rather than those with the fewest adverse environmental, health and social consequences,57 these compa-nies have created a pesticide-dependent approach to pest management.58
Pesticide manufacturers have also helped to cre-ate a “pesticide treadmill.” First they develop and aggressively promote pesticides through advertis-ing, distribution networks and technology exten-sion efforts.59 Then as pests develop resistance to these pesticides, farmers and other users must apply increasing quantities of the same pesticides or switch to “new and improved” products to achieve similar levels of control.60
One outcome of this treadmill is the pesticides in our bodies. Primary responsibility for this tres-pass must be placed at the doorstep of those who, in their own interest, created and maintain the currently dominant model of pest control.
Pesticide companies use political infl uence to promote pesticide useWorldwide, pesticides are a $27.8 billion indus-try.61 Pesticide manufacturers spend millions of this revenue to infl uence politics, media, science and even education (see box The Political and Social Infl uence of Agribusiness on page 32). For example, according to investigative journalists from Newsday and U.S. News and World Report, chemical “industry offi cials are a near-constant presence within the [U.S. EPA], exerting pressure
R esponsibility for
our pesticide
body burden rests with
the manufacturers of
pesticides.
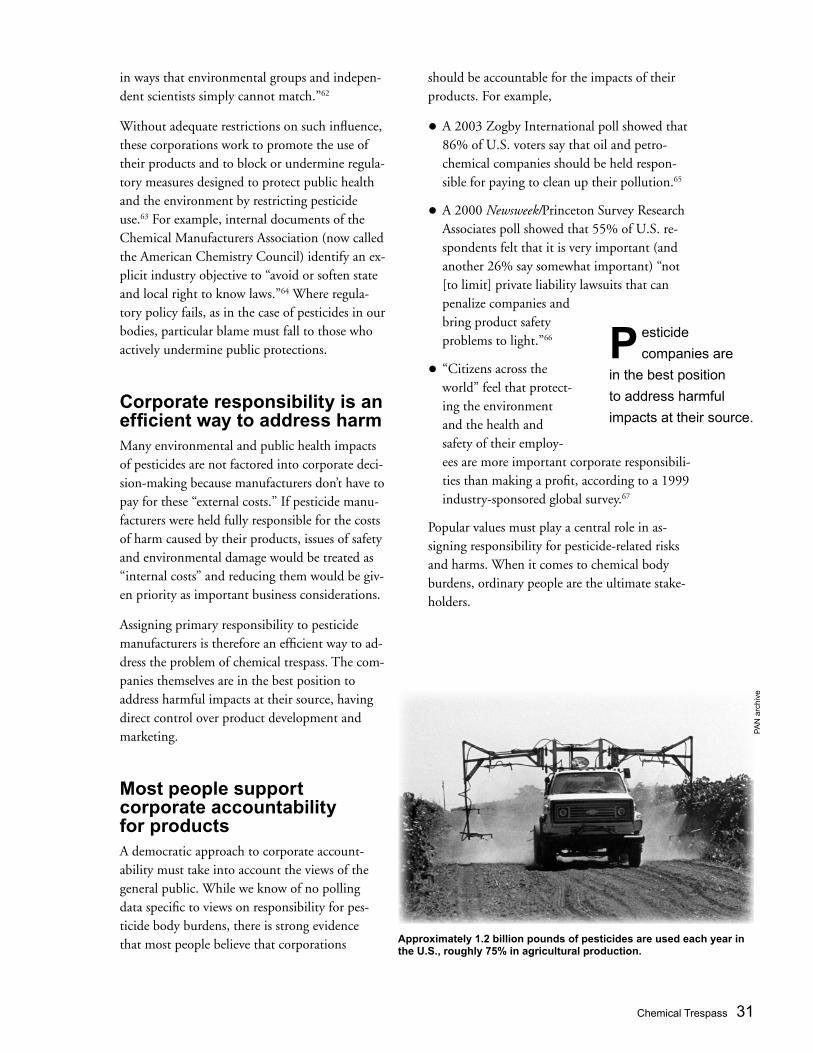
Chemical Trespass 31
P esticide
companies are
in the best position
to address harmful
impacts at their source.
in ways that environmental groups and indepen-dent scientists simply cannot match.”62
Without adequate restrictions on such infl uence, these corporations work to promote the use of their products and to block or undermine regula-tory measures designed to protect public health and the environment by restricting pesticide use.63 For example, internal documents of the Chemical Manufacturers Association (now called the American Chemistry Council) identify an ex-plicit industry objective to “avoid or soften state and local right to know laws.”64 Where regula-tory policy fails, as in the case of pesticides in our bodies, particular blame must fall to those who actively undermine public protections.
Corporate responsibility is an effi cient way to address harmMany environmental and public health impacts of pesticides are not factored into corporate deci-sion-making because manufacturers don’t have to pay for these “external costs.” If pesticide manu-facturers were held fully responsible for the costs of harm caused by their products, issues of safety and environmental damage would be treated as “internal costs” and reducing them would be giv-en priority as important business considerations.
Assigning primary responsibility to pesticide manufacturers is therefore an effi cient way to ad-dress the problem of chemical trespass. The com-panies themselves are in the best position to address harmful impacts at their source, having direct control over product development and marketing.
Most people support corporate accountability for productsA democratic approach to corporate account-ability must take into account the views of the general public. While we know of no polling data specifi c to views on responsibility for pes-ticide body burdens, there is strong evidence that most people believe that corporations
should be accountable for the impacts of their products. For example,
• A 2003 Zogby International poll showed that 86% of U.S. voters say that oil and petro-chemical companies should be held respon-sible for paying to clean up their pollution.65
• A 2000 Newsweek/Princeton Survey Research Associates poll showed that 55% of U.S. re-spondents felt that it is very important (and another 26% say somewhat important) “not [to limit] private liability lawsuits that can penalize companies and bring product safety problems to light.”66
• “Citizens across the world” feel that protect-ing the environment and the health and safety of their employ-ees are more important corporate responsibili-ties than making a profi t, according to a 1999 industry-sponsored global survey.67
Popular values must play a central role in as-signing responsibility for pesticide-related risks and harms. When it comes to chemical body burdens, ordinary people are the ultimate stake-holders.
Approximately 1.2 billion pounds of pesticides are used each year in the U.S., roughly 75% in agricultural production.
PA
N a
rchi
ve

32 Section 3
The Political and Social Influence of AgribusinessThe combined global sales of just the top ten agribusi-ness corporations were $521.5 billion in 1999.1 (The top six agrichemical manufacturers had combined sales of $19.4 billion in 2002.2) With so much revenue, agribusi-ness is able to purchase far-reaching political and social influence.
In the political realm, agribusinesses regularly support political candidates and office holders. For example, the chemical industry reported contributions of $5.5 million to candidates in the 2002 midterm election, in which nine of the top ten recipients of industry money won their races.3 Agribusiness also influences the drafting of laws affecting their industry. For example, U.S. Representative Richard Pombo (R-CA) introduced a bill on pesticide regulation in 2000 that was a near word-for-word duplicate of a 1999 draft written by an industry consulting firm employing for-mer senior U.S. EPA managers.4
Even where agribusiness does not directly exert political influence, holders of high office frequently have invest-ments in and other ties to large corporations that predis-pose them to industry-friendly positions in general. For ex-ample, Secretary of Agriculture Ann Veneman was a former Director of the biotech company Calgene (now owned by Monsanto) and served on the International Policy Council on Agriculture, Food and Trade, a group funded by Cargill, Nestle, Kraft, and Archer Daniels Midland.5 Current U.S. EPA Administrator Michael Leavitt has a net worth of be-tween $7 million and $31 million, derived primarily from ownership of companies involving insurance, real estate, and investment in multinational corporations such as Citi-group, General Electric and IBM.6
Agribusiness also uses its extraordinary resources to influ-ence the news. Through internal public relations (PR) de-partments, external PR firms, and industry-funded think-tanks agribusinesses poll public opinion, lobby reporters, threaten legal action for unflattering media coverage, place strategic op-eds, and provide press releases and “expert” sources.7 For example, the Hudson Institute, funded in part by pesticide giants such as Syngenta, BASF and DuPont, develops publications such as “Surprise! Organic Farming Conversion Increases Pesticide Use” and Saving the Planet with Pesticides and Plastic, among hundreds of other pub-lished materials espousing viewpoints highly supportive of and useful to industry.8
Agribusiness corporations even pursue influence in sci-ence, research and education. Corporate involvement in university research, for example, is rising rapidly, as uni-
versities struggle with reductions in federal and state fund-ing, the expense of high-tech research facilities, and lack of access to proprietary information (including patented genes).9 Many “independent” agricultural researchers sit on corporate boards, own stock and have other financial ties to the companies to which their research relates. Perhaps most disturbing is the fact that agribusiness provides el-ementary and secondary schools with educational materials, training, advice, teachers, presentations, exhibits, contests and awards. According to the industry newsletter Youth Markets Alert, large corporations “want to get them started young.”10
Notes1 “Agribusiness” refers to generally large-scale commercial enter-
prises involved in one or more areas of food and fiber production, such as farming, inputs and machinery, financing, processing, manufacturing, distribution, wholesaling and retailing. The top ten were Wal-Mart Stores, Phillip Morris, Bank of America, Kroger, American International Group, Procter and Gamble, Alb-ertson’s, Safeway, DuPont and Conagra. See Forbes 500s - Rank-ing the Top U.S. Companies, Forbes, 17 April 2000.
2 Pesticide Action Network Updates Service (PANUPS), Agro-chemical Sales Flat in 2002, 14 April 2003, see http://www.panna.org/resources/panups/panup_20030414.dv.html.
3 Chemical Policy Report, Inside Washington Publishers, 6 Novem-ber 2002.
4 G. Lardner Jr. and J. Warrick, Pesticide Coalition Tries to Blunt Regulation, Washington Post, 13 May 2000.
5 Center for Responsive Politics webpage, http://www.opensecrets.org/bush/cabinet/cabinet.veneman.asp, on 20 May 2003.
6 Christopher Smith, Leavitt’s Personal Wealth Revealed: Call him Mike the millionaire, Salt Lake Tribune, 14 February 2004.
7 It is difficult to calculate agribusiness spending to influence the press. Yet we know the figure is remarkable. For example, an in-dustry survey shows that in 1999, looking at only public relations, fees paid by just the food and beverage sector to only a sample of firms was US$5.6 million. The survey was conducted by T. L. Harris and Impulse Research. The PR Industry, Public Relations Online, http://www.public-relations-online.net accessed on 10 April 2004.
8 See the Hudson Institute website at http://www.hudson.org.
9 In one case, for $25 million Novartis corporation secured first rights to negotiate licenses on about a third of all innovations of the University of California at Berkeley Department of Plant and Microbial Biology and to place two representatives on the com-mittee that assesses research proposals and allocates funding. See: a) C. Cummings, Biotechnology Research Deal Draws Anger at U.C. Berkeley, Environment News Service, 24 November 1998, see http://www.foodfirst.org/media/opeds/1998/11-24-novartis.html. b) E. Press and J. Washburn, The Kept University, Atlantic Month-ly, March 2000.
10 S. Manning, Students for Sale, Nation, 27 September 1999.
Chemical Trespass 33
How do we begin to assess the share of respon-sibility for chemical trespass held by a particular pesticide manufacturer? In this section we con-sider this question by looking, quantitatively and qualitatively, at the insecticide chlorpyrifos.
Used in both agricultural and non-agricultural settings, chlorpyrifos is one of the OP pesticides, a class that kills by disrupting the nervous sys-tem. It is a neurotoxicant and a suspected endo-crine disruptor,68 and recent studies indicate it is a developmental neurotoxicant.69 As the CDC data indicate, chlorpyrifos metabolites were found in 93% of people tested, a higher percent-age than for any other pesticide except the DDT breakdown product, DDE. The levels of chlor-pyrifos metabolites found were also the furthest above established safety thresholds, with chronic exposure levels more than four times the level considered “acceptable” for young children.
Dow AgroSciences, a wholly-owned subsidiary of Dow Chemical Corporation, is the primary man-ufacturer of chlorpyrifos.70 The following sec-tions explore the question of Dow’s responsibility for the chlorpyrifos metabolites in our bodies.
Dow’s chlorpyrifos Pesticide Trespass Index and the right to knowPANNA has developed a Pesticide Trespass Index (PTI) to begin identifying to what extent indi-vidual manufacturers are responsible for pesticide body burdens. The PTI is a quantitative mea-sure (a number between 0 and 1) of a pesticide
4. Dow’s Responsibility for Chlorpyrifos Body Burdens
manufacturer’s share of chemical trespass (see box PANNA’s Pesticide Trespass Index on page 35).
Application of the PTI requires accurate in-formation about which companies produce how much of the pesticides used in a particular country or region. Unfortunately, this kind of market share data is closely guarded by industry. In some cases such data are only known within inner industry circles. In other cases, market research companies sell the data, but at prices that are prohibitive for most public interest organizations. For ex-ample, a portion of the information required to determine corporate PTIs for chlorpyrifos is available in a market survey by the Freedonia Group, but the study costs $3,600. In some cases, the information is only sold to chemical manufacturers. We even-tually found a source for market share fi gures for chlorpyrifos, but were told by the market research fi rm that it has a “company policy of not making our data available to the academic and/or public sector.”71
For a single pesticide, the PTI for a manufacturer is equal to its market share. Using a conserva-tive U.S. market-share estimate of 80%,72 Dow’s PTI for the chlorpyrifos in our bodies is 0.8. This suggests that 80% of the U.S. population’s chlorpyrifos body burden is the responsibility of the Dow Chemical Corporation. Access to reli-able market-share data would allow for a more defi nitive assessment, likely pointing to an even
D ow is responsible for
an estimated 80%
of the U.S. population’s
chlorpyrifos body burden.
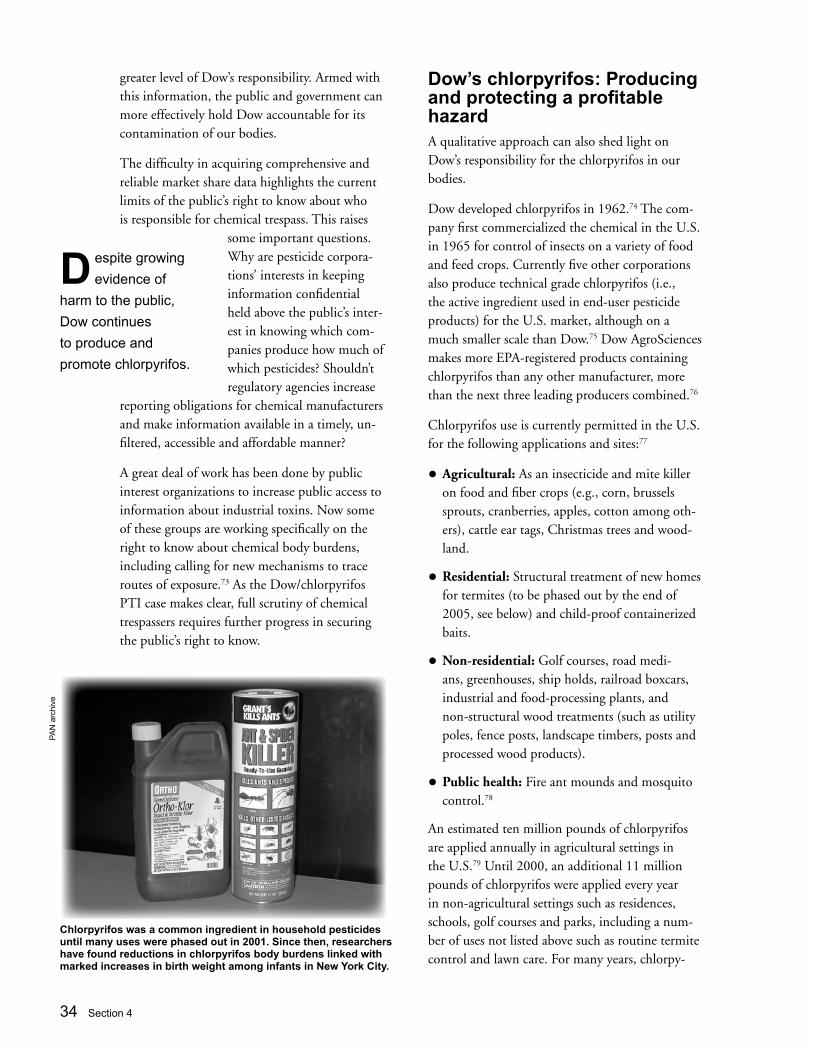
34 Section 4
greater level of Dow’s responsibility. Armed with this information, the public and government can more effectively hold Dow accountable for its contamination of our bodies.
The diffi culty in acquiring comprehensive and reliable market share data highlights the current limits of the public’s right to know about who is responsible for chemical trespass. This raises
some important questions. Why are pesticide corpora-tions’ interests in keeping information confi dential held above the public’s inter-est in knowing which com-panies produce how much of which pesticides? Shouldn’t regulatory agencies increase
reporting obligations for chemical manufacturers and make information available in a timely, un-fi ltered, accessible and affordable manner?
A great deal of work has been done by public interest organizations to increase public access to information about industrial toxins. Now some of these groups are working specifi cally on the right to know about chemical body burdens, including calling for new mechanisms to trace routes of exposure.73 As the Dow/chlorpyrifos PTI case makes clear, full scrutiny of chemical trespassers requires further progress in securing the public’s right to know.
Dow’s chlorpyrifos: Producing and protecting a profi table hazardA qualitative approach can also shed light on Dow’s responsibility for the chlorpyrifos in our bodies.
Dow developed chlorpyrifos in 1962.74 The com-pany fi rst commercialized the chemical in the U.S. in 1965 for control of insects on a variety of food and feed crops. Currently fi ve other corporations also produce technical grade chlorpyrifos (i.e., the active ingredient used in end-user pesticide products) for the U.S. market, although on a much smaller scale than Dow.75 Dow AgroSciences makes more EPA-registered products containing chlorpyrifos than any other manufacturer, more than the next three leading producers combined.76
Chlorpyrifos use is currently permitted in the U.S. for the following applications and sites:77
• Agricultural: As an insecticide and mite killer on food and fi ber crops (e.g., corn, brussels sprouts, cranberries, apples, cotton among oth-ers), cattle ear tags, Christmas trees and wood-land.
• Residential: Structural treatment of new homes for termites (to be phased out by the end of 2005, see below) and child-proof containerized baits.
• Non-residential: Golf courses, road medi-ans, greenhouses, ship holds, railroad boxcars, industrial and food-processing plants, and non-structural wood treatments (such as utility poles, fence posts, landscape timbers, posts and processed wood products).
• Public health: Fire ant mounds and mosquito control.78
An estimated ten million pounds of chlorpyrifos are applied annually in agricultural settings in the U.S.79 Until 2000, an additional 11 million pounds of chlorpyrifos were applied every year in non-agricultural settings such as residences, schools, golf courses and parks, including a num-ber of uses not listed above such as routine termite control and lawn care. For many years, chlorpy-
Chlorpyrifos was a common ingredient in household pesticides until many uses were phased out in 2001. Since then, researchers have found reductions in chlorpyrifos body burdens linked with marked increases in birth weight among infants in New York City.
PA
N a
rchi
ve
D espite growing
evidence of
harm to the public,
Dow continues
to produce and
promote chlorpyrifos.
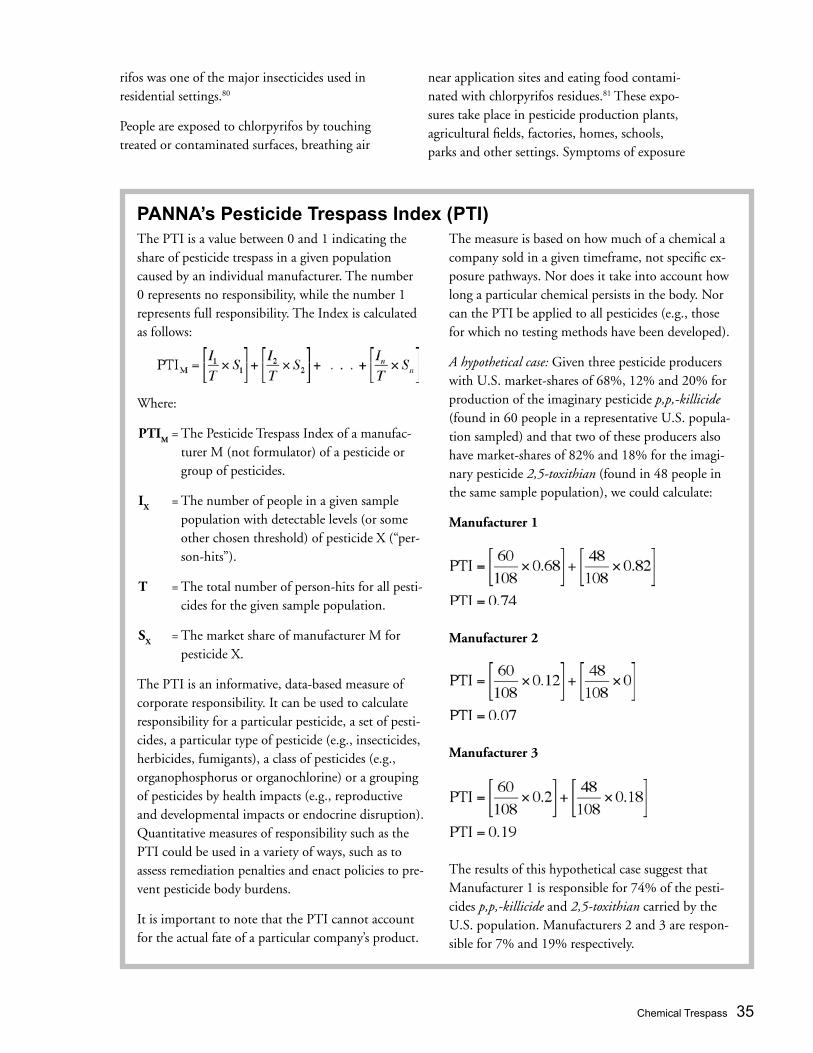
Chemical Trespass 35
PANNA’s Pesticide Trespass Index (PTI)The PTI is a value between 0 and 1 indicating the share of pesticide trespass in a given population caused by an individual manufacturer. The number 0 represents no responsibility, while the number 1 represents full responsibility. The Index is calculated as follows:
Where:
PTIM
= The Pesticide Trespass Index of a manufac-turer M (not formulator) of a pesticide or group of pesticides.
IX
= The number of people in a given sample population with detectable levels (or some other chosen threshold) of pesticide X (“per-son-hits”).
T = The total number of person-hits for all pesti-cides for the given sample population.
SX = The market share of manufacturer M for
pesticide X.
The PTI is an informative, data-based measure of corporate responsibility. It can be used to calculate responsibility for a particular pesticide, a set of pesti-cides, a particular type of pesticide (e.g., insecticides, herbicides, fumigants), a class of pesticides (e.g., organophosphorus or organochlorine) or a grouping of pesticides by health impacts (e.g., reproductive and developmental impacts or endocrine disruption). Quantitative measures of responsibility such as the PTI could be used in a variety of ways, such as to assess remediation penalties and enact policies to pre-vent pesticide body burdens.
It is important to note that the PTI cannot account for the actual fate of a particular company’s product.
The measure is based on how much of a chemical a company sold in a given timeframe, not specific ex-posure pathways. Nor does it take into account how long a particular chemical persists in the body. Nor can the PTI be applied to all pesticides (e.g., those for which no testing methods have been developed).
A hypothetical case: Given three pesticide producers with U.S. market-shares of 68%, 12% and 20% for production of the imaginary pesticide p,p,-killicide (found in 60 people in a representative U.S. popula-tion sampled) and that two of these producers also have market-shares of 82% and 18% for the imagi-nary pesticide 2,5-toxithian (found in 48 people in the same sample population), we could calculate:
Manufacturer 1
Manufacturer 2
Manufacturer 3
The results of this hypothetical case suggest that Manufacturer 1 is responsible for 74% of the pesti-cides p,p,-killicide and 2,5-toxithian carried by the U.S. population. Manufacturers 2 and 3 are respon-sible for 7% and 19% respectively.
rifos was one of the major insecticides used in residential settings.80
People are exposed to chlorpyrifos by touching treated or contaminated surfaces, breathing air
near application sites and eating food contami-nated with chlorpyrifos residues.81 These expo-sures take place in pesticide production plants, agricultural fields, factories, homes, schools, parks and other settings. Symptoms of exposure
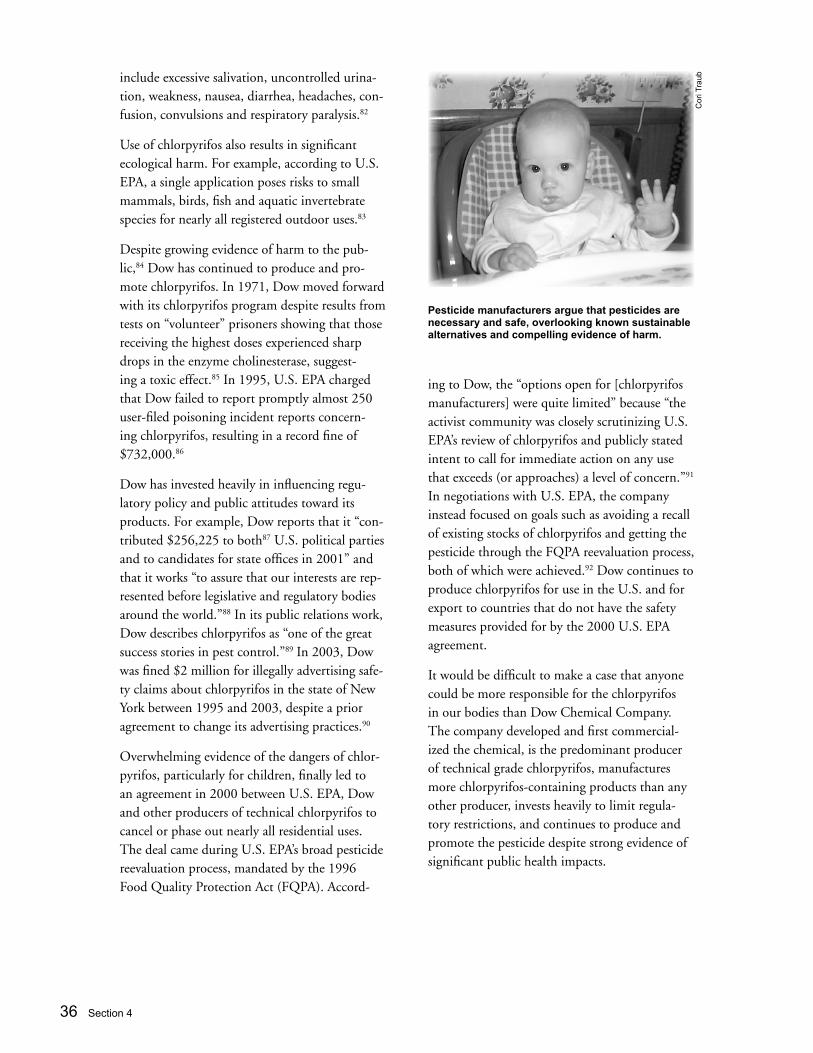
36 Section 4
include excessive salivation, uncontrolled urina-tion, weakness, nausea, diarrhea, headaches, con-fusion, convulsions and respiratory paralysis.82
Use of chlorpyrifos also results in signifi cant ecological harm. For example, according to U.S. EPA, a single application poses risks to small mammals, birds, fi sh and aquatic invertebrate species for nearly all registered outdoor uses.83
Despite growing evidence of harm to the pub-lic,84 Dow has continued to produce and pro-mote chlorpyrifos. In 1971, Dow moved forward with its chlorpyrifos program despite results from tests on “volunteer” prisoners showing that those receiving the highest doses experienced sharp drops in the enzyme cholinesterase, suggest-ing a toxic effect.85 In 1995, U.S. EPA charged that Dow failed to report promptly almost 250 user-fi led poisoning incident reports concern-ing chlorpyrifos, resulting in a record fi ne of $732,000.86
Dow has invested heavily in infl uencing regu-latory policy and public attitudes toward its products. For example, Dow reports that it “con-tributed $256,225 to both87 U.S. political parties and to candidates for state offi ces in 2001” and that it works “to assure that our interests are rep-resented before legislative and regulatory bodies around the world.”88 In its public relations work, Dow describes chlorpyrifos as “one of the great success stories in pest control.”89 In 2003, Dow was fi ned $2 million for illegally advertising safe-ty claims about chlorpyrifos in the state of New York between 1995 and 2003, despite a prior agreement to change its advertising practices.90
Overwhelming evidence of the dangers of chlor-pyrifos, particularly for children, fi nally led to an agreement in 2000 between U.S. EPA, Dow and other producers of technical chlorpyrifos to cancel or phase out nearly all residential uses. The deal came during U.S. EPA’s broad pesticide reevaluation process, mandated by the 1996 Food Quality Protection Act (FQPA). Accord-
ing to Dow, the “options open for [chlorpyrifos manufacturers] were quite limited” because “the activist community was closely scrutinizing U.S. EPA’s review of chlorpyrifos and publicly stated intent to call for immediate action on any use that exceeds (or approaches) a level of concern.”91 In negotiations with U.S. EPA, the company instead focused on goals such as avoiding a recall of existing stocks of chlorpyrifos and getting the pesticide through the FQPA reevaluation process, both of which were achieved.92 Dow continues to produce chlorpyrifos for use in the U.S. and for export to countries that do not have the safety measures provided for by the 2000 U.S. EPA agreement.
It would be diffi cult to make a case that anyone could be more responsible for the chlorpyrifos in our bodies than Dow Chemical Company. The company developed and fi rst commercial-ized the chemical, is the predominant producer of technical grade chlorpyrifos, manufactures more chlorpyrifos-containing products than any other producer, invests heavily to limit regula-tory restrictions, and continues to produce and promote the pesticide despite strong evidence of signifi cant public health impacts.
Pesticide manufacturers argue that pesticides are necessary and safe, overlooking known sustainable alternatives and compelling evidence of harm.
Cor
i Tra
ub
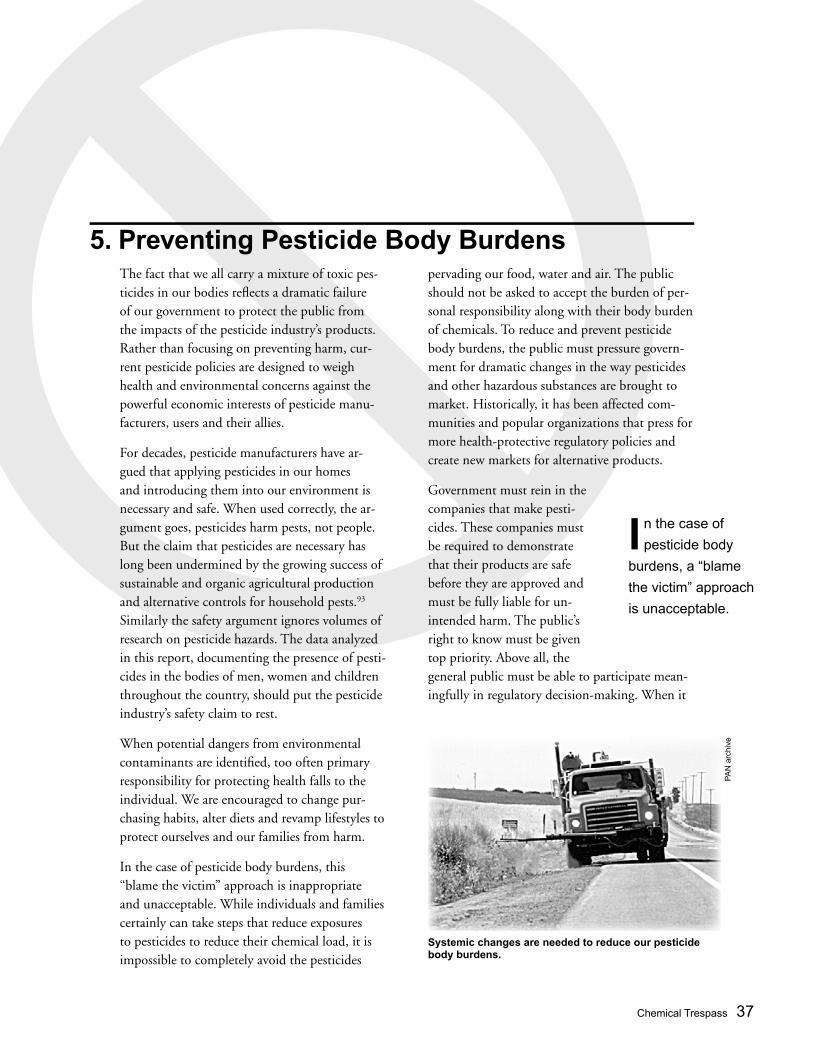
Chemical Trespass 37
The fact that we all carry a mixture of toxic pes-ticides in our bodies refl ects a dramatic failure of our government to protect the public from the impacts of the pesticide industry’s products. Rather than focusing on preventing harm, cur-rent pesticide policies are designed to weigh health and environmental concerns against the powerful economic interests of pesticide manu-facturers, users and their allies.
For decades, pesticide manufacturers have ar-gued that applying pesticides in our homes and introducing them into our environment is necessary and safe. When used correctly, the ar-gument goes, pesticides harm pests, not people. But the claim that pesticides are necessary has long been undermined by the growing success of sustainable and organic agricultural production and alternative controls for household pests.93 Similarly the safety argument ignores volumes of research on pesticide hazards. The data analyzed in this report, documenting the presence of pesti-cides in the bodies of men, women and children throughout the country, should put the pesticide industry’s safety claim to rest.
When potential dangers from environmental contaminants are identifi ed, too often primary responsibility for protecting health falls to the individual. We are encouraged to change pur-chasing habits, alter diets and revamp lifestyles to protect ourselves and our families from harm.
In the case of pesticide body burdens, this “blame the victim” approach is inappropriate and unacceptable. While individuals and families certainly can take steps that reduce exposures to pesticides to reduce their chemical load, it is impossible to completely avoid the pesticides
5. Preventing Pesticide Body Burdenspervading our food, water and air. The public should not be asked to accept the burden of per-sonal responsibility along with their body burden of chemicals. To reduce and prevent pesticide body burdens, the public must pressure govern-ment for dramatic changes in the way pesticides and other hazardous substances are brought to market. Historically, it has been affected com-munities and popular organizations that press for more health-protective regulatory policies and create new markets for alternative products.
Government must rein in the companies that make pesti-cides. These companies must be required to demonstrate that their products are safe before they are approved and must be fully liable for un-intended harm. The public’s right to know must be given top priority. Above all, the general public must be able to participate mean-ingfully in regulatory decision-making. When it
Systemic changes are needed to reduce our pesticide body burdens.
PA
N a
rchi
ve
I n the case of
pesticide body
burdens, a “blame
the victim” approach
is unacceptable.
38 Section 5
comes to pesticide body burdens, our bodies are on the line.
Recommendations for corporations and governmentThe following are PANNA’s recommendations for urgently needed actions to reduce and pre-vent pesticide body burdens.
U.S. EPA should:
• Ban pesticides that are known to build up in people's bodies (a process known as bioaccu-mulation), including those with bioaccumula-tive breakdown products. This includes an immediate ban of lindane, an action currently being considered under the North American Regional Action Plan of the Commission on Environmental Cooperation.
• Ban pesticides that are widely used, known to be hazardous and pervasive in the environ-ment and our bodies. This includes an imme-diate ban of agricultural uses of the pesticide chlorpyrifos.
• Require pesticide manufacturers to report de-tailed information to U.S. EPA on the produc-tion, sales and use of their products. U.S. EPA should make this information available to the public in a timely, unfiltered, accessible and affordable manner. The costs of this reporting should be paid by industry, not the public.
• Require that pesticides undergo an alternatives assessment process, including a credible dem-
onstration by pesticide manu-facturers that safer alternatives are not available for controlling the target pest as a condition of registration. U.S. EPA should also require that manufacturers bear the burden of proof for demonstrating that a pesticide
does not harm human health—meaning a pes-ticide is guilty until proven innocent, not the other way around.
• Initiate an aggressive transition to a precau-tionary approach to pesticide regulation, de-
signed to prevent public exposure to pesticides and the creation of pesticide body burdens, with a particular focus on vulnerable popula-tions. This transition must include collabora-tion with the U.S. Department of Agriculture to support and promote sustainable agricultur-al production, including substantial increases in funding for research, extension and training in organic and sustainable production methods.
U.S. Congress should:
• Ratify the Stockholm Convention on Persis-tent Organic Pollutants (POPs), an interna-tional treaty which targets 12 bioaccumulating chemicals for global elimination. The ratifica-tion must include strong implementing legis-lation that allows for a streamlined U.S. phase-out of chemicals identified as POPs under the Convention in the future and supports full U.S. participation in treaty implementation.
• Ensure ongoing funding of chemical body burden data collection and analysis by CDC, including establishment of appropriate pesti-cide manufacture fees earmarked for this pur-pose.
• Conduct a thorough and independent investi-gation into corporate responsibility and liabil-ity for pesticide body burdens, and establish financial mechanisms shifting the health and environmental costs of pesticides to the corpo-rations that produce them.
Centers for Disease Control and Prevention should:
• Expand pesticide body burden monitoring to include targeted monitoring in areas of inten-sive pesticide use to help address knowledge gaps about highly exposed populations.
• Expand the list of pesticides and other chemi-cals tested for in its biennial studies, and make the full data sets from these studies more read-ily accessible to the public, including more detailed demographic and occupational data.
• Aggressively pursue its stated mission to “pro-mote health and quality of life by preventing and controlling disease, injury and disability,”
G overnment
must rein in
the companies that
make pesticides.
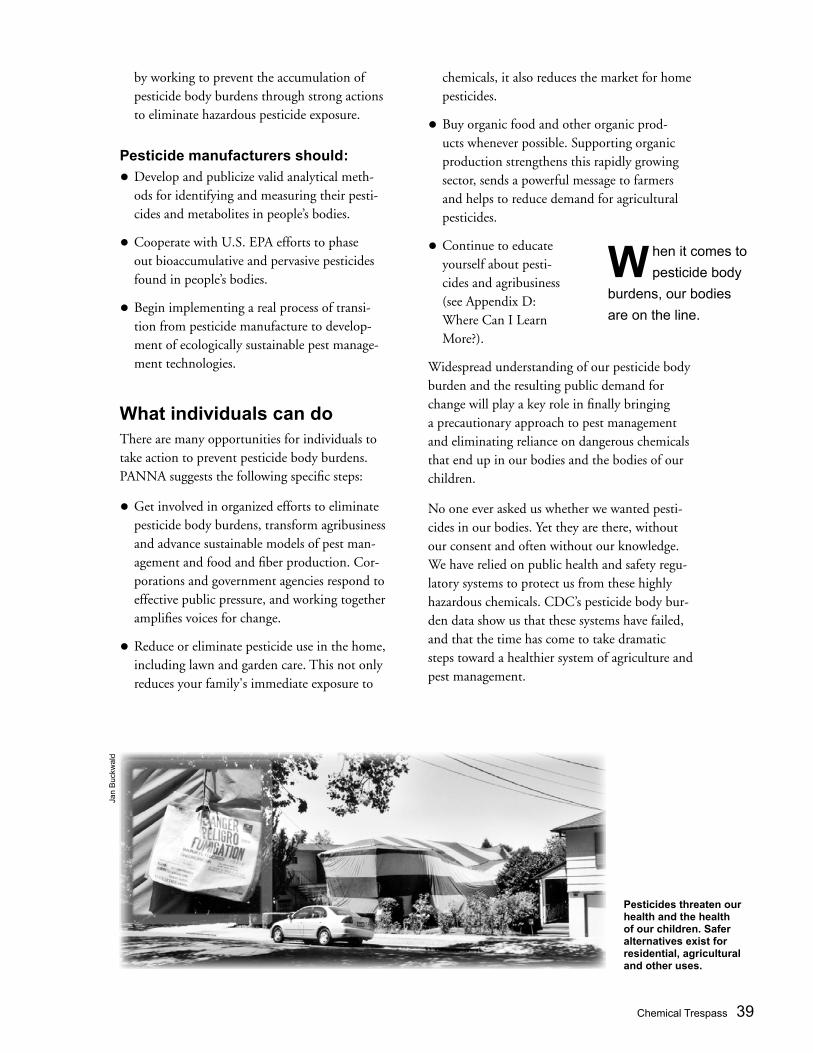
Chemical Trespass 39
by working to prevent the accumulation of pesticide body burdens through strong actions to eliminate hazardous pesticide exposure.
Pesticide manufacturers should:
• Develop and publicize valid analytical meth-ods for identifying and measuring their pesti-cides and metabolites in people’s bodies.
• Cooperate with U.S. EPA efforts to phase out bioaccumulative and pervasive pesticides found in people’s bodies.
• Begin implementing a real process of transi-tion from pesticide manufacture to develop-ment of ecologically sustainable pest manage-ment technologies.
What individuals can doThere are many opportunities for individuals to take action to prevent pesticide body burdens. PANNA suggests the following specifi c steps:
• Get involved in organized efforts to eliminate pesticide body burdens, transform agribusiness and advance sustainable models of pest man-agement and food and fi ber production. Cor-porations and government agencies respond to effective public pressure, and working together amplifi es voices for change.
• Reduce or eliminate pesticide use in the home, including lawn and garden care. This not only reduces your family's immediate exposure to
chemicals, it also reduces the market for home pesticides.
• Buy organic food and other organic prod-ucts whenever possible. Supporting organic production strengthens this rapidly growing sector, sends a powerful message to farmers and helps to reduce demand for agricultural pesticides.
• Continue to educate yourself about pesti-cides and agribusiness (see Appendix D: Where Can I Learn More?).
Widespread understanding of our pesticide body burden and the resulting public demand for change will play a key role in fi nally bringing a precautionary approach to pest management and eliminating reliance on dangerous chemicals that end up in our bodies and the bodies of our children.
No one ever asked us whether we wanted pesti-cides in our bodies. Yet they are there, without our consent and often without our knowledge. We have relied on public health and safety regu-latory systems to protect us from these highly hazardous chemicals. CDC’s pesticide body bur-den data show us that these systems have failed, and that the time has come to take dramatic steps toward a healthier system of agriculture and pest management.
Pesticides threaten our health and the health of our children. Safer alternatives exist for residential, agricultural and other uses.
Jan
Buc
kwal
d
W hen it comes to
pesticide body
burdens, our bodies
are on the line.

40 Notes
1 See http://www.chemicalbodyburden.org for discussion and citations regarding body burden studies in different parts of the world.
2 See http://www.nrdc.org/breastmilk and http://www.chemical-bodyburden.org for a sampling of recent studies documenting pesticide body burden. See also: a) Environmental Working Group, Body Burden: The Pollution in People (Washington, DC) 2003. http://www.ewg.org/reports/bodyburden.b) A. Bradman, D.B. Barr, B.G. Claus Henn, et al., Measurement of Pesticides and Other Toxicants in Amniotic Fluid as a Potential Biomarker of Prenatal Exposure: A Validation Study, Environ Health Perspect, 2003, 111(14)1779-82. This article describes a relatively small “validation” study found breakdown products from a range of pesticides in amniotic fl uid, indicating direct ex-posure to chemicals during fetal development.
3 See, for example: a) R.A. Fenske, J.C. Kissel, C.Lu, D.A. Kalman, N.J. Simcox, E.H. Allen, and M.C. Keifer, Biologically based pesticide dose es-timates for children in an agricultural community, Environ Health Perspect, 2000, 108(6): 515-20. b) C.L. Curl, R.A. Fenske, and K. Elgehun, Organophosphorus pesticide exposure of urban and suburban preschool children with organic and conventional diets, Environ Health Perspect, 2003, 111(3): 377-82. c) C. Aprea, M. Strambi, M.T. Novelli, L. Lunghini, and N. Bozzi, Biologic monitoring of exposure to organophosphorus pesticides in 195 Italian children, Environ Health Perspect, 2000, 108(6): 521.
4 U.S. EPA registered chemicals are those that can currently be le-gally used in the U.S., except in states where state laws are stricter than federal laws and prohibit such use. See http://www.pestici-deinfo.org/Docs/ref_regulatoryUS.html.
5 This fi gure refers to pesticide active ingredients, excluding water treatment chemicals. See T. Kiely, D. Donaldson, and A. Grube, Pesticides Industry Sales and Usage: 2000 and 2001 Market Esti-mates, U.S. EPA, Offi ce of Pesticide Programs, 2004.
6 a) National Center for Environmental Health, U.S. Centers for Disease Control and Prevention, Second National Report on Hu-man Exposure to Environmental Chemicals, January 2003, http://www.cdc.gov/exposurereport.b) CDC’s fi rst study monitored 27 chemicals, nine of them pesticides. See National Center for Environmental Health, U.S. Centers for Disease Control and Prevention, National Report on Human Exposure to Environmental Chemicals, March 2001, http://www.cdc.gov/nceh/dls/report/.
7 U.S. Food and Drug Administration Center for Food Safety and
NotesApplied Nutrition Pesticide Program, FDA Pesticide Program Residue Monitoring 1993-2001, April 2003, see http://vm.cfsan.fda.gov/~dms/pesrpts.html.
8 B. Heavner, Toxics on Tap: Pesticides in California Drinking Water Sources, California Public Interest Research Group Charitable Trust (San Francisco, CA) 1999, see http://www.pesticidereform.org/resources/tap.pdf.
9 S. Kegley, A. Katten, M. Moses, Secondhand Pesticides: Airborne Pesticide Drift in California, Pesticide Action Network North America, California Rural Legal Assistance Foundation and Pesti-cide Education Center (San Francisco CA) 2003, see http://www.panna.org/resources/documents/secondhandDriftAvail.dv.html.
10 R.A. Rudel, D.E. Camann, J.D. Spengler, et al., Phthalates, alkyl-phenols, pesticides, polybrominated diphenyl ethers, and other endocrine-disrupting compounds in indoor air and dust, Environ Sci Technol, 2003, 37(20): 4543-53.
11 Op. cit., S. Kegley et al., 2003, reference 9.
12 Individuals vary widely in the speed and effi ciency of this process. See for example B.W. Lee, L. London, J. Paulauskis, J. Myers, and D.C. Christiani, Association Between Human Paraoxonase Gene Polymorphism and Chronic Symptoms in Pesticide-Exposed Workers, J Occup Environ Med, 2003, 45(2): 118-122.
13 Op. cit., T. Kiely et al., reference 5.
14 Many OC pesticides are “persistent organic pollutants” a class of chemicals that is toxic, bioaccumulates, and can be transported across the globe. The Stockholm Convention on Persistent Or-ganic Pollutants, a treaty mandating the global elimination of this class of chemicals, comes into effect in May 2004. See http://www.pops.int for more information.
15 In a 2001 analysis of selected organochlorine pesticide residues in the U.S. food supply, Pesticide Action Network found that even chemicals that have been banned for decades show up consistently in food samples tested by the U.S. Food and Drug Administra-tion. This can be explained in part by the long life of many or-ganochlorines in the environment, and in part by long distance transport in wind and water currents—as well as on imported foods—of pesticides that continue to be used in other countries. See K. Schafer, S.E. Kegley, and S. Patton, Nowhere to Hide: Per-sistent Toxic Chemicals in the U.S. Food Supply. Pesticide Action Network North America and Commonweal (San Francisco CA) March 2001, http://www.panna.org/resources/documents/no-whereToHideAvail.dv.html.
16 See http://www.pesticides.org/educmaterials.html and http://www.protectingourhealth.org/ for more information on linkages between pesticide exposure and specifi c health effects.
Chemical Trespass 41
17 G. Solomon, O. Ogunseitan, and J. Kirsch, Pesticides and Human Health, Physicians for Social Responsibility and Californians for Pesticide Reform (San Francisco, CA) 2000, see http://www.psrla.org/pesthealthmain.htm.
18 These studies also unavoidably cause harm to test animals, a prac-tice coming under increasing scrutiny and considered by many as unethical, either because sufficient evidence for decisive action already exists, making further testing unnecessary, or because there are viable alternatives that do not require such intentional harm to animals.
19 a) M.P. Longnecker, M.A. Klebanoff, et al., Association between maternal serum concentration of the DDT metabolite DDE and pre-term and small-for-gestational-age babies at birth, Lancet, 2001, 358(9276): 110-114. b) F.P. Perera, V. Rauh, et al., Effects of transplacental exposure to environmental pollutants on birth outcomes in a multiethnic population, Environ Health Perspect, 2003, 111(2): 201-205. c) E.M. Bell, I. Hertz-Picciotto, and J.J. Beaumont, A case-con-trol study of pesticides and fetal death due to congenital anoma-lies, Epidemiology, 2001, 22(2): 148-156. d) D. Williamson, Study: Living near where pesticides used may boost fetal death due to birth defects, UNC News Services, 13 February 2001. e) News note: Agricultural pesticides linked to fetal death, Global Pesticide Campaigner, April 2001, 11(1): 28, see http://www.panna.org/resources/gpc/gpc_200104.11.1.18.dv.html. f ) E. Regidor, E. Ronda, A.M. García, and V. Domínguez, Pa-ternal exposure to agricultural pesticides and cause specific fetal death, Occup Environ Med, 2004, 61: 334-339, see http://oem.bmjjournals.com/cgi/content/abstract/61/4/334.
20 R.M. Whyatt, V. Rauh, D.B. Barr, et al., Prenatal Insecticide Exposures, Birth Weight and Length Among an Urban Minority Cohort, Environ Health Perspect, 2004, doi: 10.1289/ehp.6641, see http://ehp.niehs.nih.gov/members/2004/6641/6641.html.
21 See box on page 16, “Evidence Links Chronic Illnesses and Pes-ticide Exposure.” For a more detailed summary of health effects associated with pesticides, including references to the original literature, see Op. cit., S. Kegley, et al., 2003, pp. 10–13, refer-ence 9.
22 National Research Council, Commission on Life Sciences, Sci-entific Frontiers in Developmental Toxicity and Risk Assessment, January 2000, see http://www4.nationalacademies.org/news.nsf/isbn/0309070864?OpenDocument.
23 Learning Disabilities Association of Maine, LDA of Maine to participate in LDAA Healthy Children’s Project, see http://www.ldame.org/news_hcp.htm.
24 See http://www.aghealth.org/results.html for the latest results of this ongoing research project.
25 Op. cit., National Center for Environmental Health, 2003, p. 159, reference 6a.
26 This issue was directly addressed in discussion with the CDC report authors during the teleconference release of the report, 31 January, 2003.
27 For some pesticides, valid analytical methods for identifying and measuring pesticides and metabolites in people’s bodies have not yet been developed.
28 Op. cit., National Center for Environmental Health, 2003, refer-ence 6a.
29 Other chemicals found in the two studies include polychlorinated biphenyls (PCBs), dioxins and furans (industrial by-products) and phthalates (softening agents widely used in cosmetics, toys and other consumer products).
30 For this ethnic group CDC uses the term “non-Hispanic blacks”. We use “African Americans” in the text, “blacks” in figures and tables.
31 D.B. Barr, R. Bravo, G. Weerasekera, et al., Concentrations of dialkylphosphate metabolites of organophosphorus pesticides in the U.S. population, Environ Health Perspect, 2004, 112(2): 186-200.
32 a) Op. cit. C.L. Curl et al., 2003, reference 3b. b) R. Castorina, A. Bradman, T.E. McKone, et al., Cumula-tive Organophosphate Pesticide Exposure and Risk Assessment Among Pregnant Women Living in an Agricultural Community: A Case Study from the CHAMACOS Cohort, Environ Health Perspect, 2003, 111: 1640–1648.
33 Of the five pesticides which have recently been reevaluated, RfDs for two (chlorpyrifos and carbaryl) decreased (became more pro-tective) by a factor of 10, while the three others (malathion, meth-yl parathion, and lindane) remained the same. Source: U.S. EPA Reregistration Eligibility Decision documents. Older RfD values available from ExToxNet, Pesticide Information Profiles, Oregon State University, see http://extoxnet.orst.edu/pips/ghindex.html.
34 a) R.J. Feldmann, H.I. Maibach, Percutaneous absorption of some pesticides and herbicides in man, Toxicol Appl Pharmacol, 1974, 28: 126–132. b) W. Nolan, Toxicol Appl Pharmacol, 1984, 73: 8–15.
35 Calculated as a geometric mean. See Appendix A.
36 Acute PADs for chlorpyrifos are 10.6 µg/L for ages 6–11; 14.2 µg/L for ages 12–19; 25.0 µg/L for women 20–59; and 132 µg/L for men 20–59.
37 Para-Nitrophenol is also the breakdown product of ethyl para-thion, but this pesticide is scheduled for phase-out by the end of 2002, with use during the time period of the NHANES study re-stricted to crops from which U.S. EPA predicted dietary exposure would be minimal. Ethyl parathion is not a persistent chemical, so exposures at the time of the study were likely due primarily to exposures to methyl parathion. See U.S. EPA, RED Facts: Ethyl Parathion, EPA-738-F00-009, September 2000, http://cfpub.epa.gov/oppref/rereg/status.cfm?show=rereg#E.
38 National Research Council. Pesticides in the Diets of Infants and Children, National Academy Press (Washington, DC) 1993.
39 U.S. EPA Program Update: EPA Issues Cancellation Order for Chlorpyrifos Products, 25 January, 2002; and U.S. Environmen-tal Protection Agency, Chlorpyrifos Revised Risk Assessment and Agreement with Registrants, June 2000, see http://www.epa.gov/pesticides/op/chlorpyrifos/agreement.pdf.
40 Op. cit., R.M. Whyatt et al., 2004, reference 20.
41 U.S. EPA, Chlorpyrifos Facts, EPA 738-F-01-006, February 2002, see http://www.epa.gov/oppsrrd1/REDs/factsheets/chlorpy-rifos_fs.htm.
42 a) Op. cit., C.L. Curl et al., 2003, reference 3b. b) Pesticide Action Network North America (PANNA), Eating organics cuts kids’ pesticide loads, PANUPS, 31 January 2003, see http://www.panna.org/resources/panups/panup_20030131.dv.html.
42 Notes
43 a) G.D. Coronado, B. Thompson, L. Strong, et al., Agri-cultural Tasks and Exposure to Organophosphate Pesticides Among Farmworkers, Environ Health Perspect, February 2004, 112(2): 142-147, see http://ehpnet1.niehs.nih.gov/mem-bers/2003/6412/6412.pdf. b) J. Davidow, Fruit thinners’ kids may be at risk from pesticides, Seattle Post-Intelligencer, Washington, 6 February 2004, see http://seattlepi.nwsource.com/local/159583_pesticides06.html. c) A recently published analysis of some of the OPs found in the CDC body burden study confirmed that young children carry higher levels of these chemicals than other age groups. See D.B Barr, R. Bravo, G. Weerasekera, et al., Concentrations of dialkyl-phosphate metabolites of organophosphorus pesticides in the U.S. population, Environ Health Perspect, 2004, 112(2): 186-200.
44 U.S. Environmental Protection Agency, Interim Registration Eligi-bility Decision (IRED) for Methyl parathion, May 2003, see http://www.epa.gov/oppsrrd1/REDs/methylparathion_ired.pdf.
45 See for example: a) Op. cit., R.A. Fenske et al., 2000, reference 3a. b) Op. cit., G.D. Coronado et al., 2004, reference 43a.
46 Beta-HCH is both a direct waste product from the production of lindane (gamma-HCH), and a direct and indirect breakdown product. When it is in air, gamma-HCH can be photochemi-cally converted to another HCH isomer, alpha-HCH. Both gamma-HCH and alpha-HCH can then be biologically trans-formed to beta-HCH, which is much more persistent than the other isomers. See Commission for Environmental Cooperation, Substance Selection Task Force for the Sound Management of Chemicals Working Group, Decision Document on Lindane, Under the Process for Identifying Candidate Substances for Regional Action under the Sound Management of Chemicals Initiative, April 2000.
47 The same appeared to be true for DDT, but because the log-trans-formed data were not normally distributed, we omitted those data from our statistical analyses.
48 a) Op. cit., K. Schafer et al., 2001, reference 15. b) Op. cit., R.A. Rudel et al., 2003, reference 10. c) For sediments: See data from studies that are part of the Na-tional Water Quality Assessment Program, U.S. Geological Survey, http://water.usgs.gov/nawqa.
49 a) Op. cit., K. Schafer et al., 2001, reference 15. b) Pesticide Action Network North America (PANNA), POPs Residues in U.S. Diets. PANUPS, 4 December 2000, see http://www.panna.org/resources/pinups/panup_20001204.dv.
50 In 1990 the estimated annual usage of lindane was 114 tons in the U.S and 261 tons in Mexico. See Y.F. Li, A. McMilllan and M.T. Scholtz, Global HCH usage with 1x1 longitude/latitude resolution, Environ Sci Technol, 1996, 30: 3525-3533.
51 a) Agency for Toxic Substances and Disease Registry (ATSDR), Toxicological profile for Alpha-, Beta-, Gamma-, and Delta-Hexa-chlorocyclohexane, U.S. Department of Health and Human Ser-vices, Public Health Service, Agency for Toxic Substances and Disease Registry, September 1997. b) Indian and Northern Affairs Canada, Northern Contaminants Program, Canadian arctic contaminants assessment report I, 1997.
52 See North American Commission for Environmental Coopera-tion, http://www.cec.org.
53 See for example: a) Op. cit., M.P. Longnecker et al., 2001, reference 19a. b) N. Pant, R. Shankar, and S.P. Srivastava, In utero and lacta-
tional exposure of carbofuran to rats: effect on testes and sperm, Hum Exp Toxicol, May 1997, 16(5): 267-72. c) Op. cit., National Research Council, 2000, reference 22. d) G. Solomon, and T. Schettler, Generations at risk: Reproductive health and the environment, (MIT Press) July 1999. e) T. Schettler, J. Stein, F. Reich, et al., In harm’s way: Toxic threats to child development, Greater Boston Physicians for Social Respon-sibility (Red Sun Press, Boston, MA), May 2000, see http://www.igc.org/psr/ihwrept/ihwcomplete.pdf
54 a) Op. cit., M.P. Longnecker et al., 2001, reference 19a. b) B.C. Gladen and W.J. Rogan, DDE and shortened duration of lactation in a northern Mexican town, Am J Public Health, 1995, 85(4): 504-8.
55 See references 1 and 2.
56 Pesticides to 2006 (Freedonia Industry Study #1523), Freedonia, February 2002. More about Freedonia can be found at http://www.freedoniagroup.com.
57 See for example J. Ikerd, Ph.D., Corporate Agriculture and Fam-ily Farms, 20 January 2001, available at http://www.ssu.missouri.edu/faculty/jikerd/papers/CoporateAgandFamilyFarms.htm.
58 The experience of the agrochemical giants mirrors that of big agri-business generally. Agribusiness has become the primary developer of crop varieties and farm machinery, handlers of commodities, and manufacturers of most of our food. It has created an indus-trial system of food production, leaving the bulk of small farmers with little choice about how to grow food and fiber. For more see S. Spitzer, Industrial Agriculture and Corporate Power, 2003, available at http://www.panna.org/iacp.
59 For example, Monsanto spent US$103 million on advertising in 2003, although this figure also includes expenditures for its seeds as well as pesticides. Monsanto Annual Report 2003, Monsanto Company, p. 80.
60 The pesticide treadmill, for example, has created resistance to broad-spectrum insecticides in more than 500 pest species na-tionwide. See S. Kegley, L. Neumeister, and T. Martin, Disrupting the Balance: Ecological impacts of pesticides in California, Pesticide Action Network and Californians for Pesticide Reform (San Fran-cisco CA) 1999, http://www.panna.org/resources/documents/dis-ruptingAvail.dv.html.
61 This figure is for 2002. See K. Walsh, Weather Rains on Agchem Demand, Chemical Week, 5 March 2003.
62 D. Fagin, M. LaVelle, and the Center for Public Integrity, Toxic Deception: How the Chemical Industry Manipulates Science, Bends the Law, and Endangers Your Health, (Monroe, Maine: Common Courage Press), 1999.
63 For more on this see, for example:
a) Op. cit., S.Spitzer, 2003, reference 58.
b) Op. cit., D. Fagin, 1999, reference 62.
64 Written remarks by H. A . Eschenbach, Chairman of the Chemi-cal Manufacturers Association Occupational Safety and Health Committee, 23 January 1984, see http://www.chemicalindus-tryarchives.org/dirtysecrets/RtK/pdfs/CMA074460.pdf#page=1.
65 Zogby International poll, 16 September 2003, see http://www.zogby.com/search/ReadNews.dbm?ID=738.
66 This poll followed publicity regarding accidents involving Fire-stone tires used on Ford Explorer SUVs. Poll results, Newsweek/Princeton Survey Research Associates, 7 September 2000, see
Chemical Trespass 43
http://www.pollingreport.com/.
67 The Millennium Poll on Corporate Social Responsibility, Execu-tive Briefing, Environics International Ltd., September 1999, available at http://www.pwcglobal.com.
68 a) PAN Pesticides Database, http://www.pesticideinfo.org/De-tail_Chemical.jsp?Rec_Id=PC33392. b) U.S. Environmental Protection Agency, Interim Registration Eligibility Decision (IRED) for Chlorpyrifos, September 2001, see http://www.epa.gov/oppsrrd1/REDs/chlorpyrifos_ired.pdf.
69 See for example: a) A. Meyer, F.J. Seidler, J.E. Aldridge, et al., Critical periods for chlorpyrifos-induced developmental neurotoxicity: Altera-tions in adenylyl cyclase signaling in adult rat brain regions after gestational or neonatal exposure, Environ Health Perspect, 2004, 112(3): 295-301, see http://ehis.niehs.nih.gov/mem-bers/2003/6755/6755.html. b) S.J. Garcia, F.J. Seidler, and T.A. Slotkin, Developmental neu-rotoxicity elicited by prenatal or postnatal chlorpyrifos exposure: Effects on neurospecific proteins indicate changing vulnerabilities, Environ Health Perspect, 2003, 111(3): 297-303, see http://ehis.niehs.nih.gov/members/2003/5791/5791.html. c) D. Qiao, F.J. Seidler, C.A. Tate, et al., Fetal chlorpyrifos expo-sure: Adverse effects on brain cell development and cholinergic biomarkers emerge postnatally and continue into adolescence and adulthood, Environ Health Perspect, 2003, 111(4): 536-44, see http://ehis.niehs.nih.gov/members/2003/5828/5828.html. d) J.E. Aldridge, F.J. Seidler, A. Meyer et al., Serotonergic sys-tems targeted by developmental exposure to chlorpyrifos: Ef-fects during different critical periods, Environ Health Perspect, 2003, 111(14): 1736-43, see http://ehis.niehs.nih.gov/mem-bers/2003/6489/6489.html. e) D. Qiao, F.J. Seidler, and T.A. Slotkin, Developmental neuro-toxicity of chlorpyrifos modeled in vitro: Comparative effects of metabolites and other cholinesterase inhibitors on DNA synthesis in PC12 and C6 cells, Environ Health Perspect, 2001, 109(9): 909-13. f ) G.A. Buznikov, L.A. Nikitina, V.V. Bezuglov, et al., An inver-tebrate model of the developmental neurotoxicity of insecticides: Effects of chlorpyrifos and dieldrin in sea urchin embryos and larvae, Environ Health Perspect, 2001, 109(7): 651-61.
70 See http://www.dowagro.com/chlorp/about/index.htm.
71 Personal email correspondence with Marypat Corbett, Senior Account Representative, Agronomics Group, Doane Marketing Research, Inc., on 12 February 2004.
72 There is reason to believe that Dow holds virtually all of the U.S. market for technical chlorpyrifos. One report indicates that for 1992 Dow accounted for 100% of total U.S. capacity.a The Wash-ington Post reported in 2000 that chlorpyrifos’s “only American
manufacturer is Dow Chemical Co.”b After the banning of nearly all residential uses of chlorpyrifos—accounting for about half c of the estimated 20 to 24 million pounds then applied annually in the U.S.d—Dow reported that it planned to cut production
by approximately 12 million pounds,e roughly the same amount expected to be reduced by the ban. Moreover, Dow’s U.S. pro-duction capacity for chlorpyrifos is roughly 100 million pounds per year (figure from 1999),f giving the company ample ability to undercut competitors, as it (according to an industry newslet-ter) works to counter “the threats posed by generic producers” of chlorpyrifos.g It is important, however, not to overlook that
five other companies are registered to sell technical chlorpyrifos in the U.S.: Cheminova, Inc. (parent corporation in Denmark), Gharda USA, Inc. (parent in India), Luxembourg-Pamol, Inc. (an Israeli company), Makhteshim-Agan of North America, Inc. (par-ent in Israel) and Platte Chemical Company, Inc. The combined market-share of these suppliers is likely to be marginal. They are either producers with plants in the U.S. that are too small
to be listed in the Chemical Economics Handbookh (which covers production capacity of facilities in the U.S., Western Europe and Japan) or are manufacturing in India or Israel, with exports to the U.S. disadvantaged by Dow’s domestic market dominance. Nonetheless, this cautious estimate of Dow’s U.S. market-share includes a generous uncertainty factor by assuming that the minor registrants account for 20% of the market. This results in a con-servative U.S. market-share estimate for Dow of 80%. See: a) J. Weinberg, ed., with J. Thornton, C. Cray and B. Walsh, Dow Brand Dioxin, Greenpeace, August 1995, Appendix 1. b) D. Brown and J. Warrick, EPA Increases Risk Estimate of a Pesticide, June 1. c) Op. cit., U.S. EPA Program Update, 25 January 2002, refer-ence 39. d) B. Paulsrud, Pesticide Education Safety Program of the Uni-versity of Illinois Extension, Preliminary Risk Assessment for Chlorpyrifos, Illinois Pesticide Review, November 1999, Vol. 1999, Issue 6, see http://www.pesticidesafety.uiuc.edu/newsletter/html/199906c.html. e) American Bird Conservancy, Chlorpyrifos Pesticide Fact Sheet, see http://www.abcbirds.org/pesticides/Profiles/chlorpyrifos.htm. f ) Stanford Research Institute International, Chemical Economics Handbook, 1999. g) Crop Protection Monthly, 30 May 1997, Issue 90, see http://www.crop-protection-monthly.co.uk/Archives/CPMMay1997.doc. h) Op. cit., Stanford Research Institute International, 1999, refer-ence 72f.
73 See for example S. Patton and G. Cohen, Building the Right to Know About Chemical Body Burden and Stopping the Chemical Industry’s Toxic Trespass, available online at http://www.omb-watch.org/rtkconference/body_burden.html.
74 See http://www.dowagro.com/chlorp/about/index.htm.
75 These are Cheminova, Inc. (parent corporation in Denmark), Gharda USA, Inc. (parent in India), Luxembourg-Pamol, Inc. (an Israeli company), Makhteshim-Agan of North America, Inc. (par-ent in Israel) and Platte Chemical Company, Inc.
76 Dow holds 41 of 195 active chlorpyrifos product registrations. Direct query of the PAN Pesticides Database, http://www.pestici-deinfo.org.
77 Op. cit., U.S. Environmental Protection Agency, 2001, reference 68b.
78 Pesticides have made major contributions to public health pro-grams historically, and in some cases may remain important com-ponents of integrated vector management (IVM) and other public health uses. Unfortunately, however, public health programs often rely almost exclusively on these chemical tools without adequate attention given either to the health risks of the pesticide being applied, or to least-toxic and non-chemical alternative control measures. See for example: a) J. Wargo, Our Children’s Toxic Legacy: How Science and Law Fail to Protect Us from Pesticides, Yale University Press, 2nd Edi-tion, 1998.
44 Notes
b) P. Matteson, ed., Disease Vector Management for Public Health and Conservation, World Wildlife Fund (Washington DC) 1999.
79 The largest agricultural use in terms of active ingredient is corn, which accounts for about 5.5 million pounds. Other crops with a high average percentage of their total U.S. planted acres treated include Brussels sprouts (73%), cranberries (46%), apples (44%), broccoli (41%) and cauliflower (31%). Other crop uses include strawberries, citrus, figs, pears, nectarines, cherries, peaches, plums, grapes, almonds, pecans, walnuts, nut trees, onions, pep-pers, kale, cabbage, collards, cucurbits, asparagus, roots/tubers, corn, lentils, beans, peas, sorghum, tobacco, wheat, alfalfa, pea-nuts, soybeans, sunflower, cotton, sugar beets, mint and bananas. See op. cit., U.S. Environmental Protection Agency, 2001.
80 Op. cit., U.S. Environmental Protection Agency, 2001, reference 68b.
81 Agency for Toxic Substances and Disease Registry. ToxFAQs™ for Chlorpyrifos, September 1997. Available at http://www.atsdr.cdc.gov/tfacts84.html accessed 1/17/03.
82 Agency for Toxic Substances and Disease Registry. ToxFAQs™ for Chlorpyrifos, September 1997. Available at http://www.atsdr.cdc.gov/tfacts84.html accessed 1/17/03.
83 Op. cit., U.S. Environmental Protection Agency, 2001, reference 68b.
84 See for example C. Cox, Chlorpyrifos, Part 1: Toxicology, J Pest Reform, Winter 1994, Vol. 14, no. 4, available at http://www.pesticide.org/chlorpyrifos1.pdf. This review references research on chlorpyrifos and human health dating back to the late 1970s.
85 J. Morris, The Stuff in the Backyard Shed, U.S. News and World Report, 8 November 1999.
86 DowElanco Signs Adverse Effects Consent Decree for $732,000, Pesticide and Toxic Chemical News, 3 May 1995.
87 This statement overlooks the fact there are more than two politi-cal parties in the United States.
88 See http://www.dow.com/publicreport/2001/responsibility/heard.htm.
89 See http://www.dowagro.com/chlorp/about/index.htm.
90 Office of New York State Attorney General press release, “Dow Subsidiary to Pay $2 Million for Making False Safety Claims in Pesticide Ads,” 15 December 2003.
91 Presentation by Michael Shaw, Public Policy Leader for Dow AgroSciences, Government and Public Affairs at the conference of the National Pesticide Stewardship Alliance, Seattle, WA, 27 August 2002.
92 In 2002, U.S. EPA produced an interim reevaluation of chlorpyri-fos (pending an FQPA-mandated reassessment of the cumulative risk from all organophosphate pesticides), giving a green light to re-registration of the chemical. See: op. cit., U.S. Environmental Protection Agency, 2001.
93 Many studies can be found documenting the effectiveness of organic and alternative agricultural production in the U.S. and around the world. Some useful on-line resources for accessing this wealth of information on pesticide alternatives include: a) http://www.ecologic-ipm.com/alternatives_abound.pdf b) http://www.panna.org/resources/advisor.dv.html. c) http://www.ofrf.org. d) http://www.pesticide.org/factsheets.html e) http://www.pesticideinfo.org/Alternatives.html
Chemical Trespass 45
The CDC report provides detailed descriptions of data collection methods and analyses.1 In brief, the National Health and Nutrition Examination Survey (NHANES), conducted by the National Center for Health Statistics of the Centers for Disease Control and Prevention (NCHS/CDC), is a multiyear proj-ect designed to assess the health and nutrition status of the civilian non-institutionalized U.S. popula-tion. The data considered in this report are from the NHANES 1999–2000 cycle of the survey in which 22,839 households were screened in 26 U.S. locations. From those households 9,282 individuals were interviewed and examined. The sample design includes targeted sampling of African Americans, Mexican Americans and adolescents (12–19 years old). Therefore all statistical comparisons of groups were made using the sample weights provided by NCHS/CDC to account for unequal probability of selection into the survey.2
The NHANES 1999–2000 survey included mea-sures of 34 pesticides in blood and urine. Pesticides were measured in one-half to one-third of age groups six to 59 years (urine samples) and six years and older (blood samples). NCHS/CDC researchers collected many demographic variables only a few of which are currently available to the public. Our analyses include comparisons of pesticides and/or their me-tabolites in blood or urine by: 1) age (grouped as recommended by NCHS/CDC to ensure suffi cient sample sizes for analysis); 2) ethnicity/race (only the groups Mexican Americans, non-Hispanic whites, and non-Hispanic blacks are identifi ed by NCHS/CDC for comparative analyses); 3) gender; and 4) birthplace (only U.S. and Mexico are identifi ed by NCHS/CDC for comparative analyses). Variables
Appendix AAnalytical Methods
included in the study and not yet publicly available include occupation, income and poverty indices, pes-ticide use and time of sampling.
Blood levels of measured pesticides were presented as ng/g lipid. Levels of pesticides in urine are presented both on a mass per volume basis (µg/L) and mass per gram of creatinine to control for variation in urine volume. For pesticide or metabolite concentrations below the limit of detection (LOD), NCHS/CDC assigned a value equal to the LOD divided by the square root of two for calculations of geometric means—considered the most appropriate way to show central tendency for non-normally distributed data as is the case for all the NHANES 1999–2000 pesticide data.
Following the analysis protocols suggested by NCHS/CDC, we used creatinine (mg/dL) as a co-variate in the Analysis of Variance (ANOVA) model using the JMP statistical software package.3 This package is compatible with the SAS software used by NCHS/CDC allowing us to use the same sample weights provided by NCHS/CDC. ANOVA analyses were conducted using log-transformed data from which least square geometric means were calculated and presented in tables of results (results tables ap-pear in this appendix).
Log transformed DDT data were not normally dis-tributed and hence omitted from ANOVA analyses (that require normal distribution). All ANOVA tests were conducted on the subset of blood and urine data that only included the ethnic groups Mexican American, non-Hispanic black and non-Hispanic white. Conservatively, we omitted only the one or two highest values identifi ed as outliers by the JMP

46 Appendix A
statistical program. In addition, we used the criterion that an excluded value was more than 50% greater than the next lowest value (see Table A-1).
We used a Least Square (LS) Means Student’s T-test for pair-wise comparisons of LS means within the main effects of age group, ethnic group and gender; and the Tukey HSD test for pairwise comparisons of LS means for the subgroups of age group by gender.
Tables A-2 through A-6 show the geometric means and number of cases for comparisons of age groups, ethnic groups, birvthplace and gender; the corresponding figures are identified and appear in Section 2.
Pesticides in Urine (µg/L)
Ethnic Group Birthplace Gender
Age Group
DMP120 MexAm Mexico M 6–11120 White U.S. M 12–19130 MexAm U.S. F 12–19130 Black U.S. F 12–19130 MexAm U.S. M 12–19
(360) White U.S. F 12–19
DMTP960 Black U.S. F 12–191300 MexAm U.S. F 12–191400 MexAm U.S. F 6–111700 White U.S. M 12–191800 MexAm U.S. F 12–192800 White U.S. F 20–59
(333600) MexAm U.S. M 12–19
DMDTP150 MexAm U.S. M 6–11160 White U.S. M 6–11200 Black U.S. M 12–19210 Black U.S. M 12–19240 Black U.S. F 12–19
(410) MexAm U.S. F 12–19DEP
96 MexAm U.S. M 6–11100 White U.S. M 6–11130 MexAm U.S. M 6–11140 Black U.S. M 12–19150 Black U.S. M 6–11190 White U.S. M 20–59
(820) MexAm Mexico M 12–19
DETP51 MexAm U.S. M 6–1162 White U.S. F 20–5962 White U.S. M 20–5994 Black U.S. F 20–59110 MexAm Mexico F 12–19
(180) MexAm Mexico M 12–19
Table A-1. Highest values shown along with the four categorical variables evaluated for urine-measured (µg/L) and blood-measured (ng/g lipid) pesticides or pesticide metabolites included in this study. Cases omitted from analyses appear in parentheses.
DEDTP4.5 White U.S. M 12–194.9 Black U.S. M 20–595.7 MexAm U.S. M 12–198.5 Black U.S. F 20–5913 MexAm U.S. M 12–19
(34) White U.S. F 20–59
para-Nitrophenol46 White U.S. F 12–1948 MexAm Mexico M 20–5948 MexAm Mexico M 12–1958 MexAm U.S. M 12–1972 Black U.S. M 20–5976 MexAm U.S. M 12–19
TCP61 Black U.S. F 20–5990 Black U.S. F 20–59110 MexAm U.S. F 12–19130 MexAm Mexico M 12–19180 MexAm Mexico F 20–59
ortho-Phenylphenol19 MexAm Mexico F 20–5922 MexAm U.S. F 12–1944 MexAm Mexico M 12–1957 MexAm Mexico M 20–59
2,4,5-Trichlorophenol90 MexAm Mexico M 12–1991 MexAm U.S. M 12–1992 White U.S. F 20–5995 Black U.S. F 6–11100 Black U.S. M 12–19130 Black U.S. F 12–19
Ethnic Group Birthplace Gender
Age Group
continued on next page
Notes
1 Centers for Disease Control and Prevention (CDC), Second National Report on Human Exposure to Environmental Chemi-cals, January 2003. http://www.cdc.gov/exposurereport; CDC, National Health and Nutrition Examination Survey, Hyattsville, MD. National Center for Health Statistics, see http://www.cdc.gov/nchs/nhanes.htm.
2 The sample population was 33% White, 24% non-Hispanic Black, 34% Mexican American, and 9% other, compared to the U.S. population as a whole, which is 69% non-Hispanic White, 12% Black, and 12% Hispanic or Latino origin (country of origin not specified in census data). Source: U.S. Census Bureau, USA Quickfacts, http://quickfacts.census.gov/qfd/states/00000.html
3 JMP The Statistical Discovery Software. Version 5. SAS Institute Inc., Cary, NC, USA. 2002.
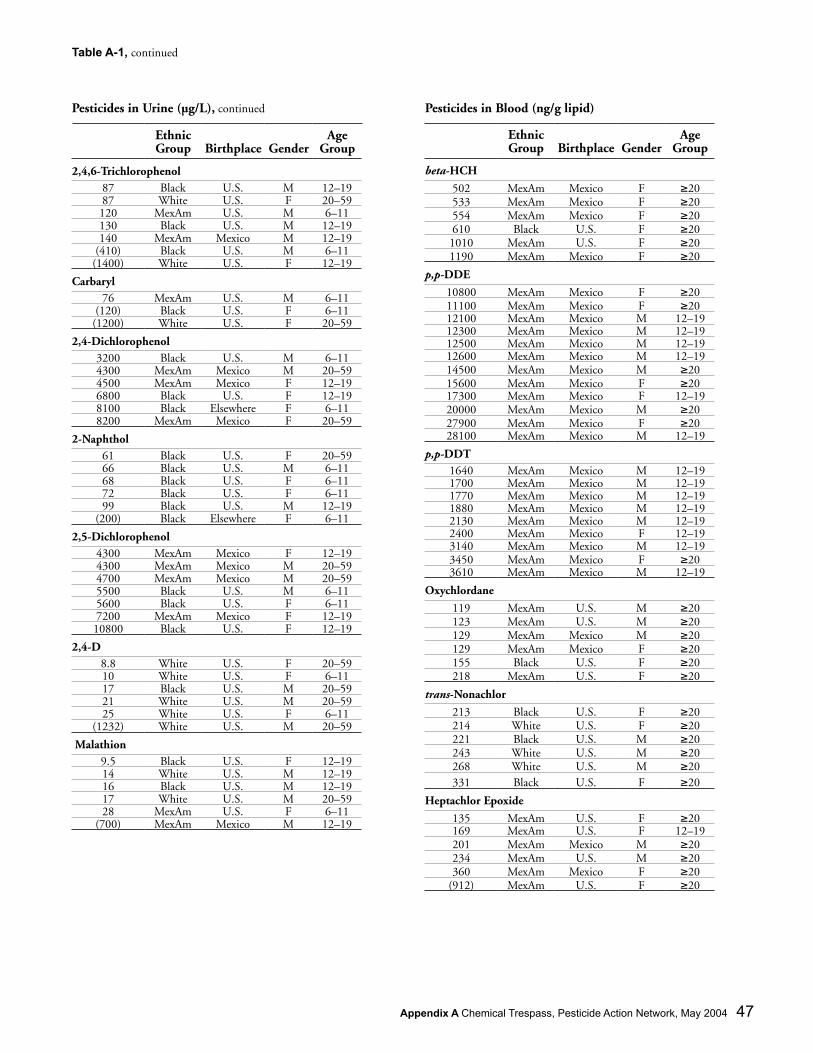
Appendix A Chemical Trespass, Pesticide Action Network, May 2004 47
Pesticides in Blood (ng/g lipid)
Ethnic Group Birthplace Gender
Age Group
beta-HCH
502 MexAm Mexico F ≥20533 MexAm Mexico F ≥20554 MexAm Mexico F ≥20610 Black U.S. F ≥201010 MexAm U.S. F ≥201190 MexAm Mexico F ≥20
p,p-DDE
10800 MexAm Mexico F ≥2011100 MexAm Mexico F ≥2012100 MexAm Mexico M 12–1912300 MexAm Mexico M 12–1912500 MexAm Mexico M 12–1912600 MexAm Mexico M 12–1914500 MexAm Mexico M ≥2015600 MexAm Mexico F ≥2017300 MexAm Mexico F 12–1920000 MexAm Mexico M ≥2027900 MexAm Mexico F ≥2028100 MexAm Mexico M 12–19
p,p-DDT1640 MexAm Mexico M 12–191700 MexAm Mexico M 12–191770 MexAm Mexico M 12–191880 MexAm Mexico M 12–192130 MexAm Mexico M 12–192400 MexAm Mexico F 12–193140 MexAm Mexico M 12–193450 MexAm Mexico F ≥203610 MexAm Mexico M 12–19
Oxychlordane
119 MexAm U.S. M ≥20123 MexAm U.S. M ≥20129 MexAm Mexico M ≥20129 MexAm Mexico F ≥20155 Black U.S. F ≥20218 MexAm U.S. F ≥20
trans-Nonachlor
213 Black U.S. F ≥20214 White U.S. F ≥20221 Black U.S. M ≥20243 White U.S. M ≥20268 White U.S. M ≥20331 Black U.S. F ≥20
Heptachlor Epoxide
135 MexAm U.S. F ≥20169 MexAm U.S. F 12–19201 MexAm Mexico M ≥20234 MexAm U.S. M ≥20360 MexAm Mexico F ≥20
(912) MexAm U.S. F ≥20
Table A-1, continued
2,4,6-Trichlorophenol87 Black U.S. M 12–1987 White U.S. F 20–59120 MexAm U.S. M 6–11130 Black U.S. M 12–19140 MexAm Mexico M 12–19
(410) Black U.S. M 6–11(1400) White U.S. F 12–19
Carbaryl76 MexAm U.S. M 6–11
(120) Black U.S. F 6–11(1200) White U.S. F 20–59
2,4-Dichlorophenol3200 Black U.S. M 6–114300 MexAm Mexico M 20–594500 MexAm Mexico F 12–196800 Black U.S. F 12–198100 Black Elsewhere F 6–118200 MexAm Mexico F 20–59
2-Naphthol61 Black U.S. F 20–5966 Black U.S. M 6–1168 Black U.S. F 6–1172 Black U.S. F 6–1199 Black U.S. M 12–19
(200) Black Elsewhere F 6–11
2,5-Dichlorophenol4300 MexAm Mexico F 12–194300 MexAm Mexico M 20–594700 MexAm Mexico M 20–595500 Black U.S. M 6–115600 Black U.S. F 6–117200 MexAm Mexico F 12–1910800 Black U.S. F 12–19
2,4-D8.8 White U.S. F 20–5910 White U.S. F 6–1117 Black U.S. M 20–5921 White U.S. M 20–5925 White U.S. F 6–11
(1232) White U.S. M 20–59
Malathion9.5 Black U.S. F 12–1914 White U.S. M 12–1916 Black U.S. M 12–1917 White U.S. M 20–5928 MexAm U.S. F 6–11
(700) MexAm Mexico M 12–19
Ethnic Group Birthplace Gender
Age Group
Pesticides in Urine (µg/L), continued

48 Appendix A Chemical Trespass, Pesticide Action Network, May 2004
Table A–2. Age Group Differences for Pesticides Measured in Urine (Figure 6)
Age Group (in years)Pesticide (µg/g creatinine) 6–11 12–19 20–59TCP (chlorpyrifos) 2.77 a (441) 1.68 b (634) 1.36 c (744)DMP 1.49 a (432) 1.31 ab (616) 1.10 b (726)DMTP 2.51 a (432) 1.58 ab (616) 1.51 b (725)DMDTP 0.58 a (432) 0.34 b (616) 0.33 b (726)DEP 1.47 a (432) 0.95 b (616) 0.90 b (726)Malathion 0.28 a (417) 0.22 ab (615) 0.18 b (724)2,4,6-Trichlorophenol 4.51 a (440) 2.69 b (630) 2.22 c (742)2,4-Dichlorophenol 1.66 a (441) 1.11 b (632) 1.26 b (742)2,5-Dichlorophenol 12.71 a (440) 6.21 b (633) 7.28 b (741)2,4-D 0.15 a (437) 0.09 b (631) 0.08 b (734)2-Naphthol 0.37 b (440) 0.37 b (634) 0.54 a (743)Carbaryl 1.28 b (442) 1.23 b (635) 1.56 a (744)Note: Means (least square mean) with different letters within a row are significantly different. Number of cases is shown in parentheses.
Table A–5. Birthplace Differences for Pesticides Measured in Blood (Figure 9)
BirthplacePesticide(ng/g lipid) Mexico United Statesbeta-HCH 41.45 a (294) 13.76 b (1372)p,p-DDE 1027.31 a (304) 225.74 b (1428)Note: Means (least square mean) with different letters within a row are signifi-cantly different. Number of cases is shown in parentheses.
Table A–6. Age and Gender Differences for Pesticides Measured in Blood (Figure 10)
Groups by Gender and Age
Pesticide (ng/g lipid)Women 20 yrs
and olderMen 20 years
and olderBoys 12–19
yearsGirls 12–19
yearsbeta-HCH 19.63 a (599) 13.95 b (524) 7.76 c (316) 6.71 c (298)p,p-DDE 295.51 a (619) 261.88 b (541) 134.66 c (332) 97.98 c (313)Oxychlordane 15.06 a (492) 13.33 b (421) 7.29 c (322) 6.15 c (302)trans-Nonachlor 22.05 a (616) 20.56 a (535) 9.08 b (324) 7.37 b (301)Heptachlor Epoxide 7.62 a (468) 7.22 a (401) 6.73 ab (311) 5.87 b (292)Note: Means (least square mean) with different letters are significantly different. Number of cases is shown in parentheses.
Table A–4. Ethnic Group Differences for Pesticides Measured in Blood (Figure 8)
Ethnic Group
Pesticide (ng/g lipid)Mexican
AmericansNon-Hispanic
BlacksNon-Hispanic
Whitesbeta-HCH 25.85 a (632) 13.15 b (403) 14.36 b (702)p,p-DDE 674.15 a (657) 294.98 b (416) 217.14 c (732)Note: Means (least square mean) with different letters within a row are significantly different. Number of cases is shown in parentheses.
Table A–3. Ethnic Group Differences for Pesticides Measured in Urine (Figure 7)
Ethnic Group
Pesticide (µg/g creatinine)Mexican
AmericansNon-Hispanic
BlacksNon-Hispanic
Whitespara-Nitrophenol 0.63 a (695) 0.46 b (518) 0.40 b (602)DEDTP 0.11 a (672) 0.10 ab (509) 0.09 b (593)2,4,5-Trichlorophenol 1.25 a (697) 0.93 c (524) 1.06 b (602)2,4-Dichlorophenol 1.60 a (694) 1.66 a (516) 0.87 b (602)2,5-Dichlorophenol 14.03 a (695) 11.86 a (517) 3.47 b (602)TCP (chlorpyrifos) 1.58 b (696) 1.92 ab (521) 2.10 a (601)2,4-D 0.08 b (695) 0.09 b (520) 0.13 a (587)2-Napthol 0.44 ab (696) 0.52 a (520) 0.32 b (602)ortho-Phenylphenol 0.48 ab (695) 0.49 a (520) 0.42 b (602)Note: Means (least square mean) with different letters within a row are significantly different. Number of cases is shown in parentheses.
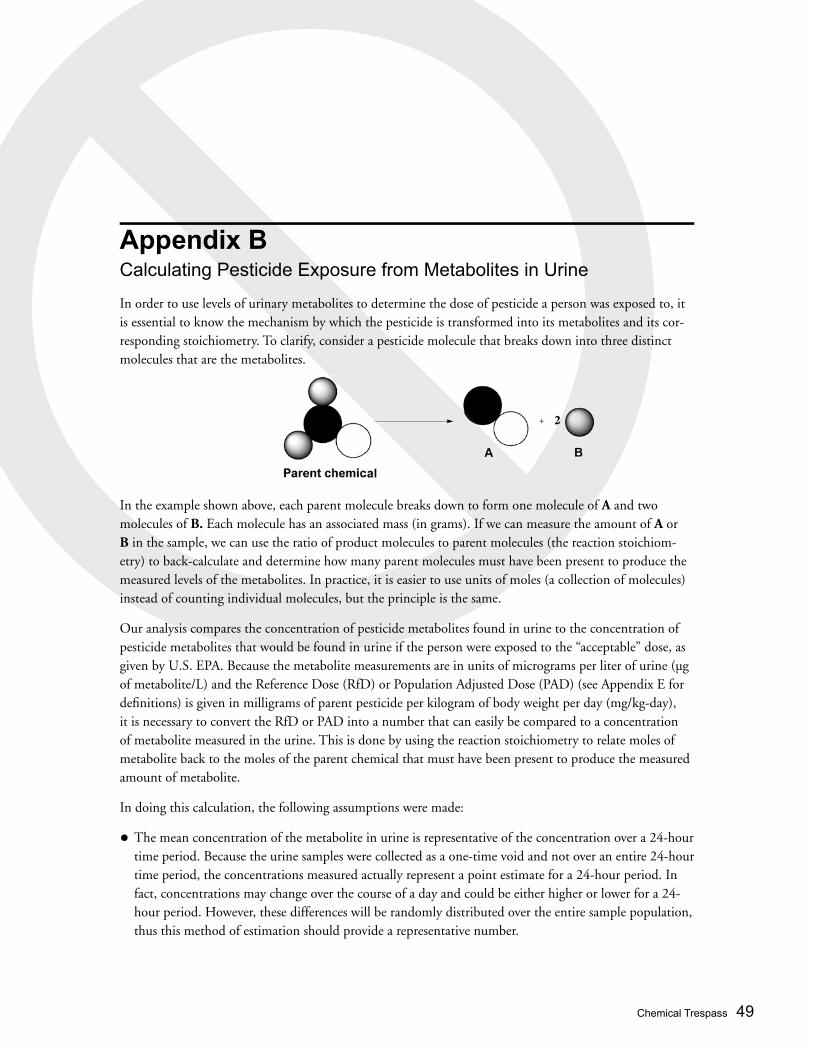
Chemical Trespass 49
Appendix BCalculating Pesticide Exposure from Metabolites in Urine
In order to use levels of urinary metabolites to determine the dose of pesticide a person was exposed to, it is essential to know the mechanism by which the pesticide is transformed into its metabolites and its cor-responding stoichiometry. To clarify, consider a pesticide molecule that breaks down into three distinct molecules that are the metabolites.
In the example shown above, each parent molecule breaks down to form one molecule of A and two molecules of B. Each molecule has an associated mass (in grams). If we can measure the amount of A or B in the sample, we can use the ratio of product molecules to parent molecules (the reaction stoichiom-etry) to back-calculate and determine how many parent molecules must have been present to produce the measured levels of the metabolites. In practice, it is easier to use units of moles (a collection of molecules) instead of counting individual molecules, but the principle is the same.
Our analysis compares the concentration of pesticide metabolites found in urine to the concentration of pesticide metabolites that would be found in urine if the person were exposed to the “acceptable” dose, as given by U.S. EPA. Because the metabolite measurements are in units of micrograms per liter of urine (µg of metabolite/L) and the Reference Dose (RfD) or Population Adjusted Dose (PAD) (see Appendix E for defi nitions) is given in milligrams of parent pesticide per kilogram of body weight per day (mg/kg-day), it is necessary to convert the RfD or PAD into a number that can easily be compared to a concentration of metabolite measured in the urine. This is done by using the reaction stoichiometry to relate moles of metabolite back to the moles of the parent chemical that must have been present to produce the measured amount of metabolite.
In doing this calculation, the following assumptions were made:
• The mean concentration of the metabolite in urine is representative of the concentration over a 24-hour time period. Because the urine samples were collected as a one-time void and not over an entire 24-hour time period, the concentrations measured actually represent a point estimate for a 24-hour period. In fact, concentrations may change over the course of a day and could be either higher or lower for a 24-hour period. However, these differences will be randomly distributed over the entire sample population, thus this method of estimation should provide a representative number.
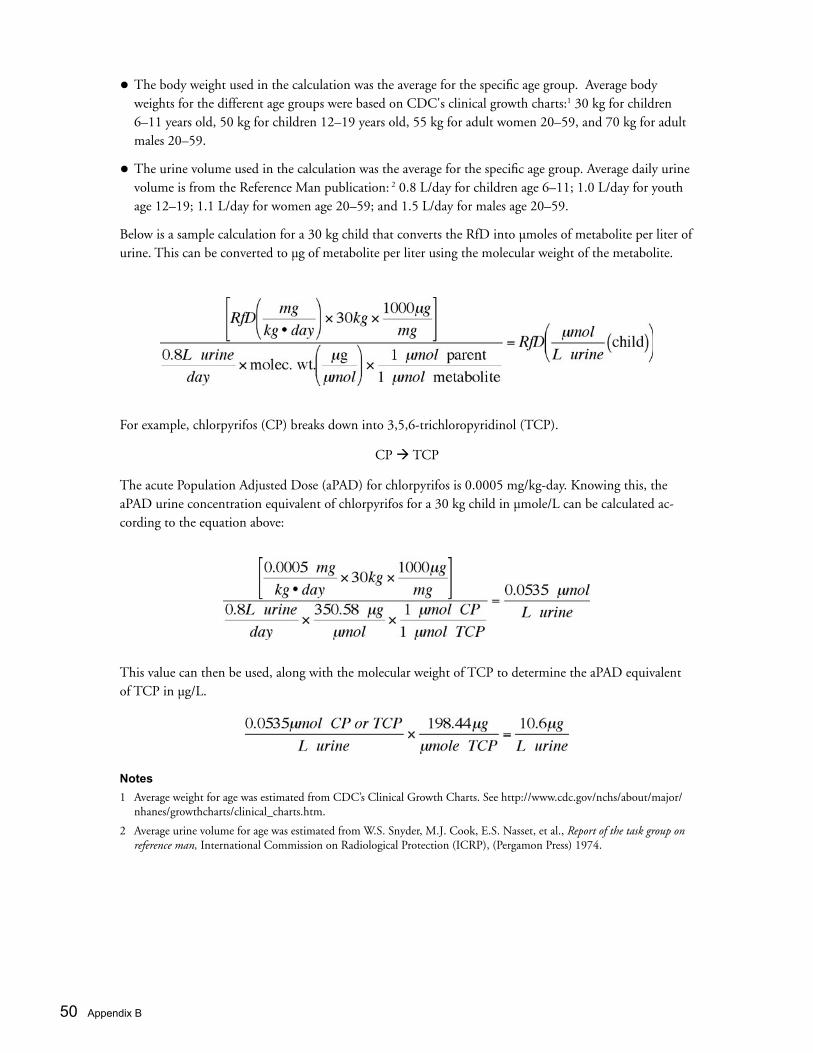
50 Appendix B
• The body weight used in the calculation was the average for the specific age group. Average body weights for the different age groups were based on CDC's clinical growth charts:1 30 kg for children 6–11 years old, 50 kg for children 12–19 years old, 55 kg for adult women 20–59, and 70 kg for adult males 20–59.
• The urine volume used in the calculation was the average for the specific age group. Average daily urine volume is from the Reference Man publication: 2 0.8 L/day for children age 6–11; 1.0 L/day for youth age 12–19; 1.1 L/day for women age 20–59; and 1.5 L/day for males age 20–59.
Below is a sample calculation for a 30 kg child that converts the RfD into µmoles of metabolite per liter of urine. This can be converted to µg of metabolite per liter using the molecular weight of the metabolite.
For example, chlorpyrifos (CP) breaks down into 3,5,6-trichloropyridinol (TCP).
CP ‡ TCP
The acute Population Adjusted Dose (aPAD) for chlorpyrifos is 0.0005 mg/kg-day. Knowing this, the aPAD urine concentration equivalent of chlorpyrifos for a 30 kg child in µmole/L can be calculated ac-cording to the equation above:
This value can then be used, along with the molecular weight of TCP to determine the aPAD equivalent of TCP in µg/L.
Notes
1 Average weight for age was estimated from CDC’s Clinical Growth Charts. See http://www.cdc.gov/nchs/about/major/nhanes/growthcharts/clinical_charts.htm.
2 Average urine volume for age was estimated from W.S. Snyder, M.J. Cook, E.S. Nasset, et al., Report of the task group on reference man, International Commission on Radiological Protection (ICRP), (Pergamon Press) 1974.
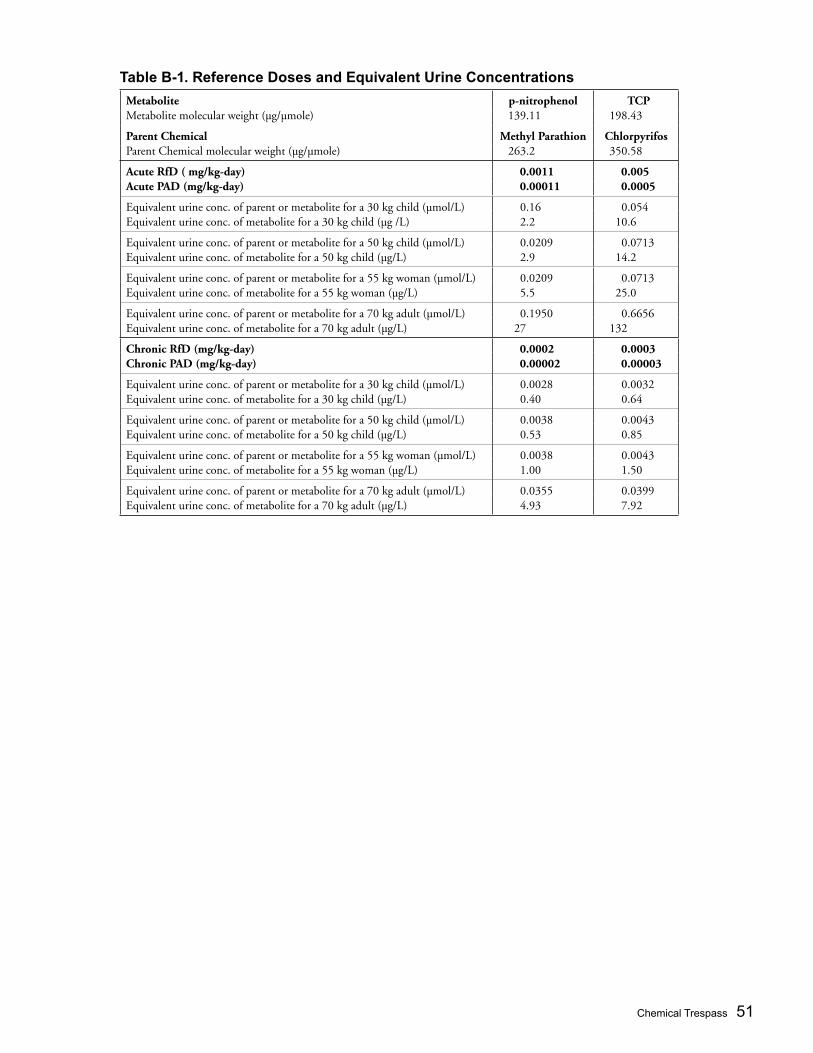
Chemical Trespass 51
Table B-1. Reference Doses and Equivalent Urine Concentrations
Metabolite p-nitrophenol TCPMetabolite molecular weight (µg/µmole) 139.11 198.43
Parent Chemical Methyl Parathion ChlorpyrifosParent Chemical molecular weight (µg/µmole) 263.2 350.58
Acute RfD ( mg/kg-day) 0.0011 0.005Acute PAD (mg/kg-day) 0.00011 0.0005
Equivalent urine conc. of parent or metabolite for a 30 kg child (µmol/L) 0.16 0.054Equivalent urine conc. of metabolite for a 30 kg child (µg /L) 2.2 10.6
Equivalent urine conc. of parent or metabolite for a 50 kg child (µmol/L) 0.0209 0.0713Equivalent urine conc. of metabolite for a 50 kg child (µg/L) 2.9 14.2
Equivalent urine conc. of parent or metabolite for a 55 kg woman (µmol/L) 0.0209 0.0713Equivalent urine conc. of metabolite for a 55 kg woman (µg/L) 5.5 25.0
Equivalent urine conc. of parent or metabolite for a 70 kg adult (µmol/L) 0.1950 0.6656Equivalent urine conc. of metabolite for a 70 kg adult (µg/L) 27 132
Chronic RfD (mg/kg-day) 0.0002 0.0003Chronic PAD (mg/kg-day) 0.00002 0.00003
Equivalent urine conc. of parent or metabolite for a 30 kg child (µmol/L) 0.0028 0.0032Equivalent urine conc. of metabolite for a 30 kg child (µg/L) 0.40 0.64
Equivalent urine conc. of parent or metabolite for a 50 kg child (µmol/L) 0.0038 0.0043Equivalent urine conc. of metabolite for a 50 kg child (µg/L) 0.53 0.85
Equivalent urine conc. of parent or metabolite for a 55 kg woman (µmol/L) 0.0038 0.0043Equivalent urine conc. of metabolite for a 55 kg woman (µg/L) 1.00 1.50
Equivalent urine conc. of parent or metabolite for a 70 kg adult (µmol/L) 0.0355 0.0399Equivalent urine conc. of metabolite for a 70 kg adult (µg/L) 4.93 7.92
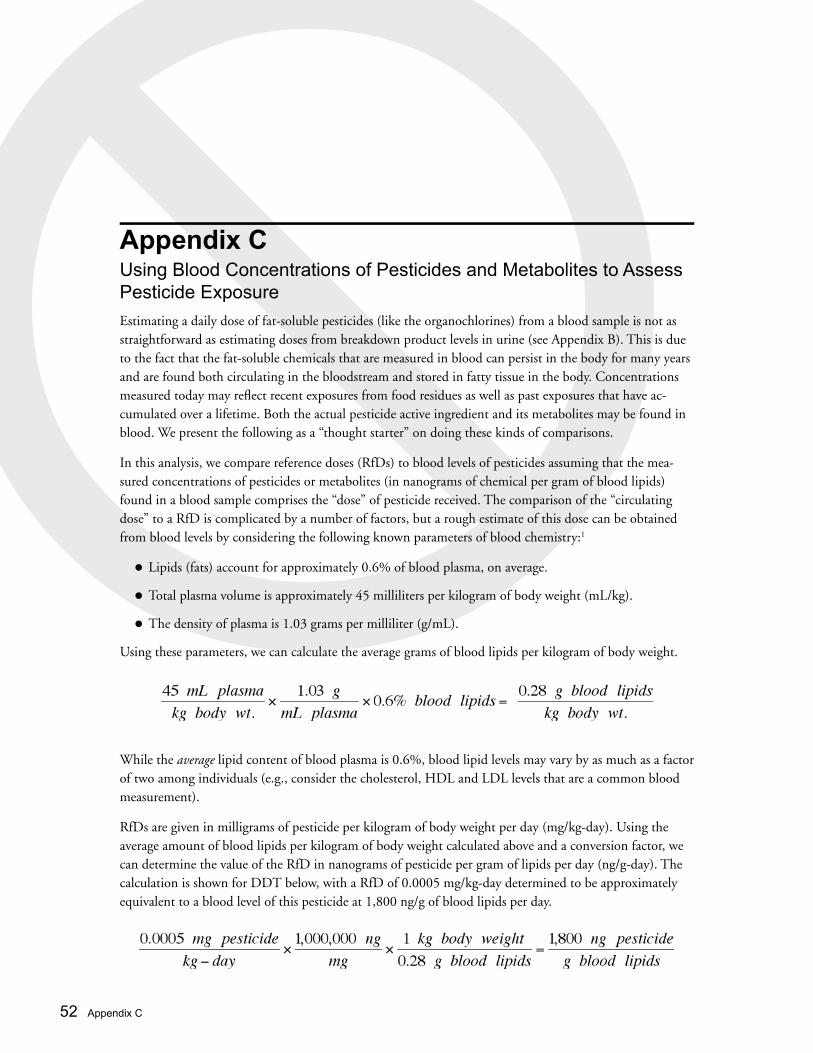
52 Appendix C
Estimating a daily dose of fat-soluble pesticides (like the organochlorines) from a blood sample is not as straightforward as estimating doses from breakdown product levels in urine (see Appendix B). This is due to the fact that the fat-soluble chemicals that are measured in blood can persist in the body for many years and are found both circulating in the bloodstream and stored in fatty tissue in the body. Concentrations measured today may refl ect recent exposures from food residues as well as past exposures that have ac-cumulated over a lifetime. Both the actual pesticide active ingredient and its metabolites may be found in blood. We present the following as a “thought starter” on doing these kinds of comparisons.
In this analysis, we compare reference doses (RfDs) to blood levels of pesticides assuming that the mea-sured concentrations of pesticides or metabolites (in nanograms of chemical per gram of blood lipids) found in a blood sample comprises the “dose” of pesticide received. The comparison of the “circulating dose” to a RfD is complicated by a number of factors, but a rough estimate of this dose can be obtained from blood levels by considering the following known parameters of blood chemistry:1
• Lipids (fats) account for approximately 0.6% of blood plasma, on average.
• Total plasma volume is approximately 45 milliliters per kilogram of body weight (mL/kg).
• The density of plasma is 1.03 grams per milliliter (g/mL).
Using these parameters, we can calculate the average grams of blood lipids per kilogram of body weight.
While the average lipid content of blood plasma is 0.6%, blood lipid levels may vary by as much as a factor of two among individuals (e.g., consider the cholesterol, HDL and LDL levels that are a common blood measurement).
RfDs are given in milligrams of pesticide per kilogram of body weight per day (mg/kg-day). Using the average amount of blood lipids per kilogram of body weight calculated above and a conversion factor, we can determine the value of the RfD in nanograms of pesticide per gram of lipids per day (ng/g-day). The calculation is shown for DDT below, with a RfD of 0.0005 mg/kg-day determined to be approximately equivalent to a blood level of this pesticide at 1,800 ng/g of blood lipids per day.
Appendix CUsing Blood Concentrations of Pesticides and Metabolites to Assess Pesticide Exposure
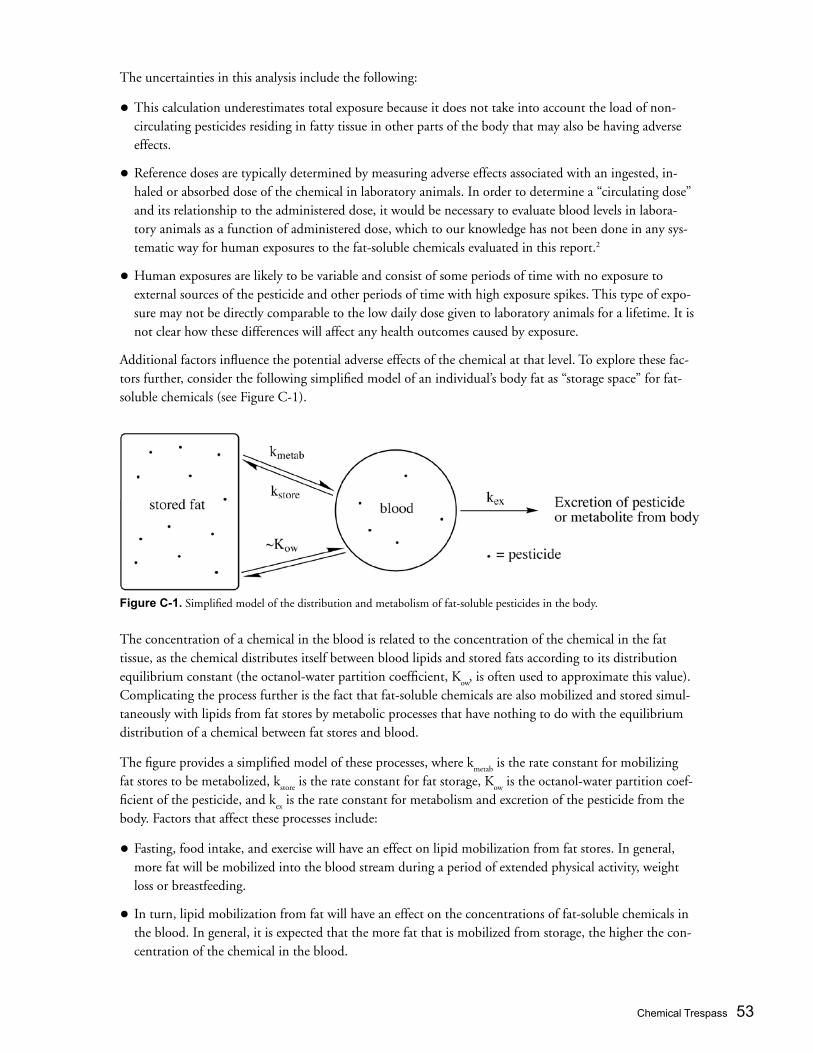
Chemical Trespass 53
The uncertainties in this analysis include the following:
• This calculation underestimates total exposure because it does not take into account the load of non-circulating pesticides residing in fatty tissue in other parts of the body that may also be having adverse effects.
• Reference doses are typically determined by measuring adverse effects associated with an ingested, in-haled or absorbed dose of the chemical in laboratory animals. In order to determine a “circulating dose” and its relationship to the administered dose, it would be necessary to evaluate blood levels in labora-tory animals as a function of administered dose, which to our knowledge has not been done in any sys-tematic way for human exposures to the fat-soluble chemicals evaluated in this report.2
• Human exposures are likely to be variable and consist of some periods of time with no exposure to external sources of the pesticide and other periods of time with high exposure spikes. This type of expo-sure may not be directly comparable to the low daily dose given to laboratory animals for a lifetime. It is not clear how these differences will affect any health outcomes caused by exposure.
Additional factors influence the potential adverse effects of the chemical at that level. To explore these fac-tors further, consider the following simplified model of an individual’s body fat as “storage space” for fat-soluble chemicals (see Figure C-1).
The concentration of a chemical in the blood is related to the concentration of the chemical in the fat tissue, as the chemical distributes itself between blood lipids and stored fats according to its distribution equilibrium constant (the octanol-water partition coefficient, K
ow, is often used to approximate this value).
Complicating the process further is the fact that fat-soluble chemicals are also mobilized and stored simul-taneously with lipids from fat stores by metabolic processes that have nothing to do with the equilibrium distribution of a chemical between fat stores and blood.
The figure provides a simplified model of these processes, where kmetab
is the rate constant for mobilizing fat stores to be metabolized, k
store is the rate constant for fat storage, K
ow is the octanol-water partition coef-
ficient of the pesticide, and kex is the rate constant for metabolism and excretion of the pesticide from the
body. Factors that affect these processes include:
• Fasting, food intake, and exercise will have an effect on lipid mobilization from fat stores. In general, more fat will be mobilized into the blood stream during a period of extended physical activity, weight loss or breastfeeding.
• In turn, lipid mobilization from fat will have an effect on the concentrations of fat-soluble chemicals in the blood. In general, it is expected that the more fat that is mobilized from storage, the higher the con-centration of the chemical in the blood.
Figure C-1. Simplified model of the distribution and metabolism of fat-soluble pesticides in the body.
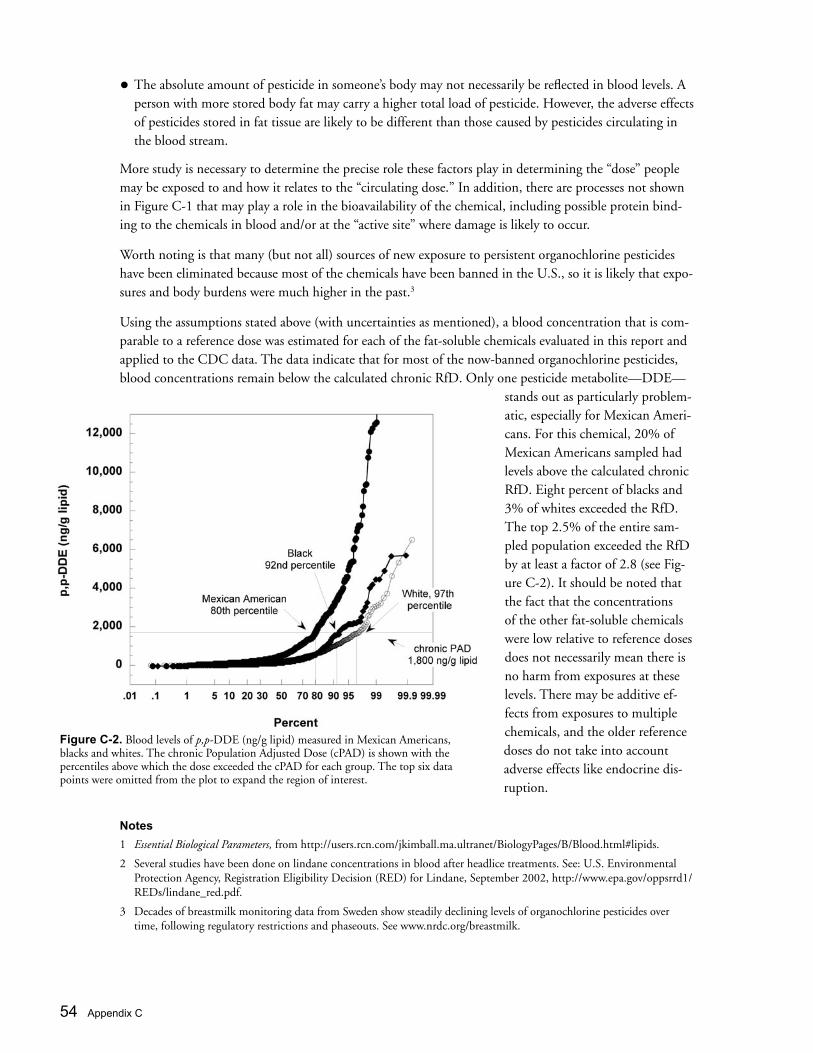
54 Appendix C
• The absolute amount of pesticide in someone’s body may not necessarily be reflected in blood levels. A person with more stored body fat may carry a higher total load of pesticide. However, the adverse effects of pesticides stored in fat tissue are likely to be different than those caused by pesticides circulating in the blood stream.
More study is necessary to determine the precise role these factors play in determining the “dose” people may be exposed to and how it relates to the “circulating dose.” In addition, there are processes not shown in Figure C-1 that may play a role in the bioavailability of the chemical, including possible protein bind-ing to the chemicals in blood and/or at the “active site” where damage is likely to occur.
Worth noting is that many (but not all) sources of new exposure to persistent organochlorine pesticides have been eliminated because most of the chemicals have been banned in the U.S., so it is likely that expo-sures and body burdens were much higher in the past.3
Using the assumptions stated above (with uncertainties as mentioned), a blood concentration that is com-parable to a reference dose was estimated for each of the fat-soluble chemicals evaluated in this report and applied to the CDC data. The data indicate that for most of the now-banned organochlorine pesticides, blood concentrations remain below the calculated chronic RfD. Only one pesticide metabolite—DDE—
stands out as particularly problem-atic, especially for Mexican Ameri-cans. For this chemical, 20% of Mexican Americans sampled had levels above the calculated chronic RfD. Eight percent of blacks and 3% of whites exceeded the RfD. The top 2.5% of the entire sam-pled population exceeded the RfD by at least a factor of 2.8 (see Fig-ure C-2). It should be noted that the fact that the concentrations of the other fat-soluble chemicals were low relative to reference doses does not necessarily mean there is no harm from exposures at these levels. There may be additive ef-fects from exposures to multiple chemicals, and the older reference doses do not take into account adverse effects like endocrine dis-ruption.
Notes
1 Essential Biological Parameters, from http://users.rcn.com/jkimball.ma.ultranet/BiologyPages/B/Blood.html#lipids.
2 Several studies have been done on lindane concentrations in blood after headlice treatments. See: U.S. Environmental Protection Agency, Registration Eligibility Decision (RED) for Lindane, September 2002, http://www.epa.gov/oppsrrd1/REDs/lindane_red.pdf.
3 Decades of breastmilk monitoring data from Sweden show steadily declining levels of organochlorine pesticides over time, following regulatory restrictions and phaseouts. See www.nrdc.org/breastmilk.
Figure C-2. Blood levels of p,p-DDE (ng/g lipid) measured in Mexican Americans, blacks and whites. The chronic Population Adjusted Dose (cPAD) is shown with the percentiles above which the dose exceeded the cPAD for each group. The top six data points were omitted from the plot to expand the region of interest.

Chemical Trespass 55
About pesticidesPesticide Action Network North America (PANNA)
http://www.panna.org
PAN Pesticide Database
http://www.pesticideinfo.org
Pesticide Action Network International
http://www.pan-international.org
Pesticide Education Center
http://www.pesticides.org/educmaterials.html
Beyond Pesticides
http://www.beyondpesticides.org
Northwest Coalition for Alternatives to Pesticides
http://www.pesticide.org
About pesticide alternatives PANNA’s Pesticide Advisor
http://www.panna.org/resources/advisor.dv.html
Organic Farming Research Foundation
http://www.ofrf.org
About chemical body burdenBody Burden Working Group
http://www.chemicalbodyburden.org
Natural Resources Defense Council http://www.nrdc.org/breastmilk
Environmental Working Group
http://www.ewg.org
Appendix D Where Can I Learn More? The following websites provide useful information, additional links and resources.
Physicians for Social Responsibility
http://www.envirohealthaction.org/bearingtheburden
Sandra Steingraber
http://www.steingraber.com
About health effects of pesticides Pesticide Education Center
http://www.pesticides.org/educmaterials.html
Our Stolen Future
http://www.ourstolenfuture.org
Collaborative on Health and the Environment (CHE)
http://www.cheforhealth.org
CHE science page
http://www.protectingourhealth.org
Physicians for Social Responsibility
http://www.psrla.org/pesthealthmain.htm
About corporate accountability PANNA’s Corporate Accountability pages
http://www.panna.org/corp/
Agribusiness Accountability Initiative
http://www.agribusinessaccountability.org/
Program on Corporations, Law, and Democracy
http://www.poclad.org/
Corporate Crime Reporter
http://www.corporatecrimereporter.com/
Public Citizen Global Trade Watch
http://www.citizen.org/trade/
56 Appendix E
Acute Population Adjusted Dose (aPAD) The short-term “acceptable” level of exposure to a particular pesticide for children, women who are pregnant or nursing and vulnerable populations such as the ill and the elderly, above which there may be cause for concern about increased risk of cancer and non-cancer effects.
Agribusiness The generally large-scale commercial enterprises involved in one or more areas of food and fi ber production, such as farming, inputs and machinery, fi nancing, processing, manufacturing, distribution, wholesaling and retailing.
Back-calculating exposure Using measured concentrations of pesticide metabolites to estimate the level of pesticide to which a person has been exposed.
Chronic Population Adjusted Dose (cPAD) The long-term “acceptable” level of exposure to a particular pesticide for children, women who are pregnant or nursing and vulnerable populations such as the ill and the elderly, above which there may be cause for concern about increased risk of cancer and non-cancer effects.
Endocrine/Hormone disruptors Chemicals known or suspected to disrupt the human hormone (endocrine) system.
Metabolite The breakdown product of a pesticide, which is often what is found when testing blood, urine or other body fl uids or tissues.
Neurotoxicity Toxicity to the brain or nervous system.
Organochlorine (OC) pesticides Insecticides composed primarily of carbon, hydrogen, and chlorine. They break down slowly and can remain in the environment long after application and in organisms long after exposure. Organochlorines have been linked to many acute and chronic diseases, and they are the class of chemicals found most often in hundreds of tests of human tissue around the world.
Organophosphorus (OP) pesticides Among the most acutely toxic pesticides, with most classifi ed by the U.S. EPA as either highly or moderately toxic (class I or class II). They work by interfering with the nervous system of insects, as well as mammals, birds, and fi sh. In addition, some OP pesticides cause developmental or reproductive harm, some are carcinogenic, and some are known or suspected endocrine disruptors.
Parent chemical The pesticide active ingredient to which a person is exposed, often resulting in breakdown products, or metabolites in the body.
Appendix E Glossary
Pesticide body burden The combination of pesticides and pesticide metabolites carried in an individual’s body at a given moment. Combined blood and urine analyses gives us a snapshot of the load of pesticides we carry in our bodies, including both pesticides that build up in our bodies over time and those that pass through our systems relatively quickly. It can also provide information about the levels at which we have been exposed to pesticides in the environment.
Pesticide treadmill The cycle of increasing reliance on commercial pesticides, in which pests develop resistance, and farmers and other users must apply increasing quantities of the same pesticides or switch to “new and improved” products to achieve similar levels of control.
Pesticide Trespass Index (PTI) A quantitative measure (a number between 0 and 1) indicating the share of pesticide trespass in a given population caused by an individual pesticide manufacturer.
Reference Dose (RfD) The long term “acceptable” level of exposure to a particular pesticide for healthy adults (excluding pregnant and nursing women), above which there may be cause for concern about increased risk of cancer and non-cancer effects.
Abbreviations2,4-D 2,4-dichlorophenoxy acetic acid
aPAD acute Population Adjusted Dose
ATSDR Agency for Toxic Substances Disease Registry
CDC Centers for Disease Control and Prevention
cPAD chronic Population Adjusted Dose
DDE Dichlorodiphenyldichloroethylene
DDT Dichlorodiphenyltrichloroethane
EPA U.S. Environmental Protection Agency
FQPA Food Quality Protection Act
HCB Hexachlorobenzene
HCH Hexachlorocyclohexane
IARC International Agency for Research on Cancer
NHANES National Health and Nutrition Examination Survey
OC Organochlorine
OP Organophosphorus
PCP Pentachlorophenol
PTI Pesticide Trespass Index
RfD Reference Dose
WHO World Health Organization

Pesticide Action Network (PAN) advocates adoption of ecologically-sound pest management methods in place of pesticide use. For 20 years, our international network of over 600 citizens groups in more than 90 countries has created a global pesticide reform movement with regional coordinating centers in Africa, Asia, Europe, Latin America and North America.
PAN North America’s (PANNA) primary approach is to link the collective strengths and expertise of groups in Canada, Mexico and the U.S. with counterpart citizen movements in other countries, and to carry out joint projects to further our collective goals of sustainable agriculture, environmental protection, workers’ rights, improved food security, and guaranteed human rights for all.
For more information and to order copies of this report, contact PANNA:49 Powell Street, Suite 500 San Francisco, CA 94102 phone (415) 981-1771 fax (415) 981-1991 [email protected] www.panna.org
Many U.S. residents carry toxic pesticides in their bodies above government
assessed “acceptable” levels. Chemical Trespass: Pesticides in Our
Bodies and Corporate Accountability makes public for the first time an analysis
of pesticide-related data collected by the Centers for Disease Control and
Prevention in a study of levels of chemicals in 9,282 people nationwide.
Many of the pesticides found in the test subjects have been linked to serious
short- and long-term health effects including infertility, birth defects and
childhood and adult cancers.
Chemical Trespass reports that children, women and Mexican Americans
shoulder the heaviest “pesticide body burden.” For example, children—the
population most vulnerable to pesticides—are exposed to the
highest levels of nerve-damaging organophosphorus
(OP) pesticides. The CDC data show that the
average 6 to 11 year-old sampled is exposed
to the OP pesticide chlorpyrifos (commonly
known by the product name Dursban) at four times the level
the U.S. Environmental Protection Agency considers “acceptable” for
long-term exposure.
The report introduces the Pesticide Trespass Index (PTI), a new tool for
quantifying the responsibility of individual pesticide manufacturers for
pesticide body burdens. Using the PTI, the report estimates that Dow Chemical
Corporation is responsible for at least 80% of the chlorpyrifos breakdown
products found in U.S. residents.
Chemical Trespass calls for immediate action by government officials and the
pesticide industry to reduce reliance on toxic pesticides and better protect the
public from pesticide exposures.