
Electrospray ionization (ESI) mass spectrometry Mass spectrometry Advanced Methods_Elviri.

Chemical Ionization Mass Spectrometry Study of Sulfuric Acid and Amine Chemical Nucleation Processes Pertinent to the Atmosphere
A DISSERTATION SUBMITTED TO THE FACULTY OF
UNIVERSITY OF MINNESOTA BY
Coty N. Jen
IN PARTIAL FULFILLMENT OF THE REQUIREMENTS FOR THE DEGREE OF
DOCTOR OF PHILOSOPHY
Peter H. McMurry
June, 2015

© Coty N. Jen, 2015

Acknowledgements
I acknowledge funding support from UMN Graduate School Fellowship, Achievement Rewards for College Scientists, National Science Foundation Graduate Research Fellowship, and UMN Doctoral Dissertation Fellowship. The National Science Foundation Awards AGS1068201, AGS0943721, and CDI1051396 provided funds for measurements and model development. Field measurements and data analysis were supported by Atmospheric Radiation Measurement Climate Research Facility and the Office of Biological and Environmental Research of the U.S. Department of Energy Grant Nos. DE-SC0006861 and DE-SC0011780.
I thank my advisor, Peter McMurry, for being the best advisor a student could want. Peter has given me an unparalleled graduate experience by providing me space to independently develop my own ideas and arguments while challenging me to think carefully about every aspect and every written word of our research. I strive to be as patient, nurturing, creative, and intelligent as Peter in my future career. I also thank my pseudo co-advisor, Professor Dave Hanson at Augsburg College, for providing invaluable insights on mass spectrometry and nucleation. Dave taught me to think deeply about every detail in an experiment and data analysis. Without Dave, my thesis research would not have been nearly as successful.
I also acknowledge help from Drs. Fred Eisle and Jim Smith at National Center for Atmospheric Research for assisting in trouble shooting my mass spectrometer. I thank Professor Jun Zhao for his help in improving the Cluster CIMS and Dr. Mari Lee for passing on the most organized set of instructions for a custom built instrument. I thank Derek O., Modi C., Ranga G., Julien B., Mark S, and Roxy K. for providing daily support in the lab and in the field. I thank Professor V. Faye McNeill, Neha S., Allie S., and Sophie C. from Columbia University who gave me useful tips throughout my graduate career.
I am grateful for the unwavering support from my friends including, but not all, Tessie P., Yogesh D., Chris T., Alex M., Brian M., Drew C., Cloud Dragon H., Max E., Jeff T., Sid C., Jeff P., Matt I., Heather L., Megan H., Simon T., Gunnar A., Nick C., Julia C., Jamie Y., Teresa L., Alex C., Jake S., and Luke F. I finally thank my mother, father, and brother for inspiring me to be better person my whole life.
i

Dedication
This dissertation is dedicated to all the graduate students suffering from mental illness. Do not suffer alone.
ii
Abstract
Clouds influence climate and cool the planet by reflecting incoming sunlight
away from Earth’s surface. The extent and brightness of these clouds depend on the
composition and concentration of atmospheric particles, the starting point for cloud
droplet formation. The majority of atmospheric particles originate from a process known
as nucleation, whereby low volatility, gaseous precursors react to form stable clusters (~1
nm diameter). Sulfuric acid (H2SO4 or SA) is essential for atmospheric nucleation and in
continental regions originates primarily from anthropogenic activities. However,
atmospheric nucleation remains difficult to study due to the challenges of measuring
incipient particles <1 nm (cluster containing ≤4 SA molecules plus water and other
stabilizing compounds) and at atmospherically relevant concentrations of 1 part per
quadrillion.
The purpose of my thesis work is (1) to better understand the technique of
chemical ionization mass spectrometry (CIMS) for measuring SA and its clusters and (2)
to measure and model how various atmospherically relevant basic gases, such as
ammonia and amines, affect SA nucleation. The main instrument, the Cluster CIMS, uses
nitrate (NO3-) to chemically ionize SA vapor and clusters at atmospheric pressure. My
measurements and subsequent modeling of the chemical ionization processes show that
nitrate is unable to ionize chemically neutral SA clusters, i.e. clusters that contain near
equal numbers of acid and base molecules. In contrast, the acetate ion (CH3CO2-) is
capable of ionizing more cluster types, thereby providing more accurate measurements of
cluster concentrations. These findings imply that a large fraction of clusters may have
gone unobserved in ambient measurements due to inefficient nitrate chemical ionization.
To ensure that the Cluster CIMS accurately measures concentrations of larger SA
clusters using acetate chemical ionization, I developed a method for comparing cluster
concentrations measured by mass spectrometry with particle number concentrations
measured by mobility classification/vapor condensation particle counter in the size range
around 1 nm where they overlap. I used computational chemistry, particle dynamics, and iii

the diffusing transfer function of a mobility classifier to reconcile these two very different
measurement techniques. Comparisons show good agreement between the instruments
for ~1 nm clusters produced in a sulfuric acid/dimethylamine (DMA) environment.
The Cluster CIMS and a diethylene glycol scanning mobility particle sizer were
also used to study how ammonia and amines react with SA vapor to form clusters and
particles in a very clean flow reactor. Results show that DMA and diamines produce
higher cluster and particle concentrations than methylamine and ammonia, which implies
that they form less volatile clusters leading to higher nucleation rates. Diamines,
including compounds such as cadaverine and putrescine, are a previously unstudied class
of atmospherically relevant compounds that originate from industrial and natural sources.
I observed that diamines+SA can produce 10 times more particles than DMA. Field
measurements of diamines in Lamont, OK from spring, 2013 show gas phase diamine
concentrations are equal to or greater than DMA concentrations. Thus, diamines are
potent nucleating agents that likely contribute significantly to atmospheric nucleation.
Overall, my thesis work improved nucleation instrumentation and increased knowledge
on the chemical mechanisms behind atmospheric nucleation.
iv

Table of Contents Acknowledgements .............................................................................................................. i
Dedication ........................................................................................................................... ii
Abstract .............................................................................................................................. iii
Table of Contents ................................................................................................................ v
List of Tables ...................................................................................................................... x
List of Figures .................................................................................................................... xi
Chapter 1. Introduction ................................................................................................. 1
1.1 Atmospheric Nucleation......................................................................... 1
1.2 Heuristic Acid-Base Chemical Reaction Model for Atmospheric
Nucleation .......................................................................................................... 5
1.3 Nanoparticle and Cluster Instrumentation ............................................. 8
1.4 Outline of Research .............................................................................. 10
Chapter 2. Stabilization of Sulfuric Acid Dimers by Ammonia, Methylamine,
Dimethylamine, and Trimethylamine .......................................................................... 13
2.1 Overview .............................................................................................. 13
2.2 Introduction .......................................................................................... 13
2.3 Data and Methodology ......................................................................... 16
2.4 Results and Discussion ......................................................................... 18
2.4.1 Observations .................................................................................. 18
2.4.2 Scheme 1, Steady State Model ...................................................... 24
2.4.3 Scheme 2, Steady State Model ...................................................... 25
v
2.4.4 Scheme 1, Transient Model ........................................................... 27
2.4.5 Scheme 2, Transient Model ........................................................... 29
2.5 Atmospheric Implications .................................................................... 32
2.6 Conclusions .......................................................................................... 34
2.7 Supporting Information ........................................................................ 35
2.7.1 MCC Measurement of NLD .......................................................... 35
2.7.2 Ion-Induced Clustering (IIC) of the MCC..................................... 35
2.7.3 Repeatability of Flow Reactor Experiments and Uncertainty in
Measurement ........................................................................................ 39
2.7.4 Collision-Controlled Limit at Steady State ................................... 40
2.7.5 Scheme 1 Acid-Base Reaction Model for Nucleation .................. 41
2.7.6 Scheme 2 Acid-Base Reaction Model for Nucleation .................. 43
2.7.7 Scheme 2 at Steady State and Applied to the Atmosphere ........... 44
2.7.8 [A2] / [A1] vs. [B] for Constant [A1] ............................................. 45
2.7.9 Time Dependent Behavior of Particle Coagulation Loss .............. 48
Chapter 3. Towards Reconciling Measurements of Atmospherically Relevant
Clusters by Chemical Ionization Mass Spectrometry and Mobility
Classification/Vapor Condensation .............................................................................. 51
3.1 Overview .............................................................................................. 51
3.2 Introduction .......................................................................................... 51
3.3 Ion Mobilities and Mobility Classifier Transfer Function ................... 53
3.4 Cluster CIMS vs. DEG MPS at 1.34 nm Centroid Mobility Diameter 53
3.5 Conclusion ........................................................................................... 55
3.6 Supporting Information ........................................................................ 56
vi

3.6.1 Experimental Setup ....................................................................... 56
3.6.2 Clusters and their Mobilities ......................................................... 57
3.6.3 Ion-Induced Clustering (IIC) in Sulfuric Acid/Dimethylamine
Environment ......................................................................................... 58
3.6.4 Nitrate vs. Acetate Sulfuric acid/DMA Spectra Comparison ....... 60
3.6.5 Cluster CIMS vs. DEG MPS at 1.34 nm Centroid Mobility
Diameter without DMA ....................................................................... 61
3.6.6 Predicted DEG MPS Comparisons at 1.23 and 1.55 nm Mobility
Diameter ............................................................................................... 63
Chapter 4. Diamine-Sulfuric Acid Reactions are a Potent Source of Atmospheric
Particle Formation ........................................................................................................ 66
4.1 Overview .............................................................................................. 66
4.2 Introduction .......................................................................................... 67
4.3 Flow Reactor Results ........................................................................... 68
4.4 Field Measurements ............................................................................. 72
4.5 Methods ................................................................................................ 74
4.6 Supporting Information ........................................................................ 76
4.6.1 Effects of [A1]o on Ntot at Fixed [B] .............................................. 76
4.6.2 [B]/Ntot, [A1]o/Ntot, and np for TMEDA and Put ............................ 76
4.6.3 Size Distributions for Particles Formed from Sulfuric + Mono or
Diamines .............................................................................................. 77
4.6.4 Power Dependencies of Ntot on [A1]o and [B] ............................... 78
4.6.5 Measurement of Diamines in the Atmosphere .............................. 80
vii

Chapter 5. Cluster Formation of Sulfuric Acid with Dimethylamine or Diamines
and Detection with Chemical Ionization ...................................................................... 81
5.1 Overview .............................................................................................. 81
5.2 Introduction .......................................................................................... 81
5.3 Method ................................................................................................. 85
5.4 Acetate vs. Nitrate Comparison ........................................................... 86
5.5 Monomer, N1 ........................................................................................ 90
5.6 Dimer, N2 ............................................................................................. 93
5.7 Trimer, N3 ............................................................................................ 97
5.8 Tetramer, N4 ....................................................................................... 101
5.9 Pentamer, N5 ...................................................................................... 102
5.10 Observed Cluster Concentrations Using Acetate CI .......................... 103
5.11 Conclusion ......................................................................................... 107
5.12 Supporting Information ...................................................................... 108
5.12.1 Mass-Dependent Sensitivity of the Cluster CIMS .................... 108
5.12.2 Chemical Ionization and IIC Reactions .................................... 110
5.12.3 Positive Ion Cluster of Sulfuric Acid and Various Bases ......... 112
5.12.4 Modeled Reactions .................................................................... 114
5.12.5 Acetate Detected S195/S160 for TMEDA and Put ....................... 116
Chapter 6. Conclusions and Recommendations for Future Work ....................... 117
6.1 Summary of Discoveries .................................................................... 117
6.2 Future Work in Nanocluster and Particle Instrumentation ................ 119
viii

6.3 Future Work for the Chemical Reaction Model of Atmospheric
Nucleation ...................................................................................................... 121
References ....................................................................................................................... 124
ix

List of Tables Table 1 Examples of cluster types for each cluster size, where A=sulfuric acid and
B=stabilizing compound ......................................................................................... 6
Table 2 Summary of the saturation [B] and the fitted evaporation rates constants for both schemes at steady state. Note for scheme 1, E3=0 s-1 and for scheme 2, E3=0.4 s-1 from Chen et al. [2012]. ........................................................................................ 26
Table 3 Fitted evaporation rate constants from the transient solutions. Note for scheme 1, E3=0 s-1 and for scheme 2, E3=0.4 s-1 from Chen et al. [2012]. ............................ 28
Table 4 Comparison of empirical evaporation rate constants from this study to those from Ortega et al. [2012] ............................................................................................... 30
Table 5 Summary of possible pathways for neutral monomer formation and chemical ionization............................................................................................................... 92
Table 6 Summary of possible pathways for neutral and ion dimer formation.................. 95
Table 7 Summary of possible pathways for neutral and ion trimers formed from sulfuric acid+DMA .......................................................................................................... 100
Table 8 Observed saturation [B] and fitted evaporation rates for four different bases using acetate CI cluster concentrations. ....................................................................... 104
Table S1 Comparison between slopes of S160/S125 and S195/S160 vs. time ................ 38
Table S2 Mobilities of sulfuric acid clusters with DMA in N2 carrier gas ....................... 58
Table S3 Summary of diamine signal from a dozen acid scrubber experiments in Minneapolis, spring 2014...................................................................................... 80
Table S4 List of positive ion cluster types detected by the Cluster CIMS ..................... 113
Table S5 Summary of all the reactions modeled in this study ........................................ 115
x

List of Figures Figure 1 Schematic of the flow reactor including the location of the MCC sampling
region. The flow in the reactor is laminar, leading to a reaction time of ~ 3 sec. The base concentration decreases about 10 times due to diffusion mixing (indicated by the red dashed line) by the MCC sampling location. The chemical ionization of the dimer (195 m/z) is shown explicitly with the unknown compound(s) X evaporating from the cluster upon ionization. ............................ 17
Figure 2 Measured [A2] vs. [A1] for the four bases at various concentrations. (a) Ammonia, NH3; (b) Methylamine, MA; (c) Dimethylamine, DMA; and (d) Trimethylamine, TMA .......................................................................................... 19
Figure 3 Comparison between the DMA data shown in this study and those given in Almeida et al. [2013]. [A2] from this study are shown as red points and are not corrected for IIC (actual concentrations will be ~1-100% lower, depending on [A1]). The green triangles correspond to the DMA experiments (range 3-100 pptv) from CLOUD. The blue squares are the baseline measurements from Petäjä et al. [2011] at a residence time of 32 sec. The dashed black line is the baseline measurements from this study at a residence time of ~40 sec. The solid black cure is the collision-controlled limit where evaporation is negligible and clusters do not react with the base. ................................................................................................ 21
Figure 4 Two conceptual acid-base reaction schemes where moving downwards is a monomer (both A1 and A1B for scheme 2) addition and moving to the right is a base addition. Modifications to the acid-base reaction model proposed in Chen et al. [2012] are shown in red. κ and η apply to both schemes. ................................ 23
Figure 5 Scheme 1 solved at steady state (lines) is compared to the measured [A2] and [A1] (points). Colors for the lines correspond to the same [B] as the points, and fitted evaporation rate constants are given inside each base graph. (a) NH3, (b) MA, (c) DMA, and (d) TMA ................................................................................ 24
Figure 6 Scheme 2 solved at steady state (lines) is compared to the measured [A2] and [A1] (points). Fitted evaporation rate constants are given inside each base graph. (a) NH3, (b) MA, (c) DMA, and (d) TMA ............................................................ 26
Figure 7 Comparison between transient scheme 1 (lines) to measured [A2] vs [A1] at different [B]. The fitted evaporation rates are shown inside the graphs. (a) NH3, (b) MA, (c) DMA, and (d) TMA .......................................................................... 28
Figure 8 Comparison between transient solution of scheme 2 (lines) to measured [A2] vs [A1] at different [B]. The fitted evaporation rates are shown inside the graphs. (a) NH3, (b) MA, (c) DMA, and (d) TMA ................................................................. 30
xi

Figure 9 Observed nucleation rates from various locations as a function of [A1]. Scheme
2 presented here predicts nucleation rates enclosed in purple dashes if nucleation is due to reactions of sulfuric acid with DMA and in black dot/dash if due to reactions with NH3. The table to the right details the values used to determine the DMA and NH3 nucleation rates ............................................................................ 33
Figure 10 TSI 3085 transfer function at the classifying voltage and flow rate used in this study. Clusters that fall within the mobility window are also shown. Those in red were detected by the Cluster CIMS using nitrate. ................................................ 53
Figure 11 Comparison of predicted DEG MPS concentration at 1.34 nm centroid mobility diameter to measured DEG MPS concentration at various [DMA]. The colors in the bar represent each cluster type and its contribution to the total number concentration. Cluster CIMS measurements were done using acetate (solid bars) and nitrate (hash-marked bars). The lines show 1:1 comparisons. This method was applied to two other centroid mobility diameters: 1.23 (3.8 V) and 1.55 nm (6.0 V). These results are given in the SI and show good agreement. ......................... 54
Figure 12 [Ntot] as a function of [B] (bottom two axes show [B] and top provides the equivalent [B]/[A1]o). Each color represents a different base compound with [A1]o =2x109 cm-3. The estimated random uncertainties for [B] and Ntot are depicted with the MA points and apply to all measurements. ............................................. 69
Figure 13 [A1]o /Ntot (filled symbol) and [B]/Ntot (open symbol) as a function of [B] (bottom x-axis, given as pptv and cm-3). [A1]o was held constant at 2x109 cm-3. [B]/[A1]o is shown on the top x-axis. Three bases are shown: (a) EDA, (b) DMA, and (c) MA. Red lines illustrate the estimated number of molecules per particle, np, with the gray region showing a range of values corresponding to aqueous sulfuric acid (higher) or solid DMA+sulfuric acid (lower). ................................. 70
Figure 14 Measured amine and sulfuric acid concentration during the SGP field campaign of spring, 2013. The vertical lines indicate the start of a nucleation event. The gray box indicates when the Cluster CIMS was not operating. The numbers at the top identify specific events. .................................................................................. 74
Figure 15 Comparison of cluster concentrations measured using acetate (solid bars) and nitrate (hashed bars) reagent ions at four different [DMA] and constant intial [A1]o=4x109 cm-3. [N1] and [N2] are on a log scale (left y-axis), while the larger clusters are on a linear scale (right y-axis). Each color in the bar represent the measured number of DMA molecules in the cluster. The percentages indicate the fraction of each cluster type compared to the total concentration of a cluster of a specified size. ........................................................................................................ 88
Figure 16 Comparison of cluster concentrations measured using acetate (solid bars) and nitrate (hashed bars) reagent ions at two different [EDA] and constant intial
xii

[A1]=4x109 cm-3. [A1] and [A2] are on a log scale (left y-axis), while the larger clusters are on a linear scale (right y-axis). Each color in the bar represent the number of EDA molecules in the cluster. ............................................................. 89
Figure 17 Comparision of cluster concentrations measured using acetate (solid bars) and nitrate (hashed bars) reagent ion at two different [TMEDA] and [A1]o=4x109 cm-3. [N1] and [N2] are on a log scale (left y-axis) ,while the larger clusters are on a linear scale (right y-axis). Each color in the bar represent the number of DMA molecules in the cluster. ........................................................................................ 89
Figure 18 Comparison of cluster concentration mesaured using acetate (solid bars) and nitrate (hashed bars) reagent ions at two different [Put] and [A1]o=4x109 cm-3. [N1] and [N2] are on a log scale (left y-axis), while the larger clusters are on a linear scale (right y-axis). Each color in the bar represent the number of DMA molecules in the cluster. ........................................................................................ 89
Figure 19 Measuerd S160/S125 as a function of CI reaction time for DMA (left) and EDA (right) as measured by nitrate CI at [A1]o=4x109 cm-3. ......................................... 91
Figure 20 Modeled S160/S125 as a function of CI reaction time at equivalent concentrations as Figure 19. .......................................................................................................... 93
Figure 21 Measured S195/S160 as a function of CI reaction time for DMA (left), EDA (center), and TMEDA (right) detected by nitrate CI at [A1]o=4x109 cm-3. The table in each graph provides the measured [A1] at that [B]. The dotted vertical line is the CI reaction time of 18 ms used in Figure 15and Figure 16 for nitrate CI. ...... 95
Figure 22 Modeled S195/S160 as a function of CI reaction time for DMA (left), EDA (center), and TMEDA (right) at the same concentrations used for Figure 21. ..... 96
Figure 23 Measured S293/S160 as a function of CI reaction time for DMA (left), EDA (center), and TMEDA (right) detected by nitrate CI at [A1]o=4x109 cm-3. ........... 98
Figure 24 Nitrate measured SA3•B/S160 as a function of CI reaction time for DMA (left), EDA (center, and TMEDA (right) at [A1]o=4x109 cm-3. Note the different y-axis scales between bases. ............................................................................................ 99
Figure 25 Modeled S293/S160 (left) and SA3.DMA/S160 (right) as a function of CI reaction time for DMA at conditions used for Figure 23 and Figure 24. ......................... 101
Figure 26 Nitrate measured SA4.diamine/S160 as a function of CI reaction time for EDA (left) and TMEDA (right). ........................................................................................... 102
Figure 27 [Nm] vs. measured [N1] for four different [DMA], as indicated by different color points.......................................................................................................... 105
xiii

Figure 28 [Nm] vs. measured [N1] for five different [EDA], as indicated by different color
points. .................................................................................................................. 106
Figure 29 [Nm] vs. measured [N1] for three different [TMEDA], as indicated by different color points.......................................................................................................... 106
Figure 30 [Nm] vs. measured [N1] for seven different [Put], as indicated by different color points ................................................................................................................... 107
Figure S1 Measured [B] as a function of [A1]. The different symbol types signify the base
type and the colors (as defined in the legend to the right) indicate the predicted NLD. The dashed lines are NLD concentrations. ................................................. 35
Figure S2 Left: Ratio of signals of 160 m/z and 125 m/z as a function of CI reaction time. Right: Ratio of signals of 195 m/z and 160 m/z as a function of CI reaction time. Each color represents a different [MA], and the lines are linear fits. ................... 39
Figure S3 Measured [A2] vs. [A1] values for [MA]=80 pptv on three different days (black for 8/27/13, blue for 8/29/13, and red for 9/3/13 ). The box on the bottom right shows the systematic error of the MCC. ............................................................... 40
Figure S4 Measured [A2] vs. [A1] with the calculated collision controlled limit drawn as a black line. The collision-controlled [A2] was determined from measured [A1] and includes particle coagulation and wall losses. No cluster evaporation or base reaction is present at this limit. Most [B] and [A1] conditions produced measured [A2] below this limit. (a) NH3, (b) MA, (c) DMA, and (d) TMA ......................... 41
Figure S5 The ratio [A2] /[A1] vs. [B] better illustrates the dimer dependence on [B]. Each color is at a constant [A1] and the lines are the predicted steady state ratios from scheme 1. (a) NH3, (b) MA, (c) DMA, and (d) TMA .................................. 46
Figure S6 Ratio of [A2] /[A1] vs. [B] solved at steady state for scheme 2 (lines). (a) NH3, (b) MA, (c) DMA, and (d) TMA .......................................................................... 46
Figure S7 [A2] / [A1] vs. [B] at constant [A1]. The lines were calculated from the transient solution of scheme 1. (a) NH3, (b) MA, (c) DMA, and (d) TMA ......................... 47
Figure S8 [A2] / [A1] vs. [B] at constant [A1]. The lines were calculated from the transient solution of scheme 2. (a) NH3, (b) MA, (c) DMA, and (d) TMA ......................... 47
Figure S9 Particle sink loss rate vs. MCC measured [A1]. Sink loss rate was determined from the Afuchs of the DEG SMPS measured size distribution for particles >1.3 nm in this study. .......................................................................................................... 49
Figure S10 Transient solution to scheme 1 with maximum amount of particle coagulation loss. The lines are the model predictions and points are measured concentrations.
xiv

The fitted evaporation rates remain unchanged. (a) NH3, (b) MA, (c) DMA, and (d) TMA ................................................................................................................ 49
Figure S11 Transient solution of scheme 2 (lines) with maximum amount of particle coagulation loss. (a) NH3, (b) MA, (c) DMA, and (d) TMA ................................ 50
Figure S12 Nitrate measured ratios of S195/S160 as a function of CI reaction time at the same [A1]o and four [DMA]. Measured [A1] at each [DMA] is given in the legend. Dashed line extrapolates the linear fit to t=0 s, where the y-intercept gives the fraction of neutral [A2] to the neutral [A1]. The dotted line indicates the CI reaction time used in this study with nitrate of 0.018 s. ....................................... 59
Figure S13 Mass spectra comparison between nitrate (black) and acetate (red) chemical ionization ions. These spectra were measured at [DMA]=110 pptv and [A1]o=4x109 cm-3. Key peaks are identified with acetate abbreviated as Ac-. ...... 61
Figure S14 Comparison between predicted DEG MPS concentration from Cluster CIMS (nitrate) to the measured DEG MPS concentration at a classifying voltage of 4.50 V (1.34 nm centroid mobility diameter) and [DMA]=0pptv. The black line is the 1:1 comparison. Only one type of cluster was detected. The other clusters were below detection limit. ................................................................................... 63
Figure S15 Transfer function (lines) of the TSI 3085 mobility classifier at three different voltages (3.80, 4.50, 6.00 V), corresponding to centroid mobility diameters of 1.23, 1.34, and 1.55 nm and centriod geometric (mass) diameters of 0.83, 1.04, and 1.25 nm. The points represent the clusters’ mobilities and their tranfer function value at each size bin. Red clusters are detected by the Cluster CIMS using nitrate and red+black detected using acetate. .............................................. 64
Figure S16 Comparison between predicted DEG MPS concentration from Cluster CIMS measured concentration (using acetate) to the measured DEG MPS concentration at a classifying voltage of 3.80 V (1.23 nm centroid mobility diameter) at four different [DMA]. The different color types in the bar represent the different types of clusters measured by the Cluster CIMS and their contribution to the predicted total number concentration. .................................................................................. 65
Figure S17 Comparison between predicted DEG MPS concentration from Cluster CIMS measured concentration (acetate) to the measured DEG MPS concentration at a classifying voltage of 6.00 V (1.55 nm centroid mobility diameter) at four different [DMA]. ................................................................................................... 65
Figure S18 Total particle number concentration as a function of [A1]o. Each color/symbol represents a different base compound at 4 pptv. The estimated random uncertainties are given for MA but represent all measurements. .......................... 76
xv

Figure S19 [A1]o /Ntot (filled symbol) and [B]/Ntot (open symbol) as a function of [B]
(bottom x-axis, given as pptv and cm-3). [A1]o was held constant at 2x109 cm-3. [B]/[A1]o is shown on the top x-axis. Two diamines are shown: (a) TMEDA and (b) Put. Red lines illustrate the estimated number of molecules per particle, np, with the gray region showing the range of values corresponding to aqueous sulfuric acid (higher) or solid DMA+sulfuric acid (lower). ................................. 77
Figure S20 Particle size distribution for [B]=4 pptv (9.6x107 cm-3) at two different [A1]o: (a) 2x109 cm-3 and (b) 4x109 cm-3. ........................................................................ 78
Figure S21 Ntot as a function of [diamine] for EDA (left), TMEDA (center), and Put (right). Each color in a panel represents a constant [A1]o, and its corresponding line represents a linear regression at a constant [A1]o. The slopes and their standard errors are given in the legends. ............................................................... 79
Figure S22 Ntot as a function of [A1]o for EDA (left), TMEDA (center), and Put (right). Each color in a panel represents a constant [B], and its corresponding line represents a linear regression at a constant [B]. The [B] are given in both pptv and cm-3. The slopes of the regressions are given in the legends. ............................... 79
Figure S23 Sensitivity of the UMN Cluster CIMS as a function of mass. The points indicate the measured sensitivity of the positive alkyl halide ions and the red line is the extrapolated sensitivity for masses larger than 450 m/z. The black is the average sensitivity of the acetate ions. ................................................................ 109
Figure S24 Mass scan of sulfuric acid at [A1]o=4x109 cm-3 and [EDA]=60 pptv measured using acetate. Identities of sulfuric acid+EDA peaks are labeled. ...................... 109
Figure S25 Monomer and dimers detected via acetate (solid), nitrate (hashed), and protonated water clusters (diagonal stripes) chemical ionization. Each color represents the number of base molecules with EDA shown on the left, Put center, and TMEDA right. .............................................................................................. 114
Figure S26 Acetate detected S195/S160 as a function of CI reaction time for one [TMEDA] and two [Put]. The inset table provides the measured [A1]. ............................... 116
Figure S27 Nitrate detected S195/S160 as a function of CI reaction time for Put. The inset table lists the corresponding measured [A1] and the equations provide the parameters of the fitted linear model. ................................................................. 116
xvi

Chapter 1. Introduction
1.1 Atmospheric Nucleation
Atmospheric particles are vital for cloud formation as they serve as seed particles
for water condensation. The composition and concentration of atmospheric particles
influence the extent and brightness of clouds and ultimately their cooling effect on the
planet. The majority of atmospheric particles over land are produced from a process
known as nucleation [IPCC, 2014], whereby gaseous sulfuric acid vapors condense and
form stable particles. However, both laboratory and computational chemistry models
have shown that the nucleation rate (i.e., the rate of particle production) by sulfuric acid
and water alone is orders of magnitude lower than observed atmospheric nucleation rates
[Weber et al., 1996]. The chemical mechanisms behind atmospheric nucleation are poorly
understood, resulting in large uncertainties in quantifying the extent to which atmospheric
aerosols influence global climate [IPCC, 2014]. Thus, a better understanding of processes
behind atmospheric nucleation is vital in improving global climate models.
Nucleation can be modeled as a series of reactions that lead to the net formation
of clusters and, eventually, larger particles. The classical nucleation theory approach to
single-component nucleation accounts only for vapor condensation or evaporation from
clusters of a given size. For example in a system containing only compound A, the
reaction scheme for the formation of a dimer (A2), a cluster composed of two monomers
(A1), occurs at a forward rate constant of k11. However, A2 can also evaporate at a rate of
E1. This is described in Reaction 1 and can be extended to larger clusters/particles.
11
11 1 2
k
EA A A→+ ← Reaction 1
The evaporation rates serve as bottlenecks to nucleation by limiting the rate at which
particles form. The maximum number of particles that can be produced in a system will
occur if all the evaporation rates are zero. This upper limit is known as the collision-
controlled limit [Kürten et al., 2014; McMurry, 1980; McMurry, 1983] and implies that
every cluster and particle is stable.
1

At equilibrium, the evaporation rate constant can be determined from the standard
Gibbs free energy change of the reaction (ΔGo), the Boltzman constant (kB), and the
temperature (T). For Reaction 1, the equilibrium constant, Keq, is defined as
11,11
1
expo
eqB
k GKE k T
−∆= =
Equation 1
where the forward rate constant, k11, is the monomer collision rate. Classical nucleation
theory combined with the liquid droplet model [Becker and Döring, 1935] has been
applied to the sulfuric acid system to estimate free energies for the cluster formation
reactions, and therefore evaporation rates. This model uses bulk vapor pressure and
surface energy to balance the change in free energy of adding one molecule to a cluster
with the change of free energy in expanding the surface of the cluster. The size at which
free energy is maximized is known as the critical size and is where a cluster will have
equal probability of evaporating or growing. Particles larger than the critical size grow
faster than they evaporate, while evaporation rates for smaller particles exceed vapor
condensation rates.
Since the atmosphere contains numerous other compounds, classical nucleation
theory with sulfuric acid has been expanded to include two common compounds: water
(binary system) and ammonia (ternary system). Nucleation rates predicted for the sulfuric
acid-water system are up to 10 orders of magnitude lower than rates observed in the
atmosphere [Weber et al., 1996]. Furthermore, observations show that nucleation rates
vary approximately in proportion to [sulfuric acid]2, while classical theory predicts a
much stronger dependence ([sulfuric acid]p, 7<p<10) [Weber et al., 1996]. Including
ammonia at 5 pptv in the sulfuric acid-water system dramatically increases predicted
nucleation rates (likely even higher if ammonia concentrations match observed
concentrations in the ppbv range) [Coffman and Hegg, 1995] but are up to 20 orders of
magnitude higher than predicted sulfuric acid-water nucleation rates and up to 10 orders
higher than observed rates [Weber et al., 1996]. These ternary nucleation rates are
2

unrealistically too high as they exceed the collision-controlled rate by 2-3 orders of
magnitude [Zhang et al., 2010].
The classical theory for atmospheric nucleation fails for several reasons. First, the
model assumes bulk properties of the liquid component, such as its density and vapor
pressure, can be extended to the 1 nm size scale, the approximate size of stable clusters in
the atmosphere. These clusters contain only a few (2-4) sulfuric acid molecules. Such
extrapolations are highly inaccurate because they neglect quantum mechanical
interactions between molecules such as proton transfers. In addition, classical theory
assumes clusters of size g (i.e., clusters that contain g sulfuric acid molecules) will have
the same composition and physical properties. We now know this is inaccurate as clusters
of size g also contain varying numbers of other molecules (see Chapter 3). Each of these
cluster types will have its own thermodynamic properties and will therefore exhibit
different evaporation rates. This reality needs to be taken into account.
Alternatively to classical nucleation theory, the evaporation rates and free
energies can be estimated from a kinetic perspective where the accumulation of a
cluster/particle of a specific size, g, is described by its formation and destruction. This is
detailed in the cluster balance equations. Equation 2 provides the cluster balance equation
for a single component system where the concentration of clusters containing g molecules
of A, [Ag], as a function of time equals its formation and loss rates.
[ ] 1 1g
ij i j g g g g g gi j g
d Ak A A E A E A A A
dtk η+ +
+ =
= + − − − ∑ Equation 2
where κ is the coagulation loss rate with other clusters/particles and η is the loss rate to
surfaces. Eg is the evaporation rate of A from Ag, and Eg+1 is the evaporation rate of A
from a cluster size g+1 to form Ag.
The kinetic model must be expanded to include multiple components as recent
research has shown that sulfuric acid vapors and cluster react with various compounds to
form stable cluster that evaporate less. These stabilizing compounds include ammonia
3

[Chen et al., 2012; Hanson and Eisele, 2002; Weber et al., 1998], amines [Almeida et al.,
2013; Chen et al., 2012; Glasoe et al., 2015; Jen et al., 2014; Kürten et al., 2014; Zhao et
al., 2011], oxidized organics [Schobesberger et al., 2013], and water [Hanson and Eisele,
2002]. The multi-component reaction model must then take into account formation of
clusters by the combination of these various compounds.
To illustrate, consider the two component system containing compounds A
(sulfuric acid) and B (stabilizing compound). The classifications of cluster size are
defined by the number of A molecules in the cluster but may also contain any number of
B molecules. We use the term “dimer” to denote clusters that contain two A molecules
and ≥0 molecules of B. The formation of a dimer in this two component system can then
be described the reaction scheme detailed in Reaction 2. This scheme predicts three types
of dimer (A2, A2•B and A2•B2) and two types of monomer (A1 and A1•B), each with its
own evaporation rate. 11
2
1
2,
2,
2,
1,
2, 2
1 1 2
1 1
1 1 2
2 2
1 1 2 2
B
B
A
B
B
B
B
k
E
k
E
k
E
k
E
k
E
A A A
A B A B
A B A A B
A B A B
A B A B A B
→+ ←
→+ •←
→• + •←
→+ •←
→• + • •←
Reaction 2
Cluster balance equations can be written for each cluster type. For example, the cluster
balance equation for A2•B is
[ ] [ ][ ] [ ][ ] [ ]( ) [ ]( )22 2. 1 1 2 2, 2, 2B B A B
d A Bk A B k A B A A B E E A B
dtk η
•= + • − • + − • + Equation 3
Overall, six cluster balance equations are needed to describe Reaction 2, including one to
describe the consumption of B. More equations will be needed if additional cluster types
are added, such as A2•B3, or if more compounds are added to the system. Once the
concentration of precursor gases (e.g. sulfuric acid and stabilizing compounds) and the
4

evaporation rates are known, then the cluster balance equations can be solve to predict
nucleation rates of particles of a certain size.
Previous research has determined evaporation rates using two distinct but
complementary methods. Computational chemistry, specifically density functional
theory, has been used by the Vehkamäki group to calculate the free energy of each cluster
type. Evaporation rates can be extracted from the energies following equilibrium
thermodynamics (Equation 1) [Ortega et al., 2012]. In addition, the Vehkamäki group
has developed a program to simulate time-evolved cluster concentrations by solving the
balance equations with their calculated evaporation rates [McGrath et al., 2012]. Our
group uses the second approach and solves the cluster balance equations for evaporation
rates from experimental observations that were measured using recently developed
instrumentation. Jiang et al. [2011c] presented first measurements of the complete
atmosphere particle distribution down to one molecule of sulfuric acid. However, cluster
concentrations measured by mass spectrometry are not comprehensive and do not include
every type of sulfuric acid cluster that may exist. In addition, solving the interdependent
cluster balance equations for evaporation rates likely leads to large uncertainties. Thus to
model atmospheric nucleation, our group has developed a simplified hybrid model that
focuses on the key bottleneck steps in the chemical nucleation and identifies
atmospherically relevant stabilizing compounds. This heuristic model, known as the acid-
base chemical reaction model, calculates evaporation rates based upon measureable
quantities .
1.2 Heuristic Acid-Base Chemical Reaction Model for Atmospheric Nucleation
First published in Chen et al. [2012], the acid-base reaction model groups clusters
with g number of sulfuric acid molecules (but varying numbers of B stabilizing
compounds) into one group labeled Ng. Examples are given in Table 1.
5

Table 1 Examples of cluster types for each cluster size, where A=sulfuric acid and
B=stabilizing compound
Label, cluster size Possible cluster types
Monomer, N1 A1, A1•B
Dimer, N2 A2, A2•B, A2•B2
Trimer, N3 A3, A3•B, A3•B2, A3•B3
The cluster formation reactions then follow the single component reaction scheme (c.f.
Reaction 1) in that each cluster size can grow via condensation or evaporation of N1.
However unlike the single component system, the acid-base model also explicitly infers
key stabilizing reaction steps from observations. For example, a dimer may evaporate or
react with a basic compound to form a lower volatility dimer that does not evaporate.
These two types of dimers are indistinguishable to the mass spectrometer (for reasons
discussed below) but the total [N2] will show a positive dependency on [B]. This trend
will be captured by including the reaction of the dimer with B. Depending on the data
available, these stabilizing reactions can be general or target specific cluster types. Due to
instrument limitations, previous experimental observations resulted in only including
generalized stabilizing reactions, such as N2 reacting with B to form a lower volatility N2
[Chen et al., 2012]. Experimental results presented here combined with computational
chemistry results have refined these reactions to include more specific reactions such as
A1 reacts with B to form A1•B.
Unlike the full, multi-component model where each cluster formation pathway
must be taken into account, this acid-base reaction model uses measured cluster
concentrations and computational chemistry to chart out most likely cluster formation
pathways. Fitted evaporation rates then represent an average over the rate limiting steps
to form clusters of that specific size. Furthermore, additional components can be added to
the acid-base model without significantly complicating the cluster balance equations by
including only their significant reaction steps to the cluster formation pathways. Overall,
this heuristic chemical reaction model for nucleation provides a useful tool for identifying 6

potential stabilizing compounds, calculating average evaporation rates, and determining
which generalized cluster formation steps are the bottlenecks to nucleation.
Chen et al. [2012] used the acid-base model to explain experimental observations
and determined that sulfuric acid dimers and trimers (with some number of attached
stabilizing molecules) evaporate to some extent, implying that evaporation from the
dimer and trimer sizes were the primary bottlenecks to nucleation. Kürten et al. [2014]
found that the dimer, with two sulfuric acids and one or two dimethylamine molecules, is
the first cluster size to not evaporate. Taken together, these results suggest that the
identity of the stabilizing compound affects the evaporation rates of sulfuric acid clusters.
Furthermore, these observations demonstrate that nucleation rates are limited by the
formation of clusters that contain fewer than four sulfuric acid molecules. Since
nucleation rates are determined by the formation of such small clusters, the problem is
more tractable than would otherwise be the case.
I have focused my research on pinpointing specific stabilizing agents and
quantifying the relative extents to which they enhance nucleation. This is challenging for
two reasons:
1) Atmospheric nucleation involves reactions between gases that are present at
exceeding low concentrations. Creating an environment where sulfuric acid only
interacts with a specific stabilizing compound entails reducing the impurity levels
below 0.1 pptv.
2) Measuring vapors, clusters, and freshly formed particles (~1 nm in diameter) at
atmospherically relevant concentrations (≥1 ppqv) requires very sensitive
instrumentation. While an instrument for measuring sulfuric acid vapor
concentrations as low as 1 ppqv has been available since 1993 [Eisele and Tanner,
1993], methods to measure other trace compounds that might react with and stabilize
sulfuric acid clusters has only recently been developed [Hanson and Eisele, 2002;
Hanson et al., 2011].
7

The work presented in the following chapters uses an extraordinarily clean and
repeatable flow reactor to produce a constant source of sulfuric acid vapor. Various basic
gases were injected into the flow reactor and, depending on the experiment, given 3 or 40
s to react with sulfuric acid. The resulting cluster concentrations were measured using the
Cluster Chemical Ionization Mass Spectrometer (Cluster CIMS) [Titcombe, 2012; Zhao
et al., 2010], and particle number distributions were monitored using a Diethylene Glycol
Scanning Mobility Particle Sizer (DEG SMPS) [Jiang et al., 2011b]. Results from these
measurements provide solid experimental evidence that atmospheric nucleation can be
described by an acid-base chemical reaction model and use this framework to explore
possible compounds that could stabilize sulfuric acid clusters and enhance nucleation
rates to levels observed in the atmosphere.
1.3 Nanoparticle and Cluster Instrumentation
The DEG SMPS is capable of detecting particles down to ~1 nm in diameter
(geometric size) [Jiang et al., 2011b]. Neutral particles are first charged in a bipolar
charger (Po-210 alpha source) then size separated in a nano-mobility classifier. Classified
particles are then grown to detectable sizes via DEG and butanol condensation. However,
the DEG SMPS only provides size and concentration data with no clues on particle
composition. The concentration measurements of the DEG SMPS are also uncertain as
particle composition influences measurement to an extent that remains to be quantified
[Jiang et al., 2011b]. My research provides some insights into those uncertainties.
Atmospheric pressure chemical ionization mass spectrometers (CIMS) have very
recently been deployed to provide vapor and cluster information including cluster size,
composition, and concentration. These instruments include the Cluster CIMS [Titcombe,
2012; Zhao et al., 2010] and the Chemical Ionization Atmospheric Pressure Interface-
Time of Flight mass spectrometer (CI-APi-ToF) [Jokinen et al., 2012]. Both instruments
use a soft ionization technique known as chemical ionization (CI) to charge neutral
clusters at atmospheric pressure. Soft ionization reduces cluster fragmentation, and
atmospheric pressure ionization allows for greater sensitivity in measuring low
concentrations of neutral vapors and clusters [Gross, 2010]. Specifically, the University 8

of Minnesota Cluster CIMS is capable of measuring concentrations down to 105 cm-3
(~40 ppqv).
Chemical ionization can be conceptualized as an acid-base reaction. To produce
negative ions, the neutral cluster must have lower proton affinity (i.e., must be more
acidic) than the reagent ion. Traditionally, nitrate (NO3- with ligands) is used to charge
sulfuric acid vapor and its clusters. An example CI reaction of the sulfuric acid dimer is
given below.
( )2 4 3 3 2 4 4 32H SO X HNO NO H SO HSO X HNO− −• + • → • + + Reaction 3
X describes compounds that are attached to the sulfuric acid dimer but evaporate upon
chemical ionization or entering the vacuum region of the mass spectrometer. Since the
nitrate reagent ion (HNO3•NO3-) is a very weak conjugate base (low proton affinity), only
a few compounds are acidic enough to donate a proton to it; this limits the number of
compounds that nitrate CI is able to detect. In the atmosphere, sulfuric acid is one of the
few compounds that undergoes CI by nitrate ions. Therefore, using nitrate reduces
interferences from non-sulfuric acid signals relative to those that would occur if a more
basic reagent ion were used. For clusters that are more basic, we use protonated water
clusters (H3O+ with water ligands) to positively charge electrically neutral clusters.
The Cluster CIMS uses an electric field to draw the reagent ions (e.g. nitrate or
protonated water clusters) perpendicularly across the flow containing the neutral clusters.
The mobility of the reagent ion is known, so the time they have to react with neutral
clusters depends on their cross-flow velocity, which can be varied by adjusting the
electric field (i.e., the voltage across the inlet). The CI reaction time dictates the amounts
of ionized clusters formed (which translates to signal intensity) and controls the extent to
which ionized sulfuric acid vapors can combine with neutral vapors/clusters to form
charged clusters, a process known as ion-induced clustering (IIC) [Hanson and Eisele,
2002]. IIC leads to false ion counts for larger clusters and higher than predicted neutral
cluster concentrations. IIC can be suppressed by reducing the CI reaction time, however
9

this also decreases overall signal. My work examines the effects of IIC on the accuracy of
Cluster CIMS measurements.
IIC is just one source of uncertainty for the Cluster CIMS (and CI-APi-ToF).
Overall, the process of measuring clusters with these mass spectrometers remains poorly
understood. For example, chemically ionizing neutral clusters likely leads to changes in
cluster composition (see X in Reaction 3), with basic molecules evaporating from the
resulting ion cluster [Kurtén et al., 2011]. Furthermore, neutral clusters containing near
equal numbers of acid and base molecules may have too high of a proton affinity (too
basic) to be chemically ionized by nitrate. This would cause measured concentrations to
be less than true values. Thus, to better map out the acid-base chemical reactions, I
carried out experiments aimed at exploring these sources of uncertainty. This work has
led to a better understanding of cluster concentration and composition data obtained with
the Cluster CIMS.
1.4 Outline of Research
This dissertation addresses two key gaps in knowledge: the chemical reactions
behind atmospheric nucleation and the instruments used to measure freshly formed
clusters and particles. In Chapter 2, the Cluster CIMS was used to measure sulfuric acid
dimer concentrations in the presence of various atmospherically relevant basic
compounds. The measured concentrations present clear evidence that basic gases react
with sulfuric acid to form more stable sulfuric acid dimers and support the acid-base
chemical reaction model for atmospheric nucleation. The study also identifies which
basic gases stabilize sulfuric acid dimers and reduce evaporation rates the most. The
measured monomer and dimer concentrations were then used to fit cluster evaporation
rates from the acid-base reaction model and predict atmospheric nucleation rates from
measured precursor gas concentrations.
However, the acid-base reaction model developed in Chapter 2 and its fitted
evaporate rates rely on several assumptions for the larger clusters that likely affect
predicted nucleation rates. Unlike the sulfuric acid dimer, the larger clusters exhibit much 10

larger sources of uncertainty due to poor understanding of the chemical ionization and
ion-molecule interactions. To better understand and quantify these uncertainties, Chapter
3 develops a method to compare number concentrations of sulfuric acid+dimethylamine
clusters measured by two fundamentally different instruments in their overlapping size
range of 1 nm: Cluster CIMS and a DEG SMPS. The comparison indicates that nitrate
reagent ions are unable to chemically ionize clusters with near equal numbers of acid and
base molecules. Acetate chemical ionization with the Cluster CIMS measured more
clusters and led to significantly improved agreement with the number concentrations
measured by the DEG SMPS. Furthermore, the DEG SMPS measured higher than
predicted concentrations of particles in the pure sulfuric acid environment, suggesting
that 1 nm particles are being produced in the charger (via IIC).
After identifying possible uncertainties that may affect the 1 nm size range of the
DEG SMPS, this instrument was used to show that diamines, a previously unstudied
group of stabilizing compounds, react with sulfuric acid to produce more particles than
dimethylamine. Chapter 4 presents particle measurements that indicate diamines are more
effective at stabilizing sulfuric acid clusters and enhancing nucleation rates than
dimethylamine. The concentrations of putrescine and cadaverine, both naturally produced
diamines, were measured during atmospheric observations in rural Oklahoma. These
concentrations (10-100 pptv) were equal to or greater than dimethylamine concentrations
at this site, so diamines are likely to significantly contribute to atmospheric nucleation.
Chapter 5 builds upon the discoveries of the previous chapters by exploring the
chemistry behind cluster formation for monoamines and diamines based upon observed
concentrations of the larger clusters. To understand the observed trends, the acid-base
neutral cluster formation model from Chapter 2 is expanded to explicitly include
formation of larger clusters and is coupled to models that describe chemical ionization,
ion-induced clustering, and ion decomposition. Cluster observations and modeling help
identify particular ion cluster behavior in specific time scales. Results also illustrate the
challenges in using either nitrate or acetate chemical ionization to detect sulfuric acid
11

clusters. Future research into cluster chemistry must be done to better extract evaporation
rates from measured cluster concentrations. Chapter 6 summarizes the work presented
here and outlines potential projects to help answer questions raised in this dissertation.
12

Chapter 2. Stabilization of Sulfuric Acid Dimers by Ammonia,
Methylamine, Dimethylamine, and Trimethylaminea
2.1 Overview
This study experimentally explores how ammonia (NH3), methylamine (MA),
dimethylamine (DMA), and trimethylamine (TMA) affect the chemical formation
mechanisms of electrically neutral clusters that contain two sulfuric acid molecules
(dimers). Measurements were conducted using a glass flow reactor which contained a
steady flow of humidified nitrogen with sulfuric acid concentrations of 107 to 109 cm-3. A
known molar flow rate of a basic gas was injected into the flow reactor. The University
of Minnesota Cluster Chemical Ionization Mass Spectrometer (Cluster CIMS) was used
to measure the resulting sulfuric acid vapor and cluster concentrations. It was found that,
for a given concentration of sulfuric acid vapor, the dimer concentration increases with
increasing concentration of the basic gas, eventually reaching a plateau. The base
concentrations at which the dimer concentrations saturate suggest NH3< MA< TMA≲
DMA in forming stabilized sulfuric acid dimers. Two heuristic models for cluster
formation by acid-base reactions are developed to interpret the data. The models provide
ranges of evaporation rate constants that are consistent with observations, and leads to an
analytic expression for nucleation rates that is consistent with atmospheric observations.
2.2 Introduction
Atmospheric nucleation is a significant source of cloud condensation nuclei and
plays an important role in radiative forcing [IPCC, 2014]. Nucleation occurs when trace
gases such as sulfuric acid [Kulmala et al., 2004; Weber et al., 1996], various basic
compounds [Almeida et al., 2013; Chen et al., 2012; Hanson and Eisele, 2002; Zhao et
al., 2011], highly oxidized organics [Schobesberger et al., 2013], and water [Leopold,
a This chapter is reproduced with permission from Jen, C. N., McMurry, P. H., and Hanson, D. R.: Stabilization of sulfuric acid dimers by ammonia, methylamine, dimethylamine, and trimethylamine, Journal of Geophysical Research: Atmospheres, 119, 2014JD021592, 10.1002/2014JD021592, 2014.
13

2011] react to produce stabilized molecular clusters that subsequently grow by vapor
uptake.
Experimentalists and modelers have used multicomponent classical nucleation
theory (CNT) to conceptualize the nucleation process and predict nucleation rates based
upon calculated and observed concentrations of gaseous precursors [Seinfeld, 2006]. CNT
assumes that clusters at one size have identical compositions with thermodynamic
properties equal to those of equivalent bulk solutions. The nucleation rate is then the net
rate at which clusters pass through the “critical size” (i.e., the size that is in equilibrium
with the condensing vapors). In actuality, clusters containing a given number of sulfuric
acid molecules also likely include varying numbers of water, basic, and/or highly
oxidized organic molecules. The thermodynamic properties of such clusters are highly
sensitive to cluster compositions [Hanson and Lovejoy, 2006; Leverentz et al., 2013;
Ortega et al., 2012]; thus, cluster evaporation rates will depend on the cluster’s exact
makeup. Overall, CNT under predicts atmospheric boundary layer nucleation rates by
several orders of magnitude and does not capture the observed functional dependence on
sulfuric acid vapor concentration [Chen et al., 2012; Riipinen et al., 2007; Weber et al.,
1996]. An alternative approach to CNT is the use of chemical kinetics to explain the
formation and growth of nucleating clusters. Both computational chemistry [Dawson et
al., 2012; Olenius et al., 2013; Ortega et al., 2012] and empirical observations [Chen et
al., 2012] have been exploited to develop kinetics-based nucleation models.
Vehkamäki and coworkers have modeled atmospheric nucleation by using ab
initio calculations to compute free energies of sulfuric acid clusters (up to 4) with water
and base molecules. Their results have shown that adding ammonia [Kurtén et al., 2007],
dimethylamine, triemethylamine, or water lower the energies of pure sulfuric acid
clusters [Leverentz et al., 2013; Olenius et al., 2013; Paasonen et al., 2012]. These free
energies are converted to cluster evaporation rates by assuming the cluster is at
equilibrium [Ortega et al., 2012]. They are then able to predict nucleation rates for
specific acid-base systems from the calculated evaporation rates [McGrath et al., 2012].
14

Nucleation rates obtained from their ab initio results for several aminated sulfuric acid
clusters match those seen in field and laboratory measurements [Almeida et al., 2013;
Paasonen et al., 2012].
Our group has focused on the use of measured nucleated cluster concentrations to
infer cluster reaction rates. The Cluster Chemical Ionization Mass Spectrometer (Cluster
CIMS) measured concentrations of neutral sulfuric acid vapor and neutral clusters that
contain up to four sulfuric acid molecules [Eisele, 1983; Hanson and Eisele, 2002;
Hanson and Lovejoy, 2006; Zhao et al., 2010]. These size four clusters are ~1 nm in
geometric diameter or ~1.3 nm in mobility diameter [Larriba et al., 2011]. For particles
larger than this, we use the diethylene glycol scanning mobility particle spectrometer
(DEG SMPS) [Iida et al., 2009; Jiang et al., 2011c] in combination with more
conventional aerosol instrumentation [Woo et al., 2001] to measure the remaining portion
of the particle size distribution. Our observations from field and laboratory experiments
indicate that sulfuric acid evaporates to some extent from cluster containing two or three
sulfuric acid molecules. Sulfuric acid vapor is taken up at the collision rate for clusters
that contain four or more sulfuric acid molecules [Chen et al., 2012]. We have therefore
defined the nucleation rate as the formation rate of size four clusters [Chen et al., 2012],
although this size may depend on the concentrations of other nucleating gases. Based
upon these measurements, we have developed a simplified acid-base atmospheric
nucleation model. This model does not rely on the concept of a critical size that is in
equilibrium with the condensing vapors. Instead, cluster concentrations are governed by
rates of reactions between vapors and clusters. Evaporation from clusters that contain
one, two or three sulfuric acid molecules is the primary bottleneck to nucleation.
Chen et al. [2012] assumed that all basic gases enhance nucleation to the same
extent, but pointed out that this requires further investigation. In this paper, we describe
an experimental study on the effects of various basic gases on the formation of sulfuric
acid dimers, one of the major bottlenecks to nucleation in the atmosphere. Our aim was to
shed light on chemical processes that may have contributed to the scatter in dimer
15

concentrations shown in Fig. 2a of Chen et al. [2012]. The greatest experimental
challenge for such investigations is the extraordinary cleanliness required to isolate and
study particular chemical systems. This study utilizes a previously characterized glass
flow reactor at Augsburg College [Panta et al., 2012; Zollner et al., 2012]. This flow
reactor has been continuously purged over a period of two years with about two million
liters of nitrogen from the head space of a liquid nitrogen tank; a portion of this flow
carries sulfuric acid vapor which coats all the surfaces within the reactor. The flow
reactor exhibits high repeatability between experiments. Measurements were carried out
using four basic compounds: ammonia (NH3), methylamine (MA), dimethylamine
(DMA), and trimethylamine (TMA). This work provides new information on the effects
of diverse bases, such as MA and TMA, on dimer concentrations and adds to prior work
on the effects of NH3 and DMA on nucleation rates [Almeida et al., 2013; Benson et al.,
2009; Erupe et al., 2011; Hanson and Eisele, 2002; Kirkby et al., 2011]. The University
of Minnesota Cluster CIMS (MCC) [Titcombe, 2012; Zhao et al., 2010] and diethylene
glycol scanning mobility particle spectrometer (DEG SMPS) [Iida et al., 2009] measured
the resulting neutral cluster and particle concentrations.
2.3 Data and Methodology
Figure 1 shows a schematic of the flow reactor and the locations of the base
injection and MCC sampling. The internal flow reactor temperature was maintained at
295-305 K with relative humidity of ~30%. The sulfuric acid concentration inside the
reactor was varied by adjusting the clean nitrogen flow over a temperature-controlled
sulfuric acid reservoir. The sulfuric acid concentration in the flow reactor ranged from
107 to 109 cm-3. Since the flow reactor is coated with thin layers of sulfuric acid, the
evaporation of sulfuric acid from the reactor walls precluded measurements at sulfuric
acid concentrations lower than this. Gaseous NH3, MA, DMA, and TMA from
permeation tubes were separately injected perpendicularly into the flow reactor. The
injected base (shown in red) mixed into the sulfuric acid-containing flow along the
centerline of the reactor. At the point of injection, the centerline base concentration was
~10 times greater than at the MCC sampling point [Freshour et al., 2014]. A well-mixed 16

concentration, called no loss dilution concentration (NLD), of basic gas was determined a
priori [Zollner et al., 2012] from the permeation rate and dilution ratios, assuming no
losses to the walls. The MCC in positive ion mode measured the base concentration and
is within 20% of NLD (see SI). The reaction time for the majority of the gas was ~3 sec,
determined from flow profiles via computational fluid dynamic simulations [Freshour et
al., 2014]. The total reactor and base injection flows were kept constant, providing a
consistent flow field and high repeatability between experiments.
Po-210
Inlet
To MCC
Sulfuric Acid ~107 to 109 #/cc
Base Injection
Flow Reactor 4 LPM
Base Mixing Dilution
~3 sec Residence Time
HNO3• NO3- +(H2SO4)2•X →
HSO4-•H2SO4+X+2 HNO3
Figure 1 Schematic of the flow reactor including the location of the MCC sampling region. The flow in the reactor is laminar, leading to a reaction time of ~ 3 sec. The base concentration decreases about 10 times due to diffusion mixing (indicated by the red dashed line) by the MCC sampling location. The chemical ionization of the dimer (195 m/z) is shown explicitly with the unknown compound(s) X evaporating from the cluster upon ionization.
The MCC was connected in-line with the flow reactor via a glass manifold
followed by a stainless steel sampling tube. This design minimized flow restrictions and
allowed the shielded, Po-210 holder to sit inside the reactor flow (see Figure 1). Dilute
nitric acid was passed over the radioactive source to produce the nitrate ion (with ligands,
(HNO3)1-4•NO3-) which was used to detect sulfuric acid monomer and dimers [Eisele and
Hanson, 2000; Hanson and Lovejoy, 2006; Titcombe, 2012; Zhao et al., 2010]. The
transport time of the reagent ion across the sampling tube was estimated to be 20 msec,
determined from the spacing and electric field in the sampling region and the mobility of
17
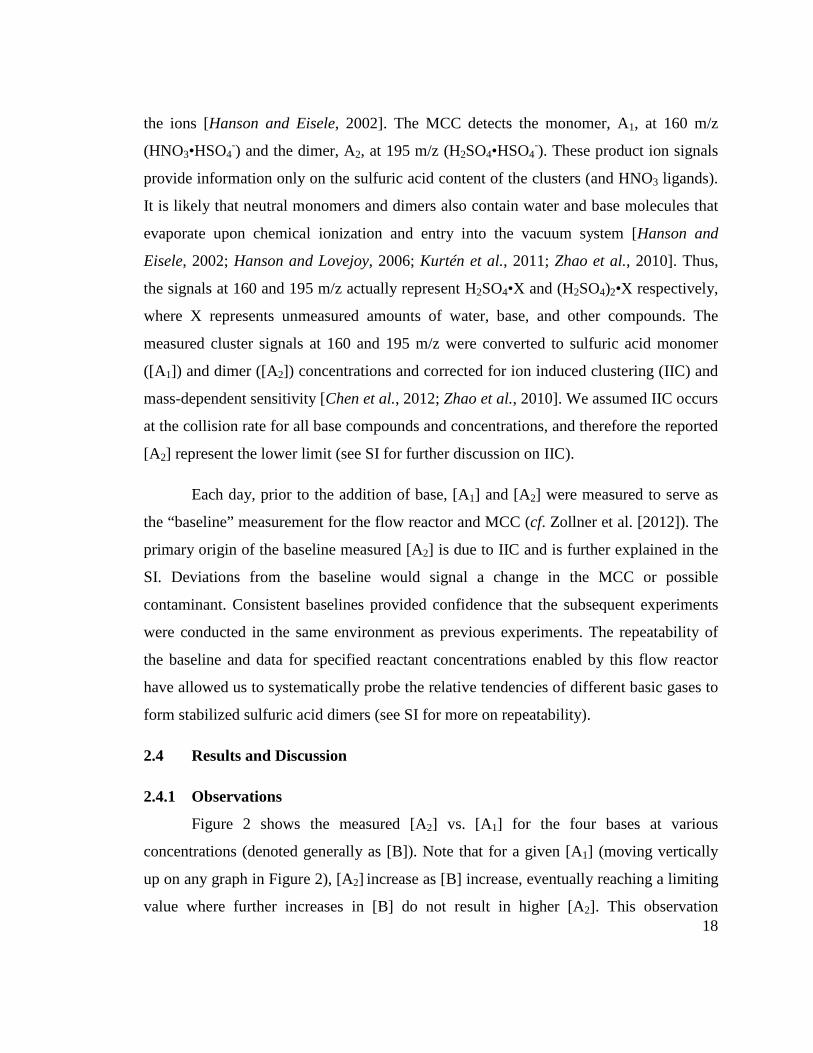
the ions [Hanson and Eisele, 2002]. The MCC detects the monomer, A1, at 160 m/z
(HNO3•HSO4-) and the dimer, A2, at 195 m/z (H2SO4•HSO4
-). These product ion signals
provide information only on the sulfuric acid content of the clusters (and HNO3 ligands).
It is likely that neutral monomers and dimers also contain water and base molecules that
evaporate upon chemical ionization and entry into the vacuum system [Hanson and
Eisele, 2002; Hanson and Lovejoy, 2006; Kurtén et al., 2011; Zhao et al., 2010]. Thus,
the signals at 160 and 195 m/z actually represent H2SO4•X and (H2SO4)2•X respectively,
where X represents unmeasured amounts of water, base, and other compounds. The
measured cluster signals at 160 and 195 m/z were converted to sulfuric acid monomer
([A1]) and dimer ([A2]) concentrations and corrected for ion induced clustering (IIC) and
mass-dependent sensitivity [Chen et al., 2012; Zhao et al., 2010]. We assumed IIC occurs
at the collision rate for all base compounds and concentrations, and therefore the reported
[A2] represent the lower limit (see SI for further discussion on IIC).
Each day, prior to the addition of base, [A1] and [A2] were measured to serve as
the “baseline” measurement for the flow reactor and MCC (cf. Zollner et al. [2012]). The
primary origin of the baseline measured [A2] is due to IIC and is further explained in the
SI. Deviations from the baseline would signal a change in the MCC or possible
contaminant. Consistent baselines provided confidence that the subsequent experiments
were conducted in the same environment as previous experiments. The repeatability of
the baseline and data for specified reactant concentrations enabled by this flow reactor
have allowed us to systematically probe the relative tendencies of different basic gases to
form stabilized sulfuric acid dimers (see SI for more on repeatability).
2.4 Results and Discussion
2.4.1 Observations
Figure 2 shows the measured [A2] vs. [A1] for the four bases at various
concentrations (denoted generally as [B]). Note that for a given [A1] (moving vertically
up on any graph in Figure 2), [A2] increase as [B] increase, eventually reaching a limiting
value where further increases in [B] do not result in higher [A2]. This observation 18

suggests two key points. Consider first in the pure sulfuric system where dimer formation
occurs by collisions of A1 and evaporation from A3; dimers are removed by sulfuric acid
evaporation, growth to larger cluster sizes, collisions with larger particles, and deposition
on the reactor walls. None of these processes depend on [B]. The fact that measured [A2]
increases with [B] implies that the basic gases must assist in the formation of the dimer.
Furthermore, [B] at which the [A2] reaches saturation differs from base-to-base. For NH3,
this saturation concentration occurs between 1800-2300 pptv, MA at 80-180 pptv, TMA
at 30 pptv, and DMA at 20 pptv. To obtain a measured [A2] of ~108 cm-3 at [A1] of ~109
cm-3, 100 times more NH3 or 2-4 times more MA than DMA or TMA are needed. From
the observations alone, we conclude that the rate limiting step in stabilizing A2 must be a
reaction with a base with an effectiveness increasing from NH3< MA< TMA≲DMA.
Figure 2 Measured [A2] vs. [A1] for the four bases at various concentrations. (a) Ammonia, NH3; (b) Methylamine, MA; (c) Dimethylamine, DMA; and (d) Trimethylamine, TMA
TMA shows a different pattern than the other bases where the range of [A2] at a
given [A1] is constricted with perhaps [A2] decreasing with [TMA] beyond the saturation
[TMA]. This could be due to the tertiary nature of TMA: no subsequent hydrogen bonds
104
105
106
107
108
109
[A2] (
cm-3
)
NH3= 100 pptv (2e9 cm-3)
300 (7e9)1100 (3e10)1800 (4e10)2300 (6e10)3500 (8e10)6000 (1e11)
MA= 10 pptv (2e8 cm-3)20 (5e8)70 (2e9)80 (2e9)180 (4e9)220 (5e9)260 (6e9)
106 107 108 109104
105
106
107
108
[A1]=[H2SO4] (cm-3)
[A2] (
cm-3
)
DMA= 2 pptv (5e7 cm-3)3 (8e7)6 (1e8)20 (5e8)60 (1e9)100 (3e9)200 (5e9)
106 107 108 109 1010
[A1]=[H2SO4] (cm-3)
TMA= 4 pptv (1e8 cm-3)12 (3e8)30 (7e8)54 (1e9)95 (2e9)140 (3e9)300 (7e9)
(b) MA
(d) TMA(c) DMA
(a) NH3
19

are available after it reacts with a sulfuric acid molecule. This would limit further
clustering with the (sulfuric acid • TMA) adduct, and lower [A2] if the adduct is a large
fraction of the A1 population. Steric hindrance by the methyl groups might also block A1
clustering in the formation of the A2. These steric effects are not present for NH3, MA,
and DMA (amines with 0 to 2 methyl groups). At [A1]=2x108 cm-3, [A2] with DMA is
higher than [A2] with TMA. However at [A1]=2x109 cm-3, this trend reverses. The
presence of TMA in the monomers and dimers may prevent clusters from coagulating.
Then at high [A1]/[TMA], more sulfuric acid molecules are free of TMA and numerous
sulfuric acid collisions would overcome TMA’s hindering effect.
The measurements in Figure 2 also show that [A2] tend to increase with [A1]. For
low [A1], saturation curves for all bases indicate that [A2] goes as [A1]2. This signifies
that at high [B], the formation of A2 is limited by A1 collisions. At high [A1], the
saturation curves exhibit a downturn of [A2] from this squared relationship. As shown in
the modeling results below, this can be explained by the depletion of A2 by collisions
with itself. It is also possible that the clusters with high base content cannot undergo
efficient chemical ionization by the nitrate ion. The downturn is more pronounced for
NH3, DMA, and TMA than MA but this may be due to smaller [A1] range for MA.
Greater insight into the slope and the shape of the saturation curves requires detailed
modeling (see below).
Figure 3 compares the DMA dimer data from this study (without IIC correction
for equal comparison) to those reported by CLOUD [Almeida et al., 2013] and from a
flow reactor [Petäjä et al., 2011]. The blue squares are the baseline measurements from
Petäjä et al. [2011], i.e. those without added base and at a residence time of 32 sec. Their
results can be directly compared to our baseline measurement at 40 sec, given as a dashed
black line in Figure 3. This residence time is determined from the point of sulfuric acid
injection into the flow reactor [Zollner et al., 2012] and is different from the 3 sec
reaction time where the base is injected (see Figure 1). The solid black curve is the steady
state collision-controlled limit (no cluster evaporation and no base reaction, but with
20

coagulation and wall losses for the Augsburg flow reactor). The blue squares closely
follow the collision-controlled limit. This provides further evidence, as suggested by
Almeida et al. [2013], that the flow reactor used in Petäjä et al. [2011] had high levels of
a stabilizing compound(s). Figure 3 also depicts the DMA stabilized [A2] data from
Almeida et al. [2013] ([DMA]=3-100 pptv) as green triangles. The range of [A1] in
Almeida et al. [2013] is lower than our work but extrapolating the measured [A2]
reported in Almeida et al. [2013] shows that their [A2] is slightly higher for a given [A1]
than were seen in this study. This could be due to a lower temperature in their chamber
(278 K compared to ~300 K here) or differences in reaction times between the Augsburg
flow reactor (~3 sec) and the CLOUD chamber. Also, IIC remains a poorly understood
process and varies between the MCC and their CIMS. The reported [DMA] in Almeida et
al. [2013] indicate that [A2] saturates at a [DMA] between 3-5 pptv, below the value
shown here of 20 pptv. It may be possible that NH3, which was also present in the
CLOUD chamber at 10 pptv, led to an increase in [A2] for a specific [DMA].
Figure 3 Comparison between the DMA data shown in this study and those given in Almeida et al. [2013]. [A2] from this study are shown as red points and are not corrected for IIC (actual concentrations will be ~1-100% lower, depending on [A1]). The green triangles correspond to the DMA experiments (range 3-100 pptv) from CLOUD. The blue squares are the baseline measurements from Petäjä et al. [2011] at a residence time of 32 sec. The dashed black line is the baseline measurements from this study at a residence time of ~40 sec. The solid black cure is the collision-controlled limit where evaporation is negligible and clusters do not react with the base.
21

We have developed two heuristic models to describe the data in Figure 2. The
first scheme is based upon the acid-base reaction model proposed in Chen et al. [2012].
Based on observations, Chen et al. argued that A2 (i.e., the signal measured at 195 m/z)
contains two flavors of dimer: more volatile (A2MV) and less volatile (A2LV). This model
assumes that A1 collides with A1 to form A2MV. This more volatile dimer either
evaporates with a rate constant of E2MV or reacts with a base to form A2LV. A2LV collides
with A1 to form A3, which then can grow to A4. This is pictorially explained in Figure 4
on the left hand side. This original acid-base model was modified in two ways to better
describe the data presented here. Chen et al. used the Fuch’s surface area from the
particle distribution (1-10 nm) to approximate monomer loss (κ) to all larger
particles/clusters including dimers. This was adequate for that study since the measured
[A2] never exceeded 10% of [A1]. However in these flow reactor experiments, the
measured [A2] approaches 50% of the measured [A1]. Thus, a significant loss of A2 will
be to dimer-dimer coagulation. Furthermore, the model was modified to include a base
evaporation from A2LV, termed E2BLV. Including this term gives the model flexibility to
describe [A2] behavior for a wide range of [B] (1-6000 pptv). The modifications to the
model are shown in red on Figure 4.
As the MCC measures all dimer types at one mass (195 m/z), [A2] is assumed to
be composed of both A2MV and A2LV, thus the modeled [A2] is the sum of both. Cluster
loss to larger particles, κ, was calculated from DEG SMPS measured size distribution at
various [A1] and [B] (see SI). The wall loss rate, η, was estimated based on the diffusion
coefficient of sulfuric acid [Hanson et al., 1992; Murphy and Fahey, 1987; Pöschl et al.,
1998]. The forward rate constants were taken to be the collision rate. See SI for the
explicit rate equations.
The second scheme begins with A1 reacting with B to form an A1B which
dissociates at a rate constant E1. Since A1 may already contain water and some base
molecules, the notation A1B represents a monomer that is more neutralized than A1.We
assume A1 and A1B can be detected efficiently by MCC at 160 m/z. A2 is formed from
22

A1B by the addition of either A1 or A1B and does not evaporate. The lack of dimer
evaporation is supported by ab initio calculations of various aminated dimers [Ortega et
al., 2012]. A3 is formed in a similar manner but evaporates at E3 as in scheme 1 and in
our previous work [Chen et al., 2012]. Trimer evaporation rate constant was included to
test for its effect on modeled [A2] and [A1]. All cluster sizes are lost to the wall at η and
to larger particles at κ. Scheme 2 is depicted on the right of Figure 4, and the explicit rate
equations are given in the SI.
We used two solutions of the differential equations that describe these schemes to
interpret the data. The first approach assumes that cluster concentrations at the MCC
sampling point have achieved steady state and depend only on measured [A1] and [B].
This would be valid if characteristic lifetimes of the clusters are short relative to the 3 sec
time available for acid-base reactions (Figure 1). The second approach involves a
transient solution at 3 sec which defines the time dependencies for the chemical reactions
illustrated in Figure 4. This accounts for changes in [B] as it mixes with the carrier gas
and depletion of both [A1] and [B] as they are lost by reactions or to the walls.
Monomer
Dimer
Trimer
Tetramer
κ
η
Pre-exisiting particles
Wall
Scheme 1 Scheme 2
A1
A3
A4
A2
k21
k31
E3
A1Bk11'
E1
k11
k22
A1
A3
A4
A2MV A2LV
k11 E2MV
k21'
E2BLV
k21
k31
k22
E3
Figure 4 Two conceptual acid-base reaction schemes where moving downwards is a monomer (both A1 and A1B for scheme 2) addition and moving to the right is a base addition. Modifications to the acid-base reaction model proposed in Chen et al. [2012] are shown in red. κ and η apply to both schemes.
23

2.4.2 Scheme 1, Steady State Model
We assume that [B]=NLD and the measured [A1] are at steady state with all
clusters. In addition, since it was found that trimer evaporation contributes negligibly to
[A2], E3 was set to 0 s-1. This leaves two fitting parameters: E2MV and E2BLV. E2MV allows
for evaporation of A1 from A2. Including this in the model allows [A2] to be at or below
collision-controlled values, as is observed (see SI). Allowing for the transformation of
more volatile to less volatile dimer by reaction with the basic gas helps to explain the
observed dependence of [A2] on [B] (recall, observed [A2] includes both more and less
volatile dimer). We found that for the stronger bases (DMA and TMA), the data could be
reasonably explained using only one parameter: E2MV. However, for the weaker bases
(NH3 and MA) it was also necessary to allow for the evaporation of base from A2LV at the
rate E2BLV. Figure 5 compares the steady state model predictions (lines) with the
observations for the four basic gases. The evaporation rate constants that best fit the
model for the full [B] range of the data are shown inside each plot. Fitting to both high
and low [B] produces an estimated range for each evaporation rate constant (see Table 2).
Figure 5 Scheme 1 solved at steady state (lines) is compared to the measured [A2] and [A1] (points). Colors for the lines correspond to the same [B] as the points, and fitted evaporation rate constants are given inside each base graph. (a) NH3, (b) MA, (c) DMA, and (d) TMA
24

The steady state model captures several key trends of the data. First, the model
predicts [A2] will reach saturation when [B] is sufficiently high, though not always at the
same [B] as was experimentally observed. The model also captures [A2]’s general
dependence on [B], even at high [NH3] (see SI for [A2] vs. [B] at constant [A1] plots).
The model also predicts the downturn of [A2] at high [A1], though to a lesser extent than
is seen in the data. This trend is due primarily to dimer-dimer and particle coagulation
losses.
For DMA and TMA, scheme 1 steady state model over-predicts [A2] at high [B]
and does not predict the squared dependence of [A2] on [A1] for the saturation curve. [A2]
over-prediction may be due to a fault in the steady state assumption. We see from the
fitted E2MV that the lifetime of the more stable A2MV is quite long (~1 sec). This is on the
order of the reaction time of the flow reactor which raises questions regarding the
suitability of a steady state model.
2.4.3 Scheme 2, Steady State Model
The dependence of [A2] on [B] can also be described by a reaction of A1 with B.
Therefore, we modeled scheme 2 at steady state by assuming [B] = NLD. However, as
this reaction model posits two types of monomers, we assume that measured 160 m/z =
[A1]+[A1B]. We also assume the reaction of A1 with B is at equilibrium. Unlike scheme
1, E3 was found to play a significant role in modeling [A2], thus we use E3=0.4 s-1 from
Chen et al. [2012] as [A3] data from the MCC requires a better understanding of IIC (see
SI).
Figure 6 shows the steady state solution of scheme 2 compared to measured [A2]
vs. [A1]. This reaction model better describes the behavior at high [A1] but under-predicts
[A2] at high [A1] except for NH3. This could be due to an over-estimation of κ. This
model also reasonably predicts the saturation [B] and the squared dependence of [A2] on
[A1]. However, this model and solution method over-predicts [A2] at high [B] for the
lower bound of E1. We suspect this is due to the short reaction time preventing [A1] and
[B] from reaching equilibrium. Table 2 summarizes the fitted evaporation rate constants
25

for the two schemes solved at steady state. Both schemes demonstrate that NH3< MA<
TMA≲ DMA in facilitating the formation of stabilized dimers.
Table 2 Summary of the saturation [B] and the fitted evaporation rates constants for both schemes at steady state. Note for scheme 1, E3=0 s-1 and for scheme 2, E3=0.4 s-1 from Chen
et al. [2012].
Observations
Steady State Scheme 1
Steady State Scheme 2
Base Name
Saturation [B] (pptv)
Approximate Slope
E2MV (s-1) E2BLV (s-1) E1 (s-1)
NH3 1800-2300 2 20-60 0.5-0.75 500-2500 MA 80-180 2 8-15 0.03-0.1 30-60
DMA 20 2 1-5 0 1-7 TMA 30 2 4-10 0 5-30
Figure 6 Scheme 2 solved at steady state (lines) is compared to the measured [A2] and [A1] (points). Fitted evaporation rate constants are given inside each base graph. (a) NH3, (b) MA, (c) DMA, and (d) TMA
104
105
106
107
108
109
[A2] (
cm-3
)
NH3= 100 pptv (2e9 cm-3)
300 (7e9)1100 (3e10)1800 (4e10)2300 (6e10)3500 (8e10)6000 (1e11)
MA= 10 pptv (2e8 cm-3)20 (5e8)70 (2e9)80 (2e9)180 (4e9)220 (5e9)260 (6e9)
106 107 108 109104
105
106
107
108
[A1]=[H2SO4] (cm-3)
[A2] (
cm-3
)
DMA= 2 pptv (5e7 cm-3)3 (8e7)6 (1e8)20 (5e8)60 (1e9)100 (3e9)200 (5e9)
106 107 108 109 1010
[A1]=[H2SO4] (cm-3)
TMA= 4 pptv (1e8 cm-3)12 (3e8)30 (7e8)54 (1e9)95 (2e9)140 (3e9)300 (7e9)
(a) E1= 500, E3= 0.4 s-1 (b) E1= 40, E3= 0.4 s-1
(c) E1= 1, E3= 0.4 s-1 (d) E1= 5, E3 =0.4 s-1
26

2.4.4 Scheme 1, Transient Model
When dimer lifetimes are comparable to transport times through the reactor,
cluster concentrations will not be at steady state. (This does not preclude the use of the
steady state model for describing atmospheric dynamics as those processes occur over
timescales of minutes to an hour.) Therefore, we solved the rate equations for species and
processes shown in scheme 1 of Figure 4 to more accurately simulate processes that
occur during the 3 sec reaction time. This transient model takes into account the dilution
of [B] following injection (see Figure 1) as a function of time as well as its reaction with
and evaporation from clusters. The base is injected at a concentration ~10 times higher
than NLD. Centerline [B] at sampling point is about equal to NLD, confirmed by MCC
measurements (see SI) and computational fluid dynamic simulations [Freshour et al.,
2014]. The dilution and wall loss of [B] can be approximated as an overall first-order loss
rate, µ. The transient model also describes the presence of high concentrations of low
volatility clusters that might be formed where [B] are highest. This may then lead to the
formation of larger particles (>1 nm) and implies that κ is time dependent. For more
discussion on this and solution method, see SI.
Figure 7 compares observations with transient model predictions (solid lines) for
[A2] vs [A1]. The captions inside the graph indicate the fitted evaporation rate constants
with their ranges in Table 2. The transient model shown in Figure 7 accounts for η but
not κ (see SI). The ranges of fitted evaporation rate constants increase for all bases when
compared to the steady state values, with the largest gain for ammonia. The increase in
evaporation rate constants is primarily due to high [B] at times shortly after 0 sec. This
creates many dimers, leading to significantly higher values of predicted [A2]. A higher
E2MV is required to lower the predicted [A2]. Regardless, the trend NH3< MA<
TMA≲DMA in helping the formation of stabilized dimers is also seen here, but with
perhaps a larger distinction of TMA<DMA.
27

Figure 7 Comparison between transient scheme 1 (lines) to measured [A2] vs [A1] at different [B]. The fitted evaporation rates are shown inside the graphs. (a) NH3, (b) MA, (c) DMA, and (d) TMA
The transient model also captures the saturation curve and the squared
dependence of [A2] on [A1]. This solution method also better describes the behavior of
the [A2] at high [B]. Furthermore, the fitted overall loss rates μ between the four bases are
approximately equal. This is consistent with expectations as wall loss and dilution mixing
is regulated by fluid transport and depends weakly on the molecular makeup of the base.
Table 3 Fitted evaporation rate constants from the transient solutions. Note for scheme 1, E3=0 s-1 and for scheme 2, E3=0.4 s-1 from Chen et al. [2012].
Transient Scheme 1 Transient Scheme 2
Base E2MV (s-1) E2BLV (s-1) μ (s-1) E1 (s-1) E3 (s-1) μ (s-1)
NH3 200-300 0.2-0.5 0.92 400-700 0.4 0.9
MA 15-30 0 0.92 20-40 0.4 0.9
DMA 2-3 0 0.87 0-1 0.4 0.70
TMA 10-15 0 0.90 5-15 0.4 0.75
28

2.4.5 Scheme 2, Transient Model
The transient solution for scheme 2 follows that given for scheme 1 (see above)
with E3=0.4 s-1 taken from Chen et al. [2012]. Figure 8 shows the comparison between
transient solution of scheme 2 to the observed [A2] vs. [A1]. This model better captures
the downturn of [A2] at high [A1] than scheme 1, especially for [DMA] at 6 pptv and
lower. Furthermore, this scheme is able to describe the range of [A2] for both small and
large ranges of [B], with TMA as the exception. It is possible that steric hindrance
minimizes [A2] dependence on [TMA] and is not captured in this model. Scheme 2 also
predicts slightly lower [A2] for low [B] than is observed for NH3 and TMA. It also
predicts [A2] saturation at similar [B] as is observed. The ranges of E1 values are given in
Table 2. It should be noted that unlike scheme 1, this model is sensitive to the value of
E3. Future studies that explore E3 could possibly alter these fitted E1. Nonetheless,
scheme 2 also supports the conclusion that NH3< MA< TMA≲DMA in affecting the
formation of stabilized dimers.
Both schemes 1 and 2 are equally valid based upon our data. Computational
chemistry simulations of sulfuric acid with DMA or NH3 suggest that scheme 2 is more
likely as calculated sulfuric acid evaporation rates of A2 containing NH3 or DMA are
much lower than A1 with the same number of base molecules [Ortega et al., 2012;
Paasonen et al., 2012]. Comparing evaporation rates of certain species for specific
clusters (Table 3) further indicates that scheme 2 is more likely. The reactions listed are
from Ortega et al. [2012] with evaporation rates that most closely match those found in
this study. As seen in Table 3, E2MV values do not fall near the computed sulfuric acid
evaporation rate constants of Ortega et al. [2012] for most likely dimer compositions.
However, E1 are close to/within the computed range of base evaporation from the
monomers. Our rate constants fall within a narrower range than those of Ortega et al.
[2012], but our rate constants represent a weighted average over cluster sizes that contain
varying number of base molecules where the average is dominated by the most stabilized
and abundant cluster composition. The ab initio calculations are for specific cluster
29

compositions with 1-4 DMA or 1-4 NH3 molecules. In addition, our empirical
evaporation rate constants can be influenced by water molecules in the clusters which are
not taken into account in the simulations. Table 4 Comparison of empirical evaporation rate constants from this study to those from
Ortega et al. [2012]
Scheme 1 This Study Ortega et al. (2012)
A2•NH3 →A1•NH3+A1 E2MV=20 to 300 s-1 10-2 s-1 A2•(NH3)→
A2+ NH3 E2LV=0.2 to 0.75 10-2 s-1
A2•DMA →A1•DMA+A1
E2MV=1 to 2 s-1 10-5 s-1
Scheme 2 A1•NH3→A1+ NH3 E1=400 to 2500 s-1 104 s-1
A1•DMA→A1+ DMA E1=0 to 7 s-1 10-2 s-1
Figure 8 Comparison between transient solution of scheme 2 (lines) to measured [A2] vs [A1] at different [B]. The fitted evaporation rates are shown inside the graphs. (a) NH3, (b) MA, (c) DMA, and (d) TMA
104
105
106
107
108
109
[A2] (
cm-3
)
NH3= 100 pptv (2e9 cm-3)
300 (7e9)1100 (3e10)1800 (4e10)2300 (6e10)3500 (8e10)6000 (1e11)
MA= 10 pptv (2e8 cm-3)20 (5e8)70 (2e9)80 (2e9)180 (4e9)220 (5e9)260 (6e9)
106 107 108 109104
105
106
107
108
[A1]=[H2SO4] (cm-3)
[A2] (
cm-3
)
DMA= 2 pptv (5e7 cm-3)3 (8e7)6 (1e8)20 (5e8)60 (1e9)100 (3e9)200 (5e9)
106 107 108 109 1010
[A1]=[H2SO4] (cm-3)
TMA= 4 pptv (1e8 cm-3)12 (3e8)30 (7e8)54 (1e9)95 (2e9)140 (3e9)300 (7e9)
(b) E1= 25, E3= 0.4 s-1
(c) E1= 0.1, E3= 0.4 s-1 (d) E1= 10, E3= 0.4 s-1
(a) E1= 700, E3= 0.4 s-1
30

The transient models should more accurately describe processes that occur in the
reactor than the steady state model. Therefore, we believe the evaporation rate constants
obtained from the transient models should more accurately illustrate the differences
between the bases in the production of stabilized dimers. However, it is difficult to
quantify uncertainties in these evaporation rates. The transient models undoubtedly
oversimplify both the fluid dynamics and chemical reactions taking place in the flow
reactor. Furthermore, we assume that chemical ionization by nitrate ions allows the MCC
to detect all compositions of sulfuric acid clusters. We are confident that the sulfuric acid
clusters are not losing acid molecules [Chen et al., 2012; Eisele and Hanson, 2000; Zhao
et al., 2010], but it is possible some clusters of the form A1BN or A2BN, where N is the
number of attached bases, are highly neutralized. These clusters may have lower proton
affinities and might not react with the nitrate ion. If so, these clusters would not be
efficiently detected, leading to an underestimation on the stabilizing effect of B on A2.
The evaporation rate constants from both solution methods and schemes differ
from those previously reported by our group's closely related paper [Chen et al., 2012].
That study involved the analysis of ambient data and Teflon chamber measurements
involving the SO2 photooxidation in the presence of DMA. We inferred evaporation rate
constants of E2MV=400 s-1 (from the chamber study) and E3=0.4 s-1 (from the ambient
data). Using these evaporation rates, predicted nucleation rates were found to be in
reasonable agreement with measured rates in Mexico City and Atlanta, assuming that all
basic gases (NH3 plus all measured amines) are equally effective at stabilizing the
clusters (i.e., form clusters with equal values of E2MV and E3). The value of the
evaporation rate constant found in this study for DMA (E2MV=2 s-1 or E1=0.1 s-1) is below
the value reported in the previous study (E2MV range 100 to 1000 s-1). The flow reactor
experiments described in this paper are more repeatable and less prone to contamination
than the chamber study described by Chen et al. [2012] and this could explain the
differences. Overall, these flow reactor experiments show unambiguously that different
bases stabilize clusters to different extents, and that this must be accounted for in
nucleation models. 31

2.5 Atmospheric Implications
The ultimate goal of our work is to predict nucleation rates from the concentration
of precursor gases with an accuracy that is adequate for atmospheric modeling. Based
upon our measurements and guided by computation chemistry results, we used scheme 2
at steady state to formulate a nucleation rate or the formation rate of the tetramer, J4.
Solving scheme 2 at steady state produces
[ ]24 1
1' 2 totJ P k A= •
Equation 4
where [A1tot] is the total concentration of monomers detected at 160 m/z. P’ is a prefactor
that is defined as
[ ]
[ ] [ ] [ ]
31 2
3 3 3 3
223 1
1 23 3 3 3
1 1
1 1 42
tot
tot
EP k AE E
E E kk A k ABE E B
k ηk η k η
k ηk η k η
= − − + + + + + +
+ − + + + + + + + +
Equation 5
[AB] is a fraction of [A1tot] and equals
[ ] [ ][ ] [ ]1
1tot
k BAB A
E k B=
+ Equation 6
This analytical expression for nucleation rate is analogous to Equation 2 of Chen et al.
[2012], albeit for scheme 2 rather than scheme 1. The prefactor P’ is always less than 1.
Equation 4 signifies that the nucleation rate is some fraction of the A1-A1 collision rate.
Figure 9 compares atmospheric nucleation rates from a variety of field campaigns
with values calculated using Equation 4. The evaporation rate constants E1 and E3 used
for these calculations are tabulated with Figure 9. The value of E3 is based on Chen et al.
[2012], and E1 values were obtained from the transient model of scheme 2 (Table 2),
32
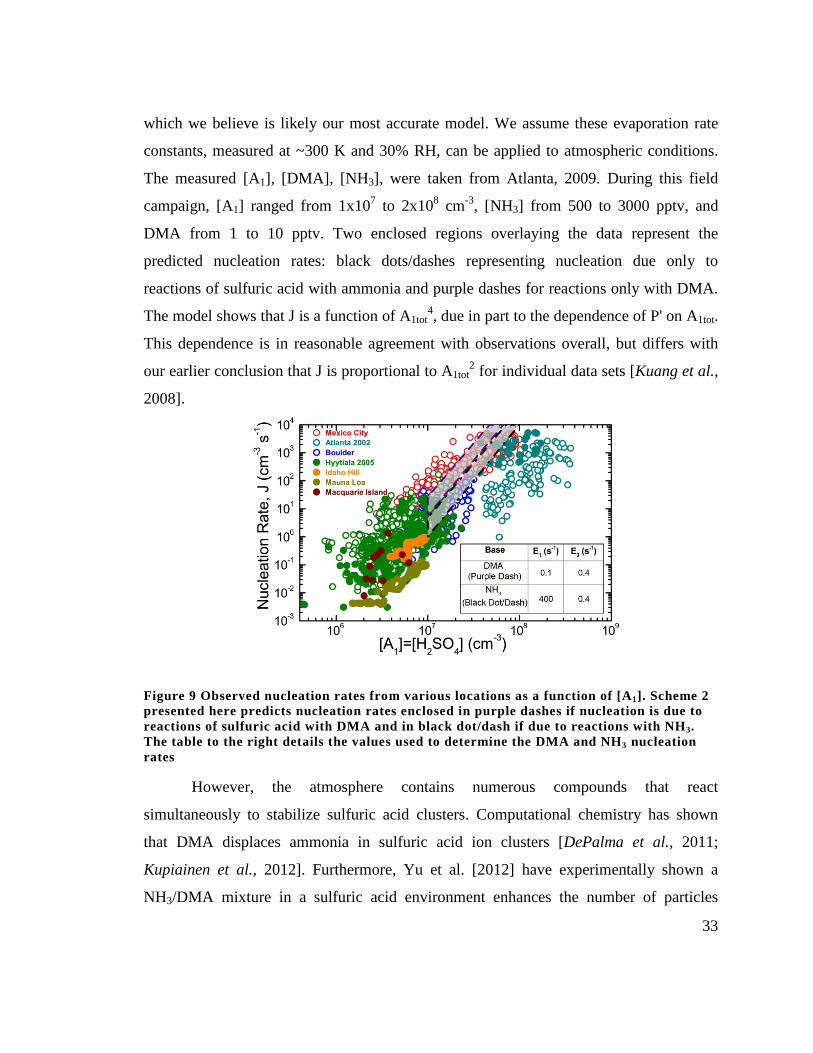
which we believe is likely our most accurate model. We assume these evaporation rate
constants, measured at ~300 K and 30% RH, can be applied to atmospheric conditions.
The measured [A1], [DMA], [NH3], were taken from Atlanta, 2009. During this field
campaign, [A1] ranged from 1x10⁷ to 2x108 cm-3, [NH3] from 500 to 3000 pptv, and
DMA from 1 to 10 pptv. Two enclosed regions overlaying the data represent the
predicted nucleation rates: black dots/dashes representing nucleation due only to
reactions of sulfuric acid with ammonia and purple dashes for reactions only with DMA.
The model shows that J is a function of A1tot4, due in part to the dependence of P' on A1tot.
This dependence is in reasonable agreement with observations overall, but differs with
our earlier conclusion that J is proportional to A1tot2 for individual data sets [Kuang et al.,
2008].
Figure 9 Observed nucleation rates from various locations as a function of [A1]. Scheme 2 presented here predicts nucleation rates enclosed in purple dashes if nucleation is due to reactions of sulfuric acid with DMA and in black dot/dash if due to reactions with NH3. The table to the right details the values used to determine the DMA and NH3 nucleation rates
However, the atmosphere contains numerous compounds that react
simultaneously to stabilize sulfuric acid clusters. Computational chemistry has shown
that DMA displaces ammonia in sulfuric acid ion clusters [DePalma et al., 2011;
Kupiainen et al., 2012]. Furthermore, Yu et al. [2012] have experimentally shown a
NH3/DMA mixture in a sulfuric acid environment enhances the number of particles
33
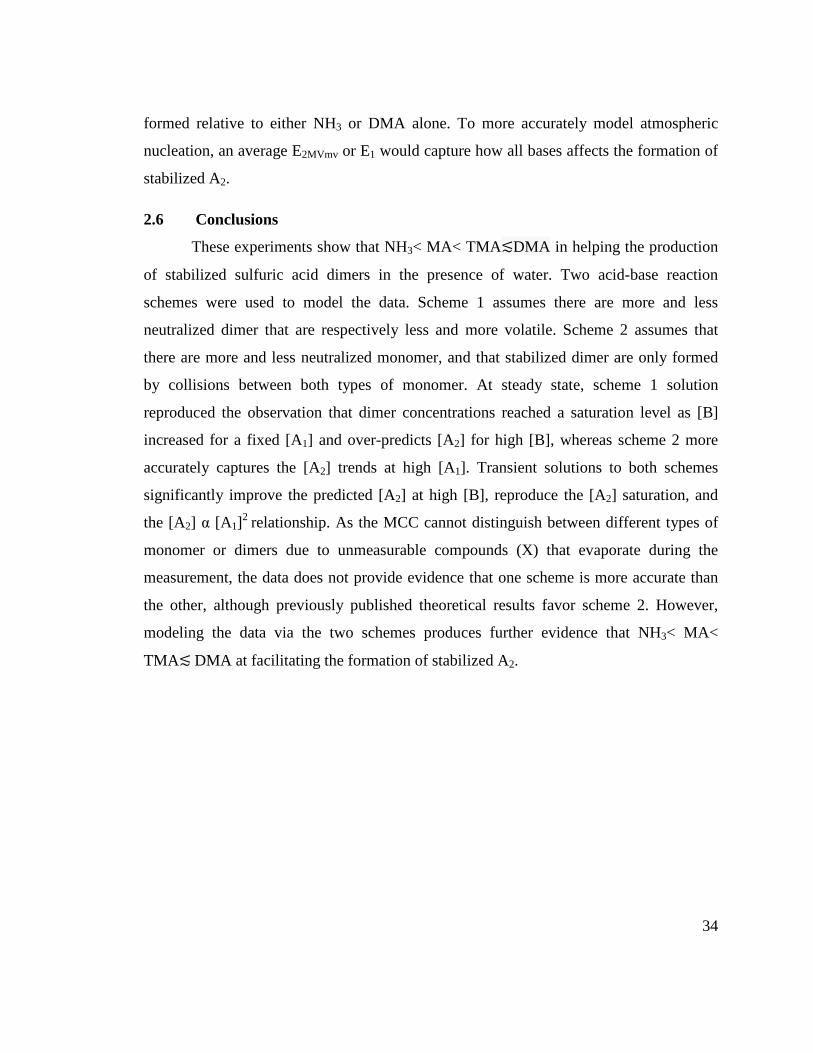
formed relative to either NH3 or DMA alone. To more accurately model atmospheric
nucleation, an average E2MVmv or E1 would capture how all bases affects the formation of
stabilized A2.
2.6 Conclusions
These experiments show that NH3< MA< TMA≲DMA in helping the production
of stabilized sulfuric acid dimers in the presence of water. Two acid-base reaction
schemes were used to model the data. Scheme 1 assumes there are more and less
neutralized dimer that are respectively less and more volatile. Scheme 2 assumes that
there are more and less neutralized monomer, and that stabilized dimer are only formed
by collisions between both types of monomer. At steady state, scheme 1 solution
reproduced the observation that dimer concentrations reached a saturation level as [B]
increased for a fixed [A1] and over-predicts [A2] for high [B], whereas scheme 2 more
accurately captures the [A2] trends at high [A1]. Transient solutions to both schemes
significantly improve the predicted [A2] at high [B], reproduce the [A2] saturation, and
the [A2] α [A1]2 relationship. As the MCC cannot distinguish between different types of
monomer or dimers due to unmeasurable compounds (X) that evaporate during the
measurement, the data does not provide evidence that one scheme is more accurate than
the other, although previously published theoretical results favor scheme 2. However,
modeling the data via the two schemes produces further evidence that NH3< MA<
TMA≲ DMA at facilitating the formation of stabilized A2.
34
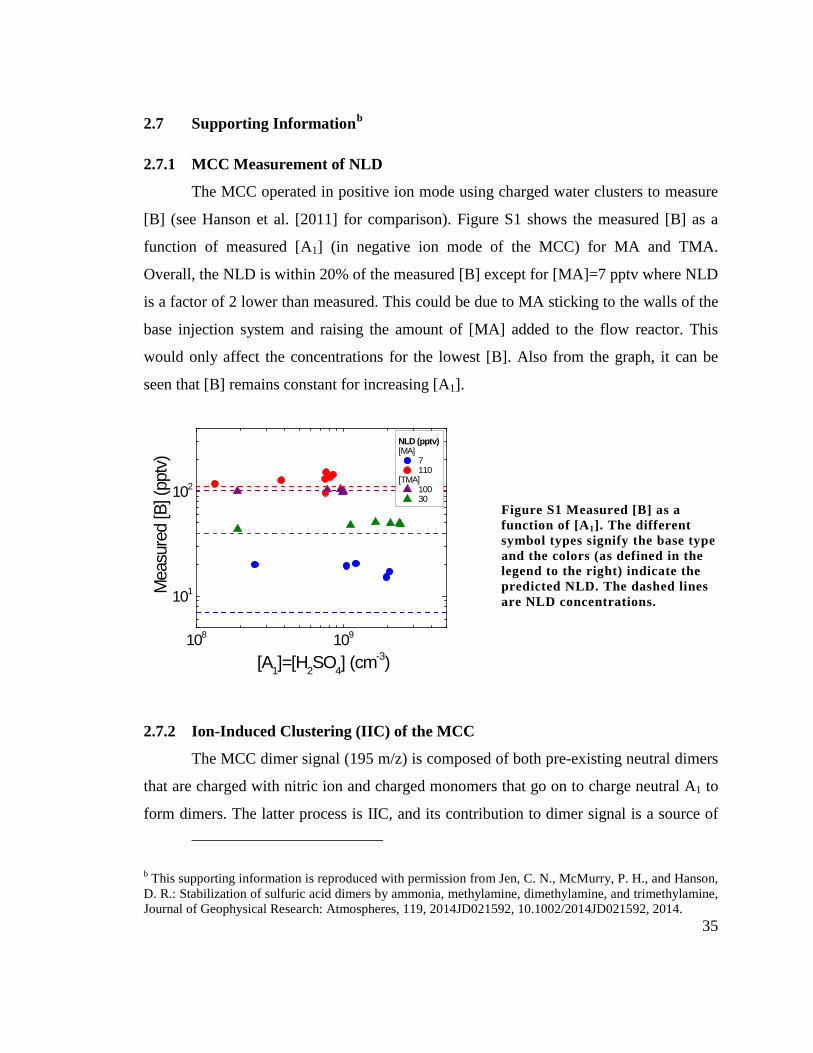
2.7 Supporting Informationb
2.7.1 MCC Measurement of NLD
The MCC operated in positive ion mode using charged water clusters to measure
[B] (see Hanson et al. [2011] for comparison). Figure S1 shows the measured [B] as a
function of measured [A1] (in negative ion mode of the MCC) for MA and TMA.
Overall, the NLD is within 20% of the measured [B] except for [MA]=7 pptv where NLD
is a factor of 2 lower than measured. This could be due to MA sticking to the walls of the
base injection system and raising the amount of [MA] added to the flow reactor. This
would only affect the concentrations for the lowest [B]. Also from the graph, it can be
seen that [B] remains constant for increasing [A1].
108 109
101
102
Mea
sure
d [B
] (pp
tv)
[A1]=[H2SO4] (cm-3)
NLD (pptv) [MA]
7 110
[TMA] 100 30
Figure S1 Measured [B] as a function of [A1]. The different symbol types signify the base type and the colors (as defined in the legend to the right) indicate the predicted NLD. The dashed lines are NLD concentrations.
2.7.2 Ion-Induced Clustering (IIC) of the MCC
The MCC dimer signal (195 m/z) is composed of both pre-existing neutral dimers
that are charged with nitric ion and charged monomers that go on to charge neutral A1 to
form dimers. The latter process is IIC, and its contribution to dimer signal is a source of
b This supporting information is reproduced with permission from Jen, C. N., McMurry, P. H., and Hanson, D. R.: Stabilization of sulfuric acid dimers by ammonia, methylamine, dimethylamine, and trimethylamine, Journal of Geophysical Research: Atmospheres, 119, 2014JD021592, 10.1002/2014JD021592, 2014.
35

uncertainty. Chen et al. [2012] (SI) lists a series of possible IIC reactions, with the
pertinent reactions given below. 1
21
2
31
32
3
1 3 3 1
1 1 2
2 3 3 2
2 1 3
1 2 3
3 3 3 3
k
k
k
k
k
k
A HNO NO A
A A A
A HNO NO A
A A A
A A A
A HNO NO A
− −
− −
− −
− −
− −
− −
+ • →
+ →
+ • →
+ →
+ →
+ • →
where A1 = neutral monomer A1
- = charged monomer A2 = neutral dimer A2
- = charged dimer ki = nitrate ionization rate constant kij = IIC rate constant
Chen et al. [2012] provides two sets of rate constants: one set contains the collision rate
constants [Hanson et al., 2011; Su and Bowers, 1973] and the second are rate constants
fitted from ambient data [Zhao et al., 2010]. To determine which set of IIC rate constants
to use for this study, the chemical ionization (CI) reaction time of the MCC was varied by
manipulating the electric field in the sampling region (see Figure 1) with constant [A1].
Changing the CI reaction time does not change the amount of pre-existing neutral dimer
but does affect the amount produced by IIC.
Consider first the ionization of A1. Integrating the ionization rate equation and
assuming the nitrate source ion (125 m/z) remains constant at short CI time scales, the
ratio between signal 160 m/z and 125 m/z (S160/S125) can be used to calculate [A1]:
36

[ ]1601 1
125
S k A tS
= Equation S1
where k1 has been experimentally measured [Viggiano et al., 1997] and is the collision
rate constant. Equation S1 matches that given in Berresheim et al. [2000] with the
implicit assumption that the MCC is able to transport and detect ions at 160 m/z and 125
m/z equally efficiently. However as is shown in Zhao et al. [2010], lighter ions are
transported and detected less efficiently than heavier ions. The difference in efficiencies
between these masses can be taken into account by dividing by the ratio of sensitivities
for the different masses (see equation S11 in Chen et al. [2012] as an example). For the
MCC between the masses of 125-195, the ratio of sensitivities is ~1.1-1.3, depending on
the specific masses in the ratio; therefore, we have left out this sensitivity ratio to
simplify the equation but have taken it into account in the MCC signal to concentration
conversion. Figure S2 (left) shows S160/S125 vs. time at varying [MA]. The linear fits of
S160/S125 vs. time gives a slope of k1[A1] with non-zero y-intercepts for all [MA]. Two
possible sources of uncertainty could cause this non-zero y-intercept. Other
uncharacterized, ionizing species (x-ray or electrons) may escape from the source holder
and ionize clusters in the flow reactor. Furthermore, the Po-210 lies inside an uncovered
cavity within the source holder. Since the source holder sits in the flow reactor (see
Figure 1), small amounts of sulfuric acid flow can enter into the cavity and mix with the
nitrate ions. This would lead to longer than predicted CI reaction for some fraction of the
sulfuric acid clusters.
Now consider both the nitrate ionization of A2 and the IIC formation of A2-.
Integrating these reaction equations at short time scales shows that the ratio of S195/S160 is
composed of neutral A2 and A2- formed by IIC.
37

[ ][ ] [ ]2195 2
21 1160 1 1
12
AS k k A tS k A
= + Equation S2
A comparison between the slopes from Equation S1and Equation S2 provides evidence if
k21 is the collision rate constant or not. A factor of 2 between the two slopes implies that
k21=k1=collision rate constant. From comparing the two graphs in Figure S2 at [MA]=0
and 10 pptv, k21=collision rate constant; however at [MA]=150 pptv, the ratio of the
slopes is 2.5 (see Table S1). Although we suspect high uncertainty with these ratios, the
trend still indicates that base effects IIC. Based upon conclusions from the main paper,
we hypothesize that the concentration and identity of B will affect IIC. For the purpose of
this paper, we assumed IIC proceeded at the faster collision rate. Thus, [A2] shown in
Figure 2 is the lower limit. The actual [A2] will be higher (up to a factor of 4) than
reported here but the fitted evaporation rates will still fall in the range reported in Table 2
and 2.
The y-intercepts from the linear fits of Figure S2 (right) show that for [A1]=4x10⁹
cm-3 and [MA]=0 pptv, the pre-existing [A2]=6x107 cm-3. The baseline measurements
detailed in the main paper produced a fitted relationship for non-IIC corrected [A2] vs.
[A1] of
[ ] [ ]1.91102 11.32 10A A−= × Equation S3
Therefore, at [A1]=4x109 cm-3, about 20% of the total 195 m/z signal is neutral dimer not
produced via IIC. Table S1 Comparison between slopes of S160/S125 and S195/S160 vs. time
[MA] (pptv) Slope S160/S125
Slope S195/S160
Ratio of slopes S160/S125 to S195/S160
0 7.0 3.4 2.0 10 4.5 2.2 2.0 150 1.6 0.64 2.5
38

0.00 0.05 0.10 0.150.0
0.4
0.8
1.2
0.00 0.05 0.10 0.150.0
0.2
0.4
0.6
y=1.6x+0.01R2=0.99
y=4.5x+0.05R2=0.97
[MA]=0 pptv 10 150
S 160/S
125
CI Reaction Time, t (s)
y=7.0x+0.1R2=0.99
y=0.64x+0.009R2=0.96
y=2.2x+0.04R2=0.96
S 195/S
160
CI Reaction Time, t (s)
y=3.4x+0.03R2=0.98
Figure S2 Left: Ratio of signals of 160 m/z and 125 m/z as a function of CI reaction time. Right: Ratio of signals of 195 m/z and 160 m/z as a function of CI reaction time. Each color represents a different [MA], and the lines are linear fits.
2.7.3 Repeatability of Flow Reactor Experiments and Uncertainty in Measurement
Several experiments were done at constant [B] on different times and days to
study daily repeatability of measurements carried out in the flow reactor system. Figure
S3 shows measurements of [A1] and [A2] made [MA]=80 pptv on three different days.
Between these three days, 12 experiments of MA were conducted at [MA] from 10-260
pptv. The good daily repeatability (~10%) suggests that the flow reactor is able to quickly
adapt to new [B] without significant “memory" of contamination from experiments
carried out in the intervening period. Figure S3 also suggests that the base
dilution/injection system developed in Zollner et al. [2012] and MCC have minimal daily
variation. In addition to day-to-day variability, the total uncertainty also includes the
systematic error of the MCC. The box on the bottom right of Figure S3 illustrates the
systematic error of the MCC measurement. The systematic error in [A2] could lower the
predicted E2mv and E1 values, but they will fall in the range given in Tables 1 and 2. [A2]
error of 70% was determined from varying chemical ionization times and comparing the
measured [A2]. [A1] error of 50% was calculated from error propagation [Chen et al.,
2012].
39

107 108 109 1010
106
107
108 8/27/13 8/29/13 9/3/13
[MA]=80 pptv
[A2]
(cm
-3)
[A1]=[H2SO4] (cm-3)
Figure S3 Measured [A2] vs. [A1] values for [MA]=80 pptv on three different days (black for 8/27/13, blue for 8/29/13, and red for 9/3/13 ). The box on the bottom right shows the systematic error of the MCC.
2.7.4 Collision-Controlled Limit at Steady State
The collision-controlled limit (CCL) is where every collision of A1 with another
A1 or cluster forms a larger cluster that does not evaporate (no backward reaction).
However, clusters are still lost via collisions with other particles (including monomer,
clusters, or larger particles) and the wall of the Augsburg flow reactor. The CCL is
important because it corresponds to the highest concentration of clusters that could be
formed for a given [A1] [McMurry, 1983]. Observed cluster concentrations must be equal
or less than the cluster-controlled limit. If less, then the difference must be related to the
extent to which cluster concentrations are depleted by sulfuric acid evaporation. Figure
S4 plots the measured [A2] vs. [A1] with the solid black line showing the CCL calculated
from measured [A1]. For all the bases except TMA, the measured [A2] falls on or below
the CCL curve. This implies that either the monomer or dimer must be evaporating to
depress the [A2] from the CCL concentration. Measured [A2] for TMA appears to exceed
the CCL, possibly due to fault in the steady state assumption where long lifetime clusters
would artificially raise the measured [A2]. If this were true, then DMA would also suffer
from inflated measured [A2]. This does not change the conclusion that the series of
conditions examined here predominately take place below CCL.
Figure S4 also shows that the measured [A2] approaches CCL curve for the
highest [A1] and [B]. In this region, the production of A2 (A2mv and A2LV from scheme 1 40

and A2 from 2) will dominate the cluster balance equations due to high concentrations of
reactants (e.g. [A1] and [B]). The rate of cluster evaporation is overwhelmed by the
production rates because the evaporation rates depend on cluster composition and
temperature but not on [A1] and [B].
Figure S4 Measured [A2] vs. [A1] with the calculated collision controlled limit drawn as a black line. The collision-controlled [A2] was determined from measured [A1] and includes particle coagulation and wall losses. No cluster evaporation or base reaction is present at this limit. Most [B] and [A1] conditions produced measured [A2] below this limit. (a) NH3, (b) MA, (c) DMA, and (d) TMA
2.7.5 Scheme 1 Acid-Base Reaction Model for Nucleation
Scheme 1 acid-base reaction model for nucleation is pictorially described on the
left in Figure 4. The resulting rate equations for each species are given below.
[ ] [ ] [ ] [ ][ ]
[ ][ ] [ ] [ ] [ ]
2111 1 2 2 21 2 1
31 3 1 3 3 1 1
2
mv mv LV
d Ak A E A k A A
dtk A A E A A Ak η
= − + −
− + − −
Equation S4
104
105
106
107
108
109
[A2] (
cm-3
)
NH3= 100 pptv (2e9 cm-3)
300 (7e9)1100 (3e10)1800 (4e10)2300 (6e10)3500 (8e10)6000 (1e11)
MA= 10 pptv (2e8 cm-3)20 (5e8)70 (2e9)80 (2e9)180 (4e9)220 (5e9)260 (6e9)
106 107 108 109104
105
106
107
108
[A1]=[H2SO4] (cm-3)
[A2] (
cm-3
)
DMA= 2 pptv (5e7 cm-3)3 (8e7)6 (1e8)20 (5e8)60 (1e9)100 (3e9)200 (5e9)
106 107 108 109 1010
[A1]=[H2SO4] (cm-3)
TMA= 4 pptv (1e8 cm-3)12 (3e8)30 (7e8)54 (1e9)95 (2e9)140 (3e9)300 (7e9)
(b) MA
(d) TMA(c) DMA
(a) NH3
41

[ ] [ ][ ] [ ] [ ]'
21 2 2 2mv Blv lv
d Bk A B E A B
dtm= − + −
Equation S5
[ ] [ ] [ ] [ ][ ]
[ ] [ ][ ][ ] [ ] [ ]
22 '11 1 2 2 21 2
2 2 22 2 2
2''21 2 2 2
12
mvmv mv mv
BLV LV LV mv
mv mv mv
d Ak A E A k A B
dtE A k A A
k A A Ak η
= − −
+ −
− − −
Equation S6
[ ] [ ][ ] [ ] [ ][ ] [ ]
[ ][ ] [ ] [ ] [ ]
2 '21 2 2 2 21 2 1 3 3
2'22 2 2 22 2 2 2
LVmv BLV LV LV
LV mv LV LV LV
d Ak A B E A k A A E A
dtk A A k A A Ak η
= − − +
− − − −
Equation S7
[ ] [ ][ ] [ ] [ ][ ] [ ] [ ]321 2 1 3 3 31 3 1 3 3 3LV
d Ak A A E A k A A A A
dtk η= − − − −
Equation S8
where [A1] = monomer concentration [A2mv] = more volatile dimer concentration [A2LV] = less volatile dimer concentration [A3] = trimer concentration [B] = base concentration E2mv = evaporation rate constant for sulfuric acid from A2mv E2BLV = evaporation rate constant for base from A2LV E3 = evaporation rate constant of sulfuric acid from A3 κi =first order coagulation rate to particles η = wall loss rate μ = base dilution coefficient As an approximation, the forward rate constants, kii, are taken to be hard sphere collision
rate for a sulfuric monomer using its bulk liquid density (4x10⁻¹⁰ cm3 s-1) [McMurry,
1983; Ortega et al., 2012]. For the transient solution, differential equations were solved
numerically using Matlab’s ode45 with an input of an initial [A1] and [B]. Initial [A1] was
based upon the baseline concentration for a given sulfuric acid flow rate, and [B] was
42

taken to be 10 times the NLD. The other cluster concentrations were assumed to be zero
at t=0 s.
2.7.6 Scheme 2 Acid-Base Reaction Model for Nucleation
Scheme 2 acid-base reaction model is pictorially described on the right in Figure 4. The
resulting rate equations for each species are given below.
[ ] [ ][ ] [ ] [ ][ ]
[ ][ ] [ ] [ ] [ ]
111 1 1 1 11 1 1
21 1 2 3 3 1 1 1
'
d Ak A B E A B k A A B
dtk A A E A A Aη k
= − + −
− + − −
Equation S9
[ ] [ ][ ] [ ] [ ][ ] [ ][ ] [ ]11 1 1 1 2 2 3 3' ' 'd B
k A B E A B k A B k A B Bdt
m= − + − − − Equation S10
[ ] [ ][ ] [ ] [ ][ ] [ ]
[ ][ ] [ ] [ ] [ ]
2111 1 1 1 11 1 1 11 1
21 1 2 3 3 1 1 1
'
d A Bk A B E A B k A A B k A B
dtk A B A E A A A Bη k
= − − −
− + − −
Equation S11
[ ] [ ][ ] [ ] [ ][ ] [ ][ ]
[ ] [ ] [ ] [ ]
2211 1 1 11 1 21 1 2 21 1 2
222 2 3 3 2 2 2
12
d Ak A A B k A B k A A k A B A
dtk A E A A Aη k
= + − −
− + − −
Equation S12
[ ] [ ][ ] [ ][ ] [ ] [ ] [ ]321 1 2 21 1 2 3 3 3 3 3
d Ak A A k A B A E A A A
dtη k= + − − −
Equation S13
where [A1] = monomer concentration [A1B] = more neutralized monomer concentration [A2] = dimer concentration [A3] = trimer concentration [B] = base concentration E1 = evaporation rate constant of A1B E3 = evaporation rate constant of sulfuric acid from A3 κi =first order coagulation rate to particles η = wall loss rate μ = base dilution coefficient
43

2.7.7 Scheme 2 at Steady State and Applied to the Atmosphere
We assume all collision rate constants, k, are equal and clusters are only lost to larger
clusters and not to the wall. The total signal at 160 m/z =[A1tot] where
[ ] [ ] [ ]1 1 1totA A A B= + Equation S14
The monomer concentrations are assumed to be at equilibrium with [B] such that
[ ][ ][ ]
1
1 1
A BkE A B
= Equation S15
Combining Equations S14 with S15 gives an expression for [A1B].
[ ] [ ][ ] [ ]1 1
1tot
k BA B A
E k B=
+
Equation S16
The steady state balance from Equation S13 gives
[ ] [ ][ ]1 23
3 3
totk A AA
E k η=
+ +
Equation S17
Combining the steady state balance from Equation S12 with Equations S14, S15, and S17
gives the steady state concentration of [A2].
[ ] [ ]
[ ] [ ] [ ]
32 1 2
3 3
223 1
1 2 13 3
1 12
1 1 42 2
tot
tot
EA k Ak E
E E kk A k A Bk E B
k ηk η
k ηk η
= − − + + + +
+ − + + + + + +
Equation S18
From Chen et al. [2012], the nucleation rate is the formation of A4 (i.e., J=J4) and equals
[ ][ ]4 1 3totJ k A A= Equation S19
Substituting Equation S18 into S17 then S19 produces
44

[ ]24 1
1'2 totJ P k A= •
Equation S20
where P’ is a prefactor. P’ is always less than 1 and is defined as
[ ]
[ ] [ ] [ ]
31 2
3 3 3 3
223 1
1 23 3 3 3
1 1
1 1 42
tot
tot
EP k AE E
E E kk A k ABE E B
k ηk η k η
k ηk η k η
= − − + + + + + +
+ − + + + + + + + +
Equation S21
[A1B] is defined in Equation S19, leaving Equation S20 in terms of measurable
concentrations.
2.7.8 [A2] / [A1] vs. [B] for Constant [A1]
The dependence of [A2] on [B] is better illustrated by taking a vertical slice of
Figure 2. This creates the graphs in Figure S5 through Figure S8 where the measured [A2]
/ [A1] ratio is a function of [B]. The lines on Figure S5 represent the steady state model of
scheme 1 for the given fitted evaporation rates. This model and solution method does
well in capturing the trend of increasing then plateauing trend of [A2] / [A1] with
increasing [B]. The leveling off is the saturation point. The model also captures decently
well the dependence of the ratio on [A1]. The model does not capture the peaking
behavior of TMA curves. The steady state solution for scheme 2 is shown in Figure S6
and more accurately describes the observations seen in the DMA graph. However, this
model underpredicts the ratio at low [A1].
Using the transient solution for scheme 1, given in Figure S7, to predict the ratios
produces worse agreement with NH3 and MA but better for DMA and TMA. This is
consistent with our hypothesis that long-life time clusters are unsuited to be modeled via
steady state. The transient solution for scheme 2 is given in Figure S8. This model most
accurately reproduces the shape of DMA out of the four solution methods/schemes.
45

Overall, both schemes capture the correct trends of the ratio vs. [B] and the spread of the
curves.
Figure S5 The ratio [A2] /[A1] vs. [B] better illustrates the dimer dependence on [B]. Each color is at a constant [A1] and the lines are the predicted steady state ratios from scheme 1. (a) NH3, (b) MA, (c) DMA, and (d) TMA
Figure S6 Ratio of [A2] /[A1] vs. [B] solved at steady state for scheme 2 (lines). (a) NH3, (b) MA, (c) DMA, and (d) TMA
46

Figure S7 [A2] / [A1] vs. [B] at constant [A1]. The lines were calculated from the transient solution of scheme 1. (a) NH3, (b) MA, (c) DMA, and (d) TMA
Figure S8 [A2] / [A1] vs. [B] at constant [A1]. The lines were calculated from the transient solution of scheme 2. (a) NH3, (b) MA, (c) DMA, and (d) TMA
47

2.7.9 Time Dependent Behavior of Particle Coagulation Loss
For this study, particle coagulation loss rate is calculated from the particle size
distributions measured by the DEG SMPS [Iida et al., 2009; Jiang et al., 2011b] for
particles >1.3 nm (geometric diameter). The instrument sampled from a 1/8 inch stainless
steel tube inserted into the center of the flow reactor. The sampling point was ~2 cm
above the MCC sampling region. The size distribution and thus loss rate to larger
particles, κ, are functions of [A1], [B], and time. Figure S9 depicts κ as a function of [A1]
for varying [DMA]. From this figure, κ was described as a power law extrapolation as a
function of measured [A1]. For conditions investigated in this study, κ is smaller than the
wall loss rate of η=0.05 s-1 for almost all [A1]. At high [A1], however, κ is large and plays
a much larger role in the cluster balance equations. This helps to explain the downturn of
[A2] at high [A1].
κ plays a much more complicated role in the transient solution method due to the
evolving particle distribution with respect to time. The total number of particles at the
point of injection is less than at the 3 sec sampling point. This is due to base reacting with
the clusters and forming stable clusters. Therefore, κ will increase as time progresses. The
maximum κ for the transient model can be approximated from the 3 sec particle
distribution and held constant from t=0 to 3 sec. This high κ changes the model lines to
those shown in Figure S10 and Figure S11 (cf. Figure 6 where total loss rate equals η).
The increase of loss prevents the calculated [A1] and [A2] from reaching the full range
seen in the measured data. However, increasing the loss rate does not alter the fitted
evaporation rates.
48
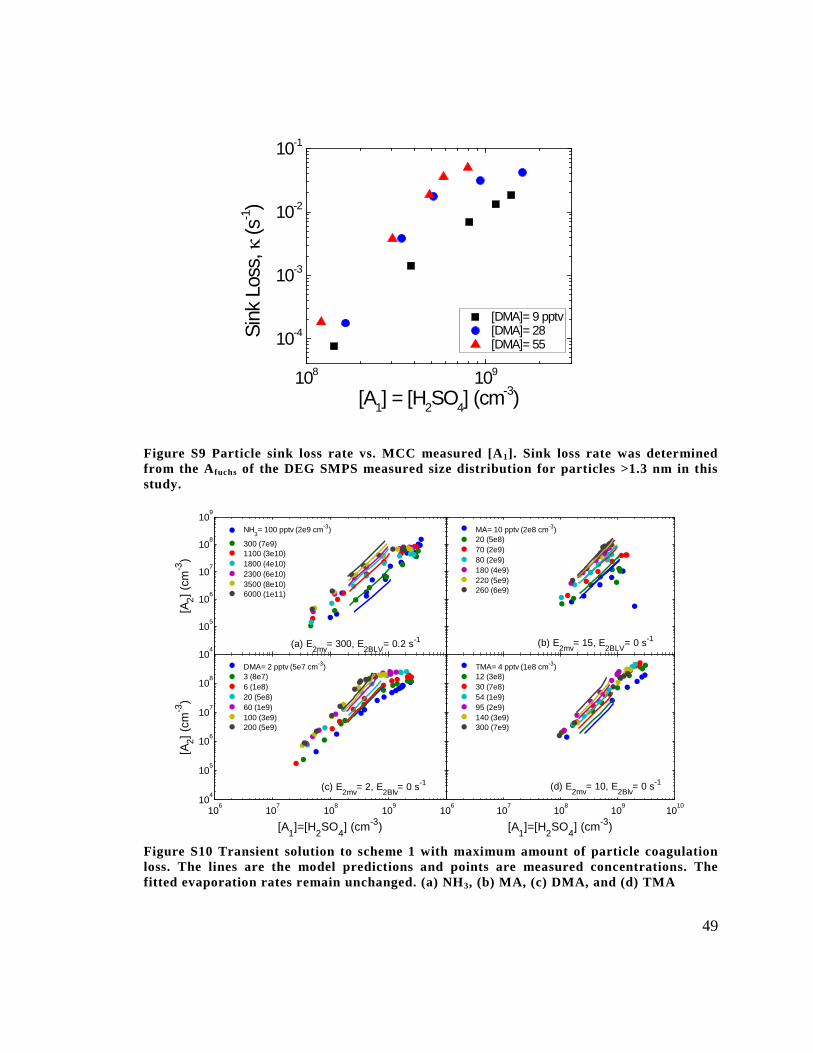
108 109
10-4
10-3
10-2
10-1
[DMA]= 9 pptv [DMA]= 28 [DMA]= 55
Sink
Los
s, k
(s-1)
[A1] = [H2SO4] (cm-3)
Figure S9 Particle sink loss rate vs. MCC measured [A1]. Sink loss rate was determined from the Afuchs of the DEG SMPS measured size distribution for particles >1.3 nm in this study.
Figure S10 Transient solution to scheme 1 with maximum amount of particle coagulation loss. The lines are the model predictions and points are measured concentrations. The fitted evaporation rates remain unchanged. (a) NH3, (b) MA, (c) DMA, and (d) TMA
104
105
106
107
108
109
[A2] (
cm-3
)
NH3= 100 pptv (2e9 cm-3)
300 (7e9)1100 (3e10)1800 (4e10)2300 (6e10)3500 (8e10)6000 (1e11)
MA= 10 pptv (2e8 cm-3)20 (5e8)70 (2e9)80 (2e9)180 (4e9)220 (5e9)260 (6e9)
106 107 108 109104
105
106
107
108
[A1]=[H2SO4] (cm-3)
[A2] (
cm-3
)
DMA= 2 pptv (5e7 cm-3)3 (8e7)6 (1e8)20 (5e8)60 (1e9)100 (3e9)200 (5e9)
106 107 108 109 1010
[A1]=[H2SO4] (cm-3)
TMA= 4 pptv (1e8 cm-3)12 (3e8)30 (7e8)54 (1e9)95 (2e9)140 (3e9)300 (7e9)
(a) E2mv= 300, E2BLV= 0.2 s-1 (b) E2mv= 15, E2BLV= 0 s-1
(d) E2mv= 10, E2Blv= 0 s-1(c) E2mv= 2, E2Blv= 0 s-1
49

Figure S11 Transient solution of scheme 2 (lines) with maximum amount of particle coagulation loss. (a) NH3, (b) MA, (c) DMA, and (d) TMA
104
105
106
107
108
109
[A2] (
cm-3
)
NH3= 100 pptv (2e9 cm-3)
300 (7e9)1100 (3e10)1800 (4e10)2300 (6e10)3500 (8e10)6000 (1e11)
MA= 10 pptv (2e8 cm-3)20 (5e8)70 (2e9)80 (2e9)180 (4e9)220 (5e9)260 (6e9)
106 107 108 109104
105
106
107
108
[A1]=[H2SO4] (cm-3)
[A2] (
cm-3
)
DMA= 2 pptv (5e7 cm-3)3 (8e7)6 (1e8)20 (5e8)60 (1e9)100 (3e9)200 (5e9)
106 107 108 109 1010
[A1]=[H2SO4] (cm-3)
TMA= 4 pptv (1e8 cm-3)12 (3e8)30 (7e8)54 (1e9)95 (2e9)140 (3e9)300 (7e9)
(a) E1= 700, E3= 0.4 s-1 (b) E1= 25, E3= 0.4 s-1
(d) E1= 10, E3= 0.4 s-1(c) E1= 0.1, E3= 0.4 s-1
50

Chapter 3. Towards Reconciling Measurements of Atmospherically
Relevant Clusters by Chemical Ionization Mass Spectrometry and
Mobility Classification/Vapor Condensationc
3.1 Overview
This chapter presents a method to compare number concentrations of cluster
composed of sulfuric acid and dimethylamine measured by two fundamentally different
instruments: a chemical ionization mass spectrometer (Cluster CIMS) and a mobility
classification/vapor condensation particle counter (DEG SMPS). Both instruments have
large uncertainties in their overlapping size range of ~1 nm geometric diameter. This size
represents larger clusters between 3-5 sulfuric acid molecules. Comparison between the
two instruments provides insights into which uncertainties affect the measured
concentrations the most. The results indicate that inefficient nitrate chemical ionization
limits the number of clusters the Cluster CIMS is able to detect. By changing the
chemical ionization reagent ion to a stronger base (e.g. acetate ion), the Cluster CIMS is
able to detect more cluster types and at higher concentrations. This leads to better
agreement between the two instruments. Furthermore, a comparison at high sulfuric acid
concentration (109 cm-3) reveals that ion-induced clustering in the charger of the DEG
SMPS may artificially produce particles large enough to be detected, resulting in higher
than expected number concentrations at 1 nm.
3.2 Introduction
We have previously reported measurements of the complete particle number
distribution down to one molecule made during atmospheric nucleation events [Jiang et
al., 2011c]. The Cluster Chemical Ionization Mass Spectrometer (Cluster CIMS) [Zhao et
al., 2010] measured concentrations of sulfuric acid vapor and sulfuric acid-containing
c This chapter except for the overview is reproduced with permission from Jen, C. N., Hanson, D. R., and McMurry, P. H.: Towards Reconciling Measurements of Atmospherically Relevant Clusters by Chemical Ionization Mass Spectrometry and Mobility Classification/Vapor Condensation, Aerosol Science and Technology, ARL, 49, i-iii, 10.1080/02786826.2014.1002602, 2015.
51

clusters, while a scanning mobility particle spectrometer equipped with a diethylene
glycol condensation particle counter (DEG SMPS) measured number distributions down
to ~1 nm. Cluster CIMS and DEG SMPS measurements typically agreed to within an
order of magnitude in the overlap ~1 nm range and showed similar trends with size.
Jiang et al. [2011c] discussed sources of measurement error. For the Cluster
CIMS, errors include interferences from high molecular weight gas molecules, and
uncertainties in chemical ionization efficiencies, ion-induced clustering (IIC), and mass
discrimination [Chen et al., 2012; Zhao et al., 2010]. For the DEG SMPS, uncertainties
include material-dependent charging and DEG CPC activation efficiencies [Iida et al.,
2009], as well as possible IIC in the bipolar charger.
In this study, we carried out laboratory experiments aimed at exploring these
uncertainties for clusters formed from sulfuric acid and dimethylamine (DMA). Trace gas
interferences have been eliminated from the clean flow reactor used here [Jen et al.,
2014]. Cluster CIMS measurements were done using both nitrate (HNO3•NO3-) and
acetate (H2O•CH3CO2-) to test the hypothesis that chemical ionization efficiencies
depend on the proton affinity of the reagent ions and composition of neutral clusters. The
transfer function for the DEG SMPS mobility classifier is sufficiently broad to allow
more than one cluster type to simultaneously reach the DEG CPC, and this was explicitly
taken into account when comparing data from the two instruments. The DEG SMPS
measurements were done at three fixed classifying voltages corresponding to centroid
mobility diameters of 1.23 nm, 1.34 nm, and 1.55 nm. Mass (geometric) diameters are
0.3 nm smaller than mobility diameters [Larriba et al., 2011]. As voltages were not
scanned, we refer to these as DEG MPS measurements.
The 5 cm diameter flow reactor has been described previously [Jen et al., 2014].
In brief, sulfuric acid vapor ([A1]=107-109 cm-3) was introduced near the entrance, and
DMA ([DMA]=2-110 ppt) was injected at a point to allow the sulfuric acid and DMA to
react for 3 s before measurement. Further experimental details are described in
Supplemental Information (SI). 52
3.3 Ion Mobilities and Mobility Classifier Transfer Function
Ion cluster mobilities were calculated using a particle dynamics program [Larriba
and Hogan, 2013a; b]. The modeled ion compositions include dimer (A2-), trimer (A3
-),
and tetramer (A4-), as well as clusters with DMA molecules (see Table S1). The
structures of these ion clusters are from Ortega et al. [2014]. The simulations ran at
experimental conditions of T=300 K and P=1 atm. The reemission velocity was set to
92% of Maxwell distribution. Water is not included in these structures but is likely
present in the ions. We assume that water does not significantly affect the cluster’s
mobility diameter.
The TSI 3085 transfer function, Ω, has been measured previously and interpolated
to the conditions of this study [Jiang et al., 2011a]. Figure 10 shows Ω for a classifying
voltage of 4.5 V, sheath flow of 13 LPM, and aerosol flow of 2.0 LPM. The points
signify clusters that would penetrate through the mobility classifier at these operating
conditions. The Ω value for each cluster represents the fraction of clusters that will be
delivered to the DEG CPC. The clusters highlighted in red are detected by nitrate
whereas acetate detects all clusters.
0.2 0.4 0.6 0.8 1.0 1.2 1.4 1.6 1.8 2.0 2.20.0
0.1
0.2
0.3
A-5•DMA4
A-5•DMA3
A-4•DMA3
A-2
Ω
Zp (cm2 V-1 s-1)
A-2•DMA
A-3
A-2•DMA2
A-4A-
3•DMA2 A-3•DMA
A-4•DMA2
A-4•DMA
Figure 10 TSI 3085 transfer function at the classifying voltage and flow rate used in this study. Clusters that fall within the mobility window are also shown. Those in red were detected by the Cluster CIMS using nitrate.
3.4 Cluster CIMS vs. DEG MPS at 1.34 nm Centroid Mobility Diameter
The value of Ω was multiplied by the measured Cluster CIMS concentration for
each cluster type. The resulting concentrations were summed over all Cluster CIMS 53

detected cluster types to give the predicted DEG MPS. The measured DEG MPS
concentrations were inverted following Jiang et al. [2011b], taking into account transport
losses in the mobility classifier at 2 LPM and size-dependent charging and activation
efficiencies.
A5.DMA4 A5.DMA3 A4.DMA3 A4.DMA2 A3.DMA2 A4.DMA A3.DMA
A3 A2
1E+05
1E+06
1E+07
Nitr
ate
Pred
icte
d D
EG M
PS C
once
ntra
tion
at 1
.34
nm (c
m-3)
Acet
ate
A4
1E+05 1E+06 1E+07 1E+081E+05
1E+06
1E+07
Measured DEG MPS Concentration at 1.34 nm (cm-3)
[DMA]=110 pptv[DMA]=55 pptv
[DMA]=6 pptv[DMA]=2 pptv
1E+06 1E+07 1E+08
Figure 11 Comparison of predicted DEG MPS concentration at 1.34 nm centroid mobility diameter to measured DEG MPS concentration at various [DMA]. The colors in the bar represent each cluster type and its contribution to the total number concentration. Cluster CIMS measurements were done using acetate (solid bars) and nitrate (hash-marked bars). The lines show 1:1 comparisons. This method was applied to two other centroid mobility diameters: 1.23 (3.8 V) and 1.55 nm (6.0 V). These results are given in the SI and show good agreement.
Figure 11 compares these predicted DEG MPS concentrations to values measured
by DEG MPS. Results are shown for four [DMA] using both nitrate (hashed bars) and
acetate (solid bars). Cluster CIMS concentrations were not corrected for IIC as IIC
contributions were deemed negligible (see SI). The various colors in the bar represent the
various clusters detected by the Cluster CIMS. The height of each color segment
represents the concentration of a specific cluster that would penetrate the mobility
classifier (note log scale). For measurements carried out using nitrate, the agreement
between the two instruments worsens as [DMA] increases. Acetate detects many more 54

clusters types than nitrate and also leads to better agreement between instruments. This
suggests that acetate is more efficient at chemically ionizing more neutralized clusters.
DEG MPS are below those measured by the Cluster CIMS at low [A1]. Under these
conditions, most of the clusters that penetrate through the mobility classifier are dimers.
It is possible that the DEG CPC does not detect dimers efficiently.
3.5 Conclusion
This study demonstrates substantial progress towards reconciling measurements
of ~1 nm cluster number concentrations in a sulfuric acid/DMA system by two
independent measurement methods: chemical ionization mass spectrometry and mobility
classification coupled to a vapor condensation particle counter. Chemical ionization
measurements carried out with acetate ions led to significantly better agreement than
those done with nitrate, especially at high [DMA]. This suggests that ion proton affinity
plays an important role in the chemical ionization process. For the DEG MPS, the
uncertainty in charging and activation efficiency increases as cluster size decreases. Thus,
the largest uncertainty of the DEG MPS measured concentration is at low [A1] where the
size distribution is dominated by the smallest clusters.
55

3.6 Supporting Informationd
3.6.1 Experimental Setup
The Cluster CIMS and DEG MPS data were taken in the extraordinarily clean and
highly repeatable Augsburg flow reactor. The flow reactor setup and procedure have been
described previously [Jen et al., 2014]. The nitrogen flow rate in the reactor was 4 (STP)
LPM with trace amounts of sulfuric acid, water vapor, and injected basic gases. The base
injection point to the Cluster CIMS sampling region results in a ~3 s reaction time
between the basic gas and the sulfuric acid vapor and clusters. Since the DEG MPS
samples gas 10 cm above the Cluster CIMS sampling region, a higher base injection port
was used to preserve the ~3 s reaction time. The basic gas studied here is dimethylamine
(DMA) and its concentrations ([DMA]) were measured by the Cluster CIMS in positive
ion mode (see Jen et al. [2014]) and calculated a priori. The Cluster CIMS separately
used nitrate ion (with a ligand, HNO3•NO3-) and acetate (with a water ligand,
H2O•CH3CO2-) to chemically ionize sulfuric acid clusters. Acetate was produced by
passing nitrogen above a reservoir of acetic anhydride and then over a radioactive charger
(Po-210). The cluster signals from the Cluster CIMS were converted to concentrations
using a chemical ionization reaction time of 15 ms for nitrate and 18 ms for acetate and
following the inversion detailed below and in Jen et al. [2014].
The DEG MPS also used a Po-210 strip to charge clusters and particles before
they entered the TSI 3085 mobility classifier. From Jiang et al. (2011), we assume that
theoretically predicted bipolar steady-state charging efficiencies can be extrapolated to
the 1 nm size range. Premnath et al. [2011] showed that chemical ionization is important
up to a critical size of ~0.5 nm for amino acids and trimethylamine, above which
charging is controlled by ion transport. This critical size is dependent on the chemical
d Supporting information is reproduced with permission from Jen, C. N., Hanson, D. R., and McMurry, P. H.: Towards Reconciling Measurements of Atmospherically Relevant Clusters by Chemical Ionization Mass Spectrometry and Mobility Classification/Vapor Condensation, Aerosol Science and Technology, ARL, 49, i-iii, 10.1080/02786826.2014.1002602, 2015.
56

system involved and must differ from the system studied here as nitrate and acetate
clearly chemically ionize different clusters at a much larger size of 1.34 nm. The Po-210
charger used with the DEG MPS produces numerous types of ionizing ions, many of
which have not been characterized, that go on to charge the neutral sulfuric acid+DMA
clusters. Further refinements in the bipolar charging of the smallest clusters require a
better understanding of the chemical system.
The mobility classifier operated in positive polarity (negative ions) with 13.0±0.5
LPM sheath flow rate and a 2.2±0.2 LPM sample flow rate. Operating conditions of the
DEG CPC followed that of Jiang et al. [2011b], with the saturator and condenser
temperatures at 59 and 20˚C, respectively. The capillary and condenser flow rates were
0.03 and 0.3 LPM respectively.
3.6.2 Clusters and their Mobilities
Mobilities of various sulfuric acid and DMA ion clusters were calculated using a
particle dynamics simulation [Larriba and Hogan, 2013a; b]. Table S2 lists the ion
cluster compositions and their calculated mobilities. Ion structures were taken from the SI
of Ortega et al. [2014] and computed via density functional theory. These structures
represent the minimum energy at zero K. At room temperature, these clusters can access
many lower energy structures and thus could alter the calculated mobility. Furthermore,
under ambient conditions, clusters likely include water, and this is probably a larger
source of uncertainty in the ion mobilities. The following shorthand notation is used: A1-
is HSO4-, A2
- is H2SO4•HSO4-, etc.
57

Table S2 Mobilities of sulfuric acid clusters with DMA in N2 carrier gas
Cluster Mobility (cm2 V-1 s-1) A1
- 2.21 A2
- 1.79 A3
- 1.39 A4
- 1.29 A2
-•DMA 1.53 A3
-•DMA 1.33 A4
-•DMA 1.10 A2
-•DMA2 1.37 A3
-•DMA2 1.24 A4
-•DMA2 1.07 A4
-•DMA3 1.00 A5
-•DMA3 * 0.90 A5
-•DMA4 * 0.85 *Extrapolated mobility as no ion coordinates have been published.
3.6.3 Ion-Induced Clustering (IIC) in Sulfuric Acid/Dimethylamine Environment
IIC has been modeled for the pure sulfuric acid environment where the list of
reactions is given in Chen et al. [2012]. The amount of IIC produced clusters depends
primarily on the chemical ionization (CI) reaction time, t, and [A1]. The relationship
between the dimer signal (S195,for nitrate-detected A2) to monomer signal (S160,
HNO3•HSO4-, for nitrate-detected A1) that takes into account direct ionization of A2 and
IIC-produced A2- can be obtained by integrating the rate equations with respect to time
(see Hanson and Lovejoy [2006] and Chen et al. [2012]) and assuming no change in
reagent ion concentration as a function of time.
[ ][ ] [ ]2195 2
21 1160 1 1
12
AS k k A tS k A
= + Equation S22
where A1 = neutral monomer A2 = neutral dimer ki = nitrate ionization rate constant kij = IIC rate constant
58
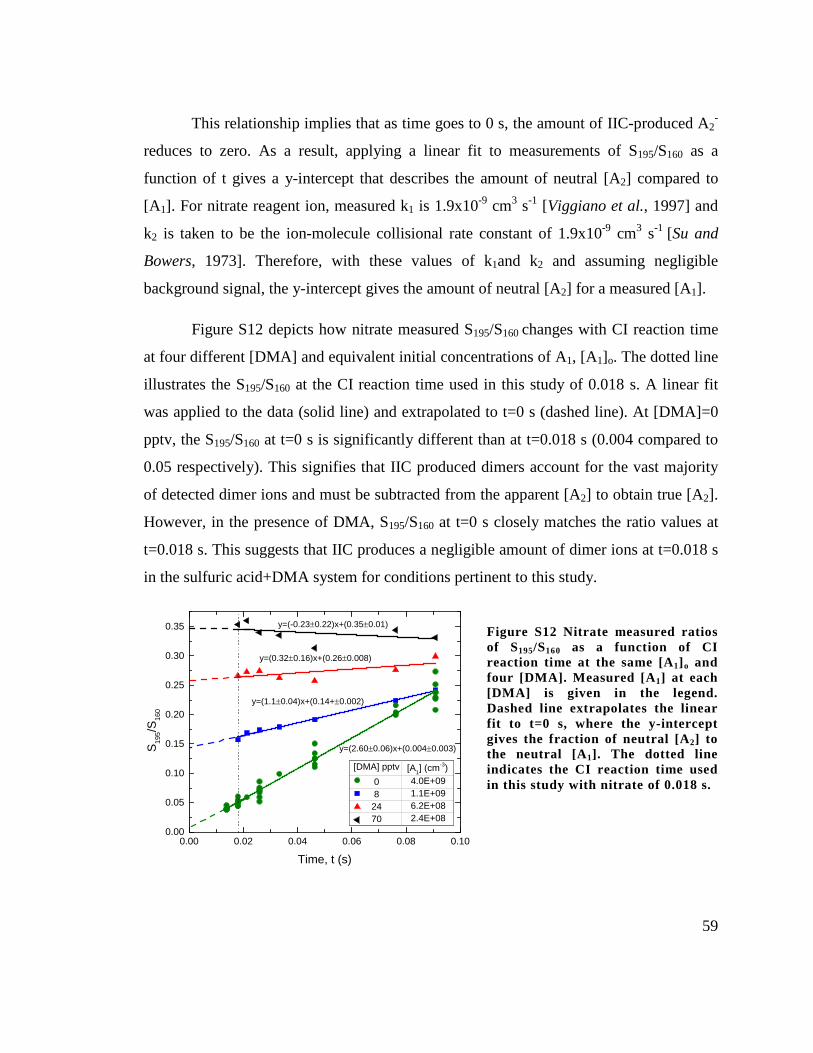
This relationship implies that as time goes to 0 s, the amount of IIC-produced A2
-
reduces to zero. As a result, applying a linear fit to measurements of S195/S160 as a
function of t gives a y-intercept that describes the amount of neutral [A2] compared to
[A1]. For nitrate reagent ion, measured k1 is 1.9x10⁻⁹ cm3 s-1 [Viggiano et al., 1997] and
k2 is taken to be the ion-molecule collisional rate constant of 1.9x10⁻⁹ cm3 s-1 [Su and
Bowers, 1973]. Therefore, with these values of k1and k2 and assuming negligible
background signal, the y-intercept gives the amount of neutral [A2] for a measured [A1].
Figure S12 depicts how nitrate measured S195/S160 changes with CI reaction time
at four different [DMA] and equivalent initial concentrations of A1, [A1]o. The dotted line
illustrates the S195/S160 at the CI reaction time used in this study of 0.018 s. A linear fit
was applied to the data (solid line) and extrapolated to t=0 s (dashed line). At [DMA]=0
pptv, the S195/S160 at t=0 s is significantly different than at t=0.018 s (0.004 compared to
0.05 respectively). This signifies that IIC produced dimers account for the vast majority
of detected dimer ions and must be subtracted from the apparent [A2] to obtain true [A2].
However, in the presence of DMA, S195/S160 at t=0 s closely matches the ratio values at
t=0.018 s. This suggests that IIC produces a negligible amount of dimer ions at t=0.018 s
in the sulfuric acid+DMA system for conditions pertinent to this study.
0.00 0.02 0.04 0.06 0.08 0.100.00
0.05
0.10
0.15
0.20
0.25
0.30
0.35
[DMA] pptv [A1] (cm-3)0 4.0E+098 1.1E+09
24 6.2E+0870 2.4E+08
y=(2.60±0.06)x+(0.004±0.003)
y=(1.1±0.04)x+(0.14+±0.002)
y=(0.32±0.16)x+(0.26±0.008)
S 195/S
160
Time, t (s)
y=(-0.23±0.22)x+(0.35±0.01)
Figure S12 Nitrate measured ratios of S195/S160 as a function of CI reaction time at the same [A1]o and four [DMA]. Measured [A1] at each [DMA] is given in the legend. Dashed line extrapolates the linear fit to t=0 s, where the y-intercept gives the fraction of neutral [A2] to the neutral [A1]. The dotted line indicates the CI reaction time used in this study with nitrate of 0.018 s.
59

3.6.4 Nitrate vs. Acetate Sulfuric acid/DMA Spectra Comparison
Figure S13 compares the mass spectra between nitrate (black) and acetate (red) at
[DMA]=110 pptv and [A1]o=4x109 cm-3. Note that higher cluster concentrations were
found with acetate than nitrate. For example, A3-•DMA2 measured using acetate is about
a factor of 10 higher than with nitrate. Also, acetate allowed more types of cluster to be
detected. As the only variation between these experiments is the chemical ionization ion,
we infer that the difference in cluster signals is due to the higher proton affinity (gas
phase basicity) of acetate relative to nitrate. These results would appear to be at variance
with recent results of Kürten et al. [2014], who reported the efficient detection of clusters
such as A3•DMA2 using nitrate. More work is needed to reconcile these results.
Figure S2 also shows that the nitrate spectrum is very clean with almost no
background peaks obscuring the important sulfuric acid peaks. This is to be expected as
nitrate is a very selective ion, i.e. it can only chemically ionize very acidic clusters. The
acetate spectrum has a high background which can artificially increase the signals at the
key masses. The background is due to trace impurities in the acetic anhydride reservoir or
their evaporation from surfaces; we believe these impurities get ionized by Po-210 but do
not affect the chemical ionization of sulfuric acid clusters by acetate or the formation of
neutral clusters in the flow reactor. This assumption is based upon very good agreement
for both total [A1] and [A2] as measured by either nitrate or acetate. In addition, the
acetate spectrum shows a nitrate peak (125 m/z) at ~15% of the value in the nitrate
spectrum. Nitrate in the acetate system is probably due to adsorbed nitric acid on the
surfaces outside the source holder from when the Cluster CIMS used nitrate as its source
ion. We believe that such a small amount of nitrate will not alter the amount of sulfuric
acid clusters detected by acetate.
Since there is high background using acetate, we took the signals at low [A1]o≈107
cm-3 (DMA=0 pptv) as the background concentration level for all pure sulfuric acid
cluster concentrations (e.g., [A2] at 195 m/z, [A3] at 293 m/z, etc.). The backgrounds for
the aminated clusters was taken to be the concentration at those specific masses without
60

DMA added but at the equivalent [A1]o , though changes in [A1]o had no effect on these
background concentrations.
0 50 100 150 200 250 300 350 400 450 500 550 600 650 700 750 8001E+01
1E+02
1E+03
1E+04
1E+05
1E+06
A-3 A-
5.DMA4A-5.DMA3
A-4.DMA3
A-4.DMA2
A-4.DMA
A-3.DMA2
A-4
A-3.DMA
A-2.DMA
(HNO3)2.A-1
A-1
(HNO3)2.NO-3
HNO3.A-1
HNO3.NO-3
A-2Ac-
[DMA]=110 pptv, [A1]o=4e9 cm-3
Sign
al (H
z)
Mass (m/z)
Nitrate AcetateAc-.H2O
Figure S13 Mass spectra comparison between nitrate (black) and acetate (red) chemical ionization ions. These spectra were measured at [DMA]=110 pptv and [A1]o=4x109 cm-3. Key peaks are identified with acetate abbreviated as Ac-.
3.6.5 Cluster CIMS vs. DEG MPS at 1.34 nm Centroid Mobility Diameter without
DMA
The comparison detailed in the main body of the paper was also done for a pure
sulfuric acid environment ([DMA]=0 pptv). Figure S14 shows the comparison between
predicted DEG MPS concentration and measured concentrations at 1.34 nm centroid
mobility diameter. Cluster concentrations measured by acetate and nitrate were nearly
equal, thus only measurements using nitrate are shown. While concentrations measured
by the DEG MPS are correlated with those predicted from Cluster CIMS measurements,
the DEG MPS concentrations are about 100 times higher.
Two possibilities exist: either the Cluster CIMS is under-measuring the cluster
concentrations or the DEG MPS is over-measuring. We believe that in the pure sulfuric
acid/water environment, the Cluster CIMS accurately measures the cluster
concentrations. The chemical ionization of sulfuric acid by nitrate is fairly well
understood and occurs at the collision rate. In addition, the formation of A2- via IIC from
61

sulfuric acid vapor and bisulfate ion can be modeled accurately and subtracted from the
measured [A2] (see section above). Both processes depend on the chemical ionization
reaction time which can be calculated from the electric field and gap distance between the
ion source and the Cluster CIMS inlet. Overall, the uncertainties from these processes are
estimated to be no greater than 50% and they cannot not account for a factor of 100
difference.
Therefore, we conclude the DEG MPS over measures the cluster concentrations
under these conditions. One reason is that IIC can occur after the sample flow is ionized.
The residence time of the ionized sample flow is ~1 s (from the charger to the point the
sample enters the mobility classifier), resulting in the formation of ionic clusters large
enough to penetrate the mobility classifier. Unlike the Cluster CIMS, a straightforward
method does not exist to take account for IIC in the DEG MPS.
Another possibility is that sulfuric acid vapor or clusters reacts with the diethylene
glycol condensation vapors in the DEG CPC. Hanson et al. [2002] showed that sulfuric
acid reacts with n-butanol to form particles. Dehydration of ethylene glycol by sulfuric
acid is a well-known reaction [McMurry, 2008], so it is possible that diethylene glycol
may also undergo a similar dehydration reaction. This process could produce particles
inside the DEG CPC in a pure sulfuric acid environment or could alter the activation
efficiency of the smallest clusters.. In the presence of a base such as DMA, a large
fraction of the sulfuric acid vapor is bound to one or two DMA molecules. Sulfuric
acid+DMA clusters may not interact with DEG in the same manner as pure sulfuric acid.
Regardless, more studies need to be done to understand the activation efficiency of DEG
in the presence of atmospherically relevant small clusters.
62

1E+06 1E+071E+04
1E+05
1E+06
1E+07[DMA]=0 pptv
Pred
icte
d D
EG M
PS C
once
ntra
tion
at 1
.34
nm (c
m-3)
Measured DEG MPS Concentration at 1.34 nm (cm-3)
A2
Figure S14 Comparison between predicted DEG MPS concentration from Cluster CIMS (nitrate) to the measured DEG MPS concentration at a classifying voltage of 4.50 V (1.34 nm centroid mobility diameter) and [DMA]=0pptv. The black line is the 1:1 comparison. Only one type of cluster was detected. The other clusters were below detection limit.
3.6.6 Predicted DEG MPS Comparisons at 1.23 and 1.55 nm Mobility Diameter
Figure S15 shows the transfer functions of the TSI 3085 mobility classifier at
three different voltages: 3.80, 4.50, and 6.00 V. This corresponds to the centroid sizes of
1.23, 1.34, and 1.55 nm mobility diameter and mobilities of 1.47, 1.27, and 0.92 cm2 V-1
s-1 respectively. Following the procedure detailed in the main paper, Figure S16 and
Figure S17 compare predicted DEG MPS concentrations measured using acetate as the
reagent ion with the Cluster CIMS to measured DEG MPS concentration at 1.23 and 1.55
nm. For all three sizes, the predicted concentrations agree well with the measured
concentrations to within an average factor of 3. However, we observe two systematic
trends: 1) the ratio between predicted concentrations to those measured decrease with
increasing [DMA] and 2) the ratio between predicted and measured concentrations
increase as the measured concentration (or [A1]) decreases. For the latter at low [A1], the
cluster distribution is primarily composed of dimers. The DEG MPS calibration curves
have not been measured down to this size and could explain the poorer agreement.
The [DMA] dependence indicates a systematic uncertainty with one of the
instruments. We believe this may be due to very small clusters/vapors that are
unobserved by the Cluster CIMS but still penetrate the mobility classifier. Consider at
1.23 nm where this trend is most pronounced (Figure S16). The transfer function for 1.23
nm displayed on the left of Figure S15 suggests that clusters smaller than the dimer can
63

penetrate through the mobility classifier but are not observed by the Cluster CIMS. For
example, A1•DMAx, where x≥1 and is number of DMA molecules, is not seen by the
Cluster CIMS with either nitrate or acetate but would penetrate the mobility classifier and
might be measured by the DEG MPS. Also sulfuric acid vapor can pass through the
mobility classifier, which could mean that other vapor molecules, such as amines, might
also be measured by the DEG CPC. Both possibilities might explain why at high [DMA],
the agreement worsens.
However in the presence of DMA, the overall agreement is reasonable (on
average a factor of 5 difference) which gives us confidence that our method for
comparing the two types of instruments is valid. Also, this agreement supports our
conclusions drawn from the IIC study detailed above. If IIC played a role in the sulfuric
acid+DMA system, then we would expect the DEG MPS measured number concentration
at 1.23 nm to be biased much higher because even in a short reaction time IIC would still
produce a considerable amount of A2-. These would penetrate the mobility classifier and
may be counted by the DEG CPC in the 1.23 nm size bin. Our measurements suggest this
does not occur.
0.5 1.0 1.5 2.0 2.50.0
0.1
0.2
0.3
0.5 1.0 1.5 2.0 0.5 1.0 1.5 2.0
1.23 nm
Ω
A-4•B3
A-2
A-5•B4
A-5•B3
A-4•B3
A-3•B2A-
1
A-2•B
A-3A-
2•B2
A-3•B
A-4
A-3•B2
A-4•B
A-4•B2 A-
2
1.34 nm
Zp (cm2 V-1 s-1)
A-2•B
A-3
A-2•B2
A-4A-
3•B2A-
3•B
A-4•B2
A-4•B A-
4•B2
A-4•B
A-4•B3
A-5•B3
A-5•B4
1.55 nm
Figure S15 Transfer function (lines) of the TSI 3085 mobility classifier at three different voltages (3.80, 4.50, 6.00 V), corresponding to centroid mobility diameters of 1.23, 1.34, and 1.55 nm and centriod geometric (mass) diameters of 0.83, 1.04, and 1.25 nm. The points represent the clusters’ mobilities and their tranfer function value at each size bin. Red clusters are detected by the Cluster CIMS using nitrate and red+black detected using acetate.
64

1E+07
1E+08
Pred
icte
d D
EG M
PS C
once
ntra
tion
at 1
.23
nm (c
m-3)
[DMA]=2 pptv [DMA]=6 pptv
[DMA]=55 pptv [DMA]=110 pptv
A5.DMA4 A5.DMA3 A4.DMA3 A4.DMA2 A3.DMA2 A4.DMA A3.DMA A3
A2
A1
1E+07 1E+08
1E+07
1E+08
Measured DEG MPS Concentration at 1.23 nm (cm-3)1E+07 1E+08
Figure S16 Comparison between predicted DEG MPS concentration from Cluster CIMS measured concentration (using acetate) to the measured DEG MPS concentration at a classifying voltage of 3.80 V (1.23 nm centroid mobility diameter) at four different [DMA]. The different color types in the bar represent the different types of clusters measured by the Cluster CIMS and their contribution to the predicted total number concentration.
1E+03
1E+04
1E+05
1E+06
1E+07
1E+08
Pred
icte
d D
EG M
PS C
once
ntra
tion
at 1
.55
nm (c
m-3)
A5.DMA4 A5.DMA3 A4.DMA3 A4.DMA2 A3.DMA2 A4.DMA A3.DMA
[DMA]=2 pptv [DMA]=6 pptv
[DMA]=55 pptv [DMA]=110 pptv
1E+05 1E+06 1E+071E+02
1E+03
1E+04
1E+05
1E+06
1E+07
1E+08
1E+05 1E+06 1E+07Measured DEG MPS Concentration at 1.55 nm (cm-3)
Figure S17 Comparison between predicted DEG MPS concentration from Cluster CIMS measured concentration (acetate) to the measured DEG MPS concentration at a classifying voltage of 6.00 V (1.55 nm centroid mobility diameter) at four different [DMA].
65

Chapter 4. Diamine-Sulfuric Acid Reactions are a Potent Source of
Atmospheric Particle Formatione
4.1 Overview
With potential sources of uncertainty identified for the DEG MPS measurements
in the 1 nm geometric size range, the DEG MPS was used to show how reactions of
sulfuric acid and diamines produce more particles than dimethylamine, a monoamine.
Particle concentrations 1.77 nm (centroid mobility diameter) and larger were examined to
avoid interferences with potential ion-induced particles formed charger before the DEG
MPS mobility classifier, as explained in Chapter 3. This chapter presents the first
evidence from laboratory and field measurements that diamines are more powerful
nucleating agents than monoamines. Diamines, a previously unstudied group of
compounds, likely originate from both natural and man-made sources, and can facilitate
particle nucleation in both clean and polluted environments. Under controlled flow
reactor conditions, diamines were observed to react with sulfuric acid and its clusters to
produce 10-100 times more particles than monoamines, including dimethylamine which
is currently the basic compound considered to enhance nucleation rates the most. We also
measured putrescine and cadaverine, both diamines, concentrations in rural Oklahoma
during spring, 2013. Their concentrations ranged from 10-100 pptv during nucleation
events and were equal to or greater than concentrations of dimethylamine. We conclude
from our observations that diamines are potent nucleating agents and contribute
significantly towards atmospheric nucleation.
e This chapter except for the overview is reproduced from Jen, C. N., Bachman, R., Zhao, J., McMurry, P. H., and Hanson, D. R.,: Diamine-sulfuric acid reactions are a potent source of atmospheric particle formation, Nature Geoscience, under review, 2015.
66

4.2 Introduction
Atmospheric nucleation is the formation of stable aerosol particles from trace
precursor gases and accounts for up to half the global cloud condensation nuclei [IPCC,
2014]. Thus, accurate predictions of global climatic cooling by aerosols and clouds
require understanding the chemical processes that lead to nucleation [Kuang et al., 2009].
Atmospheric nucleation typically correlates with sulfuric acid concentrations [Kuang et
al., 2008], but clusters formed from water and sulfuric acid alone are unstable and require
stabilizing compounds to reduce cluster evaporation rates and form stable particles. Here,
we examine how diamines, a previously unstudied class of compounds, affect sulfuric
acid nucleation in both a controlled flow reactor and in the atmosphere. We found that the
number of particles formed from sulfuric acid and diamines was equal to or greater than
the number formed from monoamines, implying that the diamines are more effective
nucleating agents. Sulfuric acid and diamine concentrations were also monitored using
chemical ionization mass spectrometers during spring, 2013 at the Southern Great Plains
(SGP) site in Lamont, OK. Field measurements suggest that high concentrations of
diamines significantly contribute to the number of freshly nucleated particles. We
conclude that diamines are an important class of compounds that participate in
atmospheric nucleation and warrant consideration in nucleation measurements and
models.
Ammonia and monoamines (i.e., organic compounds with a single amine group)
have been researched extensively in chamber and flow reactor studies. Amines are much
more effective than ammonia at enhancing nucleation, with dimethylamine (DMA) and
trimethylamine observed to stabilize sulfuric acid clusters the most [Almeida et al., 2013;
Jen et al., 2014; Kürten et al., 2014; Yu et al., 2012] In the complete absence of cluster
evaporation, nucleation rates reach a maximum, referred to as the collision-controlled
limit (CCL) [McMurry, 1980; McMurry, 1983]. Our previous flow reactor results suggest
that sulfuric acid concentrations of 108-109 cm-3 with either DMA≥20 pptv (5x108 cm-3)
or trimethylamine≥ 30 pptv (7x108 cm-3) form clusters at the CCL [Jen et al., 2014].
Kürten et al. studied DMA at 5-32 pptv (1x10⁸ - 8x108 cm-3) and sulfuric acid at 105-107 67

cm-3 in the CLOUD chamber and also concluded that clusters form at the CCL [Kürten et
al., 2014].
Nonetheless, the atmospheric boundary layer contains numerous compounds in
addition to DMA that can stabilize sulfuric acid clusters. Current research is focused on
(1) linking highly oxidized, high molecular weight organics to nucleation events in
pristine environments such as boreal forests [Schobesberger et al., 2013] and (2) amines
in industrial and agricultural/livestock regions [Chen et al., 2012; Freshour et al., 2014;
Zhao et al., 2011]. Diamines have been largely neglected in atmospheric studies, even
though some limited measurements suggest that diamines have similar sources as
monoamines (e.g. sewage, livestock, industrial operations, tobacco smoke) [Ge et al.,
2011]. Additional sources are likely but have not been characterized. With two basic
amine groups, diamines can oligomerize with atmospherically relevant dicarboxylic
acids, such as malonic and oxalic acid, and esters to form low volatility and high
molecular weight products [Hiemenz and Lodge, 2007]. With no previous computational
chemistry studies, we hypothesize that the two amine groups of diamines form more
stable clusters with sulfuric acid than monoamines.
4.3 Flow Reactor Results
Three diamines and two monoamines were separately injected into a flow reactor
containing sulfuric acid vapor: ethylene diamine (EDA), tetramethylethylene diamine
(TMEDA), and butanediamine (or putrescine, Put), DMA, and methylamine (MA). All
three diamines are used in industrial processes like polymer and food production, with
Put also produced during biological processes and the decomposition of large amino
acids [Slocum and Flores, 1991]. Figure 12 shows the dependencies of total particle
number concentrations larger than 1.77 nm mobility diameter (1.47 nm geometric
diameter [Larriba et al., 2011]), Ntot, on base concentration,[B], and at constant initial
sulfuric acid concentration of [A1]o=2x109 cm-3 (for dependence of Ntot on [A1]o, see
supporting information). Both vapor phase concentrations correspond to the amount of
reactants at the entrance to the flow reactor and prior to the acid-base reaction (see
68
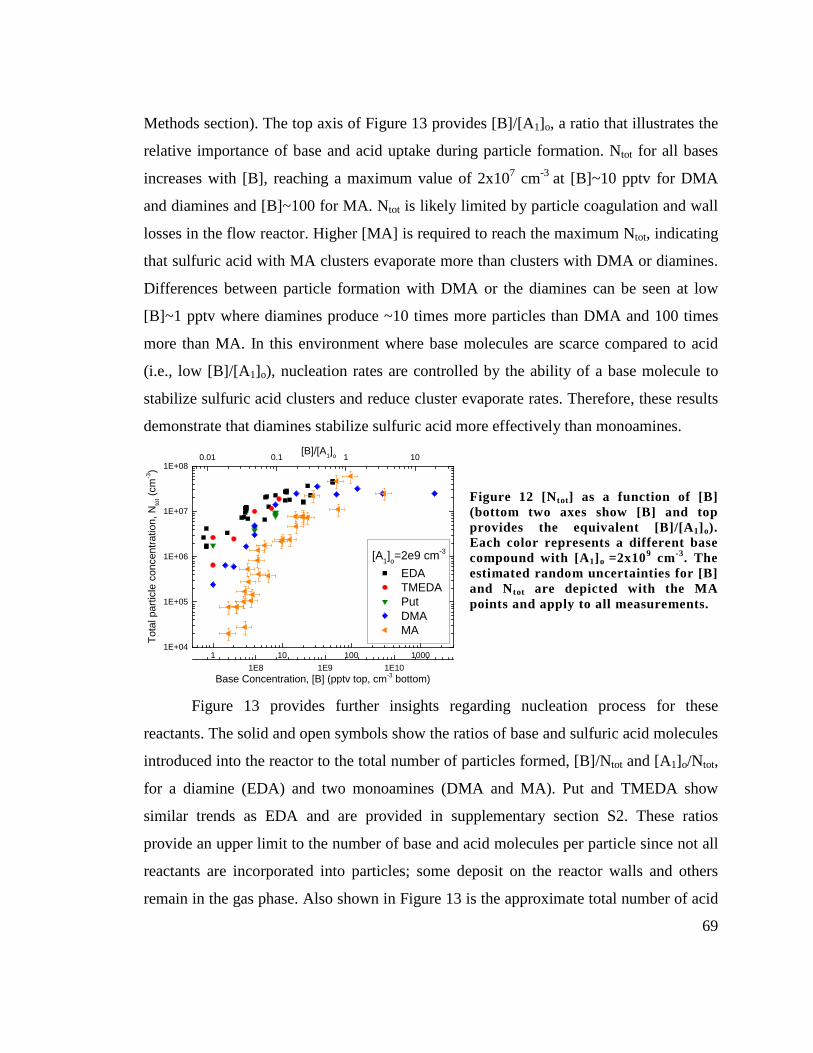
Methods section). The top axis of Figure 13 provides [B]/[A1]o, a ratio that illustrates the
relative importance of base and acid uptake during particle formation. Ntot for all bases
increases with [B], reaching a maximum value of 2x107 cm-3 at [B]~10 pptv for DMA
and diamines and [B]~100 for MA. Ntot is likely limited by particle coagulation and wall
losses in the flow reactor. Higher [MA] is required to reach the maximum Ntot, indicating
that sulfuric acid with MA clusters evaporate more than clusters with DMA or diamines.
Differences between particle formation with DMA or the diamines can be seen at low
[B]~1 pptv where diamines produce ~10 times more particles than DMA and 100 times
more than MA. In this environment where base molecules are scarce compared to acid
(i.e., low [B]/[A1]o), nucleation rates are controlled by the ability of a base molecule to
stabilize sulfuric acid clusters and reduce cluster evaporate rates. Therefore, these results
demonstrate that diamines stabilize sulfuric acid more effectively than monoamines.
1 10 100 10001E+04
1E+05
1E+06
1E+07
1E+08
[A1]o=2e9 cm-3
EDA TMEDA Put DMA MA
Tota
l par
ticle
con
cent
ratio
n, N
tot (
cm-3)
Base Concentration, [B] (pptv top, cm-3 bottom)
0.01 0.1 1 10 [B]/[A1]o
1E8 1E9 1E10
Figure 12 [Ntot] as a function of [B] (bottom two axes show [B] and top provides the equivalent [B]/[A1]o). Each color represents a different base compound with [A1]o =2x109 cm-3. The estimated random uncertainties for [B] and Ntot are depicted with the MA points and apply to all measurements.
Figure 13 provides further insights regarding nucleation process for these
reactants. The solid and open symbols show the ratios of base and sulfuric acid molecules
introduced into the reactor to the total number of particles formed, [B]/Ntot and [A1]o/Ntot,
for a diamine (EDA) and two monoamines (DMA and MA). Put and TMEDA show
similar trends as EDA and are provided in supplementary section S2. These ratios
provide an upper limit to the number of base and acid molecules per particle since not all
reactants are incorporated into particles; some deposit on the reactor walls and others
remain in the gas phase. Also shown in Figure 13 is the approximate total number of acid
69

and base molecules per particle, np, calculated from the mean of the measured particle
volumes. Note, mobility diameters were converted to geometric diameters prior to
calculating np [Larriba et al., 2011]. The increase in np with [B] reflects the observed
larger volumes as [B] increased. Also np values vary slightly between bases (see
supporting information). The range shown for np was obtained by assuming that particles
were composed of a combination of acid and base molecules (including water)
determined from (1) aqueous sulfuric acid solutions in equilibrium at 30% relative
humidity (uncorrected for curvature) and (2) dry <8.5 nm particles formed from DMA
and sulfuric acid [Ouyang et al., 2015]. Since diamines are larger than DMA, a particle
composed of diamine and sulfuric acid would have slightly fewer molecules than the
value shown for sulfuric acid and DMA.
1 10 100 10001E+00
1E+01
1E+02
1E+03
1E+04
1 10 100 1000 1 10 100 1000
(c) MA(b) DMA
[A1]o=2x109 cm-3
[A1]o/Ntot
[B]/Ntot
[B]/N
tot,
[A1] o/N
tot,
or n
p (m
olec
ules
/par
ticle
)
(a) EDA
[B] (pptv top, cm-3 bottom)
0.01 0.1 1 10 0.01 0.1 1 10[B]/[A1]o
0.01 0.1 1 10
1E8 1E9 1E10 1E8 1E9 1E10 1E8 1E9 1E10
Figure 13 [A1]o /Ntot (filled symbol) and [B]/Ntot (open symbol) as a function of [B] (bottom x-axis, given as pptv and cm-3). [A1]o was held constant at 2x109 cm-3. [B]/[A1]o is shown on the top x-axis. Three bases are shown: (a) EDA, (b) DMA, and (c) MA. Red lines illustrate the estimated number of molecules per particle, np, with the gray region showing a range of values corresponding to aqueous sulfuric acid (higher) or solid DMA+sulfuric acid (lower).
Taken together, the results for [B]/Ntot, [A1]o/Ntot, and np in Figure 13 illustrate
nucleation processes and the differences between diamines and monoamines. For all
these compounds, [B]/Ntot+[A1]o/Ntot is close to np for [B]/[A1]o about unity
(0.5<[B]/[A1]o<2.5), where base and acid collision rates are similar. This indicates that
under these conditions, near equal amounts of basic and acidic reactants were taken up,
70

leading to particles with basic or acidic vapor pressures well below [B] and [A1]o,
respectively. This could only occur if acid and base evaporation from the clusters were
negligible and if most of the gases were immediately consumed during particle formation
thereby preventing loss to the reactor walls. However as observed from Figure 12, cluster
evaporation plays a larger role in limiting particle formation at low values of [B]/[A1]o
when the acid collision rate is higher than that of base. In this low [B]/[A1]o regime for
EDA, a comparison of [B]/Ntot and np reveals that base accounts for at most 10% of the
molecules in nucleated particles, with sulfuric acid presumably accounting for the
balance. Thus, these particles are very acidic. In contrast, the [B]/Ntot for monoamines
equals or exceeds np, suggesting that some base molecules must remain in the gas phase.
The higher values of [B]/Ntot for monoamines at low [B]/[A1]o confirms that monoamines
are not as effective as diamines at stabilizing clusters.
Furthermore, trends of [B]/Ntot for EDA and the monoamines contrast at low
[B]/[A1]o. Values of [B]/Ntot for EDA are nearly independent of [EDA], i.e. Ntot is
linearly proportional to [diamine] (see supporting information for power dependencies of
Ntot on [B] and [A1]o). This would occur if one diamine molecule forms a stable cluster,
and subsequently a particle, before it was lost to the walls. Thus, the crucial first step for
nucleation of diamines with sulfuric acid may be the initial encounter of acid and base
vapors. For monoamines, however, [B]/Ntot decreases with increasing [monoamine], i.e.
Ntot is proportional to [monoamine]2 [Glasoe et al., 2015]. This entails that one
monoamine forms an unstable cluster which will evaporate unless another monoamine
reacts to stabilize the cluster. As base collision rates increase with [B], the likelihood that
more than one monoamine collides with and stabilizes a cluster to ultimately form a
particle also increases. Combined, lower values of [B]/Ntot and the independence of
[B]/Ntot on [diamine] at low [B]/[A1]o clearly show that diamines are superior to
monoamines in stabilizing sulfuric acid clusters and therefore are more potent nucleating
agents.
71

In the terrestrial atmospheric boundary layer, [B]/[A1] is typically much greater
than unity, indicating that nucleation rates are limited by sulfuric acid uptake. In this
regime, a basic molecule would be taken up immediately following the uptake of a
sulfuric acid molecule. This corresponds to [B]/[A1]o >1 in Figure 13, where [B]/Ntot for
DMA greatly exceeds np, indicating that some of this excess base likely remained in the
gas phase. (Measurements were not carried out for [B]/[A1]o >1 for the other bases, but
we expect they would exhibit the same trend.) Under these high base:acid conditions and
neglecting possible synergistic effects, diamines will contribute more to nucleation rates
than DMA if [diamine] exceed [DMA].
4.4 Field Measurements
The Ambient pressure Proton transfer Mass Spectrometer (AmPMS) [Hanson et
al., 2011] and Cluster Chemical Ionization Mass Spectrometer (Cluster CIMS) [Zhao et
al., 2010] measured the basic gases and sulfuric acid concentrations, respectively, at the
Southern Great Plains (SGP) site in Lamont, OK during spring of 2013. The air mass
around SGP is affected by industrial agriculture (wheat fields and cow pastures) and oil
extraction/refinement. Figure 14 shows the measured DMA, Put, cadaverine (Cad), and
sulfuric acid concentrations ([A1]) throughout the SGP campaign. The diamine
concentrations were corrected posteriori for interferences by isobaric compounds using a
measured constant that represents the diamine fraction of signal (see supplementary
section S5 for discussion on detection of diamines with AmPMS). The vertical lines in
Figure 14 indicate the start of nucleation events (labeled with number).
Measured [A1] ranged from 106-107 cm-3 during nucleation events, and average
[total diamine]/[A1] was 102-103. Events 8, 9, and 10 show clear spikes in either Put or
Cad at the start of nucleation such that [Put]+[Cad] exceeded [DMA]. Here, [A1] ranged
from 5x10⁶-1x107 cm-3 and more closely match [A1] in cleaner environments [Chen et
al., 2012]. Diamines and monoamines (and other compounds) may act synergistically to
stabilize sulfuric acid clusters, as was observed for ammonia and monoamines [Glasoe et
al., 2015; Yu et al., 2012], making it difficult to isolate the contribution of a single basic
72

gas to atmospheric nucleation. Nevertheless, for most of the events at SGP, [DMA]~[Put]
or [Cad] with the [total diamine] always greater than [DMA]. Because total diamines
were more abundant than DMA and because they are more effective stabilizing agents,
diamines likely contributed significantly, perhaps predominantly, to nucleation.
Particle formation from a single acid and single base depends on the relative
uptake rates of acid and base, which varies in proportion to [B]/[A1]o. The ability of base
molecules to stabilize sulfuric acid clusters and reduce evaporation rates plays a dominant
role for nucleation in acid-rich environments, where particle formation is limited by base
uptake. Here we observed that diamines react with sulfuric acid to produce 10 times more
particles than DMA and 100 times more than MA, clearly signifying that diamines are
more potent nucleating agents. In addition, our results indicate that under the conditions
investigated, just one diamine molecules is needed to form a stable particle while more
than one monoamine molecule is required. Field measurements in rural Oklahoma reveal
that concentrations of total diamines typically exceeded those of DMA. We conclude that
diamines likely contribute significantly towards atmospheric nucleation and warrant
consideration in future nucleation research.
73

25
50
75
100
50
100
150
200
10
20
30
40
50
4/18/2013
4/20/2013
4/22/2013
4/24/2013
4/26/2013
4/28/2013
4/30/20135/2/2013
5/4/20135/6/2013
5/8/2013
5/10/2013
5/12/2013
5/14/2013
5/16/2013
5/18/2013
1E+04
1E+05
1E+06
1E+07
1E+08
DMA
[B] (
pptv
)
Put
Cad
(1) (2) (3) (4) (5) (6) (7) (8) (9) (10)
[Sul
furic
aci
d] (c
m-3)
Sulfuric Acid
Figure 14 Measured amine and sulfuric acid concentration during the SGP field campaign of spring, 2013. The vertical lines indicate the start of a nucleation event. The gray box indicates when the Cluster CIMS was not operating. The numbers at the top identify specific events.
4.5 Methods
Laboratory experiments were conducted in a well-characterized, extraordinarily
clean, and highly repeatable flow reactor [Jen et al., 2014; Zollner et al., 2012] that was
operated at 296 K and 28% relative humidity. Sulfuric acid vapor was produced by
passing clean nitrogen over a sulfuric acid reservoir and injected at the top of the reactor.
Each basic gas was injected into the centerline of the sulfuric acid flow. The basic gas
mixed and reacted with the sulfuric acid vapors, and the particle size distributions along
the centerline of the flow reactor were measured with a diethylene glycol mobility
74

particle sizer (DEG SMPS) after ~40 s f . The operating parameters and sources of
uncertainties of the DEG SMPS have been described previously [Glasoe et al., 2015; Jen
et al., 2015; Jiang et al., 2011b]. The region where basic gas initially encounters and
mixes with the sulfuric acid flow is known as the nucleation zone (NZ); the initial
sulfuric acid concentration in the NZ, [A1]o, is set by the flow rate over the sulfuric acid
reservoir. The value of [A1]o has been estimated by computational fluid dynamics [Panta
et al., 2012] and compared to the measured value at the exit of the flow reactor [Panta et
al., 2012; Zollner et al., 2012]. We estimate the systematic uncertainty of [A1]o to be a
factor of two[Glasoe et al., 2015]. This uncertainty would affect all of our measurements
equally and therefore would not change the conclusions presented in this study. Small
random variations contribute additional estimated uncertainties in [A1]o of 20%. TMEDA
and Put vapor were taken from diffusion tubes where clean nitrogen was passed over a
tee connected, via a ~10 cm length of a ~1.5 mm ID tube, to a temperature controlled
liquid reservoir of the compound. EDA, DMA, and MA were produced by flowing clean
nitrogen over permeation tubes [Freshour et al., 2014]. The dilution and measurement of
basic gas concentrations have been described previously [Freshour et al., 2014; Jen et
al., 2014; Zollner et al., 2012]. Estimated uncertainties of ~25% on reported [B] are
shown in Figure 1 and were based upon comparing measured [B] via chemical ionization
mass spectrometry with measured base permeation/diffusion rates [Jen et al., 2014].
During the SGP campaign, amines were measured using the AmPMS [Freshour et al.,
2014; Hanson et al., 2011] (see supplementary section S5). Sulfuric acid concentration
was monitored with the Cluster CIMS using nitrate as the chemical ionization ion [Chen
et al., 2012]. The nucleation events were measured by scanning mobility particle sizers.
f Jen et al. (2014) reported Cluster CIMS measurements of clusters formed from sulfuric acid and various bases following a 3 s reaction time. In the current study, 40 s was used to allow particles to grow to well into the size range accessible to the DEG SMPS.
75

4.6 Supporting Informationg
4.6.1 Effects of [A1]o on Ntot at Fixed [B]
Figure S18 shows Ntot as a function of [A1]o, with [B] held constant at 4 pptv.
Higher [A1]o leads to more particles produced for all bases, with Ntot reaching a limit at
high [A1]o due to particle coagulation losses. Specifically at low [A1]o=1.5x109 cm-3, the
three diamines produce ~10 times more particles than DMA. As [A1]o increases, the
differences between the diamines and monoamines lessen.
1E9 1E10
1E+05
1E+06
1E+07
[B]=4 pptv, 9.6e7 cm-3
EDA TMEDA Put DMA MA
Tota
l par
ticle
con
cent
ratio
n, N
tot (
cm-3)
Sulfuric acid concentration, [A1]o (cm-3)
Figure S18 Total particle number concentration as a function of [A1]o. Each color/symbol represents a different base compound at 4 pptv. The estimated random uncertainties are given for MA but represent all measurements.
4.6.2 [B]/Ntot, [A1]o/Ntot, and np for TMEDA and Put
Figure S19 provides TMEDA and Put versions Figure 13 from the main text. These
two diamines exhibit the same [B]/Ntot and [A1]o/Ntot trends as EDA whereby the
particles are very acidic at low [B]/[A1]o and require one diamine to form a stable
particle. From this graph and Figure 13, we conclude that diamines are capable of
stabilizing more sulfuric acid molecules than monoamines and are thus more potent
nucleating agents.
g This supporting information is reproduced from Jen, C. N., Bachman, R., Zhao, J., McMurry, P. H., and Hanson, D. R..: Diamine-sulfuric acid reactions are a potent source of atmospheric particle formation, Nature Geoscience, under review. 2015
76

1 10 1001
10
100
1000
1 10 100
(b) Put
[B]/[
Nto
t], [A
1] o/[N
tot],
or n
p
(mol
ecul
es/p
artic
le)
[B] (top pptv, bottom cm-3)
(a) TMEDA
[A1]o=2x109 cm-3
[A1]o/Ntot
[B]/Ntot
0.01 0.1 1 0.01 0.1 1[B]/[A1]o
1E8 1E9 1E8 1E9
Figure S19 [A1]o /Ntot (filled symbol) and [B]/Ntot (open symbol) as a function of [B] (bottom x-axis, given as pptv and cm-3). [A1]o was held constant at 2x109 cm-3. [B]/[A1]o is shown on the top x-axis. Two diamines are shown: (a) TMEDA and (b) Put. Red lines illustrate the estimated number of molecules per particle, np, with the gray region showing the range of values corresponding to aqueous sulfuric acid (higher) or solid DMA+sulfuric acid (lower).
4.6.3 Size Distributions for Particles Formed from Sulfuric + Mono or Diamines
Figure S20 illustrates how [A1]o alters the measured size distribution with [B]
held constant at 4 pptv (±1 pptv) for the three diamines and two monoamines. Particle
size distributions were measured using a diethylene glycol SMPS with operating
parameters described previously [Glasoe et al., 2015; Jiang et al., 2011b]. The graph on
the left is at [A1]o=2x109 cm-3 and the right at 4x109 cm-3. The number mean diameter
increases from 2-3 nm to 4-5 nm at double the [A1]o for all bases. Specifically, sulfuric
acid+diamine particles exhibit slightly larger mean volumetric diameters (3.0 and 5.2 nm)
compared to DMA (2.8 nm and 5.1 nm) at both [A1]o. For both graphs, [B]/[A1]o<1 and
particles grow primarily by sulfuric acid uptake. Figure S20 also depicts the higher
number concentrations produced from sulfuric acid+diamines than monoamines.
77

1 101E+02
1E+03
1E+04
1E+05
1E+06
1E+07
1 10
(a)
dN/d
lnD
p (c
m-3)
Particle Mobility Diameter (nm)
(b)
EDA TMEDA Put DMA MA
Figure S20 Particle size distribution for [B]=4 pptv (9.6x107 cm-3) at two different [A1]o: (a) 2x109 cm-3 and (b) 4x109 cm-3.
4.6.4 Power Dependencies of Ntot on [A1]o and [B]
Figure S21 illustrates how Ntot increases with [diamine] at various constant [A1]o.
The slopes of the linear regressions are given in the legends. At low [A1]o for all three
diamines, the slopes are approximately 1. As [A1]o increases, these slopes decrease due
to increasing particle coagulation losses. Figure S22 shows Ntot as a function of [A1]o at
various but constant [B] for the three diamines. The slopes of the linear regression are
given in the legends and ~2 at low [B]. Similar to high [A1]o, slope values tend to be
lower at high [B]. We also attribute this to high particle coagulation losses that limit Ntot.
These two figures taken together suggest 2 1
1~ [ ] [diamine]tot oN A × . Equation S23
This contrasts with the power dependencies described in Glasoe et al. [2015] where
2.5 21~ [ ] [DMA]tot oN A × . Equation S24
They hypothesized that the formation of a stable particle requires 2-3 sulfuric
acids and 2 DMA molecules. The power dependencies for diamines suggest 2 sulfuric
acids and 1 diamine molecule. This supports our conclusion from the main paper where
[B]/Ntot for diamines are independent of [B] at low [B]/[A1]o because only one diamine
molecule is needed to form a stable particle. We hypothesize that both amine groups in a
diamine react with sulfuric acid, leading to more stable clusters than are formed from
equal amounts monoamines. 78

1 10 100
1E+06
1E+07
1 10 1 10
Nto
t (cm
-3)
[EDA] (pptv)
[A1]o (cm-3) Slope1E9 0.60.6
1.5E9 0.80.22E9 0.640.063E9 0.530.064E9 0.350.05
[A1]o (cm-3) Slope1.5E9 1.00.2
2E9 1.20.32.5E9 1.10.4
3E9 0.90.33.5E9 1.00.1
4E9 0.50.1
[TMEDA] (pptv) [Put] (pptv)
[A1]o (cm-3) Slope1E9 1.10.22E9 0.800.083E9 0.580.064E9 0.360.07
1E8 1E9[EDA] (cm-3)
1E8 1E9[TMEDA] (cm-3)
1E8 1E9[Put] (cm-3)
Figure S21 Ntot as a function of [diamine] for EDA (left), TMEDA (center), and Put (right). Each color in a panel represents a constant [A1]o, and its corresponding line represents a linear regression at a constant [A1]o. The slopes and their standard errors are given in the legends.
1E9 1E101E+05
1E+06
1E+07
1E9 1E10 1E9 1E10
PutTMEDA
[EDA] (pptv)
[EDA] (cm-3) Slope
0.8 1.9E7 2.60.61 2.9E7 2.30.23 6.7E7 1.80.35 1.3E7 2.20.1
11 2.6E8 1.30.420 4.8E8 1.70.350 1.2E9 0.830.3
Nto
t (cm
-3)
EDA
[A1]o (cm-3)
[TMEDA] (pptv) [TMEDA] (cm-3) Slope
1 2.4E7 1.700.032 4.8E7 1.60.24 9.6E7 0.120.087 1.7E8 1.00.2
[Put] (pptv) [Put] (cm-3) Slope
1 2.4E7 2.00.14 9.6E7 1.320.068 1.9E8 0.790.08
12 2.9E8 0.47
Figure S22 Ntot as a function of [A1]o for EDA (left), TMEDA (center), and Put (right). Each color in a panel represents a constant [B], and its corresponding line represents a linear regression at a constant [B]. The [B] are given in both pptv and cm-3. The slopes of the regressions are given in the legends.
79

4.6.5 Measurement of Diamines in the Atmosphere
The operation and 2-hour signal averaging technique used for the AmPMS have
been described previously [Freshour et al., 2014]. In addition, the diamine concentrations
displayed in Figure 14 of the main paper have been corrected for possible interference
from other isobaric compounds. These compounds are likely organic and not basic. We
measured the fraction of the protonated diamine signal due to a diamine by adding an
acid scrubber onto the inlet of the AmPMS. The acid scrubber consists of a tube coated
with either liquid phosphoric or sulfuric acid. The scrubber efficiently removed diamines
from the sample flow, leaving only non-basic compounds to be detected by the AmPMS.
The acid scrubber was added onto the inlet after the SGP field campaign where we
sampled outdoor air during spring, 2014 in Minneapolis, MN. Its efficiency for removal
of basic gases was high based on the behavior observed for ammonia and amines.
Table S3 lists the average fractional amounts of various diamine signals that were
removed by the acid scrubber, i.e. fraction of signal due to a diamine. The values of Put
and Cad concentrations shown in Figure 14 were obtained by multiplying measured
signals by their corresponding fractions. As the acid scrubber was not added until after
the SGP campaign, it is possible this correction method does not accurately account for
the mixture of compounds that may have existed at SGP and their temporal dependence,
so the diamine concentrations in Figure 14 should be regarded as our best estimate.
Table S3 Summary of diamine signal from a dozen acid scrubber experiments in Minneapolis, spring 2014
Diamine, abbrev. Mass, amu Diamine fraction of signal
Average abundance (pptv)
Ethylenediamine, EDA 60 0.45 1.0 Propanediamine, PDA 74 No signal 0
Putrescine, Put 88 0.75 1.3 Cadaverine, Cad 102 0.75 5.9
Hexanediamine, HDA 116 0.34 3.9
80

Chapter 5. Cluster Formation of Sulfuric Acid with Dimethylamine
or Diamines and Detection with Chemical Ionization
5.1 Overview
Chemical ionization (CI) mass spectrometers are used to study atmospheric
nucleation by detecting clusters produced in the reactions of sulfuric acid and various
basic gases. These instruments typically used nitrate to chemically ionize clusters for
detection. In this study, we compare measured cluster concentrations formed by reacting
sulfuric acid vapor with either dimethylamine, ethylene diamine, tetramethylethylene
diamine, or butanediamine (also known as putrescine) using nitrate and acetate ions. We
show from flow reactor measurements that nitrate is unable to chemically ionize clusters
with weak acidities. We then model the neutral and ion cluster formation pathways,
including chemical ionization, ion-induced clustering, and ion decomposition, to better
identify which cluster types cannot be chemically ionized by nitrate. Our results show
that sulfuric acid monomer containing one diamine, sulfuric acid dimer with two
diamines, and sulfuric acid trimer with 2 or more base molecules cannot be chemical
ionized by nitrate. We conclude that cluster concentrations measured with acetate CI
gives a better representation of both cluster abundancies and their base content than
nitrate CI.
5.2 Introduction
Atmospheric nucleation is an important source of global atmospheric particles
[IPCC, 2014]. In the atmospheric boundary layer, most nucleation occurs when sulfuric
acid [Kuang et al., 2008; Kulmala et al., 2004; Riipinen et al., 2007; Weber et al., 1996]
and its clusters react with other trace compounds to produce stable, electrically neutral
molecular clusters; these compounds include ammonia [Ball et al., 1999; Coffman and
Hegg, 1995; Kirkby et al., 2011], amines [Almeida et al., 2013; Glasoe et al., 2015; Zhao
et al., 2011], water [Leopold, 2011], and oxidized organics [Schobesberger et al., 2013].
Stable clusters subsequently grow and can serve as cloud condensation nuclei. The
primary instruments used for detecting freshly nucleated, sulfuric acid-containing clusters
81

are atmospheric pressure chemical ionization mass spectrometers (CIMS) such as the
Cluster CIMS [Chen et al., 2012; Zhao et al., 2010] and the CI atmospheric pressure
interface-time of flight mass spectrometer (CI-APi-ToF) [Jokinen et al., 2012]. Both
mass spectrometers use nitrate (NO3- with ligands) to chemically ionize neutral sulfuric
acid clusters. The detected ion clusters are then assumed to represent the neutral cluster
composition, and the signal ratio of the ion cluster to the reagent ion translates to the
neutral cluster concentration [Berresheim et al., 2000; Eisele and Hanson, 2000; Hanson
and Eisele, 2002].
The amounts and types of ions detected by the mass spectrometer are determined
by four key processes: neutral cluster formation, chemical ionization, ion-induced
clustering, and ion decomposition. The first process, neutral cluster formation, follows a
sequence of acid-base reactions [Almeida et al., 2013; Chen et al., 2012; Jen et al., 2014]
whereby sulfuric acid vapor and its clusters react with basic molecules to produce more
stable clusters than sulfuric acid alone. The concentration of a specific cluster type
depends on its stability (i.e. evaporation rates of the neutral cluster) and on concentrations
of the precursor vapors (i.e. the formation rate).
Neutral clusters then need to be ionized to be detect by a mass spectrometer. In
most prior work, this has been accomplished by chemical ionization with the nitrate ion
whereby the neutral clusters are exposed to nitrate ions for a set amount of time known as
the chemical ionization reaction time. Chemical ionization (CI) can be conceptualized as
another acid-base reaction where an acid (sulfuric acid) donates a proton to the basic
reagent ion (nitrate, the conjugate base of nitric acid). To illustrate, the CI reaction of a
sulfuric acid dimer, (H2SO4)2, is shown in Reaction 4.
( ) ( )
( )2
2 4 2 3 32
4 2 4 3 2 2
xk
H SO DMA H O HNO NO
HSO H SO DMA HNO x H O
−
−
• • + •
→ • • + + Reaction 4
This dimer of sulfuric acid contains a dimethylamine (DMA) molecule and an unknown
number of x water molecules. Water molecules evaporate upon ionization or entering the
vacuum region of the CIMS and are not detected unless temperatures are low (see Figure
82

3 in Hanson and Eisele [2002]). The forward rate constant, k2, is assumed equal to the
collision rate of 1.9x10⁻⁹ cm3 s-1 [Su and Bowers, 1973], while the reverse rate constant is
zero. Other ligands may attach to the reagent ion and decrease the collision rate, but
nitrate is assumed to be the major reagent ion. Reaction 4 can be extended to CI reactions
for larger neutral clusters of sulfuric acid and implicitly assumes that every collision
between nitrate and sulfuric acid cluster results in an ionized cluster. However Jen et al.
[2015] showed that nitrate CI, with the stated assumptions, leads to significantly lower
concentrations of clusters that contain 3-5 sulfuric acid molecules and DMA compared to
results using acetate reagent ions. Furthermore, the concentrations of clusters detected
using acetate are in overall better agreement with values measured using a diethylene
glycol mobility particle sizer (DEG MPS). As no other experimental conditions changed
except the CI reagent ion, we hypothesize that nitrate has a lower proton affinity and is
less able to chemically ionize clusters (i.e., a non-zero reverse rate constant) with near
equal amounts of sulfuric acid and base than acetate CI. Poor CI efficiency reduces the
amount and types of ions detected by the mass spectrometer.
After neutral clusters are ionized, the resulting ion may be unstable and quickly
decompose. Experimental studies have shown ion decomposition in the ammonia-sulfuric
acid system at 275 K [Hanson and Eisele, 2002], with computational chemistry studies
showing that ion decomposition may occur during the CI reaction time scales [Kurtén et
al., 2011; Lovejoy and Curtius, 2001; Ortega et al., 2014]. These studies demonstrate that
base molecules often evaporate from sulfuric acid+base ion clusters. After the CI reaction
given above, the sulfuric acid dimer ion with 1 DMA molecule will likely decompose
into the bare sulfuric acid dimer ion.
4 2 4 4 2 4dEHSO H SO DMA HSO H SO DMA− −• • → • + Reaction 5
The decomposition rate, Ed, for Reaction 5 is fast at ~100 s-1 at 298 K [Ortega et al.,
2014]. Therefore, the mass spectrometer will detect the neutral sulfuric acid dimer with 1
DMA as the bare dimer ion at room temperature.
83
The bare sulfuric acid dimer ion can also be produced by ion-induced clustering
(IIC). In general, IIC occurs when the sulfuric acid ion (HSO4-), formed by CI of sulfuric
acid monomer (with ligands), reacts with H2SO4 or its clusters. The signal due to these
IIC products must be subtracted from signals measured by mass spectrometry to
determine neutral cluster concentrations. Specifically, the sulfuric dimer ion can be
formed via the IIC pathway given in Reaction 6.
4 2 4 4 2 4ckHSO H SO HSO H SO− −+ → • Reaction 6
The forward rate constant, kc, is the collision rate constant of 2x10⁻⁹ cm3 s-1. IIC produced
dimer ion is identical to a dimer ion formed by CI of the neutral dimer. A method has
been developed to correct for IIC based upon measured sulfuric acid vapor concentrations
and CI reaction time [Chen et al., 2012; Hanson and Eisele, 2002]. However, the
bisulfate ion may not cluster with and charge all neutral clusters formed by reactions of
sulfuric acid and basic compounds, as the proton affinity of the neutralized sulfate salts
may be too high to form a bisulfate-ligand bond. If so, assuming the collision rate for
reactions such as Reaction 6 would lead to an over-correction of the neutral cluster
concentrations. As the thermodynamic properties of all cluster types composed of sulfuric
acid and various bases are virtually unknown, evaluating the propensity of these IIC
reactions is difficult and cannot be modeled with certainty.
Measured CIMS signals reflect the combined influences of all these processes,
with each occurring on time scales that depend on the chemistry, experiment, and
measurement technique. Assuming one process is dominant for all processes can lead to
large errors in reported neutral cluster composition and concentrations. Here we examine
all four processes, neutral cluster formation, chemical ionization, IIC, and ion
decomposition that influence the abundance of ion clusters composed of sulfuric acid and
various bases. These bases include DMA, ethylene diamine (EDA), tetramethylethylene
diamine (TMEDA), and butanediamine (also known as putrescine, Put). The diamines, a
previously unstudied class of basic compounds, react with sulfuric acid vapors to produce
higher particle concentrations than monoamines (Chapter 4). We present observations
that 1) show a clear difference between acetate and nitrate CI for the larger cluster sizes 84

and 2) provide evidence of ion decomposition. Also presented are modeling results in
order to identify possible neutral cluster formation pathways, those cluster types that do
not undergo nitrate CI, and clusters that are formed by IIC.
5.3 Method
Sulfuric acid clusters containing either DMA, EDA, TMEDA, or Put were
produced in an extremely clean and repeatable flow reactor as detailed in Jen et al.
[2014]. Each basic gas was injected into the flow reactor at a point to yield ~3 sec
reaction time between the basic gas and sulfuric acid vapor (see Jen et al. [2014] for a
schematic). The initial sulfuric acid concentration ([A1]o) before basic gas reaction was
set at specified concentrations. The basic gas concentration ([B]) was measured by the
Cluster CIMS in positive ion mode (see SI of Jen et al. [2014] for further details) and
confirmed with calculated concentrations [Zollner et al., 2012]. The basic vapors were
produced by passing clean nitrogen gas over either a permeation tube (for DMA and
EDA) or liquid reservoir of a diamine. The basic gas was then diluted in a process
described in Zollner et al. [2012]. The temperature of the flow reactor was held constant
throughout an experiment but varied day-to-day from 295-305 K to minimize natural
convection swirls near the Cluster CIMS sampling region. The relative humidity was
maintained at ~30%.
Two types of experiments were conducted. The first set followed closely to those
detailed in Jen et al. [2014] where the base, base concentration ([B]), and [A1]o were
varied. The resulting concentrations were measured with the Cluster CIMS using either
nitrate or acetate as the CI reagent ion. Nitrate and acetate were respectively produced by
passing nitric acid vapor and acetic anhydride vapors over Po-210 sources. Different Po-
210 sources were used for the acetate and nitrate to avoid cross-contamination. The
cluster concentrations were calculated by using calculated CI reaction time based upon
inlet dimensions and electric field strength, measured and extrapolated mass-dependent
sensitivity (see Supporting Information), and the collision rate constant between CI ion
85
and sulfuric acid clusters (see Jen et al. [2014] and [2015] for a discussion on the data
inversion process). The CI reaction time was 18 ms for nitrate and 15 ms for acetate.
The second set of experiments focused on varying the CI reaction time at fixed
[B] and [A1]o. CI reaction time was increased by decreasing the electric field used to
draw ions across the sample flow into the inlet. Similar experiments have been previously
performed on other atmospheric pressure mass spectrometers [Hanson and Eisele, 2002;
Jen et al., 2014; Zhao et al., 2010].
5.4 Acetate vs. Nitrate Comparison
Figure 15 shows the comparison between cluster concentrations measured by
acetate (solid bars) and nitrate (hashed bars) at a constant [A1]o=4x109 cm-3 for four
different [DMA]. Bars are shown for clusters that contain a given number of sulfuric acid
molecules in a cluster (N1 is the monomer, N2 is the dimer, etc.), while the number of
DMA molecules per cluster is indicated by color (e.g., A4-•DMA0–3). The notation used
here differs slightly from [Jen et al., 2014] such that [Nm] denotes the total concentration
for clusters that contain m sulfuric acids molecules (i.e., [Nm]=[Am]+[Am•B1]+Am•B2]…)
and Am•Bj represents a specific sulfuric acid (A) cluster type with m sulfuric acid
molecules and j basic molecules (B). A logarithmic axis is used for [N1] and [N2], while
the larger cluster concentrations are given on a linear scale. The measured [N1] and [N2]
obtained using nitrate and acetate are in good agreement for DMA. As DMA is a strong
base in comparison to ammonia, methylamine (MA), DMA, or trimethylamine, these
results gives us confidence in the accuracy of previously reported values of [N1] and [N2]
in [Jen et al., 2014] at high [A1]o.
Figure 16, 17, and 18 show the acetate and nitrate comparison for EDA, TMEDA,
and Put, respectively. Nitrate always detects lower [N1] and [N2] than acetate by up to a
factor of 4. These comparisons strongly suggest that nitrate does not detect all N1 and N2
in the presence of diamines. As only bare sulfuric acid cluster type was detected for both
sizes, we cannot determine which neutral clusters types cannot be CI by nitrate. Thus
more sensitive experiments that help separate out each formation pathway (i.e. variations
86

in CI reaction time detailed below) will allow us to examine the CI efficiency of N1 and
N2.
Figure 15 through 18 clearly show that more of the larger clusters (N3 and higher)
were detected by acetate CI than nitrate. For all bases, the measured [N3] by acetate is up
to a factor of 10 higher than concentrations measured by nitrate CI. Nitrate did not detect
any types of N4 or N5, probably because the ionized [N4] and [N5] fell below detection
limits (<105 cm-3). In addition as [B] increases, the differences between acetate and
nitrate cluster concentrations become more pronounced. This likely occurs because
sulfuric acid clusters become more chemically neutral as [B] increases, thereby
decreasing their tendencies to donate protons to nitrate ions. We conclude that acetate
more efficiently chemically ionizes the larger cluster population than nitrate.
The large difference between nitrate and acetate measured [N3] and [N4] provide a
better understanding of previous atmospheric measurements. Chen et al. [2012] and Jiang
et al. [2011c] published [N3] and [N4] measured by a larger version of the Cluster CIMS
[Zhao et al., 2010]. For both studies, the measurements were conducted using nitrate CI
and only at the clusters’ bare masses (A3 and A4). These measurements may have under-
detected the amount of trimer and tetramer in the atmosphere, though this is uncertain
because the atmosphere contains numerous compounds that may behave differently than
DMA and diamines. If the actual concentrations of trimer and tetramer were higher than
those reported by Zhao et al. [2010], then the fitted evaporation rate of E3=0.4 s-1 from
Chen et al. [2012] would be lower and be closer to 0 s-1 reported by Kürten et al. [2014].
Comparing these results to the CLOUD experiments, the clusters detected via
nitrate CI using the Cluster CIMS differ from those detected by nitrate using the CI-APi-
ToF [Kürten et al., 2014]. They observed clusters that contained near equal number of
sulfuric acid and DMA molecules (e.g., A3•DMA2). Our experiments suggest that such
highly neutralized clusters are not ionized by nitrate. We do not yet understand why we
were unable to detect highly neutralized large clusters by nitrate chemical ionization
while Kürten et al. [2014] were. The Cluster CIMS and CI-APi-ToF use different
87

approaches to produce the reagent ions, and this could be one reason for the differences.
Kürten et al. [2014] use corona discharge to ionize nitric acid to produce nitrate whereas
the Cluster CIMS uses a Po-210 source. The corona discharge may produce ions in
addition to nitrate that ionize neutral sulfuric acid clusters. Also, their experiments were
conducted at a lower temperature of 278 K which may lead to more stable ions than at
300 K.
1E+05
1E+06
1E+07
1E+08
1E+09
1E+10 Acetate
N2N1 N5
[DMA]=2 pptv
N4
[N1]
and
[N2]
conc
entra
tions
(cm
-3)
N3
0
1E7
2E7
3E7
4E7
5E7
6E7
7E7
8E7
[N3 ], [N
4 ], [N5 ] concentrations (cm
-3)
0 DMA 1 DMA 2 DMA 3 DMA 4 DMA
Nitrate
100%
100%
100%
100%
70%
20%
32% 63
%20
%
26%
1E+05
1E+06
1E+07
1E+08
1E+09
N2N1 N5
[DMA]=5 pptv
N4[N
1] an
d [N
2] co
ncen
tratio
ns (c
m-3)
N3
0
1E7
2E7
3E7
4E7
5E7
6E7
7E7
8E7
9E7
[N3 ], [N
4 ], [N5 ] concentrations (cm
-3)
100%
100%
100%
100%
75%
18%
38%
62%
78%
18% 51
%
1E+05
1E+06
1E+07
1E+08
1E+09
N2N1 N5
[DMA]=55 pptv
N4N3
0.0
2.0E7
4.0E7
6.0E7
8.0E7
1.0E8
1.2E8
1.4E8
100%
100% 10
0%10
0%
87%
11%
23%
5%94
%
90%
1E+05
1E+06
1E+07
1E+08
1E+09
N2N1 N5
[DMA]=110 pptv
N4N3
100%
100%
100%
100%
86%
11%
97%
2%
93%
0.0
2.0E7
4.0E7
6.0E7
8.0E7
1.0E8
1.2E8
1.4E8
Figure 15 Comparison of cluster concentrations measured using acetate (solid bars) and nitrate (hashed bars) reagent ions at four different [DMA] and constant intial [A1]o=4x109 cm-3. [N1] and [N2] are on a log scale (left y-axis), while the larger clusters are on a linear scale (right y-axis). Each color in the bar represent the measured number of DMA molecules in the cluster. The percentages indicate the fraction of each cluster type compared to the total concentration of a cluster of a specified size.
88

1E+01
1E+03
1E+05
1E+07
1E+09
N6N2N1 N5
[EDA]=8 pptv
N4
[N1]
and
[N2]
(cm
-3)
N3
0.0
2.0E7
4.0E7
6.0E7
8.0E7
1.0E8
100% 94
%
12%
67%
6%
12%
[N3 ], [N
4 ], [N5 ], [N
6 ] (cm-3)
100%
100%
100%
100%
80%
100%8%
55%
40%
1E+01
1E+03
1E+05
1E+07
1E+09
N6N2N1 N5
[EDA]=60
N4
[N1]
and
[N2]
(cm
-3)
Acetate
N3
15%
79%
6% 100% 10
0%56%
37%
7%
14%
60%
94%
0.0
2.0E7
4.0E7
6.0E7
8.0E7
1.0E8
[N3 ], [N
4 ], [N5 ], [N
6 ] (cm-3)
3 EDA 2 EDA 1 EDA 0 EDA10
0%10
0%
100%
100%
Nitrate
Figure 16 Comparison of cluster concentrations measured using acetate (solid bars) and nitrate (hashed bars) reagent ions at two different [EDA] and constant intial [A1]=4x109 cm-3. [A1] and [A2] are on a log scale (left y-axis), while the larger clusters are on a linear scale (right y-axis). Each color in the bar represent the number of EDA molecules in the cluster.
1E+05
1E+06
1E+07
1E+08
1E+09
1E+10
100%
67%
99%
8%
85% 90
%
100%
100%
[TMEDA]=5 pptv
[N1]
and
[N2]
(cm
-3)
N1 N2 N3 N4 N5
100%
100%
0
1E7
2E7
3E7
4E7
5E7
[N3 ], [N
4 ], [N5 ] (cm
-3)
1E+05
1E+06
1E+07
1E+08
1E+09
77%
[TMEDA]=35 pptv
[N1]
and
[N2]
(cm
-3) Acetate
N1 N2 N3 N4 N5
100%
100% 10
0%10
0%0.0
2.0E7
4.0E7
6.0E7
8.0E7
77%
99%
2 TMEDA 1 TMEDA 0 TMEDA
[N3 ], [N
4 ], [N5 ] (cm
-3)
Nitrate
Figure 17 Comparision of cluster concentrations measured using acetate (solid bars) and nitrate (hashed bars) reagent ion at two different [TMEDA] and [A1]o=4x109 cm-3. [N1] and [N2] are on a log scale (left y-axis) ,while the larger clusters are on a linear scale (right y-axis). Each color in the bar represent the number of DMA molecules in the cluster.
1E+05
1E+06
1E+07
1E+08
1E+09
100%
100%
100%
0 Put
[Put]=3 pptv
[N1]
and
[N2]
(cm
-3)
Acetate
A1 N2 N3 N4 N5
100%
9 9%
100%
99%
99%
82%
0
1E7
2E7
3E7
4E7 3 Put 2 Put 1 Put [N
3 ], [N4 ], [N
5 ] (cm-3)
Nitrate
1E+05
1E+06
1E+07
1E+08
1E+09
1E+10
1%
[Put]=8 pptv
[N1]
and
[N2]
(cm
-3)
N1 N2 N3 N4 N5
100%
99%
1%
100%
100%
97%
3%10
0%
0.2%
32%
68%
100%
79%
0.0
4.0E7
8.0E7
1.2E8
1.6E8
2.0E8
[N3 ], [N
4 ], [N5 ] (cm
-3)
Figure 18 Comparison of cluster concentration mesaured using acetate (solid bars) and nitrate (hashed bars) reagent ions at two different [Put] and [A1]o=4x109 cm-3. [N1] and [N2] are on a log scale (left y-axis), while the larger clusters are on a linear scale (right y-axis). Each color in the bar represent the number of DMA molecules in the cluster.
89

Chemical ionization efficiency clearly plays a role in both the types and amounts
of clusters detected. However to obtain the concentrations in Figure 15 through 4, we
assumed negligible contributions of IIC and ion decomposition. Testing the validity of
these assumptions requires examining the ion behavior as a function CI reaction time and
comparing the differences between bases. We attempt to model the complex series of
reactions that govern neutral cluster formation, chemical ionization, IIC, and ion
decomposition in order to explain observed phenomena. These models likely
oversimplify all the chemical reactions occurring in the flow reactor, but they do provide
valuable qualitative insights into the processes that may explain observed trends. In the
following sections we use model simulations to interpret our experimental observations
for each cluster size (N1, N2, etc.).
5.5 Monomer, N1
Over the 3 s acid-base reaction time in this flow reactor, initial N1 is depleted as it
forms larger clusters/particles or is lost to walls; N1 is formed only by evaporation of
larger clusters. Thus, the change of [N1] as a function of acid-base reaction time is
straight forward (see Supporting Information, SI). Computational chemistry predicts only
two types of monomer will form between sulfuric acid and DMA: A1 and A1•DMA. The
latter has an evaporation rate of 10-2 s-1 and a long lifetime of ~100 s [Ortega et al.,
2012]. However the ion A1-•DMA is very unstable with an evaporation rate of 109 s-1
[Ortega et al., 2014]. Therefore, even if A1•DMA is a significant fraction of the total
monomer concentration, the Cluster CIMS will only detect the monomer as A1- due to
DMA evaporation from the ion. This agrees with our experimental observations (Figure
15) as A1-•DMA (142 m/z) was not detected with either acetate or nitrate CI and all
monomer signals were detected at the bare sulfuric acid mass (with nitric acid ligand in
the nitrate CI case). No computational studies exist for sulfuric acid+diamines but we
assume that A1 and A1•diamine constitute the population of monomers.
The monomer ions are only formed by the CI of neutral N1. If all types of N1
instantly decompose into A1- upon ionization (i.e. [N1
-]=[A1-]), then amount of neutral
90

[N1] is linearly proportional to the signal ratio of the sulfuric acid monomer (S160) to the
reagent ion (S125 for nitrate) [Berresheim et al., 2000]. The signals represent the ion
concentrations but take into account the mass-dependent sensitivity of the mass
spectrometer. See SI for detailed derivation of Equation 7 and discussion on mass-
dependent sensitivity. S160/S125 as a function of CI reaction time, t, is given in in Equation
7, which is used to determine the neutral [N1].
[ ]1601 1
125
S k N tS
= Equation 7
For nitrate, k1=1.9x10⁻⁹ cm3 s-1[Viggiano et al., 1997] and is assumed constant for
all types of monomers. Equation 7 assumes negligible depletion of the reagent ion and
neutral N1. Figure 19 shows the signal ratios as a function of t for DMA and EDA as
detected by nitrate CI at equivalent [A1]o=4x109 cm-3. TMEDA and Put graphs look very
similar to EDA (see SI). At long t, more of [N1] is chemically ionized, leading to higher
S160/S125. As [B] increases, both the signal ratios and the slopes of the lines decrease. We
interpret this to indicate that [N1] is depleted by the formation of more larger clusters as
concentrations of the basic gas increase.
0.00 0.02 0.04 0.06 0.080.0
0.1
0.2
0.3
0.4
0.5
0.6
0.00 0.02 0.04 0.06 0.08 0.10
[DMA] (pptv)082470
S 160/S
125
Time, t (s)
y=(4.9±0.2)x+(0.022±0.008)y=(2.35±0.06)x+(0.017±0.003)y=(1.04±0.04)x+(0.072+±0.002)y=(0.45±0.01)x+(0.004±0.0005)
y=(4.9±0.2)x+0.022±0.008[EDA] pptv
0 5 81590
y=(4.20±0.09)x+0.005±0.005
y=(3.20±0.08)x+0.016±0.005y=(1.74±0.02)x+0.005±0.001y=(1.05±0.02)x+0.005±0.001
Figure 19 Measuerd S160/S125 as a function of CI reaction time for DMA (left) and EDA (right) as measured by nitrate CI at [A1]o=4x109 cm-3.
Combining the results from acetate vs. nitrate comparisons with Figure 19, we can
outline a model that encompasses the depletion and CI of neutral monomer. We know
91

sulfuric acid+DMA produces monomers that are equally detected by nitrate and acetate.
In contrast, sulfuric acid with diamines produces one or more types of monomer that
cannot be detected by nitrate CI. Based upon the high computed evaporation rate of
A1•DMA2, we hypothesize that the monomers are A1 and A1•diamine. Since diamines
contain two amine groups, A1•diamine is likely too basic to donate a proton to NO3-. The
Cluster CIMS operating in positive ion mode, with protonated water clusters as the
reagent ion ((H2O)1-3•H3O), detects [A1•diamine+] at ~10% of the [A1-•diamine] and may
help account for the invisible N1 fraction with nitrate CI. Concentrations were calculated
using similar logic as Equation 7 with further positive ion discussion provided in SI.
Following scheme 2 of Jen et al. [2014], we posit the likely monomer pathways in Table
5.
Table 5 Summary of possible pathways for neutral monomer formation and chemical ionization
Neutral formation Nitrate CI and ion decomposition
DMA and Diamines:
11
k
EA B AB→+ ←
DMA:
1 3 1
1 3 1 1
c
c
k
k fast
A NO A
A DMA NO A DMA A
− −
− − −
+ →
• + → • →
Diamines:
1 3 1
1 3 1diamine diamine
ckA NO AA NO A
− −
− −
+ →
• + → •
The neutral cluster balance equations can be solved at the 3 s acid-base reaction
time for [A1] and [A1•B], and the CI balance equations at the 18 ms CI reaction time to
solve for the ion concentrations. Ion decomposition was implicitly taken into account by
assuming the base molecule instantly evaporates upon ionization. The model also takes
into account monomer depletion via wall deposition, particle coagulation, and IIC. Figure
20 displays the modeled results for DMA and EDA at the [B] an [A1]o that were used for
the measurements made for Figure 19. The modeled predicts a non-linear dependence of 92

S160/S125 on time that differs from Equation 7 because this model takes into account [N1]
and [NO3-] depletion. In addition, the predicted values of S160/S125 and their dependence
on [B] are in good qualitative agreement with observations. However, the amount of N1
that is not chemically ionized by nitrate depends heavily on evaporation rate of
A1•diamine and requires a better estimate of E1 than is currently available.
0.00 0.02 0.04 0.06 0.080.000.050.100.150.200.250.300.35
0.00 0.02 0.04 0.06 0.08
S 160/S
125
DMA=0 pptv 8 24 70
EDA=0 pptv 5 8 15 90
CI reaction time, t (s)
Figure 20 Modeled S160/S125 as a function of CI reaction time at equivalent concentrations as Figure 19.
5.6 Dimer, N2
Modeling neutral dimer concentrations is more complicated as it can be formed
from two types of monomer and the dimer types may evaporate at different rates. For
sulfuric acid+DMA, the N2 likely exists as A2•DMA or A2•DMA2 with both cluster types
equally stable [Ortega et al., 2012]. However, the DMA evaporation rate of A2-•DMA2
and A2-•DMA are, respectively, 108 s-1 and 102 s-1 [Ortega et al., 2014]. Therefore, all
chemically ionized N2 will be detected at A2-. This mirrors our experimental observations
as all sulfuric+DMA dimers are detected at A2- mass (195 m/z). We suspect the diamine
molecule also evaporates from A2-•diamine as we only measure dimers as A2
-. This is
supported by our positive ion data where we observe A2•diamine+ at approximately equal
concentrations of A2- detected by nitrate CI (see SI for positive ion results). Also, the
nitrate vs. acetate comparisons show that some fraction of [N2] is not chemically ionized
by nitrate. Following the same logic used for the monomer, we hypothesize that
A2•diamine2 is too basic to undergo nitrate CI. We also detect A2•diamine2+ at ~10% of
nitrate detected [A2-].
93
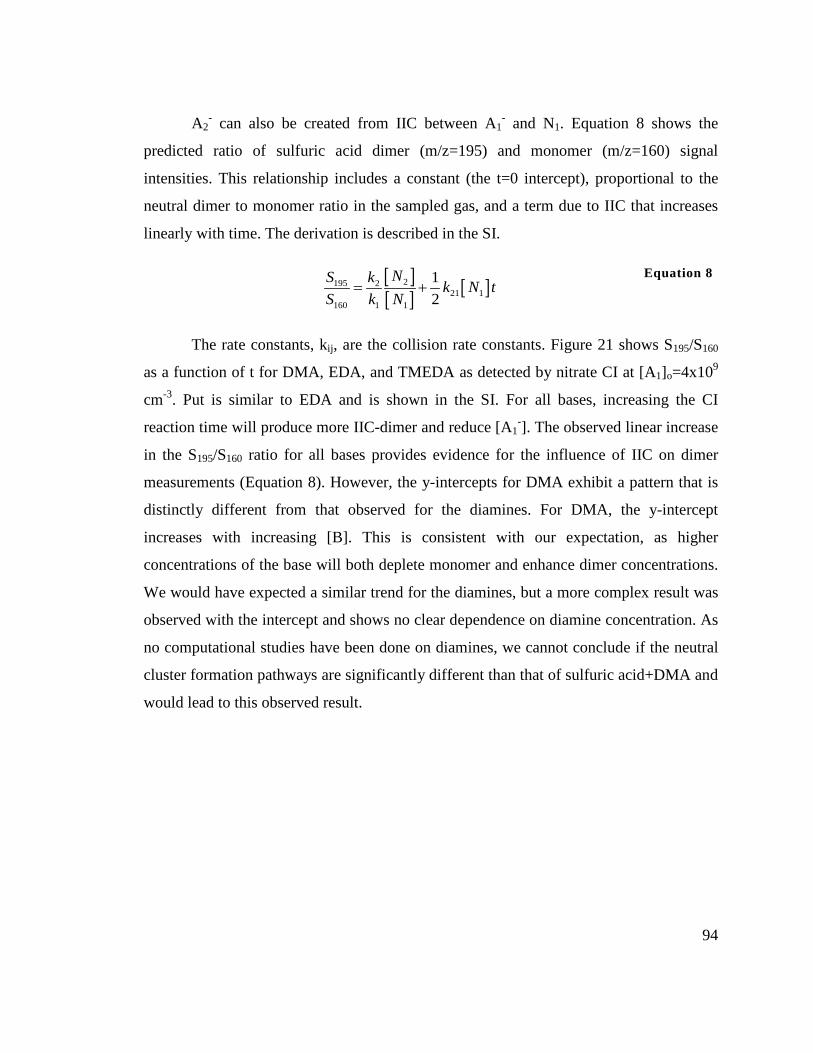
A2
- can also be created from IIC between A1- and N1. Equation 8 shows the
predicted ratio of sulfuric acid dimer (m/z=195) and monomer (m/z=160) signal
intensities. This relationship includes a constant (the t=0 intercept), proportional to the
neutral dimer to monomer ratio in the sampled gas, and a term due to IIC that increases
linearly with time. The derivation is described in the SI.
[ ][ ] [ ]2195 2
21 1160 1 1
12
NS k k N tS k N
= + Equation 8
The rate constants, kij, are the collision rate constants. Figure 21 shows S195/S160
as a function of t for DMA, EDA, and TMEDA as detected by nitrate CI at [A1]o=4x10⁹
cm-3. Put is similar to EDA and is shown in the SI. For all bases, increasing the CI
reaction time will produce more IIC-dimer and reduce [A1-]. The observed linear increase
in the S195/S160 ratio for all bases provides evidence for the influence of IIC on dimer
measurements (Equation 8). However, the y-intercepts for DMA exhibit a pattern that is
distinctly different from that observed for the diamines. For DMA, the y-intercept
increases with increasing [B]. This is consistent with our expectation, as higher
concentrations of the base will both deplete monomer and enhance dimer concentrations.
We would have expected a similar trend for the diamines, but a more complex result was
observed with the intercept and shows no clear dependence on diamine concentration. As
no computational studies have been done on diamines, we cannot conclude if the neutral
cluster formation pathways are significantly different than that of sulfuric acid+DMA and
would lead to this observed result.
94

0.00 0.02 0.04 0.06 0.080.00
0.05
0.10
0.15
0.20
0.25
0.30
0.35
0.40
0.00 0.02 0.04 0.06 0.08 0.00 0.02 0.04 0.06 0.08 0.10
[DMA] (pptv) [A1] (cm-3)4.0E+091.1E+096.2E+082.4E+08
y=(2.60±0.06)x+(0.004±0.003)
y=(1.1±0.04)x+(0.14+±0.002)
y=(0.32±0.16)x+(0.26±0.008)
0 824 70
S 195/S
160
y=(-0.23±0.22)x+(0.35±0.01) [EDA] (pptv) [A1] (cm-3)4E9
1.8E91.5E97.2E84.9E8
y=(0.37±0.10)x+0.050±0.005y=(1.00±0.03)x+0.024±0.001y=(1.86±0.06)x+0.012±0.003
0 5 8 15 90
CI reaction time, t (s)
y=(2.28±0.07)x+(0.011±0.004) [TMEDA] (pptv) [A1] (cm-3)4E9
7.5E89.8E85.7E83.6E8
y=(1.10±0.03)x+0.049±0.002
y=(0.54±0.06)x+0.11±0.003y=(0.64±0.05)x+0.088±0.003
y=(0.4±0.2)x+0.15±0.01
0 20 25 35 50
Figure 21 Measured S195/S160 as a function of CI reaction time for DMA (left), EDA (center), and TMEDA (right) detected by nitrate CI at [A1]o=4x109 cm-3. The table in each graph provides the measured [A1] at that [B]. The dotted vertical line is the CI reaction time of 18 ms used in Figure 15and Figure 16 for nitrate CI.
Identifying processes that may cause these differences requires modeling all the
reactions that form A2-. Building upon the model for the monomer given in Table 5, we
include additional dimer formation, CI, and IIC reactions. Ion decomposition was
indirectly included for the dimer as it was assumed the base molecule instantly
evaporates upon chemical ionization. However, our experimental results do not lend
enough sensitivity to determine if dimer evaporation rates affect the trends observed in
Figure 21. The dimer model is provided in Table 6.
Table 6 Summary of possible pathways for neutral and ion dimer formation
Neutral formation Nitrate CI and ion decomposition reactions
IIC reactions (only A1-)
DMA, Put, EDA: 1 2
2 2
2 2 2
k
k
k
AB A A BAB AB A BA B B A B
+ →
+ →
+ → TMEDA:
1 2
2 2
2 2 2
kAB A A BAB AB A BA B B A B
+ →+ →+ →
DMA:
2 3 2 2c
fastkA B NO A B A− − −+ → →
2 2 3 2 2 2c
fastkA B NO A B A− − −+ → →
Diamines:
2 3 2 2c
fastkA B NO A B A− − −+ → →
2 2 3 2 2A B NO A B− −+ →
All bases: 1 1 2
ckA A A− −+ →
1 2 2c
fastkA AB A B A− − −+ → →
95

Figure 22 shows modeling results for DMA, EDA, and TMEDA. The modeled
curve for [B]=0 pptv is remarkably similar to what was measured, indicating that A2- is
almost completely formed by A1-+A1 and not by the CI of A2. A2 is too unstable and does
not exist at 300 K [Hanson and Lovejoy, 2006]. The qualitative trends for each base
match those from Figure 21 by varying several key reactions. For DMA, we assumed all
clusters can undergo chemical ionization and can undergo IIC via A1- clustering. The
primary difference between DMA and EDA is the assumption that A2•EDA2 cannot be
chemically ionized. Higher [EDA] results in a larger fraction of the dimer population
existing as A2•EDA2 which would result in a lower S195/S160. The key difference between
the TMEDA and DMA model is A2•TMEDA2 does not form, probably due to one
TMEDA molecule sterically hindering the uptake of another TMEDA molecule in the
dimer. Preventing the neutral formation of A2•TMEDA2 is not equivalent to A2•B2 not
undergoing CI because the former removes a neutral monomer depletion pathway,
thereby leading to higher [A1-] (i.e. higher S160). We conclude from our modeling that the
difference between sulfuric acid+DMA dimers and diamine dimers lies in either the
formation or chemical ionization of A2•B2. Computational chemistry studies on diamines
is required to better understand these processes.
0.00 0.02 0.04 0.06 0.080.0
0.1
0.2
0.3
0.4
0.00 0.02 0.04 0.06 0.08 0.00 0.02 0.04 0.06 0.08
S 195/S
160
DMA=0 pptv 8 24 70
EDA=0 pptv 5 8 15 90
CI reaction time, t (s)
TMEDA=0 pptv 20 25 35 50
Figure 22 Modeled S195/S160 as a function of CI reaction time for DMA (left), EDA (center), and TMEDA (right) at the same concentrations used for Figure 21.
96

The model also provides an estimate on the fraction of [A2
-] formed by IIC at
t=18 ms. For DMA, IIC dimers account for <1% (less for higher [DMA]) of the total
dimer signal and agrees with the conclusions drawn in [Jen et al., 2015]. In contrast, the
IIC fraction of total dimer signal for EDA is ~50%, due to the large fraction of the dimer
population that does not undergo chemically ionization. IIC produced dimers account for
~20% of the total dimer signal for TMEDA. However, these numbers are likely highly
uncertain due to the limitations of the model. Our model is not sensitive enough to
determine if A1- can cluster with A1•B which will significantly influence the amount of
IIC dimer without significantly affecting S195/S160. Since acetate CI detects more N2 than
nitrate for the diamines (up to a factor of ~10), we believe IIC produced A2- is negligible
compared to the overall [N2]. We provide similar graphs as Figure 21 for acetate detected
N2 with TMEDA and Put in the SI.
5.7 Trimer, N3
The cluster balances describing the creation and destruction of neutral N3 are
much more complicated compared to N2. In the sulfuric acid+DMA system,
computational chemistry predicts A3•DMA, A3•DMA2, and A3•DMA3 are present after a
3 s acid-base reaction time with A3•DMA3 the most stable [Ortega et al., 2012]. For
longer reaction times, the first two types of trimer would likely evaporate. Once ionized,
A3-•DMA3 evaporates at a rate of 104 s-1 into A3
-•DMA2. A3-•DMA2 and A3
-•DMA have
lifetimes of ~1 and 100 s, respectively [Ortega et al., 2014], leading to lifetimes
comparable to the CI reaction time, given uncertainties from electronic structure
calculations. From Figure 15, nitrate only detected A3-•DMA and A3
-. We believe A3- is
primarily from IIC and A3-•DMA is from the CI of A3•DMA at the CI reaction time of 18
ms for Figure 15. The fact that nitrate CI did not detect A3-•DMA2 with its semi-long
lifetime of 1 s leads us to believe that nitrate cannot chemically ionize A3•DMA2 or
A3•DMA3. (Positive ion data for sulfuric acid+DMA is discussed in the SI). Acetate
detects a much higher [A3-•DMA] than nitrate, perhaps due to decomposition of a larger
cluster or because A3•DMA is not completely chemically ionized by nitrate. In addition,
97

acetate CI leads to A3
-•DMA2 at the highest concentration compared to the other trimer
types because A3-•DMA2 was originally A3•DMA3 before ionization.
Similar to DMA, nitrate CI only detects A3- and A3
-•diamine, with the latter at a
higher concentration. However, the types of trimer clusters detected via acetate CI have
on average 1 diamine molecule compared to 2 DMA. This may reflect differences
between DMA and diamine ion decomposition or neutral cluster formation pathway.
Based upon particle measurements, we believe one diamine molecule is able to stabilize
more sulfuric acid molecules than a DMA molecule (see Chapter 4) and would explain
the lower number of diamines in a trimer cluster.
If we assume A3- is produced from IIC of A1
-+A2•DMA and A2-+A1 (A2 does not
exist, see dimer discussion above), then signal ratio of trimer (S293) to monomer as
function of t can be written as Equation 9 (derived in the SI).
[ ][ ] [ ] [ ]23 3 23 2 32
31 2 21 31 11 1 11
1 12 6
A Nk k kk N t k k N tk N kA
−
−
= + + +
Equation 9
Figure 23 shows the nitrate measured S293/S160 as a function of CI reaction time
for DMA, EDA, and TMEDA at [A1]o=4x109 cm-3. S293/S160 curves for all bases indicate
minimal creation of A3-, likely due to IIC, in the presence of base.
0.00 0.02 0.04 0.06 0.080.000
0.005
0.010
0.015
0.020
0.025
0.030
0.00 0.02 0.04 0.06 0.08 0.00 0.02 0.04 0.06 0.08 0.10
[DMA] (pptv) 0 8 24 70
S 293/S
160
[EDA] (pptv) 0 5 8 15 90
CI Reaction Time, t (s)
[TMEDA] (pptv)0 20 25 35 50
Figure 23 Measured S293/S160 as a function of CI reaction time for DMA (left), EDA (center), and TMEDA (right) detected by nitrate CI at [A1]o=4x109 cm-3.
98

A3
- can also be formed by the decomposition of larger ions such as A3-•B which is
not accounted for in Equation 9. Evidence of this decomposition can be seen in Figure
24, presenting the measured SA3•B/S160 relationship with t at [A1]o=4x109 cm-3. Data for
all three bases were obtained using nitrate CI. At very short time scales (t approaching 0
s), SA3•B/S160 increases due to the measurement capturing more A3-•B. It follows that at
long t, more A3-•B will decompose to form A3
-, thereby increasing S293/S160. We see a
slight increase of S293/S160 for DMA approximately proportional to the increase of
SA3•DMA/S160 at short t. Our observations confirm the computational results that show A3-
•DMA decomposes via DMA evaporation; however our results show A3-•DMA
decomposes in ~0.01 s whereas Ortega et al. [2014] predicts ~100 s. A comparable trend
is not observed for the diamines, indicating that A3-•diamine may decompose in a
different fashion than A3-•DMA.
0.00 0.02 0.04 0.06 0.08 0.100.000
0.002
0.004
0.006
0.008
0.00 0.02 0.04 0.06 0.08 0.100.00
0.01
0.02
0.03
0.00 0.02 0.04 0.06 0.08 0.100.000
0.005
0.010
0.015
0.020
[DMA] (pptv) 8 24 70
S A3.D
MA/S
160
[EDA] (pptv)5 8 15 90
S A3.E
DA/S
160
CI Reaction Time, t (s)
[TMEDA] (pptv) 20 25 35 50
S A3.T
MED
A/S16
0
Figure 24 Nitrate measured SA3•B/S160 as a function of CI reaction time for DMA (left), EDA (center, and TMEDA (right) at [A1]o=4x109 cm-3. Note the different y-axis scales between bases.
Figure 24 shows numerous other trends that hint towards more significant
processes. SA3•DMA/S160 increases at long time for DMA but not for EDA or TMEDA.
This could be due to IIC formation of A3-•DMA, perhaps from A1
-+A2•DMA, or
decomposition of A3-•DMA2. It is difficult to conclude which process explains this trend
without accurate ion decomposition rates and modeling. These processes do not occur
with TMEDA and EDA. Furthermore, the value of SA3•DMA/S160 is about a factor of 10
lower than the ratios for EDA and TMEDA. Any of the four processes could contribute to
the differences between DMA and the other bases.
99
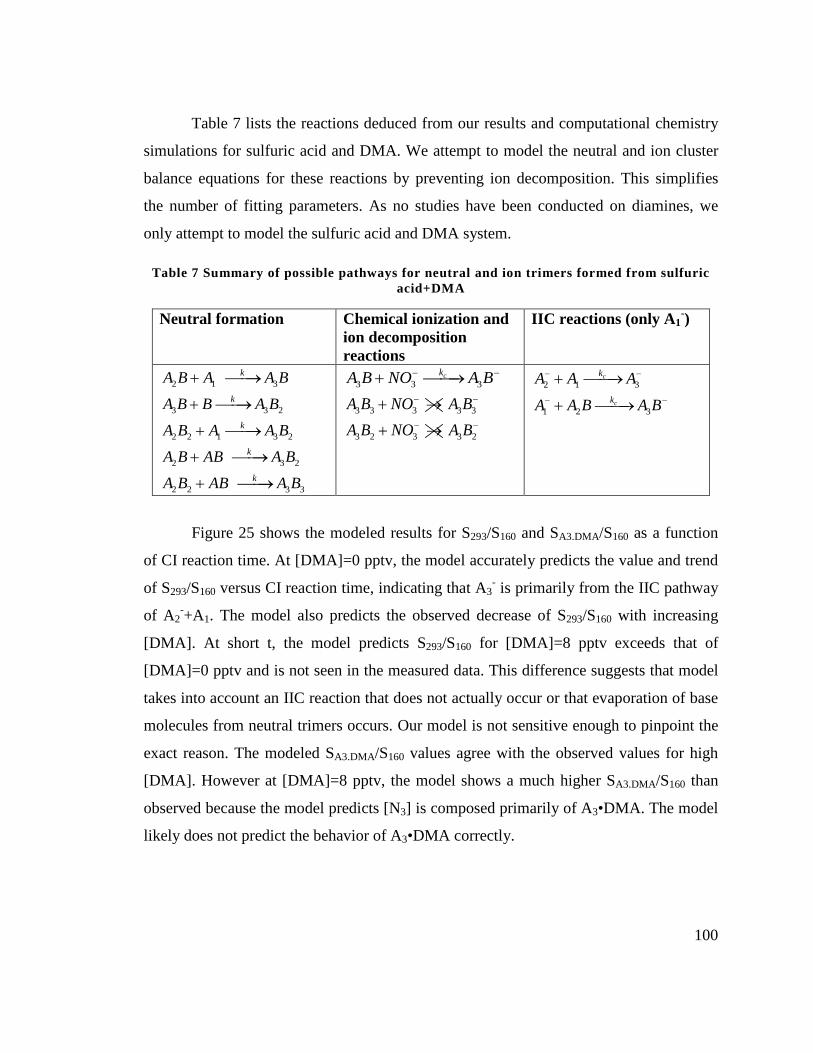
Table 7 lists the reactions deduced from our results and computational chemistry
simulations for sulfuric acid and DMA. We attempt to model the neutral and ion cluster
balance equations for these reactions by preventing ion decomposition. This simplifies
the number of fitting parameters. As no studies have been conducted on diamines, we
only attempt to model the sulfuric acid and DMA system.
Table 7 Summary of possible pathways for neutral and ion trimers formed from sulfuric acid+DMA
Neutral formation Chemical ionization and ion decomposition reactions
IIC reactions (only A1-)
2 1 3
3 3 2
2 2 1 3 2
2 3 2
2 2 3 3
k
k
k
k
k
A B A A B
A B B A B
A B A A B
A B AB A B
A B AB A B
+ →
+ →
+ →
+ →
+ →
3 3 3ckA B NO A B− −+ →
3 3 3 3 3A B NO A B− −+ →
3 2 3 3 2A B NO A B− −+ →
2 1 3
1 2 3
c
c
k
k
A A A
A A B A B
− −
− −
+ →
+ →
Figure 25 shows the modeled results for S293/S160 and SA3.DMA/S160 as a function
of CI reaction time. At [DMA]=0 pptv, the model accurately predicts the value and trend
of S293/S160 versus CI reaction time, indicating that A3- is primarily from the IIC pathway
of A2-+A1. The model also predicts the observed decrease of S293/S160 with increasing
[DMA]. At short t, the model predicts S293/S160 for [DMA]=8 pptv exceeds that of
[DMA]=0 pptv and is not seen in the measured data. This difference suggests that model
takes into account an IIC reaction that does not actually occur or that evaporation of base
molecules from neutral trimers occurs. Our model is not sensitive enough to pinpoint the
exact reason. The modeled SA3.DMA/S160 values agree with the observed values for high
[DMA]. However at [DMA]=8 pptv, the model shows a much higher SA3.DMA/S160 than
observed because the model predicts [N3] is composed primarily of A3•DMA. The model
likely does not predict the behavior of A3•DMA correctly.
100

0.00 0.02 0.04 0.06 0.08 0.100.000
0.005
0.010
0.015
0.020
0.00 0.02 0.04 0.06 0.08 0.100.00
0.05
0.10
0.15
0.20
S 293/S
160
CI reaction time, t (s)
DMA=0 pptv 8 24 70
S A3.D
MA/S
160
[DMA] (pptv) 8 24 70
Figure 25 Modeled S293/S160 (left) and SA3.DMA/S160 (right) as a function of CI reaction time for DMA at conditions used for Figure 23 and Figure 24.
5.8 Tetramer, N4
Nitrate CI detected none of the larger clusters. The tetramer likely exists as
A4•DMA2-4 during the 3 s acid-base reaction time, with A4•DMA4 dominating the
population [Ortega et al., 2012]. The acetate data confirm the trends predicted by
computational chemistry with acetate CI showing A4-•DMA3 as the largest fraction which
likely A4•DMA4 before ionization [Ortega et al., 2014]. Nitrate may be able to CI
A4•DMA1-2, however their concentrations are probably too low after the 3 s acid-base
reaction time. Nitrate was able to detect A4-•diamine, suggesting that the most stable
neutral tetramers contain less number of diamines than DMA. This is supported by the
acetate data for the diamines which show the majority of N4 containing 1 diamine.
The stability and behavior of A4-•diamine can be examined by looking at nitrate
detected SA4•diamine/S160 as a function of t, given in Figure 26 for EDA and TMEDA.
Similar to A3-•EDA, SA4•EDA/S160 increases at very short t, indicating that A4
-•EDA likely
decomposes in the 0.01 s time scale but A4-•TMEDA does not. Decomposition of A4
-
•EDA likely entails evaporation of A1 instead of diamine from the cluster as nitrate CI
did not detect any A4-. Furthermore, the lack of a rise in SA4•diamine/S160 at long t implies
that A4-•diamine is not the product of IIC.
101

0.00 0.02 0.04 0.06 0.080.000
0.002
0.004
0.006
0.008
0.010
0.012
0.014
0.016
0.00 0.02 0.04 0.06 0.08 0.10
[EDA] (pptv) 5 8 15 90
S A4.B
/S16
0
[TMEDA] (pptv) 20 25 35 50
CI Reaction Time, t (s) Figure 26 Nitrate measured SA4.diamine/S160 as a function of CI reaction time for EDA (left) and TMEDA (right).
5.9 Pentamer, N5
The most abundant N5 detected by acetate CI is A5-•DMA4 (no N5 was detected
by nitrate CI). Following the logic for the other sulfuric acid+DMA clusters, we believe
this cluster type was A5•DMA5 and was the most significant contributor to [N5]. No
computed evaporation rates have been published for N5 with DMA molecules to confirm
this hypothesis. Acetate detected A5-•EDA2 but not A5
-•EDA3, suggesting that the latter
cluster, in either neutral or ion form, might be unstable. A5-•EDA>3, A5
-•TMEDA>1, and
A5-•Put>2 fall outside the Cluster CIMS mass range of 710 amu. Thus, we may not have
measured the complete population of N5.
We can draw several conclusions from our measurements and models for all
cluster sizes. First, nitrate does not chemically ionize clusters of all sizes with attached
diamines. Nitrate also cannot detect sulfuric acid trimer and larger clusters with near
equal amounts of DMA. However by comparing sulfuric acid+DMA clusters via nitrate
with acetate CI, we can confirm the qualitative trends of both neutral and ion clusters
predicted from computational chemistry [Ortega et al., 2012; Ortega et al., 2014]. In
addition, ion decomposition does occur for clusters containing DMA and diamines which
will in turn affect the predicted composition and concentrations of neutral clusters.
However, the extent to which decomposition affects the concentrations is difficult to
determine without knowing the decomposition rates and products. Furthermore, our
102

modeling shows that A2
- and A3- are primarily produced via IIC pathways. When a basic
gas is present, the N3- population is dominated by aminated clusters, thus IIC is negligible
in the total [N3] at our 18 ms CI reaction time. In contrast, the aminated sulfuric acid
dimers decompose almost instantly, resulting in N2 detected almost completely as A2-.
IIC contributes negligible amounts of A2- for nitrate detected sulfuric acid+DMA dimers,
agreeing with our previous assessment of IIC in this system [Jen et al., 2015]. IIC
contributes up to 50% of nitrate detected [N2] for sulfuric acid+diamines; however,
acetate CI detects more [N2] with diamines, suggesting that IIC is negligible for these
[N2].
5.10 Observed Cluster Concentrations Using Acetate CI
We have shown that acetate more accurately measures the cluster concentrations
than nitrate in environments containing sulfuric acid and a strong base. Figure 27 shows
[N2], [N3], [N4], and [N5] (abbreviated as [Nm]) as a function of measured [N1] in the
presence of DMA using acetate with the Cluster CIMS. At low [N1]~2x108 cm-3, the
measured [N2] is higher than the values reported in Jen et al. [2014] by a factor of ~5.
Note, concentrations in [Jen et al., 2014] have been corrected for IIC; we have removed
the IIC correction to the sulfuric acid+DMA [N2] of Jen et al. [2014] for this comparison.
The differences between acetate [N2] and nitrate [N2] is likely due to acetate background
signals obscuring the true [N2] at low [N1]. A higher mass resolution mass spectrometer
would be able to separate out the background signals from dimer signal. Overall, the
dimer concentrations for the monoamines reported in Jen et al. [2014] are more accurate
due to lower background interferences of nitrate ionization.
Figure 27 also illustrates that all cluster concentrations reach a saturation limit
where increasing [DMA] does not produce more clusters. The saturation point for DMA
is between concentrations in the 5 to 55 pptv range, agreeing with the value of 20 pptv
reported by Jen et al. [2014]. This saturation limit implies that at this [DMA] or higher,
cluster formation is limited by sulfuric acid uptake. Figure 28 through Figure 30 show the
cluster concentrations as a function of measured [N1] for EDA, TMEDA, and Put 103

respectively. From these figures, the saturation points are [EDA]=6-9 pptv, [TMEDA]=4-
35 pptv, and [Put]=2-14 pptv. These results are summarized in Table 8.
Following Jen et al. [2014], evaporation rates (e.g. E1 and E3) were fitted from the
cluster concentration data by solving Scheme 2 of the acid-base reaction model (where
A1 reacts with B to form A1•B) at 3 s. These evaporation rates represent an average for
clusters that contain a given number of sulfuric acid molecules and do not account for the
number of base molecules in a cluster. For example, a fitted E3 from the data would
combine the evaporation rates of A3•B1-3. This might be reasonable if most clusters of a
given size consist of a single composition. However, if evaporation occurs for clusters of
a given size consisting of at least two compositions, then this approach will require
refinement in the future. In addition, fitted rates are interdependent since cluster
concentrations are linked. E3 was calculated by fixing E1 and minimizing the least square
residual for each type of cluster concentration. The range of fitted E3 and E1 values are
summarized in Table 8 and are very similar between DMA and the diamines. In addition,
their evaporation rates indicate the clusters have lifetimes on the order of acid-base
reaction time of 3 s. Therefore, we cannot say with confidence that one of these four
bases will stabilize clusters more than the others: they behave similarly during the 3 s
reaction time. In a separate paper we report on measurements of particle concentrations
after 40 s of reactions. Those measurements showed that, for given reactant
concentrations, diamines consistently produce more particles than monoamines,
indicating that they are more potent nucleating agents (i.e., that diamines produce clusters
that are more stable and evaporate more slowly than clusters formed from monoamines).
Table 8 Observed saturation [B] and fitted evaporation rates for four different bases using acetate CI cluster concentrations.
Base Saturation [B] pptv
E1 (s-1) E3 (s-1)
DMA 5-55 <1 <1 EDA 6-9 <1 <2 Put 2-14 <1 <1
TMEDA 4-35 <1 <5
104

At short acid-base reaction times, the more accurate method for fitting
evaporation rates is to model all four processes to compare measured ion ratios as a
function of CI reaction time (Figure 21, Figure 23, Figure 24, and Figure 27). The
number of chemical reactions and fitted parameters can be simplified by knowing the
stability of neutral and ion clusters, as provide by computational chemistry, to lay out the
most likely chemical reaction pathway clusters can form. However, the number of fitted
parameters and their interdependencies are too high to allow for reliable determinations
of rate constants by fitting a model to data, especially for clusters larger than N2. In
addition, some cluster lifetimes are on the order of the reaction time used in these
experiments, which constrains the range of values that can be found. In this study we
identify the challenges in using chemical ionization to study the formation of neutral
clusters and propose a method to determine the effects of various ion processes on the
measured cluster concentrations and compositions. Future computational chemistry
studies on the sulfuric acid and diamine environment would allow us to further refine our
interpretation of the observations and help model the complex system.
1E+06
1E+07
1E+08
1E+09
1E8 1E91E+05
1E+06
1E+07
1E+08
1E+09
1E8 1E9
[N5][N4]
[N3]
[DMA] 2 pptv 5 55 110
[N2]
[Nm] (
cm-3)
Measured [N1] (cm-3)
Figure 27 [Nm] vs. measured [N1] for four different [DMA], as indicated by different color points.
105

1E+05
1E+06
1E+07
1E+08
1E8 1E91E+05
1E+06
1E+07
1E+08
1E8 1E9
[EDA] pptv2 6 9 10 60
[N2] [N3]
[N4] [N5]
[Nm] (
cm-3)
Measured [N1] (cm-3)
Figure 28 [Nm] vs. measured [N1] for five different [EDA], as indicated by different color points.
1E+05
1E+06
1E+07
1E+08
1E8 1E91E+05
1E+06
1E+07
1E+08
1E8 1E9
[TMEDA] pptv 4 35 50
[N4]
[N2] [N3]
[N5]
[Nm] (
cm-3)
Measured [N1] (cm-3)
Figure 29 [Nm] vs. measured [N1] for three different [TMEDA], as indicated by different color points
106

1E+05
1E+06
1E+07
1E+08
1E+08 1E+091E+05
1E+06
1E+07
1E+08
1E+08 1E+09
[Put] pptv 2 9 14 20 40 60 120
[Nm] (
cm-3)
[N2] [N3]
[N5][N4]
Measured [N1] (cm-3)
Figure 30 [Nm] vs. measured [N1] for seven different [Put], as indicated by different color points
5.11 Conclusion
Measured cluster concentrations and compositions using chemical ionization mass
spectrometry depends on four key processes: neutral cluster formation, chemical
ionization, ion decomposition, and ion-induced clustering. Each of these processes must
be examined to determine its effect on the observed clusters. We compared nitrate and
acetate chemical ionization and determined that nitrate is unable to chemically ionize all
types of aminated sulfuric acid clusters (including DMA and the diamines) and may lead
to under-reported cluster concentrations. Acetate CI more accurately measures sulfuric
acid cluster concentrations but also exhibits a higher background. In addition, we provide
evidence that ions, such as A3-•B, decompose in the short CI reaction time scale and will
alter the observed cluster composition. IIC primarily produces bare sulfuric acid clusters
and mostly impacts measured [N2]. The sulfuric acid reaction with a basic gas reduces the
amount of ionizable monomer available for IIC and thus limits the contribution of IIC to
[N2]. Our results indicate that IIC contributes negligible amounts of A2- for nitrate
detected sulfuric acid+DMA dimers and for acetate detected [N2] for sulfuric acid and a
diamine. 107

5.12 Supporting Information
5.12.1 Mass-Dependent Sensitivity of the Cluster CIMS
Mass-dependent sensitivity experiments were performed on the University of MN
Cluster CIMS following a near identical procedure as detailed in Zhao et al. [2010], with
pertinent details described here. Four tetra-alkyl ammonium halide salts were used in this
experiment: tetramethyl ammonium iodide (TMAI at 74 and 275 m/z), tetrapropyl
ammonium iodide (TPAI at 186 m/z), tetrabutyl ammonium iodide (TBAI at 242 m/z),
and tetraheptyl ammonium bromide (THAB at 410 m/z). These salts were dissolved in
methanol and electrosprayed in positive ion mode. Specific ion mobilities [Ude and de la
Mora, 2005] were selected using a high resolution differential mobility analyzer
(HDMA) [Rosser and de la Mora, 2005]. The flow containing mono-mobile ions was
split into two equal streams with one measured by an electrometer and the other by the
Cluster CIMS. The ions were directly delivered to the inlet of the Cluster CIMS where
they first entered a conical octopole (1 MHz and 24 V pk-pk) then the quadrupole mass
analyzer. The signals of the Cluster CIMS were divided by the electrometer
concentrations to obtain the sensitivity. Since the ions were delivered directly to the
Cluster CIMS inlet, these experiments only probe the mass-dependent sensitivity of the
inlet, octopole, quadrupole, and detector.
Figure S23 shows measured sensitivity at specific masses corresponding to the
alkyl halide positive ions. We assume the mass-dependent sensitivity for positive ions is
the same for negative ions. The sensitivity at smaller masses is lower than at larger
masses, indicating that the Cluster CIMS more efficiently measures larger ions. The black
line in Figure S23 is the average sensitivity of the acetate ions (including CH3CO2-,
CH3CO2-•H2O, and CH3CO2
-•CH3CO2H). For masses between 450 to 710 m/z, we
assume a sensitivity value of 0.037 Hz cm3. Masses larger than 710 m/z are not detected
(i.e. sensitivity of zero) due to limits of our quadrupole. A constant sensitivity assumes
that all mass from ~200-710 m/z are measured equally efficient. This contrasts to Zhao et
al. [2010] where they observed a steep decline in sensitivity at large masses. We base our
assumption on the size and shape of largest mass peaks. Figure S24 shows a sample mass
108

scan of sulfuric acid with [EDA]=60 pptv. The largest ion detected is A6
-•EDA2 at 707
m/z. The peak is ~4 m/z wide and ~600 Hz tall. If the sensitivity for this large ion were
low, then the resulting [A6-•EDA2] would exceed that of [A2
-], an unlikely scenario.
Figure S23 Sensitivity of the UMN Cluster CIMS as a function of mass. The points indicate the measured sensitivity of the positive alkyl halide ions and the red line is the extrapolated sensitivity for masses larger than 450 m/z. The black is the average sensitivity of the acetate ions.
0 50 100 150 200 250 300 350 400 450 500 550 600 650 700 7501E+01
1E+02
1E+03
1E+04
1E+05
Ac-
A-6•EDA2
A-5•EDA3
A-5•EDA2
A-4•EDA3
A-5•EDA
A-4•EDA2
A-4•EDA
A-3•EDA2
A-3•EDA
A-2
A-1
Sign
al (H
z)
Mass (m/z)
A-3
A-2•EDA
[EDA]=60 pptvAc-•H2O
Figure S24 Mass scan of sulfuric acid at [A1]o=4x109 cm-3 and [EDA]=60 pptv measured using acetate. Identities of sulfuric acid+EDA peaks are labeled.
100 200 300 400 500 600 7000.005
0.01
0.015
0.02
0.025
0.03
0.035
0.04
Mass (m/z)
Sen
sitiv
ity (H
z cm
-3)
Sensitivty for mass>450 m/z
Average sensitivty acetate ions
109

5.12.2 Chemical Ionization and IIC Reactions
Negative ion chemical ionization of any sulfuric acid cluster follows a similar
reaction whereby the neutral entity donates a proton to the charged reagent ion (e.g.
nitrate). For example, CI of neutral sulfuric acid monomer can be written as
1
2 4 3 3 4 3 3
k
H SO HNO NO HSO HNO HNO− −+ • → • +
where k1 is the collision rate measured at 1.9x10⁻⁹ cm3 s-1 [Viggiano et al., 1997]. For
larger clusters, the resulting nitric acid evaporates from the ion cluster. IIC reactions up to
the trimer are as follows.
21
31
32
1 1 2
2 1 3
1 2 3
k
k
k
N A N
N A N
N A N
− −
− −
− −
+ →
+ →
+ →
The production of 1A− can be described by Equation S25 if we assume IIC depletion of
[A1] is negligible compared to CI depletion. This is a good assumption because 1A− <<
3NO− .
[ ]11 1 3
d Ak N NO
dt
−−
= Equation S25
If 3NO− and[ ]1N are assumed to not change as a function of CI reaction time, t, then
this equation can be integrated to give
[ ]11 1
3
Ak t N
NO
−
−
=
Equation S26
The left-hand side of the equation can be easily converted to measured signals by
introducing the mass-dependent sensitivity factor for masses of 1A− and 3NO− (see above
section). At long CI reaction times, [ ]1N will decrease significantly. [ ]1N can then be
estimated by assuming 110
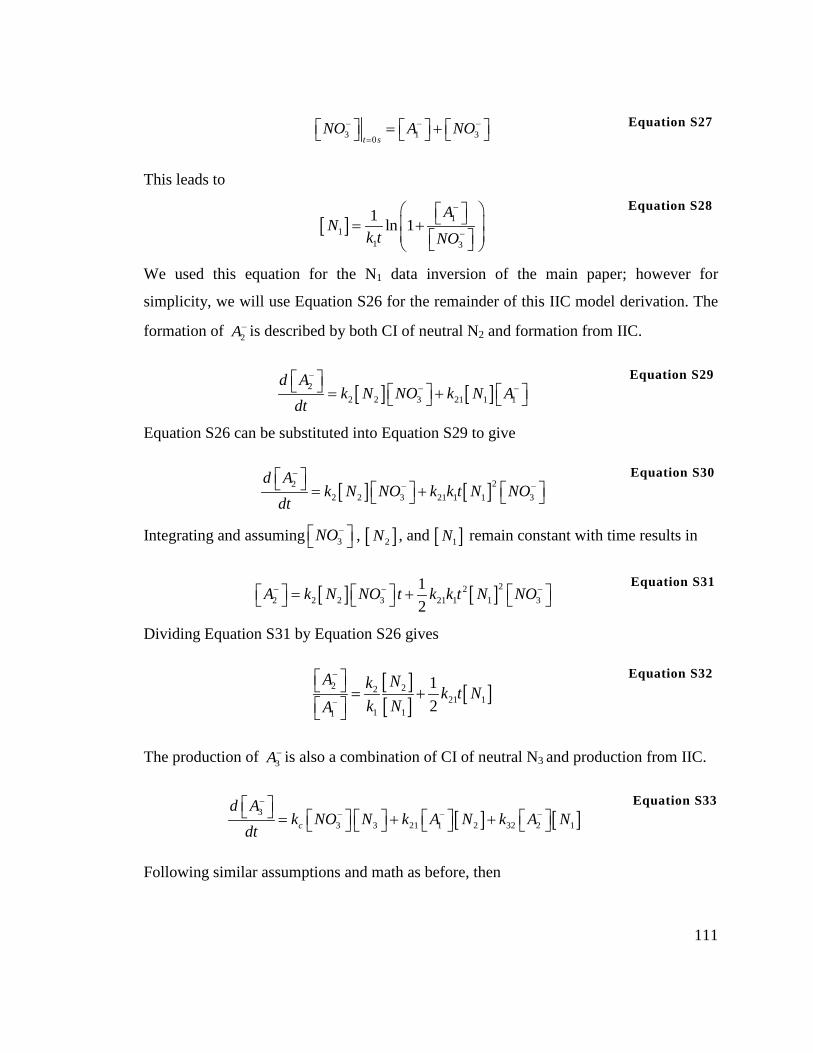
3 1 30t sNO A NO− − −
= = + Equation S27
This leads to
[ ] 11
1 3
1 ln 1A
Nk t NO
−
−
= +
Equation S28
We used this equation for the N1 data inversion of the main paper; however for
simplicity, we will use Equation S26 for the remainder of this IIC model derivation. The
formation of 2A− is described by both CI of neutral N2 and formation from IIC.
[ ] [ ]22 2 3 21 1 1
d Ak N NO k N A
dt
−− −
= + Equation S29
Equation S26 can be substituted into Equation S29 to give
[ ] [ ]222 2 3 21 1 1 3
d Ak N NO k k t N NO
dt
−− −
= + Equation S30
Integrating and assuming 3NO− , [ ]2N , and [ ]1N remain constant with time results in
[ ] [ ]222 2 2 3 21 1 1 3
12
A k N NO t k k t N NO− − − = + Equation S31
Dividing Equation S31 by Equation S26 gives
[ ][ ] [ ]2 22
21 11 11
12
A Nk k t Nk NA
−
−
= +
Equation S32
The production of 3A− is also a combination of CI of neutral N3 and production from IIC.
[ ] [ ]33 3 21 1 2 32 2 1c
d Ak NO N k A N k A N
dt
−− − −
= + + Equation S33
Following similar assumptions and math as before, then
111

[ ][ ] [ ] [ ]23 3 23 2 32
31 2 21 31 11 1 11
1 12 6
A Nk k kk N t k k N tk N kA
−
−
= + + +
Equation S34
This IIC model is the method used to correct measured signals of N2 and larger clusters
for IIC bias [Chen et al., 2012; Hanson and Eisele, 2002]. However, this model assumes
no depletion of the neutral cluster concentrations and neglects possible contributions of
ion decomposition. Deviations from this model provide insights into what other processes
are affecting the formation of ions.
5.12.3 Positive Ion Cluster of Sulfuric Acid and Various Bases
Protonated water clusters were produced by passing water vapor over a Po-210
alpha source and were used to positively charge sulfuric acid clusters containing basic
molecules. In the sulfuric acid+DMA system, the Cluster CIMS detected DMA+,
A1•DMA2+, A2•DMA2
+, A2•DMA3+, A3•DMA4
+, A4•DMA4+. These clusters are different
than the ones reported in Bianchi et al. [2014] as they did not observe positive ion
clusters with equal numbers of sulfuric acids and DMA molecules. Since we chemically
ionize neutral clusters and can control the ion drift time, we are able to detect very short
lived ions whereas Bianchi et al. sampled pre-existing ions that have achieved steady
state. Ions with short lifetimes will not be observed in the long time scales of the CLOUD
chamber experiments.
Our observed positive ion dimers and trimers are likely the evaporation products
of larger ions. Ortega et al. [2014] predicts that sulfuric acid will evaporate from these
positively charged clusters. For example, A1•DMA1+ will quickly evaporate into A1 and
DMA+ (100 s-1) and A2•DMA2+ will evaporate into A1•DMA2
+ (1 s-1). Therefore, we
cannot conclude if the dimers observed in our positive ion data were initially neutral
dimers.
We hypothesize that sulfuric acid will evaporate more slowly from sulfuric
acid+diamine positive ion clusters than with DMA due to the additional amine group of a
diamine. The observed positive ion cluster types are given in Table S4. In contrast to
sulfuric acid and DMA, the positive ion clusters with diamine show either equal or more
112

acid molecules than base molecules. This supports our hypothesis that the both amine
groups of the diamine have significant interactions with sulfuric acid.
Table S4 List of positive ion cluster types detected by the Cluster CIMS
Cluster Size, Base DMA EDA Put TMEDA N1 A1•DMA2
+ A1•EDA+ A1•EDA3
+ A1•Put+ A1•TMEDA+
A1•TMEDA2+
N2 A2•DMA2+
A2•DMA3+
A2•EDA+
A2•EDA2+
A2•Put+ A2•Put2+
A2•TMEDA+
A2•TMEDA2+
N3 A3•DMA4+ A3•EDA+
A3•EDA2+
A3•EDA4+
A3•Put2+ A3•Put3+
A3•TMEDA2+
N4 A4•DMA4+ A4•EDA3
+
A4•EDA4+
A4•Put3+ A4•TMEDA2+
N5 A5•EDA3+
Figure S25 shows the differences in [N1] and [N2] detected by acetate, nitrate, and
protonated water cluster ions. If we assume sulfuric acid does not evaporate from these
ion clusters, then protonated water is able to ionize the more chemically basic portion of
the N1 and N2 population. [N1+] represents ~1% of the overall [N1] whereas [N2
+] is about
equal to the [A2- ] detected by nitrate CI. The difference between acetate [N2] and nitrate
[N2] is approximately equal to the water [N2], perhaps indicating that acetate is able to
chemically ionize the cluster types seen in positive spectra. We require more
computational chemistry studies on the behavior of positive and negative sulfuric
acid+diamine ion clusters to understand why nitrate detected [N1] and [N2] are lower than
the concentrations measured using acetate CI.
113

1E+04
1E+05
1E+06
1E+07
1E+08
1E+09
Wat
erN
itrat
e
[EDA]=9 pptv
[N1]
and
[N2]
(cm
-3)
Acet
ate
Acet
ate
Nitr
ate
Wat
er
Acet
ate
Nitr
ate
Wat
er
N1
3 B 2 B 1 B 0 B
N2 N2N1 N2N1
[Put]=9 pptv
[TMEDA]=35 pptv
Figure S25 Monomer and dimers detected via acetate (solid), nitrate (hashed), and protonated water clusters (diagonal stripes) chemical ionization. Each color represents the number of base molecules with EDA shown on the left, Put center, and TMEDA right.
5.12.4 Modeled Reactions
The modeled reactions, listed in [table] can be divided into three categories:
neutral cluster formation, chemical ionization and ion decomposition, and IIC. The
neutral cluster forward rate constants, k, were assumed to be 4x10⁻¹⁰ cm3 s-1, and the ion
forward rate constants, kc, were taken to be 2x10⁻⁹ cm3 s-1. To constrain the number of
parameter, we set all the evaporation rates except E1 to zero. Rate constants listed as fast
were assumed to be instantaneous and the intermediate products do not form in
appreciable quantities.
114

Table S5 Summary of all the reactions modeled in this study
Neutral cluster formation CI and ion decomposition reactions IIC reactions
1
3 2
1
1 2
2 2
2 2 2
2 1 3
3 3 2
2 2 1 3 2
2 3 2
2 2 3 3
3 2 2 2 1
3 3 2 3 3 4
3 2 3 3 1 4
or or
or
A B
k
E
k
k
k
k
k
k
k
k
E
k
k
A B AB
AB A A BAB AB A BA B B A BA B A A B
A B B A B
A B A A B
A B AB A B
A B AB A B
A B A B A
A B A B A B AB N
A B A B A N
→+ ←
+ →
+ →
+ →
+ →
+ →
+ →
+ →
+ →
→ +
+ →
+ →
2
2
2 2
2 2 2
E
E
A B AB AB
A B A B B
→ +
→ +
33 2 1 A BEA B A B A→ +
2 2 3 2 2 2ck fastA B NO A B A− − −+ → →
3 1ck fastAB NO AB A− − −+ → →
3
1 3 1
2 3 2 2
3 3 3 3
4 3 4
c
c
A Bc
c
k
k fast
Ek
k
A NO A
A B NO A B A
A B NO A B A
N NO N
−
− −
− − −
− − −
− −
+ →
+ → →
+ → →
+ →
3 3 3 3 3 3 2
ck fastA B NO A B A B− − −+ → → 3 2
3 2 3 3 2 3A Bc
EkA B NO A B A B−− − −+ → →
1 1 2
2 1 3
1 2 3
1 3 4
or
c
c
c
c
k
k
k
k
A A A
A A AB A
A A B A B
A A B N
− −
− −
− −
− −
+ →
+ →
+ →
+ →
1 2 2 3 2ckA A B A B− −+ →
1 2 2ck fastA AB A B A− − −+ → →
115
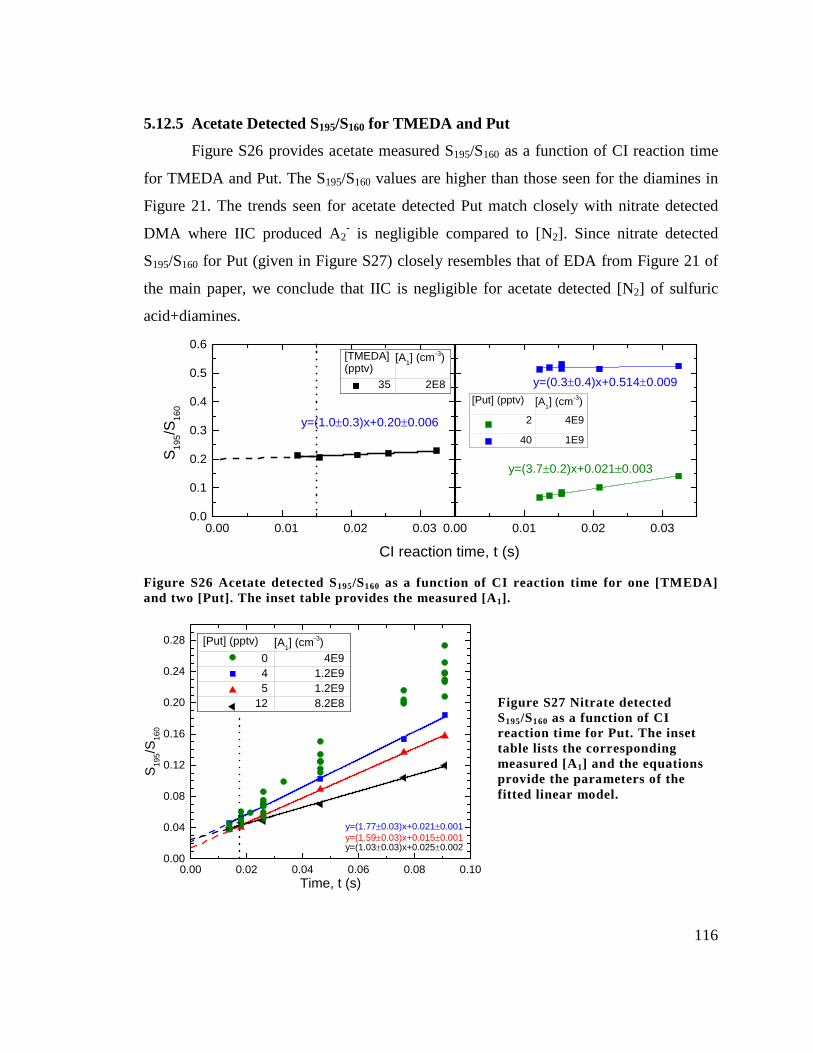
5.12.5 Acetate Detected S195/S160 for TMEDA and Put
Figure S26 provides acetate measured S195/S160 as a function of CI reaction time
for TMEDA and Put. The S195/S160 values are higher than those seen for the diamines in
Figure 21. The trends seen for acetate detected Put match closely with nitrate detected
DMA where IIC produced A2- is negligible compared to [N2]. Since nitrate detected
S195/S160 for Put (given in Figure S27) closely resembles that of EDA from Figure 21 of
the main paper, we conclude that IIC is negligible for acetate detected [N2] of sulfuric
acid+diamines.
0.00 0.01 0.02 0.030.0
0.1
0.2
0.3
0.4
0.5
0.6
0.00 0.01 0.02 0.03
[TMEDA] (pptv)
[A1] (cm-3)
35 2E8
y=(1.0±0.3)x+0.20±0.006
S 195/S
160
CI reaction time, t (s)
y=(3.7±0.2)x+0.021±0.003
y=(0.3±0.4)x+0.514±0.009[Put] (pptv) [A1] (cm-3)
2 4E9
40 1E9
Figure S26 Acetate detected S195/S160 as a function of CI reaction time for one [TMEDA] and two [Put]. The inset table provides the measured [A1].
0.00 0.02 0.04 0.06 0.08 0.100.00
0.04
0.08
0.12
0.16
0.20
0.24
0.28 [Put] (pptv) [A1] (cm-3)0 4E94 1.2E95 1.2E9
12 8.2E8
y=(1.03±0.03)x+0.025±0.002y=(1.59±0.03)x+0.015±0.001y=(1.77±0.03)x+0.021±0.001
S 195/S
160
Time, t (s)
Figure S27 Nitrate detected S195/S160 as a function of CI reaction time for Put. The inset table lists the corresponding measured [A1] and the equations provide the parameters of the fitted linear model.
116

Chapter 6. Conclusions and Recommendations for Future Work
6.1 Summary of Discoveries
The work presented in this dissertation improves our understanding on the
chemical reactions behind atmospheric nucleation and on the instrumentation used to
measure freshly formed clusters and particles. Chapter 3 investigates how various basic
gases, such as ammonia and amines, stabilize sulfuric acid dimer clusters. I show that
dimethylamine and trimethylamine stabilize dimers the most, leading to dimer
concentrations approaching the collision-controlled limit. Building upon previous work
from our group, I propose a revised acid-base chemical reaction model to describe
atmosphereic nucleation, based on measurements in a laboratory flow reactor. This model
was used to obtain dissocation rates of sulfuric acid+base clusters, which combined with
observations, suggest that ammonia<methylamine<trimethylamine≲dimethylamine at
forming stable sulfuric acid dimers. Predicted nucleation rates are in the range of
observed boundary layer nucleation rates for measurements conducted by our group and
others worldwide.
Unlike dimer concentrations, concentrations of the larger clusters in ~1 nm in size
are less certain due to measurement uncertainties, but accurate measurements of these
larger clusters are needed to improve calculated evaporation rates and the acid-base
reaction model. To better identify and understand these uncertainties, I developed a new
method to compare number concentrations measured by these two fundamentally
different instruments: a chemical ionization mass spectrometer (Cluster CIMS) and a
scanning mobility particle spectrometer equipped with a diethylene glycol condensation
particle counter (DEG SMPS). The smallest particles that can be detected by the DEG
SMPS overlap with the largest clusters that can be detected with the Cluster CIMS.
Comparison between these two instruments reveals that nitrate ions do not chemically
ionize all types of clusters formed between reactions of sulfuric acid and dimethylamine.
Acetate chemical ionization detected higher concentrations and more types of clusters
than nitrate chemical ionization, leading to improved agreement between the Cluster
117
CIMs and the DEG SMPS. In addition, the number concentrations measured by the DEG
SMPS in a pure sulfuric acid environment (with water but no base) were higher than
predicted, suggesting that either ion-induced particle formation occurs in the charger of
the mobility classifier or sulfuric acid reacts with DEG in the condenser and forms
particles. Number concentrations in the smallest size bins of the DEG SMPS (~1 nm
geometric diameter) may be biased high as a result.
After identifying possible uncertainties in the particle measurements, the DEG
SMPS was used to show that reactions of sulfuric acid with atmospherically relevant
diamines produce more particles than has been observed with any monoamines (e.g.
dimethylamine and methylamine) and ammonia. Little is known about the abundance or
chemical behavior of these diamines, and my thesis is the first to examine their role in
nucleation. My measurements show that diamines are the most potent nucleating agents
discovered to date and can react with sulfuric acid to produce 10-100 times more particles
than monoamines in the flow reactor. Putrescine and cadaverine concentrations (both
naturally occurring diamines formed via biological decomposition of proteins and other
organic matter) were also measured in rural Oklahoma during spring, 2013. Their
concentrations (10-100 pptv) were equal to or greater than the measured concentrations
of dimethylamine at this site; thus these diamines likely significantly contribute to
atmospheric nucleation.
Formation of larger clusters from reactions of sulfuric acid and various
monoamines and atmospherically-relevant diamines were investigated in Chapter 5.
However, to understand the cluster types and concentrations measured by the Cluster
CIMS requires deeper insights into neutral cluster formation, chemical ionization, ion-
induced clustering, and ion decomposition than was previously assumed. Ion behavior
was studied by varying the chemical ionization reaction time. The results show that ion
decomposition occurs and evaporation rates inferred from my measurements qualitatively
agree with the cluster types predicted to decompose in computational chemistry
simulations. A model was developed to describe these four processes using a series of
118

cluster balance equations to further interpret the observed trends in measured cluster
signals as a function chemical ionization reaction time. The model suggests that certain
sulfuric acid+diamine monomers and dimers cannot be ionized by nitrate. Thus, all
previous atmospheric measurements of sulfuric acid clusters using nitrate chemical
ionization may not be detecting the true cluster concentrations, reinforcing conclusions
from Chapter 3.
6.2 Future Work in Nanocluster and Particle Instrumentation
The results presented in Chapters 3 and 5 answer questions regarding the
measurement of clusters with the DEG SMPS and the Cluster CIMS. However, many
more questions remain. Below is a list knowledge gaps that must be addressed in the
future:
1) I show in Chapters 3 and 5 that nitrate is does not chemically ionize all types of
clusters. My measurements show that the larger clusters (trimer and larger) are most
affected by poor nitrate CI efficiency. In contrast, the DEG SMPS, with its alpha
emitting Po-210 source, is able to ionize and detect these neutral clusters. This
naturally leads to the question of how does the DEG SMPS charge ~1 nm clusters.
The identity of charger reagent ion(s) remains unknown and likely depends heavily
on the compounds in the sample flow. Better characterization of the charging ions
will provide clues into which particle compositions are being charged and detected
by the DEG SMPS. Alternatively, chemical ionization with known ions could be
used instead of the Po-210 charger to better control the cluster types detected by the
DEG SMPS. Using the method I lay out in Chapter 5, the resulting number
concentrations can then be compared to concentrations measured by the Cluster
CIMS. This comparison would provide more information on possible sources of
uncertainty (e.g. charging efficiency and IIC) of the DEG SMPS which I have not
studied.
2) In the same chapters, I show that more types of sulfuric acid+base clusters can be
detected if acetate, rather than nitrate, is used at the CI reagent ion. Acetate is a
119

stronger conjugate base than nitrate and thus can ionize more chemically neutral
clusters. Unfortunately as a consequence, acetate is also able to chemically ionize
background compounds that will interfere with the signals of sulfuric acid clusters.
Due to the vast number of compounds in the atmosphere, the background signals of
acetate CI would be too high to meaningfully measure sulfuric acid clusters in the
field. Identifying a reagent ion that is capable of ionizing the clusters of interest but
without the high background would improve measurements. Alternatively, a higher
resolution mass spectrometer could be used with acetate CI to detected sulfuric acid
clusters in the field. The higher mass resolution would allow for definitive
separation between peaks of interest and background signals.
3) Currently, computational chemistry simulations (primarily conducted by the
Vehkamäki group) predict that nitrate is able to chemically ionize near chemically
neutral clusters up to two sulfuric acids and two dimethylamines (no results have
been published for larger clusters) [Kupiainen-Määttä et al., 2013]. These
simulations should be extended to larger clusters and clusters composed of sulfuric
acid and diamines. These results can then be compared to measurements presented
in Chapters 3 and 5 to determine the validity of the simulation’s underlying
assumptions (e.g. no energy barriers to proton transfers or molecular rearrangement
inside a cluster and charge always resides on the bisulfate ion [Kupiainen-Määttä et
al., 2013]).
4) Throughout the studies detailed in this dissertation, the CI reaction time has been
calculated based upon inlet dimensions, mobility of the reagent ion, and the electric
field. This method assumes gas flows do not affect the CI reaction. The Cluster
CIMS samples gas containing the neutral vapors and clusters of interest at a flow
rate that can be varied, and a second, much smaller flow is perpendicularly injected
into the sample flow (see Figure 1 in Chapter 2) to introduce the reagent ions.
Empirical measurements using the Cluster CIMS suggest that these flows play a
non-negligible role in the signal intensities and therefore the CI reaction time.
Computational fluid dynamic modelling should be done on the sampling region and
120

mass spectrometer inlet to determine how fluid flow affects CI reaction time and
ultimately the calculated cluster concentrations. It is possible that an alternative
inlet design might allow for better characterization and reduce the sensitivity to
flow.
5) The mass dependent sensitivity for the Cluster CIMS inlet, octopole, quadrupole,
and detector has been experimentally measured (see SI of Chapter 5). However,
electric fields that control the CI reaction time likely also mass discriminate. A
similar mass-dependent sensitivity curve can be experimentally determined for the
entire sampling region and mass spectrometer if a high enough concentration
(above 106 cm-3) of mono-mobile ions could be produced and introduced into the
sample tube of the Cluster CIMS. The ions would then be simultaneously counted
by the Cluster CIMS and an electrometer. The Cluster CIMS mass-dependent
sensitivity is the ratio of its signal response to the ion concentration measured by
the electrometer.
6.3 Future Work for the Chemical Reaction Model of Atmospheric Nucleation
Chapters 2, 4, and 5 presented experimental evidence supporting the acid-base
chemical reaction model for nucleation. A second generation heuristic model was
developed in Chapter 2 and significantly expanded in Chapter 5 to include formation of
specific types of clusters using assumptions based upon computational chemistry results
for sulfuric acid+dimethylamine clusters. Diamines and sulfuric acid were also shown to
produce more particles than monoamines. Overall the results presented here are
significant and advance our understanding on the identities of potent nucleation agents
and the chemical mechanisms behind nucleation. However, questions remain.
1) Diamines and sulfuric acid produce markedly different cluster compositions and
more particles than monoamines. I hypothesize that both amine groups of the
diamine react with sulfuric acid to form a more stable cluster. Computational
chemistry studies need to be done to test this hypothesis and explore evaporation
rates of these clusters. Such work would also help experimentalists interpret their
121

data. Developing a more comprehensive understanding of sulfuric acid+diamine
neutral cluster formation will require coordination between experimental and
theoretical research.
2) In addition to neutral cluster formation pathways for sulfuric acid+diamines, the
ion behavior of these clusters needs to be studied to better interpret the results
presented in Chapter 5. Similar to the sulfuric acid+dimethylamine case,
computational chemistry could provide ion decomposition rates of sulfuric
acid+diamine clusters that can be used to determine the original identity of the
neutral cluster.
3) The focus of this work is on a two component, acid-base system (with water
implicitly included). Previous studies have shown that sulfuric acid in the presence
of two bases will produce particle concentrations that are much higher than a single
base system, where the concentrations approaches levels observed with sulfuric
acid+diamine systems [Glasoe et al., 2015; Yu et al., 2012]. The Cluster CIMS was
used to measure this synergistic effect between ammonia/methylamine and
ammonia/dimethylamine (unpublished results not presented in my thesis).
However, the 3 s acid-base reaction time was too short to observe noticeable
differences in cluster composition and concentration when compared to a single
base system. Likely, the synergistic effect requires more than 3 s to occur at
measurable levels. More measurements using the Cluster CIMS should be done at
longer reaction times to continue studying this effect. The challenge for these flow
reactor experiments will be to minimize wall losses at longer reaction times so that
the cluster concentrations are high enough for detection.
4) Relative humidity and temperature also play a large role in nucleation and were
not explored in this dissertation. Constant relative humidity was chosen for
convenience, and room temperature was chosen to prevent natural convection
swirling in the flow reactor/Cluster CIMS sample tube. Relative humidity in the
flow reactor can be adjusted by changing the flow rate of humidified nitrogen
injected into the reactor. The temperature of the reactor is controlled by an exterior
122

water jacket. Modifications will need to be done to the Cluster CIMS sample tube
(which is directly connected to the flow reactor) to attach it to the flow reactor
temperature control system. Natural convection swirling will likely be suppressed
by holding the Cluster CIMS sample tube at the same temperature as the walls of
the flow reactor.
5) The studies detailed here are the most wide ranging cluster concentration
measurements from various sulfuric acid+base environments that have been
reported to date. Using these cluster concentrations, evaporation rates for specific
cluster types can be calculated using comprehensive cluster balance equations that
include neutral cluster formation, chemical ionization, IIC, and ion decomposition.
This is similar to the approach taken in Chapter 5 but instead fits all the evaporation
rates in addition to E1. However, the challenge is that all these evaporation rates are
interdependent and thus require a complex fitting method to determine them more
accurately. Future work should identify a possible fitting method and to use it to
estimate evaporation rates from measured cluster concentrations.
123
References Almeida, J., et al. (2013), Molecular understanding of sulphuric acid-amine particle
nucleation in the atmosphere, Nature, 502(7471), 359-363, doi:10.1038/nature12663.
Ball, S. M., D. R. Hanson, F. L. Eisele, and P. H. McMurry (1999), Laboratory studies of particle nucleation: Initial results for H2SO4, H2O, and NH3 vapors, Journal of Geophysical Research: Atmospheres, 104(D19), 23709-23718, doi:10.1029/1999JD900411.
Becker, R., and W. Döring (1935), Kinetische behandlung der Keimbildung in übersättigten Dämpfen, Annalen der Physik, 5(24).
Benson, D. R., M. E. Erupe, and S. H. Lee (2009), Laboratory-measured H2SO4-H2O-NH3 ternary homogeneous nucleation rates: Initial observations, Geophysical Research Letters, 36(15), L15818, doi:10.1029/2009GL038728.
Berresheim, H., T. Elste, C. Plass-Dülmer, F. L. Eisele, and D. J. Tanner (2000), Chemical ionization mass spectrometer for long-term measurements of atmospheric OH and H2SO4, International Journal of Mass Spectrometry, 202(1–3), 91-109, doi:10.1016/s1387-3806(00)00233-5.
Bianchi, F., et al. (2014), Insight into Acid–Base Nucleation Experiments by Comparison of the Chemical Composition of Positive, Negative, and Neutral Clusters, Environmental Science & Technology, 48(23), 13675-13684, doi:10.1021/es502380b.
Chen, M., et al. (2012), Acid–base chemical reaction model for nucleation rates in the polluted atmospheric boundary layer, Proceedings of the National Academy of Sciences, 109(46), 18713-18718, doi:10.1073/pnas.1210285109.
Coffman, D. J., and D. A. Hegg (1995), A preliminary study of the effect of ammonia on particle nucleation in the marine boundary layer, Journal of Geophysical Research: Atmospheres, 100(D4), 7147-7160, doi:10.1029/94JD03253.
Dawson, M. L., M. E. Varner, V. Perraud, M. J. Ezell, R. B. Gerber, and B. J. Finlayson-Pitts (2012), Simplified mechanism for new particle formation from methanesulfonic acid, amines, and water via experiments and ab initio calculations, Proceedings of the National Academy of Sciences, 109(46), 18719-18724, doi:10.1073/pnas.1211878109.
DePalma, J. W., B. R. Bzdek, D. J. Doren, and M. V. Johnston (2011), Structure and Energetics of Nanometer Size Clusters of Sulfuric Acid with Ammonia and Dimethylamine, The Journal of Physical Chemistry A, 116(3), 1030-1040, doi:10.1021/jp210127w.
Eisele, F. L. (1983), Direct tropospheric ion sampling and mass identification, International Journal of Mass Spectrometry and Ion Processes, 54(1–2), 119-126, doi:10.1016/0168-1176(83)85011-3.
Eisele, F. L., and D. R. Hanson (2000), First Measurement of Prenucleation Molecular Clusters, The Journal of Physical Chemistry A, 104(4), 830-836, doi:10.1021/jp9930651.
124

Eisele, F. L., and D. J. Tanner (1993), Measurement of the gas phase concentration of
H2SO4 and methane sulfonic acid and estimates of H2SO4 production and loss in the atmosphere, J. Geophys. Res., 98(D5), 9001-9010, doi:10.1029/93jd00031.
Erupe, M. E., A. A. Viggiano, and S. H. Lee (2011), The effect of trimethylamine on atmospheric nucleation involving H2SO4, Atmos. Chem. Phys., 11(10), 4767-4775, doi:10.5194/acp-11-4767-2011.
Freshour, N., K. Carlson, Y. A. Melka, S. Hinz, and D. R. Hanson (2014), Quantifying Amine Permeation Sources with Acid Neutralization: AmPMS Calibrations and Amines in Coastal and Continental Atmospheres, Atmos. Meas. Tech., 7, 3611-3621, doi:10.5194/amt-7-3611-2014.
Ge, X., A. S. Wexler, and S. L. Clegg (2011), Atmospheric amines – Part I. A review, Atmospheric Environment, 45(3), 524-546, doi:http://dx.doi.org/10.1016/j.atmosenv.2010.10.012.
Glasoe, W. A., K. Volz, B. Panta, N. Freshour, R. Bachman, D. R. Hanson, P. H. McMurry, and C. Jen (2015), Sulfuric Acid Nucleation: An Experimental Study of the Effect of Seven Bases, Journal of Geophysical Research: Atmospheres, 2014JD022730, doi:10.1002/2014JD022730.
Gross, J. H. (2010), Mass spectrometry a textbook, edited, pp. 1 online resource (xxiv, 753 p.), Springer,, Berlin ; London.
Hanson, D. R., J. B. Burkholder, C. J. Howard, and A. R. Ravishankara (1992), Measurement of hydroxyl and hydroperoxy radical uptake coefficients on water and sulfuric acid surfaces, The Journal of Physical Chemistry, 96(12), 4979-4985, doi:10.1021/j100191a046.
Hanson, D. R., and F. L. Eisele (2002), Measurement of prenucleation molecular clusters in the NH3, H2SO4, H2O system, J. Geophys. Res., 107(D12), 4158, doi:10.1029/2001jd001100.
Hanson, D. R., F. L. Eisele, S. M. Ball, and P. M. McMurry (2002), Sizing Small Sulfuric Acid Particles with an Ultrafine Particle Condensation Nucleus Counter, Aerosol Science and Technology, 36(5), 554-559, doi:10.1080/02786820252883793.
Hanson, D. R., and E. R. Lovejoy (2006), Measurement of the Thermodynamics of the Hydrated Dimer and Trimer of Sulfuric Acid, The Journal of Physical Chemistry A, 110(31), 9525-9528, doi:10.1021/jp062844w.
Hanson, D. R., P. H. McMurry, J. Jiang, D. Tanner, and L. G. Huey (2011), Ambient Pressure Proton Transfer Mass Spectrometry: Detection of Amines and Ammonia, Environmental Science & Technology, 45(20), 8881-8888, doi:10.1021/es201819a.
Hiemenz, P. C., and T. P. Lodge (2007), Polymer Chemistry, Second Edition, Taylor & Francis.
Iida, K., M. R. Stolzenburg, and P. H. McMurry (2009), Effect of working fluid on sub-2 nm particle detection with a laminar flow ultrafine condensation particle counter, Aerosol Science and Technology, 43(1), 81-96, doi:10.1080/02786820802488194.
IPCC (2014), Climate Change 2014: Impacts, Adaptation, and Vulnerability. Part A: Global and Sectoral Aspects. Contribution of Working Group II to the Fifth Assessment Report of the Intergovernmental Panel on Climate Change [Field,
125

C.B., V.R. Barros, D.J. Dokken, K.J. Mach, M.D. Mastrandrea, T.E. Bilir, M. Chatterjee, K.L. Ebi, Y.O. Estrada, R.C. Genova, B. Girma, E.S. Kissel, A.N. Levy, S. MacCracken, P.R. Mastrandrea, and L.L. White (eds.)], 1132 pp., Cambridge University Press, Cambridge, United Kingdom and New York, NY, USA.
Jen, C. N., D. R. Hanson, and P. H. McMurry (2015), Towards Reconciling Measurements of Atmospherically Relevant Clusters by Chemical Ionization Mass Spectrometry and Mobility Classification/Vapor Condensation, Aerosol Science and Technology, ARL, 49(1), i-iii, doi:10.1080/02786826.2014.1002602.
Jen, C. N., P. H. McMurry, and D. R. Hanson (2014), Stabilization of sulfuric acid dimers by ammonia, methylamine, dimethylamine, and trimethylamine, Journal of Geophysical Research: Atmospheres, 119(12), 2014JD021592, doi:10.1002/2014JD021592.
Jiang, J., M. Attoui, M. Heim, N. A. Brunelli, P. H. McMurry, G. Kasper, R. C. Flagan, K. Giapis, and G. Mouret (2011a), Transfer Functions and Penetrations of Five Differential Mobility Analyzers for Sub-2 nm Particle Classification, Aerosol Science and Technology, 45(4), 480-492, doi:10.1080/02786826.2010.546819.
Jiang, J., M. Chen, C. Kuang, M. Attoui, and P. H. McMurry (2011b), Electrical Mobility Spectrometer Using a Diethylene Glycol Condensation Particle Counter for Measurement of Aerosol Size Distributions Down to 1 nm, Aerosol Science and Technology, 45(4), 510-521, doi:10.1080/02786826.2010.547538.
Jiang, J., J. Zhao, M. Chen, F. L. Eisele, J. Scheckman, B. J. Williams, C. Kuang, and P. H. McMurry (2011c), First Measurements of Neutral Atmospheric Cluster and 1–2 nm Particle Number Size Distributions During Nucleation Events, Aerosol Science and Technology, 45(4), ii-v, doi:10.1080/02786826.2010.546817.
Jokinen, T., M. Sipilä, H. Junninen, M. Ehn, G. Lönn, J. Hakala, T. Petäjä, R. L. Mauldin Iii, M. Kulmala, and D. R. Worsnop (2012), Atmospheric sulphuric acid and neutral cluster measurements using CI-APi-TOF, Atmos. Chem. Phys., 12(9), 4117-4125, doi:10.5194/acp-12-4117-2012.
Kirkby, J., et al. (2011), Role of sulphuric acid, ammonia and galactic cosmic rays in atmospheric aerosol nucleation, Nature, 476(7361), 429-433, doi:http://www.nature.com/nature/journal/v476/n7361/abs/nature10343.html#supplementary-information.
Kuang, C., P. H. McMurry, and A. V. McCormick (2009), Determination of cloud condensation nuclei production from measured new particle formation events, Geophysical Research Letters, 36(9), L09822, doi:10.1029/2009GL037584.
Kuang, C., P. H. McMurry, A. V. McCormick, and F. L. Eisele (2008), Dependence of nucleation rates on sulfuric acid vapor concentration in diverse atmospheric locations, Journal of Geophysical Research: Atmospheres, 113(D10), n/a-n/a, doi:10.1029/2007jd009253.
Kulmala, M., H. Vehkamäki, T. Petäjä, M. Dal Maso, A. Lauri, V. M. Kerminen, W. Birmili, and P. H. McMurry (2004), Formation and growth rates of ultrafine atmospheric particles: a review of observations, Journal of Aerosol Science, 35(2), 143-176, doi:http://dx.doi.org/10.1016/j.jaerosci.2003.10.003.
126
Kupiainen-Määttä, O., T. Olenius, T. Kurtén, and H. Vehkamäki (2013), CIMS Sulfuric
Acid Detection Efficiency Enhanced by Amines Due to Higher Dipole Moments: A Computational Study, The Journal of Physical Chemistry A, 117(51), 14109-14119, doi:10.1021/jp4049764.
Kupiainen, O., I. K. Ortega, T. Kurtén, and H. Vehkamäki (2012), Amine substitution into sulfuric acid - ammonia clusters, Atmos. Chem. Phys., 12(8), 3591-3599, doi:10.5194/acp-12-3591-2012.
Kürten, A., et al. (2014), Neutral molecular cluster formation of sulfuric acid–dimethylamine observed in real time under atmospheric conditions, Proceedings of the National Academy of Sciences, doi:10.1073/pnas.1404853111.
Kurtén, T., et al. (2011), The effect of H2SO4 & amine clustering on chemical ionization mass spectrometry (CIMS) measurements of gas-phase sulfuric acid, Atmos. Chem. Phys., 11(6), 3007-3019, doi:10.5194/acp-11-3007-2011.
Kurtén, T., L. Torpo, M. R. Sundberg, V. M. Kerminen, H. Vehkamäki, and M. Kulmala (2007), Estimating the NH3:H2SO4 ratio of nucleating clusters in atmospheric conditions using quantum chemical methods, Atmos. Chem. Phys., 7(10), 2765-2773, doi:10.5194/acp-7-2765-2007.
Larriba, C., and C. J. Hogan (2013a), Free molecular collision cross section calculation methods for nanoparticles and complex ions with energy accommodation, Journal of Computational Physics, 251(0), 344-363, doi:http://dx.doi.org/10.1016/j.jcp.2013.05.038.
Larriba, C., and C. J. Hogan (2013b), Ion Mobilities in Diatomic Gases: Measurement versus Prediction with Non-Specular Scattering Models, The Journal of Physical Chemistry A, 117(19), 3887-3901, doi:10.1021/jp312432z.
Larriba, C., C. J. Hogan, M. Attoui, R. Borrajo, J. F. Garcia, and J. F. de la Mora (2011), The Mobility–Volume Relationship below 3.0 nm Examined by Tandem Mobility–Mass Measurement, Aerosol Science and Technology, 45(4), 453-467, doi:10.1080/02786826.2010.546820.
Leopold, K. R. (2011), Hydrated Acid Clusters, Annual Review of Physical Chemistry, 62(1), 327-349, doi:doi:10.1146/annurev-physchem-032210-103409.
Leverentz, H. R., J. I. Siepmann, D. G. Truhlar, V. Loukonen, and H. Vehkamäki (2013), Energetics of Atmospherically Implicated Clusters Made of Sulfuric Acid, Ammonia, and Dimethyl Amine, The Journal of Physical Chemistry A, 117(18), 3819-3825, doi:10.1021/jp402346u.
Lovejoy, E. R., and J. Curtius (2001), Cluster Ion Thermal Decomposition (II): Master Equation Modeling in the Low-Pressure Limit and Fall-Off Regions. Bond Energies for HSO4-(H2SO4)x(HNO3)y, The Journal of Physical Chemistry A, 105(48), 10874-10883, doi:10.1021/jp012496s.
McGrath, M. J., T. Olenius, I. K. Ortega, V. Loukonen, P. Paasonen, T. Kurtén, M. Kulmala, and H. Vehkamäki (2012), Atmospheric Cluster Dynamics Code: a flexible method for solution of the birth-death equations, Atmos. Chem. Phys., 12(5), 2345-2355, doi:10.5194/acp-12-2345-2012.
McMurry, J. (2008), Organic Chemistry, 7th ed., Thomson Brooks/Cole.
127

McMurry, P. H. (1980), Photochemical aerosol formation from SO2: A theoretical
analysis of smog chamber data, Journal of Colloid and Interface Science, 78(2), 513-527, doi:http://dx.doi.org/10.1016/0021-9797(80)90589-5.
McMurry, P. H. (1983), New particle formation in the presence of an aerosol: Rates, time scales, and sub-0.01 μm size distributions, Journal of Colloid and Interface Science, 95(1), 72-80, doi:http://dx.doi.org/10.1016/0021-9797(83)90073-5.
Murphy, D. M., and D. W. Fahey (1987), Mathematical treatment of the wall loss of a trace species in denuder and catalytic converter tubes, Analytical Chemistry, 59(23), 2753-2759, doi:10.1021/ac00150a006.
Olenius, T., O. Kupiainen-Määttä, I. K. Ortega, T. Kurtén, and H. Vehkamäki (2013), Free energy barrier in the growth of sulfuric acid–ammonia and sulfuric acid–dimethylamine clusters, The Journal of Chemical Physics, 139(8), -, doi:doi:http://dx.doi.org/10.1063/1.4819024.
Ortega, I. K., O. Kupiainen, T. Kurtén, T. Olenius, O. Wilkman, M. J. McGrath, V. Loukonen, and H. Vehkamäki (2012), From quantum chemical formation free energies to evaporation rates, Atmos. Chem. Phys., 12(1), 225-235, doi:10.5194/acp-12-225-2012.
Ortega, I. K., T. Olenius, O. Kupiainen-Määttä, V. Loukonen, T. Kurtén, and H. Vehkamäki (2014), Electrical charging changes the composition of sulfuric acid–ammonia/dimethylamine clusters, Atmos. Chem. Phys., 14(15), 7995-8007, doi:10.5194/acp-14-7995-2014.
Ouyang, H., S. He, C. Larriba-Andaluz, and C. J. Hogan (2015), IMS–MS and IMS–IMS Investigation of the Structure and Stability of Dimethylamine-Sulfuric Acid Nanoclusters, The Journal of Physical Chemistry A, doi:10.1021/jp512645g.
Paasonen, P., et al. (2012), On the formation of sulphuric acid - amine clusters in varying atmospheric conditions and its influence on atmospheric new particle formation, Atmos. Chem. Phys., 12(19), 9113-9133, doi:10.5194/acp-12-9113-2012.
Panta, B., W. A. Glasoe, J. H. Zollner, K. K. Carlson, and D. R. Hanson (2012), Computational Fluid Dynamics of a Cylindrical Nucleation Flow Reactor with Detailed Cluster Thermodynamics, The Journal of Physical Chemistry A, 116(41), 10122-10134, doi:10.1021/jp302444y.
Petäjä, T., M. Sipilä, P. Paasonen, T. Nieminen, T. Kurtén, I. K. Ortega, F. Stratmann, H. Vehkamäki, T. Berndt, and M. Kulmala (2011), Experimental Observation of Strongly Bound Dimers of Sulfuric Acid: Application to Nucleation in the Atmosphere, Physical Review Letters, 106(22), 228302.
Pöschl, U., M. Canagaratna, J. T. Jayne, L. T. Molina, D. R. Worsnop, C. E. Kolb, and M. J. Molina (1998), Mass Accommodation Coefficient of H2SO4 Vapor on Aqueous Sulfuric Acid Surfaces and Gaseous Diffusion Coefficient of H2SO4 in N2/H2O, The Journal of Physical Chemistry A, 102(49), 10082-10089, doi:10.1021/jp982809s.
Premnath, V., D. Oberreit, and C. J. Hogan (2011), Collision-Based Ionization: Bridging the Gap between Chemical Ionization and Aerosol Particle Diffusion Charging, Aerosol Science and Technology, 45(6), 712-726, doi:10.1080/02786826.2011.556683.
128

Riipinen, I., et al. (2007), Connections between atmospheric sulphuric acid and new
particle formation during QUEST III-IV campaigns in Heidelberg and Hyytiälä, Atmos. Chem. Phys., 7(8), 1899-1914, doi:10.5194/acp-7-1899-2007.
Rosser, S., and J. F. de la Mora (2005), Vienna-Type DMA of High Resolution and High Flow Rate, Aerosol Science and Technology, 39(12), 1191-1200, doi:10.1080/02786820500444820.
Schobesberger, S., et al. (2013), Molecular understanding of atmospheric particle formation from sulfuric acid and large oxidized organic molecules, Proceedings of the National Academy of Sciences, 110(43), 17223-17228, doi:10.1073/pnas.1306973110.
Seinfeld, J. H., S. N. Pandis (2006), Atmospheric Chemistry and Physics- From Air Pollution to Climate Change, John Wiley and Sons, Inc, Hoboken, NJ.
Slocum, R. D., and H. E. Flores (1991), Biochemistry and Physiology of Polyamines in Plants, Taylor & Francis.
Su, T., and M. T. Bowers (1973), Theory of ion‐polar molecule collisions. Comparison with experimental charge transfer reactions of rare gas ions to geometric isomers of difluorobenzene and dichloroethylene, The Journal of Chemical Physics, 58(7), 3027-3037, doi:doi:http://dx.doi.org/10.1063/1.1679615.
Titcombe, M. E. (2012), New particle formation: sulfuric acid and amine chemical nucleation, photochemical reaction chamber studies and the laboratory cluster-CIMS, Ph.D thesis, University of Minnesota - Twin Cities, Minneapolis, MN.
Ude, S., and J. F. de la Mora (2005), Molecular monodisperse mobility and mass standards from electrosprays of tetra-alkyl ammonium halides, Journal of Aerosol Science, 36(10), 1224-1237, doi:10.1016/j.jaerosci.2005.02.009.
Viggiano, A. A., J. V. Seeley, P. L. Mundis, J. S. Williamson, and R. A. Morris (1997), Rate Constants for the Reactions of XO3
-(H2O)n (X = C, HC, and N) and NO3-
(HNO3)n with H2SO4: Implications for Atmospheric Detection of H2SO4, The Journal of Physical Chemistry A, 101(44), 8275-8278, doi:10.1021/jp971768h.
Weber, R. J., J. J. Marti, P. H. McMurry, F. L. Eisele, D. J. Tanner, and A. Jefferson (1996), Measured atmospheric new particle formation rates: implications for nucleation mechanisms, Chemical Engineering Communications, 151(1), 53-64, doi:10.1080/00986449608936541.
Weber, R. J., P. H. McMurry, L. Mauldin, D. J. Tanner, F. L. Eisele, F. J. Brechtel, S. M. Kreidenweis, G. L. Kok, R. D. Schillawski, and D. Baumgardner (1998), A study of new particle formation and growth involving biogenic and trace gas species measured during ACE 1, Journal of Geophysical Research: Atmospheres, 103(D13), 16385-16396, doi:10.1029/97JD02465.
Woo, K. S., D. R. Chen, D. Y. H. Pui, and P. H. McMurry (2001), Measurement of Atlanta Aerosol Size Distributions: Observations of Ultrafine Particle Events, Aerosol Science and Technology, 34(1), 75-87, doi:10.1080/02786820120056.
Yu, H., R. McGraw, and S.-H. Lee (2012), Effects of amines on formation of sub-3 nm particles and their subsequent growth, Geophysical Research Letters, 39(2), L02807, doi:10.1029/2011GL050099.
129
Zhang, Y., P. H. McMurry, F. Yu, and M. Z. Jacobson (2010), A comparative study of
nucleation parameterizations: 1. Examination and evaluation of the formulations, Journal of Geophysical Research: Atmospheres, 115(D20), D20212, doi:10.1029/2010JD014150.
Zhao, J., F. L. Eisele, M. Titcombe, C. Kuang, and P. H. McMurry (2010), Chemical ionization mass spectrometric measurements of atmospheric neutral clusters using the cluster-CIMS, J. Geophys. Res., 115(D8), D08205, doi:10.1029/2009jd012606.
Zhao, J., J. N. Smith, F. L. Eisele, M. Chen, C. Kuang, and P. H. McMurry (2011), Observation of neutral sulfuric acid-amine containing clusters in laboratory and ambient measurements, Atmos. Chem. Phys., 11(21), 10823-10836, doi:10.5194/acp-11-10823-2011.
Zollner, J. H., W. A. Glasoe, B. Panta, K. K. Carlson, P. H. McMurry, and D. R. Hanson (2012), Sulfuric acid nucleation: power dependencies, variation with relative humidity, and effect of bases, Atmos. Chem. Phys., 12(10), 4399-4411, doi:10.5194/acp-12-4399-2012.
130
![Electrospray ionization mass spectrometry of ...93)85031-R.pdfElectrospray Ionization Mass Spectrometry of Phosphopeptides Isolated by On-Line ... this purpose [19~22]. Immobilized](https://static.fdocuments.net/doc/165x107/5ad660d07f8b9a6b668b8d17/electrospray-ionization-mass-spectrometry-of-9385031-rpdfelectrospray-ionization.jpg)


