Chemical Industry Companies in Sweden - …€¦ · Maritime; Forest, pulp and paper ... Denna...
72
VINNOVA ANALYSIS VA 2013:01 JOHANNA MOSSBERG - SP TECHNICAL RESEARCH INSTITUTE OF SWEDEN CHEMICAL INDUSTRY COMPANIES IN SWEDEN
Transcript of Chemical Industry Companies in Sweden - …€¦ · Maritime; Forest, pulp and paper ... Denna...

V I N N O V A A N A l y s I sV A 2 0 1 3 : 0 1
J O h A N N A M O s s b e r g - s P T e c h N I c A l r e s e A r c h I N s T I T u T e O f s w e d e N
ChemiCal industry Companiesin sweden

VINNOVA´s publications are published at www.VINNOVA.se
Title: Chemical Industry Companies in SwedenAuthor: Johanna Mossberg - SP Technical Research Institute of SwedenSeries: VINNOVA Analysis VA 2013:01ISBN: 978-91-86517-79-3ISSN: 1651-355XPublished: February 2013Publisher: VINNOVA - Swedish Governmental Agency for Innovation Systems/Verket för InnovationssystemCase No: 2011-04085
VINNOVA - strengthening Sweden´s innovativeness
VINNOVA is Sweden’s innovation agency. Our mission is to promote sustainable growth by improving the conditions for innovation, as well as funding needs-driven research.
VINNOVA’s vision is for Sweden to be a world-leading country in research and innovation, an attractive place in which to invest and conduct business. We promote collaborations between companies, universities, research institutes and the public sector. We do this by stimulating a greater use of research, by making long-term investment in strong research and innovation milieus and by developing catalytic meeting places. VINNOVA’s activities also focus on strengthening international cooperation. In order to increase our impact, we are also dedicated to interacting with other research financiers and innovation-promoting organisations. Every year VINNOVA invests about SEK 2 billion in various initiatives.
VINNOVA is a Swedish government agency working under the Ministry of Enterprise, Energy and Communications and acts as the national contact agency for the EU Framework Programme for R&D. We are also the Swedish government’s expert agency within the field of innovation policy. VINNOVA was founded in January 2001. About 200 people work here and we have offices in Stockholm and Brussels. Our Director General is Charlotte Brogren.
The VINNOVA Analysis series includes publications of studies, analyses, official reports and evaluations that have been produced or commissioned by VINNOVA´s Operational Development Division.
Chemical Industry Companies in Sweden
by
Johanna Mossberg – SP Technical Research Institute of Sweden
SP: PX18251


Preface
Operations at VINNOVA – the Swedish innovation agency – require a solid knowledge of the Swedish national, regional and sectorial systems for innovation in an international perspective. This includes knowledge of the stakeholders in the innovation system as well as their respective roles, global context, networks and innovation processes. The knowledge base is used in strategy processes, in dialogues with stakeholders in the innovation system, in operative activities and as a support during follow-up, evaluation and effect analyses of VINNOVA activities.
The following components are part of the knowledge needed about innovation systems. These affect the ability for innovation, and therefore Swedish competitiveness:
• The economy and industrial trends • Policies and systems • Research, development and innovation • The needs and challenges of society
Within its framework of strategic monitoring VINNOVA has embarked on a series of analyses of trends for several branches of industry. Parameters examined include business structure, strategic areas for renewal and cooperation in research, and innovation. On-going or recently completed studies include: Life Science; Automotive; Chemicals; Mines and minerals; Metals; Maritime; Forest, pulp and paper; Information and communications technology; Environmental Technology and finally, Energy. The studies are conducted using the same overall methodology, but with certain adaptations to suit the specific characteristics of each branch. VINNOVA intends to supplement these studies with analyses of other branches of industry as well as additional aspects of the innovation systems while taking an international context into consideration. Furthermore these studies will be updated in order to reveal trends, renewals and structural alterations. The present study analyses businesses in the chemical industry.
This work has been carried out in close co-operation with stakeholders in the innovation system, either as participants in working groups or reference groups. The processes and their results are an important part of the VINNOVA dialogue with the regions and the value VINNOVA can offer back to them. The factual material is intended for use in strategic discussions by various stakeholders and stakeholder clusters. In addition to the reports, it is intended to create databases of the collected information, as well as a graphic interface for the presentation of results from the database. This, in turn, will enable the creation of presentations that can be adapted for different contexts and intentions.
The study has been carried out by Johanna Mossberg of SP, Technical Research Institute of Sweden the consultant companies Addendi and Okatima in close cooperation with VINNOVA. The VINNOVA process managers involved were Anna Sandström and Göran Andersson. The reference group included representatives from Kemira, Processum, INEOS, AstraZeneca, Borealis, The Swedish Plastics and Chemicals Federation, Nynäs and VINNOVA.
VINNOVA in February 2013
Margareta Groth Anna Sandström Head of Manufacturing & Materials Department Senior Advisor Manufacturing & Working life Division International Collaboration & Networks


Table of contents
Sammanfattning ............................................................................................... 7
Summary ........................................................................................................... 8
1 Introduction ............................................................................................... 9
2 Scope of the analysis ............................................................................. 11 2.1 Companies included and process for selection ............................................. 11 2.2 Excluded companies ...................................................................................... 12 2.3 Business segments ......................................................................................... 13 2.4 Activity category ........................................................................................... 16 2.5 Number of employees ................................................................................... 18 2.6 Regions .......................................................................................................... 18 2.7 Exports .......................................................................................................... 19 2.8 Comments regarding graphic illustrations .................................................... 19
3 Chemical industry in Sweden 2010 ....................................................... 21 3.1 All companies ................................................................................................ 21 3.2 Large companies and corporate groups ......................................................... 22 3.3 Activity category and export matrix .............................................................. 24 3.4 Development during years 2007 to 2010 ...................................................... 26 3.5 Map visualisation .......................................................................................... 26 3.6 Exports .......................................................................................................... 29 3.7 Fixed assets and capital intensity .................................................................. 30 3.8 Relative results and ownership structure ....................................................... 31 3.9 Participation in the European seventh framework programme ..................... 36 3.10 Universities, research institutes and R&D collaborations ............................. 37
4 Cluster profiles for business segments ................................................ 40 4.1 Refinery (including grease) ........................................................................... 40 4.2 Biorefinery .................................................................................................... 41 4.3 Basic chemicals ............................................................................................. 42 4.4 Chemical products ......................................................................................... 44 4.5 Pharmaceutical products, reagents, etc. ........................................................ 45
5 Regional cluster profiles ........................................................................ 47 5.1 Region North ................................................................................................. 47 5.2 Region Central ............................................................................................... 49 5.3 Region West .................................................................................................. 50 5.4 Region East ................................................................................................... 51 5.5 Region South ................................................................................................. 51

6 Consultants and service companies ..................................................... 53 6.1 The example of direct and indirect employment for two companies in the
chemical industry .......................................................................................... 54
Appendix ......................................................................................................... 55 Biogenic feedstock and the business segment biorefineries .................................... 55 Universities, research institutes, knowledge centres, etc. related to the chemical
industry .......................................................................................................... 55 A summary record of environmental aspects and supplemental information ......... 58 Process for identifying the companies ..................................................................... 59 List of companies .................................................................................................... 60
7
Sammanfattning
Denna rapport ger en översikt över kemiindustrin i Sverige så som den såg ut år 2010. Rapporten belyser några viktiga karaktärsdrag och diskuterar industristrukturen för kemiindustrin i Sverige. Rapporten är kortfattad och dess huvudsakliga syfte är att, med hjälp av de presenterade figurerna, fungera som en grund för strategidiskussioner och ge insikter och idéer till vidare studier av kemiindustrin och andra delar av innovationssystemet kring industrin.
Studien omfattar cirka 450 företag och ger en ögonblicksbild av företagens verksamhet i Sverige år 2010. Bolagen har grupperats baserat på branschsegment, typ av verksamhet, region och exportintensitet. Företag som enbart sysslar med handel, marknadsföring och/eller transport av kemiska produkter har exkluderats. År 2010 svarade den kemiska industrin i Sverige för cirka 34 000 heltidsekvivalenter. Motsvarande siffra år 2007 var cirka 37 500, det vill säga en minskning med cirka 3 500 anställda eller ~ 7 %. Minskningen har till största delen skett inom branschsegmenten "Läkemedel, Reagenser etc." och "Organiska och oorganiska baskemikalier".
Kemiindustrin i Sverige domineras av ett begränsat antal stora företag och koncerner vilket exemplifieras av att 13 % av företagen står för 80 % av de anställda. De tio största företagen och företagsgrupperna svarar för mer än 50 % av de anställda. AstraZeneca och Akzo Nobel koncernen är de två största arbetsgivarna med totalt mer än 10 000 heltidskvivalenter. Förutom de stora företagen utgörs industrin av ett begränsat antal medelstora företag och ett stort antal små- och mikroföretag.
Kemiindustrin i Sverige är i huvudsak lokaliserad kring de tre storstadsregionerna Stockholm/Uppsala, Göteborg och Malmö/Lund. En högre koncentration av kemiföretag återfinns även i de större städerna längs Norrlandskusten. En majoritet, 61 %, av företagen inom den kemiska industrin visade positiva resultat efter finansiella poster under 2010, men hela 87 % av de anställda jobbade i företag med positiva relativa resultat för samma år. Stora företag är överrepresenterade bland företag med positivt resultat medan företag med negativt resultat är jämnt fördelade mellan företag utan export och företag med betydande export och mellan företag med endast produktion och företag med en högre FoU. Utlandsägda företag visar bättre resultat och har högre export än svenskägda företag. En majoritet av företagen (300 +) är svenskägda men en majoritet av de anställda (~ 80 %) arbetar i utlandsägda företag. I genomsnitt är de utlandsägda företagen cirka åtta gånger större än de svenskägda (sett till antalet heltidsekvivalenter).
Majoriteten av företagen är främst inriktade på produktion och bortsett från företag inom branschsegmentet "Läkemedel, reagenser, etc", är endast ett fåtal företag aktiva inom forskning och utveckling.

8
Summary
This report gives an overview of the chemical industry in Sweden in the year 2010. The report highlights some important industry features and discusses the structure of the chemical industry. The report is brief and its main aim is to serve as a basis for discussion as well as give insights and ideas for further studies of the chemical industry in Sweden including other parts of the innovation system connected to it.
This study covers about 450 companies and gives a snapshot of the companies’ activities in Sweden in the year 2010. The companies are grouped by business segment, activity category, region and export intensity. Companies involved only in sales, marketing and/or transport of chemical products have not been included. In the year 2010 the chemical industry in Sweden accounted for about 34 000 FTE (full time employments). For the year 2007 the corresponding number was about 37 500, i.e. a reduction with about 3 500 employees or ~7%. The decrease is most significant within the business segments “Pharmaceutical products, regents, etc.” and the “Organic and inorganic basic chemicals”.
The chemical industry in Sweden is dominated by a limited number of large companies and corporate groups and 13% of the companies account for 80% of the employees. The ten largest companies and corporate groups account for more than 50% of the employees, AstraZeneca and the Akzo Nobel group being the two largest employers. In addition to the large companies, there are a limited number of medium sized companies, and then, a vast number of small and micro-scale companies.
The chemical industry in Sweden is mainly located around its three major metropolitan areas—Stockholm/Uppsala, Göteborg, and Malmö/Lund. There is also a higher concentration of companies in the larger cities on the northern coast of Sweden. A majority, 61%, of the companies in the chemical industry, showed positive results after financial items in 2010, however, as many as 87% of the employees worked in companies with positive relative results 2010. Large companies are overrepresented among companies with positive results. Companies with negative results are evenly distributed between companies with no exports and companies with significant exports, and between companies whose business is only production and companies with a larger R&D department. Foreign owned companies show better results and have higher exports than the Swedish owned. Furthermore, a majority of the companies (300+) are Swedish owned, yet a majority of the employees (~80%) work in foreign owned companies. On average, the foreign owned companies are eight times larger than the Swedish owned, utilising the number of FTEs.
The majority of the companies are focused on production, and apart from companies in the business segment “Pharmaceutical products, reagents, etc.”, only very few companies are active in R&D.

9
1 Introduction
The chemical industry is today producing a broad range of products which we use in our daily lives. More accurately, the chemical industry is providing modern materials and enabling technical solutions in virtually all sectors of the economy. Chemical products are, for example, essential for the development of new and improved products and services in the food industry, the car industry and the pulp and paper industry. New ways to produce energy as well as reducing energy demand, diversifying the raw material base, having clean water, better food and progress in health care are all examples of challenges that could be addressed by the chemical industry as well as by research and development in the field of chemistry.
Compared to, for example, Germany and the Netherlands, the chemical industry in Sweden may seem small. It is, however, an important export industry in Sweden, and as one of our basic industries, it provides an important foundation for other industries and industrial development.
Accurate knowledge of the extent, structure and development of different industry sectors, combined with information about international industrial and scientific trends, is essential for sound policy decisions and for the design of relevant public measures. For this purpose, VINNOVA has initiated a number of consistently performed analyses of different industry sectors. The analysis presented for the chemical industry in this report is one of them. Some of the technologies and processes used by the chemical industry are also used by other sectors, such as the pulp and paper industry and the food industry. In this study, however, only companies with their main activities within the business segments described in the section below are included and analysed. This analysis focuses solely on one part of the innovation system, the companies. It does not, however, include or account for other important parts of the innovation system, such as public authorities, universities or other research organisations.
The overview given in this report presents different aspects of the chemical industry in Sweden, and is based on a database created and categorised by SP Technical Research Institute of Sweden in dialogue with VINNOVA and Region Västra Götaland. The analysis only reflects the companies´ activities in Sweden. The total company population has been identified using NACE1-codes2 together with other sources of information, such as membership lists for trade organisations and lists from cluster organisations. It should be noted that there is a delay in the publication of statistics and thus the latest data available when preparing this report was data for the year 2010. Further, changes due to mergers, acquisitions and liquidations appear with some delay in the statistics. The analysed companies have been classified into different business
1 Statistical Classification of Economic Activities in the European Community 2The NACE-codes used in this analysis are: 19, 20 and 21 including sub-groups.

10
segments, activity categories and degrees of exports. The business segments included are: Refinery (including grease), Biorefinery, Basic chemicals (with sub-segments), Production of chemical products (also with sub-segments) and “Pharmaceutical products, reagents, etc.” The companies’ activities are categorised under the following headings with increasing R&D content: Supporting activities, Manufacturing, Product development, Product development together with R&D operator, Business with R&D, and R&D units. The methodology and how the companies have been categorised into business segments and activities is presented in the following section.
The analyses of the different industry sectors results in comparable figures which show cluster profiles for regions, business segments and the chemical industry as a whole, development of employment and the development of relative results, etc. The cluster profiles are based on the size of the companies in terms of employees, business segments, geographical location, exports and core activities.
This study thus aims to give insights into the size, structure, development and performance of the chemical industry in Sweden between the years 2007 and 2010, and aims to be a foundation for future follow-up studies and analyses.
The report is only one of the subsequent results from the project. The results also include the database and an interactive graphical interface of the aggregated results. The list of companies and some of the information compiled will be made available to individual regions for use in their activities to promote regional development. The main aim of the project is to generate easily accessible information, compiling complex quality assured data to be used as input for strategic discussions among different combinations of organisations and players in the innovation system. It is VINNOVA’s ambition to update the database every several years and in this way follow the development of the chemical industry.

11
2 Scope of the analysis
This study is an analysis of the chemical industry in Sweden. The analysis partly uses statistical data, but should not be viewed as a typical statistical study. Compared to general statistical excerpts and summaries, this study holds a higher quality since both the population and the information about each company have been assessed by experts in the field. The information for each company is based on various sources3 and stored in a database to which a graphical interface is connected.
The text in this report is rather brief and the material and images are primarily designed as a basis for oral presentations and discussions. Thus, the reader is encouraged to draw her own conclusions by studying the graphic illustrations.
The work presented in this report has been performed in dialogue with a reference group including representatives from the chemical industry, trade associations and public stakeholders. However, all assessments and comments included in the report are the author's own.
Members of the reference group: Lars Josefsson, INEOS; Anders Fröberg, Borealis; Lennart Albertsson, Kemira; Claes Engström, Processum; Staffan Folestad, AstraZeneca; Magnus Huss and Ulla Nyman, Plast- & Kemiföretagen; Per Redelius, Nynäs; Mats Robertsson, VINNOVA.
2.1 Companies included and process for selection For the activity category and export matrix, companies which had as their major activity one of the business segments described in Section 2.3 and had at least one employee in 2010 are included. Similarly, the dynamic diagrams included data for companies which have their major activity within the defined business segments and had one or more employees in any of the years 2007-2010.
The population was identified through scanning companies with primary NACE code 19-214 (removing the companies that were not relevant), and through scanning of chemical clusters and cluster initiatives, membership lists of trade associations and relevant knowledge centres and platforms.
3 Statistics, websites, annual reports, personal knowledge and for some companies contact with the individual companies. 4 19:Coke and refined petroleum products, 20:Production of chemicals and chemical products and 21:Basic pharmaceutical products and pharmaceuticals.

12
2.2 Excluded companies Companies devoted to sales, marketing, or transport of chemical products are not included. Subcontractors to companies within the selection of business segments which do not have their core activity within these fields of expertise are not included. Also excluded are companies in other industrial sectors which may have some chemical industry related activities, but not as their core competence or main activity. Examples of such sectors are energy companies and energy service companies, recyclers and the food industry. Intersections of the chemical industry with other industry sectors are most common between the emerging biorefinery business segment and will increase in all likelihood if more focus is placed on developing and producing chemicals and chemical products based on biogenic feedstock.
Companies producing biogas5 Today, most biogas produced is used in the transportation sector. The biogas could, however, just as well be used as feedstock for production of chemicals. In 2010 there were 31 companies which had biogas production as their main activity. However, only six out of these reported having any employees. The reason for this is that many of the biogas companies are associated with other companies that have other main activities such as agriculture or energy companies (e.g., Tekniska Verken i Linköping). Thus the employees employed in the companies producing biogas are counted under other sectors and hard to extract for the biogas producing activities.
The pulp and paper industry In the case of developing biorefineries the pulp and paper industry and chemical industry have quite a few intersections. In principal, biorefineries producing more or less the same products could be introduced in both the pulp and paper industry and the chemical industry. Further, through the development of biorefineries or biobased products these two sectors could be even more closely linked to each other, exchanging intermediate products with each other and/or developing and applying similar processes throughout. One example is Smurfitt Kappa which hosts Chemrec’s demonstration plant of black liquor gasification and also sells tall oil to Sunpine. Other examples are the expanding biorefinery units of SCA and Holmen. In 2009 they had zero employees devoted to biorefinery and now (2012) they together have roughly ten people working with these issues.
Consultants and service companies In recent years, larger companies within the chemical industry have to some extent started to outsource some of their activities as have most of the large companies within the process industry. Further, a number of staffing companies providing personnel to the process industry have appeared. The types of services which are most common to
5 Companies producing biogas were prior to 2009 included in the group of companies producing chemicals and chemical products (in the SIC-code 20, now they have their own code as a subgroup to Sic-code 35:Electricity, gas, steam and air conditioning supply)
13
outsource include: engineering services, service and maintenance, security and guard and restaurant and food service. The companies providing these services are not included in this study since they are also usually providing services to other industry sectors, and thus, the portion of the companies devoted to the chemical industry is difficult to separate from the rest. The scope of all these activities is difficult to estimate, however, an example and further discussion is given in Section 6. Nevertheless, a limited number of small consultant firms which clearly state that they solely work for the chemical industry have been included.
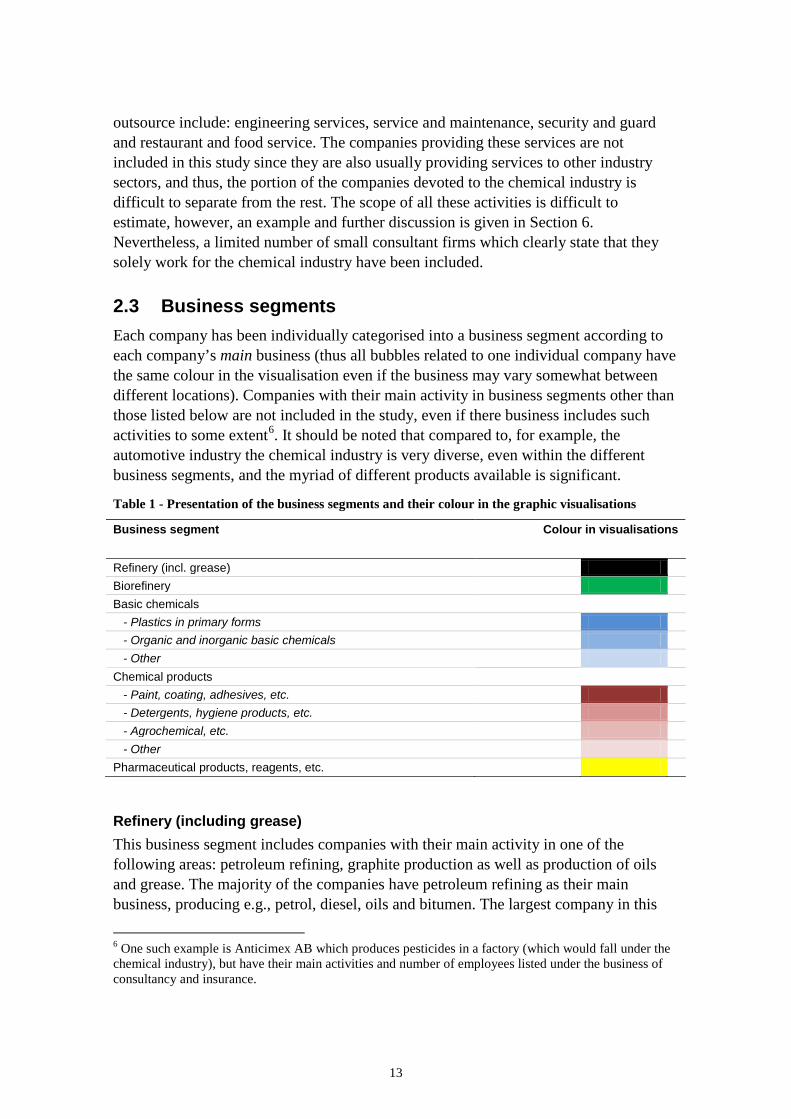
2.3 Business segments Each company has been individually categorised into a business segment according to each company’s main business (thus all bubbles related to one individual company have the same colour in the visualisation even if the business may vary somewhat between different locations). Companies with their main activity in business segments other than those listed below are not included in the study, even if there business includes such activities to some extent6. It should be noted that compared to, for example, the automotive industry the chemical industry is very diverse, even within the different business segments, and the myriad of different products available is significant.
Table 1 - Presentation of the business segments and their colour in the graphic visualisations
Business segment Colour in visualisations
Refinery (incl. grease) Biorefinery Basic chemicals - Plastics in primary forms - Organic and inorganic basic chemicals - Other Chemical products - Paint, coating, adhesives, etc. - Detergents, hygiene products, etc. - Agrochemical, etc. - Other Pharmaceutical products, reagents, etc.
Refinery (including grease) This business segment includes companies with their main activity in one of the following areas: petroleum refining, graphite production as well as production of oils and grease. The majority of the companies have petroleum refining as their main business, producing e.g., petrol, diesel, oils and bitumen. The largest company in this
6 One such example is Anticimex AB which produces pesticides in a factory (which would fall under the chemical industry), but have their main activities and number of employees listed under the business of consultancy and insurance.

14
business segment is Preem. Examples of other companies in this business segment are St1 Refinery, Axel Christersson, Superior Graphite Europe Ltd., Göteborgs Smörjmedelsfabrik (Scanlube) and Nynäs.
Biorefinery In the business segment of chemical biorefineries, companies have been selected which fulfil the following criteria for their main activities: 1) The absolute majority of the raw materials used should be biogenic, 2) The main product should be a “chemical product”, that is, it should be a product which would make the company fall into any of the other business segments if it would not have been for the biogenic raw material, 3) The product or the production process should be innovative or “new”.7 Using this definition companies producing e.g., ethanol or biodiesel, are included, whereas companies producing hygiene products based on imported palm oil are excluded8. The largest company in this business segment is Domsjö fabriker. Examples of other companies in this business segment are Sunpine, Arizona Chemicals, Perstorp Bioproducts, Lantmännen Agroetanol, Värmlandsmetanol, Bioendev (Bio Energy Development North) and Swedish Biofuels.
The main objective of including/defining this business segment is to identify a possible movement or a potential change in the structure of the chemical industry and to give the opportunity to study this change over time (in future work). However, the reader should be aware that as of today there exists no broad consensus regarding the definition of biorefineries, and thus the definition of this business segment and the selection of companies included can, and should, be discussed. Some further perspectives regarding this issue and a discussion regarding the use of biogenic feedstock in other business segments are given in the Appendix.
Basic chemicals The business segments in this group include companies with their main activity in the field of transformation of organic and inorganic raw materials using chemical processes. The segment comprises the manufacture of basic chemicals which are further processed within other segments or industries.
Plastics in primary forms This business segment comprises companies which have as their main activity the area of development and manufacture of plastics in primary forms, such as polymers (including those of ethylene, propylene, styrene, vinyl chloride, vinyl acetate and acrylics), polyamides, phenolic and epoxide resins and polyurethanes, alkyd and
7 The EU definition of a biorefinery as producing at least two products based on biogenic raw material has thus been discarded as too broad, and thereby companies such as Skellefteå Kraft with their facility Biostor (which produce power, heat and pellets) have been excluded from this study. 8 This definition also excludes companies or applications which have used biogenic raw material for a long time, and where using the biogenic raw material, it has not been judged as a novelty or innovation such as e.g., for production of some pharmaceuticals, pesticides or chemicals (e.g., many of the products produced by Akzo Nobel companies).
15
polyester resins and polyethers, silicones and also the manufacture of chemical derivatives. The largest company in this business segment is Borealis producing e.g., polyethylene. Examples of other companies in this sub-segment are INEOS Sverige, Chemiplastica, PA Resins, Habia Teknoflour and BIM Kemi.
Organic and inorganic basic chemicals This business segment comprises a variety of companies developing and producing organic and inorganic basic chemicals for further use in other segments and industries, e.g., the iron and steel industry (Ask Chemicals Scandinavia) and the pulp and paper industry (Eka Chemicals and Marenordic). Companies producing mineral fillers are also included (Imerys Minerals). The largest company in this business segment is Eka Chemicals which produces chemicals for the pulp and paper industry. Examples of other companies in this sub-segment are Kemira, Akzo Nobel Functional Chemicals, Perstorp Speciality Chemicals, Element Six, Sellukem, Carbide Sweden and Feralco Nordic.
Other This business segment includes mainly companies producing industrial gases, dry ice and some other speciality chemicals. The largest company in this business segment is AGA Gas and examples of other companies in this sub-segment are Air Liquide Gas, Polyone Sweden and Isblästring Sverige.
Chemical products The segment includes the transformation of organic and inorganic raw materials through chemical processes and the general formation of products. It comprises the production of intermediate and end products through further processing of base chemicals.
Paint, coating, adhesives, etc. This business segment includes production and development of paint, coating, ink, varnish, adhesives, solvents, thinners, prepared pigments, etc. Thus, the population of companies is rather diverse, including everything from small companies producing linseed oil (e.g. RHL i Högsta) to large companies producing industrial coatings and adhesives (e.g. Akzo Nobel Decorative Coating and Casco Adhesives). Examples of companies in this business segment are Alcro-Beckers, Boastik, Bona, Caparol, Linotech, Bacca Byggkemi, Akzo Nobel Industrial Finishes and Arboritech. The largest companies in this sub-segment are Casco Adhesives and Flügger.
Detergents, hygiene products, etc. Here both companies developing and producing hygiene products, such as facial creams (e.g. Oriflame Products Sweden), wet wipes (e.g. K.Ungh) and hair care products (e.g., Scandinavian Hair), and detergents and cleaning products for both industry and private consumers (e.g., A Clean Partner International) are represented. Companies producing perfumes and essential oils and fragranced soaps and candles are also included (e.g., Natural Fragrance of Sweden and Klockargårdens i Norberg). Many companies are contract manufacturers (e.g., Cleano International and PLS Produkter). The largest

16
company in this sub-segment is Cederroth. Examples of other companies in this sub-segment are Svenska Diskbolaget, Petefa, Nordic Biocosmetic Production, Chemex, Weba Kemi and Dermanord Svensk Hudvård,
Agrochemical, etc. Here manufacture and development of pesticides and other agrochemical products (as well as sprout and growth regulators) are included. The products include insecticides, fungicides, herbicides, rodenticides and biocides. The business segment also includes companies which have their main activity in the field of fertilizers and plant nutrition. The largest company in this sub-segment is Yara. Examples of other companies in this business segment are Nya Bionema, BioBact, SweTree Technologies and Binab Bio-Innovation.
Other This business segment includes the manufacture of explosives and pyrotechnics, essential oils, artificial fibres and other chemical products such as photochemical products (including film and photosensitive paper). This business segment also comprises some companies with diverse activities, which due to the lack of one dominating product, could not be placed in other business segments. The largest company in this sub-segment is Orica Sweden9 and examples of other companies in the sub-segment are EPC Sverige, Pyroswede, Swedish Match Industries, Eurenco Bofors, Textilfilter Scandinavia and Bycotest.
Pharmaceutical products, reagents, etc. This business segment includes the manufacture of basic pharmaceutical products and medicines. Also included is the production of medical chemicals, reagents and diagnostic products. The largest company is Astra Zeneca. There exists a similar study to this one for this business segment regarding the Swedish Life science industry10. At least 15 of the manufacturing companies in this business segment are contract manufacturers.
2.4 Activity category Each company, or company site, has been assigned to one activity category according to its activities in specific business units (establishments) in Sweden. Companies with more than 450 employees have been divided into different activity categories shown as separate bubbles. Companies with fewer than 450 employees and several activity categories within the company have been placed in the activity category which is highest on the vertical axis11. This means that if the company has both product
9 Formerly known as Dyno Nobel Sweden. 10 See http://www.vinnova.se/upload/EPiStorePDF/va-11-03.pdf 11 For a few companies, however, information was available regarding number of employees in different activity categories and these companies have been divided accordingly. This mainly concerns companies with both production and supporting activity in the same region (but at different sites).

17
development and manufacturing activities, they appear under “Product development” on the vertical axis.
R&D units and R&D parts of larger companies In this activity category, the bubble actually represents the number of persons engaged in R&D work.
Business or production unit - with R&D Here companies with their own research within one or a few key areas are included. These companies usually also have production activities. The size of the bubble in the bubble diagram, however, reflects the total number of employees, and not only the ones engaged in R&D- unless the company has more than 450 employees as previously mentioned.
Business or production unit - with product development in cooperation with R&D operator Here companies that mainly design and manufacture their own or other companies’ products/services are included. They do not have their own research, but they have recently been, or are involved in, national research programmes or conduct product development together with universities or research institutes. These connections and cooperation with R&D actors may be a first step for the companies to develop their competitive edge. This category also includes consultants whom have their whole business in the field of supporting chemical companies with their R&D and R&D processes.
Business or production unit - with product development The companies in this category develop products and services in their own business, i.e. incremental product development without elements of exploratory research.
Production This activity category refers to companies or sites which manufacture products. This category also includes a small number of consultants who have no R&D content in their business and produce services solely for the chemical industry.
Supporting activities, head office, administration, retail, storage or production of non-chemical products, etc. This activity category refers to activities which the company or company site might engage in, but which are not related to production or development of chemical products. Such activities are e.g., a separate unit for administration, marketing, sales, etc. (e.g., Syrgis Performance Initiators office in Mölnlycke), sites for storage of products/ intermediate products (e.g., Nynäs activities in Kalmar, Malmö, Västerås, etc) or stores where the products produced are sold (common for the business segment “Paint, coating, adhesives”, etc. where Flügger, for example, have one production facility and a vast number of retail stores).

18
2.5 Number of employees In the graphic illustrations, the size of companies, measured by number of full-time equivalent (FTE) employees, is given as a bubble where the size of the company or operation is proportional to the volume of the bubble12.
Following contact with the companies, those with more than 450 employees have been divided into different activity categories (rather than different business segments). The bubble highest on the vertical axis is downsized according to the number of employees in other activity categories and new bubbles are created for those units. The procedure has been done for the companies which clearly expressed that they have a separate R&D department. Further, companies with operations in different regions are divided into the corresponding number of bubbles, where the volume is proportional to the number of employees in each region.
2.6 Regions For the activity category and export matrix (see e.g., Fig. 4) Sweden has been divided into five regions: North, Central, West, East and South. For companies with operations in several regions, their activity in each region is shown. The regions are comprised of their respective list of counties below.
Region North: Norrbotten, Västerbotten, Jämtland, Västernorrland, Gävleborg and Dalarna.
Region Central: Uppsala, Stockholm, Södermanland, Västmanland and Örebro.
Region West: Västra Götaland, Värmland and Halland.
Region East: Östergötland, Jönköping, Kalmar and Gotland.
Region South: Kronoberg, Blekinge and Skåne.
12 The number of full-time equivalent employees is reported by companies in their annual report to the Swedish Companies Registration Office. The actual number of people employed in companies may be 20-30% higher due to part-time posts, leave of absence etc.

19
2.7 Exports In the statistics used, the export data for each company is given in the following intervals13:
1 – 249 kSEK/year 250 – 999 kSEK/year 1 – 1.0 MSEK/year 2 – 4.9 MSEK/year 5 – 9.9 MSEK/year 10 – 49.9 MSEK/year 50 – 99.9 MSEK/year More than 100 MSEK/year
The export data given in absolute numbers have then been divided by the net turnover for each company giving the export in relation to turnover [%]. For the graphical illustrations in this report three different export categories have been used: No exports, Some exports, and Significant exports. Where “Some exports” is defined as exports of 1-50% of annual turnover and “Significant exports” as more than 50% in relation to company turnover. All companies with exports of more than 100 MSEK/year have been placed in the “Significant exports” category, even if their turnover is more than 200 MSEK/year.
2.8 Comments regarding graphic illustrations
Activity category and export matrix The activity category and export matrix presented in this study shows five variables simultaneously:
• Activity category (vertical axis) • Exports (horizontal axis) • Geographical location (horizontal axis) • Business segment (colour of bubble) • Company size in terms of the number of full time employees (bubble size)
The reader is encouraged to draw her own conclusions based on different combinations of these variables.
Dynamic diagrams The database used for this report dates back to 2007. It includes some companies which no longer exist as well as the number of employees and financial data for these companies. Thus, dynamic diagrams regarding such indicators can be obtained for the
13 Where kSEK stands for thousand SEK and MSEK stands for million SEK.

20
period 200714-2010. The data is based on the information that companies submits to the Companies’ Registration Office in their annual reports. These values are available in October the year following the fiscal year. Thus, when this report was prepared data for 2010 was the most recent data available. This delay may be perceived as long, however, experience from similar structural analysis has determined that changes in the industry are slow and that change also requires long-term action.
Map visualisation In the map visualisation (Figure 6), all bubbles in the diagram are distributed by county according to their geographic location. They have been randomly distributed within each municipality. The four circles with bubbles in them just outside the map represent the municipalities of Stockholm, Göteborg, Lund and Malmö where the concentration of companies/bubbles is larger than the area available for visualisation on the map.
14 This was when a new industry classification standard of Swedish industry was introduced. A general problem with the introduction of a new industrial classification is the conflict between the interests of the new standard will provide better opportunities to highlight the changes in industry structure, while it is important that as much as possible to maintain reasonably intact time series. For this work consistent time series prior to 2007 were not possible to obtain.

21
3 Chemical industry in Sweden 2010
3.1 All companies The total number of companies identified in the present study as active in research and development, product development, consulting or manufacturing within the included business segments of the chemical industry in Sweden is about 440, with a total of 34,000 employees. This does not include companies focusing on sales, marketing or transportation of chemical products. Figure 1 shows that the companies in the business segment “Pharmaceutical products, reagents, etc.” reflects almost half of the employment in the chemical industry, but only contains about 20% of the number of companies. The chemical industry is dominated by a limited number of large companies, a structure which is further discussed in Section 3.2. The majority of the companies have their main business in production of chemical products.
Figure 1 - The chemical industry in Sweden 2010 divided by companies and employees in the different business segments
Number of companies: 438 Number of employees: ~34 000
Refinery incl. grease
Biorefinery
Basic chemicals - Plastics in primary forms
Basic chemicals - Organic and inorganic basic chemicals
Basic chemicals - Other
Chemical products - Paint, coating, adhesives etc.
Chemical products - Detergents, hygiene products etc.
Chemical products - Agrochemicals etc.
Chemical products - Other
Pharmaceutical products, reagents etc.

22
3.2 Large companies and corporate groups The chemical industry in Sweden is dominated by a small number of large companies and corporate groups. Essentially 14% (61) of the companies jointly employ 27 300 FTE which corresponds to 80% of the total employment in the Swedish chemical industry. The fifteen largest companies are listed in Table 2. Only three of these companies are Swedish owned and they are all in the business segment of Pharmaceutical products, etc. (Octapharma, Apoteket Production och Laboratorier and Swedish Orphan Biovitrum). Out of the employees in the 15 largest companies only 8% (1 429) work in companies with Swedish ownership.
As can be seen in the table, the number of employees in the fifteen largest companies decreased by roughly 2 800 people between the year 2007 and the year 2010. This is equal to 75% of the total decrease of employment in the Swedish chemical industry during these years15.
Table 2 - The fifteen largest chemical industry companies in Sweden 2010
The 15 largest companies Business segment (colour)
Country affiliation for parent company
Number of employees
2010
Number of employees
2007
AstraZeneca GB 7 277 9 407
GE Healthcare Bio-Sciences US 1 632 1 689
Preem CY 1 315 1 445
Borealis AE 936 1 034
Fresenius Kabi DE 926 887
Eka Chemicals* NL 908 1 231
AGA Gas DE 907 915
McNeil US 756 867
Octapharma SE 557 514
Flügger DK 474 436
Apoteket produktion och laboratorier SE 438 46016
Swedish Orphan Biovitrum SE 434 539
Phadia LU 418 444
Akzo Nobel Functional Chemicals* NL 407 415
Akzo Nobel Surface Chemistry* NL 399 328
Total 17 784 20 611
*Part of the Akzo Nobel Group (in total the group consists of > 10 companies in Sweden)
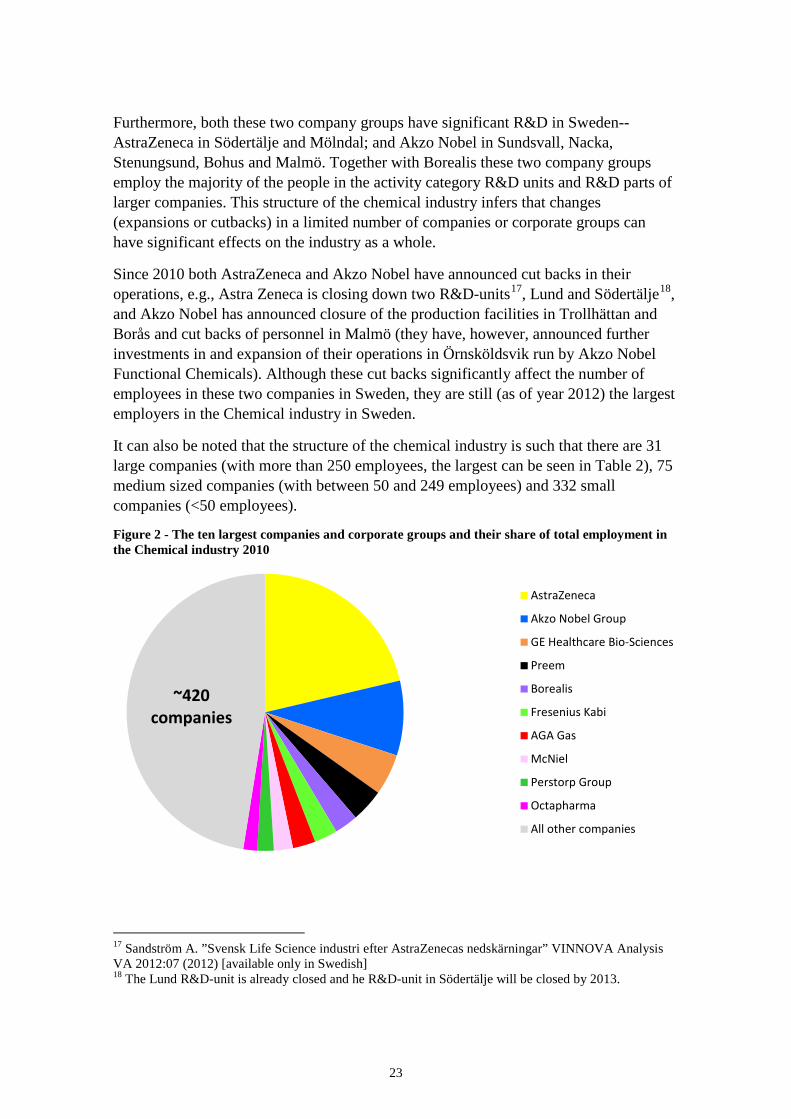
Together with AstraZeneca, Akzo Nobel is a major employer; in fact in 2010 these two company groups comprised more than 25% of the total employment in the Swedish Chemical industry, see Figure 2. In 2010 AstraZeneca was located in Mölndal, Södertälje and Lund. The Akzo Nobel group are more spread out, conducting business in all five geographic regions described in the present study and at more than 10 sites. 15 However, these jobs could have moved to another sector, see Section 6 for discussion. 16 Started in 2008 with 460 FTE.
23
Furthermore, both these two company groups have significant R&D in Sweden-- AstraZeneca in Södertälje and Mölndal; and Akzo Nobel in Sundsvall, Nacka, Stenungsund, Bohus and Malmö. Together with Borealis these two company groups employ the majority of the people in the activity category R&D units and R&D parts of larger companies. This structure of the chemical industry infers that changes (expansions or cutbacks) in a limited number of companies or corporate groups can have significant effects on the industry as a whole.
Since 2010 both AstraZeneca and Akzo Nobel have announced cut backs in their operations, e.g., Astra Zeneca is closing down two R&D-units17, Lund and Södertälje18, and Akzo Nobel has announced closure of the production facilities in Trollhättan and Borås and cut backs of personnel in Malmö (they have, however, announced further investments in and expansion of their operations in Örnsköldsvik run by Akzo Nobel Functional Chemicals). Although these cut backs significantly affect the number of employees in these two companies in Sweden, they are still (as of year 2012) the largest employers in the Chemical industry in Sweden.
It can also be noted that the structure of the chemical industry is such that there are 31 large companies (with more than 250 employees, the largest can be seen in Table 2), 75 medium sized companies (with between 50 and 249 employees) and 332 small companies (<50 employees).
Figure 2 - The ten largest companies and corporate groups and their share of total employment in the Chemical industry 2010
17 Sandström A. ”Svensk Life Science industri efter AstraZenecas nedskärningar” VINNOVA Analysis VA 2012:07 (2012) [available only in Swedish] 18 The Lund R&D-unit is already closed and he R&D-unit in Södertälje will be closed by 2013.
AstraZeneca
Akzo Nobel Group
GE Healthcare Bio-Sciences
Preem
Borealis
Fresenius Kabi
AGA Gas
McNiel
Perstorp Group
Octapharma
All other companies
~420companies
24
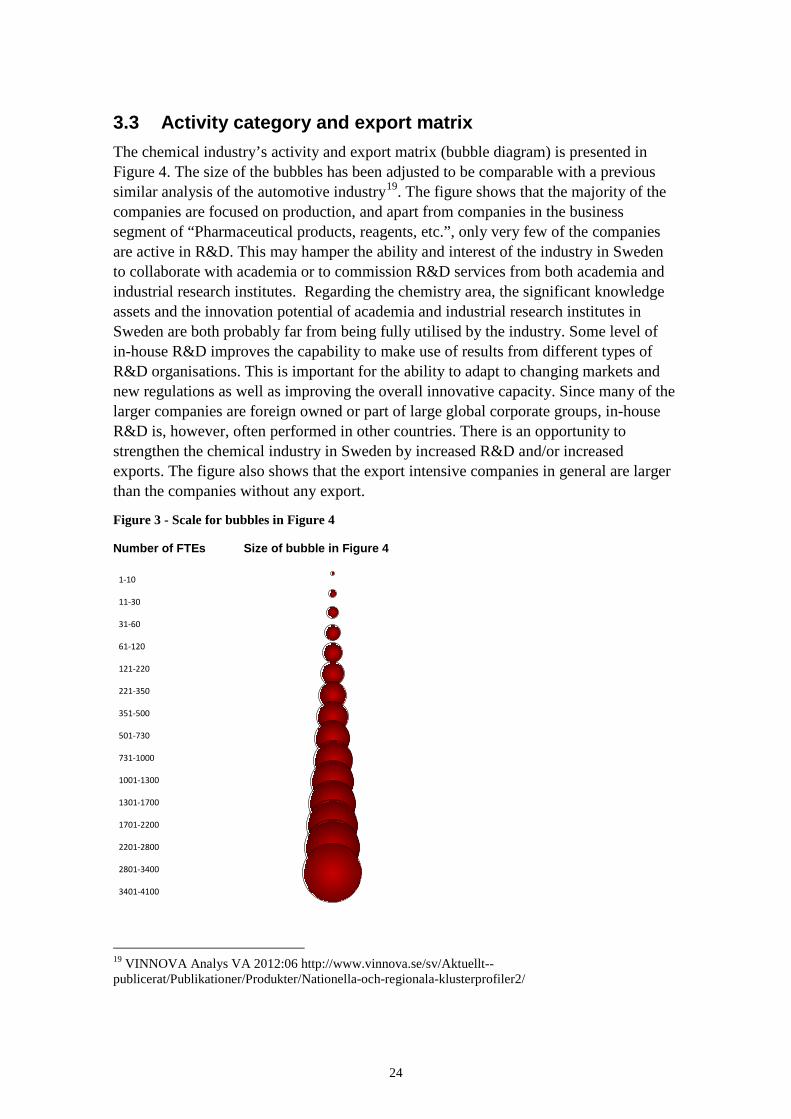
3.3 Activity category and export matrix The chemical industry’s activity and export matrix (bubble diagram) is presented in Figure 4. The size of the bubbles has been adjusted to be comparable with a previous similar analysis of the automotive industry19. The figure shows that the majority of the companies are focused on production, and apart from companies in the business segment of “Pharmaceutical products, reagents, etc.”, only very few of the companies are active in R&D. This may hamper the ability and interest of the industry in Sweden to collaborate with academia or to commission R&D services from both academia and industrial research institutes. Regarding the chemistry area, the significant knowledge assets and the innovation potential of academia and industrial research institutes in Sweden are both probably far from being fully utilised by the industry. Some level of in-house R&D improves the capability to make use of results from different types of R&D organisations. This is important for the ability to adapt to changing markets and new regulations as well as improving the overall innovative capacity. Since many of the larger companies are foreign owned or part of large global corporate groups, in-house R&D is, however, often performed in other countries. There is an opportunity to strengthen the chemical industry in Sweden by increased R&D and/or increased exports. The figure also shows that the export intensive companies in general are larger than the companies without any export.
Figure 3 - Scale for bubbles in Figure 4
Number of FTEs Size of bubble in Figure 4
19 VINNOVA Analys VA 2012:06 http://www.vinnova.se/sv/Aktuellt--publicerat/Publikationer/Produkter/Nationella-och-regionala-klusterprofiler2/
1-10
11-30
31-60
61-120
121-220
221-350
351-500
501-730
731-1000
1001-1300
1301-1700
1701-2200
2201-2800
2801-3400
3401-4100

25
Figure 4 - Activity and export matrix (bubble diagram) for the Chemical industry in Sweden 2010 (The size of the bubbles represents the sizes of the companies or operations given in terms of number of FTE and is proportional to the volume, not the area, of the bubble)
R&
D•
R&
D u
nits
, R&
D
activ
ities
inco
rpor
ated
in
larg
er o
pera
tions
•bu
sine
ss o
r pr
oduc
tion
unit
with
som
eR
&D
Bus
ines
s or
pr
oduc
tion
unit
•w
ithpr
oduc
tdev
elop
-m
ent i
n co
oper
atio
n w
ith
R&
D p
erfo
rmer
•w
ithpr
oduc
tde
velo
pmen
t
Pro
duct
ion
Oth
er•
supp
ort a
ctiv
ities
, he
adof
fice,
adm
inis
tra-
tion,
reta
il, s
tora
ge o
r pr
oduc
tion
of n
on-
chem
ical
prod
ucts
etc
Cen
tral
Sou
th
Wes
t E
ast
Nor
th C
entra
l S
outh
Wes
t E
ast
Nor
th
C
entra
l
Sou
th
Wes
t
Eas
t N
orth
No
expo
rts
Som
e ex
port
sS
igni
fican
t exp
orts
Ref
iner
y in
cl. g
reas
eBi
oref
iner
yBa
sic
chem
ical
s - P
last
ics
in p
rimar
y fo
rms
Basi
c ch
emic
als
- Org
anic
and
inor
gani
c ba
sic
chem
ical
sBa
sic
chem
ical
s - O
ther
Che
mic
al p
rodu
cts
- Pai
nt, c
oatin
g, a
dhes
ives
etc
.C
hem
ical
pro
duct
s - D
eter
gent
s, h
ygie
ne p
rodu
cts
etc.
Che
mic
al p
rodu
cts
- Agr
oche
mic
als
etc.
Che
mic
al p
rodu
cts
- Oth
erPh
arm
aceu
tical
pro
duct
s, re
agen
ts e
tc.

26
3.4 Development during years 2007 to 2010 Between the years 2007 and 2010 the employment in the included companies decreased by 3 700 FTE. As seen in Figure 5, however, the largest reduction occurred in the business segment “Pharmaceutical products, reagents, etc.” The cut backs of AstraZeneca are partly behind these numbers. The largest decrease in the number of employees occurred between the years 2008 and 2009, in the aftermath of the economic crisis of 2008. Apart from the business segment “Pharmaceutical products, reagents, etc.” the largest decrease of employment during the analysed period has occurred within the sub- segment “Organic and inorganic base chemicals” where, for example, large companies such as Eka Chemicals, Perstorp Oxo, Element Six and Böhler Welding Group Nordic have made significant cut backs in their staffing. The decrease in employment is, however, widespread in the whole chemical industry; out of the companies active between the years 2007 and 2010, only about 20 increased their number of employees.
Figure 5 - Dynamic diagram for employment structure
3.5 Map visualisation As can be seen in Figure 6, the companies are primarily located in and around the three Swedish metropolitan areas, Stockholm/Uppsala, Göteborg and Malmö/Lund. However, there are also smaller clusters of companies around cities in northern Sweden, such as Sundsvall.
The figure also shows that the three different cluster regions all have different characteristics with respect to the types of companies located there. For example, the
0
5 000
10 000
15 000
20 000
25 000
30 000
35 000
40 000
45 000
2007 2008 2009 2010
Pharmaceutical products, reagentsetc.Chemical products - Other
Chemical products - Agrochemicalsetc.Chemical products - Detergents,hygiene products etc.Chemical products - Paint, coating,adhesives etc.Basic chemicals - Other
Basic chemicals - Organic andinorganic basic chemicalsBasic chemicals - Plastics in primaryformsBiorefinery
Refinery incl. grease

27
area around Stockholm and Uppsala is heavily populated with companies active in the Production and development of pharmaceutical products, reagents, etc. (yellow), something which mirrors the fact that this area is an important hub for Pharmaceutical and Life Science industry. In this region also strong public actors and universities are located such as Karoliska Institutet and Uppsala University. KTH, Royal Institute of Technology is also an important public actor in the region educating e.g., chemical engineers.
In Västra Götaland and around Göteborg, the majority of companies have their main activities within the Production and development of basic chemicals (blue) and Refinery (black). In Stenungsund, the region holds the largest chemical cluster of its kind in Sweden, producing plastic in primary forms and basic chemicals. Sweden’s largest RME-plant is also located at this site (owned and run by companies in the Perstorp group). In the region, a cluster initiative for the chemical industry exists (hosted by Business Region Göteborg), also including other important actors besides the chemical industry companies themselves, such as Chalmers University of Technology, the Region of Västra Götaland, SP Technical Research Institute of Sweden, and companies from other industry sectors, such as Renova and Göteborg Energi.
The third cluster region, Malmö/Lund, have many companies in the Production and development of chemical products (red) Pharmaceutical products, reagents, etc. (yellow) and Basic chemicals (blue), with a slight emphasis towards production and development of chemical products. In the region, a strong public actor related to the chemical industry is Lund University, with strong competencies in e.g., agricultural biotechnology, something which is reflected in the population of companies in the region.
The Refinery industry (black) is mainly located in Västra Götaland and around Stockholm, whereas the biorefinery industry is strongly represented along the coast of Norrland. Similar to the strength of companies and research connected to agricultural technologies in southern Sweden, industry and academia in Northern Sweden have a long tradition in developing and producing forest based products. With respect to this fact, an initiative worth mentioning is Bio4Energy, which is a strategic research environment consisting of Luleå University of Technology, Umeå University and Swedish University of Agricultural Sciences (only the campus based in Umeå). Bio4Energy has a handful of associated industrial partners, e.g., SEKAB. Another actor in northern Sweden worth mentioning is the member owned company Processum. Processum started in 2003 as a technology park, but has since developed into a biorefinery cluster initiative. The major part of the activities within Processum lies within research and development in the areas of biotechnology, energy technology, inorganic and organic chemistry as well as sustainable raw materials.

28
Figure 6 - Map visualisation of the chemical industry location in Sweden 2010
Refinery incl. greaseBiorefineryBasic chemicals - Plastics in primary formsBasic chemicals - Organic and inorganic basic chemicalsBasic chemicals - OtherChemical products - Paint, coating, adhesives etc.Chemical products - Detergents, hygiene products etc.Chemical products - Agrochemicals etc.Chemical products - OtherPharmaceutical products, reagents etc.
29
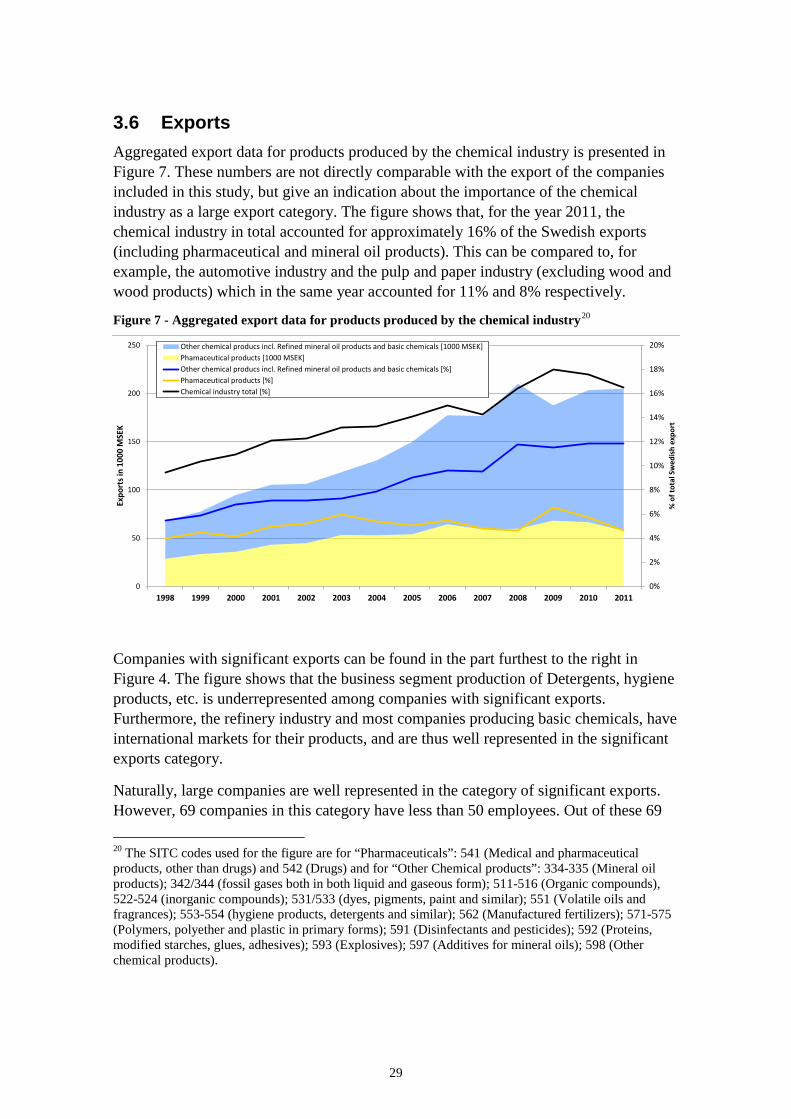
3.6 Exports Aggregated export data for products produced by the chemical industry is presented in Figure 7. These numbers are not directly comparable with the export of the companies included in this study, but give an indication about the importance of the chemical industry as a large export category. The figure shows that, for the year 2011, the chemical industry in total accounted for approximately 16% of the Swedish exports (including pharmaceutical and mineral oil products). This can be compared to, for example, the automotive industry and the pulp and paper industry (excluding wood and wood products) which in the same year accounted for 11% and 8% respectively.
Figure 7 - Aggregated export data for products produced by the chemical industry20
Companies with significant exports can be found in the part furthest to the right in Figure 4. The figure shows that the business segment production of Detergents, hygiene products, etc. is underrepresented among companies with significant exports. Furthermore, the refinery industry and most companies producing basic chemicals, have international markets for their products, and are thus well represented in the significant exports category.
Naturally, large companies are well represented in the category of significant exports. However, 69 companies in this category have less than 50 employees. Out of these 69 20 The SITC codes used for the figure are for “Pharmaceuticals”: 541 (Medical and pharmaceutical products, other than drugs) and 542 (Drugs) and for “Other Chemical products”: 334-335 (Mineral oil products); 342/344 (fossil gases both in both liquid and gaseous form); 511-516 (Organic compounds), 522-524 (inorganic compounds); 531/533 (dyes, pigments, paint and similar); 551 (Volatile oils and fragrances); 553-554 (hygiene products, detergents and similar); 562 (Manufactured fertilizers); 571-575 (Polymers, polyether and plastic in primary forms); 591 (Disinfectants and pesticides); 592 (Proteins, modified starches, glues, adhesives); 593 (Explosives); 597 (Additives for mineral oils); 598 (Other chemical products).
0%
2%
4%
6%
8%
10%
12%
14%
16%
18%
20%
0
50
100
150
200
250
1998 1999 2000 2001 2002 2003 2004 2005 2006 2007 2008 2009 2010 2011
% o
f tot
al S
wed
ish
expo
rt
Expo
rts i
n 10
00 M
SEK
Other chemical producs incl. Refined mineral oil products and basic chemicals [1000 MSEK]Phamaceutical products [1000 MSEK]Other chemical producs incl. Refined mineral oil products and basic chemicals [%]Phamaceutical products [%]Chemical industry total [%]

30
smaller companies, the majority has no element of R&D. The majority of the smaller companies are active in the fields of Pharmaceutical products, reagents, etc. (to a large extent reagents and products for diagnostics) and Paint, coating adhesives, etc. (mainly speciality products, e.g., industrial coatings and adhesives and products for drytech). Examples of smaller companies with significant exports are: Bycosine (producing additives for heavy oils); IDL Biotech (developing and producing diagnostic tests for use within the area of oncology); Lyckeby Industrial (developing producing adhesives for industrial users); Syrgis Performance Initiators (producing organic peroxides); and Bactiguard (developing coatings which reduce the risk of infection within healthcare).
As seen in Figure 4, the companies with high elements of R&D usually also have significant exports. Accordingly, the companies with no exports are mainly focused on production without any element of R&D.
3.7 Fixed assets and capital intensity By definition, capital intensive industries use a large portion of their capital to invest in expensive machines, or other fixed assets21 compared to their labour costs. Due to significant expenses for fixed assets, these companies are subject to a greater financial risk compared to labour intensive companies.
For sectors and business segments which are capital intensive or demand investments in large fixed assets, there is a significant financial barrier to enter the marketplace or renew the production (to e.g., enter a new market or market niche). Significant financial barriers slow down the rate of technological innovation (especially if the access to capital is limited), and thus, for this type of capital intensive industry, new production units and companies with high tech machinery or new products and processes might hold a small share of the marketplace, even though they raise general productivity and output.
The companies with the highest levels of fixed assets are found almost exclusively amongst the Pharmaceutical companies and the Basic chemical companies. For the basic chemical companies the fixed assets are mainly material, that is machinery and process equipment, whereas for the pharmaceutical companies the fixed assets are to a higher degree both material and immaterial, such as patents and licensing rights. A lower value of fixed assets, however, does not necessarily reflect lower capital intensity; it could also reflect a situation where new investments have been neglected or postponed.
Innovation through investments in new processes and machinery demand large amounts of capital, and thus is associated with large financial risks. Therefore, cooperation and
21 Fixed assets are assets which cannot easily be converted into cash and which are intended to be used for a longer period of time. Fixed assets can be both material (e.g. machinery, equipment and buildings), immaterial (e.g. goodwill, patents and R&D) and financial (e.g. long-term receivables).

31
joint investment between companies in the industry (e.g., along the value chain), or with other sectors, might be an opportunity to enhance innovation. It is also important to remember that many of the big chemical companies in Sweden are foreign-owned, which means that investments in Sweden compete with investments in the companies’ sites in other places around the world.
Figure 8 - Fixed assets in different business segments
Companies with fixed assets > 100 MSEK Companies with fixed assets > 100 MSEK and fixed assets/turnover > 50%
The five companies with highest fixed assets 2010: Astra Zeneca, AGA Gas, Preem, Borealis, Swedish Orphan Biovitrum.
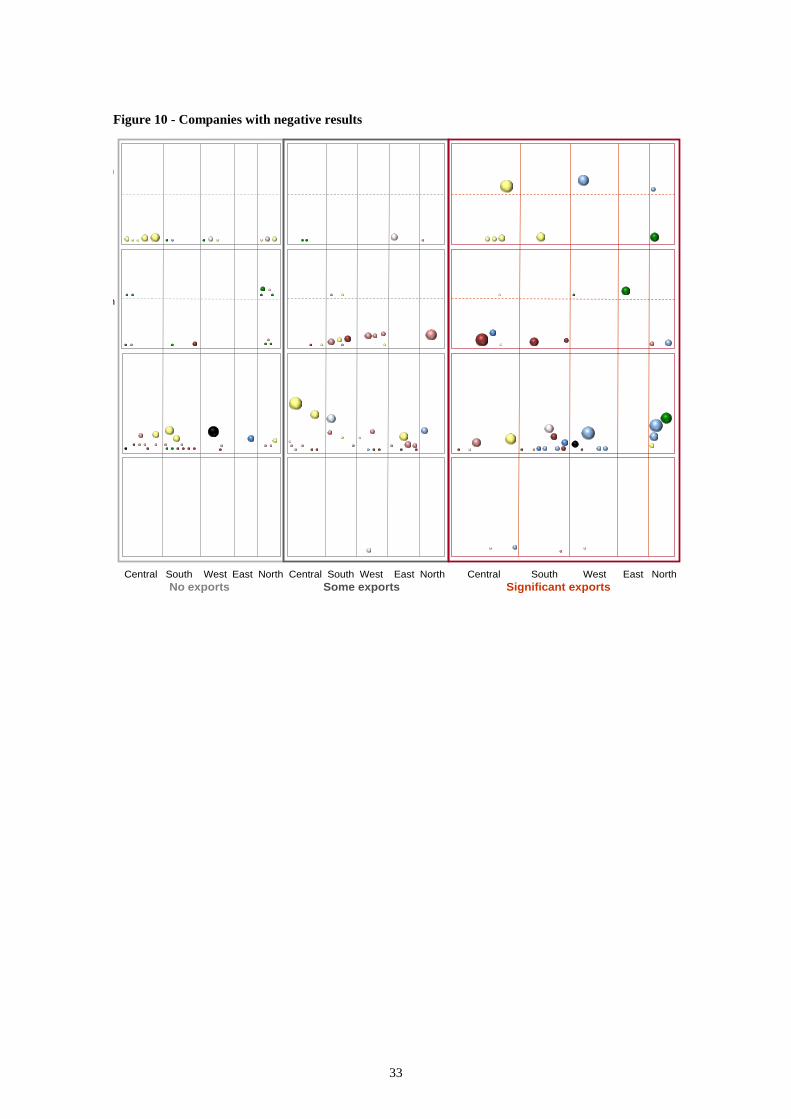
3.8 Relative results and ownership structure A majority, 61%, of the companies in the chemical industry showed positive results after financial items in 2010, however, as many as 87% of the employees worked in companies with positive relative results 2010. Large companies are overrepresented among companies with positive results. Companies with negative results are evenly distributed between companies with no exports and companies with significant exports and also between companies with only production and companies with a higher R&D content (see Figures 9 and 10). Concerning business segments, the segments Biorefineries, Organic and inorganic base chemicals and Detergents, hygiene products, etc. show a higher share of companies with negative relative results compared to the
Refinery incl. grease
Biorefinery
Basic chemicals - Plastics in primary forms
Basic chemicals - Organic and inorganic basic chemicals
Basic chemicals - Other
Chemical products - Paint, coating, adhesives etc.
Chemical products - Detergents, hygiene products etc.
Chemical products - Agrochemicals etc.
Chemical products - Other
Pharmaceutical products, reagents etc.

32
other business segments. It can be noted that the companies which comprise also supporting activities (marketing, sales, and other parts of the value chain or other types of production) almost exclusively show positive results.
Figure 9 - Companies with positive results
Foreign-owned (in terms of parent company nationality) chemical industry companies are often large companies with significant exports and active in R&D and/or manufacturing. The business segments “Biorefineries” and “Detergents, hygiene products”, etc. are underrepresented among foreign-owned companies. These two business segment have rather local/national markets for their products as can be seen in Figures 11 and 12. Most companies with no or low exports are Swedish-owned. Similarly, most companies producing basic chemicals have international markets (and thus significant exports) and are foreign-owned.
33
Figure 10 - Companies with negative results
n
h
Central South West East North Central South West East North Central South West East NorthNo exports Some exports Significant exports

34
Figure 11 - Companies with foreign ownership

35
Figure 12 - Companies with Swedish ownership
Some key numbers are presented in Table 3 which show a comparison between foreign-owned and Swedish-owned companies in the chemical industry. The table shows that the average foreign owned company is roughly eight times larger than the average Swedish-owned company. Further, the foreign-owned companies are more prone to show positive relative results. They also have a higher share of employees in companies with large fixed assets (both in absolute numbers and relative to turnover).
Table 3 - Comparable data for companies with foreign and Swedish ownership
Ownership All companies
Foreign Swedish Number of employees 27 054 7 085 34 139 Number of companies 136 302 438 Average number of employees per company 199 24 78 Share of employees in companies with positive relative results
90% 74% 87%
Share of companies with positive relative results 76% 65% 69% Share of employees in companies with fixed assets/turnover > 50%
55% 32% 50%
Share of employees in companies with fixed assets > 100 MSEK
80% 46% 73%

36
3.9 Participation in the European seventh framework programme
Of the companies included in the present study, 17 have participated in the European Seventh Framework Programme (FP7) (see Table 4). Most large companies with significant R&D in Sweden are represented in Seventh Framework Programme Projects, e.g., AstraZeneca, Perstorp Speciality chemicals, Casco Adhesives and Eka Chemicals (the latter two are both part of the Akzo Nobel group) whereas some are not, e.g., Borealis and Nynäs. AstraZeneca dominates the statistics with participation in 10 projects. At the same time, the largest project by far, in terms of funding to the Swedish participants, is in Energy involving Chemrec AB and Preem Petroleum AB. Viscogel AB is the only company which is a coordinator of a project in the ‘research for SMEs’ section of the programme. Five companies are involved in more than one project. The table shows that the business segment with the most projects by far is “Pharmaceutical products, reagents, etc.” with 17 participations (equal to 55% of the total number of participations by the Swedish chemical industry). However, seven out of these participations are within the Health programme and thus the “chemistry content” in these might be low. The second most active business segment(s) are “Chemical products” (and its sub-segments) with 10 participant projects. Out of these 10 participants, the development company SweTree Technologies and the consultant firm PP-Polymer stand for half (5).
In total, the chemical industry’s participation equals approximately 5% of the total Swedish business participation including SME. Compared to the chemical industry’s share of exports (see Section 3.6), and given that approximately a third of the participant projects are made by AstraZeneca, the Swedish chemical industry’s participation in the seventh framework programme must be regarded as low.

37
Table 4 - Participation in the European Seventh Framework Programme by chemical industry companies
FP7 Programme Bus
ines
s se
gmen
t
Ene
rgy
Env
ironm
ent
Hea
lth
ICT
Food
, agr
icul
ture
and
fish
erie
s,
and
biot
echn
olog
y
Nan
osci
ence
s,
nano
tech
nolo
gies
, mat
eria
ls &
ne
w p
rodu
ctio
n te
chno
logi
es
Peo
ple
Sm
all a
nd m
ediu
m s
ized
en
terp
rises
Spa
ce
Tota
l no.
of p
artic
ipan
t pr
ojec
ts
AstraZeneca 4 2 1 3 10
SweTree Technologies 2 1 3
Bactiguard 1 1 2
Fujirebio Diagnostics 1 1 2
PP-Polymer 1 1 2
Casco Adhesives 1 1
Linotech 1 1
Perstorp Speciality Chemicals 1 1
Eeurenco Bofors 1 1
Plasmatrix Materials 1 1
GE Healthcare Bio-Sciences 1 1
Lavivo 1 1
Viscogel 1 1
Eka Chemicals 1 1
Polykemi 1 1
Preem 1 1
Chemrec 1 1 Source: VINNOVA using data from e-corda (extraction date 2012 06 19)
3.10 Universities, research institutes and R&D collaborations In Sweden, there are no major industry research programmes or research foundations connected to the chemical industry in the way they are connected to other industry sectors such as the energy sector22, pulp and paper industry23 or iron and steel industry24. Consequently, the chemical industry’s trade association is not managing
22 E.g. Elforsk (www.elforsk.se/) and Värmeforsk (www.varmeforsk.se). 23 E.g. the Industry research for wood and forest (in Swedish Branschforskningsprogrammet för skogs- och träindustrin): http://www.vinnova.se/upload/EPiStorePDF/vi-10-03.pdf 24 E.g. Strategic research for the steel industry (in Swedish “Strategiskt stålforskningsprogram för Sverige”: http://www.jernkontoret.se/forskning/stalforskningsprogrammet/index.php

38
research programmes nor is it coordinating common national industry research in the same way as e.g., the trade organisation for the iron and steel industry does25. Some of the more general research programmes financed by the Swedish Energy Agency could be applied also to the chemical industry26, as can parts of the research performed around the three pilot plants for production of the second generation biofuels (black liquor gasification in Piteå, gasification of biomass in Värnamo and production of ethanol in Örnsköldsvik), but there are no industry specific programmes. Publicly financed industry research programmes which encourage additional funding by participating industry partners is one way R&D operators and industry can approach and learn from each other. The lack of such initiatives in Sweden can be one reason to why information regarding R&D collaboration between public and private actors was difficult to find for the chemical industry during the work for this report.
Despite the lack of industry related research programmes and research foundations, significant research is carried out in the field of chemistry and chemical engineering at many Swedish universities and research institutes, some of which are briefly described in the Appendix, together with related knowledge centres, science parks, etc.
Roughly a third of the companies which have some R&D related activities or product development clearly state that they perform these activities in collaboration with universities. The universities most often mentioned are KTH Royal Institute of Technology, Chalmers University of Technology and Lund University. A handful of companies also state that they do research or product development in cooperation with research institutes such as SP Technical Research Institute of Sweden (and subsidiaries, mainly YKI, Institute for Surface Chemistry) and Innventia. The companies which perform their research in collaboration with R&D operators range from large, e.g., Preem which has a partnership with Chalmers University of Technology and Perstorp Speciality Chemicals which collaborates with Lund University in the development of platform chemicals, to small, e.g., Pica Kemi (which develops and produces products for graffiti removal) which perform their product development in collaboration with SP Technical Research Institute of Sweden and Lund University. A number of the smaller companies are academic spin-offs such as Appeartex (which develops and produces biotechnological germicides) founded in 2003 in collaboration with Chalmers Innovation, Xylophane (which is developing a biobased barrier material for packaging) born out of a research project at Chalmers University of Technology and Plasmatrix (which is developing plasma coating for reducing friction) which develops their products in collaboration with researchers at KTH Royal Institute of Technology.
Since the chemical industry by definition is rather diverse, and since only a limited number of companies are active in R&D, it is hard to point out strategic research areas. 25 E.g. Jernkontoret is managing the common Nordic steel research and administrates two large research programmes funded by the Swedish Energy Agency and VINNOVA: “Energiforskningsprogrammet” and “Stålforskningsprogrammet”. 26 E.g.programmes on energy efficiency such as ”Effektivisering av industrins energianvändning”.

39
However, some areas worth mentioning are the development of biobased products and processes (e.g., chemical biorefineries), nanotechnology and its applications in the field of chemistry, process development, reduced environmental impact and areas connected to the field of Life Science (e.g., industrial biotechnology).
Roughly 65% of the companies which state that they perform research or product development in cooperation with R&D operators have less than 50 employees. The companies with external R&D collaborations are represented in all business segments. However, “Pharmaceutical products, reagents, etc.” and “Biorefinery” are the business segments with the most frequent occurrences of collaborations with external R&D operators.
The research areas are manifold and mirror the diverse chemical industry with respect to products, processes and raw materials. Most of the research is, however, quite applied and focused on improving (or adding) properties or features of the products in the company’s product portfolio.

40
4 Cluster profiles for business segments
This section presents the cluster profiles (bubble diagrams) for each business segment. For each business segment, a short discussion is given regarding some of the perspectives that can be seen in the figures. The reader is encouraged to make his/her own further interpretations.
4.1 Refinery (including grease) In 2010, the refinery industry, including the production of graphite and grease, employed 2188 people (FTE).The number of FTEs have remained fairly constant over the years 2007 to 2010. The business segment is largely made up by three larger refinery companies, Preem, Nynäs, and St1 Refinery (previously Shell Raffinaderi), one graphite producer (Superior Graphite) and a limited number of companies developing and manufacturing grease (Axel Christiernsson, etc.). The main activities are carried out solely in Västra Götaland and the areas around Stockholm, apart from Superior Graphite which has their business in Sundsvall. Most of the companies have R&D within the company (e.g., Axel Christiernsson) or are working with product development in cooperation with R&D performers (e.g., Preem). One interesting example to put forward is the joint work which has resulted in Preem’s Evolution Diesel. This product is based on tall oil from the pulp and paper industry which is refined by the company Sunpine (in the business segment Biorefinery), and then blended into Preem’s diesel and sold as a partly green product. Here companies have worked together along the value chain and through joint ownership of the company (Sunpine) innovation has been achieved.
The environmental aspects which are commonly discussed by the companies in this business segment are reduction of emissions and energy efficiency. Also, some companies supply excess heat for district heating purposes.

41
Figure 13 - Cluster profile Refinery including greas
4.2 Biorefinery This business segment consists of two types of companies, larger exporting companies (Lantmännen Agroetanol, SEKAB, Arizona Chemicals, Domsjö Fabriker, etc.) and smaller companies in which consultants and research partners also are represented (e.g., Taurus Energy and Chemrec). The business segment additionally includes facilities currently under development such as Nordic Ethanol and Biogas (Nordisk Etanol och Biogas). In total these companies employ 789 FTEs, mainly in northern Sweden. The number of FTEs has grown by 42% between the years 2007 and 2010. Most of the companies engage in R&D and/or product development, commonly in clusters or in cooperation with other R&D actors or companies. Less than 30% of the companies showed positive results for 2010.
Currently, most companies are focused on development and manufacturing of biofuels, for example Perstorp Bioproducts, which is Sweden’s largest producer of RME. Further, Domsjö Fabriker is Sweden’s largest producer of biogas, although their main product is celluloses used for manufacturing of textiles (viscose). However, some of the companies develop and manufacture chemicals or materials (e.g., Arizona Chemicals and Organoclic) and some are focused on process development (e.g., Bioendev and the process for torrefaction and Värmlandsmetanol and the process for producing methanol from wood). The main environmental aspect put forward by the companies in this
R&D• R&D units, R&D activities incorporated in larger operations
• business or production unit withsome R&D
Business or production unit• with product develop-ment in cooperation with R&D performer• with productdevelopment
Production
Other• support activities, head office, administra-tion, retail, storage or production of non-chemical products etc
Central South West East North Central South West East North Central South West East NorthNo exports Some exports Significant exports

42
business segment is that the products produced by the companies are “better for the environment than alternative products”. The argumentation is often implicit, the products themselves usually have the more or less the same characteristics and environmental impact, the alternative processes and alternative feedstock are what lend a better environmental performance. Most companies, however, put forward and promote the use of a biogenic feedstock.
Figure 14 - Cluster profile Biorefinery
4.3 Basic chemicals In this business segment, products are produced which are used for further processing in other business segments and industry sectors. The market for these products are global, and consequently, most companies in this business segment have some or significant exports. In total, this business segment employs 7 184 FTEs. Between the years 2007 and 2010 the employment in this business segment decreased by 12%. The companies are mainly located around Göteborg, Malmö/Lund, and Sundsvall. The companies in this business segment are rather diverse. For example, there is only one producer of polyethylene, PE, in Sweden (Borealis) and only one producer of polyvinylchloride, PVC (INEOS).
Within this business segment, R&D is almost exclusively performed by foreign-owned large companies and corporate groups such as Borealis, Akzo Nobel Group and Perstorp
R&D• R&D units, R&D activities incorporated in larger operations
• business or production unit withsome R&D
Business or production unit• with product develop-ment in cooperation with R&D performer• with productdevelopment
Production
Other• support activities, head office, administra-tion, retail, storage or production of non-chemical products etc
Central South West East North Central South West East North Central South West East NorthNo exports Some exports Significant exports

43
Group. Exceptions are the, rather new, companies BIM Kemi and Nexam Chemical, known for their innovation.
Environmental aspects commonly put forward by this business segment are reduced emissions and the environmental responsibility the industry takes for their business and their products. Most companies focus the communication regarding environmental issues on aspects of on-site activities, not products. However, some of the companies produce products which contribute to beneficial environmental effects, such as Kemira Kemi and Feralco Nordic, both of whom produce products for water treatment. Furthermore, some of the companies produce biodegradable plastics (promoted as environmentally sound). This is not to be confused with biobased or recycled/reused plastics. However, in some applications, biodegradable is not beneficial, for example, if the product degrades if exposed to sunlight or oxygen when it is expected to be durable (this applies to plastic used in products such as dashboards or cables).
One corporate group worth mentioning, especially concerning environmental issues, is Akzo Nobel which has been acknowledged for its sustainability work e.g., by the continuously high rankings on the Dow Jones Sustainability index.
Figure 15 - Cluster profile Basic chemicals
R&D• R&D units, R&D activities incorporated in larger operations
• business or production unit withsome R&D
Business or production unit• with product develop-ment in cooperation with R&D performer• with productdevelopment
Production
Other• support activities, head office, administra-tion, retail, storage or production of non-chemical products etc
Central South West East North Central South West East North Central South West East NorthNo exports Some exports Significant exports
Basic chemicals - Plastics in primary forms
Basic chemicals - Organic and inorganic basic chemicals
Basic chemicals - Other

44
4.4 Chemical products This is the largest business segment with regards to the number of companies. Most companies included are, however, fairly small themselves. The products produced by companies in this business segment are very diverse. The main activities are, however, similar among the companies. Most companies have their main activities in manufacturing and incremental product development. Within the sub-segment “Detergents and hygiene products, etc.” contract manufacturers are more common than within the other sub-segments. The companies are evenly spread in all five regions and employed 7 294 FTEs in the year 2010, a reduction of 5% compared to the year 2007. The R&D carried out within the companies in this business segment is partly directed towards developing new products based on biogenic feedstock. Furthermore, R&D is both carried out in larger companies with significant exports (e.g., Akzo Nobel Decorative Coating) and smaller companies lacking export (e.g., SweTree Technologies).
For the companies producing chemical products the environmental aspects put forward varies with the type of products produced. However, most companies focus on product characteristics, and/or on site environmental impacts. The companies developing and producing paint often tell if their products are water based and companies producing skin and hair care products often promote the product as “natural”. Many of the companies in this business segment also clearly state that they have an ISO 14001 certification and/or an environmental policy.

45
Figure 16 - Cluster profile Chemical products
4.5 Pharmaceutical products, reagents, etc. With respect to its 16 486 FTEs in the year 2010, this is the largest business segment in the chemical industry. A majority of the companies in this business segment is covered more in depth in a previous, similar, analysis of the Life Science industry27. The absolute majority of the companies are located in central Sweden around Stockholm and Uppsala.
Within the chemical industry, this is the business segment with by far the most R&D activities. It is, however, also the business segment which has reduced its employees the most between the years 2007 and 2010, both in absolute and relative terms. The cut backs made by AstraZeneca are the largest contributor to this development, since AstraZeneca is by far the largest company, both within the business segment and within the chemical industry as a whole. From this perspective it is interesting to note that the company Fresenius Kabi has moved parts of its R&D back to Sweden in the last couple of years. Apart from the R&D intensive companies, this business segment also comprises many contract manufacturers. 27 Sandström A. et. al. “Life Science companies in Sweden – Including a comparison with Denmark” VINNOVA Analysis VA 2011:03 (2011)
R&D• R&D units, R&D activities incorporated in larger operations
• business or production unit withsome R&D
Business or production unit• with product develop-ment in cooperation with R&D performer• with productdevelopment
Production
Other• support activities, head office, administra-tion, retail, storage or production of non-chemical products etc
Central South West East North Central South West East North Central South West East NorthNo exports Some exports Significant exports
Chemical products - Paint, coating, adhesives etc.
Chemical products - Detergents, hygiene products etc.
Chemical products - Agrochemicals etc.
Chemical products - Other

46
Within this business segment, environmental aspects are seldom clearly mentioned on company websites and annual reports even though many of the companies are ISO 14001 certified and actively work with e.g., energy and process efficiency (stated if asked). In this field increasing attention is also given to what happens after the pharmaceuticals have been consumed, e.g., hormones affecting fish. Another area receiving increased attention is on site environmental issues in low cost countries given the increased outsourcing of manufacturing to such countries by the large pharmaceutical corporations.
Figure 17 - Cluster profile Pharmaceutical products, reagents, etc.
R&D• R&D units, R&D activities incorporated in larger operations
• business or production unit withsome R&D
Business or production unit• with product develop-ment in cooperation with R&D performer• with productdevelopment
Production
Other• support activities, head office, administra-tion, retail, storage or production of non-chemical products etc
Central South West East North Central South West East North Central South West East NorthNo exports Some exports Significant exports
Pharmaceutical products, reagents etc.

47
5 Regional cluster profiles
Figure 18 shows the share of employees in the chemical industry out of the total population in the working age for the different counties in Sweden. It should be noted that in addition to a high employment ratio in the counties close to the three regions with the highest density of companies (Stockholm, Uppsala, Skåne and Västra Götaland, see e.g., Figure 6), the chemical industry also employs a large share of the population in the counties of Västernorrland (1%) and Örebro (0.8%). The average number for the whole country is 0.8%.
Sections 7.1-7.5 presents the regional cluster profiles for the five regions analysed.
Figure 18 - Percentage of employees in the chemical industry per county out of total population in the working age
5.1 Region North In Region North, a large share of the employees work in chemical industry companies which are biorefineries (e.g., Domsjö Fabriker) or use biogenic feedstock (Akzo Nobel Group). Most of the business segments are well represented in the region. The region represents 17% of the companies in the chemical industry, but only 9% of the
0,7%
1,6%
0,3%
0,2% 0,2%
0,1%
0,2%
0,0%0,1%
0,7%
0,1%
0,8%
0,2%
0,8%
0,2%
0,3%
0,2%
1,0%
0,0%
0,5%
0,1%

48
employees, indicating that the companies and company sites located in the region are smaller compared to the average.
Figure 19 - Overview of the cluster profile for Region North
Employees in Region North divided by business segment
Number of employees
3 238 Share of chemical industry in Sweden total 9%
Number of companies
76 Share of chemical industry in Sweden total 17%
Number of company sites
105 Share of chemical industry in Sweden total 15%
Share of business or production units in Region North with product development or R&D 38% Share of companies in Region North with positive results 2010 (69% in all of Sweden) 67% Share of employees employed in Swedish owned companies in Region North (20% in all of Sweden)
16%
Five largest sites/companies: GE Healthcare Bio-sciences, Domsjö fabriker, Eka Chemicals28, Cederroth, Akzo Nobel Functional Chemicals
Many of the companies in the region engage in product development and/or R&D. With respect to this, the cluster of companies in Örnsköldsvik (where e.g., Domsjö Fabriker is located) should be mentioned as an innovative and research oriented environment where companies share both feedstock and R&D resources. As has already been mentioned, other regional cluster initiatives and research environments include Processum and Bio4Energy.
28 As of 2012 also known as Akzo Nobel Pulp and Paper Chemicals.
Refinery incl. grease
Biorefinery
Basic chemicals - Plastics in primary forms
Basic chemicals - Organic and inorganic basic chemicals
Basic chemicals - Other
Chemical products - Paint, coating, adhesives etc.
Chemical products - Detergents, hygiene products etc.
Chemical products - Agrochemicals etc.
Chemical products - Other
Pharmaceutical products, reagents etc.

49
5.2 Region Central Region Central is dominated by companies which develop and manufacture pharmaceutical products and chemical products for medical purposes and many of the companies have significant R&D activities. Almost half of the employees in the chemical industry work in this region and the companies are larger than average. The second largest business segment is production of different chemical products, which in total represents 17% of the employees in the chemical industry in the region. Examples of companies in Region Central which are active in other business segments than pharmaceuticals and medical products are Nynäs with its oil refinery in Nynäshamn, Organoclick, which develops fiber based materials, Casco Adhesives, which develops adhesives and has their headquarters in Stockholm, and Orica Sweden which manufactures explosives.
Figure 20 - Overview of the cluster profile for Region Central
Employees in Region Central divided by business segment
Number of employees
15 599 Share of chemical industry in Sweden total 46%
Number of companies
144 Share of chemical industry in Sweden total 33%
Number of company sites
211 Share of chemical industry in Sweden total 31%
Share of business or production units in Region Central with product development or R&D 26% Share of companies in Region Central with positive results 2010 (69% in all of Sweden) 68% Share of employees employed in Swedish owned companies in Region Central (20% in all of Sweden)
19%
Five largest sites/companies: AstraZeneca, GE Healthcare Bio-sciences, Fresenius Kabi, Octapharma, Phadia
Refinery incl. grease
Biorefinery
Basic chemicals - Plastics in primary forms
Basic chemicals - Organic and inorganic basic chemicals
Basic chemicals - Other
Chemical products - Paint, coating, adhesives etc.
Chemical products - Detergents, hygiene products etc.
Chemical products - Agrochemicals etc.
Chemical products - Other
Pharmaceutical products, reagents etc.

50
5.3 Region West In the western part of Sweden, the basic chemical industry and the refinery industry are the main employers within the chemical industry. Another large employer is AstraZeneca that have a large development unit in Mölndal close to Göteborg. In relation to Swedish chemical industry as a whole, many of the companies show positive results. Also, the companies in Region West are to a greater extent than average foreign-owned.
Cluster initiatives have been formed in the region and the large chemical companies in Stenungsund (Borealis, INEOS, Akzo Nobel, Perstorp and AGA) work together with a joint vision on Sustainable Chemistry by 2030 and together with other regional actors through a regional initiative, “Kemiindustriklustret”. Furthermore, within the region, Green chemistry and biobased products have been appointed as one of five strategic areas and is identified as a regional strength.
Figure 21 - Overview of the cluster profile for Region West
Employees in Region West divided by business segment
Number of employees 8 285 Share of chemical industry in Sweden total 24% Number of companies 119 Share of chemical industry in Sweden total 27% Number of company sites
159 Share of chemical industry in Sweden total 23%
Share of business or production units in Region West with product development or R&D 26% Share of companies in Region West with positive results 2010 (69% in all of Sweden) 77% Share of employees employed in Swedish owned companies in Region West (20% in all of Sweden)
14%
Five largest sites/companies: AstraZeneca, Borealis, Preem, INEOS Sverige, Eka Chemicals29
29 As of 2012 also known as Akzo Nobel Pulp and Paper Chemicals.
Refinery incl. grease
Biorefinery
Basic chemicals - Plastics in primary forms
Basic chemicals - Organic and inorganic basic chemicals
Basic chemicals - Other
Chemical products - Paint, coating, adhesives etc.
Chemical products - Detergents, hygiene products etc.
Chemical products - Agrochemicals etc.
Chemical products - Other
Pharmaceutical products, reagents etc.

51
5.4 Region East Out of the five regions, Region East has by far the smallest share of chemical industry. Here the chemical industry employs 1250 people in 42 companies. Most companies produce different chemical products and only a few are active in product development and R&D.
Many of the companies in the region show positive results and the companies are to a greater extent Swedish-owned compared to the other regions.
Figure 22 - Overview of the cluster profile for Region East
Employees in Region East divided by business segment
Number of employees
1 254 Share of chemical industry in Sweden total 4%
Number of companies
42 Share of chemical industry in Sweden total 10%
Number of company sites
53 Share of chemical industry in Sweden total 8%
Share of business or production units in Region East with product development or R&D 11% Share of companies in Region East with positive results 2010 (69% in all of Sweden) 79% Share of employees employed in Swedish owned companies in Region East (20% in all of Sweden)
42%
Five largest sites/companies: Akzo Nobel Industrial Finishes, Carpenter Sweden, Vitamex production, DuPont Powder Coatings Scandinavia, Lantmännen Agroetanol
5.5 Region South In Region South there is an even distribution between companies producing basic chemicals, different chemical products, and pharmaceutical products. Most of the companies are located in and around Malmö, Lund, and Perstorp. In total, the region
Refinery incl. grease
Biorefinery
Basic chemicals - Plastics in primary forms
Basic chemicals - Organic and inorganic basic chemicals
Basic chemicals - Other
Chemical products - Paint, coating, adhesives etc.
Chemical products - Detergents, hygiene products etc.
Chemical products - Agrochemicals etc.
Chemical products - Other
Pharmaceutical products, reagents etc.
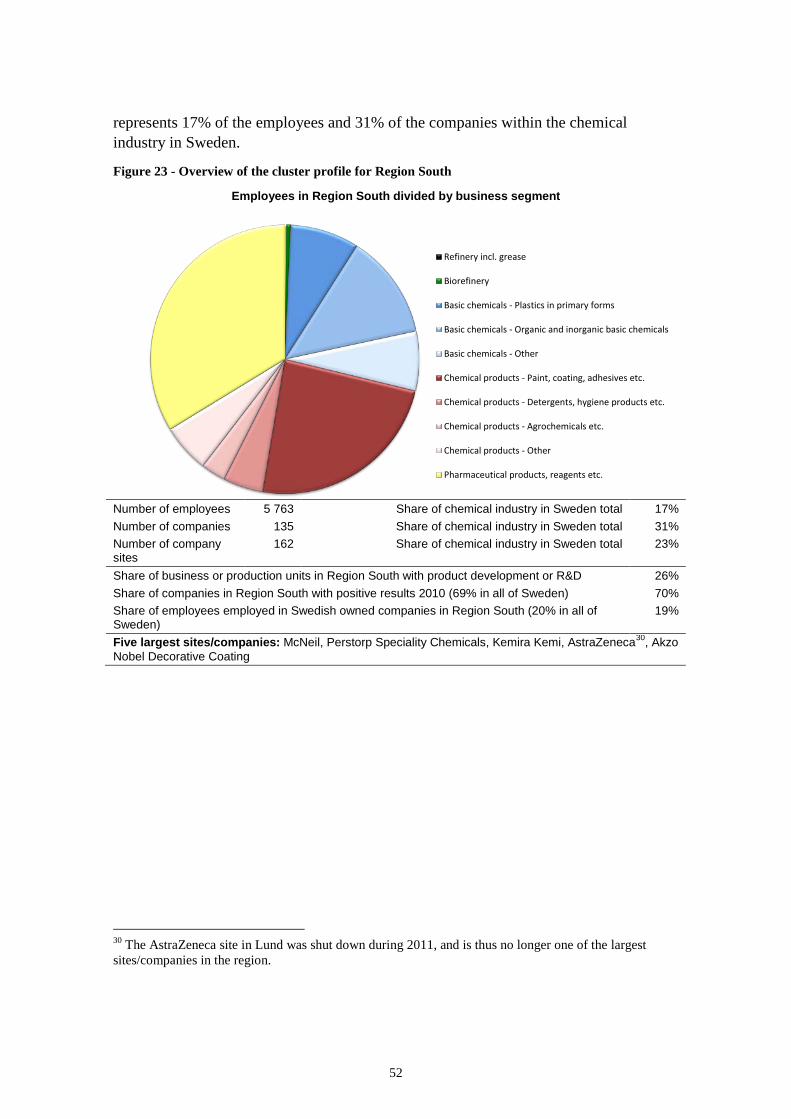
52
represents 17% of the employees and 31% of the companies within the chemical industry in Sweden.
Figure 23 - Overview of the cluster profile for Region South
Employees in Region South divided by business segment
Number of employees 5 763 Share of chemical industry in Sweden total 17% Number of companies 135 Share of chemical industry in Sweden total 31% Number of company sites
162 Share of chemical industry in Sweden total 23%
Share of business or production units in Region South with product development or R&D 26% Share of companies in Region South with positive results 2010 (69% in all of Sweden) 70% Share of employees employed in Swedish owned companies in Region South (20% in all of Sweden)
19%
Five largest sites/companies: McNeil, Perstorp Speciality Chemicals, Kemira Kemi, AstraZeneca30, Akzo Nobel Decorative Coating
30 The AstraZeneca site in Lund was shut down during 2011, and is thus no longer one of the largest sites/companies in the region.
Refinery incl. grease
Biorefinery
Basic chemicals - Plastics in primary forms
Basic chemicals - Organic and inorganic basic chemicals
Basic chemicals - Other
Chemical products - Paint, coating, adhesives etc.
Chemical products - Detergents, hygiene products etc.
Chemical products - Agrochemicals etc.
Chemical products - Other
Pharmaceutical products, reagents etc.

53
6 Consultants and service companies
The five largest technical consultants with some business directed to the chemical industry are listed in Table 5 below. As previously mentioned, only consultants with the chemical industry as their major business have been included in the population. Such companies are, however, rather small, with 1-20 employees.
Table 5 - The five largest technical consultants with some business within the chemical industry
Number of employees 2011
Number of employees 2008
ÅF-INDUSTRY AB 1284 970
RAMBÖLL SVERIGE AB 856 945
SEMCON CARAN AB 1011 1628
GRONTMIJ AB 713 778
VATTENFALL POWER CONSULTANT AKTIEBOLAG 700 661
Within the chemical industry there is a broad use of technical consultants and service companies, at least amongst the larger companies. The consultants and service companies today perform different functions in the companies that were previously handled by the companies themselves, e.g., maintenance, engineering, and security. Sometimes staffing companies are also responsible for parts of the workforce employed in production or human relations and recruitment processes.
One example of such a company is BIS Production Partner that offers projects and maintenance services to various branches of industry (in Sweden to most sectors in the process industry). BIS Production Partner was founded in Sweden in 2005 and has since then expanded significantly, from 91 employees in 2008 to 536 in 2011. For the chemical industry, BIS Production Partner has signed strategic agreements to supply, for example, production-related maintenance work, preparation of maintenance and preventive maintenance for Borealis, Akzo Nobel, INEOS, Eka Chemicals, Nynäs, etc.
Other examples of consultants and service companies working (partly) with the chemical industry that have significantly expanded their business, with respect to full time employees, between the years 2007-2011 are Jacobs (51 to 69 FTE), Prevent (113 to 146), COWI (556 to 758), Randstad (532 to 784), Eurocon Engineering (6 to 142) and ÅF Industry (970 to 1294).
The consultants are important since the chemical industry to a large extent does not develop their own technologies, but buys them from engineering and consultant firms. Consequently, it might be the collaboration between the chemical companies and specialised consultants that generates innovation in new technology and biorefineries.

54
Examples of consultant firms working with biorefineries in different ways (with regard to the chemical industry, but mainly about other industry sectors, such as the pulp and paper industry) are e.g., MoRe Research, Eurocon and the research institute Innventia.
6.1 The example of direct and indirect employment for two companies in the chemical industry
In Figure 24 an example is given regarding the direct and indirect employment in the chemical industry. The cores represent INEOS, a PVC manufacturer, and Akzo Nobel, which develops and produces surfactants in Stenungsund. The circles around the cores represent all the people which work for INEOS and Akzo Nobel at the Stenungsund site, but are employed in other companies. As can be seen, these people add an additional 30-50% to the total number of FTEs. For the process industry the indirect employment for the process industry can be estimated by a factor two, which means for each direct employee in the industry another person is employed in another industry or sector31.
Figure 24 - Direct employment and on-site indirect employment for INEOS and Akzo Nobel in Stenungsund
Data for on-site indirect employment given by Lars Josefsson of INEOS and Sara Mårlind of Akzo Nobel Surface Chemistry
31 See e.g. IVA-M-353 “Ökad konkurrenskraft för svensk processindustri” (only available in Swedish).

55
Appendix
Biogenic feedstock and the business segment biorefineries By definition all companies in the business segment Biorefinery have biogenic feedstock. There are, however, many more companies which to different extents utilise biogenic feedstock. Companies may also produce products based on different types of feedstock at different production sites, and in this report they have been categorised into business segments based on their main product. One example that should be mentioned is the Akzo Nobel sites in Sundsvall where the feedstock is fully biogenic. Depending on the choice of definition, these sites may be classified as biorefineries or “green chemistry”. In this study, however, they have been categorised into the business segment “Organic and inorganic base chemicals” since the companies’ main activities are in this field and also since the use of biogenic feedstock is not a novelty for manufacturing of the produced products. Other companies with mainly biogenic feedstock (but not classified as biorefineries) are manufacturers of limewash, linseed oil, skincare products and pharmaceutical companies. Thus, the chemical industry is “greener” than it looks in the map visualisation (see Figure 7).
It should be noted that it is difficult to fully and correctly identify all companies which fully or partly utilise biogenic feedstock. It is also a complicated task to define what “enough” is in order to be called a biorefinery, and what can be included in the term “green chemistry”. Many companies also have renewable (sometimes biogenic) sources for the energy they use in their support processes, e.g., Nynäs that source some of their process heat from a biomass based heat and power plant. Thus, the aim in this work has been a first attempt to identify a business segment which may, or may not grow, and thereby has begun a foundation to study the dynamics of changes in the coming years.
Universities, research institutes, knowledge centres, etc. related to the chemical industry At KTH, located in Stockholm, the School of Chemical Science and Engineering is one of the larger schools at the university. The school is comprised of both fundamental and applied sciences and is divided into three departments, Chemical Engineering (with a focus on energy research and production of fuels), Chemistry (with the focus areas of Bioactive Molecules, Functional Materials & Surfaces, and Energy & Environment) and Fibre and Polymer Technology (mainly related to the pulp and paper industry and its systems and processes). At KTH one can find the following centres related to the chemical industry: the Industrial NMR Centre, the Centre of Molecular Devices, the Biofibre Materials Centre and the Swedish Centre for Biomimetic Fiber Engineering.

56
Further, the following large research institutes are also located at the KTH campus: the Institute for Surface Chemistry32, Innventia, and Swerea KIMAB.
At Chalmers University of Technology, located in Göteborg, the research most closely related to the chemical industry is performed by the Department of Chemical and Biological Engineering. The research ranges from natural science and bioscience, applied chemistry and biotechnology to chemical engineering, and is performed through its five divisions: Chemistry and Biochemistry, Life Sciences, Applied Chemistry, Energy and Materials and Chemical Engineering. At this department one can find the following national centres: Centre for Chemical Process Engineering (CPE), Competence Centre for Recycling (CCR), Competence Centre for High Temperature Corrosion (HTC), Competence Centre for Catalysis (KCK), Plastic for a Sustainable Society (PLUS), SUMO Biomaterials and SUPRA centre. The rector of Chalmers has a background in chemical engineering and Chalmers is plays an active part in “Kemiindustriklustret”33, which aims at promoting and supporting the chemical industry in western Sweden.
In Gothenburg also the faculty of science at University of Gothenburg performs research in the area of chemistry, mostly through the department of Chemistry and Molecular Biology. The research at the department is divided into more than 15 different areas (e.g. Analytical chemistry, Biochemistry, Electrochemistry, Environmental nanochemistry, Inorganic chemistry, Marine chemistry, Medicinal chemistry, Organic chemistry, Surface biophysics). Also, the VINN Excellence Centre BIOMATCELL (which combines the expertise of materials science and medical devices, with state-of-the art knowledge of biological components) is hosted by the University of Gothenburg.
In Lund the chemistry research is organised under the umbrella of “Kemicentrum” which is comprised of three departments from both the Faculty of Engineering (LTH) and The Faculty of Science (LU). This makes Kemicentrum one of the largest research centres within the chemistry area in Northern Europe. The three departments are: the Department of Chemistry, the Department of Food Technology, Engineering and Nutrition and the Department of Chemical Engineering. In addition to Kemicentrum, many other research centres and institutes are also located at the Lund University campuses, e.g., Biomedical Centre, Centre for Biomechanics, Centre for Research on Pharmaceuticals and Medical Devices and Lund Functional Food Science Centre. Lund University also is the host for LU Biofuels, which is a multi-disciplinary research platform that brings together researchers working on biofuels from faculties, departments and centres across the entire university. 32 Previously a subsidiary of SP Technical Research Institute of Sweden but as of December 2012 merged with SP Chemistry and Materials and a part of SP parent company. 33 Lead by Business Region Göteborg. See: http://www.businessregion.se/huvudmeny/affarsomraden/affarsdrivenmiljoutveckling/gronkemi/kemiindustriklustret.4.47345d50135f346f271708.html

57
At Umeå University, in northern Sweden, the Department of Chemistry is one of the largest departments. The research at the department is divided into three main research areas: Biological Chemistry (focusing on biologically important molecules, macromolecules like proteins, nucleic acids, carbohydrates and lipids, as well as small organic molecules), Environmental and Biogeochemistry (focusing on chemical compounds in the environment) and Technical Chemistry (focusing on accelerating the development of integrated biorefining and energy technologies). The department cooperates with more than 30 companies, and a number of small spin-off companies are located in close proximity to Umeå University and the University Science Park, Uminova Science Park. Apart from its location in Umeå, Umeå University has campuses also in Örnsköldsvik and Skellefteå.
Bio4Energy which is a strategic research environment which consists of Luleå University of Technology, Umeå University, and the Swedish University of Agricultural Sciences (Umeå campus). Bio4Energy has a handful of associated industrial partners, e.g., SEKAB. Bio4Energy works with seven research platforms, each of which corresponds to a link in the biorefinery value chain: Feedstock, Pretreatment and Fractionation, Thermochemical, Biochemical, Catalysis and Separation, Process Integration and Environmental.
Processum started in 2003 as a technology park, but has since developed into a biorefinery cluster initiative. Processum is now a member owned company located in Örnsköldsvik (at the same premises as e.g., Domsjö Fabriker, SEKAB and MoRe Research). The major part of the activities within Processum lies within R&D in the areas of biotechnology, energy technology, inorganic and organic chemistry as well as sustainable raw materials.
SP Technical Research Institute of Sweden is Sweden’s largest industry research institute and the parent company in a group consisting of six wholly-owned subsidiary companies. The Swedish state, through RISE Holding (Research Institutes of Sweden, government owned), is the sole shareholder of the company. SP operates at about 30 sites in Sweden, but has its headquarters and main facilities outside Borås. The subsidiary YKI, Institute for Surface Chemistry, and the technical area Chemistry and Materials (which will be merged at the beginning of the year 2013) are the units with most strong links to the chemical industry. However, other technical areas and subsidiaries also have relevant activities, such as Energy Technology, Wood Technology, JTI - Swedish Institute of Agricultural and Environmental Engineering and SIK - Swedish Institute for Food and Biotechnology.
Swerea SICOMP, a part of the RISE Holding owned Swerea group, is a research institute in the field of polymer fibre composites. Their business includes applied composite research, development, as well as training, within eight working areas: Large-Scale Experimental Equipment, Materials Science, Modelling and Simulation, Process Development, Product Development, Production Technology, Structural

58
Engineering, Testing and Analysis. Swerea SICOMP is located in Göteborg, Piteå and Linköping.
Innventia is a research institute which is owned partly by six forest industry companies and partly by RISE Holding (Research Institutes of Sweden, government owned). Innventia has three business areas: Biorefining, Material Processes and Packaging Solutions. Out of these three business areas it is the business area of Biorefining which is the one mostly related to the chemical industry. However, all activities at Innventia are primarily based on or related to the pulp and paper industry. The headquarters are located on the campus of KTH in Stockholm, but Innventia also has operations in Trondheim (the subsidiary PFI), London and at Bäckhammars Bruk where they are operating a demonstration plant for lignin extraction.
The Swedish Knowledge Centre for Renewable Fuels (f3) is a nationwide centre, which through cooperation and a systems approach aims to enhance the development of “fossil free fuels” (otherwise known as renewable fuels) for transportation. The centre does not perform or support fundamental research, but performs syntheses of current research about the production of renewable fuels as well as supplemental research, such as comparative systems analyses of fuels, processes, raw materials and plant design. From the chemical industry, Sekab, Perstorp and Preem are partners in f3. The research activities in the centre are, however, almost exclusively performed by the research operators, not the partnering companies.
Other innovation environments and science parks where the chemical industry is (partly) represented are: Shift2Bio, Uppsala Science Park and SLU Holding, Solander Science Park, Åkroken, Paper Province, the Biofuel region and others.
A summary record of environmental aspects and supplemental information For the environmental aspects, the following main sources of information have been used: company annual reports, annual environmental reports (if available), information on company websites, environmental parts/aspects of research/development projects in which the company is active, company environmental policy (if available) and online publicly available information about the company (press releases, popular science articles, membership in environmental networks, efficiency programs, etc.).
The quantity and quality of information available varies significantly between the different companies. For many of the very small companies (1-4 employees) no information could be found. On the contrary, for many of the larger companies, significant amounts of information could be found in e.g., environmental reports where both already implemented and future environmental measures were accounted for and described.
Almost all companies which provide any information regarding environmental aspects (usually through an environmental policy) state that they work with “continuous

59
improvements” and “energy efficiency” and/or “waste minimisation”. Many companies also state that they comply with REACH and that they strive towards reducing their environmental impact (on-site, implicitly stated).
The quality and content of environmental policies given by the companies vary. Some give only a single sentence statement, and some are rather explicit including both vision and goals. The focus is mostly on on-site activity and the non-toxicity of the products produced.
A minority of the companies state environmental aspects as part of their overall company vision and/or business, some rather clearly (e.g., Kemira Kemi) and some more implicitly.
Only very few companies work with the full definition of sustainability (economic, social and environmental), Akzo Nobel being the best example naturally, as it is renowned for its top ranking on Dow Jones Sustainability Index.
Process for identifying the companies In the table below the primary sources for identifying companies are listed. The companies were examined one by one and some were found not to be within the definition, see Section 3, and thus excluded. The companies included can be found in the list in the subsequent section.
NACE-codes Exerps for NACE 19, 20, 21 Trade organisations and similar The Swedish Plastics and Chemicals Federation, The Swedish
Industrial and Chemical Employers Association, The Swedish Bioenergy Association (Svebio)
Cluster and cluster initiatives Processum, Hållbar Kemi 2030, The biofuel region Knowledge centres, platforms and science parks
f3, Shift2Bio, Solander sciencepark, Åkroken, Paper Province
Project/EU-project BioDME, SUPRABIO, Projects connected to LUBiofuels Other NyTekniks 33-Listan, the magazine Bioenergy’s list of existing and
planned plants for biofuel production in Sweden

60
List of companies
Refinery (including grease) >250 employees Preem AB Nynäs AB
51-250 employees St1 Refinery AB Axel Christersson AB Petrolia AB 11-50 employees Lantmännen Aspen Petrolium AB Exxon Mobile Sverige AB Göteborgs smörjmedelsfabrik (Scanlube) AB Superior Graphite Europé Ltd, USA, Sweden filial 1-10 employees Svensk oljeåtervinning AB Ecopar AB
Biorefinery >250 employees Domsjö Fabriker Aktiebolag
51-250 employees Arizona Chemical Aktiebolag Sekab Biofuels and Chemicals AB Lantmännen Agroetanol AB
11-50 employees Binol AB Sunpine AB Sveprol Bio Production AB Chemrec Aktiebolag
1-10 employees Swedish Biofuels AB Ecoil AB (PUBL) NBE Sweden AB Meva Innovation AB Ecobränsle i Karlshamn Aktiebolag Lignoboost Demo AB Organoclick AB
Värmlandsmetanol Aktiebolag (PUBL) Taurus Energy AB (PUBL) Perstorp Bioproducts AB Norups Gård Bioraff AB Energigårdarna i Eslöv AB Nordisk Etanol & Biogas AB Bioendev AB (Bio Energy Development North AB) Eco-oil Miljöbränslen i Sverige AB Sveprol Bio Production AB Chemrec Aktiebolag
Basic chemicals >250 employees Borealis Aktiebolag Eka Chemicals AB AGA Gas Aktiebolag Akzo Nobel Functional Chemicals AB Akzo Nobel Surface Chemistry Aktiebolag INEOS Sverige AB Perstorp Speciality Chemicals AB Perstorp Oxo AB (incl. Perstorp Oxo Belgium) Kemira Kemi Aktiebolag
51-250 employees Air Liquide Gas Aktiebolag Polykemi Aktiebolag Element Six Aktiebolag Carpenter Sweden AB Akzo Nobel Base Chemicals Aktiebolag Ashland Industries Sweden AB (previously Hercules AB) Imerys Mineral AB Celanese Emulotions Norden AB BASF AB Habia Teknoflour Aktiebolag Chemiplastica AB Sealed Air Svenska Aktiebolag Böhler Welding Group Nordic AB

61
PA Resins AB INEOS Compounds Sweden AB Elasto Sweden AB Rohm and Haas Nordiska Aktiebolag Evonik Norcarb AB
11-50 employees Riflex Film Aktiebolag BIM Kemi SWEDEN Aktiebolag Wibax Aktiebolag INEOS Nova Sweden AB Aluflour Aktiebolag Carbide Sweden AB Polyone Sweden AB Delta Plast AB Nolato Silikonteknik AB Styron Sverige AB Skogens Kol Aktiebolag BASF Polyurethanes Nordic AB Ask Chemicals Scandinavia Aktiebolag Syrgis Performance Initiators AB Kemikalia AB Tetra Chemicals Europe AB Nils Malmgren Aktiebolag Thevinyl Aktiebolag Feralco Nordic AB Marenordic AB PQ Sweden AB
1-10 employees Unicolor AB Wibax Tech Aktiebolag Nexam Chemical AB Strandplast Perstorp AB Lab.service i Sundsvall Aktiebolag Archemi Aktiebolag Sellukem AB TA Chemistry Aktiebolag Recyclean Biosystems AB Vindelkol AB Lundin Polymertek AB BSI Byggsystem Industri Aktiebolag Extroil AB J.M. Huber Sweden AB
Cryotech AB Peroxide Propulsion Gunnilse Aktiebolag Elastomix AB Isblästring Sverige AB CP Kelco AB Getica AB
Chemical products >250 employees Flügger AB Orica Sweden AB (previously Dyno Nobel S weden AB) Cederroth AB Akzo Nobel Decorative Coatings AB Casco Adhesives AB Alcro-Beckers Aktiebolag
51-250 employees Becker Industrial Coatings AB Eurenco Bofors Aktiebolag Akzo Nobel Industrial Coatings Aktiebolag Yara AB Gelita Sweden Aktiebolag Swedish Match Industries Aktiebolag Flint Group Sweden AB Bona Aktiebolag International Färg Aktiebolag CCS Healthcare AB Akzo Nobel Industrial Finishes AB Oriflame Products Sweden AB Bostik Aktiebolag Caparol Sverige AB Aerosol Scandinavia Aktiebolag DuPont Powder Coatings Scandinavia AB Kemetyl Aktiebolag Lahega Kemi Aktiebolag Hardford Production AB Clariant Masterbatches Norden Aktiebolag Henkel Adhesive Technologies Norden Aktiebolag

62
Southcoat AB DuPont Sverige AB Teknos Aktiebolag Sika Sverige Aktiebolag Rekal Svenska Aktiebolag Yara Helsingborg AB Formox AB Carlfors Bruk AB Depend Cosmetic Aktiebolag Aromatic Aktiebolag A Clean Partner International AB
11-50 employees Hagmans Kemi Aktiebolag Auson Aktiebolag Colorex Sweden Aktiebolag Herdins Färgverk Aktiebolag Sterisol AB Wedevåg Färg Aktiebolag Flowcrete Sweden AB Norstel Aktiebolag Liwell Kemi Aktiebolag Regosam Manufacturing AB Victoria Scandinavian Soap AB LaPerle Haircare Aktiebolag EPC Sverige AB Umicore Autocat Sweden AB Flint Group Lund AB Aktiv Kemi i Småland AB Aksab Kemi Aktiebolag Stockholms Analytiska Laboratorium Aktiebolag SweTree Technologies AB Petefa AB Silvandersson Sweden Aktiebolag Grace Catalyst AB Kimit Aktiebolag Landora Färgindustri Aktiebolag Cleano Production AB PLS Produkter Aktiebolag Aurena Laboratories AB Vasco Aktiebolag Syntema i Vaggeryd Aktiebolag Lyckeby Construction AB
AB Röa Stora Kopparbergs Bergslags Aktiebolag Aktiebolaget Lennart Månsson International Liwa Färg AB Plasticolor Sweden Aktiebolag Gjöco AB Lyckeby Industrial AB Arboritec Aktiebolag Dermanord-Svensk Hudvård AB Scandinavian Hair Company AB Macserien Produktion AB K. Ungh Aktiebolag Tinter Färgblandarna Aktiebolag Ecofix AB Lotrec Aktiebolag Nordic Biocosmetic Production AB Norab Aktiebolag Svenska Latex AB Kempartner Aktiebolag FFAB Legopack Aktiebolag Xylophane AB 1-10 employees Syntema i Eskilstuna Aktiebolag Engwall O. Claesson Aktiebolag Westlén Industrier AB Vio Ljusfabrik Aktiebolag Syntema i Göteborg AB Lars-Erik Johansson Bilprodukter Aktiebolag EKC Production AB Almén Cosmetic Group AB Svensk Freonåtervinning Aktiebolag Bycosin AB Fuji Hunt Nordic Aktiebolag Wibo Färg Aktiebolag Simplus AB Yngve Niklasson Aktiebolag Invekta Green Aktiebolag H L C Produkter AB MICO AB Föllinge Hälsoprodukter Aktiebolag

63
Aktiebolaget Konsumentkemi Klockargårdens i Norberg AB Björnax Aktiebolag Protega AB Kefa Drytech Aktiebolag Målarkalk Aktiebolag Kemisan Sverige AB Swede Global SG AB Blue & Green AB Gyllebo Gödning Aktiebolag Kemiverken i Skänninge Aktiebolag GFFAB, Pyromedia & Pyroteknik, Fyrverkerispecialisterna AB C. Majbäck AB Ljungby Komposit AB Rosinco AB Becker Acroma Group Aktiebola Bacca Byggkemi AB Sunchem Aktiebolag PP-Polymer Aktiebolag Svenska Diskbolaget Aktiebolag T.H. Meyer AB Sanego AB Natural Fragrance of Sweden AB Schmidts Polérmedel Aktiebolag Gyttorp Cartridge Company AB Joel Svenssons Vaxfabrik Aktiebolag Industriqulören i Eskilstuna Aktiebolag Vadstena Färg AB Screentech i Haparanda Aktiebolag Aktiebolaget Prols-Fabrik Kombi Kemi Aktiebolag Pica Kemi AB Kombidelta AB Plantamed Aktiebolag Alron Chemical Co Aktiebolag Blekinge Bioprodukter AB Syntema i Linköping Aktiebolag Codec Förg Aktiebolag Ingenjörsfirma Gustaf Båke Aktiebolag Vensotec Systemkemi Aktiebolag Thord Ohlssons Kemiska Produkter Aktiebolag
Chemex Aktiebolag ICR Kemi AB Emin Svenska Aktiebolag Temax AB Relaco i Klippan Aktiebolag Biobact Aktiebolag Swetech i Karlskoga Aktiebolag G Vesta SI Europe AB Falu Vapen Färg AB Protega Production AB Syntema i Malmö Aktiebolag Colorpoint Osby Kemi AB Vining Färg AB Q-Bond Aktiebolag Klippotekets Fabrik Aktiebolag Zefin Chemical AB NMK Svenska Försäljning AB Unique Cosmetics Sweden AB GDP Gégo de Prince-Myrthil Lab AB Rapsodine T.H. Meyers AB Chempos Aktiebolag Textilfilter Scandinavia AB Waltreco Aktiebolag Specialkemi Väst AB Emutec AB Bigner & Co Kem AB Borkmanns Antik & Byggnadsvård AB N.P.G Nordic Paint Aktiebolag Handels & Partifirman Svedo A Hermansson AB Qloss AB (previously Cmart AB) Ovolin AB RLH i Högsta Aktiebolag Gysinge Färg AB Weba Kemi Aktiebolag Kemek Aktiebolag Uniol-Produkter Aktiebolag ANA- Produkter Aktiebolag GRP Produkter Aktiebolag Dr G. Strindbergs Produkter I SVERIGE Aktiebolag Recykling i Gävle Aktiebolag

64
Condico Miljöprodukter i Lessebo Aktiebolag Wise Naturkosmetik AB Ekholm Vision AB Valbo Kem AB Luxit Organic Care AB Kemeco Aktiebolag Skillingarydssalvan Aktiebolag B.K. Industri Kell Olsson Aktiebolag Duoex Chemical AB Visolve Chemicals AB Pyro - Smålands Krutbruk Aktiebolag KTM-Krim.Teknisk Materiel Aktiebolag Solaster Production AB Lack och Färg Harald Jansson Aktiebolag Aktiebolaget Svenska Handelsimporten Kopparbergs Pigment AB Ferroman Nordcoat AB Enetorpets Färg Aktiebolag Limtek & Mikab AB Linotech Aktiebolag Glor-isol Färg Aktiebolag Trikem AB FFC Kemi Aktiebolag HCL & Pet Care Laboratory Aktiebolag Skargard AB A Cook AB Capinord AB Tonics of Sweden AB Protomega Chemicals Sweden AB Nya Bionema Aktiebolag Binab Bio-Innovation AB Reniderm Scandinavia Aktiebolag Svenska Saneringsaktiebolaget Alldecopy Aktiebolag Envitech Aktiebolag Pyro Event Magnus Cieslak AB Svenska Brandia Aktiebolag Masens Kemiska Tekniska Aktiebolag Pyroproffs Fireworks Aktiebolag Pyroswede Aktiebolag
Chemirol AB Plasmatrix Materials AB Hexion Speciality Chemicals Sweden AB Glitsa Produktion AB Kullafärg AB Cosmedica of Sweden AB Amfolyten Aktiebolag Bil- & Båtvårds Aktiebolaget Err-Bee Sempérvirens Handel AB Ecovation Production Aktiebolag Microplan AB Biocontrol Systems AB Aviosol AB (PUBL)
Pharmaceutical products, reagents, etc. >250 employees AstraZeneca AB GE Healthcare Bio-Sciences AB Fresenius Kabi AB McNeil AB Octapharma AB Apotek Produktion & Laboratorier AB Swedish Orphan Biovitrum AB (PUBL) Phadia AB Pfizer AB Q-Med Aktiebolag Cambrex Karlskoga Aktiebolag Recipharm Stockholm AB Pfizer Health AB
51-250 employees Recipharm Karlskoga AB Kemwell AB Polypeptide Laboratories (Sweden) AB AMO Uppsala AB Vitamex Production AB Qpahrma AB Crucell Sweden AB Vitrolife Sweden Aktiebolag Orexo AB Euro-Diagnostica AB Rechon Life Sciences AB

65
Unimedic Aktiebolag Recipharm Strängnäs AB Allergon Aktiebolag Cepheid AB Oasmia Pharmaceutical AB Recipharm Höganäs AB Bioglan AB
11-50 employees Scandinavian Gene Synthesis Aktiebolag Recipharm Biologics AB Fujirebio Diagnostics AB Abigo Medical Aktiebolag Bohus Biotech Aktiebolag Svanova Biotech AB Aktiebolaget Cernelle Natumin Pharma AB Biora AB Bactiguard AB Olerup SSP Aktiebolag Unitech Biopharma AB Magle Aktiebolag Chemotechnique MB Diagnostics Aktiebolag AB Biomérieux (fusionerat med Aktiebolaget Biodisk) Syntagon AB Swedish Orphan Biovitrum Manufacturing AB Bioreal (Sweden) AB Nidacon International AB Agrisera Aktiebolag Miwana Aktiebolag Rolf Kullgren AB Biokraft Pharma Aktiebolag
IDL Biotech AB 1-10 employees Scandinavian Regulatory Services Aktiebolag JE-Medic i Gävle AB Protista International AB Biothema Aktiebolag Bactus AB Medirox Aktiebolag DSM Anti-Infectives Sweden AB Carls-Bergh Pharma Aktiebolag Dental Therapeutics Aktiebolag Viscogel AB Devyser AB Appeartex AB Novozymes Biopharma Sweden AB Octean AB Materia Compacta i Höganäs AB Reagensia Aktiebolag Wasa Medicals AB Pharmadone AB Stratosphere Pharma AB Novasaid AB Probac AB Encecor Aktiebolag Percell Biolytica Aktiebolag Imco Corporation LTD Aktiebolag BR. Bioreagens AB Metina AB Prolight Diagnostics AB (PUBL) Medipharm Aktiebolag Ellem Läkemedel Aktiebolag Nexyte AB Recip Läkemedel AB Lavivo AB

66

VINNOVA AnalysisVA 2013:
01 Chemical Industry Companies in Sweden
VA 2012:01 Impact of innovation policy - Lessons
from VINNOVA´s impact studies. For Swedish version see VA 2011:10
02 Lösningar på lager - Energilagringstekniken och framtidens hållbara energiförsörjning
03 Friska system - eHälsa som lösning på hälso- och sjukvårdens utmaningar
04 Utan nät - Batterimarknadens utvecklingsmöjligheter och framtida tillväxt
05 Sveriges deltagande i sjunde ramprogrammet för forskning och teknisk utveckling (FP7) - Lägesrapport 2007 - 2011. Only available as PDF
06 Företag inom fordonsindustrin - Nationella, regionala och sektoriella klusterprofiler som underlag för analys- och strategiarbete
07 Svensk Life Science industri efter AstraZenecas nedskärningar. Only available as PDF
08 EUREKA Impact Evaluation - Effects of Swedish participation in EUREKA projects
09 Uppföljning avseende svenskt deltagande i Eurostars. For English version see VA 2012:10. Only available as PDF
10 Follow-Up of Swedish Participation in Eurostars. For Swedish version see VA 2012:09. Only available as PDF
VA 2011:01 Smart ledning - Drivkrafter och
förutsättningar för utveckling av avancerade elnät
02 Framtid med växtverk - Kan hållbara städer möta klimatutmaningarna?
03 Life science companies in Sweden - Including a comparison with Denmark
04 Sveriges deltagande i sjunde ramprogrammet för forskning och teknisk utveckling (FP7) - Lägesrapport 2007-2010, fokus SMF. Only available as PDF. For brief version see VA 2011:05
05 Sammanfattning Sveriges deltagande i FP7 - Lägesrapport 2007-2010 - Fokus SMF. Brief version of VA 2011:04
06 Effektanalys av forskningsprogram inom material från förnyelsebara råvaror
07 Effektanalys av starka forsknings- & innovationssystem. Only available as PDF. For brief version see VA 2011:08
08 Sammanfattning - Effektanalys av starka forsknings- & innovationssystem. Brief version of VA 2011:07
09 Samarbete mellan Sverige och Kina avseende vetenskaplig sampublicering - aktörer, inriktning och nätverk. Only available as PDF
10 När staten spelat roll - lärdomar av VINNOVAs effektstudier. For English version see VA 2012:01
VINNOVA InformationVI 2013:
01 Branschforskningsprogrammet för skogs- & träindustrin - Projektkatalog 2013
VI 2012:02 Så blir Sverige attraktivare
genom forskning och innovation - VINNOVAs förslag för ökad konkurrenskraft och hållbar tillväxt till regeringens forsknings- och innovationsproposition
03 Idékatalog - Sociala innovationer för äldre
04 Innovation i offentlig upphandling - Ett verktyg för problemlösning
05 Årsredovisning 201106 Replaced by VI 2012:1507 Din kontakt till EU:s forsknings- och
innovationsprogram08 Uppdrag att stärka det svensk-
kinesiska forsknings- och innovationssamarbetet. Only available as PDF
09 Projektkatalog eTjänster. Slutkonferens - summering och reflektioner
10 Hållbara produktionsstrategier samt Tillverkning i ständig förändring - Projektkatalog 2012
11 VINNVÄXT12 Efffekter av innovationspolitik -
Tillbakablickar och framtidsperspektiv13 Banbrytande IKT - Projektkatalog14 Smartare, snabbare, konvergerande
lösningar - Projektkatalog inom området IT och Data/Telekommunikation i programmet Framtidens kommunikation
15 Fordonsstrategisk forskning och innovation för framtidens fordon och transporter.
16 Utmaningsdriven innovation - Samhällsutmaningar som drivkraft för stärkt tillväxt
17 Handledning för insatser riktade mot tjänsteverksamheter och tjänsteinnovation. Only available as PDF
VI 2011:01 Framtidens personresor -
Projektkatalog02 Miljöinnovationer - Projektkatalog03 Innovation & Gender
VINNOVA´s publicationsFebruary 2013
See www.vinnova.se for more information

04 Årsredovisning 201005 VINN Excellence Center - Investing
in competitive research & innovation milieus
06 VINNOVA Sweden´s Innovation Agency
07 Challenge-driven Innovation - VINNOVA´s new strategy for strengthening Swedish innovation capacity. For Swedish version see VI 2011:08
08 Replaced by VI 2012:16. For English version see VI 2011:07
09 Replaced by VI 2012:0210 Projektkatalog - Innovationer för
framtidens hälsa. 11 Replaced by VI 2012:06 . 12 Replaced by VI 2012:1413 Replaced by VI 2012:04
VINNOVA PolicyVP 2011:
01 Tjänstebaserad innovation - Utformning av insatser som möter behov hos företag och organisationer. Only available as PDF
02 Regeringsuppdrag Kina - ”Föreslå områden för förstärkt långsiktigt forsknings-, innovations- och utbildningssamarbete med Kina” U2010/7180/F. Only available as PDF
03 Behov av kunskap och kompetens för tjänsteinnovationer
04 Utveckling av Sveriges kunskapsintensiva innovationssystem - Huvudrapport - Underlag till forsknings- & innovationsproposition
05 Utveckling av Sveriges kunskapsintensiva innovationssystem - Bilagor - Underlag till forsknings- & innovationsproposition
VINNOVA ReportVR 2012:
01 Utvärdering av Strategiskt gruvforskningsprogram - Evaluation of the Swedish National Research Programme for the Mining Industry
02 Innovationsledning och kreativitet i svenska företag
03 Utvärdering av Strategiskt stålforskningsprogram för Sverige - Evaluation of the Swedish National Research Programme for the Steel Industry
04 Utvärdering av Branschforsknings-program för IT & Telekom - Evaluation of the Swedish National Research Programme for IT and Telecom
05 Metautvärdering av svenska branschforskningsprogram - Meta-evaluation of Swedish Sectoral Research Programme
06 Utvärdering av kollektivtrafikens kunskapslyft. Only available as PDF
07 Mobilisering för innovation - Studie baserad på diskussioner med 10 koncernledare i ledande svenska företag. Only available as PDF
08 Promoting Innovation - Policies, Practices and Procedures
09 Bygginnovationers förutsättningar och effekter
10 Den innovativa vården11. Framtidens personresor - Slutrapport.
Dokumentation från slutkonferens hösten 2011 för programmet Framtidens personresor
12 Den kompetenta arbetsplatsen13 Effektutvärdering av Produktionslyftet
- Fas 1: 2007-2010. Only available as PDF
VR 2011:01 Hundra år av erfarenhet - Lärdomar
från VINNVÄXT 2001 - 201102 Gender across the Board - Gender
perspective on innovation and equality. For Swedish version see VR 2009:20
03 Visioner och verklighet - Några reflexioner kring eHälsostrategin för vård och omsorg. Only available as PDF
04 Hälsa genom e - eHälsorapporten 2010. Only available as PDF
05 Halvtidsutvärdering av branschforskningsprogrammet för skogs- & träindustrin - Mid-term evaluation of the Swedish National research programme for the forest-based sector
06 Leadership Mandate Programme - The art of becoming a better centre director. For Swedish version see VR 2010:18
07 The policy practitioners dilemma - The national policy and the transnational networks
08 Genusvägar till innovation - Erfarenheter från VINNVÄXT. Only available as PDF
09 Att utveckla Öppna Innovationsarenor - Erfarenheter från VINNVÄXT.
10 White Spaces Innovation in Sweden - Innovation policy for exploring the adjacent possible
11 Etapputvärdering av centrumbildningen Virtual Prototyping and Assessment by Simulation - ViP. Only available as PDF
12 Tjänsteinnovationer i offentlig sektor - Behov av forskningsbaserad kunskap och konsekvens
13 Competences supporting service innovation - a literature review. Only available as PDF
14 Innovationsdrivande forskning i praktiken - Samverkan mellan forskare och praktiker för att skapa organisatoriska innovationer. Only available as PDF
15 Det offentliga stödsystemet för hantering av företags immateriella tillgångar - Kartläggning och analys
16 Innovative Growth through Systems Integration and Glocalisation - International evaluation of the 2004 VINNVÄXT programme initiatives
17 Ready for an early Take Off? - International evaluation of the VINNVÄXT initiatives in early stages

The Environment - everyone´s responsibilityIndividuals, businesses and governments - all need to work together for a better future environment.E-Print and Trosa Tryckeri in cooperation with VINNOVA, take responsibility for an eco-friendly print production.We use modern production techniques and environmentally friendly materials in our efforts to minimize environmental impact.
Production: VINNOVA´s Communication DivisionPrinted by: E-Print, Stockholm, Sweden, www.eprint.se
February 2013Sold by: Fritzes Offentliga Publikationer, www.fritzes.se

VINNOVA strengthens Sweden’s innovation capacity
v e r k e t f ö r i n n o vat i o n s sy s t e m – s w e d i s h g o v e r n m e n ta l a g e n cy f o r i n n o vat i o n s y s t e m s
VINNOVA, SE-101 58 Stockholm, Sweden Besök/Office: Mäster Samuelsgatan 56Tel: +46 (0)8 473 3000 Fax: +46 (0)8 473 3005
[email protected] www.VINNOVA.se


![Säkra dosgränser, finns det?...Säkra dosgränser, finns det? RISKERNA [KLR 2016] ÖVERSIKT ÖVER OLIKA DOSGRÄNSER Lennart Johansson, Sjukhusfysiker, adj. professor Inst. f. strålningsvetenskaper,](https://static.fdocuments.net/doc/165x107/5e4031ea0839961c481d4d83/skra-dosgrnser-finns-det-skra-dosgrnser-finns-det-riskerna-klr.jpg)