
Chemical Hazards Engineering Fundamentals Webinar CCPS An ...
49
C CPS Center for Chemical Process Safety An AIChE Technology Alliance Chemical Hazard Engineering Fundamentals – Case Studies June 28, 2021 Slide - 1 Chemical Hazards Engineering Fundamentals Webinar Case Study – LG Polymers RUNAWAY STYRENE POLYMERIZATION Visakhapatnam, Andhra Pradesh, India May 7, 2020 Reference: Report of the Joint Monitoring Committee in the Matter of O.A. 73 of 2020 (May 28, 2020)
Transcript of Chemical Hazards Engineering Fundamentals Webinar CCPS An ...

CCPSCenter for Chemical Process Safety
An AIChE Technology Alliance Chemical Hazard Engineering Fundamentals – Case Studies
June 28, 2021 Slide - 1
Chemical Hazards Engineering Fundamentals Webinar
Case Study – LG Polymers
RUNAWAY STYRENE POLYMERIZATION
Visakhapatnam, Andhra Pradesh, India
May 7, 2020
Reference: Report of the Joint Monitoring Committee
in the Matter of O.A. 73 of 2020 (May 28, 2020)

CCPSCenter for Chemical Process Safety
An AIChE Technology Alliance Chemical Hazard Engineering Fundamentals – Case Studies
June 28, 2021 Slide - 2
Chemical Hazards Engineering Fundamentals (CHEF)For the Current Presentation, Please Join Us at:

CCPSCenter for Chemical Process Safety
An AIChE Technology Alliance Chemical Hazard Engineering Fundamentals – Case Studies
June 28, 2021 Slide - 3
We begin the study by Identifying the Equipment or Activity for which we intend to perform
an analysis. We will often use the operation of a specific equipment item containing a
specific chemical or chemical mixture to define the activity. For example, the operation of a
storage tank, a reactor, a piping network, etc. Inputs are chemical data, equipment designinformation, operating conditions, and plant layout.
What are the Hazards?
What can go Wrong?
How Bad could it Be?
How Oftenmight it
Happen?
Is the Risk Tolerable?
Identify Chemical
and ProcessHazards
Estimate Frequency
AnalyzeConsequences
Analyze Risk
ImplementAdditional
Safeguards as Needed
Develop Scenarios
Select Equipmentor Activity to be
Analyzed
Sustain Performancefor Life Cycle
of Facility
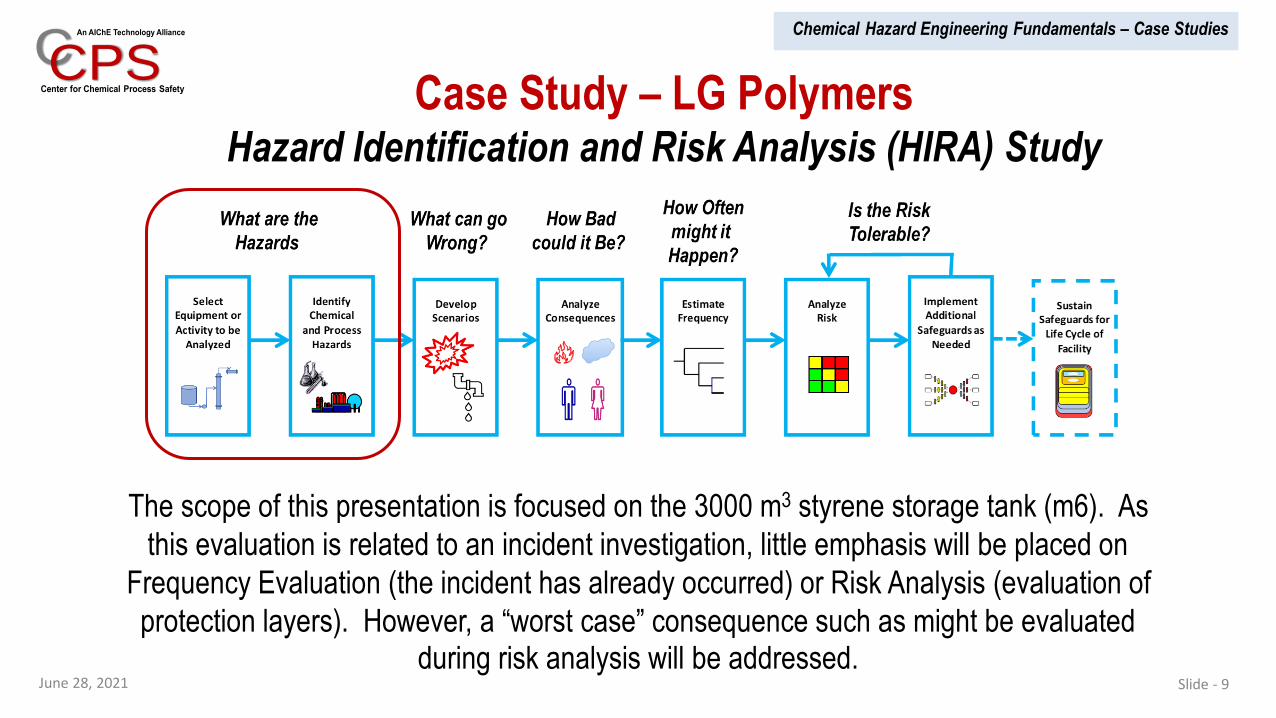
Case Study – LG PolymersHazard Identification and Risk Analysis (HIRA) Study

CCPSCenter for Chemical Process Safety
An AIChE Technology Alliance Chemical Hazard Engineering Fundamentals – Case Studies
June 28, 2021 Slide - 4
Case Study – LG Polymers
The Presenters
• More than 46 years industry
experience with Dow
Chemical - Engineering,
Process R&D, AgroSciences
Technology Center, and
Process Safety
• Part-time Lecturer at
University of Michigan
• Part-time Staff Consultant
for CCPS
• Primary developer of CHEF
and RAST spreadsheet tools
Rahul Raman Ken First
▪ Principal Engineer at Kaypear
▪ 13 years experience in Process
Safety Management with a
specialization in Emergency
Relief Systems.
▪ Active member AIChE DiERS
User Group and the API Sub-
Committee for Pressure-
Relieving Systems.
▪ Contributor to the High Power
Committee Report on the
Styrene Vapor Release
Incident at LG Polymers, India.

CCPSCenter for Chemical Process Safety
An AIChE Technology Alliance Chemical Hazard Engineering Fundamentals – Case Studies
June 28, 2021 Slide - 5
Case Study – LG Polymers
Process Description
LG Polymers was established in 1961 as “Hindustan Polymers” for manufacture of polystyrene
and it co-polymers at Visakhapatnam, India. The facility was taken over by LG Chemical
(South Korea) in 1997. The site employees 475 workers and 200 contractors. It is located on
219-acre site with a 30-acre greenbelt to the east. A residential area is located only 150 m
from site to the northwest.
Styrene is primarily stored in two tanks, m5 with a capacity of 3285 metric ton and m6 with a
capacity of 2790 metric ton. Tank m6 is 18 m diameter by 12 m height and contained 1830
metric ton styrene at the time of the incident. This tank is insulated and “flat-roof” with likely a
maximum allowable working pressure less than 0.1 bar (similar to API 650 design). m6 is
equipped with a 2-inch vent and 8-inch vent with dip hatch.
This is an illustrative example and does not reflect a thorough or complete study.

CCPSCenter for Chemical Process Safety
An AIChE Technology Alliance Chemical Hazard Engineering Fundamentals – Case Studies
June 28, 2021 Slide - 6
Case Study – LG Polymers
Process Description
Source: The High
Power Committee
Report on the Styrene
Vapor Release
Incident at LG
Polymers India Pvt Ltd
Shri Neerabh Kumar
Prasad, Chief
Secretary,
Government of
Andhra Pradesh

CCPSCenter for Chemical Process Safety
An AIChE Technology Alliance Chemical Hazard Engineering Fundamentals – Case Studies
June 28, 2021 Slide - 7
Case Study – LG Polymers
Process DescriptionStyrene monomer is stored at 20 C. However, the refrigeration unit servicing the styrene
storage tanks is often shut off at the end of the day shift (which is often the hottest part of
the day). Temperature is only measured at the bottom of the tank.
T-Butyl Catechol (TBC) is added to the monomer to inhibit polymerization. This inhibitor
requires dissolved oxygen to be effective. Dissolved oxygen is not monitored. TBC
concentration was monitored but no inhibitor was added to the storage tank after April 1 as
there was no stock available on site (although measured inhibitor level was within the
acceptable concentration range). No inhibitor was added for the past 10 years.
The facility was idled on March 25 due to the corona virus pandemic. Preparations were begun
on May 4 for a planned resumption of operations on May 7, 2020; the day of the incident.
This is an illustrative example and does not reflect a thorough or complete study.

CCPSCenter for Chemical Process Safety
An AIChE Technology Alliance Chemical Hazard Engineering Fundamentals – Case Studies
June 28, 2021 Slide - 8This is an illustrative example and does not reflect a thorough or complete study.
Case Study – LG PolymersHazard Identification and Risk Analysis versus Incident Investigation
Incident Investigation and Hazard Identification and Risk Analysis (HIRA) often utilize similar concepts
and methodology during the evaluation. In a HIRA study, process upsets and equipment failures
are anticipated which could lead to an unintended Loss of Containment of hazardous material
or energy. The possible Outcome with associated “worst” Consequence is estimated or modeled in
addition to estimation of the likelihood of the Event Sequence and effectiveness of Safeguards or
Protective Layers.
For an Incident Investigation, typically the Outcome and Consequence are known. The Loss
Event is often modeled to better understand how the Outcome and Consequence occurred. Incident
details are often used to “piece together” the Event Sequence to determine the possible Initiating Event
or Cause. Since the Incident has occurred, the Safeguards or Protective Layers were not effective and
conditions contributing to the consequence severity likely existed. This information is often used to
determine which key Management Systems had failed.
CCPSCenter for Chemical Process Safety
An AIChE Technology Alliance Chemical Hazard Engineering Fundamentals – Case Studies
June 28, 2021 Slide - 9
Case Study – LG PolymersHazard Identification and Risk Analysis (HIRA) Study
The scope of this presentation is focused on the 3000 m3 styrene storage tank (m6). As
this evaluation is related to an incident investigation, little emphasis will be placed on
Frequency Evaluation (the incident has already occurred) or Risk Analysis (evaluation of
protection layers). However, a “worst case” consequence such as might be evaluated during risk analysis will be addressed.

CCPSCenter for Chemical Process Safety
An AIChE Technology Alliance Chemical Hazard Engineering Fundamentals – Case Studies
June 28, 2021 Slide - 10
Case Study – LG Polymers
Hazard IdentificationStyrene
Flash Point: 88 ° F (NTP, 1992)
Lower Explosive Limit (LEL): 1.1 % (NTP, 1992)
Upper Explosive Limit (UEL): 6.1 % (NTP, 1992)
Autoignition Temperature: 914 ° F (USCG, 1999)
Melting Point: -24 to -23 ° F (NTP, 1992)
Vapor Pressure: 4.3 mm Hg at 59 ° F (15 ° C);
9.5 mm Hg at 86° F; 10 mm Hg at 95° F (NTP, 1992)
Specific Gravity: 0.906 at 68 ° F (USCG, 1999)
Boiling Point: 293 to 295 ° F (145.5 ° C) at 760 mm Hg (NTP, 1992)
Molecular Weight: 104.16 (NTP, 1992)
IDLH: 700 ppm (NIOSH, 2016)
Reference: Cameo Chemicals

CCPSCenter for Chemical Process Safety
An AIChE Technology Alliance Chemical Hazard Engineering Fundamentals – Case Studies
June 28, 2021 Slide - 11
Case Study – LG Polymers
Hazard Identification
Reference: Cameo Chemicals
• Although not considered highly toxic by inhalation, styrene causes moderate irritation
of eyes and skin. High vapor concentrations cause dizziness, drunkeness, and
anesthesia. (USCG, 1999)
• Styrene has been involved in several industrial explosions caused by violent,
exothermic polymerization [Bond, J., Loss Prev. Bull., 1985, (065), p. 25]. The
presence of an inhibitor lessens but does not eliminate the possibility of unwanted
polymerization. Violent polymerization leading to explosion may be initiated by
peroxides (e.g., di-tert-butyl peroxide, dibenzoyl peroxide), butyllithium,
azoisobutyronitrile. Styrene reacts violently with strong acids (sulfuric acid, oleum,
chlorosulfonic acid), and strong oxidizing agents [Lewis, 3rd ed., 1993, p. 1185].
• The heat of polymerization is noted as -154 cal/g by US National Oceanic and
Atmospheric Administration (NOAA)

CCPSCenter for Chemical Process Safety
An AIChE Technology Alliance Chemical Hazard Engineering Fundamentals – Case Studies
June 28, 2021 Slide - 12
Case Study – LG PolymersHazard Identification and Risk Analysis (HIRA) Study

CCPSCenter for Chemical Process Safety
An AIChE Technology Alliance Chemical Hazard Engineering Fundamentals – Case Studies
June 28, 2021 Slide - 13
Case Study – LG PolymersPartial List of Hazard Scenarios per CHEF Example Scenarios
Partial Listing of suggested scenarios for consideration from CHEF Calculation Aid which includes
the likely scenario resulting in the runaway polymerization incident (Uncontrolled Reaction).
Go to Top Example Listing of scenario groups for Common Chemical Process Equipment
Scenario or Hazard
CategoryParameter/ Deviation Applicable Equipment
Initiating Events
(Partial List)Loss Event* Incident Outcome
Excessive Heat Input -
Pool Fire Exposure
Temperature-High
Pressure-High
Heat Input-High
AllScenarios involving spill plus ignition in nearby
liquid-containing equipment
Relief Venting
Equipment Rupture
Equipment Damage
Flammable Release
Toxic Release
Flash Fire or Fireball
Physical Explosion
Business Loss
Ignitable Headspace
Composition-Wrong
Concentration
Electrostatic Charge-High
Electrical Conductivity-Low
All but Liquid-Full Equipment
Flow Control Failure
Failure of Bonding or Grounding
Particle Size Control Failure (Solids)
Wrong Type or Damaged Bag, Pak or Drum (Solids)
Improper Changing Dust Collector Bag or Screen (Solids)
Gasket Leak
Equipment Rupture
Equipment Damage
Flammable Release
Toxic Release
Flash Fire or Fireball
Physical Explosion
Business Loss
Overfill, Overflow, or
Backflow
Level-High
Flow-BackflowAll Liquid Containing Equipment
Level Control Failure
Procedure Failure (Human Error)
Overflow Release
Equipment Damage
Equipment Rupture
Flammable Release
Toxic Release
Physical Explosion
Business Loss
Uncontrolled Reaction
Reaction-High Rate
Temperature-High
Composition-Wrong
AllFlow Control Failure
Temperature Control Failure
Relief Venting
Equipment Rupture
Flammable Release
Toxic Release
Flash Fire or Fireball
Physical Explosion
Business Loss
Uncontrolled Reaction -
Incompatible MaterialsReaction-Wrong Reaction All
Addition of Wrong Recipe (Human Error)
Addition of Wrong Material (Human Error)Equipment Rupture
Flammable Release
Toxic Release
Flash Fire or Fireball
Physical Explosion
Business Loss
Vacuum Damage Pressure-Low AllPressure Control Failure
Mechanical Failure
Full-Bore Leak
Equipment Damage
Flammable Release
Toxic Release
Business Loss

CCPSCenter for Chemical Process Safety
An AIChE Technology Alliance Chemical Hazard Engineering Fundamentals – Case Studies
June 28, 2021 Slide - 14
Case Study – LG PolymersRunaway Exothermic Reaction Scenario
To better understand this scenario, we need to address “how”
runaway reaction of an inhibited monomer can occur. This
requires more information on the polymerization inhibitor and
reaction kinetics.

CCPSCenter for Chemical Process Safety
An AIChE Technology Alliance Chemical Hazard Engineering Fundamentals – Case Studies
June 28, 2021 Slide - 15
Case Study – LG PolymersRunaway Exothermic Reaction
A potential cause for unintended reaction, particularly during transportation or storage is loss
of inhibitor effectiveness. Styrene is typically inhibited with 4-tert-butylcatechol (TBC) which
requires dissolved oxygen to be effective. This inhibitor also degrades with time and becomes
ineffective. As the plant was shut down, no “fresh” inhibited styrene was added to the storage tank for more than 6 weeks.
Reference: Americas Styrenics LLC, “Safe Handling and Storage of Styrene Monomer” (2016)

CCPSCenter for Chemical Process Safety
An AIChE Technology Alliance Chemical Hazard Engineering Fundamentals – Case Studies
June 28, 2021 Slide - 16
Case Study – LG PolymersRunaway Exothermic Reaction – Simple Screening Techniques
Also during the Reactivity Hazards module, use of Reactive Chemicals test data such as
calorimetry was discussed in estimation of reaction kinetics . The initial rate, r0, and
Activation Energy, DE, may be determined as a function of conversion for a simple “n” order
model at any assumed reaction order by linear regression of:
ln (observed rate / (1-c)n) = ln (r0) + (DE/R) (1/TDet – 1/T)
where: x is reaction conversion estimated from an increment of temperature riseR = gas law constant
Various reaction orders may be assumed to determine which provides a “best” fit. Similar
regression analysis may be used for other simple kinetic models.
Often a simple zero or first order kinetic model provides sufficient accuracy for
screening evaluation of reactivity hazards.

CCPSCenter for Chemical Process Safety
An AIChE Technology Alliance Chemical Hazard Engineering Fundamentals – Case Studies
June 28, 2021 Slide - 17
Case Study – LG PolymersRunaway Exothermic Reaction – Simple Kinetics
This reactive chemicals experiment was run with
a Thermal Inertia (or f factor) of 1.56. In other
words, 36% of the observed heat was lost to the
experimental apparatus. To scale this data to a
large storage tank (for which little of the reaction
heat would be lost to heating the tank itself), we
need to correct the information by multiplying the
initial observed heat rate by 1.56 and recognizing
that, in a near adiabatic system, the overall
temperature rise would be 1.56 higher than this
observation. Also note that over a broad region
of the reaction, the reactor order may not
significantly impact the overall rate estimate.
RC Data Reaction ModelingUninhibited Styrene at F = 1.56
0.01
0.1
1
10
100
0 50 100 150 200 250 300
Temperature, C
Tem
pera
ture
Ris
e R
ate
C/m
in
Rate at n=2
Rate at n=0
Heat Rate Data
Rate at n=1
r0 D E r 2 F ss
reg
Fit at n=2 0.0305 22.1 0.948 618.289 7.73E+02
Fit at n=1 0.0346 19.2 0.638 59.935 1.44E+03
Fit at n=0 0.0395 16.2 0.197 8.336 2.92E+03
RC Data Reaction ModelingUninhibited Styrene at F = 1.56
0.01
0.1
1
10
100
0 50 100 150 200 250 300
Temperature, C
Tem
pera
ture
Ris
e R
ate
C/m
in
Rate at n=2
Rate at n=0
Heat Rate Data
Rate at n=1
Rate at n=2
Rate at n=0
Heat Rate Data
Rate at n=1
r0 D E r 2 F ss
reg
Fit at n=2 0.0305 22.1 0.948 618.289 7.73E+02
Fit at n=1 0.0346 19.2 0.638 59.935 1.44E+03
Fit at n=0 0.0395 16.2 0.197 8.336 2.92E+03
R at 80 C0 D E r 2 F ssreg
Fit at n=2 0.0305 22.1 0.948 618.289 7.73E+02
Fit at n=1 0.0346 19.2 0.638 59.935 1.44E+03
Fit at n=0 0.0395 16.2 0.197 8.336 2.92E+03

CCPSCenter for Chemical Process Safety
An AIChE Technology Alliance Chemical Hazard Engineering Fundamentals – Case Studies
June 28, 2021 Slide - 18
Case Study – LG PolymersRunaway Exothermic Reaction – Simple Screening Techniques
During the Reactivity Hazards module, the concept of Temperature of No Return
was discussed. As the storage tank was likely insulated due to also be refrigerated,
heat loss would be very small.
Beyond the Temperature of No Return, if no action is taken, the reaction will
proceed to a maximum rate.
Note that most reactions follow an Arrhenius or exponential relationship with temperature while heat losses are
generally linear with temperature.
Heat Gain from
Exothermic Reaction
Proportional to e-DE / R T
Hea
t R
ate
Temperature
Heat Loss to
Surroundings
= U A DT
Temperature of No Return, TNR

CCPSCenter for Chemical Process Safety
An AIChE Technology Alliance Chemical Hazard Engineering Fundamentals – Case Studies
REACTIVITY HAZARDS INPUT INFORMATIONRequired Inputs are Shaded "Yellow"
Description:
Select Reactivity Screening Estimate
Input Value Input Units Equation Input Equation Units
Initial (or Detected Onset) Temperature, T0 80 C 80 C
Initial Pressure, P0 0.001 bar 0.00 bar gauge
Initial Observed Temperature Rate, r0 0.035 C/min 0.035 C/min
Activation Energy, DE 19.2 kcal/g mole 80.33 kJ/g mole
Heat of Reaction per Mass, DHr -154 cal/g 644.34 kJ/kg
Contents Average Heat Capacity, C 1.93 kJ/kg 1.930 kJ/kg C
Total Reaction Mass 1830000 kg 1830000.00 kg
Net Mole Vapor Generated/Liter Contents g mole/liter contents
Exothermic or Endothermic Reaction Exothermic Assumed Exothermic if blank
Vapor or Liquid Phase Reaction Liquid Assumed Liquid if blank
Thermal Inertia of Testing Device 1.56 Note: A value of 1 indicates an adiabatic data. Assumed 1 if blank.
Equipment of Vessel Fill Fraction, FF 0.66 Assumed 0.5 if blank
Vol Ratio (Vr / VV) = 1 for vapor phase or Fill Fr / (1 - Fill Fr) for liquid phase reaction = 1.941
Temperature Temp Units Vapor Press Pressure Units
Input Temperature 1 and Vap Press 1 15 C 4.3 mmHg
Input Temperature 2 and Vap Press 2 145.5 C 760 mmHg
Vapor Pressure at Temperature 1 15 C 0.57 kPa absolute
Vapor Pressure at Temperature 2 145.5 C 101.33 kPa absolute
Estimated Vap Pressure at Initial Reaction Temperature, PVP@To = 0.12 bar
Estimated Vap Pressure at Max Reaction Temperature, PVP@Tmax = 87.83 bar
Estimated Pad Gas Pressure at T0 = P0 - PVP@To = 0.89 bar
Input Value Input Units Equation Input Equation Units
Equipment or Vessel Heat Transfer Area, A 950 sq m 950.000 m2
Heat Loss Coefficient, U 0.0005 kwatt /sq m C 0.0005 kWatt/m2 C
Coolant Temperature, TCoolant 20 C 20 C
Ref Temperature for Time to Max Rate, TRef 30 C 30 C
Estimated Temp Rate at TREF, qREF = 0.0006 C/min
Temperature of No Return
Evalutaion of runaway polymerization in Styrene Storage Tank based on Accelerating Rate Calometry Data for
uninhibited Styrene
Clear Inputs
June 28, 2021 Slide - 19
Case Study – LG PolymersRunaway Exothermic Reaction – Temperature of No Return
This is an illustrative example and does not reflect a thorough or complete study.
Enter information from the
Reactive Chemicals “test”
including Initial Temperature,
Initial Temperature Rate,
Activation Energy, Heat of
Reaction, and Thermal Inertia
Enter Equipment Information
such as Total Reaction
Mass, Fill Fraction, Heat
Transfer Area, Heat Loss
Coefficient, and Coolant
Temperature
Enter Reference Temperature
for “Time to Maximum Rate”
estimation if desired.
Enter Chemical Data such
as Liquid Heat Capacity
and Vapor Pressure of the
reaction system
ln(Vap Press) = A -B / (T + 273)
Initial Temperature for Plot = C Vap Press A 16.0384
Maximum Temperature Rise for Plot = 333.9 C Vap Press B 4779.285
Vap Press at Initial Temperature = 0.12 bar Pad Gas = 0.89 bar
Conversion Temp, C Vap Press, barTotal Press, bar Temp Rate Cool Rate, C/min
0.00 0.69 1.7942E-05 #N/A
0.001 40 0.02 0.81 0.0017 0.0002
0.005 80 0.12 1.01 0.0543 0.0005
0.1 113.4 0.39 1.37 0.5230 0.0008
0.2 146.8 1.05 2.11 3.3967 0.0010
0.3 180.2 2.43 3.57 16.1995 0.0013
0.4 213.5 5.00 6.23 59.9691 0.0016
0.5 246.9 9.40 10.72 178.8640 0.0018
0.6 280.3 16.37 17.77 439.0995 0.0021
0.7 313.7 26.77 28.25 889.5195 0.0024
0.8 347.1 41.50 43.07 1439.2231 0.0026
0.9 380.5 61.53 63.18 1595.2057 0.0029
0.95 397.2 73.82 75.52 1152.7337 0.0030
0.98 407.2 82.00 83.71 570.1461 0.0031
0.99 410.5 84.86 86.59 305.5541 0.0032
0.995 412.2 86.32 88.05 158.1299 0.0032
Maximum Adiabatic Temperature (equation 4-1), TMax = T0 - DHr / C
TMax = 80 + 644.3 / 1.93 = 413.9 C
Maximum Adiabatic Pressure (equation 4-2), Pmax = Ppad (Tmax / T0 ) + PVP@Tmax + b R Tmax ( Vr / VV)
Pmax = 0.89 ( 413.9+273 ) / (80+273 ) + 87.83 + 0 ( 0.083 ) (413.9+273) ( 1.94 ) = 89.57 bar
Temperature of No Return (equation 4-4), TNR = 1 / [R ln (r0 / rTNR) / DE + 1 / T0]
where rTNR = U A (TNR - Tcoolant) / ( M C )
TNR solved by trial and error or graphically yields: < Coolant T C
Time to Maximum Rate (equation 4-5), tMR = R TRef2 / ( rRef DE )
where rRef determined by thermal kinetic expression: r = r0 exp[ -( DE / R ) ( 1 / TRef - 1 / T0 )
tMR = 8.3145 ( 30 + 273 )^2 / ( 0.001 ( 80332.8 ) ) = 15928.0 min
or 11.1 day
MAXIMUM ADIABATIC TEMPERATURE and PRESSURE
Reactivity Hazards - section 4.7
TIME TO MAXIMUM RATE - Exothermic Reaction
Reactivity Hazards - section 4.17
TEMPERATURE OF NO RETURN - Exothermic Reaction
Reactivity Hazards - section 4.16
0.0001
0.001
0.01
0.1
1
10
100
1000
10000
0 50 100 150 200 250 300 350 400 450
Tem
pera
ture
Rat
e (C
/min
) or
Pres
sure
(bar
)
Temperature, C
Temperature Rate or Pressure versus TemperatureAssuming 1st Order Reaction
Vap Press, bar Total Press, bar Temp Rate Cool Rate, C/min
The Temperature of
No Return less than
ambient operating
temperature.
CCPSCenter for Chemical Process Safety
An AIChE Technology Alliance Chemical Hazard Engineering Fundamentals – Case Studies
June 28, 2021 Slide - 20
Case Study – LG Polymers
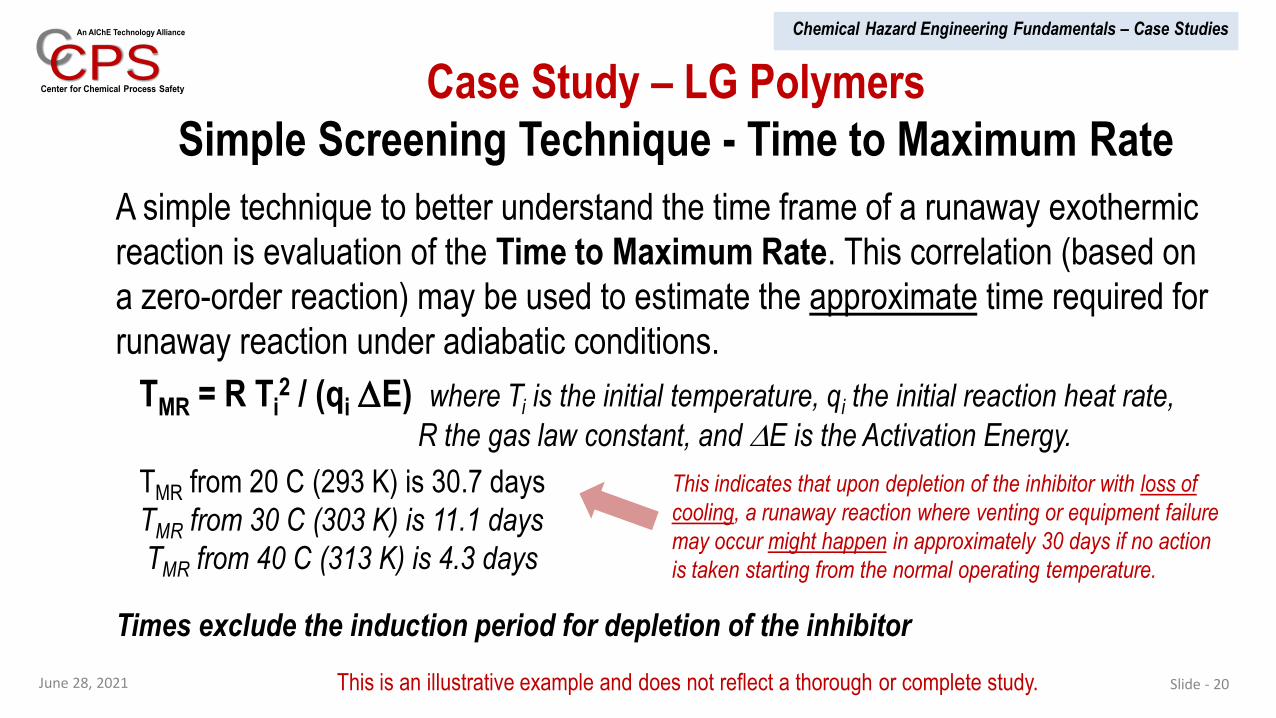
Simple Screening Technique - Time to Maximum Rate
A simple technique to better understand the time frame of a runaway exothermic
reaction is evaluation of the Time to Maximum Rate. This correlation (based on
a zero-order reaction) may be used to estimate the approximate time required for
runaway reaction under adiabatic conditions.
TMR = R Ti2 / (qi DE) where Ti is the initial temperature, qi the initial reaction heat rate,
R the gas law constant, and DE is the Activation Energy.
TMR from 20 C (293 K) is 30.7 days
TMR from 30 C (303 K) is 11.1 days
TMR from 40 C (313 K) is 4.3 days
Times exclude the induction period for depletion of the inhibitor
This is an illustrative example and does not reflect a thorough or complete study.
This indicates that upon depletion of the inhibitor with loss of
cooling, a runaway reaction where venting or equipment failure
may occur might happen in approximately 30 days if no action
is taken starting from the normal operating temperature.

CCPSCenter for Chemical Process Safety
An AIChE Technology Alliance Chemical Hazard Engineering Fundamentals – Case Studies
June 28, 2021 Slide - 21
Polling QuestionDo You Have Access to Reactive Chemicals Testing
and Interpretation at Your Company?
❑ Have Internal Testing Capability and Internal Interpretation Expertise
❑ Use Contract Laboratories for Testing and Interpretation
❑ Use Contract Laboratories for Testing with Internal Interpretation
❑ Do Little or No Reactive Chemicals
Testing or Data Interpretation
❑ Do Not Know

CCPSCenter for Chemical Process Safety
An AIChE Technology Alliance Chemical Hazard Engineering Fundamentals – Case Studies
June 28, 2021 Slide - 22
Case Study – LG PolymersHazard Identification and Risk Analysis (HIRA) Study

CCPSCenter for Chemical Process Safety
An AIChE Technology Alliance Chemical Hazard Engineering Fundamentals – Case Studies
June 28, 2021 Slide - 23
Case Study – LG PolymersPotential Incident Outcome
Generalized OutcomeEvent Tree
Property Damage or Business Loss
Vapor, Liquid Mist,or Suspended Dust
Liquid
Flash Fraction, Aerosol and Pool
Evaporation
NotIgnited
Ignited
NotIgnited
Early Ignition
Vapor Cloud Explosion
Dermal Toxic, Hot, or Corrosive
Aquatic or Ingestion Toxic
Outdoors
NotIgnited
Outdoor Flash or Jet Fire
Outdoor Toxic Vapor Cloud
Indoor Toxic Release
Building Explosion
Indoors
Pool Fire
Chemical Exposure
Environmental Damage
BLEVE or Fireball
Loss of Containment
(Release of Hazardous Material or Material in Hazardous Service)
Equipment Rupture Physical
Explosion
Equipment Damage
Ph
ysic
al S
tate
Lo
cati
on
Excessive Heat with
Vapor Venting
NotIgnited
LateIgnitionNot
Ignited
Early Ignition
Release of Energy(Excessive Pressure,
Reaction, Internal Deflagration, etc.)
Peak Pressure >> MAWP
LateIgnition
Indoor Flash or Jet Fire
Loss Events
Incident Outcome
Ignited
NotIgnited
Gas
ket
Fai
lure
Head Space Deflagration
Outcome for
Outdoor Vapor
Release
CCPSCenter for Chemical Process Safety
An AIChE Technology Alliance Chemical Hazard Engineering Fundamentals – Case Studies
June 28, 2021 Slide - 24
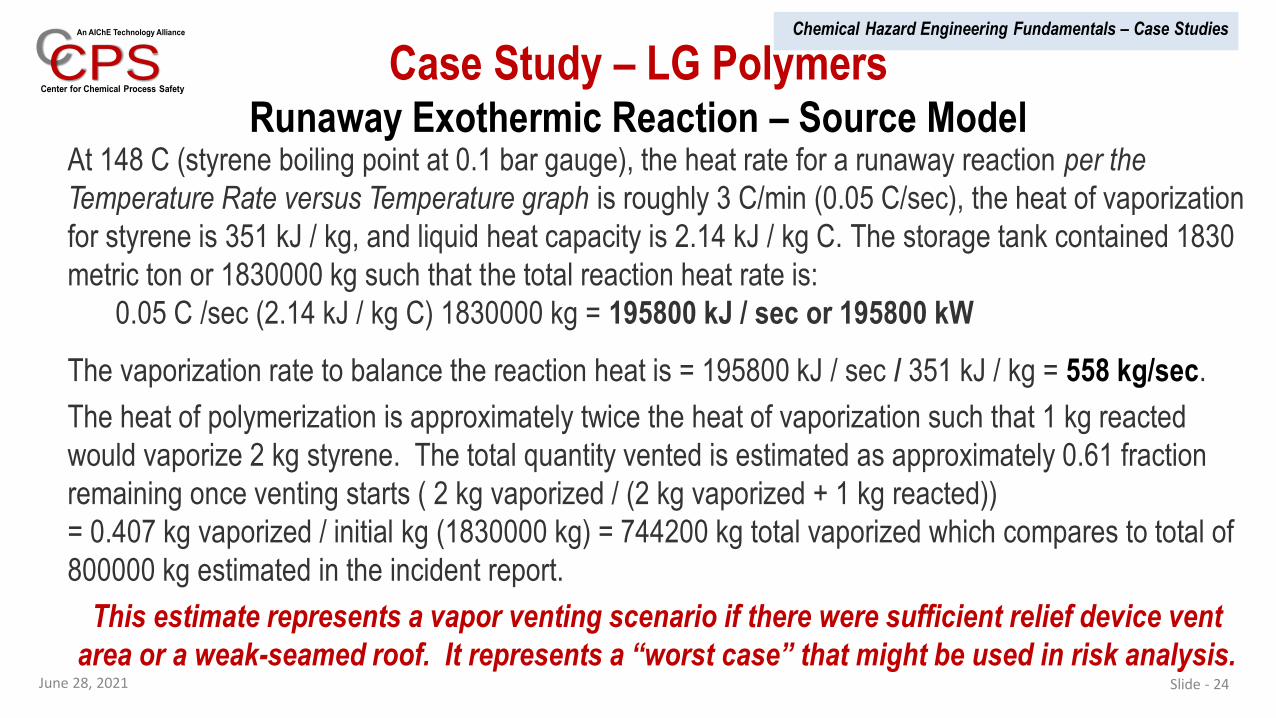
Case Study – LG PolymersRunaway Exothermic Reaction – Source Model
At 148 C (styrene boiling point at 0.1 bar gauge), the heat rate for a runaway reaction per the
Temperature Rate versus Temperature graph is roughly 3 C/min (0.05 C/sec), the heat of vaporization
for styrene is 351 kJ / kg, and liquid heat capacity is 2.14 kJ / kg C. The storage tank contained 1830
metric ton or 1830000 kg such that the total reaction heat rate is:
0.05 C /sec (2.14 kJ / kg C) 1830000 kg = 195800 kJ / sec or 195800 kW
The vaporization rate to balance the reaction heat is = 195800 kJ / sec / 351 kJ / kg = 558 kg/sec.
The heat of polymerization is approximately twice the heat of vaporization such that 1 kg reacted
would vaporize 2 kg styrene. The total quantity vented is estimated as approximately 0.61 fraction
remaining once venting starts ( 2 kg vaporized / (2 kg vaporized + 1 kg reacted))
= 0.407 kg vaporized / initial kg (1830000 kg) = 744200 kg total vaporized which compares to total of
800000 kg estimated in the incident report.
This estimate represents a vapor venting scenario if there were sufficient relief device vent
area or a weak-seamed roof. It represents a “worst case” that might be used in risk analysis.

CCPSCenter for Chemical Process Safety
An AIChE Technology Alliance Chemical Hazard Engineering Fundamentals – Case Studies
June 28, 2021 Slide - 25
Case Study – LG PolymersDispersion Model for “Worst Case” Venting Scenario
Using the CHEF Calculation Aid, a 558 kg/sec styrene release would reach the following distances
for specific concentrations at a wind speed of 3 m/sec and residential surface roughness.
Concentration
(ppm)
Distance
(m)
LFL of 8800 ppm* 573*
½ LFL of 4400 ppm* 870*
1000 2080
2000 1388
5000 806
*based on flammable averaging time of 18 sec
These estimates represent a “worst
case” consequence as might be
evaluated during risk analysis.
VAPOR DISPERSION INPUT INFORMATION
Required Inputs are Shaded "Yellow"
STEP 1 - Select Location, Type of Release, Concentration and Distance of Interest
Release Location (Assumed Outdoor if Blank)
Type of Release
Use Averaging Time Correction for Flammable Release Yes
Input Value Input Units Equation Input Equation Units
Concentration of Interest 0.88 vol % 8800 ppm
Concentration of Interest for Hazard Analysis is typically 1/2 LFL, LFL, ER-2, ER-3 or LC 50
Outdoor Downwind Distance of Interest, X m
Distance of Interest is typically to the property limit, to an unrestricted work area, or to an occupied building
Note that Concentration of Interest must be entered for estimation of Instantaneous (or puff) release
STEP 2 - Enter Chemical Properties (or Select Chemical Name from Pic List)
Cas No.
Chemical Name 100-42-5
Data Table Value
Lower Flammable Limit, LFL 0.88 vol %
ERPG-3 Concentration 1000 ppm
ERPG-2 Concentration 250 ppm
Input Value Equation Input
Vapor Molecular Weight, Mw 104.15 104.15
Normal Boiling Point, TB 144.6 144.6 C
STEP 3 - Enter Process Information
Process Inputs: Input Value Input Units Equation Input Equation Units
Airborne Rate, Q 558 558 kg/sec
Vapor Temperature, T 148 148 C
Total Release Quantity, Q* (Leave Blank if Unlimited) 744200 744200 kg
Liquid or Two-Phase Release Velocity* (Flashing Liquid) m/sec
Initial Fraction Vapor*, f 0 (Flashing Liquid Only) Fraction
kPa absolute
*Note that these inputs may not significantly change results
STEP 4 - Enter Equipment and Plant Layout Information
Equipment and Plant Layout Inputs: Input Value Input Units Equation Input Equation Units
Diameter of Hole or Discharge Piping, d0 m
The hole size for vapor release estimate or diameter of relief system discharge piping. If blank, no jet mixing used.
Release Elevation, h (Blank assumed at Ground) 12 12 m
Release Direction (Assumed Horizontal if Blank)
Enclosed Process Area Volume, VBldg cu m
Enclosed Process Area Ventilation Rate Air Changes/Hr (Assumed 1 if Blank)
Vapor Pressure at Release Temp
(Subcooled Liquid Only)
Outdoor
Styrene
Vapor
Input Units may be changed - Input Values in "blue" will be converted to appropriate equation units
If "Yes" dispersion concentration
is approximately doubled
For reference in determining
concentration of interest
Leave Blank to accept
Chemical Data Table
Mw
Clear InputsClear Inputs
per Correlation Details with Concentration in ppmv
Plume or Continuous: C m = 3.8E+08 1.75 )
Puff or Instantaneous: C m = 6.5E+06 2.29 )
per Correlation Details for 1.5 m/sec F Stability with Concentration in ppmv
Plume or Continuous: C m = 1.6E+08 1.73 )
Puff or Instantaneous: C m = 1.3E+07 2.45 )
Test for Plume versus Puff Model at Dispersion Conditions: (equation 12-20)
If Q > (a*/a) u Q* Xb-b* ---> Instantaneous Model (from equating Puff and Plume correlation at X)
558 kg/sec < 0.01689 (3 m/sec) 744200 kg (614 m)^-0.54 or 1194.93 kg/sec -->
Alternate weather Puff versus Plume Model
558 kg/sec < 0.080222 (1.5 m/sec) 744200 kg (604 m)^-0.71 or 932.52 kg/sec -->
Estimated Exposure Duration - Continuous Dispersion (Equations 12-21, 12-23)
t = Q* / Q for Continuous or 2 (0.2) [Q* T amb / (Mw C)]0.37
/ Wind Speed for Instantaneous
t = 744200 Kg / 558 Kg/sec = 1333.7 sec
Alternate weather Estimated Exposure Duration
t = 744200 Kg / 558 Kg/sec = 1333.7 sec
Maximum Downwind Distance to Concentration of Interest (equations 12-9, 12-13)
Continuous (equation 37): X = a [ Q / ( u Mw Cm ) ]b - X0
r air = 1.18 Kg/m3 = 78200 [ ( 558 ) / { ( 3 ) 104.15 ( 8800 ) } ]^0.57 - 41.3 = 573 m
at ambient conditions Instantaneous (equation 41): X = a* [ (Q* / ( Mw Cm ) ]
b* - X0
= 940 [ 744200 / ( 104.15 ( 8800 )) ]^0.44 - 41.3 = m
( Q* / Mw ) / ( X ^
Continuous
for 3 m/sec Wind Speed, Class D Atmospheric Stability, and Residential Surface Roughness
( Q* / Mw ) / ( X ^
SIMPLE VAPOR DISPERSION
( Q / Mw ) / ( u X ^
Continuous
( Q / Mw ) / ( u X ^
Maximum Concentration at Ground Elevation
Effective Release Elevation
Release Elevation
Ground Elevation
Cloud Centerline
Concentration at Specified Distance
and Elevation
Maximum Concentration at Specified Distance
Outdoor Vapor Release
Initial Dilution
Distance Correction for
Initial Dilution, DXt
Show Correlation Details
Hide Correlation Details

CCPSCenter for Chemical Process Safety
An AIChE Technology Alliance Chemical Hazard Engineering Fundamentals – Case Studies
June 28, 2021Slide - 26
Case Study – LG PolymersVapor Cloud Explosion Model for “Worst Case” Venting Scenario
Using the CHEF Calculation Aid, a 558 kg/sec styrene release and distance to LFL concentration of
573 m, a Vapor Cloud Explosion would yield:
Distance to 1 psi blast
overpressure of 604 m
from the release location.
Distance to 2.3 psi blast
overpressure of 430 m from
the release location.
These estimates represent a
“worst case” consequence
as might be evaluated
during risk analysis.
EXPLOSION INPUT INFORMATION
Required Inputs are Shaded "Yellow"
STEP 1 - Select Type of Explosion and Distance of Interest
Type of Explosion:
Input Value Input Units Equation Input Equation Units
Distance of Interest, X 430 430 m
STEP 2 - Enter Equipment Burst Pressure and Volume for Physical Explosion Skip Step
Physical Explosion Inputs: Input Value Input Units Equation Input
Burst Pressure (gauge), PB - P0 kPa gauge
Equipment Volume, VEquip cu m
Burst Temperature, TBurst C
Fraction Liquid Level (if Superheated), FF
Flash Fract during Depressurization, FV
STEP 3 - Enter Quantity and Heat of Reaction for Condensed Phase Explosion Skip Step
Condensed Phase Detonable Inputs: Input Value Input Units Equation Input
Mass of Material, M kg
Heat of Reaction per Mass, DHR kJ/kg
STEP 4 - Enter Chemical Properties (or Select Chemical Name from Pic List)
Cas No.
Chemical Name 100-42-5
Data Table Value User Value Equation Input
Vapor Molecular Weight, Mw 104.15 104.15
Liquid Density, rL (at Burst Temperature) 924 924 kg/m3
Lower Flammable Limit, LFL 0.88 0.88 vol %
Fuel Reactivity based on Fundamental Burning Velocity Medium Medium(Leave User Value Blank to accept Data Table Value)
Ideal Gas Vapor Density, rV (at Burst Temperature) 4.63 kg/m3
STEP 5 - Enter Information for Building or Head Space Explosion Skip Step
Building or Head Space Explosion Inputs: Input Value Input Units Equation Input
Building or Head Space Volume, VB cu m
Degree of Internal Congestion Assumed "Medium" if Blank
1 D Confinement? (such as Fire Tube Boilier) Assumed "No" if Blank
STEP 6 - Enter Information for Vapor Cloud Explosion
Vapor Cloud Explosion Inputs: Input Value Input Units Equation Input
Distance to LFL from Dispersion Model , XLFL 573 m 573 m
Vapor Rate 558 kg/sec 558 kg/sec
Wind Speed (Assumed 3 m/sec if Blank) 3
Degree of Outdoor Congestion Assumed "Medium" if Blank
Vapor Cloud Explosion
Styrene
Input Units may be changed - Input Values in "blue" will be converted to appropriate equation units
Clear Inputs
Vapor Cloud Explosion (based on 3 m/sec wind speed)
Low Medium High
High 0.5 >1 >1
Low-Medium 0.35 0.5 1
Flammable Cloud Volume (equation 13-4), VC = 2440 Q XLFL / ( F u Mw CLFL) =
2440 ( 558 ) ( 573 ) / [ 2 ( 3 ) ( 104.15 ) ( 0.88 ) ] = 30000 m3
Distance to Explosion Epicenter, X EE = 0.5 X LFL = 0.5 ( 573 ) = 286.5 m
Potential Explosion Site Volume limited to 30000 cu m
Explosion Energy (equation 13-3), QE = 3500 VPES = Note: P A = 101.3 kPa
3500 ( 30000 ) = 105000000 kJ
Scaled Overpressure at 1 psi = 0.068
Scaled Distance, R = X / (2 QE / P0 )1/3
= 2.5
Distance to 1 psi = R (2 QE / P0 )1/3
+ XEE =
2.5 [ 2 ( 105000000 ) / 101.3 ]^1/3 + 286.5 = 603.7 m
From Graph, Scaled Distance, R = ( X - XEE) / (2 QE / P0 )1/3
=
( 430 - 286.5 ) / [ 2 ( 105000000 ) / 101.3 ]^1/3 = 1.131
Scaled Overpressure = 0.158
Overpressure at 430 m = 2.3 psi or 16 kPa
Fuel
Reactivity
Obstacle Density or Congestion
Use Mach 0.5 for Low-
Medium Fuel Reactivity and
Medium Confinement
BAKER-STREHLOW-TANG MODEL
0.01
0.1
1
10
100
0.1 1 10
Sca
led
Ove
rpre
ssu
re,
PS
= P
0/
P a
Scaled Distance, R = X / (2 QE / Pa)1/3
Baker-Strehlow-Tang Overpressure Curves
Mach > 1
Mach 1.0
Mach 0.7
Mach 0.35
Mach 0.5
1 psi overpressure

CCPSCenter for Chemical Process Safety
An AIChE Technology Alliance Chemical Hazard Engineering Fundamentals – Case Studies
June 28, 2021 Slide - 27
Case Study – LG PolymersDevelopment of “Worst Case” Scenario Consequence Severity
ConcentrationsBlast Overpressure
2.1 km to
1000 ppm
0.6 km to 1 psi
overpressure
0.43 km to 2.3 psi
overpressure
0.81 km to 5000 ppm
0.87 km to 4400 ppm ½ LFL
Estimation of Concentration and Blast Overpressure versus Distance per CHEF/RAST
1.4 km to
2000 ppm
0.57 km to
8800 ppm LFL

CCPSCenter for Chemical Process Safety
An AIChE Technology Alliance Chemical Hazard Engineering Fundamentals – Case Studies
June 28, 2021 Slide - 28
Case Study – LG PolymersScenario Consequence Severity
o Had the styrene vent rate been close to that estimated from the reaction kinetics assuming a
“homogeneous” system, the hazard zones would have been significantly greater than actual
observation.
o If the tank had ruptured or the roof opened such as a “weak seam roof”, then contents would
likely have continued reacting and vaporizing styrene at near this rate and temperature.
o Since the tank did not fail, the actual vent rate of styrene was likely close to the 8 inch
emergency vent capacity.
Why was the actual event consequence severity so much lower than the
screening estimate?

CCPSCenter for Chemical Process Safety
An AIChE Technology Alliance Chemical Hazard Engineering Fundamentals – Case Studies
June 28, 2021 Slide - 29
Case Study – LG Polymers
Additional Questions
• Would a more detailed kinetic model account for the differences?
• How long might it take for the inhibitor to become depleted?
• How effective was the tank cooling system?
• Is it feasible to reach runaway reaction conditions to occur within the time
frame of the plant shutdown?
• Other questions?

CCPSCenter for Chemical Process Safety
An AIChE Technology Alliance Chemical Hazard Engineering Fundamentals – Case Studies
June 28, 2021 Slide - 30
Case Study – LG Polymers
Detailed Kinetic Modeling
• Hui and Hamielec model is a well-established kinetic model to represent the
Runaway Reaction of Styrene Monomer. Excellent agreement to experimental
results between 100 °C to 200 °C. Design Institute for Emergency Relief
Systems (DiERS) Recommended Model.
• Inhibitor depletion was included in the model based on work by Harold Fisher.
“H Fisher (1991). A Runaway Styrene Polymerization Incident with Inhibitor
Effectiveness Study. Pittsburgh, PA.”
• A Runaway Polymerization was simulated for the m6 tank using a DiERS
version of SuperChemsTM software from ioMosaic.

CCPSCenter for Chemical Process Safety
An AIChE Technology Alliance Chemical Hazard Engineering Fundamentals – Case Studies
Slide - 34
❑ With 30 °C starting temperature, the time
taken to reach relief device set point is 23
days
❑ Rapid opening and closing of relief device
as the temperature increases beyond 80 °C. Relief valve remains open at 100 °C.
❑ Premature vessel failure as relief device
is not adequately sized to handle the
runaway reaction scenario under true
adiabatic conditions occurs at 587
hours or 24.5 days (versus estimated time
to maximum rate of 11.1 days excluding
inhibitor depletion starting at 30 °C)
Case Study – LG Polymers
SuperChems Model Results
This is an illustrative example and does not reflect a thorough or complete study.

CCPSCenter for Chemical Process Safety
An AIChE Technology Alliance Chemical Hazard Engineering Fundamentals – Case Studies
Slide - 35
Case Study – LG Polymers
SuperChems Model Results
This is an illustrative example and does not reflect a thorough or complete study.
• The detailed model predicted the runaway reaction could occur within a time
frame consistent with the 5 week plant shutdown. However, an initial temperature of 30 °C versus the operating temperature of 20 °C was needed.
• Simulation of the event indicated the vessel would fail as the relief device was
grossly undersized for the required vent rate.
• Detailed Kinetic Modeling did not identify why the vent rate was much lower
than estimated such that the tank did not fail. There are other factors that need
to be considered.

CCPSCenter for Chemical Process Safety
An AIChE Technology Alliance Chemical Hazard Engineering Fundamentals – Case Studies
June 28, 2021 Slide - 36
Case Study – LG Polymers
Inhibitor Depletion ModelSource: DiERS User Group, H Fisher (1991). A Runaway Styrene Polymerization Incident with Inhibitor Effectiveness Study. Pittsburgh, PA.
Source: DiERS User Group Singh.et.al. (Fall 2012). Determination of Self Accelerating Decomposition Temperature (SADT) of Styrene using Accelerating Rate Calorimeter. Concord, MA
CCPSCenter for Chemical Process Safety
An AIChE Technology Alliance Chemical Hazard Engineering Fundamentals – Case Studies
June 28, 2021 Slide - 37
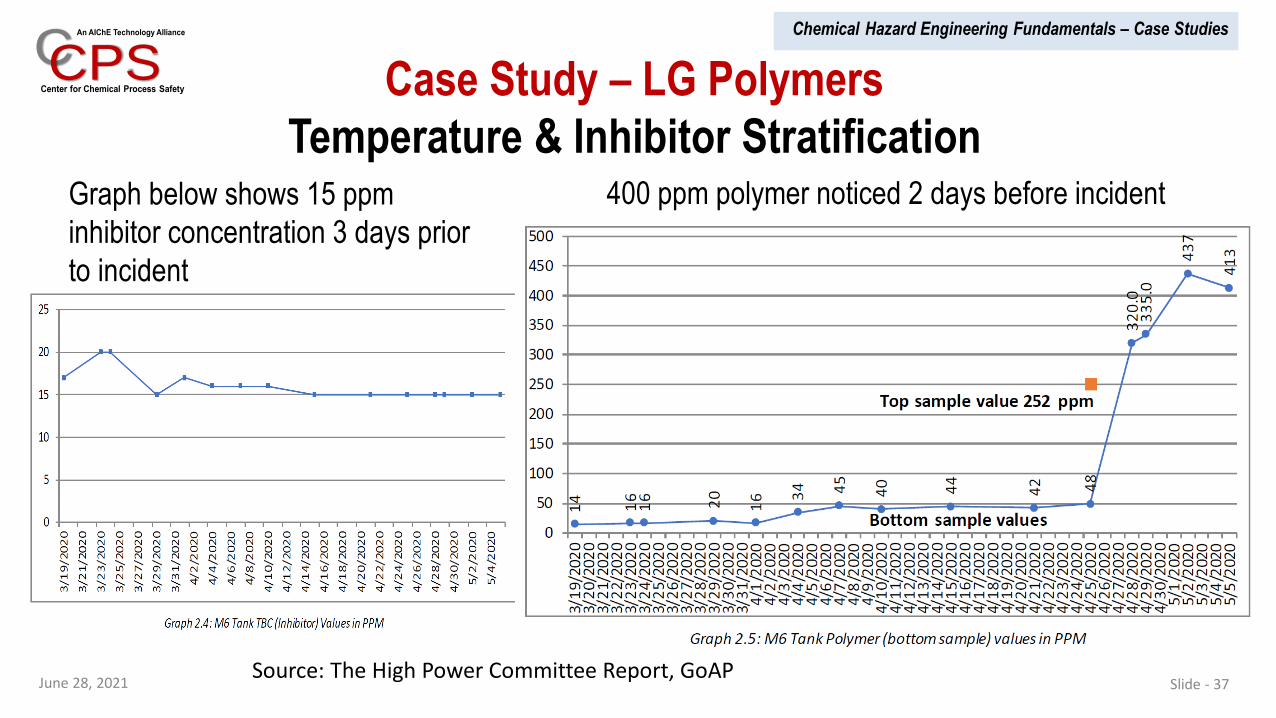
Case Study – LG Polymers
Temperature & Inhibitor Stratification
Source: The High Power Committee Report, GoAP
Graph below shows 15 ppm
inhibitor concentration 3 days prior
to incident
400 ppm polymer noticed 2 days before incident
CCPSCenter for Chemical Process Safety
An AIChE Technology Alliance Chemical Hazard Engineering Fundamentals – Case Studies
June 28, 2021 Slide - 38
Case Study – LG Polymers
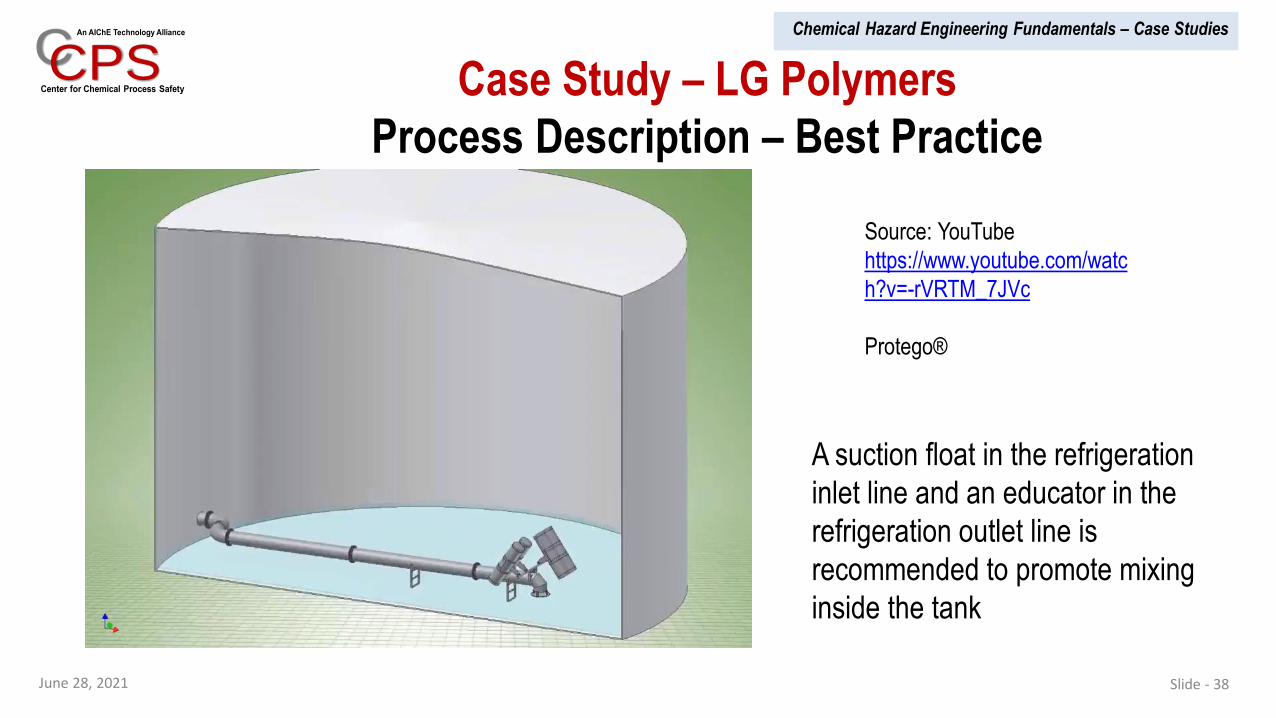
Process Description – Best Practice
Source: YouTube
https://www.youtube.com/watc
h?v=-rVRTM_7JVc
Protego®
A suction float in the refrigeration
inlet line and an educator in the
refrigeration outlet line is
recommended to promote mixing
inside the tank

CCPSCenter for Chemical Process Safety
An AIChE Technology Alliance Chemical Hazard Engineering Fundamentals – Case Studies
June 28, 2021 Slide - 39
Case Study – LG Polymers
Process Description – Best Practice
Source: The High Power
Committee Report, GoAP

CCPSCenter for Chemical Process Safety
An AIChE Technology Alliance Chemical Hazard Engineering Fundamentals – Case Studies
June 28, 2021 Slide - 40
Case Study – LG Polymers
Temperature & Inhibitor Stratification
Source: The High Power Committee Report, GoAP
Increasing Temperature
Increasing Inhibitor concentration

CCPSCenter for Chemical Process Safety
An AIChE Technology Alliance Chemical Hazard Engineering Fundamentals – Case Studies
June 28, 2021 Slide - 41
Case Study – LG PolymersEstimate of Actual Styrene Venting for Use in Incident Investigation
o In addition to thermal gradients within the tank, several actions were taken that
may have slowed the reaction rate including adding water and a high
temperature inhibitor.
o The actual vent rate was approximately 10 kg/sec for the 8-inch vent
significantly reducing the distance to potentially toxic concentration and potential
for Vapor Cloud Explosion. The vent duration was more than 20 hours.
o This incident resulted in 12 fatalities and more than 1000 people effected due to
toxic inhalation impacts.
This is an illustrative example and does not reflect a thorough or complete study.

CCPSCenter for Chemical Process Safety
An AIChE Technology Alliance Chemical Hazard Engineering Fundamentals – Case Studies
June 28, 2021 Slide - 42
Case Study – LG PolymersEstimated Maximum Capacity for Tank Vent
SOURCE MODELS INPUT INFORMATION
Required Inputs are Shaded "Yellow"
Hole Size (equation 11-1):
STEP 1 - Select Type of Release V = 23 cd d2 P0 { [ (PA/P0)
1.429- (PA/P0)
1.714] Mw / T }
1/2 based on 1.4 isentropic exponent
PA / P0 = 0.91 Note: P A = 101.3 kPa
" V = 23 ( 1 ) ( 0.21 )^2 ( 111.3 ) { ( 0.91 )^1.429 - ( 0.91 )^1.714 } ( 104.15 ) / ( 421.15 )}^1/2 =
STEP 2 - Enter Required Release Information V = 8.51 kg/sec - or - 1120 lb/min
1 hr Release = 30636 kg - or - 67399.2 lb
Release Inputs: Input Value Input Units Equation Input Equation Units
Hole Size, d 8.25 in 0.20955 m Specified Rate:
Coefficient cd (typically Square Edged Hole) 1 dimensionless V = kg/sec - or - lb/min
Heat Input Rate, q kWatt 1 hr Release = kg - or - lb
Specified Rate (at either specified Hole kg/sec Size or Release Pressure) Heat Input with Vaporization (equations 11-7 to 11-10):
Process Inputs: Input Value Input Units Equation Input Equation Units V = q / DHV = ( 0 ) / ( 351 )
Release Temperature, T 148 148 C V = kg/sec - or - lb/min
Release Pressure (gauge), P0 - PA 0.1 bar 10 kPa gauge 1 hr Release = kg - or - lb
Total Inventory (Leave Blank for 1 hour leak) kg
10 Minute Release:
STEP 3 - Enter Chemical Properties (or Select Chemical Name from Pic List) V = kg/sec - or - lb/min
Cas No. 1 hr Release = kg - or - lb
Chemical Name 100-42-5
Equipment Rupture:
(Leave Input Value Blank to accept Chemical Data Table Values) Total Release = kg - or - lb
Input Units may be changed - Input Values in "blue" will be converted to appropriate equation units
Hole Size
Rounded Nozzle
ESTIMATED VAPOR RELEASE RATE
Styrene
Clear InputsClear Inputs
Equivalent Diameter of 8 inch
vent plus 2 inch breather and
use maximum discharge
coefficient for “rounded”
nozzle of 1.
Since the tank pressure
could have been somewhat
higher than the maximum
allowable working pressure
without failure, round result
up to 10 kg/sec

CCPSCenter for Chemical Process Safety
An AIChE Technology Alliance Chemical Hazard Engineering Fundamentals – Case Studies
per Correlation Details with Concentration in ppmv
Plume or Continuous: C m = 1.5E+09 1.78 )
Puff or Instantaneous: C m = 6.5E+06 2.29 )
per Correlation Details for 1.5 m/sec F Stability with Concentration in ppmv
Plume or Continuous: C m = 6.5E+08 1.76 )
Puff or Instantaneous: C m = 1.3E+07 2.45 )
Test for Plume versus Puff Model at Dispersion Conditions: (equation 12-20)
If Q > (a*/a) u Q* Xb-b* ---> Instantaneous Model (from equating Puff and Plume correlation at X)
10 kg/sec < 0.00438 (3 m/sec) 744200 kg (425 m)^-0.51 or 436.93 kg/sec -->
Alternate weather Puff versus Plume Model
10 kg/sec < 0.020024 (1.5 m/sec) 744200 kg (425 m)^-0.69 or 348.09 kg/sec -->
Estimated Exposure Duration - Continuous Dispersion (Equations 12-21, 12-23)
t = Q* / Q for Continuous or 2 (0.2) [Q* T amb / (Mw C)]0.37
/ Wind Speed for Instantaneous
t = 744200 Kg / 10 Kg/sec = 3600.0 sec
Alternate weather Estimated Exposure Duration
t = 744200 Kg / 10 Kg/sec = 3600.0 sec
Maximum Downwind Distance to Concentration of Interest (equations 12-9, 12-13)
Continuous (equation 37): X = a [ Q / ( u Mw Cm ) ]b - X0
r air = 1.18 Kg/m3 = 143400 [ ( 10 ) / { ( 3 ) 104.15 ( 1000 ) } ]^0.56 - 8.7 = 417 m
at ambient conditions Instantaneous (equation 41): X = a* [ (Q* / ( Mw Cm ) ]
b* - X0
= 940 [ 744200 / ( 104.15 ( 1000 )) ]^0.44 - 8.7 = m
Alternate weather Maximum Downwind Distance to Concentration of Interest
Continuous (equation 10-xx): X = a [ Q ( F ) / ( u Mw Cm ) ]b - X0
= 103300 [ ( 10 ) / { ( 3 ) 104.15 ( 1000 ) } ]^0.57 - 8.3 = 416 m
Instantaneous (equation 10-xx): X = a* [ (Q* / ( Mw Cm ) ]b*
- X0
= 810 [ 744200 / ( 104.15 ( 1000 )) ]^0.41 - 8.3 = m
for 3 m/sec Wind Speed, Class D Atmospheric Stability, and Residential Surface Roughness
( Q* / Mw ) / ( X ^
SIMPLE VAPOR DISPERSION
( Q / Mw ) / ( u X ^
Continuous
( Q / Mw ) / ( u X ^
( Q* / Mw ) / ( X ^
Continuous
Maximum Concentration at Ground Elevation
Effective Release Elevation
Release Elevation
Ground Elevation
Cloud Centerline
Concentration at Specified Distance
and Elevation
Maximum Concentration at Specified Distance
Outdoor Vapor Release
Initial Dilution
Distance Correction for
Initial Dilution, DXt
Show Correlation Details
Hide Correlation Details
June 28, 2021 Slide - 43
Case Study – LG PolymersDispersion Model for Estimate of Actual Styrene Venting
Using the CHEF Calculation Aid, a distance of 416 m to 1000 ppm by volume is estimated at a
wind speed of 1.5 m/sec and residential surface roughness. (The actual wind speed is unknown.)VAPOR DISPERSION INPUT INFORMATION
Required Inputs are Shaded "Yellow"
STEP 1 - Select Location, Type of Release, Concentration and Distance of Interest
Release Location (Assumed Outdoor if Blank)
Type of Release
Use Averaging Time Correction for Flammable Release
Input Value Input Units Equation Input Equation Units
Concentration of Interest 1000 1000 ppm
Concentration of Interest for Hazard Analysis is typically 1/2 LFL, LFL, ER-2, ER-3 or LC 50
Outdoor Downwind Distance of Interest, X m
Distance of Interest is typically to the property limit, to an unrestricted work area, or to an occupied building
Note that Concentration of Interest must be entered for estimation of Instantaneous (or puff) release
STEP 2 - Enter Chemical Properties (or Select Chemical Name from Pic List)
Cas No.
Chemical Name 100-42-5
Data Table Value
Lower Flammable Limit, LFL 0.88 vol %
ERPG-3 Concentration 1000 ppm
ERPG-2 Concentration 250 ppm
Input Value Equation Input
Vapor Molecular Weight, Mw 104.15 104.15
Normal Boiling Point, TB 144.6 144.6 C
STEP 3 - Enter Process Information
Process Inputs: Input Value Input Units Equation Input Equation Units
Airborne Rate, Q 10 10 kg/sec
Vapor Temperature, T 148 148 C
Total Release Quantity, Q* (Leave Blank if Unlimited) 744200 744200 kg
Liquid or Two-Phase Release Velocity* (Flashing Liquid) m/sec
Initial Fraction Vapor*, f 0 (Flashing Liquid Only) Fraction
kPa absolute
*Note that these inputs may not significantly change results
STEP 4 - Enter Equipment and Plant Layout Information
Equipment and Plant Layout Inputs: Input Value Input Units Equation Input Equation Units
Diameter of Hole or Discharge Piping, d0 m
The hole size for vapor release estimate or diameter of relief system discharge piping. If blank, no jet mixing used.
Release Elevation, h (Blank assumed at Ground) 12 12 m
Release Direction (Assumed Horizontal if Blank)
Enclosed Process Area Volume, VBldg cu m
Enclosed Process Area Ventilation Rate Air Changes/Hr (Assumed 1 if Blank)
For reference in determining
concentration of interest
Leave Blank to accept
Chemical Data Table
Mw
Outdoor
Styrene
Vapor
Input Units may be changed - Input Values in "blue" will be converted to appropriate equation units
Blank will not correct for
flammable averaging time.
Vapor Pressure at Release Temp
(Subcooled Liquid Only)
Clear InputsClear Inputs

CCPSCenter for Chemical Process Safety
An AIChE Technology Alliance Chemical Hazard Engineering Fundamentals – Case Studies
June 28, 2021 Slide - 44
Case Study – LG PolymersEstimate of Actual Styrene Venting for Use in Incident Investigation
416 m to
1000 ppm
162 m to
5000 ppm
There is a densely
populated residential
area downwind of the
release who may have
been exposed to
concentrations in the
range of 1000 to 5000
ppm styrene for one or
more hours duration.
This concentration is in
good agreement with
ALOHA modeling in the
High Power Committee
Report.

CCPSCenter for Chemical Process Safety
An AIChE Technology Alliance Chemical Hazard Engineering Fundamentals – Case Studies
June 28, 2021 Slide - 45
Case Study – LG PolymersHazard Identification and Risk Analysis (HIRA) Study
CCPSCenter for Chemical Process Safety
An AIChE Technology Alliance Chemical Hazard Engineering Fundamentals – Case Studies
With the high population density near the facility, flash fire, toxic impacts or vapor
cloud explosion would all likely yield multiple potential fatalities. Depending on the
specific risk matrix, this would be a very-high consequence severity requiring
several protective layers.
There may be other scenarios associated with Styrene Storage Tank (m6) that
may ultimately need to be addressed through risk analysis to ensure hazard are
managed to within a reasonable tolerable frequency.
June 28, 2021 Slide - 46
Case Study – LG Polymers
Consequence Analysis / Frequency Evaluation

CCPSCenter for Chemical Process Safety
An AIChE Technology Alliance Chemical Hazard Engineering Fundamentals – Case Studies
June 28, 2021 Slide - 47
Case Study – LG PolymersSummary of Root Cause Analysis per High Power Committee Report
1. Compliance with Standards: Ineffective Design of Styrene Monomer Storage Tank by
removing suction float.
✓ Unaware of the best practices in Process Safety Information, Management of Change, and Compliance Audits. This
led to thermal stratification within the tank. Unaware of Best Practices in Styrene Monomer Storage and Handling.
2. Inability to understand Process Safety Information and Failure to rectify Standard
Operating Procedures.
✓ Switching off the refrigeration system at 5 PM (Hottest time in the day) is not best practice when polymer can auto
polymerize even at lower temperature and the inhibitor depletes as a function of temperature and time.
✓ Choosing 35 deg C as an acceptable maximum operating condition. This is ineffective Standard Operating Condition
and not recognizing the importance of auto polymerization of Styrene (PSI).
✓ Inability to understand inhibitor depletion characteristics.
✓ Inability to understand High Polymer Content as a precursor for a runaway reaction. An SOP should switch on the
refrigeration system and add TBC when upon high Polymer content. However, no action was observed for three
consecutive days.
CCPSCenter for Chemical Process Safety
An AIChE Technology Alliance Chemical Hazard Engineering Fundamentals – Case Studies
June 28, 2021 Slide - 48
3. Improper Hazard Identification
✓ No risk assessment carried out
✓ Failure to understand safeguards
4. Management of Change (Removing suction float)
✓ Did not complete a hazard identification
✓ Unaware of technical basis for change
✓ Did not modify operation procedure and conditions for the change in tank design
Case Study – LG PolymersSummary of Root Cause Analysis per High Power Committee Report
CCPSCenter for Chemical Process Safety
An AIChE Technology Alliance Chemical Hazard Engineering Fundamentals – Case Studies
June 28, 2021 Slide - 49
5. Emergency Planning and response✓ Onsite emergency plan was inadequate as they did not consider to handle toxic gas release and runaway
reaction
✓ Onsite emergency plan addressed fire and other scenarios.
✓ Inactivation of Siren to inform public. Assumed public and emergency responders were informed.
6. Low Process Safety Competency
✓ Staff at facility had little to no training in Process Safety
7. Deficient Mechanical / Asset Integrity
✓ Refrigeration system was not maintained properly. Visual inspection showed corrosion.
✓ Tank had not been cleaned internally for four years while recommended practice is cleaning every 2 years.
Case Study – LG PolymersSummary of Root Cause Analysis per High Power Committee Report
CCPSCenter for Chemical Process Safety
An AIChE Technology Alliance Chemical Hazard Engineering Fundamentals – Case Studies
June 28, 2021 Slide - 50
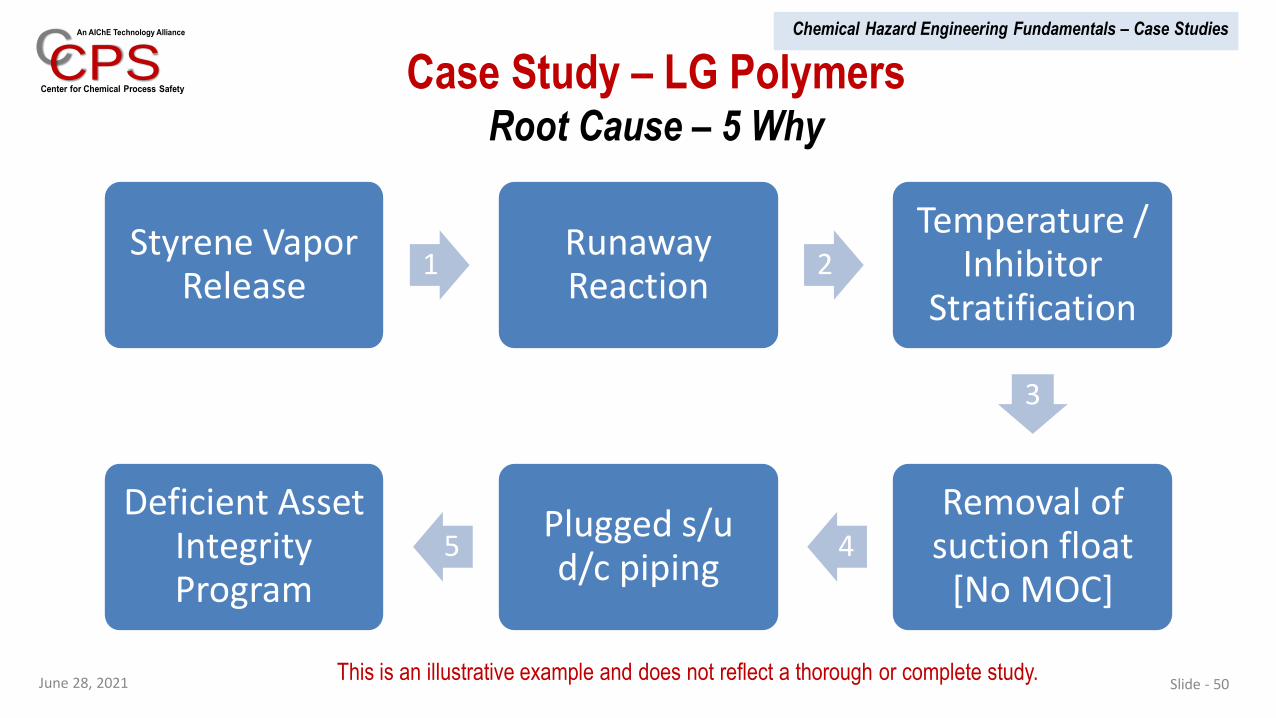
Case Study – LG PolymersRoot Cause – 5 Why
This is an illustrative example and does not reflect a thorough or complete study.
Styrene Vapor Release
1Runaway Reaction
2
Temperature / Inhibitor
Stratification
3
Removal of suction float
[No MOC]4
Plugged s/u d/c piping
5
Deficient Asset Integrity Program

CCPSCenter for Chemical Process Safety
An AIChE Technology Alliance Chemical Hazard Engineering Fundamentals – Case Studies
June 28, 2021 Slide - 51
Case Study – LG PolymersRisk Analysis versus Incident Investigation
Seldom does an actual incident match the details of an
anticipated scenario from Risk Analysis. However,
exploration of the differences between anticipated and
actual incident information may help to better understand
“how” and “why” the actual incident occurred and lead to
better Process Risk Management.

CCPSCenter for Chemical Process Safety
An AIChE Technology Alliance Chemical Hazard Engineering Fundamentals – Case Studies
Questions?
June 28, 2021 Slide - 52


![CCPS Metric Pres Customizable[1]](https://static.fdocuments.net/doc/165x107/577cc37b1a28aba711961ae1/ccps-metric-pres-customizable1.jpg)