Chemical Evidence for Migration of Deep Formation Fluids into
15
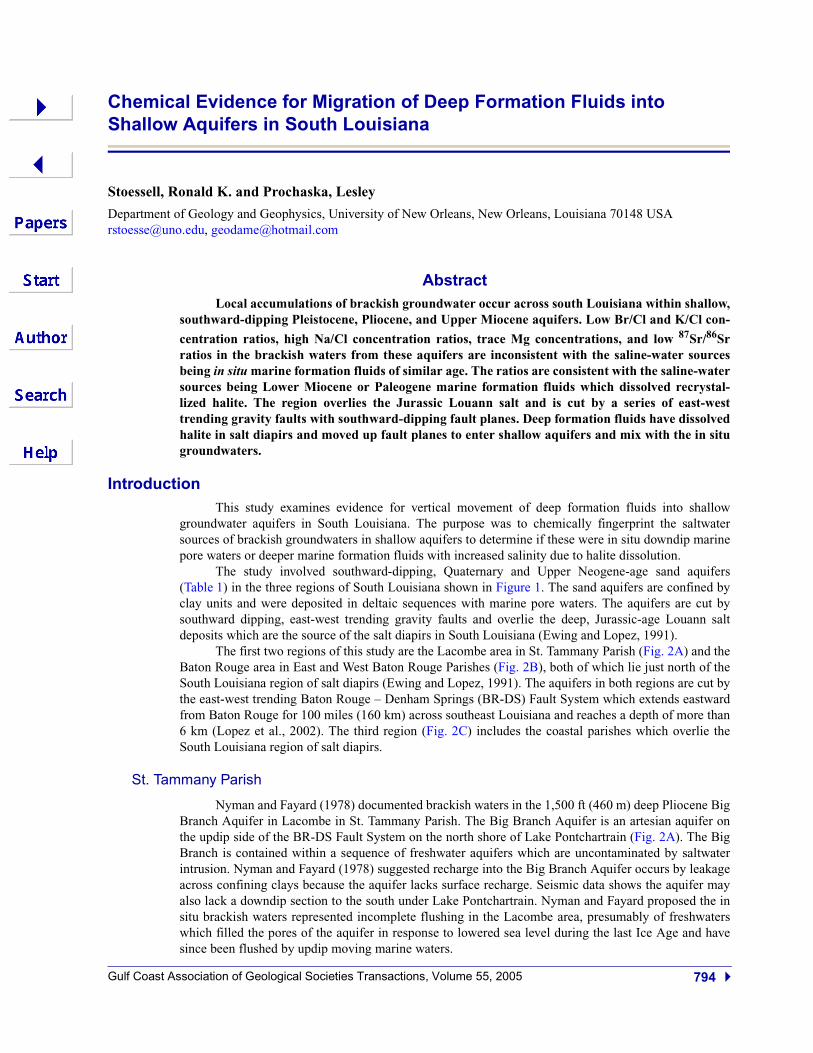
794 Gulf Coast Association of Geological Societies Transactions, Volume 55, 2005 Chemical Evidence for Migration of Deep Formation Fluids into Shallow Aquifers in South Louisiana Stoessell, Ronald K. and Prochaska, Lesley Department of Geology and Geophysics, University of New Orleans, New Orleans, Louisiana 70148 USA [email protected], [email protected] Abstract Local accumulations of brackish groundwater occur across south Louisiana within shallow, southward-dipping Pleistocene, Pliocene, and Upper Miocene aquifers. Low Br/Cl and K/Cl con- centration ratios, high Na/Cl concentration ratios, trace Mg concentrations, and low 87 Sr/ 86 Sr ratios in the brackish waters from these aquifers are inconsistent with the saline-water sources being in situ marine formation fluids of similar age. The ratios are consistent with the saline-water sources being Lower Miocene or Paleogene marine formation fluids which dissolved recrystal- lized halite. The region overlies the Jurassic Louann salt and is cut by a series of east-west trending gravity faults with southward-dipping fault planes. Deep formation fluids have dissolved halite in salt diapirs and moved up fault planes to enter shallow aquifers and mix with the in situ groundwaters. Introduction This study examines evidence for vertical movement of deep formation fluids into shallow groundwater aquifers in South Louisiana. The purpose was to chemically fingerprint the saltwater sources of brackish groundwaters in shallow aquifers to determine if these were in situ downdip marine pore waters or deeper marine formation fluids with increased salinity due to halite dissolution. The study involved southward-dipping, Quaternary and Upper Neogene-age sand aquifers (Table 1) in the three regions of South Louisiana shown in Figure 1. The sand aquifers are confined by clay units and were deposited in deltaic sequences with marine pore waters. The aquifers are cut by southward dipping, east-west trending gravity faults and overlie the deep, Jurassic-age Louann salt deposits which are the source of the salt diapirs in South Louisiana (Ewing and Lopez, 1991). The first two regions of this study are the Lacombe area in St. Tammany Parish (Fig. 2A) and the Baton Rouge area in East and West Baton Rouge Parishes (Fig. 2B), both of which lie just north of the South Louisiana region of salt diapirs (Ewing and Lopez, 1991). The aquifers in both regions are cut by the east-west trending Baton Rouge – Denham Springs (BR-DS) Fault System which extends eastward from Baton Rouge for 100 miles (160 km) across southeast Louisiana and reaches a depth of more than 6 km (Lopez et al., 2002). The third region (Fig. 2C) includes the coastal parishes which overlie the South Louisiana region of salt diapirs. St. Tammany Parish Nyman and Fayard (1978) documented brackish waters in the 1,500 ft (460 m) deep Pliocene Big Branch Aquifer in Lacombe in St. Tammany Parish. The Big Branch Aquifer is an artesian aquifer on the updip side of the BR-DS Fault System on the north shore of Lake Pontchartrain (Fig. 2A). The Big Branch is contained within a sequence of freshwater aquifers which are uncontaminated by saltwater intrusion. Nyman and Fayard (1978) suggested recharge into the Big Branch Aquifer occurs by leakage across confining clays because the aquifer lacks surface recharge. Seismic data shows the aquifer may also lack a downdip section to the south under Lake Pontchartrain. Nyman and Fayard proposed the in situ brackish waters represented incomplete flushing in the Lacombe area, presumably of freshwaters which filled the pores of the aquifer in response to lowered sea level during the last Ice Age and have since been flushed by updip moving marine waters.
Transcript of Chemical Evidence for Migration of Deep Formation Fluids into
794 Gulf Coast Association of Geological Societies Transactions, Volume 55, 2005
Chemical Evidence for Migration of Deep Formation Fluids into Shallow Aquifers in South Louisiana
Stoessell, Ronald K. and Prochaska, Lesley
Department of Geology and Geophysics, University of New Orleans, New Orleans, Louisiana 70148 USA [email protected], [email protected]
AbstractLocal accumulations of brackish groundwater occur across south Louisiana within shallow,
southward-dipping Pleistocene, Pliocene, and Upper Miocene aquifers. Low Br/Cl and K/Cl con-
centration ratios, high Na/Cl concentration ratios, trace Mg concentrations, and low 87Sr/86Srratios in the brackish waters from these aquifers are inconsistent with the saline-water sourcesbeing in situ marine formation fluids of similar age. The ratios are consistent with the saline-watersources being Lower Miocene or Paleogene marine formation fluids which dissolved recrystal-lized halite. The region overlies the Jurassic Louann salt and is cut by a series of east-westtrending gravity faults with southward-dipping fault planes. Deep formation fluids have dissolvedhalite in salt diapirs and moved up fault planes to enter shallow aquifers and mix with the in situgroundwaters.
IntroductionThis study examines evidence for vertical movement of deep formation fluids into shallow
groundwater aquifers in South Louisiana. The purpose was to chemically fingerprint the saltwatersources of brackish groundwaters in shallow aquifers to determine if these were in situ downdip marinepore waters or deeper marine formation fluids with increased salinity due to halite dissolution.
The study involved southward-dipping, Quaternary and Upper Neogene-age sand aquifers(Table 1) in the three regions of South Louisiana shown in Figure 1. The sand aquifers are confined byclay units and were deposited in deltaic sequences with marine pore waters. The aquifers are cut bysouthward dipping, east-west trending gravity faults and overlie the deep, Jurassic-age Louann saltdeposits which are the source of the salt diapirs in South Louisiana (Ewing and Lopez, 1991).
The first two regions of this study are the Lacombe area in St. Tammany Parish (Fig. 2A) and theBaton Rouge area in East and West Baton Rouge Parishes (Fig. 2B), both of which lie just north of theSouth Louisiana region of salt diapirs (Ewing and Lopez, 1991). The aquifers in both regions are cut bythe east-west trending Baton Rouge – Denham Springs (BR-DS) Fault System which extends eastwardfrom Baton Rouge for 100 miles (160 km) across southeast Louisiana and reaches a depth of more than6 km (Lopez et al., 2002). The third region (Fig. 2C) includes the coastal parishes which overlie theSouth Louisiana region of salt diapirs.
St. Tammany Parish
Nyman and Fayard (1978) documented brackish waters in the 1,500 ft (460 m) deep Pliocene BigBranch Aquifer in Lacombe in St. Tammany Parish. The Big Branch Aquifer is an artesian aquifer onthe updip side of the BR-DS Fault System on the north shore of Lake Pontchartrain (Fig. 2A). The BigBranch is contained within a sequence of freshwater aquifers which are uncontaminated by saltwaterintrusion. Nyman and Fayard (1978) suggested recharge into the Big Branch Aquifer occurs by leakageacross confining clays because the aquifer lacks surface recharge. Seismic data shows the aquifer mayalso lack a downdip section to the south under Lake Pontchartrain. Nyman and Fayard proposed the insitu brackish waters represented incomplete flushing in the Lacombe area, presumably of freshwaterswhich filled the pores of the aquifer in response to lowered sea level during the last Ice Age and havesince been flushed by updip moving marine waters.
Stoessell and Prochaska
795
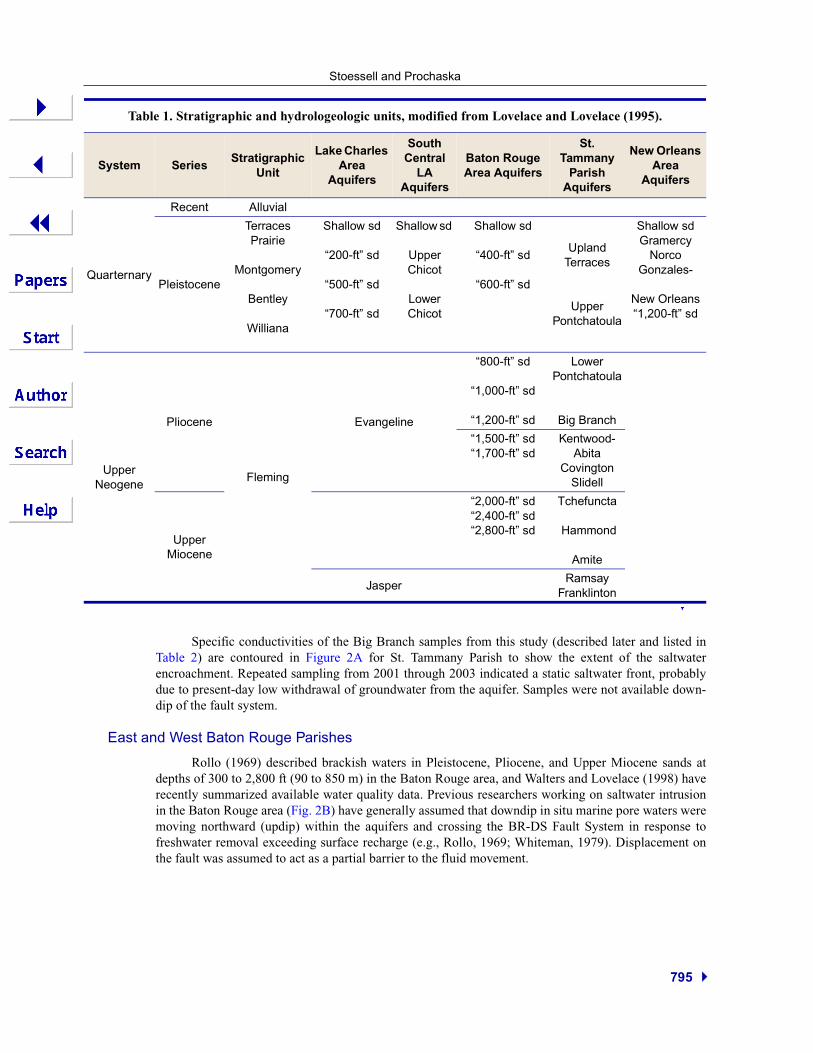
Specific conductivities of the Big Branch samples from this study (described later and listed inTable 2) are contoured in Figure 2A for St. Tammany Parish to show the extent of the saltwaterencroachment. Repeated sampling from 2001 through 2003 indicated a static saltwater front, probablydue to present-day low withdrawal of groundwater from the aquifer. Samples were not available down-dip of the fault system.
East and West Baton Rouge Parishes
Rollo (1969) described brackish waters in Pleistocene, Pliocene, and Upper Miocene sands atdepths of 300 to 2,800 ft (90 to 850 m) in the Baton Rouge area, and Walters and Lovelace (1998) haverecently summarized available water quality data. Previous researchers working on saltwater intrusionin the Baton Rouge area (Fig. 2B) have generally assumed that downdip in situ marine pore waters weremoving northward (updip) within the aquifers and crossing the BR-DS Fault System in response tofreshwater removal exceeding surface recharge (e.g., Rollo, 1969; Whiteman, 1979). Displacement onthe fault was assumed to act as a partial barrier to the fluid movement.
Table 1. Stratigraphic and hydrologeologic units, modified from Lovelace and Lovelace (1995).
System SeriesStratigraphic
Unit
Lake Charles Area
Aquifers
South Central
LA Aquifers
Baton Rouge Area Aquifers
St. Tammany
Parish Aquifers
New Orleans Area
Aquifers
Quarternary
Recent Alluvial
Pleistocene
Terraces Prairie
Montgomery
Bentley
Williana
Shallow sd
“200-ft” sd
“500-ft” sd
“700-ft” sd
Shallow sd
Upper Chicot
Lower Chicot
Shallow sd
“400-ft” sd
“600-ft” sd
Upland Terraces
Upper Pontchatoula
Shallow sd Gramercy
Norco Gonzales-
New Orleans “1,200-ft” sd
Upper Neogene
Pliocene
Fleming
Evangeline
“800-ft” sd
“1,000-ft” sd
“1,200-ft” sd
Lower Pontchatoula
Big Branch
“1,500-ft” sd “1,700-ft” sd
Kentwood-Abita
CovingtonSlidell
Upper Miocene
“2,000-ft” sd “2,400-ft” sd “2,800-ft” sd
Tchefuncta
Hammond
Amite
JasperRamsay
Franklinton
Chemical Evidence for Migration of Deep Formation Fluids into Shallow Aquifers in South Louisiana
796
Figure 1. The South Louisiana study region included 3 saline groundwater areas: the Big Branch PlioceneAquifer in St. Tammany Parish (hatched area); the Pleistocene, Pliocene, and Upper Miocene sands in Eastand West Baton Rouge Parishes (cross-hatched area); and the Pleistocene sands in 13 coastal parishes (shadedareas).
Figure 2A. Well locations and specific con-ductivities (Table 2) in the Big BranchAquifer in the Lacombe area at depths of1,400-1500 ft (425-460 m). Faults are anextension of the BR-DS Fault System inFigure 2B.
Stoessell and Prochaska
797
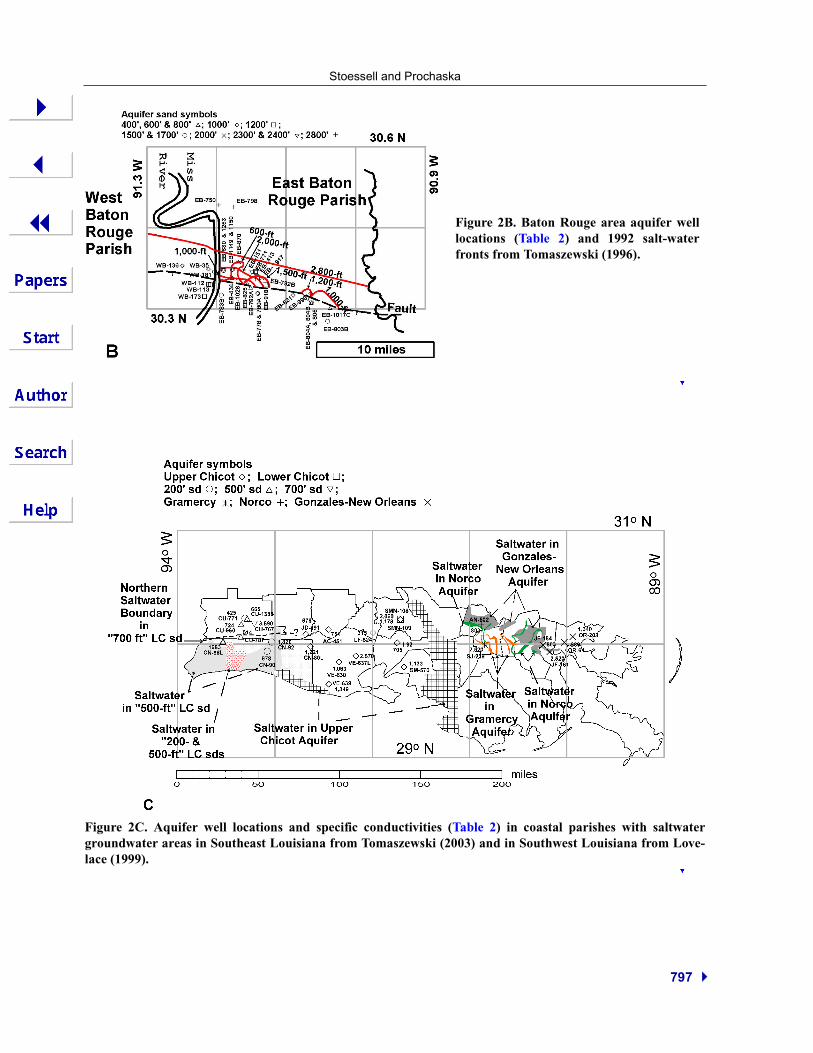
Figure 2C. Aquifer well locations and specific conductivities (Table 2) in coastal parishes with saltwatergroundwater areas in Southeast Louisiana from Tomaszewski (2003) and in Southwest Louisiana from Love-lace (1999).
Figure 2B. Baton Rouge area aquifer welllocations (Table 2) and 1992 salt-waterfronts from Tomaszewski (1996).

Chemical Evidence for Migration of Deep Formation Fluids into Shallow Aquifers in South Louisiana
798
Table 2. Well and groundwater information. See text for further explanation.
Well #DOTD
Aquifer & Sample Date
Latitude & Longitude Depth ftSp. C. uS/cm
Tds mg/l
87Sr/86Sr
LP Lake Pont., 9/01 N30.34980 W90.06300 1 4,030 2,028 n.m.
BL B. Lacombe, 9/01 N30.31000 W90.93139 1 540 222 n.m.
St Tammany Parish – Big Branch
ST-157 Big Branch, 9/01 N30.30972 W89.93111 1,503 5,830 3,165 0.708334
ST-181 Big Branch, 2/02 N30.33611 W90.00222 1,509 553 419 n.m.
ST-359 Big Branch, 11/01 N30.39333 W89.89583 1,253 552 514 n.m.
ST-572 Big Branch, 11/01 N30.33889 W90.00000 1,501 539 402 n.m.
ST-739 Big Branch, 11/01 N30.34194 W89.82333 1,576 388 410 n.m.
ST6244Z Big Branch, 11/01 N30.40361 W90.06417 1,460 278 283 n.m.
ST-R1 Big Branch?, 7/03 N30.31444 W89.92361 ? 3,690 2,186 0.708328
ST-R2 Big Branch, 10/01 N30.32155 W89.90348 1,500 3,350 1,990 0.708269
ST-R3 Big Branch? 11/01 N30.33194 W89.99111 ? 659 484 n.m.
ST-R4 Big Branch? 10/01 N30.33862 W90.01442 ? 641 461 n.m.
Baton Rouge Area Aquifers
EB-825 BR 400’sd, 11/03 N30.43139 W91.15556 475 275 290 n.m.
EB1017C BR 400’sd, 12/03 N30.40167 W91.03667 567 308 300 n.m.
EB-434 BR 600’sd, 11-03 N30.43861 W91.17778 611 441 356 n.m.
EB-870 BR 600’sd, 11-03 N30.45806 W91.16833 692 288 288 n.m.
EB-782A BR 1000’sd, 1/03 N30.42693 W91.15111 1,189 1,800 1,076 0.707881
EB-805 BR 1000’sd, 11/03 N30.40778 W91.06389 1,072 24,900 14,555 0.708339
WB-35 BR 1200’sd, 12/03 N30.44917 W91.21167 1,290 305 303 n.m.
WB-136 BR 1200’sd, 12/03 N30.45333 W91.24917 1,305 279 286 n.m.
EB-621 BR 1200’sd, 12/03 N30.41667 W91.09028 1,487 545 428 n.m.
EB-780A BR 1200’sd, 11/03 N30.41917 W91.14083 1,622 3,260 1,749 0.708226
EB-990 BR 1200’sd, 12/03 N30.41917 W91.06472 1,450 317 298 n.m.
WB-112 BR 1500’sd, 12/03 N30.43056 W91.21139 2,205 627 508 n.m.
WB-113 BR 1500’sd, 12/03 N30.42972 W91.20889 2,242 1,135 815 0.708342
WB-173 BR 1500’sd, 12/03 N30.41556 W91.21722 2,194 412 354 n.m.
EB-413 BR 1500’sd, 11/03 N30.44500 W91.14222 1,745 327 328 n.m.
EB-771 BR 1500’sd, 11/03 N30.44611 W91.14389 1,739 315 323 n.m.
EB-917 BR 1500’sd, 11/03 N30.43722 W91.14167 1,736 439 352 n.m.
EB-918 BR 1500’sd, 12/03 N30.42972 W91.12889 1,834 2,740 1,539 0.708372.
WB-181 BR 1700’sd, 12/03 N30.44556 W91.20333 1,900 292 281 n.m.
EB-804A BR 1700’sd, 1/03 N30.40778 W91.06389 1,950 375 346 n.m.
EB-630 BR 2000’sd, 11/03 N30.44750 W91.19000 2,253 643 509 n.m.
EB-778 BR 2000’sd, 12/03 N30.41917 W91.14083 2,586 1,012 734 0.708408
EB-783B BR 2000’sd, 12/03 N30.41722 W91.19333 2,675 3,340 2,154 0.708316
EB-792B BR 2000’sd 11/03 N30.43472 W91.13500 2,286 387 363 n.m.
EB-803B BR 2000’sd 12/03 N30.38500 W91.04056 2,565 2,270 1,405 0.708524
EB-1028 BR 2000’sd 11/03 N30.43472 W91.16917 2,238 1,156 730 0.70820
EB-1150 BR 2000’sd 11/03 N30.44806 W91.17694 2,242 833 593 n.m.
EB-1253 BR 2300’sd 11/03 N30.44778 W91.19000 2,687 408 401 n.m.
Table 2 cont. on next page
Stoessell and Prochaska
799
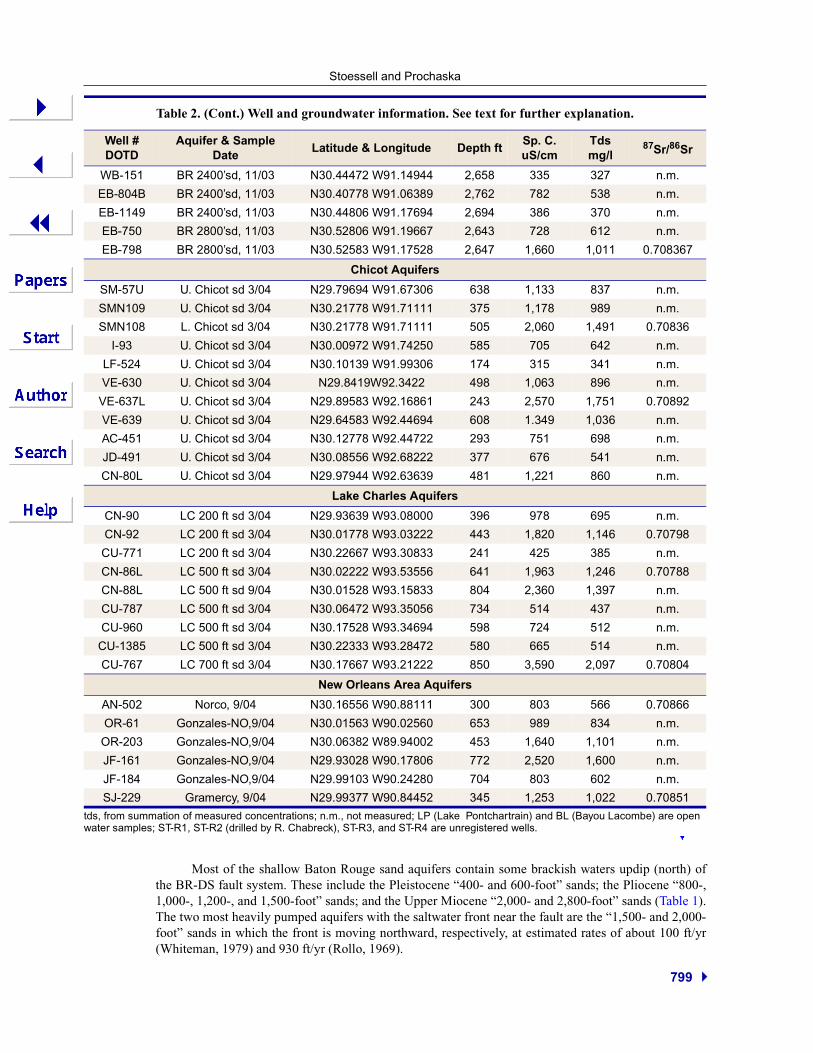
tds, from summation of measured concentrations; n.m., not measured; LP (Lake Pontchartrain) and BL (Bayou Lacombe) are open water samples; ST-R1, ST-R2 (drilled by R. Chabreck), ST-R3, and ST-R4 are unregistered wells.
Most of the shallow Baton Rouge sand aquifers contain some brackish waters updip (north) ofthe BR-DS fault system. These include the Pleistocene “400- and 600-foot” sands; the Pliocene “800-,1,000-, 1,200-, and 1,500-foot” sands; and the Upper Miocene “2,000- and 2,800-foot” sands (Table 1).The two most heavily pumped aquifers with the saltwater front near the fault are the “1,500- and 2,000-foot” sands in which the front is moving northward, respectively, at estimated rates of about 100 ft/yr(Whiteman, 1979) and 930 ft/yr (Rollo, 1969).
WB-151 BR 2400’sd, 11/03 N30.44472 W91.14944 2,658 335 327 n.m.
EB-804B BR 2400’sd, 11/03 N30.40778 W91.06389 2,762 782 538 n.m.
EB-1149 BR 2400’sd, 11/03 N30.44806 W91.17694 2,694 386 370 n.m.
EB-750 BR 2800’sd, 11/03 N30.52806 W91.19667 2,643 728 612 n.m.
EB-798 BR 2800’sd, 11/03 N30.52583 W91.17528 2,647 1,660 1,011 0.708367
Chicot Aquifers
SM-57U U. Chicot sd 3/04 N29.79694 W91.67306 638 1,133 837 n.m.
SMN109 U. Chicot sd 3/04 N30.21778 W91.71111 375 1,178 989 n.m.
SMN108 L. Chicot sd 3/04 N30.21778 W91.71111 505 2,060 1,491 0.70836
I-93 U. Chicot sd 3/04 N30.00972 W91.74250 585 705 642 n.m.
LF-524 U. Chicot sd 3/04 N30.10139 W91.99306 174 315 341 n.m.
VE-630 U. Chicot sd 3/04 N29.8419W92.3422 498 1,063 896 n.m.
VE-637L U. Chicot sd 3/04 N29.89583 W92.16861 243 2,570 1,751 0.70892
VE-639 U. Chicot sd 3/04 N29.64583 W92.44694 608 1.349 1,036 n.m.
AC-451 U. Chicot sd 3/04 N30.12778 W92.44722 293 751 698 n.m.
JD-491 U. Chicot sd 3/04 N30.08556 W92.68222 377 676 541 n.m.
CN-80L U. Chicot sd 3/04 N29.97944 W92.63639 481 1,221 860 n.m.
Lake Charles Aquifers
CN-90 LC 200 ft sd 3/04 N29.93639 W93.08000 396 978 695 n.m.
CN-92 LC 200 ft sd 3/04 N30.01778 W93.03222 443 1,820 1,146 0.70798
CU-771 LC 200 ft sd 3/04 N30.22667 W93.30833 241 425 385 n.m.
CN-86L LC 500 ft sd 3/04 N30.02222 W93.53556 641 1,963 1,246 0.70788
CN-88L LC 500 ft sd 9/04 N30.01528 W93.15833 804 2,360 1,397 n.m.
CU-787 LC 500 ft sd 3/04 N30.06472 W93.35056 734 514 437 n.m.
CU-960 LC 500 ft sd 3/04 N30.17528 W93.34694 598 724 512 n.m.
CU-1385 LC 500 ft sd 3/04 N30.22333 W93.28472 580 665 514 n.m.
CU-767 LC 700 ft sd 3/04 N30.17667 W93.21222 850 3,590 2,097 0.70804
New Orleans Area Aquifers
AN-502 Norco, 9/04 N30.16556 W90.88111 300 803 566 0.70866
OR-61 Gonzales-NO,9/04 N30.01563 W90.02560 653 989 834 n.m.
OR-203 Gonzales-NO,9/04 N30.06382 W89.94002 453 1,640 1,101 n.m.
JF-161 Gonzales-NO,9/04 N29.93028 W90.17806 772 2,520 1,600 n.m.
JF-184 Gonzales-NO,9/04 N29.99103 W90.24280 704 803 602 n.m.
SJ-229 Gramercy, 9/04 N29.99377 W90.84452 345 1,253 1,022 0.70851
Table 2. (Cont.) Well and groundwater information. See text for further explanation.
Well #DOTD
Aquifer & Sample Date
Latitude & Longitude Depth ftSp. C. uS/cm
Tds mg/l
87Sr/86Sr
Chemical Evidence for Migration of Deep Formation Fluids into Shallow Aquifers in South Louisiana
800
The saltwater fronts north (updip side) of the BR-DS Fault System sketched in the Baton Rougearea in Figure 2B are for 1992 (Tomaszewski, 1996). The Pliocene and Upper Miocene aquifers southof the fault are thought to contain primarily saltwater; however, the limited available water-quality datadoes not preclude occurrences of freshwater in these aquifers south of the fault.
Coastal parishes
Shallow Pleistocene aquifers in coastal parishes across South Louisiana (Fig. 2C) make up thethird region of this study. These aquifers are part of the regional Chicot Aquifer System in southwestand south-central Louisiana and the New Orleans Aquifer System in southeast Louisiana (Table 1).Areas of saltwater intrusion shown in Figure 2C are from Nyman (1984) and Lovelace (1999) in south-west and south-central Louisiana, and from Tomaszewski (2003) in the New Orleans area of southeastLouisiana. The entire region is cut by numerous east-west trending gravity faults and includes numeroussalt diapirs (Ewing and Lopez, 1991).
Brackish waters occur in the “200- 500- and 700-foot” Lake Charles sands in southwest Louisi-ana, the Upper and Lower Chicot sands in south-central Louisiana, and in the Gramercy, Norco, and theGonzales-New Orleans Aquifers in southeast Louisiana. From west to east, the “200-foot” and “700-foot” sands grade into the Upper and Lower Chicot sands, respectively, and the “500-ft” sand pinchesout, just east of the Calcasieu Parish Boundary. Continuity of these Pleistocene sands with those in theNew Orleans Aquifer System further east is unknown.
Nyman (1984) attributed the in situ brackish waters in the Chicot Aquifer System to a combina-tion of updip movement of marine pore waters within an aquifer, vertical leakage from underlyingaquifers containing saltwater, e.g., from the “700-foot” Lake Charles sand into the “500-foot” LakeCharles sand, and saltwater coning from the base of an aquifer. These processes are driven by the dis-charge of freshwater in wells at a rate faster than surface aquifer recharge of the freshwater. Thesaltwater front in the most heavily pumped aquifer in southwest Louisiana, the “500-foot” sand, may beslowly moving northward from the border of Calcasieu and Cameron Parishes (Lovelace, 1999).
Unlike the Baton Rouge and Lacombe areas, the saltwater encroachments in the New Orleansarea and in the southwest and south-central coastal parishes are not associated with one specific regionalfault system. In Figure 2C, the brackish specific conductivities in several of the well samples from thisstudy (described later and listed in Table 2) north of the saltwater aquifer fronts, indicate further updipmovement of the fronts is occurring, e.g., CN-92 in the “200-ft” sand; CN-86L in the “500-foot” sand,CU- 767 in the “700-foot” sand, VE-637L in the Upper Chicot Sand; SMN-108 in the Lower ChicotSand, and OR-203 in the Gonzales Aquifer.
Methods
Well locations
Sample well locations in the vicinities of Lacombe, Baton Rouge, and in the coastal Pleistoceneaquifers across South Louisiana are shown, respectively, in Figs. 2A, 2B, and 2C. The longitude and lat-itude of each well location, together with the available LA DOTD well registration number at http://www.dotd.la.us/intermodal/wells/select_wells.asp are listed in Table 2. Samples from the mouth ofBayou Lacombe and Lake Pontchartrain area also listed in Table 2.
Ten artesian Big Branch wells in St. Tammany Parish (Fig. 2A) were sampled in 2001 through2003. Four of these wells were unregistered and were identified by completion depth by RichardChabreck, a Lacombe water-well driller. Samples from these wells are listed in Table 2 with well num-bers ST-RC1 through ST-RC4. The 33 USGS monitor wells in East and West Baton Rouge Parishes(Fig. 2B, Table 2) and the 27 USGS monitor wells in the coastal Pleistocene aquifers (Fig. 2C, Table 2)were sampled, respectively, in 2003 and in 2004, during USGS sampling trips with Frank Glass.
Stoessell and Prochaska
801
Field and laboratory procedures
The well-sampling procedure on non-artesian wells used either a permanently-mounted turbine
pump or injection of compressed air through tubing below the water level to force the water to the surface.
A minimum of two well-bore volumes was allowed to flow before taking samples. A Hydrolab Quanta G
probe was used to measure specific conductivity, Eh, temperature, dissolved oxygen, and pH in artesian
and pump wells and to measure specific conductivity in air-lift wells. Some of the samples had traces of
H2S, and field iodometric titrations with thiosulfate indicated concentrations less than one mg/l.
Water samples were taken in 250 ml acid-washed bottles in the field and gravity-filtered through
#42 micron Whatman filters in the laboratory. Alkalinity was measured on each filtered sample using a
standard acid titration to a pH of 4.5. The remaining filtered sample was split into two 60 ml aliquots
(one acidified) and refrigerated. The filtration, measurement of alkalinity, and acidification of field sam-
ples were generally completed within 8 hours of field collection.
Measurements of aqueous component concentrations were completed within six weeks of collec-
tion using Dionix 100 and Dionix 1000 ion chromatographs (IC) for cations (acidified aliquot) and
anions (non-acidified aliquot). Aqueous silicon concentrations were measured colorimetrically by the
molybdenum blue method on a Turner 690 UV-VIS spectrograph. Isotopic ratios of 87Sr/86Sr in 20
brackish-water samples were measured in filtered samples using a Finnigan MAT 262 mass spectrome-
ter within nine months of collection. Analytical precisions were 1 mg l-1 HCO3 for alkalinities, 0.05
mg l-1 for cations, other anions, and aqueous SiO2, and 0.00001 for 87Sr/86Sr ratios. Analytical results
are reported in Tables 2 and 3, and additional data such as pH, aqueous O2, N, and P concentrations are
available from the senior author by request.
Procedures to identify and place age restrictions on the saltwater sources
The components commonly used as chemical fingerprints of saltwater sources are Br, Cl, Na, and
K, e.g., see Carpenter (1978), Land and Prezbindowski (1981), Stoessell and Moore (1983), and Stoes-
sell (1997). Linear mixing trends are determined by plotting the concentrations of one conserved
component versus a second conserved component, e.g., Br versus Cl, and by plotting the concentration
ratio of the two conserved components versus the reciprocal of the concentration of the component in
the denominator, e.g., Br/Cl versus Cl-1. The first plot focuses on the more saline samples, and the sec-
ond plot expands the dilute region to show how well the dilute samples fit a linear mixing relationship.
The intercept on the second plot accurately delineates the slope of a trend line on the first plot, useful
because of scatter in the mixing line. The intercept is usually close to the value of the ratio in the saltwa-
ter end member because its salt composition dominates the mixture.
Aqueous 87Sr/86Sr ratios can help set minimum age limits for marine Cenozoic formation fluids
which have acted as saltwater end members. Since Late Eocene, the isotopic ratio has steadily increased
in seawater due to decay of 87Rb to 87Sr and its subsequent input into the oceans through weathering
reactions (Faure, 1998), making this a convenient fluid dating tool. However, if the marine formation
fluid subsequently moves upward through other formations, the isotopic ratio may be elevated by mix-
ing with a younger marine fluid and/or by picking up additional 87Sr generated from 87Rb decay in
clays and feldspar, producing an apparent younger age. If Sr is conserved, plotting the 87Sr/86Sr ratios
against the reciprocal of the total Sr concentrations produces a linear mixing line in which the intercept
is an estimate of the Sr isotope ratio in the saltwater end member. Generally, the mixing line is expected
to have a positive slope because younger pore waters are expected to have higher isotope ratios.
Chemical Evidence for Migration of Deep Formation Fluids into Shallow Aquifers in South Louisiana
802
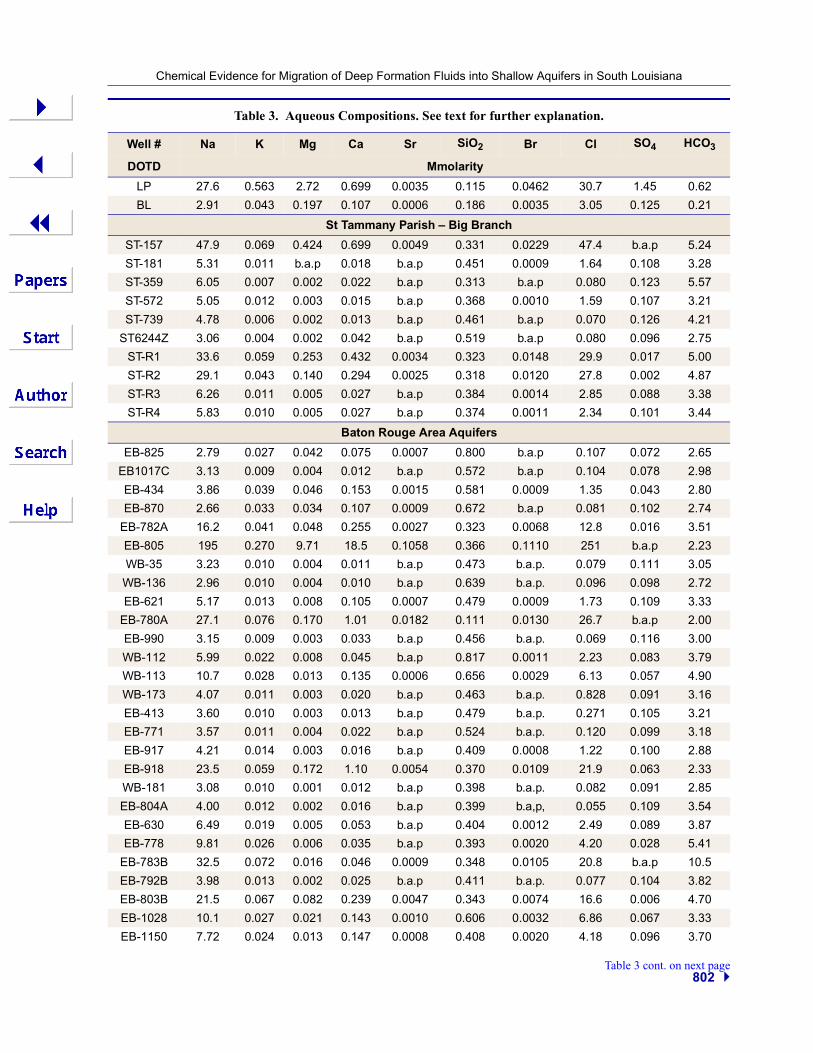
Table 3. Aqueous Compositions. See text for further explanation.
Well # Na K Mg Ca Sr SiO2 Br Cl SO4 HCO3
DOTD Mmolarity
LP 27.6 0.563 2.72 0.699 0.0035 0.115 0.0462 30.7 1.45 0.62
BL 2.91 0.043 0.197 0.107 0.0006 0.186 0.0035 3.05 0.125 0.21
St Tammany Parish – Big Branch
ST-157 47.9 0.069 0.424 0.699 0.0049 0.331 0.0229 47.4 b.a.p 5.24
ST-181 5.31 0.011 b.a.p 0.018 b.a.p 0.451 0.0009 1.64 0.108 3.28
ST-359 6.05 0.007 0.002 0.022 b.a.p 0.313 b.a.p 0.080 0.123 5.57
ST-572 5.05 0.012 0.003 0.015 b.a.p 0.368 0.0010 1.59 0.107 3.21
ST-739 4.78 0.006 0.002 0.013 b.a.p 0.461 b.a.p 0.070 0.126 4.21
ST6244Z 3.06 0.004 0.002 0.042 b.a.p 0.519 b.a.p 0.080 0.096 2.75
ST-R1 33.6 0.059 0.253 0.432 0.0034 0.323 0.0148 29.9 0.017 5.00
ST-R2 29.1 0.043 0.140 0.294 0.0025 0.318 0.0120 27.8 0.002 4.87
ST-R3 6.26 0.011 0.005 0.027 b.a.p 0.384 0.0014 2.85 0.088 3.38
ST-R4 5.83 0.010 0.005 0.027 b.a.p 0.374 0.0011 2.34 0.101 3.44
Baton Rouge Area Aquifers
EB-825 2.79 0.027 0.042 0.075 0.0007 0.800 b.a.p 0.107 0.072 2.65
EB1017C 3.13 0.009 0.004 0.012 b.a.p 0.572 b.a.p 0.104 0.078 2.98
EB-434 3.86 0.039 0.046 0.153 0.0015 0.581 0.0009 1.35 0.043 2.80
EB-870 2.66 0.033 0.034 0.107 0.0009 0.672 b.a.p 0.081 0.102 2.74
EB-782A 16.2 0.041 0.048 0.255 0.0027 0.323 0.0068 12.8 0.016 3.51
EB-805 195 0.270 9.71 18.5 0.1058 0.366 0.1110 251 b.a.p 2.23
WB-35 3.23 0.010 0.004 0.011 b.a.p 0.473 b.a.p. 0.079 0.111 3.05
WB-136 2.96 0.010 0.004 0.010 b.a.p 0.639 b.a.p. 0.096 0.098 2.72
EB-621 5.17 0.013 0.008 0.105 0.0007 0.479 0.0009 1.73 0.109 3.33
EB-780A 27.1 0.076 0.170 1.01 0.0182 0.111 0.0130 26.7 b.a.p 2.00
EB-990 3.15 0.009 0.003 0.033 b.a.p 0.456 b.a.p. 0.069 0.116 3.00
WB-112 5.99 0.022 0.008 0.045 b.a.p 0.817 0.0011 2.23 0.083 3.79
WB-113 10.7 0.028 0.013 0.135 0.0006 0.656 0.0029 6.13 0.057 4.90
WB-173 4.07 0.011 0.003 0.020 b.a.p 0.463 b.a.p. 0.828 0.091 3.16
EB-413 3.60 0.010 0.003 0.013 b.a.p 0.479 b.a.p. 0.271 0.105 3.21
EB-771 3.57 0.011 0.004 0.022 b.a.p 0.524 b.a.p. 0.120 0.099 3.18
EB-917 4.21 0.014 0.003 0.016 b.a.p 0.409 0.0008 1.22 0.100 2.88
EB-918 23.5 0.059 0.172 1.10 0.0054 0.370 0.0109 21.9 0.063 2.33
WB-181 3.08 0.010 0.001 0.012 b.a.p 0.398 b.a.p. 0.082 0.091 2.85
EB-804A 4.00 0.012 0.002 0.016 b.a.p 0.399 b.a,p, 0.055 0.109 3.54
EB-630 6.49 0.019 0.005 0.053 b.a.p 0.404 0.0012 2.49 0.089 3.87
EB-778 9.81 0.026 0.006 0.035 b.a.p 0.393 0.0020 4.20 0.028 5.41
EB-783B 32.5 0.072 0.016 0.046 0.0009 0.348 0.0105 20.8 b.a.p 10.5
EB-792B 3.98 0.013 0.002 0.025 b.a.p 0.411 b.a.p. 0.077 0.104 3.82
EB-803B 21.5 0.067 0.082 0.239 0.0047 0.343 0.0074 16.6 0.006 4.70
EB-1028 10.1 0.027 0.021 0.143 0.0010 0.606 0.0032 6.86 0.067 3.33
EB-1150 7.72 0.024 0.013 0.147 0.0008 0.408 0.0020 4.18 0.096 3.70
Table 3 cont. on next page
Stoessell and Prochaska
803
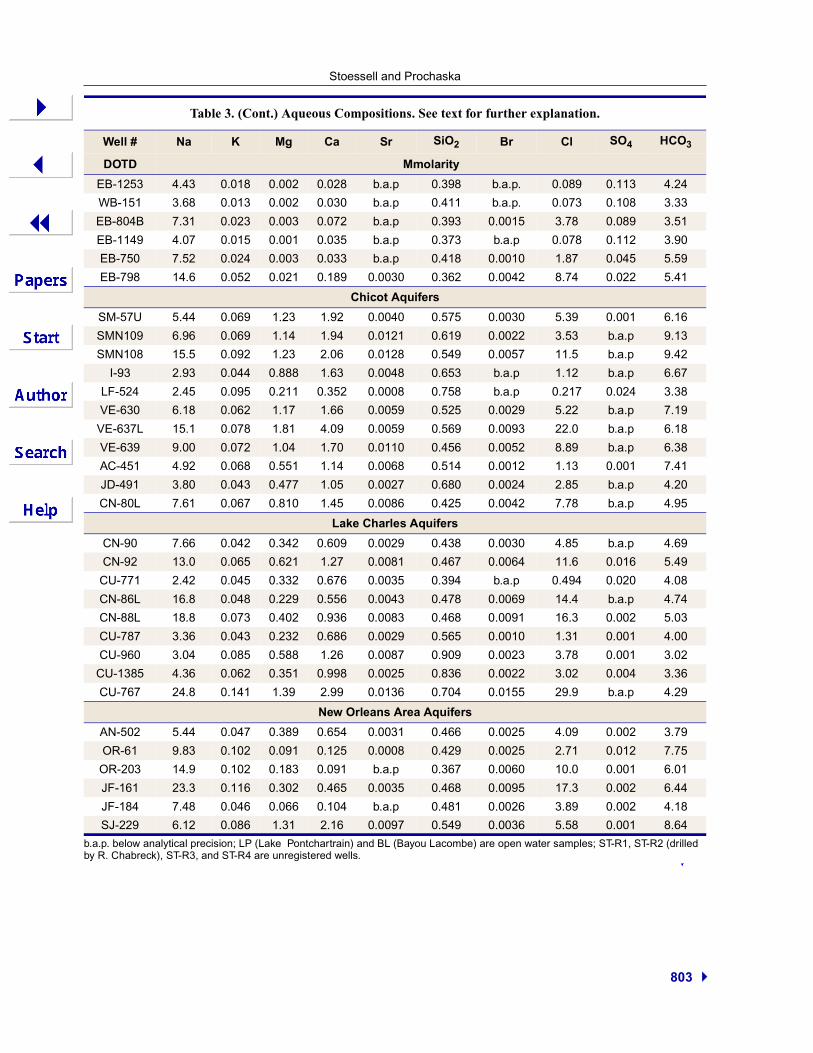
b.a.p. below analytical precision; LP (Lake Pontchartrain) and BL (Bayou Lacombe) are open water samples; ST-R1, ST-R2 (drilled by R. Chabreck), ST-R3, and ST-R4 are unregistered wells.
EB-1253 4.43 0.018 0.002 0.028 b.a.p 0.398 b.a.p. 0.089 0.113 4.24
WB-151 3.68 0.013 0.002 0.030 b.a.p 0.411 b.a.p. 0.073 0.108 3.33
EB-804B 7.31 0.023 0.003 0.072 b.a.p 0.393 0.0015 3.78 0.089 3.51
EB-1149 4.07 0.015 0.001 0.035 b.a.p 0.373 b.a.p 0.078 0.112 3.90
EB-750 7.52 0.024 0.003 0.033 b.a.p 0.418 0.0010 1.87 0.045 5.59
EB-798 14.6 0.052 0.021 0.189 0.0030 0.362 0.0042 8.74 0.022 5.41
Chicot Aquifers
SM-57U 5.44 0.069 1.23 1.92 0.0040 0.575 0.0030 5.39 0.001 6.16
SMN109 6.96 0.069 1.14 1.94 0.0121 0.619 0.0022 3.53 b.a.p 9.13
SMN108 15.5 0.092 1.23 2.06 0.0128 0.549 0.0057 11.5 b.a.p 9.42
I-93 2.93 0.044 0.888 1.63 0.0048 0.653 b.a.p 1.12 b.a.p 6.67
LF-524 2.45 0.095 0.211 0.352 0.0008 0.758 b.a.p 0.217 0.024 3.38
VE-630 6.18 0.062 1.17 1.66 0.0059 0.525 0.0029 5.22 b.a.p 7.19
VE-637L 15.1 0.078 1.81 4.09 0.0059 0.569 0.0093 22.0 b.a.p 6.18
VE-639 9.00 0.072 1.04 1.70 0.0110 0.456 0.0052 8.89 b.a.p 6.38
AC-451 4.92 0.068 0.551 1.14 0.0068 0.514 0.0012 1.13 0.001 7.41
JD-491 3.80 0.043 0.477 1.05 0.0027 0.680 0.0024 2.85 b.a.p 4.20
CN-80L 7.61 0.067 0.810 1.45 0.0086 0.425 0.0042 7.78 b.a.p 4.95
Lake Charles Aquifers
CN-90 7.66 0.042 0.342 0.609 0.0029 0.438 0.0030 4.85 b.a.p 4.69
CN-92 13.0 0.065 0.621 1.27 0.0081 0.467 0.0064 11.6 0.016 5.49
CU-771 2.42 0.045 0.332 0.676 0.0035 0.394 b.a.p 0.494 0.020 4.08
CN-86L 16.8 0.048 0.229 0.556 0.0043 0.478 0.0069 14.4 b.a.p 4.74
CN-88L 18.8 0.073 0.402 0.936 0.0083 0.468 0.0091 16.3 0.002 5.03
CU-787 3.36 0.043 0.232 0.686 0.0029 0.565 0.0010 1.31 0.001 4.00
CU-960 3.04 0.085 0.588 1.26 0.0087 0.909 0.0023 3.78 0.001 3.02
CU-1385 4.36 0.062 0.351 0.998 0.0025 0.836 0.0022 3.02 0.004 3.36
CU-767 24.8 0.141 1.39 2.99 0.0136 0.704 0.0155 29.9 b.a.p 4.29
New Orleans Area Aquifers
AN-502 5.44 0.047 0.389 0.654 0.0031 0.466 0.0025 4.09 0.002 3.79
OR-61 9.83 0.102 0.091 0.125 0.0008 0.429 0.0025 2.71 0.012 7.75
OR-203 14.9 0.102 0.183 0.091 b.a.p 0.367 0.0060 10.0 0.001 6.01
JF-161 23.3 0.116 0.302 0.465 0.0035 0.468 0.0095 17.3 0.002 6.44
JF-184 7.48 0.046 0.066 0.104 b.a.p 0.481 0.0026 3.89 0.002 4.18
SJ-229 6.12 0.086 1.31 2.16 0.0097 0.549 0.0036 5.58 0.001 8.64
Table 3. (Cont.) Aqueous Compositions. See text for further explanation.
Well # Na K Mg Ca Sr SiO2 Br Cl SO4 HCO3
DOTD Mmolarity
Chemical Evidence for Migration of Deep Formation Fluids into Shallow Aquifers in South Louisiana
804
Results and Discussion
Chemical fingerprints
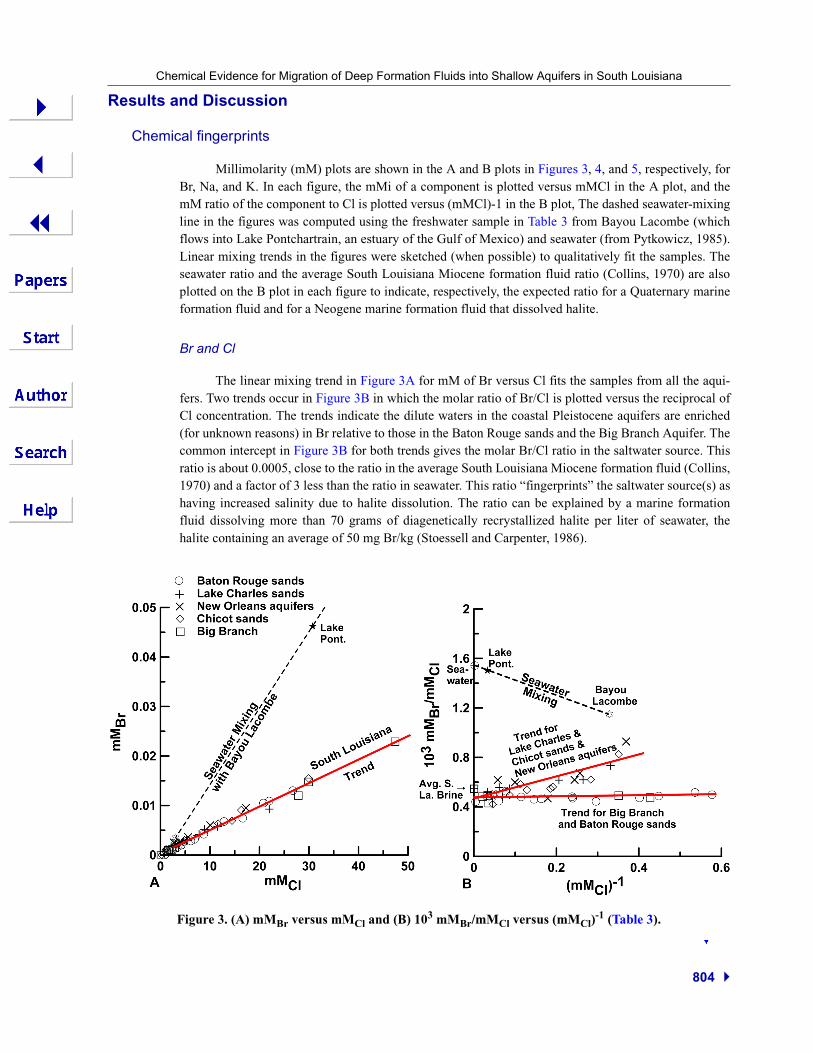
Millimolarity (mM) plots are shown in the A and B plots in Figures 3, 4, and 5, respectively, forBr, Na, and K. In each figure, the mMi of a component is plotted versus mMCl in the A plot, and themM ratio of the component to Cl is plotted versus (mMCl)-1 in the B plot, The dashed seawater-mixingline in the figures was computed using the freshwater sample in Table 3 from Bayou Lacombe (whichflows into Lake Pontchartrain, an estuary of the Gulf of Mexico) and seawater (from Pytkowicz, 1985).Linear mixing trends in the figures were sketched (when possible) to qualitatively fit the samples. Theseawater ratio and the average South Louisiana Miocene formation fluid ratio (Collins, 1970) are alsoplotted on the B plot in each figure to indicate, respectively, the expected ratio for a Quaternary marineformation fluid and for a Neogene marine formation fluid that dissolved halite.
Br and Cl
The linear mixing trend in Figure 3A for mM of Br versus Cl fits the samples from all the aqui-fers. Two trends occur in Figure 3B in which the molar ratio of Br/Cl is plotted versus the reciprocal ofCl concentration. The trends indicate the dilute waters in the coastal Pleistocene aquifers are enriched(for unknown reasons) in Br relative to those in the Baton Rouge sands and the Big Branch Aquifer. Thecommon intercept in Figure 3B for both trends gives the molar Br/Cl ratio in the saltwater source. Thisratio is about 0.0005, close to the ratio in the average South Louisiana Miocene formation fluid (Collins,1970) and a factor of 3 less than the ratio in seawater. This ratio “fingerprints” the saltwater source(s) ashaving increased salinity due to halite dissolution. The ratio can be explained by a marine formationfluid dissolving more than 70 grams of diagenetically recrystallized halite per liter of seawater, thehalite containing an average of 50 mg Br/kg (Stoessell and Carpenter, 1986).
Figure 3. (A) mMBr versus mMCl and (B) 103 mMBr/mMCl versus (mMCl)-1 (Table 3).

Stoessell and Prochaska
805
Figure 4. (A) mMNa versus mMCl and (B) mMNa/mMCl versus (mMCl)-1 (Table 3).
Figure 5. (A) mMK versus mMCl and (B) mMK/mMCl versus (mMCl)-1 (Table 3).
Chemical Evidence for Migration of Deep Formation Fluids into Shallow Aquifers in South Louisiana
806
Na and Cl
Halite dissolution will produce a molar Na/Cl ratio approaching one in the saltwater source,larger than the 0.86 ratio in seawater. The dissolution of 70 grams of halite dissolution per liter ofmarine pore fluids (mentioned above) would produce an aqueous molar Na/Cl ratio of 0.94. With theexceptions of 4 samples mentioned below, Na concentrations and molar Na/Cl ratios, respectively, plotabove above the seawater-mixing line in Figures 4A and 4B, supporting halite dissolution as the salinitysource.
The scatter in the data in Figures 4A and 4B is probably due to water-rock interactions. In fresh-waters at near-surface temperatures, Na is input from weathering feldspars and exchanged with calciumon clays (Berner, 1971). Na is commonly removed by albitization of Ca feldspar during diagenesis indeeper formations (Land and Prezbindowski, 1981). Three of the four exceptions (EB-805, VE-637L,and CU-767) are saline with high molar Ca/Na ratios, consistent with Na removal by albitization of Cafeldspar, and the fourth sample (CU-960) is predominantly freshwater in which the Na concentrationreflects near-surface weathering reactions.
K and Cl
The linear mixing trend for the saline samples in Figure 5A for mM of K plotted versus Cl fits thesamples from the Big Branch Aquifer and the Baton Rouge sands. The samples from the coastal Pleis-tocene aquifers in the figure have more scatter and higher K concentrations and do not form a linearmixing trend. The linear trend in Figure 5A splits into two trends in Figure 5B in which the molar K/Clratio is plotted against the reciprocal of Cl concentration. The trends indicate the dilute waters in theBaton Rouge sands are slightly enriched in K (for unknown reasons) relative to those in the Big BranchAquifer. The samples in Figure 5B from the coastal Pleistocene aquifers have higher molar K/Cl ratiosand have too much scatter to define a linear mixing trend. However, with increasing chlorinity, themolar K/Cl ratios of all samples converge towards a common intercept in Figure 5B ranging from0.0015 to 0.003, bracketing the ratio of 0.0029 for the average South Louisiana Miocene formation flu-ids (Collins, 1970). These ratios for the saltwater sources are more than a factor of 6 lower than inseawater. Removal of K from pore waters by illitization of smectites is a common diagenetic reaction indeeply-buried formations (Stoessell and Moore, 1983), making the ratio consistent with the saltwatersource being a deep formation fluid.
SO4 and Mg
Only minor to trace concentrations of Mg and SO4 are present in the groundwater samples inTable 3, consistent with the saltwater source being dissolution of halite by a formation fluid. However,the lack of SO4 is not diagnostic because it is removed by both biogenic SO4 reduction at near-surfacetemperatures and by thermal SO4 reduction at higher temperatures. But the low concentrations of Mgsupport the saltwater source being a deep formation fluid. Mg is expected to be removed at higherdiagenetic tempertures by dolomitization of calcium carbonate and transformation of kaolinite and other7A clays into 14A chlorite (Berner, 1971; Carpenter, 1978; Stoessell and Moore, 1983).
Age of salt-water source
87Sr/86Sr
The expected 87Sr/86Sr ratios from Faure (1998) for marine formation fluids range from 0.7089(late Miocene) to 0.7090 (Pliocene) to 0.7092 (Quaternary). The measured ratios (from Table 2) of 19out of 20 samples in this study are plotted versus the reciprocal of total strontium concentrations inFigure 6 with the one unplotted sample being off scale. The ratios are grouped by aquifer or group ofadjacent aquifers and 6 mixing trends are shown in the figure. The mixing trends have to be used withcaution since two trends involve only two samples each. Nevertheless, the intercepts provide an estimateof the expected ratios in the saltwater sources. These ratios range from 0.7080 to 0.7085, correspondingto seawater ages of Middle Oligocene to Early Miocene, consistent with the saltwater

Stoessell and Prochaska
807
sources being older formation fluids than in situ marine fluids in the Late Miocene to Pleistocene-ageaquifers. The negative slopes of some of the mixing trends are unexpected. We can only hypothesizethat earlier saltwater sources were deeper (older) formation fluids and their lower isotope ratios arereflected in the brackish groundwaters.
Summary and Conclusions
A simple chemical profile of formation fluids in deep Cenozoic Gulf Coast formations occursdue to diagenetic reactions and halite dissolution (Stoessell and Moore, 1983). These brines have lowmolar Br/Cl ratios, molar Na/Cl ratios approaching one, low molar K/Cl ratios, and are depleted in SO4and Mg concentrations. These are also the chemical profiles in this study delineated for the saltwatersources in the brackish waters in the shallow South Louisiana aquifers.
The only known halite sources are deeper salt diapirs, suggesting the saltwater sources were deepmigrating formation fluids. The 87Sr/86Sr ratios imply the minimum age of these formation fluids areEarly Miocene. These fluids dissolved halite, entered the fault systems, migrated up the fault planes andentered some of the Upper Neogene and Quaternary aquifers.
Acknowledgments
The research began with the serendipitous sampling of a brackish, artesian Big Branch well inLacombe on property owned by Judy and Bill Wilson. The field aspects of the project could not havebeen completed without the help of Richard Chabreck of Lacombe and Frank Glass and Dan Tomasze-
wski of the USGS. The 87Sr/86Sr ratios were measured at LSU in Lui-Heung Chan’s laboratory and the2 Dionix ion chromatographs were purchased with Louisiana LEQSF/8(G) grants to RKS.
ReferencesBerner, R.A., 1971, Principles of Chemical Sedimentology: New York, N.Y., McGraw Hill, 240 p.Carpenter, A.B., 1978, Origin and chemical evolution of brines in sedimentary basins, J.S. Johnson and J.R. Rus-
sell, eds. 13th Industrial Minerals Forum: Oklahoma Geological Survey Circular 79, p. 60-77.Collins, A.G., 1970, Geochemistry of some petroleum-associated waters from Louisiana: United States Department
of the Interior, Bureau of Mines, Report of Investigations 7326, 31 p.Ewing, T.E. and R.F. Lopez, 1991, Principal structural features, Gulf of Mexico Basin, A. Salvador, ed., The Gulf of
Mexico Basin: The Geological Society of America, The Geology of North America v. J, plate 2.
Faure, G., 1998, Principles and Applications of Inorganic Geochemistry: 2nd edition, Upper Saddle River, New Jer-sey, Prentice Hall, 600 p.
Figure 6. 87Sr/86Sr versus (mMSr)-1
for different aquifer groups (Tables 2and 3).
Chemical Evidence for Migration of Deep Formation Fluids into Shallow Aquifers in South Louisiana
808
Land, L.S. and D.R. Prezbindowski, 1981, The origin and evolution of saline formation water, Lower Cretaceouscarbonates, south-central Texas, U.S.A: Journal of Hydrology v. 54, p. 51-74.
Lopez, J., S. Penland, P. Connor Jr, J. Kindinger and J. Williams, 2002, Baton Rouge-Denham Springs Fault Sys-tem, Lake Pontchartrain, S. Penland, A. Beall and J. Waters, eds. Environmental Atlas of the Lake Pontchar-train Basin: Lake Pontchartrain Basin Foundation, p. 55.
Lovelace, J.K. and W.M. Lovelace, 1995, Hydrogeologic unit nomenclature and computer codes for aquifers and con-fining units in Louisiana. State of LA, Office of Public Works, Water Resources Special Report No. 9, 12 p.
Lovelace, J.K., 1999, Distribution of saltwater in the Chicot Aquifer System in the Calcasieu Parish Area, Louisi-ana, 1995-96: State of LA, Water Resources Section, Water Resources Technical Report No. 66, 61 p.
Nyman, D.J. and L.D. Fayard (1978) Groundwater resources of Tangipahoa and St. Tammany Parishes, southeast-ern Louisiana: State of LA, Office of Public Works, Water Resources Technical Report No. 15, 76 p.
Nyman, D.J., 1984 The occurrence of high concentrations of chloride in the Chicot Aquifer System of southwesternLouisiana: State of LA. Office of Public Works, Water Resources Technical Report No. 33, 75 p.
Rollo, J.R., 1969, Saltwater encroachment in aquifers of the Baton Rouge Area, Louisiana: State of LA, Office ofPublic Works, Water Resources Bulletin No. 13, 45 p.
Pyktowicz, R.M., 1983, Equilibria, Nonequilibria, and Natural Waters, Vol 1: New York, N.Y., John Wiley, 351 p.Stoessell, R.K., 1997, Delineating the chemical composition of the salinity source for saline groundwaters: An
example from east-central Concordia Parish, Louisiana: Ground Water, v. 35, p. 409-417.Stoessell, R.K. and A.B. Carpenter, 1986, Stoichiometric saturation tests of NaCl1-xBrx and KCl1-xBrx: Geochimica
et Cosmochima Acta, v. 50, p. 1465-1474.Stoessell, R.K. and C.H. Moore, 1983, Chemical constraints and origins of four Gulf Coast reservoir fluids: Ameri-
can Association of Petroleum Geologists, v. 67, p. 896-906.Tomaszewski, D.J., 1996, Distribution and movement of saltwater in aquifers in the Baton Rouge area, Louisiana,
1990-92: State of LA, Office of Public Works, Water Resources Technical Report No. 59, 44 p. Tomaszewski, D.J., 2003, Ground-water resources along the lower Mississippi River, southeastern Louisiana: State
of LA, Office of Public Works, Water Resources Technical Report No. 69, 23 p.Walters, D.J. and W.M. Lovelace, 1998, Groundwater quality for East and West Baton Rouge, East and West Felici-
ana, and Pointe Coupee Parishes, Louisiana, water years 1944-97: State of LA, Office of Public Works,Water Resources Basic Records Report No. 21, 54 p.
Whiteman, C.D. Jr., 1979, Saltwater encroachment in the “600-foot” and “1,500” foot sands of the Baton Rougearea, Louisiana, 1966-78, including a discussion of saltwater in other sands: Louisiana Department ofTransportation and Development, Office of Public Works Water Resources Technical Report No. 19, 49 p.


![Untitled-1 [] · isolation is necessary to prevent vertical migration of fluids or gases behind the casing; (4) All hydraulic fracturing fluids are directed into the zone(s) ... a](https://static.fdocuments.net/doc/165x107/5af95cf27f8b9abd588cc6af/untitled-1-is-necessary-to-prevent-vertical-migration-of-fluids-or-gases-behind.jpg)