Chemical compounds Second-quarter 2012 global chemicals mergers
20
Chemical compounds Second-quarter 2012 global chemicals mergers and acquisitions analysis www.pwc.com/us/chemicals
Transcript of Chemical compounds Second-quarter 2012 global chemicals mergers

Chemical compoundsSecond-quarter 2012 global chemicals mergers and acquisitions analysis
www.pwc.com/us/chemicals


Chemical compounds 1
Welcome to the latest edition of Chemical compounds, PwC’s analysis of mergers and acquisitions in the global chemicals industry. In this report, you’ll fi nd an overview of M&A in the sector during the second quarter of 2012, as well as potential expectations for deal activity in the near future.
PwC analysts are monitoring several trends expected to affect the values and locations of deals in the chemicals sector:
• Deal volume improved slightly during the second quarter. Deal value, however, declined, driven largely by a decrease in mega-deals. Additionally, the global economy continued to slow, particularly in the Eurozone and other advanced economies. Emerging markets, including China and India, slowed as well.
• EBITDA multiples, as measured by median transaction value to EBITDA, improved during the second quarter, driven by healthcare-related deals.
• Asia & Oceania drove local deal value and volume during the fi rst half of the year, and most of these deals were China-based.
• The outlook for the near term remains unpredictable, given the economic uncertainty exhibited during the second quarter. Europe remains a potential concern, as growth in the region’s chemicals output in 2012 may be weaker than expected due to a slowing economy and inventory trimming. On the plus side, interest rates remain low, and companies have strong balance sheets, particularly cash.
We’re pleased to present the second-quarter 2012 edition of Chemical compounds as a part of our ongoing commitment to provide a better understanding of M&A trends and prospects in the industry.
Antoine Westerman Anthony J. ScamuffaGlobal Chemical leader US Chemical leader
Antoine Westerman
Anthony J. Scamuffa

2 PwC
Perspective:Thoughts on deal activity in the second quarter of 2012
The second quarter saw some improvement in deal volume; however, deal value declined compared with the fi rst quarter. This decline in value was due primarily to a decrease in mega-deals, which fell almost two-thirds in value. Also, the outlook for the global economy has continued to slow, particularly in the advanced economies such as the Eurozone. The emerging markets are seeing slower growth as well. For example, China’s GDP growth rate declined to 7.6% in the second quarter, the slowest pace in three years.
Over the past year, liquidity has remained strong. We have seen an increase in cash balances while debt-to-equity levels have declined. Normally, this bodes well for deals because it indicates that potential acquirers are becoming better capitalized over the long term. Although deals are being negotiated, they are, on average, smaller than we have seen recently.
Despite the decrease in average deal size, EBITDA multiples, as measured by median transaction value to EBITDA, increased this quarter. Healthcare-related deals such as Koninklijke DSM/Kensey Nash and Air Liquide/LVL Medical Group helped contribute to the higher multiple. Additionally, we are seeing that, despite the current deal environment, buyers may be seeing value in their acquisitions, particularly those that allow them to achieve economies of scale, realize synergies, or gain control over downstream products.
On a regional basis, Asia & Oceania continued to drive local deal value and volume in the fi rst half, with 24 deals valued at $7.4 billion. A large proportion of these deals was China-related (16 deals). This strong showing was aided by the largest mega-deal, a local-market Chinese transaction valued at $2.8 billion, in which Yunnan Yuntianhua acquired Yunnan Yuntianhua International Chemical, making it the largest phosphorous-based fertilizer manufacturer in Asia.
Given the uncertainty in the economy this quarter, the outlook for the near term remains unpredictable. According to the European Chemical Industry Council, growth in chemicals output in 2012 will be weaker than expected, driven by a slowing economy and inventory trimming. However, there are some positives: interest rates remain low, and companies have strong balance sheets, particularly cash.
If M&A totals continue at this pace for the remainder of 2012, we could see a year-over-year decline of as much as 45% in deal value. Given this scenario, we may see the lowest annual deal value since 2009. This decline may not be surprising, given the slowing of the Chinese economy and the double-dip recession in the United Kingdom and parts of the Eurozone.

Chemical compounds 3
Commentary
Deal value declines in the wake of economic uncertainty
For the second quarter, the volume of deals increased; however, value declined, falling more than 13% compared with the fi rst quarter. This decline in value is due in part to fewer mega-deals this quarter. The two mega-deals, valued at $3.91 billion, comprised only a third of this quarter’s value. This compares with the fi rst quarter, in which six mega-deals were responsible for more than 80% of value. Despite solid liquidity positions for many producers, factors such as volatile energy prices may have created a challenging deal environment—particularly for large investors—and an uncertain economic environment—particularly in the Eurozone.
Quarterly chemicals deal activityMeasured by number and value of deals worth $50 million or more
2009 2010 2011 20123Q 4Q 1Q 2Q 3Q 4Q 1Q 2Q 3Q 4Q 1Q 2Q
Number of deals 25 29 24 31 30 33 36 30 27 29 22 32
Total deal value ($ bil) 8.6 8.5 27.4 16.3 50.8 24.8 41.2 14.6 26.2 8.0 13.5 11.8
Average deal value ($ bil) 0.3 0.3 1.1 0.5 1.7 0.8 1.1 0.5 1.0 0.3 0.6 0.4
Deal activity by number of dealsMeasured by number of deals worth $50 million or more
Deal activity by total deal valueMeasured by value of deals worth $50 million or more
0
20
40
60
80
100
120
140
2011(122 total deals)
1H12(54 total deals)
2Q12(32 total deals)
Completed or partially completed
Pending, unconditional, or intended
Withdrawn
Num
ber
of d
eals
28
6
8836
16
2
25
7
0
20
40
60
80
100
2011($90 billion
total deal value)
1H12($25.3 billion
total deal value)
2Q12($11.8 billion
total deal value)
Completed or partially completed
Pending, unconditional, or intended
Withdrawn
U$S
bill
ions
10.9
5.1
74.1
1.2
17.6
6.510.3
1.5
4 PwC
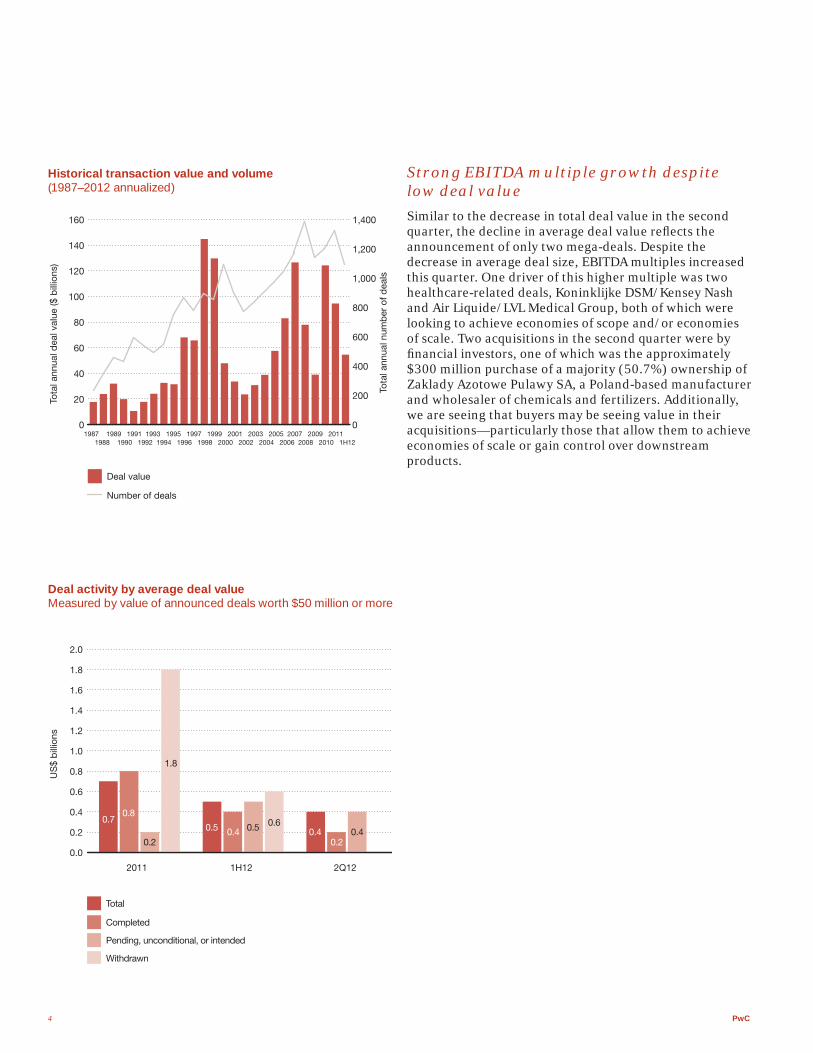
Strong EBITDA multiple growth despite low deal value
Similar to the decrease in total deal value in the second quarter, the decline in average deal value refl ects the announcement of only two mega-deals. Despite the decrease in average deal size, EBITDA multiples increased this quarter. One driver of this higher multiple was two healthcare-related deals, Koninklijke DSM/Kensey Nash and Air Liquide/LVL Medical Group, both of which were looking to achieve economies of scope and/or economies of scale. Two acquisitions in the second quarter were by fi nancial investors, one of which was the approximately $300 million purchase of a majority (50.7%) ownership of Zaklady Azotowe Pulawy SA, a Poland-based manufacturer and wholesaler of chemicals and fertilizers. Additionally, we are seeing that buyers may be seeing value in their acquisitions—particularly those that allow them to achieve economies of scale or gain control over downstream products.
Historical transaction value and volume (1987–2012 annualized)
Deal activity by average deal valueMeasured by value of announced deals worth $50 million or more
Deal value
Number of deals
0
20
40
60
80
100
120
140
160
0
200
400
600
800
1,000
1,200
1,400
Tota
l ann
ual d
eal v
alue
($ b
illio
ns)
Tota
l ann
ual n
umb
er o
f dea
ls
1987 1989 1991 1993 1995 1997 1999 2001 2003 2005 2007 2009 20111988 1990 1992 1994 1996 1998 2000 2002 2004 2006 2008 2010 1H12
Total
Completed
Pending, unconditional, or intended
0.0
0.2
0.4
0.6
0.8
1.0
1.2
1.4
1.6
1.8
2.0
2Q121H122011
US
$ b
illio
ns
Withdrawn
0.70.8
0.2
1.8
0.5 0.4 0.5 0.40.2
0.40.6

Chemical compounds 5
Deal valuation by median value/EBITDAMeasured by value/EBITDA for deals worth $50 million or more in which target EBITDA was available
Mega-deal activity sees decline
As mentioned previously, mega-deal activity declined this quarter, driving only approximately one-third of deal value. Ten of 18 mega-deals in 2011 involved a European entity, but only 1 of 8 mega deals in the fi rst half of 2012 involved a European entity. It appears that the economic downturn in that region seems to have stalled large deal activity in the subsector.
In June, Yunnan Yuntianhua Co. Ltd. announced its plan to acquire the entire share capital in Yunnan Yuntianhua International Chemical Co. Ltd., a Kunming-based manufacturer and wholesaler of chemicals, from Chinese state-owned Yuntianhua Group Co. Ltd. for $2.8 billion. After completing this and several smaller acquisitions, Yunnan Yuntianhua Co. Ltd. will be the largest phosphorous compound fertilizer producer in Asia and the second-largest producer globally.
Also in June, Cabot Corp., a Boston-based specialty chemicals maker, agreed to acquire Norit NV, a Netherlands-based manufacturer and wholesaler of purifi cation solutions, products, and systems, from Doughty Hanson & Co. Ltd. and Euroland Investments BV, for $ 1.1 billion. Norit is a global leader in activated carbon purifi cation, and the acquisition strengthens Cabot’s specialty chemicals portfolio with a non-cyclical, high-growth and high-margin business. Cabot plans to sell $600 million in debt securities to fund the acquisition.
0
3
6
9
12
2011 1H12 2Q12
9.7x
11.0x8.0x
Mega-deals
$10+ billion
$5–10 billion
$0
$10
$20
$30
$40
$50
$60
$70
$80
$90
$100
2008 2009 2010 2011 1H12
1
1
1
612 14
5
13 8
2
2
Valu
e of
dea
ls (#
in la
bel
s)
$1–5 billion

6 PwC
Mega-deals in 2011 (value of $1 billion or more)
Month announced Target name
Target nation Acquirer name
Acquirer nation Status
Value of transaction in US$ billion Category
Jul The Clorox Co United States
Icahn Enterprises LP United States
Withdrawn 9.42 Commodity Chemicals
Jan The Mosaic Co United States
Creditors United States
Completed 8.88 Fertilizers & Agricultural Chemicals
Mar Lubrizol Corp United States
Berkshire Hathaway Inc
United States
Completed 8.79 Commodity Chemicals
Jul Nalco Holding Co United States
Ecolab Inc United States
Completed 8.11 Specialty Chemicals
Jan Danisco A/S Denmark DuPont Denmark Holding ApS
Denmark Completed 7.21 Other
Apr Rhodia SA France Solvay SA Belgium Completed 4.64 Commodity Chemicals
Feb PTT Aromatics & Refi ning PCL
Thailand PTT Chemical PCL Thailand Completed 3.78 Commodity Chemicals
May International Specialty Products Inc
United States
Ashland Inc United States
Completed 3.20 Commodity Chemicals
Feb Sued Chemie AG Germany Clariant AG Switzerland Completed 2.63 Specialty Chemicals
Jan Elkem AS Norway China National Bluestar(Group) Co Ltd
China Completed 2.18 Other
Dec Taminco NV Belgium Apollo Global Management LLC
United States
Completed 1.43 Commodity Chemicals
Sep Exxaro Resources Ltd-Mineral Sands Operations
Australia Tronox Inc United States
Completed 1.33 Other
Apr Evonik Industries AG-Carbon Black Business
Germany Investor Group United States
Completed 1.30 Commodity Chemicals
Jul Arch Chemicals Inc United States
Lonza Group Ltd Switzerland Completed 1.20 Specialty Chemicals
Sep BASF Antwerpen NV-Fertilizer Production Plant
Belgium OAO "Mineral'no-khimicheskaya kompaniya YevroKhim"
Russian Fed Completed 1.13 Fertilizers & Agricultural Chemicals
Jun Vale Fertilizantes SA Brazil Mineracao Naque SA Brazil Completed 1.13 Fertilizers & Agricultural Chemicals
Feb Sued Chemie AG Germany Clariant AG Switzerland Completed 1.08 Specialty Chemicals
Jul Vacuumschmelze GmbH & Co KG
Germany OM Group Inc United States
Completed 1.01 Other

Chemical compounds 7
Mega-deals in 1H12 (value of $1 billion or more)
Month announced Target name
Target nation Acquirer name
Acquirer nation Status
Value of transaction in US$ billion Category
Jan Solutia Inc United States
Eastman Chemical Co United States
Pending 3.40 Specialty Chemicals
Jun Yunnan Yuntianhua International Chemical Co Ltd
China Yunnan Yuntianhua Co Ltd{YYTH}
China Pending 2.81 Fertilizers & Agricultural Chemicals
Mar ZOLL Medical Corp United States
Asahi Kasei Corp Japan Completed 2.20 Other
Mar Viterra Inc-Agri Products Business
Canada Agrium Inc Canada Pending 1.81 Commodity Chemicals
Mar Neo Material Technologies Inc
Canada Molycorp Inc United States
Completed 1.29 Commodity Chemicals
Feb New Energy Mining Co Ltd China Hebei Veyong Bio-chemical Co Ltd
China Pending 1.19 Other
Jan Georgia Gulf Corp United States
Westlake Chemical Corp
United States
Withdrawn 1.14 Commodity Chemicals
Jun Norit NV Netherlands Cabot Corp United States
Pending 1.10 Specialty Chemicals
Mega-deals in 2Q12 (value of $1 billion or more)
Month announced Target name
Target nation Acquirer name
Acquirer nation Status
Value of transaction in US$ billion Category
Jun Yunnan Yuntianhua International Chemical Co Ltd
China Yunnan Yuntianhua Co Ltd {YYTH}
China Pending 2.81 Fertilizers & Agricultural Chemicals
Jun Norit NV Netherlands Cabot Corp United States
Pending 1.10 Specialty Chemicals
8 PwC
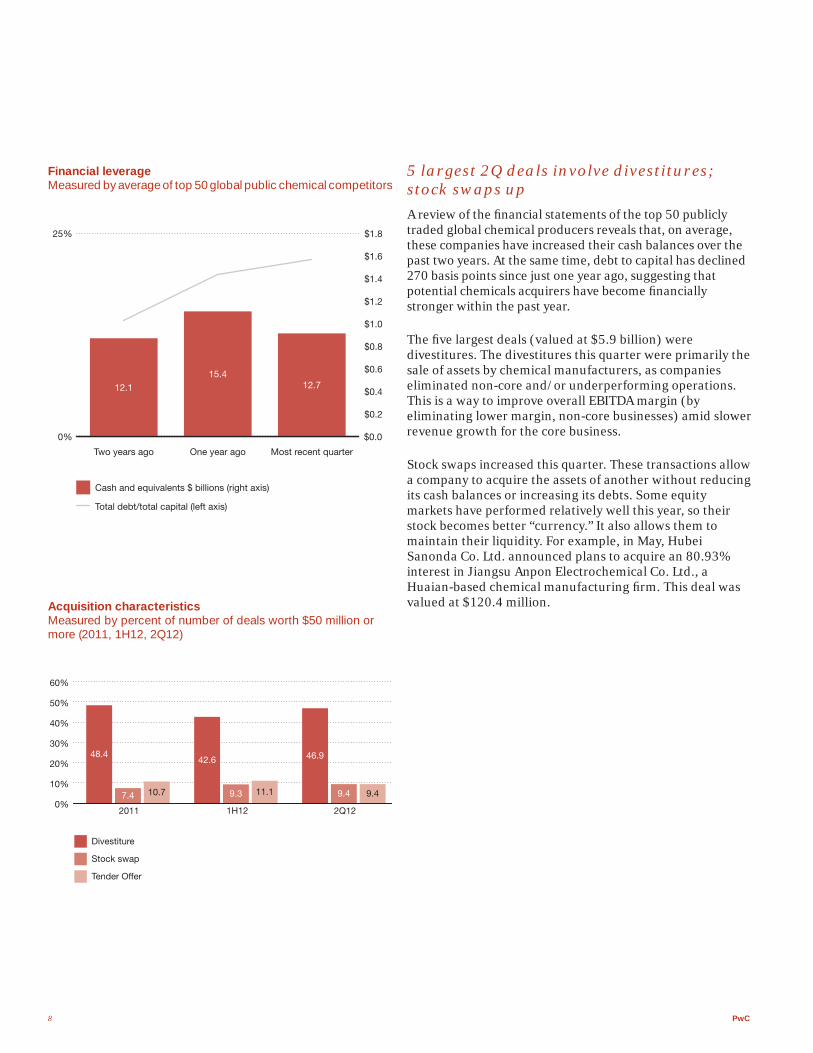
Financial leverageMeasured by average of top 50 global public chemical competitors
Acquisition characteristicsMeasured by percent of number of deals worth $50 million or more (2011, 1H12, 2Q12)
5 largest 2Q deals involve divestitures; stock swaps up
A review of the fi nancial statements of the top 50 publicly traded global chemical producers reveals that, on average, these companies have increased their cash balances over the past two years. At the same time, debt to capital has declined 270 basis points since just one year ago, suggesting that potential chemicals acquirers have become fi nancially stronger within the past year.
The fi ve largest deals (valued at $5.9 billion) were divestitures. The divestitures this quarter were primarily the sale of assets by chemical manufacturers, as companies eliminated non-core and/or underperforming operations. This is a way to improve overall EBITDA margin (by eliminating lower margin, non-core businesses) amid slower revenue growth for the core business.
Stock swaps increased this quarter. These transactions allow a company to acquire the assets of another without reducing its cash balances or increasing its debts. Some equity markets have performed relatively well this year, so their stock becomes better “currency.” It also allows them to maintain their liquidity. For example, in May, Hubei Sanonda Co. Ltd. announced plans to acquire an 80.93% interest in Jiangsu Anpon Electrochemical Co. Ltd., a Huaian-based chemical manufacturing fi rm. This deal was valued at $120.4 million.
Cash and equivalents $ billions (right axis)
Total debt/total capital (left axis)
0%
25%
Two years ago One year ago Most recent quarter
12.1
15.412.7
$0.0
$0.2
$0.4
$0.6
$0.8
$1.0
$1.2
$1.4
$1.6
$1.8
Stock swap
Divestiture
Tender Offer
0%
10%
20%
30%
40%
50%
60%
2011 1H12 2Q12
48.4
10.77.4
46.9
11.19.3
42.6
9.49.4

Chemical compounds 9
Deals by investor groupMeasured by value of deals worth $50 million or more
Recently, deals have largely been by strategic investors. These deals allow a company to enter more specialized markets and to diversify their product portfolios. There is evidence that fundraising has been relatively weak this year, which could be limiting fi nancial investors’ involvement in the deal environment. For example, there were only four deals by non-strategic investors this quarter, one of which was by a labor union.
Strategic investors
Financial investors
0%
20%
40%
60%
80%
100%
% o
f dea
l val
ue (a
bso
lute
dea
lva
lue
in d
ata
lab
els
in $
bill
ions
)
2011 1H12 2Q12
66.5
23.5
24.3
1.0 0.7
11.1

10 PwC
BRIC-affi liated transactions increase as producers in China continue to consolidate
Despite a 45% increase in deal value in the second quarter, the level of activity related to Brazil, Russia, India, and China (the BRIC countries) for deals valued greater than $50 million increased only 25%. This quarter all 10 announced BRIC deals were for China-based targets and acquirers. These deals were responsible for almost one-third of total volume for the quarter. In the Chinese government’s most recent fi ve-year plan, the focus for chemical manufacturers is increased innovation and improved manufacturing effi ciencies. By combining smaller producers, the new, larger companies may be better able to meet these goals, while extending their reach and increasing their product lines. For example, Yunnan Yuntianhua’s recent acquisitions will position it to become the largest phosphorous-based fertilizer manufacturer in Asia.
Distribution of BRIC deals by target nationMeasured by number of announced deals worth $50 million or more
Greater China deals Measured by number of announced deals worth $50 million or more
0
2,000
4,000
6,000
8,000
10,000
12,000
2011 1H12 2Q12
Greater China
Outbound
Inbound
US
$ m
illio
ns
252
44
103
63
43 88 4
5
China
India
Russia
Brazil
02468
101214161820
2011 2Q12
1415
10 9
Pending orIntended WithdrawnTotal Completed
Pending orIntended WithdrawnTotal Completed
1111
111 1

Chemical compounds 11
Regional distribution of deals by target region
Regional distribution of deals by acquirer region
Africa/Undisclosed
South America
North America
Europe ex-UK & Eurozone
UK & Eurozone
Asia & Oceania
0%
20%
40%
60%
80%
100%
2010 2011 2Q12
2.5
5.7
4.1
21.3
26.2
40.2
7.4
27.8
48.1
9.3
7.4
9.38
18.75
9.38
12.50
50
0%
20%
40%
60%
80%
100%
2010 2011 2Q12
1.6 1.9 3.14.9
4.9
24.6 22.2
18.0
45.9
5.6
16.7
5.6
48.1
6.3
15.6
6.3
21.9
46.9
Africa/Undisclosed
South America
North America
Europe ex-UK & Eurozone
UK & Eurozone
Asia & Oceania
Asia & Oceania region drives deal value and volume in second quarter
During the second quarter, targets in the Asia & Oceania region drove deal volume and value, with the UK and Eurozone responsible for a signifi cant portion of the balance. The two regions combined were responsible for almost two-thirds of deal value. This strong showing was aided by the two mega-deals, a local market Chinese transaction valued at $2.8 billion and the acquisition of Netherlands-based Norit for $1.1 billion. For acquirers, deal volume was also driven by Asia & Oceania. Activity in North America was also strong, driven by Cabot’s $1.1 billion acquisition.
Half of the acquisitions were from emerging economies this quarter, the same as in the fi rst quarter, which is up from 2011. Chinese targets played a major part in activity for emerging economies. The majority of this activity involved local market deals, particularly in China, where Chinese companies sought controlling interests in local operations. However, China’s GDP slowed to a three-year low of 7.6% last quarter, raising concerns that the economy may continue to decelerate. India is also showing signs of a slowdown, with Asia’s third-biggest economy expected to grow only 6.5% this year, compared with a previous estimate of 7%, according to the Asian Development Bank. While the Asia & Oceania region could continue to be a driver of overall deal activity, it may be at a slower pace, as the economies of China and other countries cool.

12 PwC
North America drives local deal value
North America drove local deal value in the fi rst half of 2012, as chemical companies continued to seek growth and other synergies through consolidation. However, Asia & Oceania drove local deal volume; potentially due to the smaller, more fragmented market in this region. A signifi cant portion of the deals was by fertilizer and agricultural acquirers; however, commodity chemicals and construction-related industries (e.g., cement and explosives) were also represented. The majority of these deals were smaller in nature (i.e., deals valued at less than $250 million). Similarly, North America also drove inbound deals, assisted by the fi rst quarter’s Japan-based Asahi Kasei’s acquisition of Canada-based ZOLL.
Of the eight mega-deals so far this year, fi ve were for North American targets, four of the deals were local market, and two were inbounds.
Outbound deal value was driven by the Asia-Pacifi c region, with two deals during the fi rst half of 2012 valued at $3.0 billion. Outbound deal volume is increasing (12 deals), and Europe had the most activity, with fi ve deals. There were also two outbound deals involving North America, including the second-quarter acquisition of Netherland-based Norit by Cabot Co. for $1.1 billion.
North AmericaLocal—9 deals, $8.81 bil.Inbound—7 deals, $4.16 bil.Outbound—3 deals, $2.07 bil.
South AmericaLocal—2 deals, $0.20 bil.Inbound—1 deal, $0.90 bil.Outbound—1 deal, $0.12 bil.
EuropeLocal—7 deals, $2.21 bil.Inbound—2 deals, $1.16 bil.Outbound—5 deals, $1.19 bil.
Asia & OceaniaLocal—24 deals, $7.37 bil.Inbound—2 deals, $0.47 bil.Outbound—2 deals, $3.00 bil.
Middle East and AfricaLocal—0 dealsInbound—0 dealsOutbound—1 deal, $0.33 bil.
Global chemicals M&A activity
Measured by number and value of deals worth $50 million or more (1H12)
Note: In the regional chart local-market means within region, not within country
Chemical compounds 13
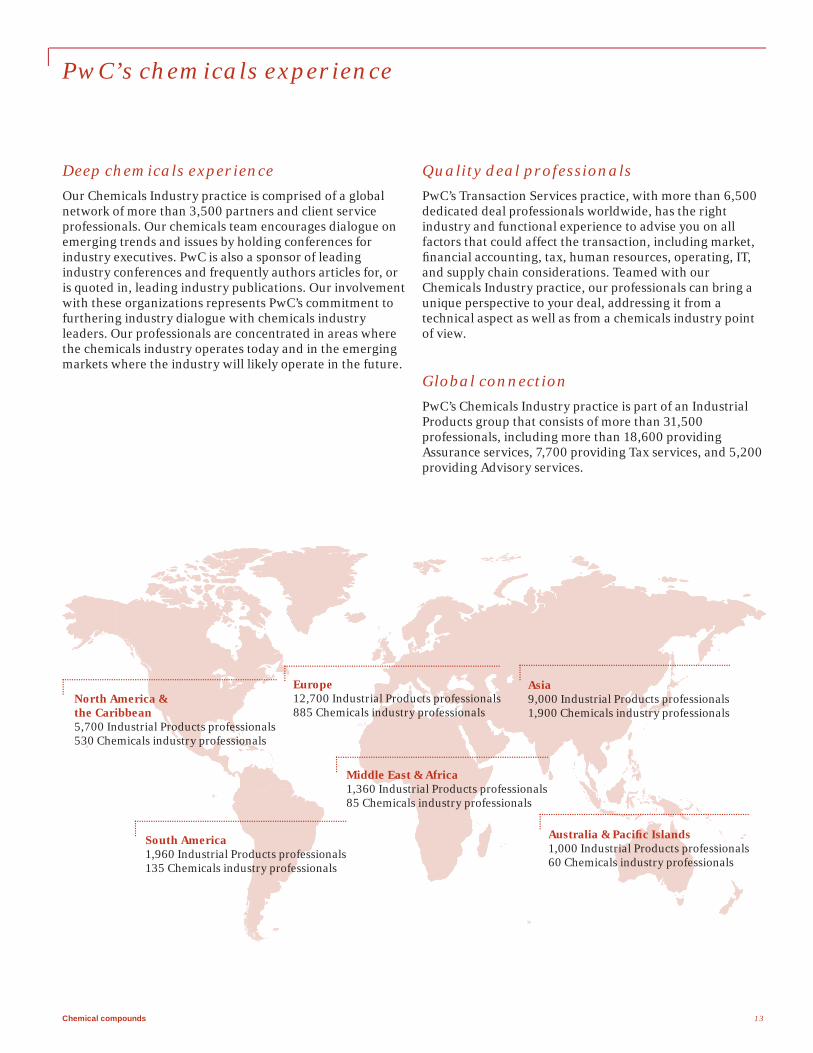
PwC’s chemicals experience
Deep chemicals experience
Our Chemicals Industry practice is comprised of a global network of more than 3,500 partners and client service professionals. Our chemicals team encourages dialogue on emerging trends and issues by holding conferences for industry executives. PwC is also a sponsor of leading industry conferences and frequently authors articles for, or is quoted in, leading industry publications. Our involvement with these organizations represents PwC’s commitment to furthering industry dialogue with chemicals industry leaders. Our professionals are concentrated in areas where the chemicals industry operates today and in the emerging markets where the industry will likely operate in the future.
Quality deal professionals
PwC’s Transaction Services practice, with more than 6,500 dedicated deal professionals worldwide, has the right industry and functional experience to advise you on all factors that could affect the transaction, including market, fi nancial accounting, tax, human resources, operating, IT, and supply chain considerations. Teamed with our Chemicals Industry practice, our professionals can bring a unique perspective to your deal, addressing it from a technical aspect as well as from a chemicals industry point of view.
Global connection
PwC’s Chemicals Industry practice is part of an Industrial Products group that consists of more than 31,500 professionals, including more than 18,600 providing Assurance services, 7,700 providing Tax services, and 5,200 providing Advisory services.
North America & the Caribbean5,700 Industrial Products professionals530 Chemicals industry professionals
South America1,960 Industrial Products professionals135 Chemicals industry professionals
Middle East & Africa1,360 Industrial Products professionals85 Chemicals industry professionals
Europe12,700 Industrial Products professionals885 Chemicals industry professionals
Asia9,000 Industrial Products professionals1,900 Chemicals industry professionals
Australia & Pacifi c Islands1,000 Industrial Products professionals60 Chemicals industry professionals

14 PwC
PwC’s Chemicals Industry practice
PwC’s Chemicals Industry practice is a global network of professionals who provide industry-focused Assurance, Tax, and Advisory services to public and private chemical companies. Our leadership team consists of:
Contacts
US Chemicals Transaction Services directorSimon Bradford—[email protected]
US Industrial Products marketing directorThomas Waller—[email protected]
US Industrial Products marketing managerGina Reynolds—[email protected]
Central and Eastern Europe Chemicals leaderPawel Peplinski—[email protected]
France Chemicals leaderStephane Basset—[email protected]
Germany Chemicals leaderEckhard Sprinkmeier—[email protected]
Greater China Chemicals leaderJean Sun—[email protected]
United Kingdom Chemicals leaderRichard Bunter—[email protected]
Global Chemicals leaderAntoine Westerman—[email protected]
Global Chemicals Tax leaderMichael Burak—[email protected]
Global Chemicals Advisory leaderVolker Fitzner—+49.69.9585.5602volker.fi [email protected]
Global Chemicals client service advisorChristy Robeson—[email protected]
US Chemicals leaderAnthony J. Scamuffa—[email protected]
US Chemicals Tax leaderMatthew Bruhn—[email protected]
US Advisory leaderVenkatesh Jayaraman—[email protected]
US Chemicals Transaction Services partnerTom Hudspeth—[email protected]
US Chemicals Transaction Services directorSeamus Jiang—[email protected]

Chemical compounds 15
PwC’s global Transaction Services practice
PwC’s Transaction Services practice offers a full range of tax fi nancial, business, Assurance, and Advisory capabilities covering acquisitions, disposals, private equity, and strategic M&A advice on listed company transactions, fi nancing, and public/private partnerships. The team consists of:
Global Transaction Services leaderJohn Dwyer—[email protected]
US Transaction Services leaderMartyn Curragh—[email protected]
Asia-Pacifi c Transaction Services leaderChao Choon Ong—[email protected]
Europe Transaction Services LeaderVolker Strack—[email protected]
Greater China Chemicals Transaction Services partnerRoland Xu—[email protected]
United Kingdom Chemicals Transaction Services directorMike Clements—[email protected]
PwC’s Research and Analysis group
Industrial Products Research and Analysis managerSean Gaffney—[email protected]
PwC’s Corporate Finance group
Senior Managing Director, Corporate Finance Rakesh Kotecha—[email protected]

16 PwC
Methodology
Chemical compounds is an analysis of deals in the global chemicals industry. Deal and fi nancial information was sourced from Thomson Reuters using the Thomson-defi ned industry sector of Chemicals and Allied Products for target, and other selected industries acquired by companies that are part of the Thomson-defi ned Chemicals and Allied Products designation. This analysis includes all mergers and acquisitions for disclosed or undisclosed values, leveraged buyouts, privatizations, minority stake purchases and acquisitions of remaining interest announced between January 1, 2008, and March 31, 2012, with a deal status of completed, intended, partially completed, pending, pending regulatory approval, seeking buyer, seeking buyer
withdrawn, unconditional (i.e., initial conditions set forth by the acquirer have been met but deal has not been completed) or withdrawn. Geographic categories generally correspond to continents with exceptions for Australia (included in the Asia Pacifi c category), Europe (divided into Western and Eastern categories based upon UN defi nitions) and the Middle East (defi ned as a separate category based upon US CIA World Factbook). Where China is referenced in this analysis, it includes both the Peoples Republic of China and Hong Kong, unless otherwise indicated. Where the number of deals is referenced in this analysis it means the number of all deals with disclosed or undisclosed values, unless otherwise noted.

Chemical compounds 17

Visit our chemicals industry website at www.pwc.com/us/industrialproducts
© 2012 PricewaterhouseCoopers LLP. All rights reserved. “PricewaterhouseCoopers” and “PwC” refer to PricewaterhouseCoopers LLP, a Delaware limited liability partnership, or, as the context requires, the PricewaterhouseCoopers global network or other member fi rms of the network, each of which is a separate legal entity. This document is for general information purposes only, and should not be used as a substitute for consultation with professional advisors. MW-12-0438 jp