Chemical composition mapping with nanometre resolution … · SUPPLEMENTARY INFORMATION DOI:...
10
SUPPLEMENTARY INFORMATION DOI: 10.1038/NPHOTON.2014.207 NATURE PHOTONICS | www.nature.com/naturephotonics 1 David A. Shapiro a , Young-Sang Yu b,g , Tolek Tyliszczak a , Jordi Cabana b,c , Rich Celestre a , Weilun Chao d , Konstantin Kaznatcheev e , A.L. David Kilcoyne a , Filipe Maia f , Stefano Marchesini a , Y. Shirley Meng g , Tony Warwick a , Lee Lisheng Yang a , and Howard A. Padmore a a Advanced Light Source, Lawrence Berkeley National Laboratory, Berkeley, CA 94720 b Environmental Energy Technologies Division, Lawrence Berkeley National Laboratory, Berkeley, CA 94720 c Department of Chemistry, University of Illinois at Chicago, Chicago, IL 60607 d Center for X-ray Optics, Lawrence Berkeley National Laboratory, Berkeley, CA 94720 e NSLS-II, Brookhaven National Laboratory, Upton, NY 11973 f Laboratory of Molecular Biophysics, Uppsala University, SE-751 24 Uppsala, Sweden g Department of NanoEngineering, University of California at San Diego, San Diego, CA 92093 The ALS has implemented ptychography in two of the three standard STXMs, all of which use a similar configuration of motor stages for sample scanning. The foundation of the scanning mechanism is an XY pair of stepper motors while the precision scanning is performed by an XY piezo flexure stage, mounted on top of the stepper motor base, which is stabilized with respect to the x-ray focusing optic by a laser interferometer. The closed loop operation of the piezo motors allows for long term stability, scan step precision, and vibrational amplitudes in the 1-5 nm (RMS) range depending on the particular system mechanics and environmental conditions on any given day. Since these values are already approaching the wavelength of the radiation used for imaging, and will ultimately set the resolution limit, it is not generally necessary to implement any numerical optimization of the scan positions during post-processing as has been done in previous work. During normal user operations, the STXMs use a 25 nm outer zone width zone plate but ptychographic data can be generated with a larger spot, in this case using a 60 nm outer zone width optic, in order to reduce the number of scan points needed for a given field of view and to increase the scattering contrast in each illuminated sample position. The limited dynamic range of soft x-ray pixel detectors necessarily implies that there is a relationship between the size of the probe and the achievable spatial resolution which is more complicated than a standard point spread function. As the spot size increases, the dynamic range of the signal between the minimum spatial frequency present and the desired resolution increases as well. At soft x-ray energies, CCD detectors can only span 2-3 Chemical composition mapping with nanometre resolution by soft X-ray microscopy © 2014 Macmillan Publishers Limited. All rights reserved.
Transcript of Chemical composition mapping with nanometre resolution … · SUPPLEMENTARY INFORMATION DOI:...
SUPPLEMENTARY INFORMATIONDOI: 10.1038/NPHOTON.2014.207
NATURE PHOTONICS | www.nature.com/naturephotonics 1
Mapping Chemical Composition with Nanometer Resolution by Soft X-rayMicroscopy
David A. Shapiroa, Young-Sang Yub,g, Tolek Tyliszczaka, Jordi Cabanab,c, Rich Celestrea, Weilun Chaod,Konstantin Kaznatcheeve, A.L. David Kilcoynea, Filipe Maiaf, Stefano Marchesinia, Y. Shirley Mengg,Tony Warwicka, Lee Lisheng Yanga, and Howard A. Padmorea
a Advanced Light Source, Lawrence Berkeley National Laboratory, Berkeley, CA 94720b Environmental Energy Technologies Division, Lawrence Berkeley National Laboratory, Berkeley, CA 94720c Department of Chemistry, University of Illinois at Chicago, Chicago, IL 60607d Center for X-ray Optics, Lawrence Berkeley National Laboratory, Berkeley, CA 94720e NSLS-II, Brookhaven National Laboratory, Upton, NY 11973f Laboratory of Molecular Biophysics, Uppsala University, SE-751 24 Uppsala, Swedeng Department of NanoEngineering, University of California at San Diego, San Diego, CA 92093
Supplementary Information
The ALS has implemented ptychography in two of the three standard STXMs, all of which use
a similar configuration of motor stages for sample scanning. The foundation of the scanning
mechanism is an XY pair of stepper motors while the precision scanning is performed by an XY piezo
flexure stage, mounted on top of the stepper motor base, which is stabilized with respect to the x-ray
focusing optic by a laser interferometer. The closed loop operation of the piezo motors allows for long
term stability, scan step precision, and vibrational amplitudes in the 1-5 nm (RMS) range depending on
the particular system mechanics and environmental conditions on any given day. Since these values
are already approaching the wavelength of the radiation used for imaging, and will ultimately set the
resolution limit, it is not generally necessary to implement any numerical optimization of the scan
positions during post-processing as has been done in previous work.
During normal user operations, the STXMs use a 25 nm outer zone width zone plate but
ptychographic data can be generated with a larger spot, in this case using a 60 nm outer zone width
optic, in order to reduce the number of scan points needed for a given field of view and to increase the
scattering contrast in each illuminated sample position. The limited dynamic range of soft x-ray pixel
detectors necessarily implies that there is a relationship between the size of the probe and the
achievable spatial resolution which is more complicated than a standard point spread function. As the
spot size increases, the dynamic range of the signal between the minimum spatial frequency present
and the desired resolution increases as well. At soft x-ray energies, CCD detectors can only span 2-3
Chemical composition mapping with nanometre resolution by soft X-ray microscopy
© 2014 Macmillan Publishers Limited. All rights reserved.

orders of magnitude in intensity, due to the limited electron well depth, which corresponds to a range
of length scales spanning only a factor of 5 at maximum, assuming the inverse fourth power
dependence of the cross-section for coherent scattering on voxel size and that we can phase reliably
to a scattered intensity with average signal-to-noise ratio of 11,2. Thus, a 60 nm zone plate should
achieve 12.7 nm resolution when imaging in two dimensions. However, the facets of the LiFePO4
crystals scattered so strongly that the scattered intensity was significant at the edge of the detector NA
which is equivalent to a half period spatial resolution of 4.1 nm. In order to avoid aliasing effects in the
reconstruction, the data were truncated with a Gaussian filter with a full-width at half maximum
(FWHM) of 10 nm in real space though the real space pixel size of the reconstructions was set at 4.0
nm in order to have an integer number of pixels per scan step.
We have implemented a merging technique which expands the dynamic range of our
measurement by combining long and short exposures at each sample position and improves the
achievable spatial resolution by more than a factor of 2. This requires saturation of the detector during
the long exposure times (since a beamstop is not used) and is practically limited to roughly a factor of
10-20 difference between long and short exposures because of charge blooming in the sensor which
contaminates non-saturated pixels. The two exposure times are merged during pre-reconstruction
processing according to:
where s is a saturation mask which is 0 for pixels near or beyond saturation and 1 otherwise. The
diffraction patterns Ilong and Ishort are the background subtracted exposures, with exposure times tshort
and tlong, which are also thresholded to remove readout noise which is not time dependent. After
merging and filtering the data, they are zero padded so as to give a real space pixel size which results
in an integer number of pixels between scan steps, and then finally downsampled to 128 pixels across
the field of view. Figure SI-1 shows details of the merging and downsampling.
The background refinement determines an offset which is common to all frames but which is
variable across a single frame. The background refinement is particularly important to this work as the
© 2014 Macmillan Publishers Limited. All rights reserved.
interferometer lasers and order sorting aperture can introduce significant stray light which is common
to all diffraction patterns. This stray light is iteratively determined and subtracted from the
measurements thus improving the convergence. Figure SI-1 shows the average of all diffraction
frames from the test sample before and after the iterative background refinement. Stray reflections
and a faint halo around the STXM brightfield annulus are apparently incoherent signal which are
removed during the reconstruction. Figure SI-2 shows a comparison of the reconstructed phase
image with (a) and without (b) background refinement. The finest lines in the test object are only
resolved for the former case. The probe refinement allows for determination of a probe function which
is not precisely known but we have found that the end result does not differ significantly from the initial
estimate which is well defined in a diffraction-limited STXM as the Fourier transform of the zone plate
pupil with flat phase (Supplementary Figure 1 (c)-(d)). Since the zone plate focus in a STXM is filtered
by an order sorting aperture (OSA) which removes all but the positive first diffraction order, the
diffraction pattern of the probe is localized to an annulus. This lack of high spatial frequency content in
the probe can be enforced during reconstruction via a mask applied in reciprocal space and
suppresses the emergence of grid pathologies which have prohibited the use of square scan grids in
previous work3.
The chemical compositions of the reconstructions where analyzed by first registering the
images using the StackReg4 plugin to ImageJ5 (image shifts are found using the absorption signal)
then calculating a complex-valued principal component analysis, expectation-maximization clustering
of the second and third component (ignoring the first component to minimize mass effects), followed
finally by singular value decomposition to obtain the target spectra of the end members. The
composition maps are calculated as a dot product of the three dimensional energy image stack with
the target spectra. The components in the composition maps are interpreted as FePO4 and LiFePO4
because of qualitative agreement with the reference spectra. However, the maps do not represent
quantitative fractions of the end members as they are determined from the ptychographic spectra
rather than the reference spectra. All computations, except image registration, used code available in
the SciPy6 Python package. The analysis is automated and parameter free except for the choice of
© 2014 Macmillan Publishers Limited. All rights reserved.

the number of clusters. For this system, which is expected to be two phase, the number of clusters is
necessary three. The same automated analysis was performed on the STXM absorption images.
Supplemental References
1. Howells, M. R. et al. An assessment of the resolution limitation due to radiation-damage in x-ray diffraction microscopy. J. Electron Spectrosc. Relat. Phenom. 170, 4–12 (2009).
2. Chapman, H. N. et al. High-resolution ab initio three-dimensional x-ray diffraction microscopy. J Opt Soc Am Opt Image Sci Vis 23, 1179–1200 (2006).
3. Thibault, P., Dierolf, M., Bunk, O., Menzel, A. & Pfeiffer, F. Probe retrieval in ptychographic coherent diffractive imaging. Ultramicroscopy 109, 338–343 (2009).
4 Thevenaz, P., Ruttimann, U. E. & Unser, M. A pyramid approach to subpixel registration based on intensity. IEEE Trans. Image Process. 7, 27–41 (1998).
5. Schneider, C. A., Rasband, W. S. & Eliceiri, K. W. NIH Image to ImageJ: 25 years of image analysis. Nat. Methods 9, 671–675 (2012).
6. Jones, E., Oliphant, T. & Peterson, P. SciPy: Open Source Scientific Tools for Python. (2001). at
<http://www.scipy.org
© 2014 Macmillan Publishers Limited. All rights reserved.
Supplementary Figure Legends
© 2014 Macmillan Publishers Limited. All rights reserved.

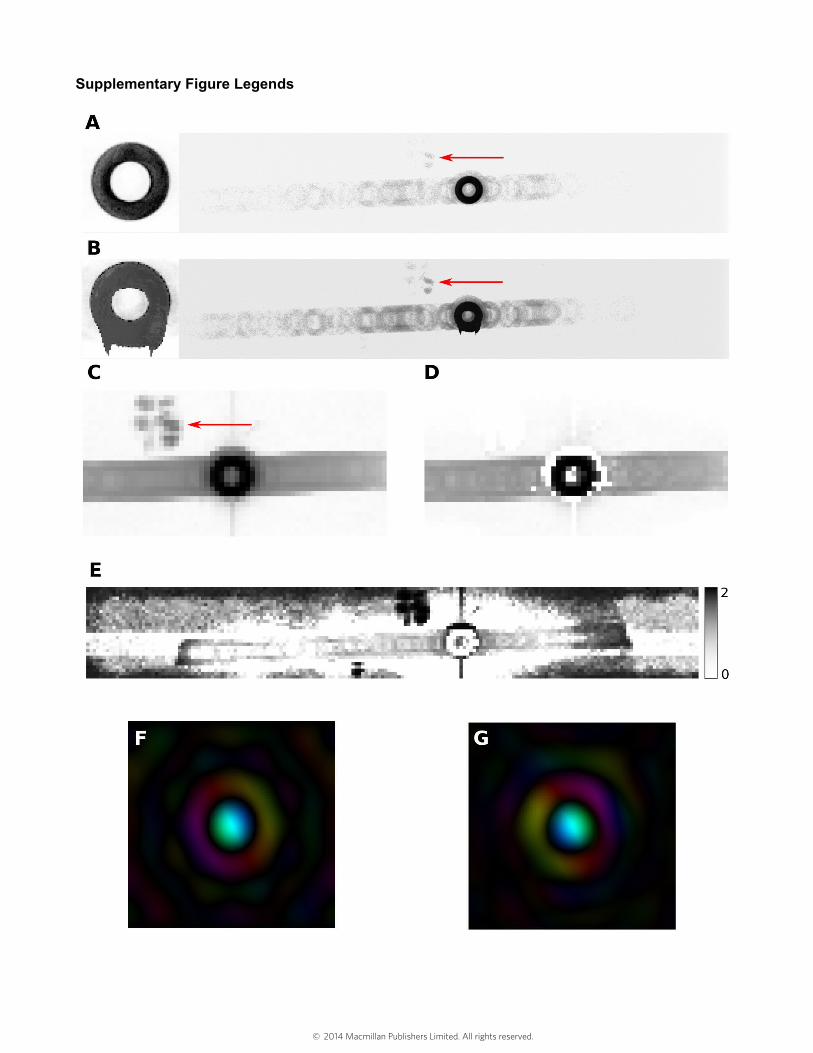
Supplementary Figure 1 Details of the data processing and ptychographic reconstruction. Raw
diffraction data for the short (a) and long (b) exposures. The long exposure is saturated and the
saturated pixels have bloomed slightly into neighboring pixels. The red arrows point to spurious x-ray
signal which does not originate from the sample but which has comparable intensity to the sample
scattering. Central portions of the average diffraction data (after merging and downsampling) before
(c) and after (d) background retrieval. Outside of the central annulus (the image of the zone plate
pupil) spurious x-ray scattering spots (red arrow) and a faint halo of incoherent light can be seen.
These features are determined by the algorithm and subtracted during the reconstruction process. (e)
Shows the ratio of the recovered background intensity to that of the average diffraction pattern. The x-
ray probe function before (f) and after (g) the probe retrieval process. The initial probe is calculated as
the Fourier transform of the zone plate pupil assuming flat phase. The recovered probe shows minor
differences from the original, indicating the high quality of the STXM focus. These HSV images
represent the probe intensity on a log scale as Value and phase as Hue.
© 2014 Macmillan Publishers Limited. All rights reserved.
© 2014 Macmillan Publishers Limited. All rights reserved.

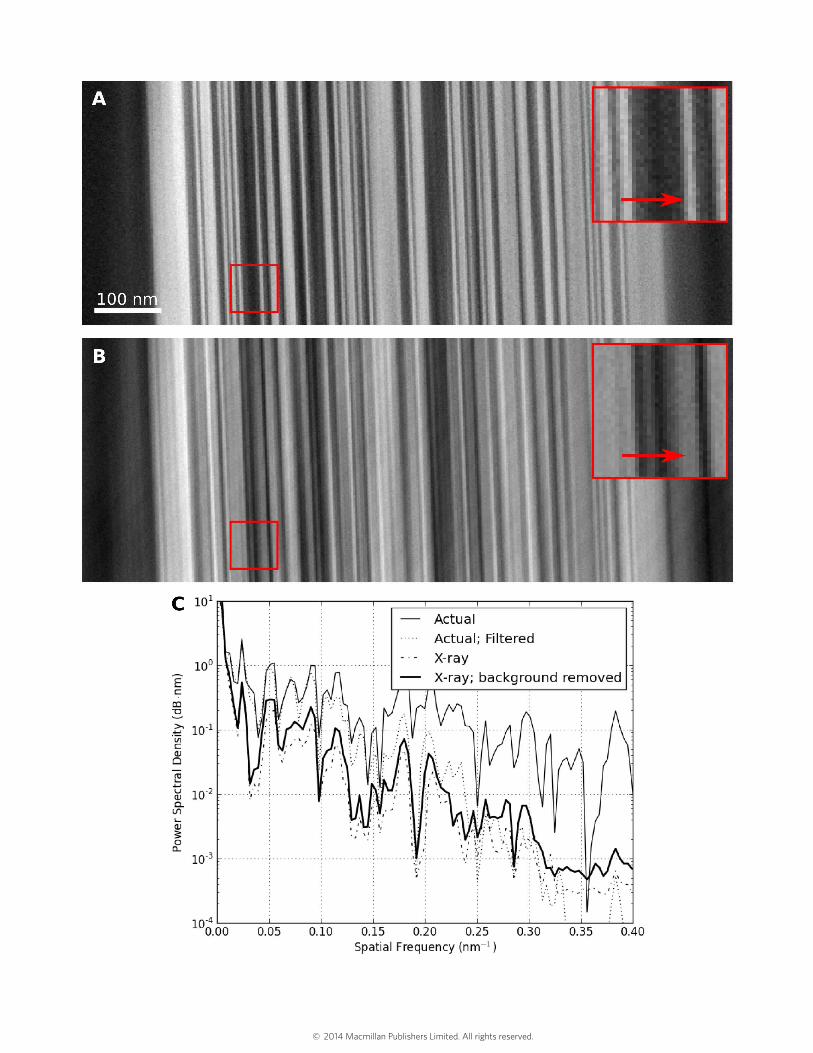
Supplementary Figure 2 Comparison of the reconstructed phase images with (a) and without (b) the
background refinement step. The inset images show a red arrow pointing at an isolated line with 5 nm
width. The line is only resolved for the case with background refinement showing clearly enhanced
spatial resolution. (c) Power spectral densities (PSD) of the reconstructed phase images under various
conditions. The PSD for the actual sequences are calculated from a single line while that of the x-ray
images is the average PSD of all lines in the image.
© 2014 Macmillan Publishers Limited. All rights reserved.
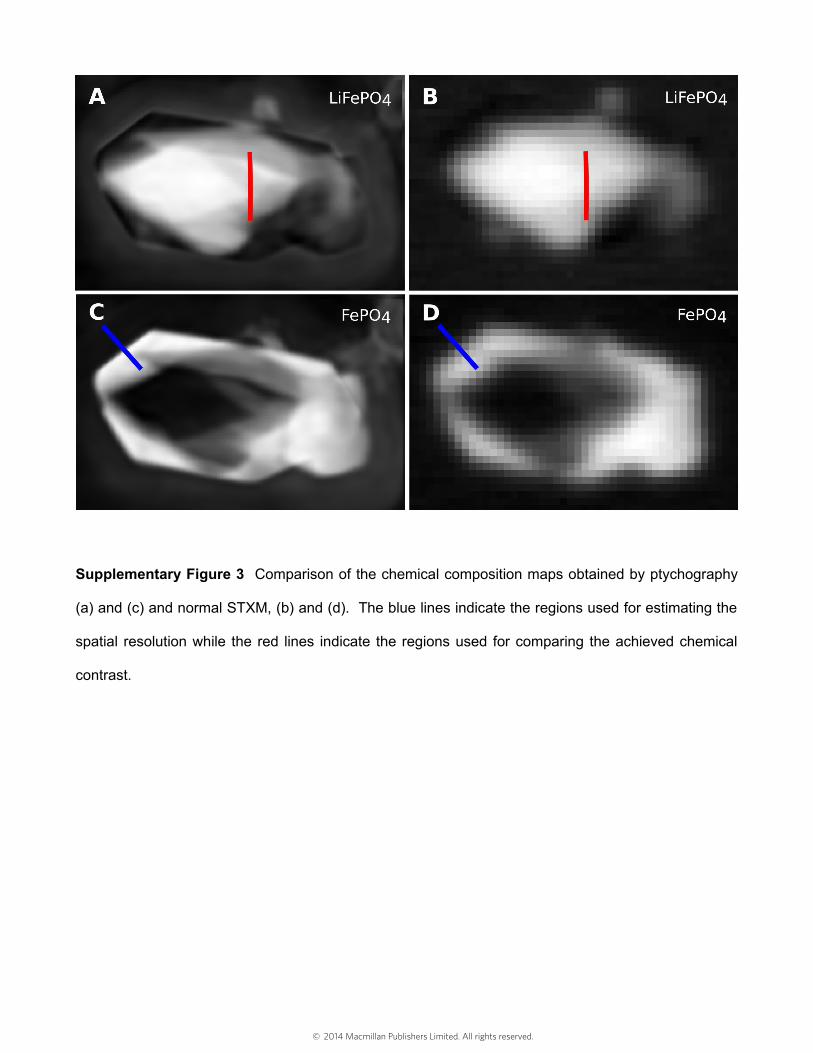
Supplementary Figure 3 Comparison of the chemical composition maps obtained by ptychography
(a) and (c) and normal STXM, (b) and (d). The blue lines indicate the regions used for estimating the
spatial resolution while the red lines indicate the regions used for comparing the achieved chemical
contrast.
© 2014 Macmillan Publishers Limited. All rights reserved.
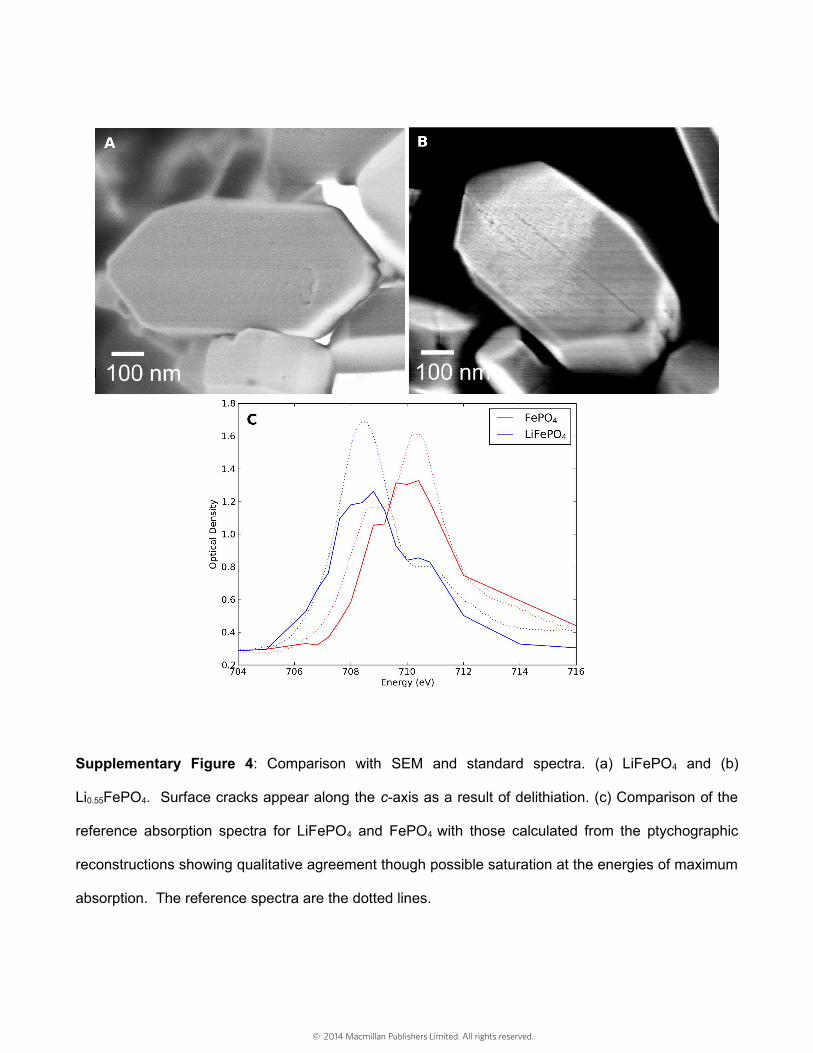
Supplementary Figure 4: Comparison with SEM and standard spectra. (a) LiFePO4 and (b)
Li0.55FePO4. Surface cracks appear along the c-axis as a result of delithiation. (c) Comparison of the
reference absorption spectra for LiFePO4 and FePO4 with those calculated from the ptychographic
reconstructions showing qualitative agreement though possible saturation at the energies of maximum
absorption. The reference spectra are the dotted lines.
© 2014 Macmillan Publishers Limited. All rights reserved.