Chemical Analysis of Pesticides Using GC/MS, GC/MS/MS,...
28
5 Chemical Analysis of Pesticides Using GC/MS, GC/MS/MS, and LC/MS/MS Renata Raina University of Regina, Department of Chemistry & Biochemistry and Trace Analysis Facility Canada 1. Introduction There are well over 500 registered pesticides worldwide for use in agricultural regions and new agrochemicals are introduced to the marketplace continuously. This chapter deals with the chemical analysis methods for the main pesticide chemical classes that are most frequently analyzed with gas chromatography (GC) or liquid chromatography (LC) coupled to mass spectrometry (MS). GC amenable pesticide chemical classes which do not require derivatization include organochlorines (OCs), pyrethroids, organophosphorus pesticides (OPs), triazines, and chloroacetanilides. In addition some transformation products of organochlorines, triazines, and phenylureas are GC amenable and when derivatized some transformation products of OPs, pyrethroids, and phenoxyacid herbicides are also GC amenable. Specific methods have been developed with other injector choices than the standard splitless injection for more thermally labile chemical classes such as trihalomethylthio fungicides to extend the range of GC amenable pesticides. Some chemical classes which are more polar such as phenoxy acid herbicides and carbamates can still be analyzed by GC/MS methods but require derivatization to make them GC amenable. For some other chemical classes a few pesticides have been analyzed by GC/MS usually included in multiresidue methods but these methods have not tackled the entire range of compounds within the chemical class. These include chemical classes such as dicarboximides (vinclozin, iprodione), dinitroaniline (trifluralin, ethalfluralin), dinitrophenol (dinoseb), and dithiocarbamate (triallate). A large number of pesticide classes generally of higher polarity suffer from poor chromatographic performance, poor MS source ionization or stability in GC/MS injectors, on-column, or in MS. For these chemical classes and also to minimize the need for derivatization prior to GC there has been a gradual shift to the development of new methods utilizing LC coupled with tandem mass spectrometry (MS/MS). Tandem mass spectrometry in selected reaction monitoring (SRM) mode is generally now more frequently used for LC rather than selected ion monitoring (SIM) with LC/MS as the ionization process for LC/MS is a softer process (change processes to process) than that of GC/MS ion sources such as EI and CI. For atmospheric pressure ionization (API) sources most frequently used in LC/MS/MS most pesticides have only one ion formed during ionization (the protonated or deprotonated molecular ion or sometimes an adduct ion (eg. sodium or ammonium adduct)) and consequently there is little confirmation ability. Tandem mass spectrometry allows for the controlled collision induced dissociation www.intechopen.com
Transcript of Chemical Analysis of Pesticides Using GC/MS, GC/MS/MS,...
5
Chemical Analysis of Pesticides Using GC/MS, GC/MS/MS, and LC/MS/MS
Renata Raina University of Regina, Department of Chemistry &
Biochemistry and Trace Analysis Facility Canada
1. Introduction
There are well over 500 registered pesticides worldwide for use in agricultural regions and new agrochemicals are introduced to the marketplace continuously. This chapter deals with the chemical analysis methods for the main pesticide chemical classes that are most frequently analyzed with gas chromatography (GC) or liquid chromatography (LC) coupled to mass spectrometry (MS). GC amenable pesticide chemical classes which do not require derivatization include organochlorines (OCs), pyrethroids, organophosphorus pesticides (OPs), triazines, and chloroacetanilides. In addition some transformation products of organochlorines, triazines, and phenylureas are GC amenable and when derivatized some transformation products of OPs, pyrethroids, and phenoxyacid herbicides are also GC amenable. Specific methods have been developed with other injector choices than the standard splitless injection for more thermally labile chemical classes such as trihalomethylthio fungicides to extend the range of GC amenable pesticides. Some chemical classes which are more polar such as phenoxy acid herbicides and carbamates can still be analyzed by GC/MS methods but require derivatization to make them GC amenable. For some other chemical classes a few pesticides have been analyzed by GC/MS usually included in multiresidue methods but these methods have not tackled the entire range of compounds within the chemical class. These include chemical classes such as dicarboximides (vinclozin, iprodione), dinitroaniline (trifluralin, ethalfluralin), dinitrophenol (dinoseb), and dithiocarbamate (triallate). A large number of pesticide classes generally of higher polarity suffer from poor chromatographic performance, poor MS source ionization or stability in GC/MS injectors, on-column, or in MS. For these chemical classes and also to minimize the need for derivatization prior to GC there has been a gradual shift to the development of new methods utilizing LC coupled with tandem mass spectrometry (MS/MS). Tandem mass spectrometry in selected reaction monitoring (SRM) mode is generally now more frequently used for LC rather than selected ion monitoring (SIM) with LC/MS as the ionization process for LC/MS is a softer process (change processes to process) than that of GC/MS ion sources such as EI and CI. For atmospheric pressure ionization (API) sources most frequently used in LC/MS/MS most pesticides have only one ion formed during ionization (the protonated or deprotonated molecular ion or sometimes an adduct ion (eg. sodium or ammonium adduct)) and consequently there is little confirmation ability. Tandem mass spectrometry allows for the controlled collision induced dissociation
www.intechopen.com
Pesticides - Strategies for Pesticides Analysis
106
(CID) of the parent ion making discrimination possible from co-eluting matrix components. No additions (LC/MS/MS or LC/MS methods include phenoxyacid herbicides other pesticides of interest. The main chemical classes of pesticides that have been more recently analyzed by LC/MS/MS or LC/MS methods and include phenoxyacid herbicides and a related nitrile herbicide (bromoxynil) often used in formulations with phenoxyacid herbicides, phenylureas, sulfonyl ureas, carbamates, pyrethroids, azoles, and a more extensive list of dithiocarbamates. Phenylureas, sulfonylureas, and most dithiocarbamates are not GC amenable and many azoles have significantly lower detection limits with LC/MS/MS. Some chemical classes including OPs, pyrethroids, carbamates, phenoxyacid herbicides, and azoles have both GC and LC methods coupled to mass spectrometry that have been developed and will be discussed in more detail in this chapter. There are a large number of factors that require consideration for the selection of the method for analysis whether that is for an individual pesticide, a chemical class of pesticides, a large number of pesticides of different chemical classes, or for inclusion of their transformation products. These factors include: boiling point or polarity; solubility in desired solvent or mobile phases; stability of pesticides in injector ports, on-column, or in mass spectrometer ion sources; selectivity of columns and chromatographic behaviour; interferences in detection; molecular structure or other chemical properties important for both ionization and fragmentation; method detection limit or regulatory requirements; and confirmation ability over linear dynamic range. This chapter does not include a discussion of the sample preparation (pre-concentration or sample clean-up) procedures and does not distinguish methods developed for fruit and vegetables, biological tissues, soil, water, air or other sample matrices. The focus is on issues related to the chromatography-mass spectrometry and instrumental approaches that may be taken advantage of to improve selectivity or sensitivity of analysis.
2. Identification of the problem
Due to the large number of pesticides under investigation users must firstly decide on whether to choose a GC or LC method coupled to mass spectrometry and if the method can achieve the desired quantitative analysis and confirmation needs. Some laboratories may also be more limited in their choice of instruments or skill of analysts so need to be aware of methods that may be equivalent for those chemical classes that can be analyzed by both GC and LC. Many laboratories are looking towards streamlining sample preparation and analysis needs such as with the Quick Easy Cheap Effective Rugged and Safe (QuEChERSA) pesticide multiresidue methods in combination with GC and LC mass spectrometry methods (Cunha et al., 2007; Payá et al., 2007; Pihlström et al., 2007). Due to the large diversity in sample types and pesticides used or of concern in different regions, multiresidue analysis methods can vary significantly in their choice of target pesticides and transformation products and this makes it challenging for an analyst to select a method for analysis as they may not fully understand the factors that went into the selection of the instrumental parameters and the compromises that were made to resolve matrix effects, chromatographic needs, and detection requirements. This chapter takes a chemical class approach which users can then utilize to select methods with their target pesticide list and can be further built on to include compounds not in these major chemical classes. A main goal is to highlight by chemical class some of the preferences for these methods and the demands or options for improvements. Some of the advances in instrumental approaches to
www.intechopen.com
Chemical Analysis of Pesticides Using GC/MS, GC/MS/MS, and LC/MS/MS
107
either improve the range of compounds for analysis, reduce background signal, or improve selectivity or sensitivity of the analysis will be highlighted. Due to the increasing need for analysis of transformation products they will be discussed along with their chemical class of parent compounds. Simultaneous analysis of parent pesticides and transformation products is desirable but because of the large diversity in polarity, volatility, stability, and ionization in MS ion sources this is not always feasible. Issues with co-elution of other complex interfering matrix components or other pesticides of interest and their impact on detection and confirmation will also be discussed.
3. GC/MS, GC/MS/MS, and LC/MS/MS for pesticides and their transformation products
3.1 GC/MS and GC/MS/MS methods
One of the most important parameters when considering GC/MS methods of analysis particularly when added selectivity or sensitivity are required is the choice of the ionization mode. Sample matrix and sample preparation procedures including clean-up also dictate selection of the ionization method due to presence of co-eluting pesticides or matrix components which can interfere in analysis if they can not be distinguish in the mass spectra. If pesticides are electron-capturing such as those pesticides which contain halogen, NO2, or P ester groups then they will generally give an enhanced response (up to two or three orders of magnitude) with negative chemical ionization (NCI) in comparison to electron impact (EI) or positive chemical ionization (PCI) (Raina and Hall, 2009; Liapis et al., 2003; Bailey and Belzer, 2007; Húšková et al., 2009). The selection of ionization mode often depends upon whether the analysis is targeted for specific chemical classes or is a multiresidue analysis methods for determination of hundreds of pesticides in a sample extract. A comparison of GC/MS or GC/MS/MS with EI to LC/MS/MS has been reviewed for a large number of compounds and suggests for most pesticides other than organochlorines that LC/MS/MS can provide lower detection limits (Alder et al., 2006; Pihlström et al., 2007; Paya et al., 2007; Lambropoulou et al ., 2007). However, lower or comparable detection limits have also been found for chloracetanilides (metolachlor, acetochlor, alachlor) and selected triazines by GC/MS or GC/MS/MS with EI relative to LC/APCI-MS/MS (Dagnac et al., 2005) or LC/ESI-MS/MS (Gomides Freitas et al., 2004). GC/MS of a wider range of triazines has also been done by GC-EI/MS (Nagaraju and Huang, 2007; Zambonin and Palmisano, 2000; Jiang et al., 2005; Gonçalves et al., 2006; Albanis et al., 1998). Chemical ionization is often not considered in comparisons of GC and LC mass spectrometry methods. Reduction of matrix interferences particularly for masses <50 (Bailey and Belzer, 2007; Bailey, 2005) is often an important consideration as well as the need for molecular structure information from the MS spectra. Due to the large diversity in properties of pesticides analyzed by multiresidue analysis methods EI is more frequently used however particularly for many halogenated pesticides (excluding chloracetanilides) it does not often give the best sensitivity or selectivity. The clear advantage of EI is the availability of extensive libraries in full scan mode for confirmation of compound identify by library search matching, however sufficient sample concentration must be available. Most quantitative analysis is completed in selected ion monitoring (SIM) mode with peak area of the most abundant ion in the MS spectra used for the quantitative analysis, and the peak area obtained from an additional one or two ions used for confirmation along with the ratio of ion responses and retention time match (Raina and Hall, 2009). At the concentration
www.intechopen.com
Pesticides - Strategies for Pesticides Analysis
108
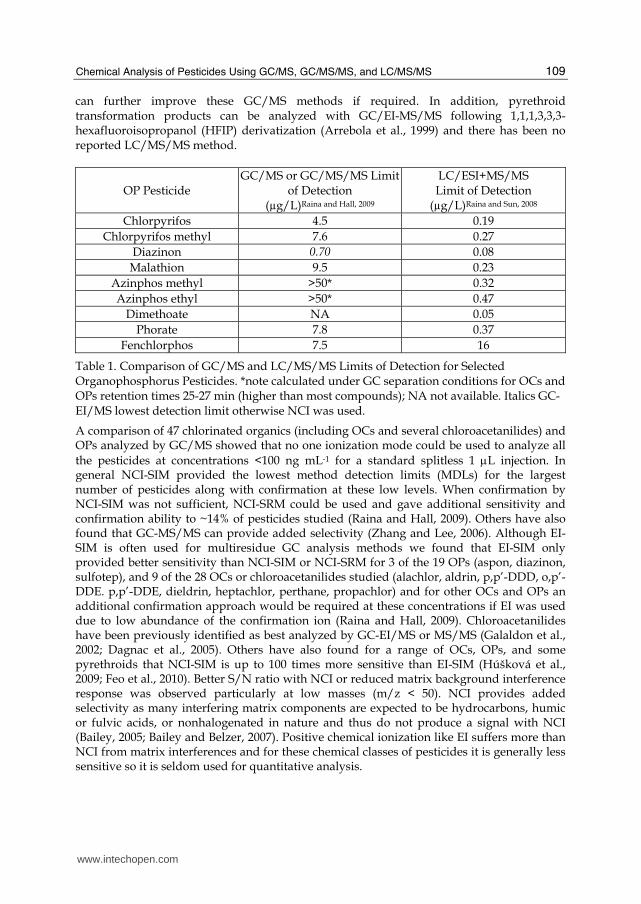
levels of routine analysis particularly for environmental sample analysis there is insufficient concentration to obtain full scan MS spectra of sufficient abundance for library matching when quadrupole or ion trap systems are used. There is another unique feature of pesticide analysis with mass spectrometry that is often not discussed in detail. Relative to other contaminants, many pesticides including OCs, OPs, pyrethroids, and chloroacetanilides exhibit low intensity for the molecular ion regardless of whether EI or CI is used (Raina and Hall, 2009; Húšková et al., 2009; Yoshida, 2009; Feo et al., 2010; Dagnac et al., 2005). Consequently in SIM mode the quantitative or qualifier ion is rarely selected as the molecular ion. In general >90% of pesticides do not monitor the molecular ion by EI or CI methods as at the working concentration ranges of trace analysis generally the molecular ion is too low in abundance to be observed. The exception are the triazines where the molecular ion is one of the ions monitored but may not be the base peak in the EI mass spectra (Nagaraju et al., 2007; Jiang et al., 2005; Zabonin and Palmisano, 2000). The selection of EI versus NCI or PCI may also be based on instrument design and cost and basic GC/MS instruments often do not include CI capability. In this section the focus will first be on chemical classes of pesticides where GC/MS methods are superior or equivalent to LC/MS/MS methods and derivatization is not required. The chemical classes that will be discussed include organochlorines (OCs), organophosphorus pesticides (OPs), trihalomethylthio fungicides, pyrethroids, triazines, and chloracetanilides. The ion sources used in LC/MS/MS are not suitable for some of these pesticides including many of the OCs and trihalomethylthio fungicides. OC degradation products have been routinely included in GC/MS methods either with EI or NCI and include OCs such as endosulfan sulphate, DDD, DDE, HCH isomers, endrin ketone, endrin aldehyde, heptachlor epoxide, methoxychlor. Chloroacetanilides are more sensitive with EI than CI modes with GC/MS (Raina and Hall, 2009; Dagnac et al., 2005; Gabaldon et al., 2002) but can be done with similar detection limits with LC/ ESI+ or APCI+ MS/MS (Dagnac et al., 2005). The transformation products of chloroacetanilides are not analyzed by GC/MS, however chloroacetanilide (eg alachlor, propachlor, metalochlor) analysis is frequently included with analysis of OCs by GC/MS. Triazines can be analyzed with comparable GC/EI-MS or LC/MS/MS methods and it depends upon the application needs and availability of instrumentation as to which method is choosen. Transformation products of atrazine: deisopropylatrazine (DIA), desethylatrazine (DEA), didealkylatraizine (DDA) and 3,4-chloroaniline which is a transformation product of phenylureas (linuron and diuron) have also been analyzed by GC/EI-MS or GC/EI-MS/MS methods (Planas et al., 2006; Jiang et al., 2005; Dagnac et al., 2005). GC/MS methods are more suitable to a wider range of OPs than LC/MS/MS as not all OPs are ionized efficiently by API sources (eg. parathion). However, a significant number of OPs which are widely used give significantly lower detection limits with LC/MS/MS (Table 1). In addition GC/MS methods suffer from poor chromatographic performance, low sensitivity, and required derivatization for OP transformation products, whereas LC/MS/MS can be used to simultaneous analyze the OP transformation products including OP oxons with detection limits of 0.06-0.38 µg/L (Raina and Sun, 2008) and OP sulfones and sulfoxides (Chung and Chan, 2010; Jansson et al., 2004; Hiemstra et al., 2007; Economou et al., 2009). For some pyrethroids GC/EI-MS has approximately 100 times higher detection limits than LC/MS/MS (Alder et al., 2006) while for many they are comparable (Yoshida et al., 2009). When NCI is used detection limits for some pyrethroids can be 10-100 times lower than EI (Feo et al., 2010) making GC/MS comparable or better than LC/MS/MS methods. Coupling this with large volume injections
www.intechopen.com
Chemical Analysis of Pesticides Using GC/MS, GC/MS/MS, and LC/MS/MS
109
can further improve these GC/MS methods if required. In addition, pyrethroid transformation products can be analyzed with GC/EI-MS/MS following 1,1,1,3,3,3-hexafluoroisopropanol (HFIP) derivatization (Arrebola et al., 1999) and there has been no reported LC/MS/MS method.
OP Pesticide GC/MS or GC/MS/MS Limit
of Detection (µg/L)Raina and Hall, 2009
LC/ESI+MS/MS Limit of Detection
(µg/L)Raina and Sun, 2008
Chlorpyrifos 4.5 0.19 Chlorpyrifos methyl 7.6 0.27
Diazinon 0.70 0.08 Malathion 9.5 0.23
Azinphos methyl >50* 0.32 Azinphos ethyl >50* 0.47
Dimethoate NA 0.05 Phorate 7.8 0.37
Fenchlorphos 7.5 16
Table 1. Comparison of GC/MS and LC/MS/MS Limits of Detection for Selected Organophosphorus Pesticides. *note calculated under GC separation conditions for OCs and OPs retention times 25-27 min (higher than most compounds); NA not available. Italics GC-EI/MS lowest detection limit otherwise NCI was used.
A comparison of 47 chlorinated organics (including OCs and several chloroacetanilides) and OPs analyzed by GC/MS showed that no one ionization mode could be used to analyze all the pesticides at concentrations <100 ng mL-1 for a standard splitless 1 μL injection. In general NCI-SIM provided the lowest method detection limits (MDLs) for the largest number of pesticides along with confirmation at these low levels. When confirmation by NCI-SIM was not sufficient, NCI-SRM could be used and gave additional sensitivity and confirmation ability to ~14% of pesticides studied (Raina and Hall, 2009). Others have also found that GC-MS/MS can provide added selectivity (Zhang and Lee, 2006). Although EI-SIM is often used for multiresidue GC analysis methods we found that EI-SIM only provided better sensitivity than NCI-SIM or NCI-SRM for 3 of the 19 OPs (aspon, diazinon, sulfotep), and 9 of the 28 OCs or chloroacetanilides studied (alachlor, aldrin, p,p’-DDD, o,p’-DDE. p,p’-DDE, dieldrin, heptachlor, perthane, propachlor) and for other OCs and OPs an additional confirmation approach would be required at these concentrations if EI was used due to low abundance of the confirmation ion (Raina and Hall, 2009). Chloroacetanilides have been previously identified as best analyzed by GC-EI/MS or MS/MS (Galaldon et al., 2002; Dagnac et al., 2005). Others have also found for a range of OCs, OPs, and some pyrethroids that NCI-SIM is up to 100 times more sensitive than EI-SIM (Húšková et al., 2009; Feo et al., 2010). Better S/N ratio with NCI or reduced matrix background interference response was observed particularly at low masses (m/z < 50). NCI provides added selectivity as many interfering matrix components are expected to be hydrocarbons, humic or fulvic acids, or nonhalogenated in nature and thus do not produce a signal with NCI (Bailey, 2005; Bailey and Belzer, 2007). Positive chemical ionization like EI suffers more than NCI from matrix interferences and for these chemical classes of pesticides it is generally less sensitive so it is seldom used for quantitative analysis.
www.intechopen.com

Pesticides - Strategies for Pesticides Analysis
110
EI full scan mode provides the ability for confirmation with library search matching, however in quantitative analysis generally selected ion monitoring (SIM) is accomplished only with confirmation using an additional one or two ions and the ratio of response of these ions within a specified % relative standard deviation usually determined from standard injections on the day of analysis rather than from libraries. One advantage of GC/MS over LC/MS/MS methods is the lower instrument cost and that pesticides fragment in the EI or CI ion source easily and consequently structural information is available for the pesticide for its confirmation. Fragmentation with EI sources is distinctly different from electrospray ionization used in LC/MS/MS with odd-electron (OE) fragment ions more frequently produced with EI (35% OE ions, 65% EE ions) as compared to 93% even-electron (EE) ions with positive electrospray ionization (Thurman et al., 2007). Chemical ionization is a softer ionization process than EI and the MS spectra generally produce less fragment ions, however for > 90% of pesticides analyzed by GC/MS the two most abundant ions in any ionization mode still generally do not include the molecular ion even when PCI or NCI are used (Raina and Hall, 2009; Húšková et al., 2009; Feo et al., 2010). In addition there may be relatively few fragments available of sufficient abundance for confirmation and consequently often isotope masses of fragment ions are used for confirmation. This has implications on the applicability of GC/MS/MS with our results showing that EI is not suitable for the analysis of OCs or OPs < 100 ng mL-1 and NCI-SRM is generally less sensitive than NCI-SIM even though there is reduced background noise (Raina and Hall, 2009). For fruit and vegetable analysis where higher levels of pesticides can be achieved in sample extracts, GC/MS analysis with SRM in EI mode has been used for a similar range of OPs and OCs with preference for these pesticides analyzed by GC/MS/MS over LC/MS/MS (Pihlström et al, 2007). As pesticides easily fragment in the ion sources of GC/EI or NCI-MS, the parent ion selected for collision induced dissociation (CID) is often a fragment ion and this ion must be capable of further fragmentation. In a number of cases for these chemical classes with NCI the presence of higher mass parent ions or the molecular ion improved the potential for lower MDLs with NCI-SRM as compared to EI-SRM. However, most pesticides did not have an abundant molecular ion. Even in NCI-SRM for OCs the SRM transition selected were often f1+>Cl- (m/z=35) with the confirmation SRM utilizing an isotope peak mass (eg f1+>Cl- (m/z=37)) (Raina and Hall, 2009). The fact that the parent ions with GC/MS/MS are often fragment ions makes finding suitable product ions more challenging than with LC/MS/MS ion sources where the parent ion is generally the protonated or deprotonated molecular ion. In the case of HFIP derivatized transformation products of pyrethroids the molecular ion was used for CID and produced better sensitivity and selectivity that GC/EI-MS which observed significant chromatographic resolution problems and reduced MS sensitivity (Arrebola et al., 1999). There are a number of approaches that can be used to extend the range of pesticides that can be analyzed by GC/MS or to further improve MDLs beyond the most frequently used splitless injections with a hot split/splitless injector. For pesticides such as the trihalomethylthio fungicides that are more thermally labile other injectors including programmable temperature vaporizer (PTV) or cold on-column (COC) injector can be used (Bailey, 2005). Another advantage of these injectors is that they can also be utilized for large volume injections increasing the sample injection size from 1-2 µL to 5-100 µL. With both approaches the sample is injected cold (below or near the boiling point of the solvent). Pre-columns have also been utilized with these approaches for focusing and to extend the analytical column lifetime by minimizing build-up of non-volatile matrix components. Both approaches have limitations that are discussed requiring careful consideration.
www.intechopen.com
Chemical Analysis of Pesticides Using GC/MS, GC/MS/MS, and LC/MS/MS
111
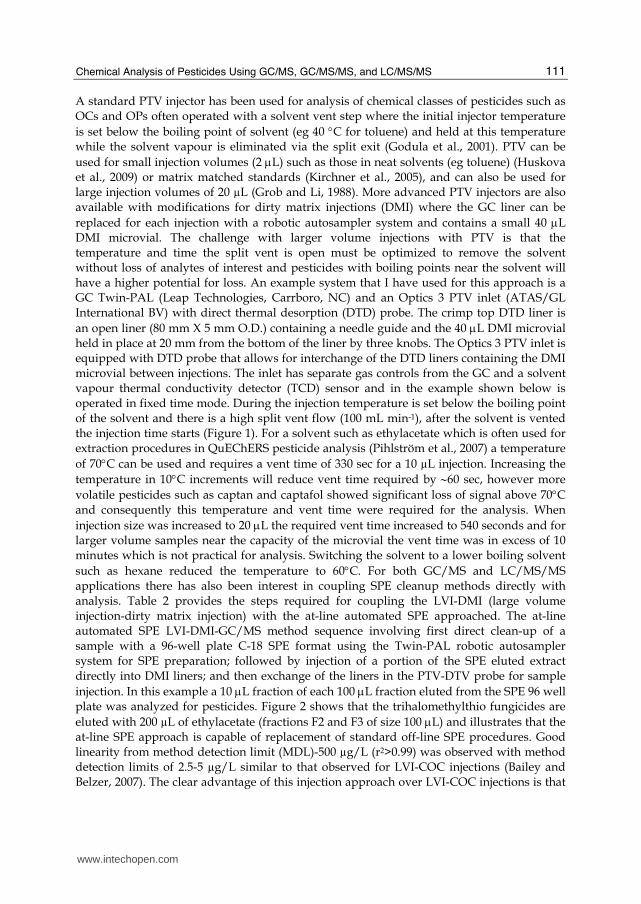
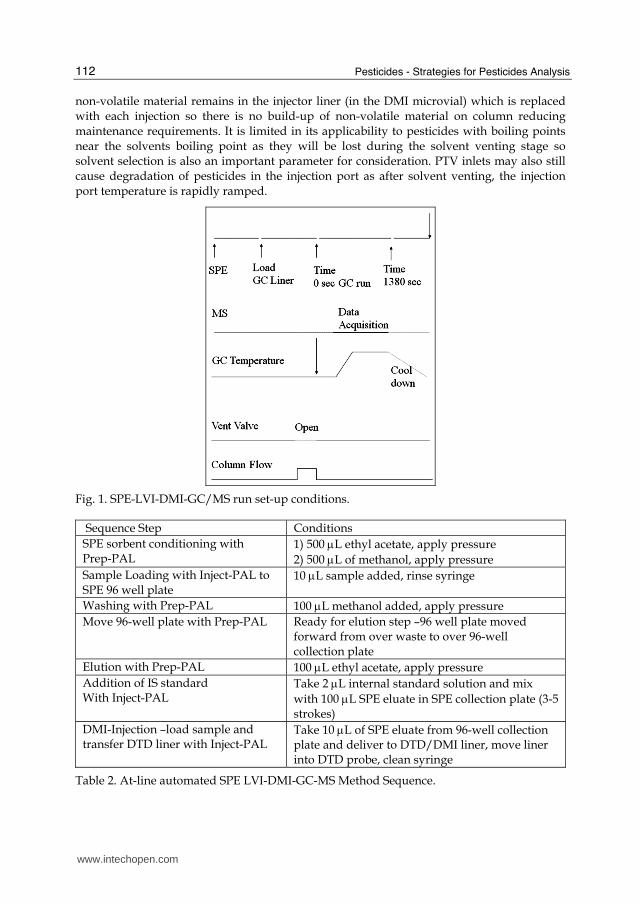
A standard PTV injector has been used for analysis of chemical classes of pesticides such as OCs and OPs often operated with a solvent vent step where the initial injector temperature is set below the boiling point of solvent (eg 40 °C for toluene) and held at this temperature while the solvent vapour is eliminated via the split exit (Godula et al., 2001). PTV can be used for small injection volumes (2 μL) such as those in neat solvents (eg toluene) (Huskova et al., 2009) or matrix matched standards (Kirchner et al., 2005), and can also be used for large injection volumes of 20 µL (Grob and Li, 1988). More advanced PTV injectors are also available with modifications for dirty matrix injections (DMI) where the GC liner can be replaced for each injection with a robotic autosampler system and contains a small 40 μL DMI microvial. The challenge with larger volume injections with PTV is that the temperature and time the split vent is open must be optimized to remove the solvent without loss of analytes of interest and pesticides with boiling points near the solvent will have a higher potential for loss. An example system that I have used for this approach is a GC Twin-PAL (Leap Technologies, Carrboro, NC) and an Optics 3 PTV inlet (ATAS/GL International BV) with direct thermal desorption (DTD) probe. The crimp top DTD liner is an open liner (80 mm X 5 mm O.D.) containing a needle guide and the 40 μL DMI microvial held in place at 20 mm from the bottom of the liner by three knobs. The Optics 3 PTV inlet is equipped with DTD probe that allows for interchange of the DTD liners containing the DMI microvial between injections. The inlet has separate gas controls from the GC and a solvent vapour thermal conductivity detector (TCD) sensor and in the example shown below is operated in fixed time mode. During the injection temperature is set below the boiling point of the solvent and there is a high split vent flow (100 mL min-1), after the solvent is vented the injection time starts (Figure 1). For a solvent such as ethylacetate which is often used for extraction procedures in QuEChERS pesticide analysis (Pihlström et al., 2007) a temperature of 70°C can be used and requires a vent time of 330 sec for a 10 µL injection. Increasing the temperature in 10°C increments will reduce vent time required by ∼60 sec, however more volatile pesticides such as captan and captafol showed significant loss of signal above 70°C and consequently this temperature and vent time were required for the analysis. When injection size was increased to 20 μL the required vent time increased to 540 seconds and for larger volume samples near the capacity of the microvial the vent time was in excess of 10 minutes which is not practical for analysis. Switching the solvent to a lower boiling solvent such as hexane reduced the temperature to 60°C. For both GC/MS and LC/MS/MS applications there has also been interest in coupling SPE cleanup methods directly with analysis. Table 2 provides the steps required for coupling the LVI-DMI (large volume injection-dirty matrix injection) with the at-line automated SPE approached. The at-line automated SPE LVI-DMI-GC/MS method sequence involving first direct clean-up of a sample with a 96-well plate C-18 SPE format using the Twin-PAL robotic autosampler system for SPE preparation; followed by injection of a portion of the SPE eluted extract directly into DMI liners; and then exchange of the liners in the PTV-DTV probe for sample injection. In this example a 10 μL fraction of each 100 μL fraction eluted from the SPE 96 well plate was analyzed for pesticides. Figure 2 shows that the trihalomethylthio fungicides are eluted with 200 µL of ethylacetate (fractions F2 and F3 of size 100 μL) and illustrates that the at-line SPE approach is capable of replacement of standard off-line SPE procedures. Good linearity from method detection limit (MDL)-500 µg/L (r2>0.99) was observed with method detection limits of 2.5-5 µg/L similar to that observed for LVI-COC injections (Bailey and Belzer, 2007). The clear advantage of this injection approach over LVI-COC injections is that
www.intechopen.com
Pesticides - Strategies for Pesticides Analysis
112
non-volatile material remains in the injector liner (in the DMI microvial) which is replaced with each injection so there is no build-up of non-volatile material on column reducing maintenance requirements. It is limited in its applicability to pesticides with boiling points near the solvents boiling point as they will be lost during the solvent venting stage so solvent selection is also an important parameter for consideration. PTV inlets may also still cause degradation of pesticides in the injection port as after solvent venting, the injection port temperature is rapidly ramped.
Fig. 1. SPE-LVI-DMI-GC/MS run set-up conditions.
Sequence Step Conditions SPE sorbent conditioning with Prep-PAL
1) 500 μL ethyl acetate, apply pressure 2) 500 μL of methanol, apply pressure
Sample Loading with Inject-PAL to SPE 96 well plate
10 μL sample added, rinse syringe
Washing with Prep-PAL 100 μL methanol added, apply pressure Move 96-well plate with Prep-PAL Ready for elution step –96 well plate moved
forward from over waste to over 96-well collection plate
Elution with Prep-PAL 100 μL ethyl acetate, apply pressure Addition of IS standard With Inject-PAL
Take 2 μL internal standard solution and mix with 100 μL SPE eluate in SPE collection plate (3-5 strokes)
DMI-Injection –load sample and transfer DTD liner with Inject-PAL
Take 10 μL of SPE eluate from 96-well collection plate and deliver to DTD/DMI liner, move liner into DTD probe, clean syringe
Table 2. At-line automated SPE LVI-DMI-GC-MS Method Sequence.
www.intechopen.com
Chemical Analysis of Pesticides Using GC/MS, GC/MS/MS, and LC/MS/MS
113
0
0.2
0.4
0.6
0.8
1
F1 F2 F3 F4
SPE Elution Step
Fra
ctio
n P
esti
cid
e
Captan
Captafol
Folpet
Dicofol
Chlorpyrifos
Fig. 2. Fraction of Pesticide in Washing and Elutions Steps of At-line SPE Procedure. F1 (washing):100 μL methanol; F2 (elution):100 μL ethylacetate; F3 (elution):100 μL ethylacetate; F4 (elution):100 μL ethylacetate; Sample 10 μL of 0.1 μg mL-1 pesticide mixture dissolved in hexane; SPE 96 well plate Bond Elute® C18 100 mg.
0
500
1000
1500
2000
2500
3000
3500
0 20 40 60 80 100
Volume Injected (μL)
Pea
k A
rea
captan
captafol
folpet
diazinon
chlorpyrifos
parathiond10
diazinond10
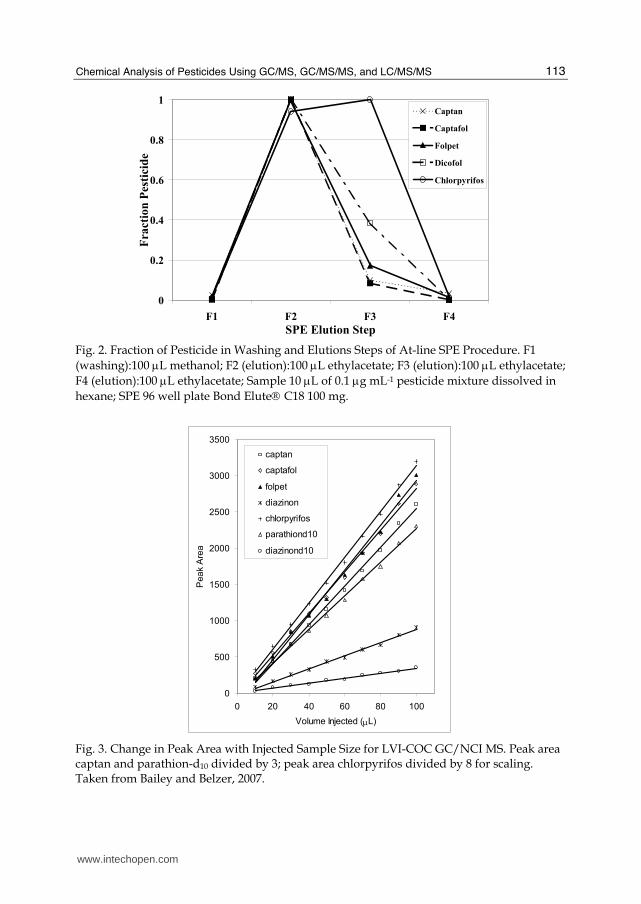
Fig. 3. Change in Peak Area with Injected Sample Size for LVI-COC GC/NCI MS. Peak area captan and parathion-d10 divided by 3; peak area chlorpyrifos divided by 8 for scaling. Taken from Bailey and Belzer, 2007.
www.intechopen.com
Pesticides - Strategies for Pesticides Analysis
114
The cold on-column injector is another option for thermally labile pesticides or large volume injections. Figure 3 shows that it can be used for injection sizes up to 100 μL which exceeds the capability of the LVI-DMI injections. The injection size is also more compatible with the needs for at-line SPE approaches. Cold on-column injection reduces the potential for breakdown of pesticides by directly injecting the sample onto typically a wider diameter 1-1.5 m retention gap (0.53 mm i.d.) which is connected to a short pre-column (∼0.4 m X 0.25 mm) and then further connected with a T-connector to both the analytical column and a solvent vapour exit valve (50 μm bleed restrictor, Agilent) (Bailey and Belzer, 2007). The oven temperature at the start is set at 60-65°C (hexane as solvent) and the split vent is opened until the solvent is removed which for hexane was 60 seconds. The limitation of this system is that the retention gap and pre-column need periodic replacement due to build-up of non-volatile material from samples and thus there are higher maintenance requirements than standard PTV or LVI-DMI injections. Significant loss in sensitivity or poor chromatographic performance is observed when the retention gap requires replacement. Some of these problems may be alleviated with the availability of high temperature GC columns. Another key recent advancement in GC/MS analysis that should be considered by users are the use of high temperature columns to extend column lifetime, reduce maintenance needs, to identify high boilers, and reduced column bleed. These columns are available in the full range of polarities from 100% polysiloxane to polyethylene glycol stationary phases and have low column bleed due to the proprietary ESC™ bonding technology. Low and mid-polarity columns can be used up to temperatures of 430°C, and higher polarity columns up to 400°C as compared to maximum temperatures of 300-360°C for most standard fused silica GC columns temperatures above which the standard polyimide resin coating pyrolyzes. Zebron™ Inferno™ columns (Phenomenex) utilize a high temperature polyimide coating with the flexibility and robustness of other non-metal columns making it highly compatible for GC/MS analysis. The use of higher temperatures has several advantages even if the pesticides elute prior to these temperatures as it reduces build-up of high boiling point matrix components which can be baked-off at the end of the run. To extend GC/MS analysis to more polar pesticides often requires preceding or on-column derivatization. One chemical class of pesticides which has been successfully analyzed with derivatization prior to GC/MS analysis is the phenoxy acid herbicides. Derivatization agents have included pentafluorobenzyl (PFB) bromide, benzyl bromide, trimethylsilyl diazomethane, or alkylchloroformates to produce the corresponding PFB, benzyl, or methyl ester (Nilsson et al., 1998; Rimmer et al., 1996; Henriksen et al., 2001). Methylation with diazomethane or by reaction with 10% sulfuric acid in methanol has also been used (Shin, 2006). The chlorophenols which are transformation products of the phenoxy acid herbicides can also be converted to their carbonates for GC/MS analysis using alkylchloroformates (Henriksen et al., 2001). These approaches can suffer from deteriorating peak shapes over time and reduced column lifetime (Charlton et al., 2009). Carbamates are thermally labile and can breakdown in the injector port or on-column to their corresponding phenols and amines and consequently derivatization using acetylation, silylation, alkylation, or perfluorination is required. On-column derivatization with trimethylphenylammonium hydroxide and trimethylsulfonium hydroxide has been used to give thermally stable products for a variety of carbamates including carbaryl, methiocarb, chlorpropham, propham, and promecarb that can be analyzed by GC-EI/MS (Zhang and Lee, 2006). In more recent years there has been a shift to LC/MS/MS methods (see section 3.2) for both
www.intechopen.com
Chemical Analysis of Pesticides Using GC/MS, GC/MS/MS, and LC/MS/MS
115
phenoxyacid herbicides and carbamates as these methods do not require the derivatization step and can provide an ability to simultaneous analyze transformation products and often a wider range of pesticides within the same chemical class (Raina and Etter, 2010; Charlton et al., 2009; Chung and Chan, 2010). To achieve the necessary MDLs required for environmental or food analysis the majority of GC/MS pesticide analysis methods are in SIM mode with either single quadrupole or ion-trap systems with ion-traps providing similar or slightly higher MDLs than the more popular quadrupole systems. In addition to the use of tandem mass spectrometry in GC/MS analysis, recent advances in pesticide analysis have included the use of GC/TOF-MS for pesticide analysis to achieve MS scan separation even at these low environmental levels enabling full confirmation ability and added selectivity. In these analysis TOF is generally operated with unit resolution and high scan rates (eg 200-500 scans/sec) to provide for automated mass spectral deconvolution of overlapping signals and library matching (de Koning et al., 2003; Zrostlikova et al., 2003b). GC/TOF-MS can also be operated with high mass resolution (0.02 -0.05 Da) with slower scan rates (2-10 scans/sec). It has had more limited applicability for pesticide analysis (Cajka et al., 2004), however with new designs that include a dynamic range enhancement (DRE) the limitations of saturation at high ion concentrations have been overcome (Leandro et al., 2007). GC/TOF-MS is most often used for fast-eluting peaks and for applications such as comprehensive two-dimensional gas chromatography (GC X GC) analysis of pesticides (Zrostlikova et al., 2003b) but has received much less attention than other GC or LC applications. In these multiresidue analysis applications unit resolution is used with fast scan rates to allow multiresidue screening by GC X GC/MS full scan (50-500 m/z) utilizing spectra library matching in EI mode (Dasgupta et al, 2010). A 5 μL DMI injection has also been used with GC/TOF-MS analysis of pesticides utilizing peak deconvolution and library searching software for isolation of the analyte peaks from matrix components (de Koning et al., 2003). With this smaller DMI injection size and for the list of pesticides under their study the temperature for solvent venting step was set to 50°C with a shorter solvent vent time of 120 sec. Utilizing DMI with GC/TOF-MS is a dual approach of reducing matrix interferences by firstly reducing the amount of matrix introduced into the GC/MS system and secondly utilizing MS spectral library matching ability of TOF-MS. Keeping the upper limit of injector temperature to that just necessary to volatilize analytes also keeps the non-volatile material in the DMI microvial and consequently reduced demands on mass spectral resolution.
3.2 LC/MS/MS methods
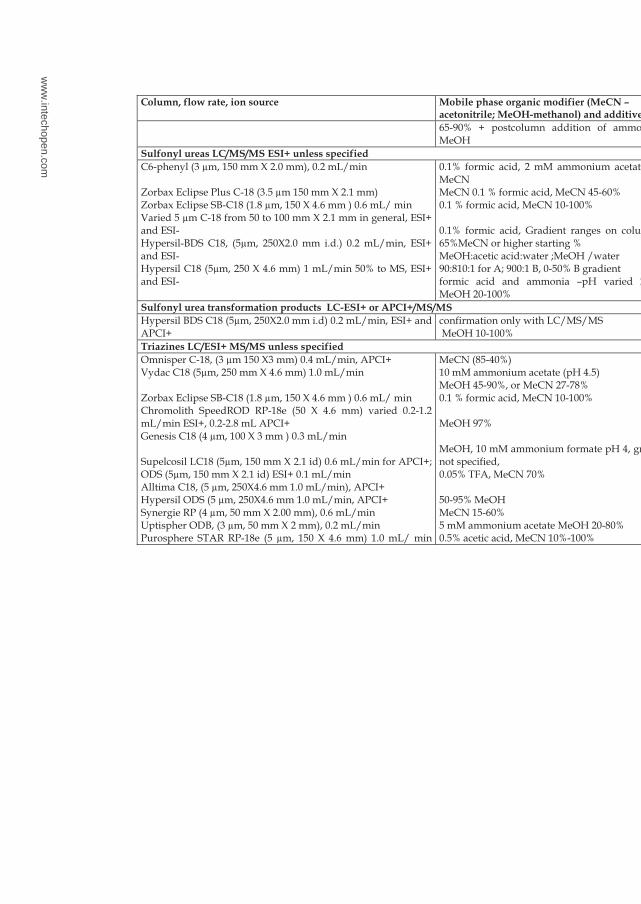
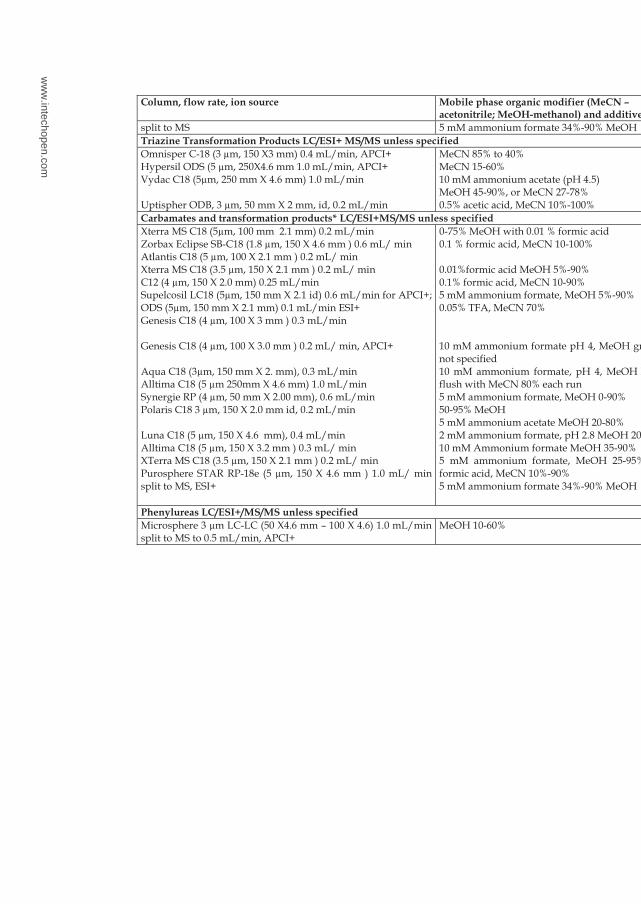
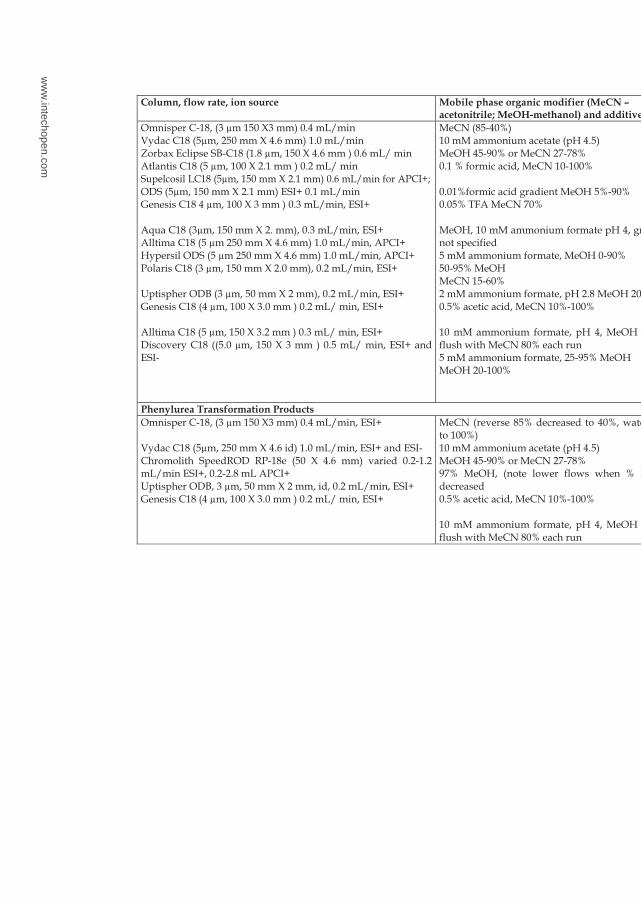
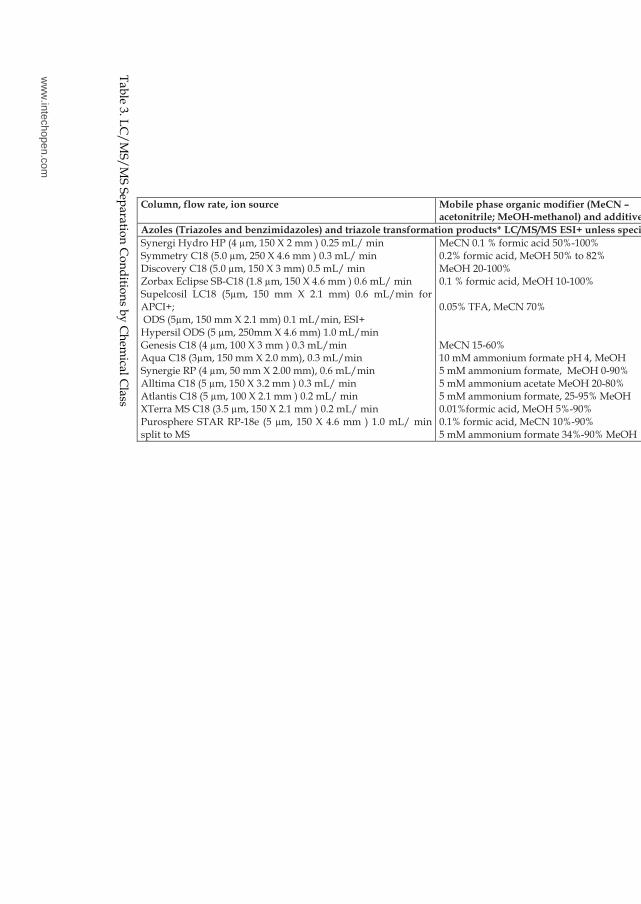
LC/MS/MS continues to gain popularity in use for pesticide analysis with most applications focused on non-GC amenable compounds, thermolabile, polar and non-volatile pesticides. Some chemical classes such as phenoxyacids herbicides, triazines, OPs, chloroacetanilides, and pyrethroids can be analyzed by both GC/MS and LC/MS/MS. For phenoxacid herbicides and carbamates LC/MS/MS is regarded as more favourable as it does not require a derivatization step prior to analysis. The use of LC/MS/MS over GC/MS for the chemical classes listed in Table 3 may also be done in order to achieve reduced analysis time by utilizing a multiresidue LC/MS/MS method covering a range of target pesticides from different chemical classes. However the key reason for choosing LC/MS/MS over GC/MS is the need to deal with more polar chemical classes of pesticides and increasingly for the simultaneous analysis of their transformation products.
www.intechopen.com
Pesticides - Strategies for Pesticides Analysis
116
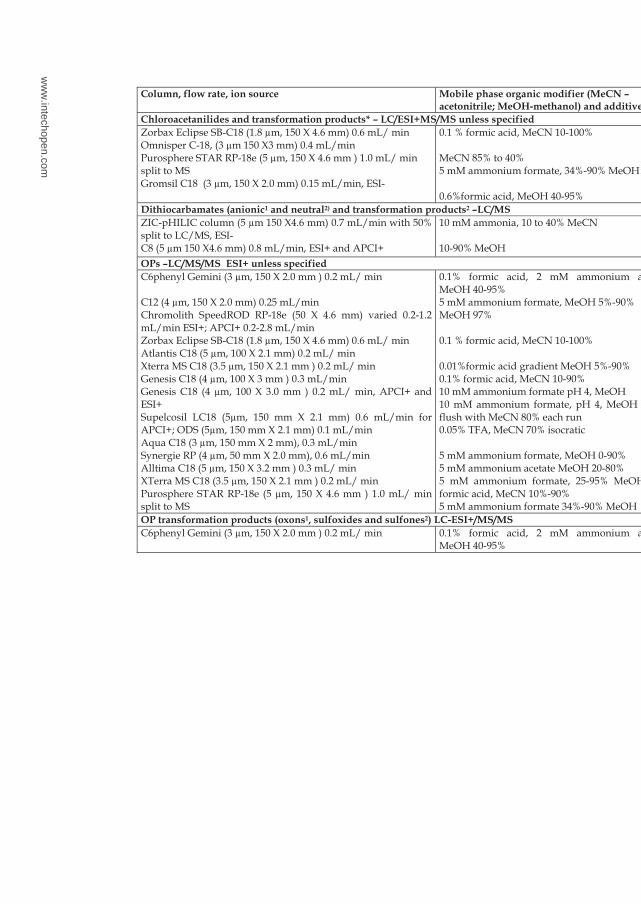
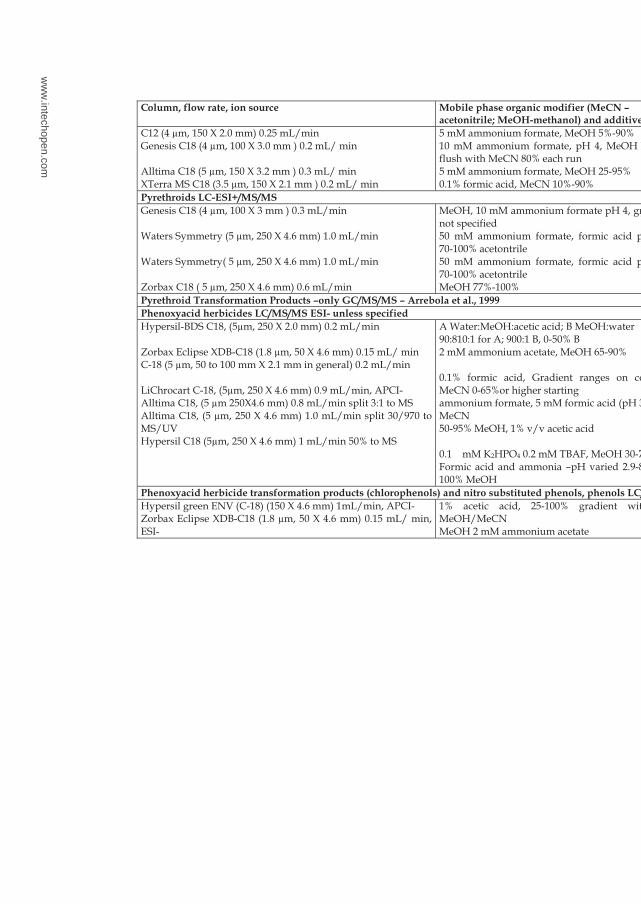
Transformation products are often more polar and less volatile than their parent compounds and generally have poor chromatographic performance on nonpolar GC columns or are thermolabile. Transformation products many also require derivatization to make them GC amenable for some of these chemical classes as discussed previously. Even for LC/MS/MS methods the large difference in polarity between parent pesticide and transformation product may require different separation conditions or ion source (mode) for adequate sensitivity making development of simultaneous methods challenging. The use of LC/MS/MS for pesticide residue analysis has focused on systems with atmospheric pressure ionization (API) either atmospheric pressure chemical ionization (APCI) or electrospray ionization (ESI) either in positive or negative mode. Many LC/MS/MS methods are multiresidue analysis methods and have been done for a target list of pesticides requiring analysis for regulatory purposes. Both APCI or ESI have been used for multiresidue methods with ESI+ the most popular as shown in Table 3. Direct comparisons of the sensitivity of APCI and ESI are often not available or not under the same chromatographic conditions. In addition, often regulatory requirements can be met with both approaches with similar MDLs for many pesticides observed under optimal conditions (Titato et al., 2007; Thurman et al., 2001). The design and operational parameters of individual API ion sources can also lead to varying results between the sensitivity of ESI versus APCI and consequently should be evaluated for the system under use and expected flow rate conditions. Table 3 shows that flow rate conditions for the separation are an important consideration as ESI is generally most sensitive at lower flow rates typically near 0.2 mL/min and consequently it may be desire to utilize smaller particle size (2-3µm) LC/MS columns however the reduction in sample loading capacity should also be consider (Asperger et al., 2001; Titato et al.,2007). If using higher flow rate conditions for the separation on columns (5µm, 150 to 250 mm X 4.6 mm) then the flow is generally split prior to MS (Banerjee et al., 2009; Crescenzi et al., 1995; Di Corcia et al., 2000). APCI is most often operated under high flow rates 1-2 mL/min (Table 3) and optimal flow varies with chemical class (Asperger et al., 2001; Titato et al., 2007). OPs are distinctly different and require lower flow rates for optimal sensitivity with APCI (Asperger et al., 2001; Jansson et al., 2004; Titato et al, 2004). Even if sensitivity is better with the more popular ESI methods there may be preference to use APCI for some chemical classes (OPs, chloracetanildes, pyrethroids, phenoxyacid herbicides, carbamates) to take advantage of other factors which include the following: (1) APCI is generally less prone to sodium adduct formation that ESI; (2) APCI can be less prone to matrix impacts as compared to ESI (Souverian et al., 2004); and (3) in some cases the SRM transition can differ from ESI so that co-eluting peaks can be isolated with MS/MS thereby reducing chromatographic resolution needs (see Table 3). As a general rule the choice of positive or negative mode depends upon polarity and acidity of analytes and sample matrix impacts. In general, ESI- is more sensitive for phenoxyacid herbicides and their transformation products (Raina and Etter, 2010; Koppen et al., 1998; Dijkman et al., 2001) and chloroacetanilide transformation products; ESI+ for sulfonylureas, phenylureas, N-methylcarbamates, organophosphorus pesticides (Cessna et al., 2006; Degenhardt et al., 2010; Hernandez et al., 2006; Steen et al., 1999; Raina and Sun, 2008); APCI+ for triazines (Dagnac et al., 2005; Jeannot et al., 2000); and APCI+ or ESI+ for chloroacetanilides (Dagnac et al., 2005; Ferrer et al., 2007; Banerjee et al., 2009). It should be noted that phenoxyacid herbicides have been analyzed with APCI- (Puig et al., 1997); sulfonylureas, phenylureas, carbamates, OPs with APCI+ (see Table 3); triazines with ESI+ (Dagnac et al., 2005; Jeannot et al., 2005); and for methods where acidic pesticides are
www.intechopen.com
Chemical Analysis of Pesticides Using G
C/MS, G
C/MS/M
S, and LC/MS/M
S
117
C – NCeM( reifidom cinagro esahp eliboM ecruos noi ,etar wolf ,nmuloacetonitrile; MeOH-methanol) and additive
Reference
Chloroacetanilides and transformation products* – LC/ESI+MS/MS unless specified
Zorbax Eclipse SB-C18 (1.8 µm, 150 X 4.6 mm) 0.6 mL/ min Omnisper C-18, (3 µm 150 X3 mm) 0.4 mL/min Purosphere STAR RP-18e (5 µm, 150 X 4.6 mm ) 1.0 mL/ min split to MS Gromsil C18 (3 µm, 150 X 2.0 mm) 0.15 mL/min, ESI-
0.1 % formic acid, MeCN 10-100% MeCN 85% to 40% 5 mM ammonium formate, 34%-90% MeOH 0.6%formic acid, MeOH 40-95%
Ferrer et al ., 2007 Dagnac et al., 2005 Banerjee et al., 2009 Gomides Freitas, 2004*
Dithiocarbamates (anionic1 and neutral2) and transformation products2 –LC/MS
ZIC-pHILIC column (5 µm 150 X4.6 mm) 0.7 mL/min with 50% split to LC/MS, ESI- C8 (5 µm 150 X4.6 mm) 0.8 mL/min, ESI+ and APCI+
10 mM ammonia, 10 to 40% MeCN 10-90% MeOH
Crnogorac et al ., 20071
Blasco and Pico, 20042
OPs –LC/MS/MS ESI+ unless specified
C6phenyl Gemini (3 µm, 150 X 2.0 mm ) 0.2 mL/ min C12 (4 µm, 150 X 2.0 mm) 0.25 mL/min Chromolith SpeedROD RP-18e (50 X 4.6 mm) varied 0.2-1.2 mL/min ESI+; APCI+ 0.2-2.8 mL/min Zorbax Eclipse SB-C18 (1.8 µm, 150 X 4.6 mm) 0.6 mL/ min Atlantis C18 (5 µm, 100 X 2.1 mm) 0.2 mL/ min Xterra MS C18 (3.5 µm, 150 X 2.1 mm ) 0.2 mL/ min Genesis C18 (4 µm, 100 X 3 mm ) 0.3 mL/min Genesis C18 (4 µm, 100 X 3.0 mm ) 0.2 mL/ min, APCI+ and ESI+ Supelcosil LC18 (5µm, 150 mm X 2.1 mm) 0.6 mL/min for APCI+; ODS (5µm, 150 mm X 2.1 mm) 0.1 mL/min Aqua C18 (3 µm, 150 mm X 2 mm), 0.3 mL/min Synergie RP (4 µm, 50 mm X 2.0 mm), 0.6 mL/min Alltima C18 (5 µm, 150 X 3.2 mm ) 0.3 mL/ min XTerra MS C18 (3.5 µm, 150 X 2.1 mm ) 0.2 mL/ min Purosphere STAR RP-18e (5 µm, 150 X 4.6 mm ) 1.0 mL/ min split to MS
0.1% formic acid, 2 mM ammonium acetate, MeOH 40-95% 5 mM ammonium formate, MeOH 5%-90% MeOH 97% 0.1 % formic acid, MeCN 10-100% 0.01%formic acid gradient MeOH 5%-90% 0.1% formic acid, MeCN 10-90% 10 mM ammonium formate pH 4, MeOH 10 mM ammonium formate, pH 4, MeOH 0-90%, flush with MeCN 80% each run 0.05% TFA, MeCN 70% isocratic 5 mM ammonium formate, MeOH 0-90% 5 mM ammonium acetate MeOH 20-80% 5 mM ammonium formate, 25-95% MeOH 0.1% formic acid, MeCN 10%-90% 5 mM ammonium formate 34%-90% MeOH
Raina and Sun, 2008 Chung and Chan, 2010 Asperger et al., 2001 Ferrer et al., 2007 Hernandez et al., 2006 Botitsi et al., 2007 Pihlstrom et al., 2007 Jansson et al. , 2004 Titato et al ., 2007 Paya et al. , 2007 Muller et al ., 2007 Hiemstra et al. 2007 Economou et al., 2009 Banerjee et al 2009
OP transformation products (oxons1, sulfoxides and sulfones2) LC-ESI+/MS/MS
C6phenyl Gemini (3 µm, 150 X 2.0 mm ) 0.2 mL/ min
0.1% formic acid, 2 mM ammonium acetate, MeOH 40-95%
Raina and Sun, 20081
ww
w.intechopen.com
Pesticides - Strategies for Pesticides Analysis
118
C – NCeM( reifidom cinagro esahp eliboM ecruos noi ,etar wolf ,nmuloacetonitrile; MeOH-methanol) and additive
Reference
C12 (4 µm, 150 X 2.0 mm) 0.25 mL/min Genesis C18 (4 µm, 100 X 3.0 mm ) 0.2 mL/ min Alltima C18 (5 µm, 150 X 3.2 mm ) 0.3 mL/ min XTerra MS C18 (3.5 µm, 150 X 2.1 mm ) 0.2 mL/ min
5 mM ammonium formate, MeOH 5%-90% 10 mM ammonium formate, pH 4, MeOH 0-90%, flush with MeCN 80% each run 5 mM ammonium formate, MeOH 25-95% 0.1% formic acid, MeCN 10%-90%
Chung and Chan, 20102
Jansson et al., 20042
Hiemstra et al., 20072
Economou et al., 20092
Pyrethroids LC-ESI+/MS/MS
Genesis C18 (4 µm, 100 X 3 mm ) 0.3 mL/min Waters Symmetry (5 µm, 250 X 4.6 mm) 1.0 mL/min Waters Symmetry( 5 µm, 250 X 4.6 mm) 1.0 mL/min Zorbax C18 ( 5 µm, 250 X 4.6 mm) 0.6 mL/min
MeOH, 10 mM ammonium formate pH 4, gradient not specified 50 mM ammonium formate, formic acid pH 3.5, 70-100% acetontrile 50 mM ammonium formate, formic acid pH 3.5, 70-100% acetontrile MeOH 77%-100%
Pihlstrom et al., 2007 Martinez et al., 2006 Gil-Garcia et al., 2006 Chen et al., 2007
Pyrethroid Transformation Products –only GC/MS/MS – Arrebola et al., 1999
Phenoxyacid herbicides LC/MS/MS ESI- unless specified
Hypersil-BDS C18, (5µm, 250 X 2.0 mm) 0.2 mL/min Zorbax Eclipse XDB-C18 (1.8 µm, 50 X 4.6 mm) 0.15 mL/ min C-18 (5 µm, 50 to 100 mm X 2.1 mm in general) 0.2 mL/min LiChrocart C-18, (5µm, 250 X 4.6 mm) 0.9 mL/min, APCI- Alltima C18, (5 µm 250X4.6 mm) 0.8 mL/min split 3:1 to MS Alltima C18, (5 µm, 250 X 4.6 mm) 1.0 mL/min split 30/970 to MS/UV Hypersil C18 (5µm, 250 X 4.6 mm) 1 mL/min 50% to MS
A Water:MeOH:acetic acid; B MeOH:water 90:810:1 for A; 900:1 B, 0-50% B 2 mM ammonium acetate, MeOH 65-90% 0.1% formic acid, Gradient ranges on column, MeCN 0-65%or higher starting ammonium formate, 5 mM formic acid (pH 3), 40% MeCN 50-95% MeOH, 1% v/v acetic acid 0.1 mM K2HPO4 0.2 mM TBAF, MeOH 30-75% Formic acid and ammonia –pH varied 2.9-8.4, 20-100% MeOH
Koppen et al., 1998 Raina and Etter, 2010 Dijkman et al., 2001 Santos et al., 2000 Baglio et al., 1999 Crescenzi et al. ,1995 Di Corcia et al., 2000
Phenoxyacid herbicide transformation products (chlorophenols) and nitro substituted phenols, phenols LC/MS/MS
Hypersil green ENV (C-18) (150 X 4.6 mm) 1mL/min, APCI- Zorbax Eclipse XDB-C18 (1.8 µm, 50 X 4.6 mm) 0.15 mL/ min, ESI-
1% acetic acid, 25-100% gradient with 1:1 MeOH/MeCN MeOH 2 mM ammonium acetate
Puig et al. , 1997 Raina and Etter, 2010
ww
w.intechopen.com
Chemical Analysis of Pesticides Using G
C/MS, G
C/MS/M
S, and LC/MS/M
S
119
C – NCeM( reifidom cinagro esahp eliboM ecruos noi ,etar wolf ,nmuloacetonitrile; MeOH-methanol) and additive
Reference
65-90% + postcolumn addition of ammonia in MeOH
Sulfonyl ureas LC/MS/MS ESI+ unless specified
C6-phenyl (3 µm, 150 mm X 2.0 mm), 0.2 mL/min Zorbax Eclipse Plus C-18 (3.5 µm 150 mm X 2.1 mm) Zorbax Eclipse SB-C18 (1.8 µm, 150 X 4.6 mm ) 0.6 mL/ min Varied 5 µm C-18 from 50 to 100 mm X 2.1 mm in general, ESI+ and ESI- Hypersil-BDS C18, (5µm, 250X2.0 mm i.d.) 0.2 mL/min, ESI+ and ESI- Hypersil C18 (5µm, 250 X 4.6 mm) 1 mL/min 50% to MS, ESI+ and ESI-
0.1% formic acid, 2 mM ammonium acetate, 35% MeCN MeCN 0.1 % formic acid, MeCN 45-60% 0.1 % formic acid, MeCN 10-100% 0.1% formic acid, Gradient ranges on column, 0-65%MeCN or higher starting % MeOH:acetic acid:water ;MeOH /water 90:810:1 for A; 900:1 B, 0-50% B gradient formic acid and ammonia –pH varied 2.9-8.4, MeOH 20-100%
Degenhardt et al., 2010 Fang et al., 2010 Ferrer et al ., 2007 Dijkman et al., 2001, Koppen et al., 1998 Di Corcia et al ., 2000
Sulfonyl urea transformation products LC-ESI+ or APCI+/MS/MS
Hypersil BDS C18 (5µm, 250X2.0 mm i.d) 0.2 mL/min, ESI+ and APCI+
confirmation only with LC/MS/MS MeOH 10-100%
Bossi et al., 1999
Triazines LC/ESI+ MS/MS unless specified
Omnisper C-18, (3 µm 150 X3 mm) 0.4 mL/min, APCI+ Vydac C18 (5µm, 250 mm X 4.6 mm) 1.0 mL/min Zorbax Eclipse SB-C18 (1.8 µm, 150 X 4.6 mm ) 0.6 mL/ min Chromolith SpeedROD RP-18e (50 X 4.6 mm) varied 0.2-1.2 mL/min ESI+, 0.2-2.8 mL APCI+ Genesis C18 (4 µm, 100 X 3 mm ) 0.3 mL/min Supelcosil LC18 (5µm, 150 mm X 2.1 id) 0.6 mL/min for APCI+; ODS (5µm, 150 mm X 2.1 id) ESI+ 0.1 mL/min Alltima C18, (5 µm, 250X4.6 mm 1.0 mL/min), APCI+ Hypersil ODS (5 µm, 250X4.6 mm 1.0 mL/min, APCI+ Synergie RP (4 µm, 50 mm X 2.00 mm), 0.6 mL/min Uptispher ODB, (3 µm, 50 mm X 2 mm), 0.2 mL/min Purosphere STAR RP-18e (5 µm, 150 X 4.6 mm) 1.0 mL/ min
MeCN (85-40%) 10 mM ammonium acetate (pH 4.5) MeOH 45-90%, or MeCN 27-78% 0.1 % formic acid, MeCN 10-100% MeOH 97% MeOH, 10 mM ammonium formate pH 4, gradient not specified, 0.05% TFA, MeCN 70% 50-95% MeOH MeCN 15-60% 5 mM ammonium acetate MeOH 20-80% 0.5% acetic acid, MeCN 10%-100%
Dagnac et al ., 2005 Steen et al.,1999 Ferrer et al .,2007 Asperger et al., 2001 Pihlstrom et al., 2007 Titato et al .,2007 Baglio et al., 1999 Jeannot et al., 2000 Muller et al., 2007 Bichon et al ., 2006
ww
w.intechopen.com
Pesticides - Strategies for Pesticides Analysis
120
C – NCeM( reifidom cinagro esahp eliboM ecruos noi ,etar wolf ,nmuloacetonitrile; MeOH-methanol) and additive
Reference
9002 ,.la te eejrenaB HOeM %09-%43 etamrof muinomma Mm 5 SM ot tilps
Triazine Transformation Products LC/ESI+ MS/MS unless specified
Omnisper C-18 (3 µm, 150 X3 mm) 0.4 mL/min, APCI+ Hypersil ODS (5 µm, 250X4.6 mm 1.0 mL/min, APCI+ Vydac C18 (5µm, 250 mm X 4.6 mm) 1.0 mL/min Uptispher ODB, 3 µm, 50 mm X 2 mm, id, 0.2 mL/min
MeCN 85% to 40% MeCN 15-60% 10 mM ammonium acetate (pH 4.5) MeOH 45-90%, or MeCN 27-78% 0.5% acetic acid, MeCN 10%-100%
Dagnac et al., 2005 Jeannot et al., 2000 Steen et al., 1999 Bichon et al., 2006
Carbamates and transformation products* LC/ESI+MS/MS unless specified
Xterra MS C18 (5µm, 100 mm 2.1 mm) 0.2 mL/min Zorbax Eclipse SB-C18 (1.8 µm, 150 X 4.6 mm ) 0.6 mL/ min Atlantis C18 (5 µm, 100 X 2.1 mm ) 0.2 mL/ min Xterra MS C18 (3.5 µm, 150 X 2.1 mm ) 0.2 mL/ min C12 (4 µm, 150 X 2.0 mm) 0.25 mL/min Supelcosil LC18 (5µm, 150 mm X 2.1 id) 0.6 mL/min for APCI+; ODS (5µm, 150 mm X 2.1 mm) 0.1 mL/min ESI+ Genesis C18 (4 µm, 100 X 3 mm ) 0.3 mL/min Genesis C18 (4 µm, 100 X 3.0 mm ) 0.2 mL/ min, APCI+ Aqua C18 (3µm, 150 mm X 2. mm), 0.3 mL/min Alltima C18 (5 µm 250mm X 4.6 mm) 1.0 mL/min Synergie RP (4 µm, 50 mm X 2.00 mm), 0.6 mL/min Polaris C18 3 µm, 150 X 2.0 mm id, 0.2 mL/min Luna C18 (5 µm, 150 X 4.6 mm), 0.4 mL/min Alltima C18 (5 µm, 150 X 3.2 mm ) 0.3 mL/ min XTerra MS C18 (3.5 µm, 150 X 2.1 mm ) 0.2 mL/ min Purosphere STAR RP-18e (5 µm, 150 X 4.6 mm ) 1.0 mL/ min split to MS, ESI+
0-75% MeOH with 0.01 % formic acid 0.1 % formic acid, MeCN 10-100% 0.01%formic acid MeOH 5%-90% 0.1% formic acid, MeCN 10-90% 5 mM ammonium formate, MeOH 5%-90% 0.05% TFA, MeCN 70% 10 mM ammonium formate pH 4, MeOH gradient not specified 10 mM ammonium formate, pH 4, MeOH 0-90%, flush with MeCN 80% each run 5 mM ammonium formate, MeOH 0-90% 50-95% MeOH 5 mM ammonium acetate MeOH 20-80% 2 mM ammonium formate, pH 2.8 MeOH 20-85% 10 mM Ammonium formate MeOH 35-90% 5 mM ammonium formate, MeOH 25-95% 0.1% formic acid, MeCN 10%-90% 5 mM ammonium formate 34%-90% MeOH
Goto et al., 2006* Ferrer et al., 2007* Hernandez et al, 2006 Botitsi et al., 2007* Chung and Chan, 2010
Titato et al ., 2007 Pihlstrom et al., 2007 Jansson et al., 2004* Paya et al., 2007 Baglio et al., 1999 Muller et al., 2007 Martinez Vidal et al., 2005 Pico and Kozmutza, 2007* Hiemstra et al., 2007 Economou et al., 2009 Banerjee et al., 2009
Phenylureas LC/ESI+/MS/MS unless specified
Microsphere 3 µm LC-LC (50 X4.6 mm – 100 X 4.6) 1.0 mL/min split to MS to 0.5 mL/min, APCI+
MeOH 10-60%
Van der Heeft et al., 2000
ww
w.intechopen.com
Chemical Analysis of Pesticides Using G
C/MS, G
C/MS/M
S, and LC/MS/M
S
121
C – NCeM( reifidom cinagro esahp eliboM ecruos noi ,etar wolf ,nmuloacetonitrile; MeOH-methanol) and additive
Reference
Omnisper C-18, (3 µm 150 X3 mm) 0.4 mL/min Vydac C18 (5µm, 250 mm X 4.6 mm) 1.0 mL/min Zorbax Eclipse SB-C18 (1.8 µm, 150 X 4.6 mm ) 0.6 mL/ min Atlantis C18 (5 µm, 100 X 2.1 mm ) 0.2 mL/ min Supelcosil LC18 (5µm, 150 mm X 2.1 mm) 0.6 mL/min for APCI+; ODS (5µm, 150 mm X 2.1 mm) ESI+ 0.1 mL/min Genesis C18 4 µm, 100 X 3 mm ) 0.3 mL/min, ESI+ Aqua C18 (3µm, 150 mm X 2. mm), 0.3 mL/min, ESI+ Alltima C18 (5 µm 250 mm X 4.6 mm) 1.0 mL/min, APCI+ Hypersil ODS (5 µm 250 mm X 4.6 mm) 1.0 mL/min, APCI+ Polaris C18 (3 µm, 150 mm X 2.0 mm), 0.2 mL/min, ESI+ Uptispher ODB (3 µm, 50 mm X 2 mm), 0.2 mL/min, ESI+ Genesis C18 (4 µm, 100 X 3.0 mm ) 0.2 mL/ min, ESI+ Alltima C18 (5 µm, 150 X 3.2 mm ) 0.3 mL/ min, ESI+ Discovery C18 ((5.0 µm, 150 X 3 mm ) 0.5 mL/ min, ESI+ and ESI-
MeCN (85-40%) 10 mM ammonium acetate (pH 4.5) MeOH 45-90% or MeCN 27-78% 0.1 % formic acid, MeCN 10-100% 0.01%formic acid gradient MeOH 5%-90% 0.05% TFA MeCN 70% MeOH, 10 mM ammonium formate pH 4, gradient not specified 5 mM ammonium formate, MeOH 0-90% 50-95% MeOH MeCN 15-60% 2 mM ammonium formate, pH 2.8 MeOH 20-85% 0.5% acetic acid, MeCN 10%-100% 10 mM ammonium formate, pH 4, MeOH 0-90%, flush with MeCN 80% each run 5 mM ammonium formate, 25-95% MeOH MeOH 20-100%
Dagnac et al., 2005 Steen et al., 1999 Ferrer et al., 2007 Hernandez et al., 2006 Titato et al ., 2007 Pihlstrom et al., 2007 Paya et al., 2007 Baglio et al., 1999 Jeannot et al., 2000 Vidal et al., 2005 Bichon et al., 2006 Jansson et al., 2004 Hiemstra et al., 2007 Zrostlikova et al. 2003
Phenylurea Transformation Products
Omnisper C-18, (3 µm 150 X3 mm) 0.4 mL/min, ESI+ Vydac C18 (5µm, 250 mm X 4.6 id) 1.0 mL/min, ESI+ and ESI- Chromolith SpeedROD RP-18e (50 X 4.6 mm) varied 0.2-1.2 mL/min ESI+, 0.2-2.8 mL APCI+ Uptispher ODB, 3 µm, 50 mm X 2 mm, id, 0.2 mL/min, ESI+ Genesis C18 (4 µm, 100 X 3.0 mm ) 0.2 mL/ min, ESI+
MeCN (reverse 85% decreased to 40%, water 15% to 100%) 10 mM ammonium acetate (pH 4.5) MeOH 45-90% or MeCN 27-78% 97% MeOH, (note lower flows when % MeOH decreased 0.5% acetic acid, MeCN 10%-100% 10 mM ammonium formate, pH 4, MeOH 0-90%, flush with MeCN 80% each run
Dagnac et al ., 2005 Steen et al ., 1999 Asperger et al., 2001 Bichon et al., 2006 Jansson et al., 2004
ww
w.intechopen.com
Pesticides - Strategies for Pesticides Analysis
122
C – NCeM( reifidom cinagro esahp eliboM ecruos noi ,etar wolf ,nmuloacetonitrile; MeOH-methanol) and additive
Reference
Azoles (Triazoles and benzimidazoles) and triazole transformation products* LC/MS/MS ESI+ unless specified
Synergi Hydro HP (4 µm, 150 X 2 mm ) 0.25 mL/ min Symmetry C18 (5.0 µm, 250 X 4.6 mm ) 0.3 mL/ min Discovery C18 (5.0 µm, 150 X 3 mm) 0.5 mL/ min Zorbax Eclipse SB-C18 (1.8 µm, 150 X 4.6 mm ) 0.6 mL/ min Supelcosil LC18 (5µm, 150 mm X 2.1 mm) 0.6 mL/min for APCI+; ODS (5µm, 150 mm X 2.1 mm) 0.1 mL/min, ESI+ Hypersil ODS (5 µm, 250mm X 4.6 mm) 1.0 mL/min Genesis C18 (4 µm, 100 X 3 mm ) 0.3 mL/min Aqua C18 (3µm, 150 mm X 2.0 mm), 0.3 mL/min Synergie RP (4 µm, 50 mm X 2.00 mm), 0.6 mL/min Alltima C18 (5 µm, 150 X 3.2 mm ) 0.3 mL/ min Atlantis C18 (5 µm, 100 X 2.1 mm ) 0.2 mL/ min XTerra MS C18 (3.5 µm, 150 X 2.1 mm ) 0.2 mL/ min Purosphere STAR RP-18e (5 µm, 150 X 4.6 mm ) 1.0 mL/ min split to MS
MeCN 0.1 % formic acid 50%-100% 0.2% formic acid, MeOH 50% to 82% MeOH 20-100% 0.1 % formic acid, MeOH 10-100% 0.05% TFA, MeCN 70% MeCN 15-60% 10 mM ammonium formate pH 4, MeOH 5 mM ammonium formate, MeOH 0-90% 5 mM ammonium acetate MeOH 20-80% 5 mM ammonium formate, 25-95% MeOH 0.01%formic acid, MeOH 5%-90% 0.1% formic acid, MeCN 10%-90% 5 mM ammonium formate 34%-90% MeOH
Trosken et al., 2005 Schermerhorn et al., 2005* Zrostlikova et al., 2003 Ferrer et al., 2007 Titato et al., 2007 Jeannot et al ., 2000 Pihlstrom et al., 2007, Paya et al. , 2007 Muller et al., 2007 Hiemstra et al., 2007 Hernandez et al., 2006 Economou et al., 2009 Banerjee et al, 2009
Table 3. L
C/
MS/
MS Sep
aration Cond
itions by Chem
ical Class
ww
w.intechopen.com
Chemical Analysis of Pesticides Using GC/MS, GC/MS/MS, and LC/MS/MS
123
analyzed separately from neutrals the sulfonylureas along with phenoxyacid herbicides are analyzed together with ESI- (Dijkman et al., 2001; Koppen et al., 1998; Di Corcia et al., 2000). Similarly triazines and atrazine metabolites may be done with ESI+ rather than APCI+ due to the diversity and sensitivity of ESI+ for other chemical classes that are analyzed simultaneously with only a small loss in sensitivity. Common co-elution problems that must be resolved prior to detection exist for a number pesticides either within the same chemical class or for multi-class residue methods. Table 3 shows the vast majority of LC/MS/MS methods utilize C18 columns in order to achieve the desired selectivity for the separation. A few separations have taken advantage of different selectivity from ZIC-pHILIC, C6-phenyl, C8, or C12 (Raina and Sun, 2008; Degenhardt et al., 2010; Crnogorac et al., 2007; Blasco and Pico, 2004). In general methods provide the necessary resolution for compounds with the same SRM transitions. For chloracetanilides care must be taken with ESI+ as acetochlor, metalochlor, and alachlor can co-elute and acetochlor and alachlor which both have molecular mass of 269.5 g/mol have the same precursor ions with ESI+ (m/z 270 or 292) from [M+H]+ and [M+Na]+ (Dagnac et al., 2005; Ferrer et al., 2007). This can be resolved by adequate chromatographic resolution prior to detection or switching to APCI + where in addition to monitoring [M+H]+ for both the 224 and 256 precusor ion can be monitored for acetochlor, while for alachlor 162 and 238 can be monitored (Dagnac et al., 2005). Phenoxyacid herbicides and sulfonylureas also require adequate chromatographic resolution. Niocsulfuron, ethametsulfuron-methyl, bensulfuron-methyl have a similar parent ion (411.2, 411.8, 411.5) but can be separated using C6-phenyl column (Degenhardt et al., 2010). With ESI- the phenoxy acid herbicides MCPA, mecoprop, MCPB have a common confirmation SRM transition of 140.9 > 105.2 which is also the quantitative SRM for degradation product, chloromethylphenol. In addition, 2,4-D, dichlorprop, and 2,4-DB also have the sample confirmation SRM of 160.9 > 124.7 which is also the quantitative SRM for dichlorophenol (Raina and Etter, 2010). Separated of these phenyoxyacid herbicides can be achieved using a short C18 column with methanol gradient and mobile phase containing 2 mM ammonium acetate (Raina and Etter, 2010). The list of pesticides that are required for screening or quantitative analysis and those potentially present in samples should determine your requirements for detection and separation. Degradation products by LC/MS/MS such as more chlorophenols (degradation products of phenoxyacid herbicides) and nitrophenols are move sensitive with ESI-, while other phenols are more sensitive with APCI (Reesmtsma et al., 2003; Raina and Etter, 2010). However these chloro and nitrophenols have also been analyzed successfully by APCI (Silgoner et al., 1997). OP degradation products including 3,5,6-trichloro-2-pyridinol, diethyl phosphate, 2-isopropyl-6-methyl-4-pyrimidinol, malathion monocarboxylic acid, and OPoxons (Raina and Sun, 2008) as well as OP sulfones and sulfoxides (Jansson et al, 2004; Chung and Chang, 2010, Hiemstra et al., 2007; Economou et al, 2009) are more sensitive with LC-ESI+/MS/MS and some OPs observe a drastic loss in sensitivity with an APCI source at high flow rates (Asperger et al., 2001). Degradation products of triazines and phenylureas have been done by LC-APCI+/MS/MS but for triazines lower MDLs can be achieved with GC-EI/MS/MS (Dagnac et al., 2005; Goncalves et al., 2006). Diuron and its degradates 3,4-dichlorophenyurea and 2,4-dichlorophenylurea also observed better sensitivity in methanol compared to acetonitrile mobile phases and switching the organic modifier has greater impact for these degradation products when using ESI+ than ESI- (Steen et al., 1999). Chloroacetanilide metabolites have been analyzed by LC-ESI-/MS/MS (Gomides Freitas et al., 2004). LC-ESI+/MS/MS has also been used for analysis of a number of carbamate and
www.intechopen.com
Pesticides - Strategies for Pesticides Analysis
124
azole degradation products the most common of which for carbamates are aldicarb sulfone and sulfoxide, and 3-hydroxycarbofuran (Goto et al., 2006; Ferrer et al., 2007; Botitsi et al., 2007; Jansson et al., 2004; Pico and Kuzmutza, 2007; Schermerhorn et al., 2005). A more extensitive list of dithiocarbamates and their transformation products have only been analyzed using LC/MS methods (Crnogorac et al., 2007; Blasco and Pico, 2004) with triallate routinely analyzed by GC/MS methods. Transformation products of pyrethroids currently have no LC/MS or LC/MS/MS. Selection of the organic modifier (generally methanol or acetonitrile), and the presence or absence of formic or acetic acid, and salts can greatly impact the ionization of a pesticide and its sensitivity. Some pesticides have the potential to form sodium or ammonium adducts in positive ion mode, or acetate or formate adducts in negative ion mode with an API source. The formation of adducts decreases the abundance of the protonated or deprotonated molecular ion and there is greater potential for adduct formation with ESI than APCI. In general positive ion mode is more prone to adduct formation than negative ion mode. Methanol mobile phases have a higher degree of adduct formation particularly for sodium adducts relative to acetonitrile although many pesticides see better ionization in methonal than acetonitrile. The formation of sodium adducts in mobile phases with methanol can be reduced or suppressed by the addition of ammonium or hydrogen ions. The most common additives for this purpose are ammonium acetate (2-10 mM), ammonia, acetic acid (1%), formic acid (0.05-.2 v/v%), or trifluoroacetic acid (TFA, 0.05 v/v%) (see Table 3). The impact of adjustment of the pH of the mobile phase on chromatographic resolution for closely eluting pesticides with the same SRM transitions or parent ions should be considered along with the impact of changing pH on sensitivity particularly for acidic pesticides (Raina and Etter, 2010). In practice a balance must be met between separation needs and MS sensitivity for the range of pesticides and transformation products under study and can vary significantly even for those of the same chemical class. Table 3 shows that there is a large diversity in additives and organic solvent used even within the same chemical class. For OPs ESI+ is superior and generally [M+H]+ is observed as the parent ion even in mobile phases only containing methanol. The presence of both ammonium and formic acid was shown to give optimal sensitivity or OPs, OP oxons, and other OP transformation products (Raina and Sun, 2008). For OP sulfone and sulfoxide transformation products sodium adducts can form in mobile phases containing only methanol or methanol with formic acid. Switching either to acetonitrile with formic acid or addition of a salt such as ammonium formate (or ammonium acetate) suppresses the formation of adducts (Hiemstra et al., 2007; Economou et al., 2009; Jansson et al., 2004; Raina and Sun, 2008; Muller et al., 2007). Individual phenylureas and carbamates are also more likely to form sodium adducts as compared to triazines. Aldicarb, 3-hydroxycarbofuran, aldicarb sulfone, and aldicarb sulfoxide form sodium adducts in a methanol mobile phase with 0.01% formic acid (Hernandez et al., 2006). Switching to acetonitrile reduces adduct formation for the sulfone and sulfoxide of aldicarb but aldicarb is still present as sodium adduct (Botitsi et al., 2007). Addition of ammonium formate (Pihlström et al., 2007; Pico and Kozmutza, 2007) or ammonium acetate leads to suppression or reduction in the formation of the sodium adduct. Depending upon the ammonium ion concentration aldicarb may form the ammonium adduct (Pico and Kozmutza, 2007) as well as oxamyl (Pihlström et al., 2007). In a mobile phase of methanol with 5 mM ammonium formate, methiocarb sulfone and ethiocarb sulfone both form the ammonium adduct as well as the protonated molecular ion with SRM transitions of 275→122 and 258→122 for methiocarb sulfone and 275 →107 and 258→107 for
www.intechopen.com
Chemical Analysis of Pesticides Using GC/MS, GC/MS/MS, and LC/MS/MS
125
ethiocarb sulfone (Hiemstra and de Kok, 2007). Aldicarb does not form [M+H]+ under most mobile phase conditions so either [M+Na]+ (213→116 or 213→89) or [M+NH4]+ (208 →116 or 208→89) are used for SRM transition under the proper mobile phase conditions (Table 3). Other carbamates generally form [M+H]+ regardless of mobile phase composition. With ESI+ the most commonly monitored phenylureas produce [M+H]+ under varying mobile phase conditions and the mass selected may be utilizing 35 or 37 Cl isotopes. A few phenylureas such as isoproturon and chlortoluron can form sodium adducts and consequently ammonium formate or ammonium acetate may be added to the mobile phase (Table 3). Often these additives are required more for other chemical classes that are analyzed along with the phenylureas such as carbamates. The more commonly analyzed phenylureas such as diuron and linuron do not require addition of additives. Phenylureas sensitivity is impacted by the organic solvent selected with methanol having significant improved response in ESI+ for phenylureas and their degradation products (Steen et al., 1999). In addition, the use of a higher percentage of methanol to achieve the desired separation conditions also improves sensitivity for both for ESI+ and ESI- as sensitivity improves with the percentage of organic modifier. The reduction in signal intensity for the degradation products when switching organic modifier to acetonitrile was not as great in ESI- (Steen et al., 1999). For chloracetanilides and phenylureas using APCI also reduces potential for sodium adduct formation (Dagnac et al., 2005). Sulfonylureas also observe predominately [M+H]+ but can form sodium adducts as has been observed for sulfometuron-methyl with ESI+ with acetonitrile-aqueous 0.1%formic acid mobile phase (Dijkman et al., 2001). Consequently separation conditions generally contain both 0.1% formic acid and 2 mM ammonium acetate (Degenhardt et al., 2010) and if an organic modifier is used it is generally acetonitrile as shown in Table 3. In negative ion mode adduct formation is not observed. For phenoxy acid herbicides the presence of formic acid will result in decreased abundance of [M-H]- (Raina and Etter, 2010) while for many neutral pesticide chemical classes it will improve the ionization so typically is added at ~0.1-0.2 v/v%. For phenoxyacid herbicides methanol is generally choosen as the organic modifier as it improves the efficiency of ionization and the sensitivity improvement relative to acetonitrile mobile phases ranges from 3-5 orders of magnitude (Raina and Etter, 2010). OPs and their degradation product signal intensity is also much better with methanol (Raina and Sun, 2008) and it has been shown as the % of methanol increases the signal intensity improves as was also observed for phenylureas (Steen et al., 1999). This suggests an advantage in using gradient elutions with methanol rather than acetonitrile for these pesticides as a higher percentage of organic solvent will be required to achieve the same chromatographic resolution during the separation. Users must also be aware of particularly for gradient elution whether the pesticides of interest are soluble over the range of mobile phase conditions for the separation. For some chemical classes or multi-residue analysis gradient elution programs will start at a very low percentage of methanol or acetonitrile and peak broadening or distortion and even carry-over and increasing MS background signal may be observed. Reduced sensitivity and reproducibility over time may become apparent due to low solubility of some of the analytes in mobile phases of high aqueous content. For these challenging chemical classes which are more prone to build-up a flushing step with high concentration of acetonitrile is used prior to re-equilibration of the column to reduce carry-over issues. A number of LC/ESI+MS methods for pyrethroids have been developed (Chen and Chen, 2007; Gil-Garcia et al., 2006; Martinez et al., 2006) which have comparable MDLs to GC/EI-
www.intechopen.com
Pesticides - Strategies for Pesticides Analysis
126
MS methods (Yoshida, 2009). For halogenated pyrethroids GC/NCI-MS provides the best sensitivity (Feo et al., 2010). These methods have largely focused on LC/MS where either the protonated molecular ion or ammonia adduct are predominately observed in mobile phases containing ammonium acetate or formate (Table 3). There is little structural information available and only a few multi-residue LC/MS/MS methods contain selected pyrethroids (Pihlstrom et al., 2007). In addition, the only available methods for analysis of pyrethroid metabolites currently require derivatization with GC/MS analysis. There are a number of approaches that have been used to further improve sensitivity of LC/MS/MS methods. When separation needs do not permit changes in mobile phase composition to improve MS sensitivity then alternatively post-column reagents may be added using an additional pump (Raina and Etter, 2010; Carabias-Martinez et al., 2004) at lower flow rates (eg 50 µL/min) such that the total flow is still optimal for the ESI or APCI used for the analysis. Bases have been used as post-column reagents to enhance ionization including ammonia, trimethylamine, tris(hydroxymethyl) aminomethane, and 1,8-diazabicyclo-(5,4,0) undec-7-en (Raina and Etter, 2010; Carabais-Martinez et al., 2004; Marchese et al., 2002; Gomides Freitas et al., 2004). This approach has been used to improve the sensitivity of transformation products of phenoxyacid herbicides with ammonia in methanol (Raina and Etter, 2010). Reagent addition should consider the change in solvent composition as this may also alter sensitivity with most pesticides observing enhanced sensitivity with higher percentages of organic modifiers such as methanol. Similar to GC/MS methods large volume injections have also been used for LC/MS/MS applications although not specifically for pesticides. Direct on-column loop injection of 2 mL of water samples to a standard C18 column with LC/APCI+MS/MS achieved sub-µg/L range detection (Speksnijder et al., 2010). For urine samples an on-line LC-MS approach was used where the sample is pumped into the LC system and diluted through a mixing Tee with ammonium acetate after which it is loaded onto a restricted access material (RAM) pre-column while the analytical column equilibrates. The analytes of interest are then back-flushed to transfer them to the analytical column followed by a typical gradient elution (Liu et al., 2008). The use of the RAM pre-column enables matrix removal of proteins as it retains only low molecular weight analytes. Matrix effects with API sources can lead to suppression or enhancement of analyte response due to co-eluting matrix constituents (Niessen et al., 2006). The choice of solvent used in extraction procedures can reduce matrix impacts with ethylacetate or acetonitrile often preferred for QuEChERS methods. If matrix suppression/enhancement can not be eliminated by sample preparation procedures prior to LC/MS/MS then deuterium or carbon-C13 labeled internal calibrations should be used for stable isotope dilution. If sufficient levels are available sample dilution or infinite dilution (matrix-free solution) can be utilized with typical dilution factors of 0.05 or 0.025 (Kruve et al., 2009). UV detection can also be utilized to identify co-eluting matrix issues requiring improvements in chromatography which can be achieved either with other column choices or comprehesive LCXLC (Hajšlová and Zrostíková, 2003). LC/TOF-MS has also gained considerable interest for confirmation of pesticides or transformation products with exact mass measurements for those applications where LC/MS/MS may not have the required sensitivity from the confirmation SRM transition (Portolés et al., 2009; Kuster et al., 2009). Pesticides such as aldicarb, diuron, linuron, aldicarb sulfone and sulfoxide can be distinguished and quantified by exact mass measurements with mean error of 2.3 ppm (Maizels and Budde, 2001).
www.intechopen.com
Chemical Analysis of Pesticides Using GC/MS, GC/MS/MS, and LC/MS/MS
127
4. Conclusion
GC/MS, GC/MS/MS, LC/MS/MS, and in some cases LC/MS methods are required to cover the full range of pesticide chemical classes and their transformation products. No one method can meet the needs of all the current pesticide chemical classes. There are also a number of chemical classes including phenoxyacid herbicides, pyrethroids, triazines, acetanilides, and azoles with both GC and LC methods coupled to mass spectrometry which may meet the needs of users. GC/MS or GC/MS/MS multiresidue methods with NCI are recommended for use with OCs, most OC transformation products, trihalomethylthio fungicides, and if a wide range of OPs require analysis for the best sensitivity and selectivity. Pyrethroids are recommended to be done with GC/EI-MS methods for those which are not chlorinated and for their derivatized degradation products. NCI may be also used for added sensitivity and selectivity for those pyrethroids that are halogenated. When developing GC/MS multiresidue methods it is also essential to have a GC/EI-MS method which is more suitable for acetanilides, triazines, atrazine transformation products, some OCs and a few OP pesticides. For some pesticides or transformation products the second confirmation ion or SRM transition may not be sensitive enough and both NCI SIM and NCI SRM methods or NCI and EI SIM methods may be required. If sufficient sample concentration is available then EI SRM methods may also be useful for a wide range of these pesticides. If sample concentrations are lower but added confirmation beyond these methods is required then GC/TOF-MS or GCXGC/TOF-MS is an alternative. In general it is not recommended to analyze azoles with GC/MS methods due to often higher detection limits as compared to LC/MS/MS methods and thermal instability. As a strategy LC/MS/MS methods should be utilized for carbamates, phenylureas, sulfonyl ureas, azoles, and transformation products from these chemical classes. If a laboratory desires to minimize the need for derivatization then phenoxyacid herbicides and their degradation products can also be accomplished by LC/MS/MS and postcolumn reagent addition can be used if added sensitivity is required for the chlorophenol transformation products. If a multiresdiue LC/MS/MS method is developed for these pesticide classes then the inclusion of chloroacetanilides, triazines, and transformation products from these chemical classes should also be considered. As with GC/MS methods, one ionization method can not be utilized for all chemical classes for LC/MS/MS methods and matrix impacts should be assessed to determine if there is an advantage in utilizing an alternative ionization mode to minimize impacts from interferences. For example one may consider analyzing sulfonylureas and acetanilide transformation products with phenoxyacid herbicides with LC/ESI-MS/MS, while analyzing phenylureas, carbamates, azoles, chloroacetanilides, triazines, OPs and transformation products of OPs, carbamates, and some sulfonylureas by LC/ESI+MS/MS, or LC/APCI+MS/MS method for triazines, phenylurea and their transformation products for best sensitivity. LC/APCI+/MS/MS can also be used to resolve matrix issues or co-elution problems for OPs, chloroacetanilides, phenylureas, carbamates, triazines, sulfonyl ureas (if phenoxyacid analysis is not required). Inclusion of transformation products will likely be the largest factor in selection of multiple methods with ESI and APCI in positive and negative mode as some transformation products require alternative ionization methods from that used for parent pesticides for adequate sensitivity. In addition the dithiocarbamates with the exception of triallate which can be included with standard GC/MS methods should be done with separate LC/MS methods either for anionic or neutral dithiocarbamates and their transformation products. Although their analysis
www.intechopen.com
Pesticides - Strategies for Pesticides Analysis
128
requires a separate LC/MS method this is a significant improvement over prior GC methods that were not specific to individual dithiocarbamates and were laborious. If no GC/MS methods are necessary then pyrethroids may be included in LC methods. Currently the advantages of new column choices, GCXGC or LCXLC, large volume injections, on-column clean-up, post-column reagent addition, and TOF-MS are underutilized to resolve matrix and confirmation needs and should be considered in future method development.
5. References
Albanis, T.A.; hela, D.G.; Sakellarides, T.M.; Konstantinou I.K. (1998). J. Chromatogr. A, 823, 59-71.
Alder, L.; Gruelich, K.; Kempe, G.; Vieth, B. (2006). Mass Spectrometry Reviews, 25, 838-865. Arrebola, F.J.; Martínez Vidal, J.L.; Fernández-Gutiérrez, A.; Akhtar, M.H. (1999). Anal.
Chim. Acta, 401, 45-54. Asperger, A.; Efer, J.; Koal, T.; Engewald, W. (2001). J. Chromatogr. A, 937, 65-72. Baglio, D.; Kotzias, D.; Larsen, B.R. (1999). J. Chromatogr. A, 854, 207-220. Bailey (Raina), R. (2005). J. Environ. Monitor., 7, 1054-1058 Bailey (Raina), R.; Belzer, W. (2007). J. Agric. Food Chem., 55, 1150-1155. Banerjee, K.; Oulkar, D.P.; Patil, S.B.; Jadhav, M.R.; Dasgupta, S.; Patil, S.H.; Bal, S.; Adsule,
P.G. (2009). J. Agric. Food Chem., 57, 4068-4078. Bichon, E.; Dupuis, M.; Le Bizec, B.; André, F. (2006). J. Chromatogr. A, 838, 96-106. Bossi, R.; Vejrup, K.; Jacobsen, C.S. (1999). J. Chromatogr. A, 855, 575-582. Botitsi, H.; Economou, A.; Tsipi, D. (2007). Anal. Bioanal. Chem., 389, 1685-1695. Cajka, T.; Hajslova, J.; Lacina, O.; Mastovska, K.; Lehotay, S.J. (2004). J. Chromatogr. A, 1058,
251-261. Carabis-Martinez, R.; Rodriguez-Gonzalo, E.; Revilla-Ruiz, P. (2004). J. Chromatogr. A, 1056,
131-138. Cessna, A. J.; Donald, D.B.; Bailey, J.; Waiser, M.; Headley, J.V. (2006). J. Environ. Qual., 35,
2395-2401. Charlton, A.J.A., Stuckey, V.; Sykes, M.D. (2009). Bull Environ. Contam. Toxicol., 82, 711-715 Chen, T.; Chen, G. (2007). Rapid Commun. Mass Spectrom., 21 (12), 1848-1854. Chung, S.W.C.; Chan, B.T.P. (2010). J. Chromatogr. A, 1217, 4815-4824. Corcia, A. D.; Nazzari, M.; Rao, R.; Samperi, R.; Sebastiani, E. (2000). J. Chromatogr. A, 878,
87-98. Crescenzi, C.; Corcia, A.D.; Marchese, S.; Samperi, R. (1995). Anal. Chem., 67, 1968-1975. Crnogorac, G.; Schwack, W. (2007). Rapid Commun. Mass Spectrom., 21, 4009-4016. Cunha, S.C.; Lehotay, S.J.; Mastovska, K.; Fernandes, J.O.; Beatriz, M.; Oliveira, P.P. (2007). J.
Sep. Sci., 30, 620-632. Dagnac, T,; Bristeau, S.; Jeannot, R.; Mouvet, C.; Baran, N. (2005). J. Chromatogr. A, 1067, 225-
233. Dasgupta, S.; Banerjee, K.; Patil, S.H.; Ghaste, M.; Dhumal, K.N.; Assule, P.G. (2010). J
Chromatogr. A, 1217, 3881-3889. Degenhardt, D.; Cessna, A.J.; Raina, R.; Pennock, D.J.; Farenhorst, A. (2010). J. Environ. Sci.
Health, Part B, 45, 11-24. de Koning, S.; Lach, G.; Linkerhägner, M.; Löscher, R.; Tablack, P.H.; Brinkman, U. A. Th.
(2003). J Chromatogr. A, 1008, 247-252.
www.intechopen.com
Chemical Analysis of Pesticides Using GC/MS, GC/MS/MS, and LC/MS/MS
129
Dijkman, E.; Mooibroek, D.; Hoogerbrugge, R.; Hogendoorn, E.; Sancho, J.-V.; Pozo, O.; Hernández, F. (2001). J. Chromatogr. A, 926, 113-125.
Economou, A.; Botitsi, H.; Antoniou, S.; Tsipi, D. (2009). J. Chromatogr. A, 1216, 5856-5867. Feo, M.L.; Eljarrat, E.; Barceló, D. (2010). J. Chromatogr. A, 1217, 2248-2253. Ferrer, I.; Thurman, E.M.; Zweigenbaum, J.A. (2007). Rapid Commun. Mass Spectrom., 21,
3869-3882. Gabaldón, J. A.; Cascales J.M.; Maquieira, A.; Puchades, R. (2002). J. Chromatogr. A, 963, 125-
136. Godula, M.; Hajšlová, J.; Maštouska, K.; Křivánková, J. (2001). J. Sep. Sci., 24, 355-366. Gonçalves, C.; Carvalho, J.J.; Azenha, M.A.; Alpendurada, M.F. (2006). J. Chromatogr. A,
1110, 6-14. Gil-García, M.D.; Barranco-Martinez, D.; Martinez-Galera, M.; Parrilla-Vázquez, P. (2006).
Rapid Commun. Mass Spectrom., 20 (16), 2395-2403. Gomides Freitas, L.; Götz, C.W.; Ruff, M.; Singer, H.P.; Müller, S.R. (2004). J. Chromatogr. A,
1028, 277-286. Goto, T.; Ito, Y.; Yamada, S.; Matsumoto, H.; Oka, H.; Nagase, H. (2006). Anal. Chim. Acta,
555, 225-232. Grob, K.; Li, Z. (1988). J. High Resolut. Chrom., 11, 626-632. Hajšlová, J.; Zrostíková, J. (2003). J. Chromatogr. A, 1000, 181-197. Henriksen, T.; Svensmark, B.; Lindhardt, B.; Juhler, R.K. (2001). Chemosphere, 44, 1531-1539. Hernández, F.; Pozo, O.J.; Sancho, J.V.; Barreda, M.; Pitarch, E. (2006). J. Chromatogr. A, 1109,
242-252. Hiemstra, M.; de Kok, A. (2007). J. Chromatogr. A, 1154, 3-25. Hogenboom, A.C.; Niessen, W.M.A.; Brinkman, U.A. Th. (2001). J. Sep. Sci., 24, 331-354. Húšková, R.; Matisová, E.; Švorc, L.; Mocák, J.; Kirchner, M. (2009). J. Chromatogr. A, 4927-
4932. Jansson, C.; Pihlström, T.; Österdahl, B.-G.; Markides, K.E. (2004). J. Chromatogr. A, 2004,
1023, 93-104. Jeannot, R.; Sabik, H.; Sauvard, E.; Genin, E. (2000). J. Chromatogr. A, 879, 51-71. Jiang, H.; Adams, C.D.; Koffskey, W. (2005). J. Chromatogr. A, 1064, 219-226. Kirchner, M.; Matisová, E.; Otrekal, R.; Hercegová, A.; de Zeeuw, J. (2005). J. Chromatogr. A,
1084, 63-70. Køppen, B.; Spliid, N.H. (1998). J. Chromatogr. A, 803, 157-168. Kuster, M.; de Alda, M.L.; Barceló, D. (2009). J. Chromatogr. A, 1216, 520-529. Lambropoulou, D.A.; Albanis, T.A. (2007). Anal. Bioanal. Chem., 389, 1663-1683. Leandro, C.C.; Hancock, P.; Fussell, R.J.; Keely B.J. (2007). J. Chromatogr. A, 1166, 152-162 Liapis, K.S.; Aplada-Sarlis, P.; Kyriakidis, N.V. (2003). J. Chromatogr. A, 996, 181-187. Maizels, M.; Budde, W.L. (2001). Anal. Chem., 73, 5436-5440. Marchese, S. Perret, D.; Gentili, A.; D’Ascenzo, G.; Faberi, A. (2002). Rapid Commun. Mass
Spectrom., 16, 134-141. Martínez Vidal, J.L.; Garrido Frenich, A.; López López, T.; Martínez Salvador, I.; Hajjaj el
Hassani, L.; Hassan Benajiba, M. (2005). Chromatographia, 61 (3/4), 127-131. Martínez, D.B.; Parrilla Vázquez, P.; Martínez Galera M.; Gil García, M.D. (2006)
Chromatographia, 63 (9/10), 487-491. Müller, A.; Flottmann, D.; Schulz, W.; Seitz, W.; Weber, W.H. (2007). Clean, 35(4), 329-338. Nagaraju, D.; Huang, S.-D. (2007). J. Chromatogr. A, 1161, 89-97.
www.intechopen.com
Pesticides - Strategies for Pesticides Analysis
130
Nilsson, T; Baglio, D.; Galdo-Miguez, I.; Madsen J.O.; Facchette, S. (1998). J. Chromatogr. A, 826, 211-216.
Payá, P.; Anastassiades, M.; Mack, D.; Sigalova, I.; Tasdelen, B.; Oliva, J.; Barba, A. (2007). Anal. Bioanal. Chem., 389, 1697-1714.
Pico, Y.; Kozmutaz, C. (2007). Anal. Bioanal. Chem., 389, 1805-1814. Pihlström, T.; Blomkvist, G.; Friman, P.; Pagard, U.; Österdahl, B.-G. (2007). Anal. Bioanal.
Chem., 389, 1773-1789. Planas, C.; Puig, A.; Rivera, J.; Caixach, J. (2006). J. Chromatogr. A, 1131, 242-252. Portolés, T.; Ibáñez, M.; Sancho, J.V.; López, F.J.; Hernández, F. (2009). J. Agric. Food Chem.,
57, 4079-4090. Puig, D.; Silgoner, I.; Grasserbauer, M.; Barceló, D. (1997). Anal. Chem., 69, 2756-2761. Raina, R.; Sun, L. (2008). J. Environ. Sci. Health, Part B, 43, 323-332. Raina, R.; Hall, P. (2009). Anal. Chem. Insights, 3, 111-125. Raina, R.; Etter, M.L. (2010). Anal. Chem. Insights, 5, 1-14. Reesmtsma, T. (2003). J. Chromatogr. A, 1000, 2003, 477-501. Rimmer, D.A.; Johnson, P.D., Brown, R.H. (1996) J. Chromatogr. A, 755, 245-250. Santos, T.C. R.; Rocha, J.C.; Barceló, D. (2000). J. Chromatogr. A, 879, 3-12. Schermerhorn, P.G.; Golden, P.E.; Krynitsky, A.J.; Leimkuehler, W.M. (2005). J. AOAC
International, 88 (5), 1491-1502. Shin, H.-S. (2006). Chromatographia, 63, 579-583. Souverian, S.; Rudaz, S.; Veuthey, J.-L. (2004). J. Chromatogr. A, 1058, 61-66. Steen, R.J.C.A.; Hogenboom, A.C.; Leonards, P.E.G.; Peerboom, R.A.L.; Cofino, W.P.;
Brinkman U.A.Th. (1999). J. Chromatogr. A, 857, 157-166. Thurman, E.M.; Ferrer, I.; Baceló, D. (2001). Anal. Chem., 73, 5441-5449. Thurman, E.M.; Ferrer, I.; Pozo, O.J.; Sancho, J.V.; Hernandez, F. (2007). Rapid Commun. Mass
Spectrom., 21, 3855-3868. Titato, G.M.; Bicudo, R.C.; Lanças, F.M. (2007). J. Mass Spectrom., 42, 1348-1357. Trösken, E.R.; Bittner, N.; Völkel, W. (2005). J. Chromatogr. A, 1083, 113-119. Van der Heeft, E.; Dijkman, E.; Baumann, R.A.; Hogendoorn, E.A. (2000). J. Chromatogr. A,
879, 39-50. Yoshida, T. (2009). J. Chromatogr. A, 1216, 5069-5076. Zambonin, C.G.; Palmisano, F. (2000). J. Chromatogr. A, 874, 247-255. Zang, J.; Lee, H.K. (2006). J. Chromatogr. A, 1117, 31-37. Zrostlíková, J.; Hajšlová, J.; Kovalczuk, T.; Štĕpán, R.; Poustka, J. (2003a). J. AOAC
International, 86 (3), 612-622. Zrostlíková, J.; Hajšlová, J.; Čajka, T. (2003b). J. Chromatogr. A, 1019, 173-186.
www.intechopen.com
Pesticides - Strategies for Pesticides AnalysisEdited by Prof. Margarita Stoytcheva
ISBN 978-953-307-460-3Hard cover, 404 pagesPublisher InTechPublished online 21, January, 2011Published in print edition January, 2011
InTech EuropeUniversity Campus STeP Ri Slavka Krautzeka 83/A 51000 Rijeka, Croatia Phone: +385 (51) 770 447 Fax: +385 (51) 686 166www.intechopen.com
InTech ChinaUnit 405, Office Block, Hotel Equatorial Shanghai No.65, Yan An Road (West), Shanghai, 200040, China
Phone: +86-21-62489820 Fax: +86-21-62489821
This book provides recent information on various analytical procedures and techniques, representingstrategies for reliability, specificity, selectivity and sensitivity improvements in pesticides analysis. The volumecovers three main topics: current trends in sample preparation, selective and sensitive chromatographicdetection and determination of pesticide residues in food and environmental samples, and the application ofbiological (immunoassays-and biosensors-based) methods in pesticides analysis as an alternative to thechromatographic methods for "in situ" and "on line" pesticides quantification. Intended as electronic edition,providing immediate "open access" to its content, the book is easy to follow and will be of interest toprofessionals involved in pesticides analysis.
How to referenceIn order to correctly reference this scholarly work, feel free to copy and paste the following:
Renata Raina (2011). Chemical Analysis of Pesticides Using GC/MS, GC/MS/MS, and LC/MS/MS, Pesticides -Strategies for Pesticides Analysis, Prof. Margarita Stoytcheva (Ed.), ISBN: 978-953-307-460-3, InTech,Available from: http://www.intechopen.com/books/pesticides-strategies-for-pesticides-analysis/chemical-analysis-of-pesticides-using-gc-ms-gc-ms-ms-and-lc-ms-ms

© 2011 The Author(s). Licensee IntechOpen. This chapter is distributedunder the terms of the Creative Commons Attribution-NonCommercial-ShareAlike-3.0 License, which permits use, distribution and reproduction fornon-commercial purposes, provided the original is properly cited andderivative works building on this content are distributed under the samelicense.