CHELTENHAM BOROUGH COUNCIL - GOV.UK
18
1 CHELTENHAM BOROUGH COUNCIL TARGETED FEASIBILITY STUDY TO DELIVER NITROGEN DIOXIDE CONCENTRATION COMPLIANCE IN THE SHORTEST POSSIBLE TIME Local authorities covered Cheltenham Borough Council Further information on the content of each section is set out in the guidance. Part 1: Understanding the problem The directive applies to one road link, census ID: 77985, which is projected to exceed the limit value for NO2. The road link in question forms part of the A40, running from the B4063 at Arle Court Roundabout to the A4013 at Princess Elizabeth Way Roundabout on the western side of Cheltenham, and is shown in Map 1 below. This section of the A40 connects Cheltenham town centre to the M5 at Junction 10 and beyond to Gloucester. The link is approximately 800m long.
Transcript of CHELTENHAM BOROUGH COUNCIL - GOV.UK

1
CHELTENHAM BOROUGH COUNCIL
TARGETED FEASIBILITY STUDY TO DELIVER NITROGEN DIOXIDE CONCENTRATION COMPLIANCE IN THE SHORTEST POSSIBLE TIME
Local authorities covered Cheltenham Borough Council
Further information on the content of each section is set out in the
guidance.
Part 1: Understanding the problem
The directive applies to one road link, census ID: 77985, which is projected to exceed the limit value for NO2. The road link in question forms part of the A40, running from the B4063 at Arle Court Roundabout to the A4013 at Princess Elizabeth Way Roundabout on the western side of Cheltenham, and is shown in Map 1 below. This section of the A40 connects Cheltenham town centre to the M5 at Junction 10 and beyond to Gloucester. The link is approximately 800m long.

2
Map 1: Satellite map identifying A40 with Census ID 77985 between B4063 and A4013
Pollution Climate Modelling (PCM) Results predict the following NO2 concentrations:
2017 43 µg/m3
2018 41 µg/m3
2019 40 µg/m3
2020 38 µg/m3
2021 36 µg/m3
These results show that the road link is expected to comply with guideline limits from the end of 2018. Map 1 below identifies the A40 with Census ID 77985 and other major roads in Cheltenham, and as the colour code demonstrates, the road is projected to comply by the beginning of 2019.
Map 2: A40 with Census ID 77985 identifying other major roads and compliance year
No margin of error is quoted with the PCM figures. The computer model relies largely on apportionment data for traffic using the link and appears not to account for surrounding topography on what is an open site with buildings set back by at least 15m from the carriageway.
This feasibility study considers measures to bring forward compliance with the 40 µg/m3 limit as quickly as possible, i.e. before the end of December 2018. To achieve this target NO2 concentrations need to be reduced by 1 µg/m3 over the rest of 2018. A reduction this marginal could be adversely affected by weather and local factors beyond the control of Cheltenham Borough Council (such as roadworks and local construction). Conversely, this change is so marginal that it might be achieved without intensive transport or air quality interventions. The later parts of this study will evaluate the likely impact of a short list of measures to provide evidence as to the efficacy of a preferred option or package. DEFRA’s Joint Air Quality Unit (JAQU) has already identified the possibility that it might not be possible to introduce a measure to achieve compliance in a shorter time than that predicted by the PCM. The authority will examine the evidence from
3
this study before reaching an informed conclusion.
Local data relating to apportionment is not available, and it is not realistic to collect reliable data in the timeframe available for completing this report, hence we quote the apportionment data reported for the PCM model, as follows:
Regional background 5%
Urban background (non-traffic) 7%
Urban background (traffic) 8%
Diesel cars 23%
Petrol cars 9%
Diesel LGVs 17%
Petrol LGVs 0%
HGV (rigid) 8%
HGV (articulated) 4%
Buses 5%
The most significant influence on road traffic on this link is believed to be the GCHQ “Doughnut” buildings, which are served by a junction roughly at mid-point. This complex houses approximately 6,000 staff and has extensive car parks, which are full to capacity 5 days a week, so it is probable that this site is the single biggest specific trip generator on the stretch of road in exceedance. Staff also park in neighbouring residential streets and at a small number of private car parks around the site. GCHQ do not publish copious information about their staff travel for security reasons, however they do publish an Environmental Policy Statement that includes a commitment to “Implementing travel plans for business and commuter travel that minimise environmental impact”.
Other employers in the vicinity of the link include the following (see Map 3 for the proximity to the link road of the key ones)
A small retail park with stores including B&Q, Pets At Home and Home Bargains
Asda
Pure Office (General purpose office accommodation).
Nuffield Hospital.
Hotels: Travelodge and Jury’s Inn at Arle Court (the latter also has a health club)
KFC Drive Thru.
Care Home at Whittington Road.
Gloucestershire College on Princess Elizabeth Way
Cotswold BMW / Mini showroom
4
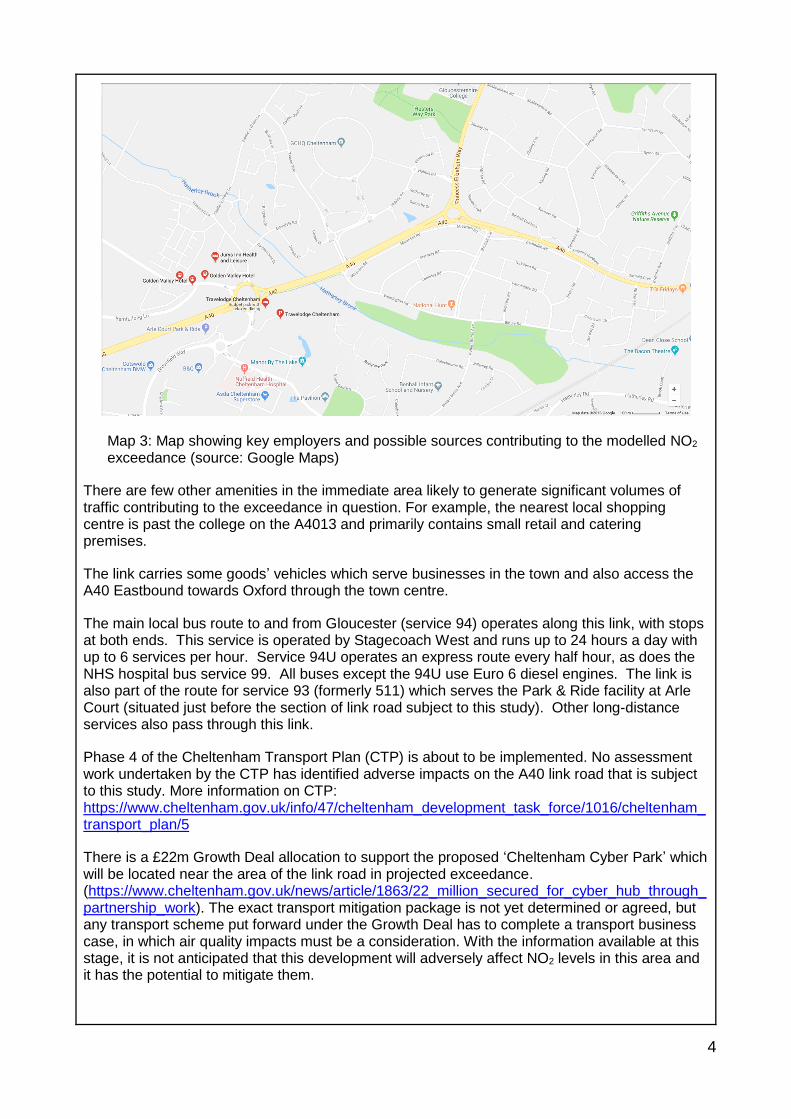
Map 3: Map showing key employers and possible sources contributing to the modelled NO2 exceedance (source: Google Maps)
There are few other amenities in the immediate area likely to generate significant volumes of traffic contributing to the exceedance in question. For example, the nearest local shopping centre is past the college on the A4013 and primarily contains small retail and catering premises.
The link carries some goods’ vehicles which serve businesses in the town and also access the A40 Eastbound towards Oxford through the town centre.
The main local bus route to and from Gloucester (service 94) operates along this link, with stops at both ends. This service is operated by Stagecoach West and runs up to 24 hours a day with up to 6 services per hour. Service 94U operates an express route every half hour, as does the NHS hospital bus service 99. All buses except the 94U use Euro 6 diesel engines. The link is also part of the route for service 93 (formerly 511) which serves the Park & Ride facility at Arle Court (situated just before the section of link road subject to this study). Other long-distance services also pass through this link.
Phase 4 of the Cheltenham Transport Plan (CTP) is about to be implemented. No assessment work undertaken by the CTP has identified adverse impacts on the A40 link road that is subject to this study. More information on CTP: https://www.cheltenham.gov.uk/info/47/cheltenham_development_task_force/1016/cheltenham_transport_plan/5
There is a £22m Growth Deal allocation to support the proposed ‘Cheltenham Cyber Park’ which will be located near the area of the link road in projected exceedance. (https://www.cheltenham.gov.uk/news/article/1863/22_million_secured_for_cyber_hub_through_partnership_work). The exact transport mitigation package is not yet determined or agreed, but any transport scheme put forward under the Growth Deal has to complete a transport business case, in which air quality impacts must be a consideration. With the information available at this stage, it is not anticipated that this development will adversely affect NO2 levels in this area and it has the potential to mitigate them.
5
Based on the information in Part 1, the main activity causing emissions in the area of exceedance is from commuters travelling to and from work.
Part 2: Developing a long list of measures for addressing the exceedances
This section should provide a long list of possible measures to be considered for each
road link. Local authorities should consider the source apportionment set out in part 1.
The PCM apportionment data above indicates that the largest contributor to NO2 on this link comes from private diesel cars (23%). These are likely to be used most commonly for commuting to work and could be considered as two types of commuter – those passing through the link and those using the link to access GCHQ. The long list of measures below therefore contains measures which target reducing emissions from cars in use by commuters.
There is also a significant contribution to NO2 levels from LGVs (17%) and HGVs (12%). Clearly, there is a current need for many of these vehicles to access businesses in the wider Cheltenham area, but there may be scope for reducing the use of the link by LGVs/HGVs to pass through the town to points beyond.
Buses make up a relatively small proportion of the predicted NO2 level (5%). The use of cleaner vehicles may reduce the overall NO2 level, however, reducing the number of buses would appear counter-productive and is likely to lead to more private car use. Therefore, consideration is given to targeting bus emissions, rather than bus numbers in the long list.
Existing Measures
Implementation dates for existing measures are given where known. Measures implemented since 2015 will not be reflected in Defra’s baseline PCM modelling. None of these existing or proposed measures, or those about to be implemented, have been assessed yet to see if they have brought, or will bring, the road link into compliance. This work should be undertaken as a priority once the grant is received from Defra, in order to evidence the need for, and appropriateness of, the short list of measures and preferred final option/s.
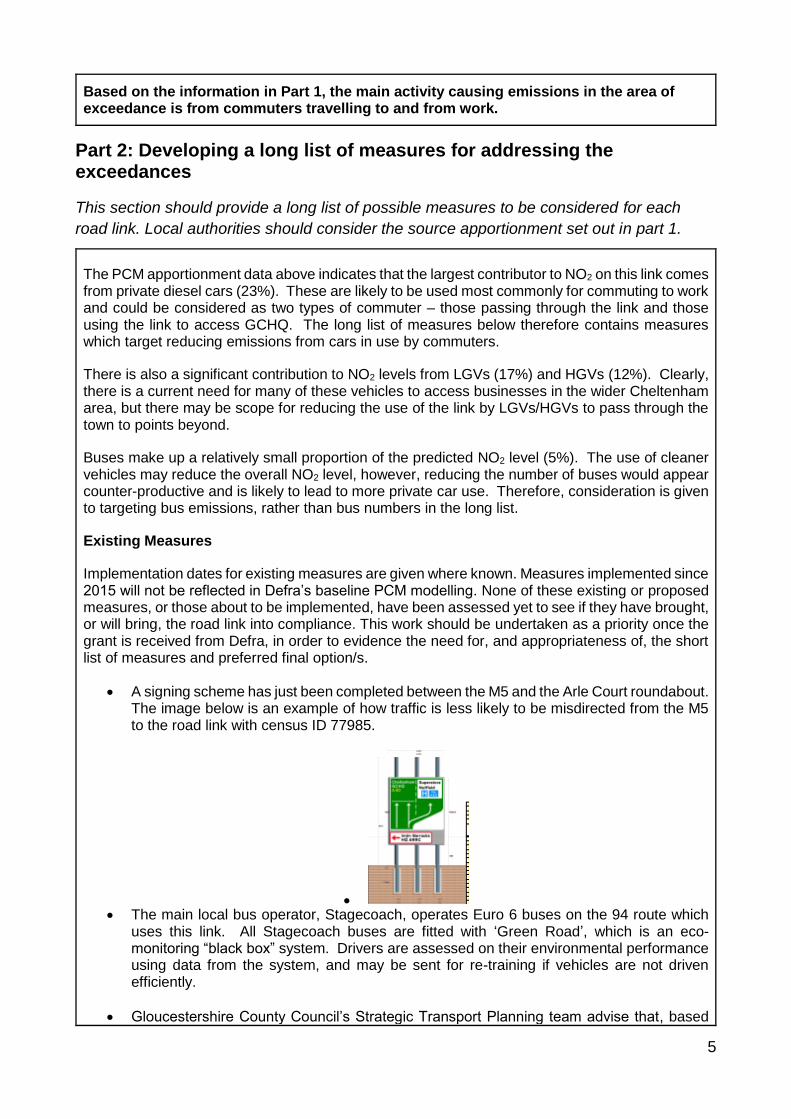
A signing scheme has just been completed between the M5 and the Arle Court roundabout. The image below is an example of how traffic is less likely to be misdirected from the M5 to the road link with census ID 77985.
The main local bus operator, Stagecoach, operates Euro 6 buses on the 94 route which
uses this link. All Stagecoach buses are fitted with ‘Green Road’, which is an eco-monitoring “black box” system. Drivers are assessed on their environmental performance using data from the system, and may be sent for re-training if vehicles are not driven efficiently.
Gloucestershire County Council’s Strategic Transport Planning team advise that, based

6
around Arle Court, the following businesses engaged with their Thinktravel programme between 2014-2016:
- Pure Offices received a travel grant to improve staff cycle facilities, but it is not known if a sustainable travel plan was subsequently developed.
- GCHQ received a travel grant to install high density staff cycle parking.
We are aware that GCHQ operates a staff travel plan which continues to help limit vehicle congestion and air pollution in the immediate vicinity of their site. Further information on the details of this plan are being sought and a meeting has been arranged between the Borough Council and GCHQ on 10th May 2018 to discuss progress and any obstacles to securing beneficial outcomes.
None of the following local employers in the nearby area have fully implemented Business Travel Plans as far as the County Council’s Strategic Transport team are aware:
Gloucestershire College (Cheltenham campus) GCHQ Travel Lodge & Pub B&Q Home Bargains Pets at Home Pure Offices Nuffield Hospital ASDA (Cheltenham) Cheltenham Film Studios & Nursery Ultra Electronics Cotswold BMW (new business development opened late 2017)
Measures that are currently being implemented, or are due to be implemented soon
Bus Lane Improvements Whittington Rd – Arle Court (Arle Court Bus Priority). (Commenced April 2018, completion due September 2018). These improvements will provide an additional westbound bus lane from Whittington Road to Arle Court roundabout. Gloucestershire County Council states “The dedicated lane will improve journey time predictability for the 2 million plus passengers each year who use the 94 bus route, as well as users of the 511 park and ride, and other services that use this busy stretch of the A40 westbound.” This initiative is part of the Elmbridge Transport Scheme. More information is available here: https://www.gloucestershire.gov.uk/roads-parking-and-rights-of-way/major-projects/arle-court-bus-priority/
Changes to existing Park & Ride at Arle Court (Implementation 2019). Changes are being introduced at the Arle Court P&R site in an attempt to prevent use by drivers who park there and work locally. This uses parking capacity intended for P&R customers, and can lead to P&R customers being turned away when all the available spaces are taken.
New service provider on Park & Ride route. Since May 2018 the Arle Court P&R route has been operated by Stagecoach, replacing the previous operator. As part of the new contract, Stagecoach is operating MMC E400 buses, fitted with cleaner Euro6 compliant engines.

7
Long List of New Measures for further consideration
These are new measures that might affect the road link with projected exceedance (with reference to the guidance, including the LAQM toolkit; CBC air quality action plan; clean air zone framework and the Director of Public Health report on outdoor air quality.
Some of the education and awareness measures (particularly workplace travel planning) could potentially achieve the required 1% reduction on their own, if it has not already been achieved by the existing or planned measures outlined above. Air Quality is a national and local priority, so it would be good practice for the county and district authority to proceed with some of the measures anyway (subject to available resources). Public Health England’s evidence review of interventions is anticipated by the end of 2018.
Workplace Travel Planning with other employers (as listed above)
Encourage ultra low emission vehicle take up (ULEV)
Review the integration of air quality as a consideration in local planning decisions.
Encourage home working and flexible working to reduce emissions at peak times
Business initiatives and incentives to move to sustainable or active transport, or home/flexible working.
Implementation of a cycle lane, promotion of cycle routes and improved links with public transport.
Promotion of Clean Air Day.
Promotion of walking.
Promotion of Arle Court P&R until capacity is reached.
Explore parking options for LEVs such as priority or reduced parking.
Promotion of Car Sharing and Travel Clubs
Installation of enforced High Occupancy Vehicle Lane.
Freight route options (by-pass / alternative “black sign” routes).
LGV / HGV Driver Training.
Local Government Fleet Leadership – review procurement and management options.
Review of Traffic Management arrangements (signal phasing).
Car Parking Strategy – for example, higher charges for diesel engines; align car parking facilities and associated restrictions with transport plans and air quality assessments.
Education campaigns through local schools and Gloucestershire College.
Review speed limits.
It is quite probable that the existing measures implemented since 2015 have already achieved the 1% reduction in NO2 required to bring forward compliance, However, the authority will take further action if this is found to be required following a review of the evidence.
Clean Air Zones (CAZs) and Low Emission Zones (LEZs) have been deliberately excluded from the long list of measures in accordance with the guidance for this study, as it is not practicable to implement longer term measures such as these within a shorter timescale than compliance is already projected to be achieved. Although there is considerable air quality evidence associated with CAZs and LEZs, this study must focus on identifying measures that are realistic and proportionate to achieve the required 1% reduction by the end of 2018.
8
Part 3: Assessing deliverability/feasibility and delivering a short list
For each of the measures identified in part 2, local authorities should set out an
assessment of deliverability including how long it would take to deliver each measure and
whether it is practicably feasible to deliver. Based on this assessment of deliverability and
feasibility, the local authority should develop a short list of measures to take forward to part
4 of the report.
Existing measures (including those currently being implemented).
As discussed in part 2 of this study, existing measures impacting the road link include bus lane improvements (2018); upgrades to buses to Euro VI standard (2016 and 2018); signing scheme (2018); improvements to the park and ride facility (pending early 2019); and travel grants given to a major local employer (GCHQ) to improve cycling provision (2015/16).
As most of these measures have been implemented since 2015 or are due to be implemented soon, they are included on the shortlist and their impacts on air quality will be assessed in part 4 of this study.
New measures
This section considers whether any of the measures included in the longlist in part 2 of this study can be practically and technically delivered in time to be able to forward compliance on this road link (notwithstanding any benefit from existing measures, which will be evidenced in part 4).
As discussed in part 1, the road link is projected to become compliant in 2019 so any measure would need to be deliverable before December 2018 to bring forward compliance in the shortest time.
Measures rejected due to deliverability issues
The following measures have been eliminated because they are not deliverable in time or are practically or technically unfeasible.
1. Encourage ultra low emission vehicle take up (ULEV): this measure has been discounted because there is insufficient time to deliver a campaign and for its impact to reduce NO2 levels on the link road. In addition, there may be missed opportunities with a standalone campaign as according to Jin et al (2014), quoted in a Department of Transport review of ULEV take-up, “the most effective incentives in driving…purchases are subsidies, HOV lane access, access to charging infrastructure, and exemptions from emissions testing.” https://assets.publishing.service.gov.uk/government/uploads/system/uploads/attachment_data/file/464763/uptake-of-ulev-uk.pdf
2. Review the integration of air quality as a consideration in local planning decisions. This has not been put on the shortlist because its impact would be on general air quality and not the link road specifically. Local planning policies already require the consideration of air quality.
3. Implementation of a segregated cycle lane, promotion of cycle routes and improved links with public transport: although the option of implementing a cycle lane and updating the associated infrastructure is on the longlist in part 2, in practicality it would not be delivered in time even if there was sufficient space to install a cycle lane once the bus lane improvements have been made. Therefore this measure has not been taken forward to the shortlist.
9
4. Installation of enforced High Occupancy Vehicle Lane: this scheme would not be
implemented in time to bring forward compliance, and some research in South Gloucestershire suggests it can actually increase traffic by approx. 10% as the road allows for smoother throughput: http://www.its.leeds.ac.uk/projects/konsult/private/level2/instruments/instrument029/l2_029c.htm
5. Explore parking options for LEVs such as priority or reduced parking: this measure has not been shortlisted due to the practicalities of delivering it before the end of 2018 so that NO2 levels are reduced on the link road. For example, it would take longer than this for the promotion of advantageous parking options for LEVs to increase the take up of LEV purchase and use.
6. Freight route options (by-pass / alternative “black sign” routes): this measure was longlisted because freight traffic contributes significantly to traffic on the link road. However, the measure is now being discounted as it is not practical to explore, design, consult on and implement alternative route options in time to bring forward compliance.
7. LGV / HGV Driver Training. This measure has been discounted because it is not practical in time to bring forward compliance as it would be necessary to undertake preliminary research about sectors/companies contributing to LGV/HGV use of the link road; deliver targeted training; implement in cab technology if appropriate and monitor outcomes to see if improved driving habits can be said to positively benefit air quality on the link road.
8. Local Government Fleet Leadership – review procurement and management options. This measure has been rejected as it is not specifically related to air quality on the link road and any review of procurement and management arrangements would not be completed and implemented in time.
9. Review of Traffic Management arrangements (signal phasing). This measure has not been carried forward to the shortlist because it would not be explored and delivered in time to bring forward compliance.
10. Car Parking Strategy – for example, higher charges for diesel engines; align car parking facilities and associated restrictions with transport plans and air quality assessments. Aligning the car parking strategy with air quality outcomes is good practice, even though this measure is not being carried through to the shortlist because it is not feasible to update the strategy through the democratic process and implement changes in time to bring forward compliance. Higher charges for diesel engines will be not be shortlisted as a measure in itself as it would not be implemented in time and there is insufficient data available about the proportion of A40 traffic that uses Cheltenham Borough Council car parks. However, the council is likely to still investigate this option outside of the timescales associated with this study.
11. Education campaigns through local schools and Gloucestershire College. This measure has been rejected due the lack of time in which to implement it and effect a change on the driving behaviour and patterns of parents/students. It would not bring forward compliance in the shortest possible time.
12. Review speed limits. There is insufficient time in which to conduct a review, and implement a new speed limit, so this measure has been discounted.
10
Shortlisted measures
There are five measures that have been implemented since 2015 or which are currently being implemented so these have been carried through to the shortlist for evaluation. In addition, we propose two new measures to help bring forward compliance.
The shortlisted measures are:
Existing measures
1. Signing scheme 2. Euro 6 buses on the 94 bus route and Park and Ride (upgraded from Euro 5) – 13 buses
running every 10 minutes 3. Pure and GCHQ travel grants/plans partially implemented 4. Bus lane improvements 5. Park and Ride capacity improvements e.g. barrier, promotion of facility
New measures
1. Workplace travel planning with employers listed in Part 2. There are a number of major employers in the vicinity of the link road as discussed in part 1 and the majority of these do not appear to have a fully developed travel plan, so we believe this measure will help to bring forward compliance. It should be noted that the largest employer, GCHQ has a travel plan in place, but has operational constraints relating to employees working at home. We believe this measure could be delivered by the end of 2018 with assistance from the GCHQ Corporate Travel team, county council colleagues in the Public Health and Infrastructure teams and external support. This intervention will consist of potential sub-measures such as:
encouraging LEV take-up and workplace infrastructure;
joining up and incentivising the use of public transport routes to work (such as exploring the discounted hire of bicycles from the train station to workplaces);
and importantly – the innovative use of real time air pollution exposure data to allow commuters to make an informed decision about when and how they travel to and from work so that long term behaviour change is achieved.
promotional season tickets for public transport
additional cycle parking and enhancing the existing cycle salary sacrifice scheme
real time bus information at the two GCHQ bus stops
It is proposed to start by working with GCHQ to test the effectiveness and practicality of interventions before rolling them out to other workplaces in the vicinity so that emissions are reduced at peak times.
2. Public awareness and behaviour change campaigns: including promoting walking;
buses, cycling and car sharing, travel clubs and healthy workplaces. This measure has been shortlisted because an intervention to promote public awareness and change travel behaviour can be designed and delivered by the end of the year with County Council colleagues from the Public Health and Strategic Infrastructure teams. We believe that the learning from the workplace travel planning initiatives will help to inform public promotions and that this will help effect behaviour change in commuter traffic and travel. For example, air pollution data could inform messages on the A40 through Variable Messaging Signs.
11
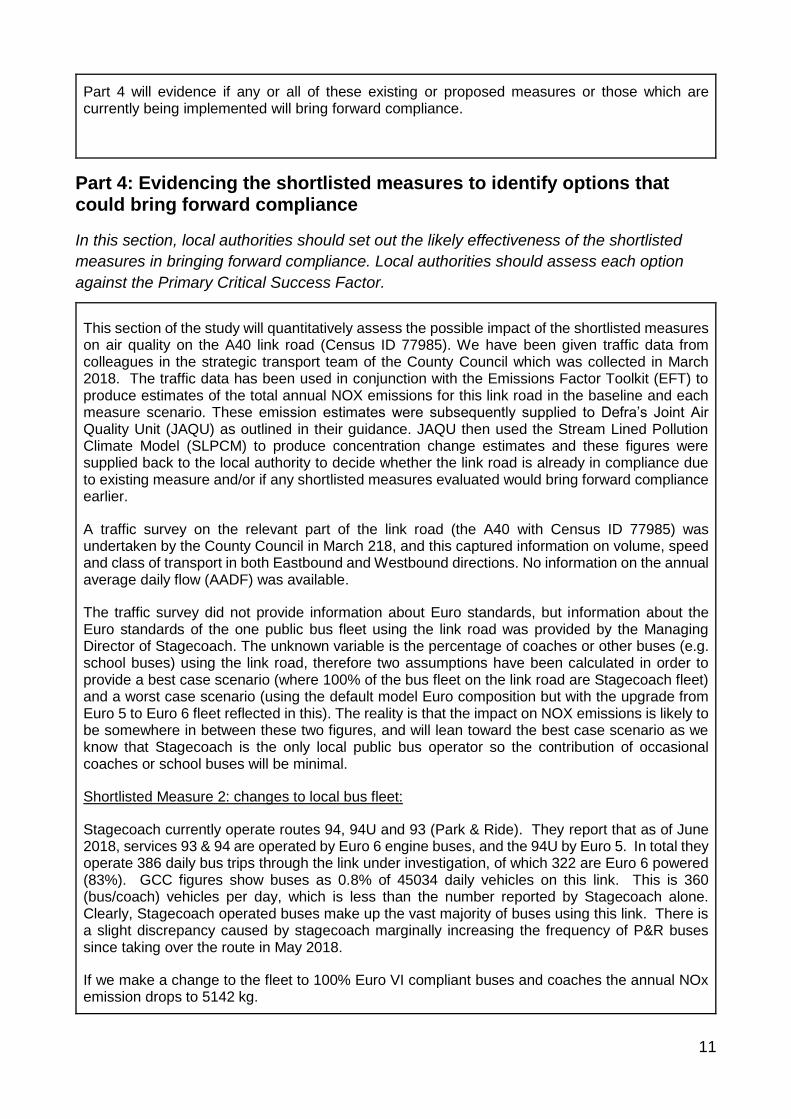
Part 4 will evidence if any or all of these existing or proposed measures or those which are currently being implemented will bring forward compliance.
Part 4: Evidencing the shortlisted measures to identify options that could bring forward compliance
In this section, local authorities should set out the likely effectiveness of the shortlisted
measures in bringing forward compliance. Local authorities should assess each option
against the Primary Critical Success Factor.
This section of the study will quantitatively assess the possible impact of the shortlisted measures on air quality on the A40 link road (Census ID 77985). We have been given traffic data from colleagues in the strategic transport team of the County Council which was collected in March 2018. The traffic data has been used in conjunction with the Emissions Factor Toolkit (EFT) to produce estimates of the total annual NOX emissions for this link road in the baseline and each measure scenario. These emission estimates were subsequently supplied to Defra’s Joint Air Quality Unit (JAQU) as outlined in their guidance. JAQU then used the Stream Lined Pollution Climate Model (SLPCM) to produce concentration change estimates and these figures were supplied back to the local authority to decide whether the link road is already in compliance due to existing measure and/or if any shortlisted measures evaluated would bring forward compliance earlier.
A traffic survey on the relevant part of the link road (the A40 with Census ID 77985) was undertaken by the County Council in March 218, and this captured information on volume, speed and class of transport in both Eastbound and Westbound directions. No information on the annual average daily flow (AADF) was available.
The traffic survey did not provide information about Euro standards, but information about the Euro standards of the one public bus fleet using the link road was provided by the Managing Director of Stagecoach. The unknown variable is the percentage of coaches or other buses (e.g. school buses) using the link road, therefore two assumptions have been calculated in order to provide a best case scenario (where 100% of the bus fleet on the link road are Stagecoach fleet) and a worst case scenario (using the default model Euro composition but with the upgrade from Euro 5 to Euro 6 fleet reflected in this). The reality is that the impact on NOX emissions is likely to be somewhere in between these two figures, and will lean toward the best case scenario as we know that Stagecoach is the only local public bus operator so the contribution of occasional coaches or school buses will be minimal.
Shortlisted Measure 2: changes to local bus fleet:
Stagecoach currently operate routes 94, 94U and 93 (Park & Ride). They report that as of June 2018, services 93 & 94 are operated by Euro 6 engine buses, and the 94U by Euro 5. In total they operate 386 daily bus trips through the link under investigation, of which 322 are Euro 6 powered (83%). GCC figures show buses as 0.8% of 45034 daily vehicles on this link. This is 360 (bus/coach) vehicles per day, which is less than the number reported by Stagecoach alone. Clearly, Stagecoach operated buses make up the vast majority of buses using this link. There is a slight discrepancy caused by stagecoach marginally increasing the frequency of P&R buses since taking over the route in May 2018.
If we make a change to the fleet to 100% Euro VI compliant buses and coaches the annual NOx emission drops to 5142 kg.

12
Assumption 1: As assuming all of fleet is Euro V1 standard is slightly unrealistic, so if we instead just model upgrading ALL Euro V buses and coaches to Euro VI, this make the proportions as follows in Assumption 1 in the following table:
Buses (and coaches)
Default Euro Proportions (2018)
User Euro Proportions 2015 - England (not London)
1Pre-Euro I - -
2Euro I - -
3Euro II 0.02 0.02
4Euro III 0.10 0.10
5Euro IV 0.09 0.09
6Euro V_EGR 0.07
7Euro V_SCR 0.22
8Euro VI 0.49 0.79
9Euro II SCRRF - -
10Euro III SCRRF - -
11Euro IV SCRRF - -
12Euro V EGR + SCRRF
- -
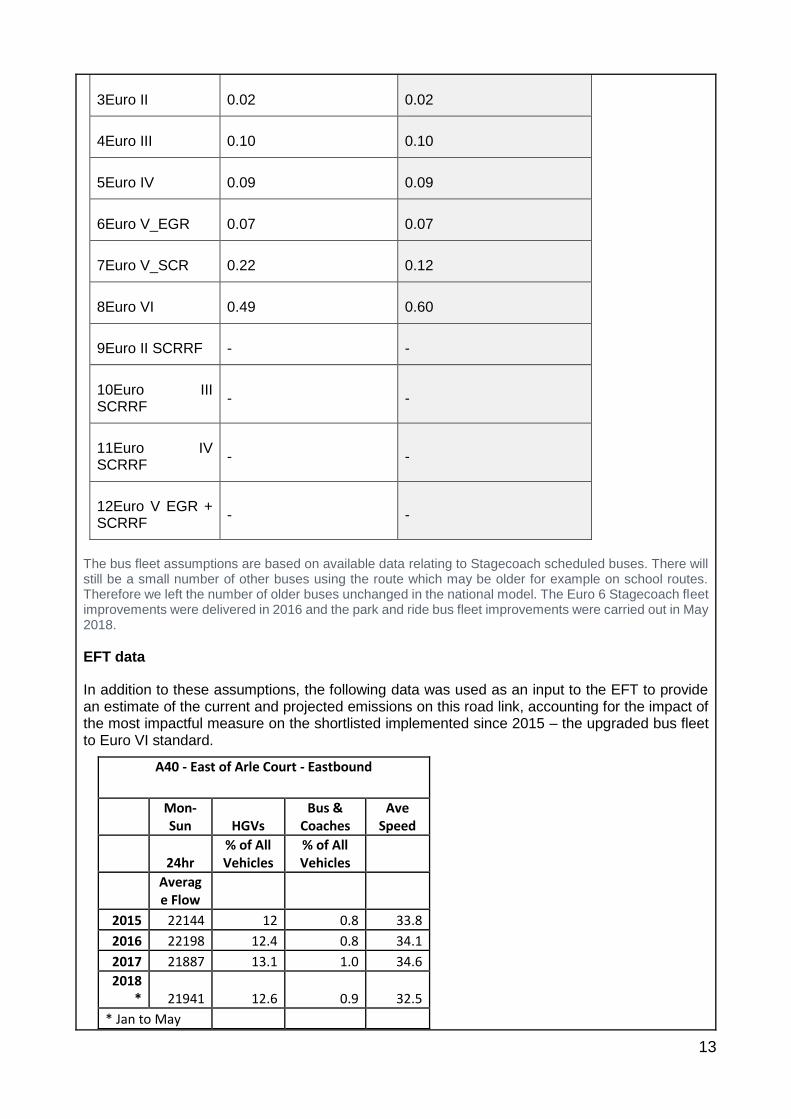
Assumption 2: Being slightly more conservative we can leave the proportion of Pre-Euro 1 – Euro IV unchanged, but decrease the value of Euro V and increase the value of Euro VI to maintain the 83% ratio reported by Stagecoach, as demonstrated in the following table:
Buses Default Euro Proportions (2018)
User Euro Proportions 2015 - England (not London)
1Pre-Euro I - -
2Euro I - -
13
3Euro II 0.02 0.02
4Euro III 0.10 0.10
5Euro IV 0.09 0.09
6Euro V_EGR 0.07 0.07
7Euro V_SCR 0.22 0.12
8Euro VI 0.49 0.60
9Euro II SCRRF - -
10Euro III SCRRF
- -
11Euro IV SCRRF
- -
12Euro V EGR + SCRRF
- -
The bus fleet assumptions are based on available data relating to Stagecoach scheduled buses. There will still be a small number of other buses using the route which may be older for example on school routes. Therefore we left the number of older buses unchanged in the national model. The Euro 6 Stagecoach fleet improvements were delivered in 2016 and the park and ride bus fleet improvements were carried out in May 2018.
EFT data
In addition to these assumptions, the following data was used as an input to the EFT to provide an estimate of the current and projected emissions on this road link, accounting for the impact of the most impactful measure on the shortlisted implemented since 2015 – the upgraded bus fleet to Euro VI standard.
A40 - East of Arle Court - Eastbound
Mon-Sun HGVs
Bus & Coaches
Ave Speed
24hr % of All Vehicles
% of All Vehicles
Average Flow
2015 22144 12 0.8 33.8
2016 22198 12.4 0.8 34.1
2017 21887 13.1 1.0 34.6
2018* 21941 12.6 0.9 32.5
* Jan to May

14
2015 to 2017 growth -1.16%
A40 - East of Arle Court - Westbound
Mon-Sun HGVs
Bus & Coaches
Ave Speed
24hr % of All Vehicles
% of All Vehicles
Average
2015 23116 9.2 0.6 29.5
2016 23263 9.7 0.6 30
2017 22930 9.9 0.6 29.9 Buses & Coaches based on Jan to Jun 2017 data only
2018* 23093 No data 29.1
* Jan to April
2015 to 2017 growth = -0.8%
Taking into account the reliability of the equipment, the above data shows little change in flows between 2015 and 2017/18.
A40 - East of Arle Court - Combined East & West
Mon-Sun HGVs Bus & Coaches Ave Speed Annual
NOx
24hr % of All Vehicles
% of All Vehicles MPH KPH kg/yr
Average
Flow
2015 45259 10.6 0.7 31.6 50.9 8118
2016 45461 11.0 0.7 32.0 51.5 7772
2017 44817 11.5 0.8 32.2 51.8 7059
2018* 45034 11.5* 0.8* 30.8 49.5 6490
2019 45034 11.5* 0.8* 30.8 49.5 5806
*to date
*assumes no change, due to W'bound figure being unavailable and change <1%
*assumes no change, due to W'bound figure being unavailable and change <1%
From EFT, using each year's model
15
Outcome of EFT and SLPCM evaluation
Using the EFT, we modelled that NOX emissions will be reduced as follows:
Assumption 1 (100% Euro 6 standard bus composition on link road)
5806 kg/yr (2019) compared to 8118 kg/yr baseline = 28% reduction in NOX due to the modelled measure (bus fleet upgrade)
Assumption 2: reduces the annual NOx emission to 6338kg/yr which is a 22% reduction from the baseline of 8118 kg/yr due to the modelled measure (bus fleet upgrade).
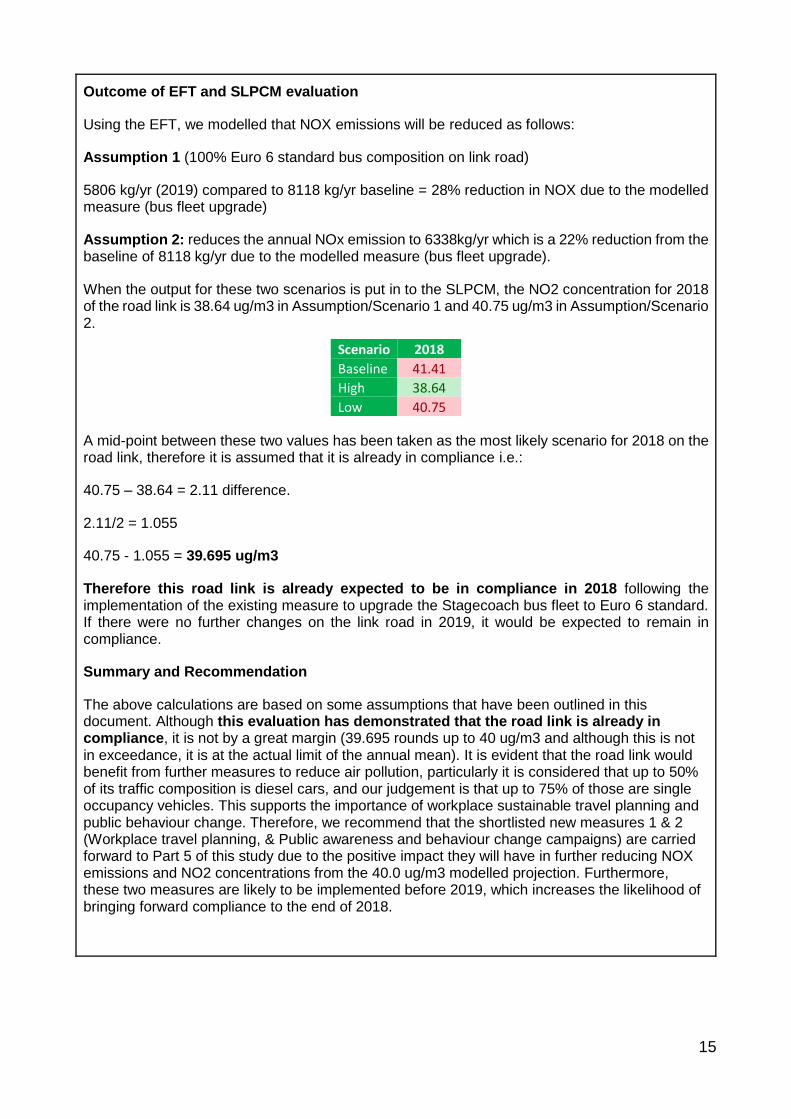
When the output for these two scenarios is put in to the SLPCM, the NO2 concentration for 2018 of the road link is 38.64 ug/m3 in Assumption/Scenario 1 and 40.75 ug/m3 in Assumption/Scenario 2.
Scenario 2018
Baseline 41.41
High 38.64
Low 40.75
A mid-point between these two values has been taken as the most likely scenario for 2018 on the road link, therefore it is assumed that it is already in compliance i.e.:
40.75 – 38.64 = 2.11 difference.
2.11/2 = 1.055
40.75 - 1.055 = 39.695 ug/m3
Therefore this road link is already expected to be in compliance in 2018 following the implementation of the existing measure to upgrade the Stagecoach bus fleet to Euro 6 standard. If there were no further changes on the link road in 2019, it would be expected to remain in compliance.
Summary and Recommendation
The above calculations are based on some assumptions that have been outlined in this document. Although this evaluation has demonstrated that the road link is already in compliance, it is not by a great margin (39.695 rounds up to 40 ug/m3 and although this is not in exceedance, it is at the actual limit of the annual mean). It is evident that the road link would benefit from further measures to reduce air pollution, particularly it is considered that up to 50% of its traffic composition is diesel cars, and our judgement is that up to 75% of those are single occupancy vehicles. This supports the importance of workplace sustainable travel planning and public behaviour change. Therefore, we recommend that the shortlisted new measures 1 & 2 (Workplace travel planning, & Public awareness and behaviour change campaigns) are carried forward to Part 5 of this study due to the positive impact they will have in further reducing NOX emissions and NO2 concentrations from the 40.0 ug/m3 modelled projection. Furthermore, these two measures are likely to be implemented before 2019, which increases the likelihood of bringing forward compliance to the end of 2018.
16
Part 5: Setting out a preferred option
In this section, local authorities should set out a summary of their preferred option to
bringing forward compliance (where such measures exist). Where new measures have
been identified that could bring forward compliance, local authorities should also assess a
range of Secondary Critical Success Factors in order to identify the preferred option.
This part of the study sets out our conclusion and recommendation for the road link covered in the study.
We conclude that the road link is compliant (40 µg/m3) and we set out the evidence for this in the table below.
However, as the statutory annual limit is 40 µg/m3, we have identified a package of measures that we believe would help improve air quality so that the road link complies by a wider margin.
Part 4 recommended that a second measure was carried forward to the preferred option stage, regarding a public campaign. After consideration, it has been decided to focus on the workplace travel planning package of measures as our preferred option, in order to meet the requirements of this study (i.e. implementation by January 2019). The additional benefit of this package of measures (assuming that funding is obtained) would be that the skills and tools acquired could be reused later to further promote sustainable travel choices to a wider range of workplaces and the public – this is particularly important, as the council’s draft Air Quality Annual Status Report demonstrates attention is required in other locations in order to address any non-compliances with statutory limits
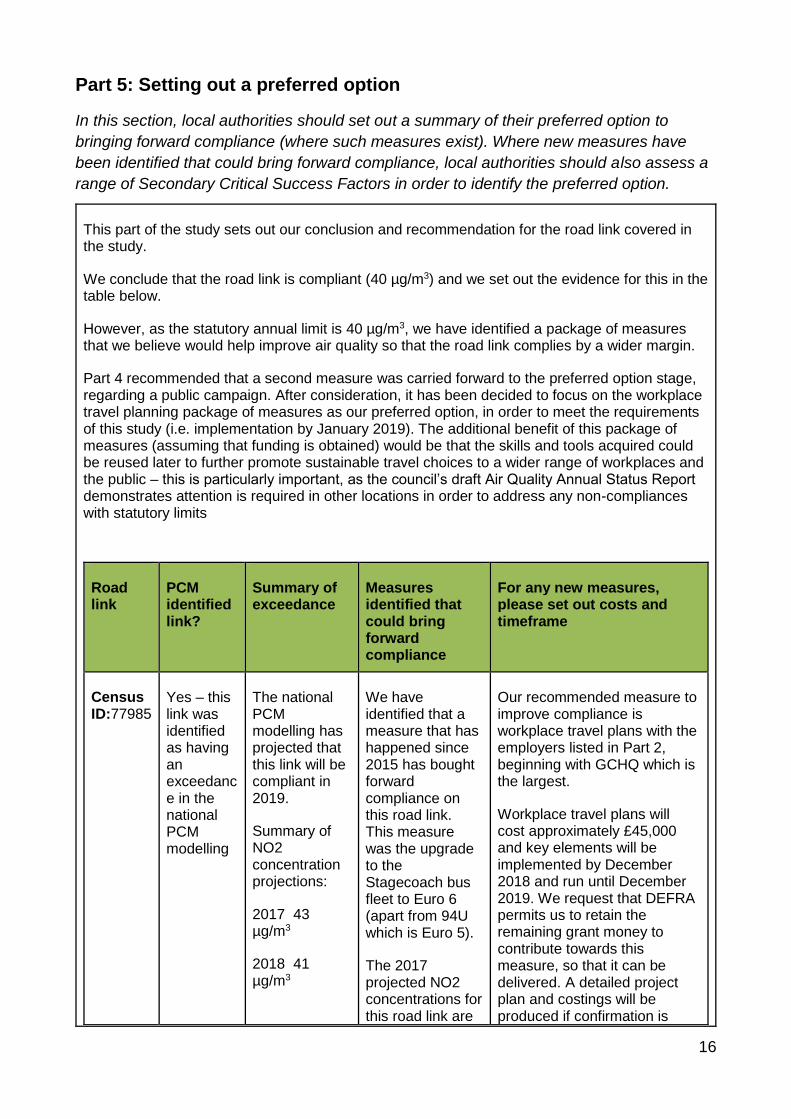
Road link
PCM identified link?
Summary of exceedance
Measures identified that could bring forward compliance
For any new measures, please set out costs and timeframe
Census ID:77985
Yes – this link was identified as having an exceedance in the national PCM modelling
The national PCM modelling has projected that this link will be compliant in 2019.
Summary of NO2 concentration projections:
2017 43 µg/m3
2018 41 µg/m3
We have identified that a measure that has happened since 2015 has bought forward compliance on this road link. This measure was the upgrade to the Stagecoach bus fleet to Euro 6 (apart from 94U which is Euro 5).
The 2017 projected NO2 concentrations for this road link are
Our recommended measure to improve compliance is workplace travel plans with the employers listed in Part 2, beginning with GCHQ which is the largest.
Workplace travel plans will cost approximately £45,000 and key elements will be implemented by December 2018 and run until December 2019. We request that DEFRA permits us to retain the remaining grant money to contribute towards this measure, so that it can be delivered. A detailed project plan and costings will be produced if confirmation is
17
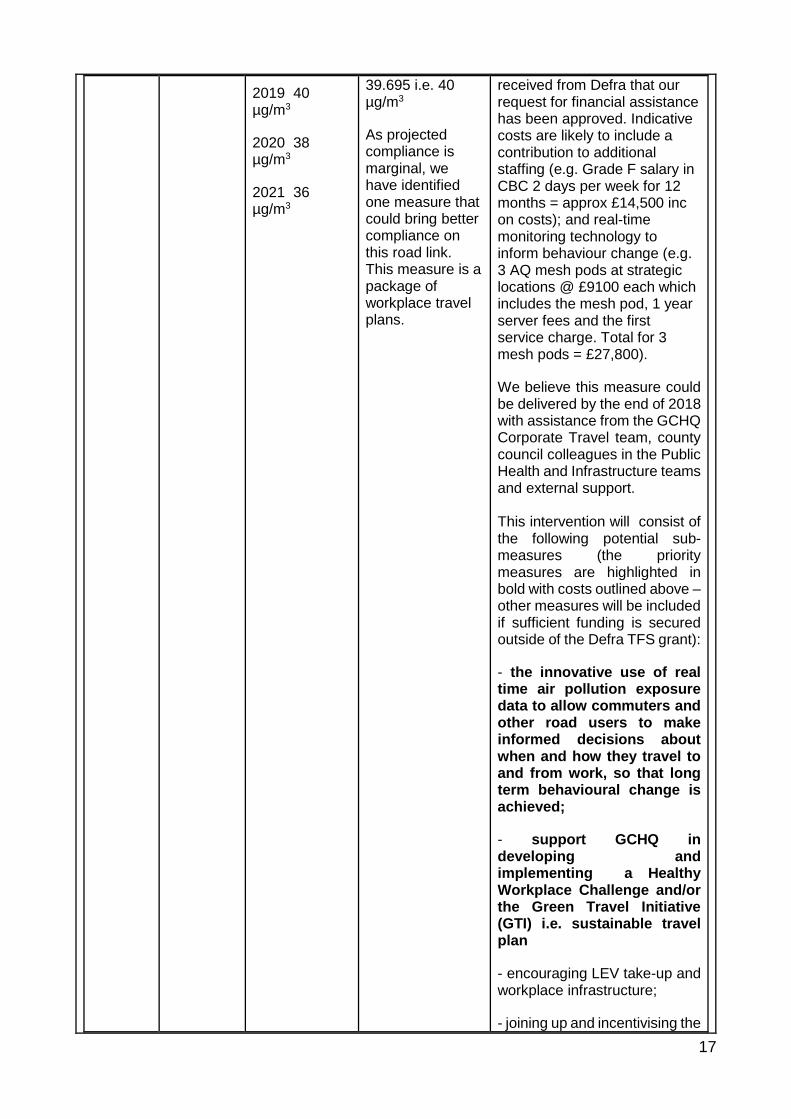
2019 40 µg/m3
2020 38 µg/m3
2021 36 µg/m3
39.695 i.e. 40 µg/m3
As projected compliance is marginal, we have identified one measure that could bring better compliance on this road link. This measure is a package of workplace travel plans.
received from Defra that our request for financial assistance has been approved. Indicative costs are likely to include a contribution to additional staffing (e.g. Grade F salary in CBC 2 days per week for 12 months = approx £14,500 inc on costs); and real-time monitoring technology to inform behaviour change (e.g. 3 AQ mesh pods at strategic locations @ £9100 each which includes the mesh pod, 1 year server fees and the first service charge. Total for 3 mesh pods = £27,800).
We believe this measure could be delivered by the end of 2018 with assistance from the GCHQ Corporate Travel team, county council colleagues in the Public Health and Infrastructure teams and external support.
This intervention will consist of the following potential sub-measures (the priority measures are highlighted in bold with costs outlined above – other measures will be included if sufficient funding is secured outside of the Defra TFS grant):
- the innovative use of real time air pollution exposure data to allow commuters and other road users to make informed decisions about when and how they travel to and from work, so that long term behavioural change is achieved;
- support GCHQ in developing and implementing a Healthy Workplace Challenge and/or the Green Travel Initiative (GTI) i.e. sustainable travel plan
- encouraging LEV take-up and workplace infrastructure;
- joining up and incentivising the
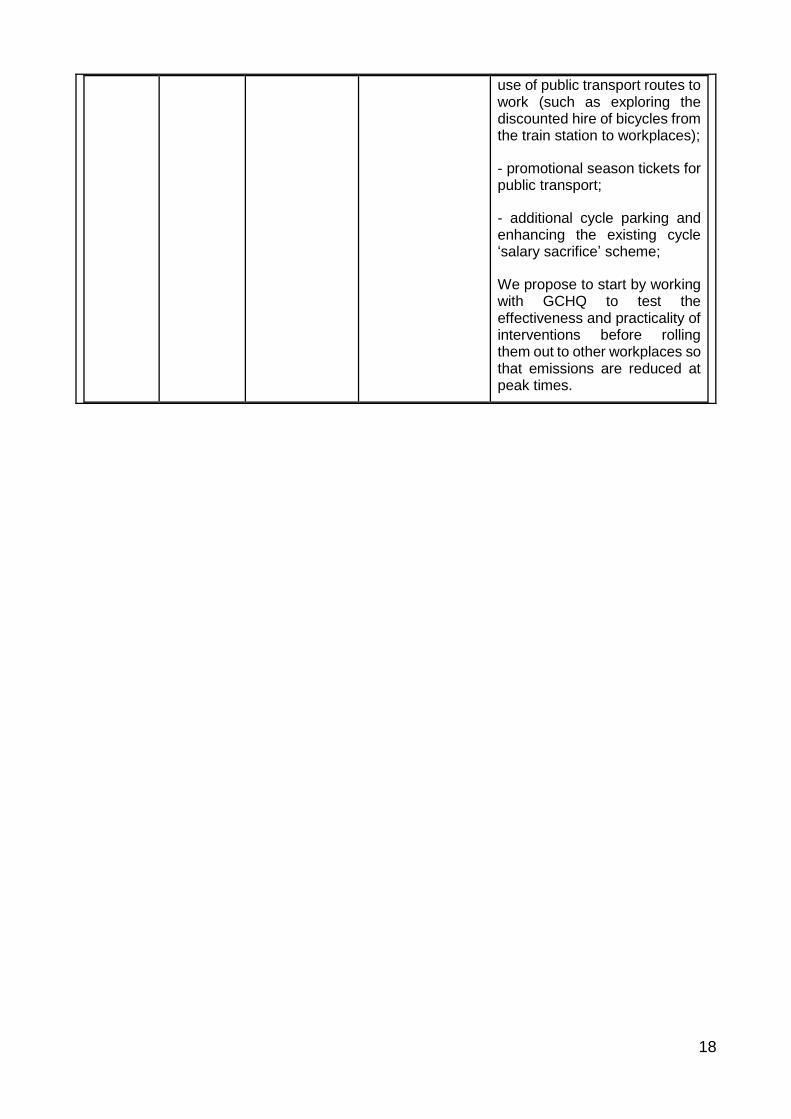
18
use of public transport routes to work (such as exploring the discounted hire of bicycles from the train station to workplaces);
- promotional season tickets for public transport;
- additional cycle parking and enhancing the existing cycle ‘salary sacrifice’ scheme;
We propose to start by working with GCHQ to test the effectiveness and practicality of interventions before rolling them out to other workplaces so that emissions are reduced at peak times.